Formulation of Folate-Modified Raltitrexed-Loaded Nanoparticles for Colorectal Cancer Theranostics


Abstract
:1. Introduction
2. Materials and Methods
2.1. Materials
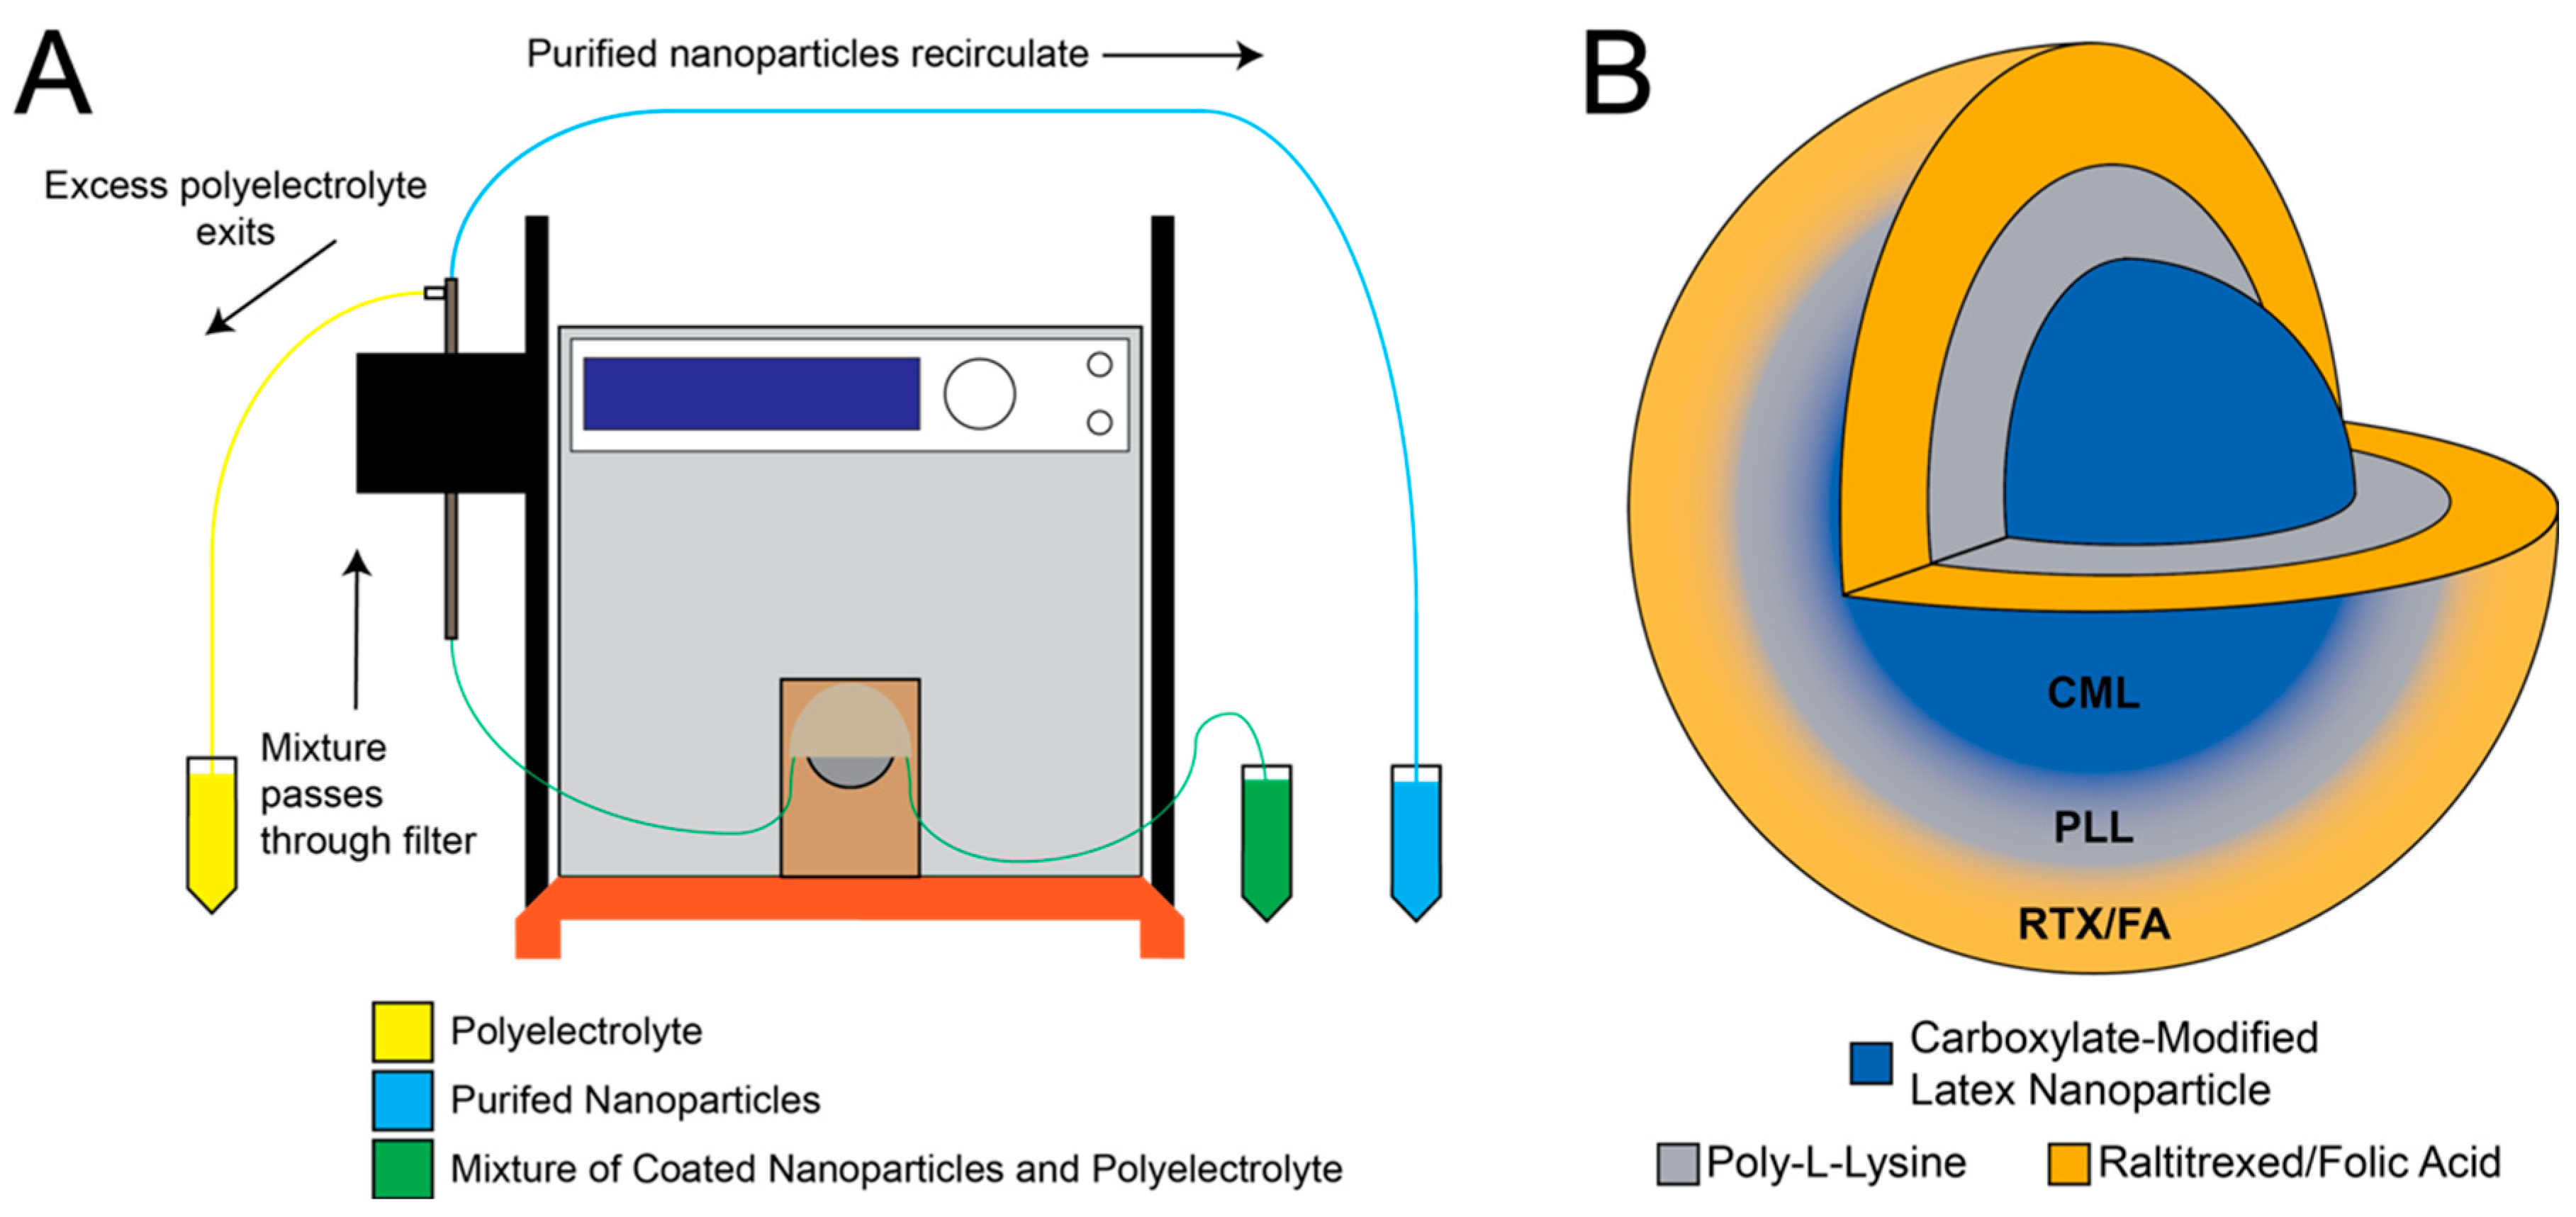
2.2. Layer-by-Layer Process
2.3. Nanoparticle Characterization
2.4. Cell Uptake
2.5. Cell Viability
2.6. In Vivo Biodistribution
2.7. Statistical Analysis
3. Results and Discussion
3.1. Drug Encapsulation Process
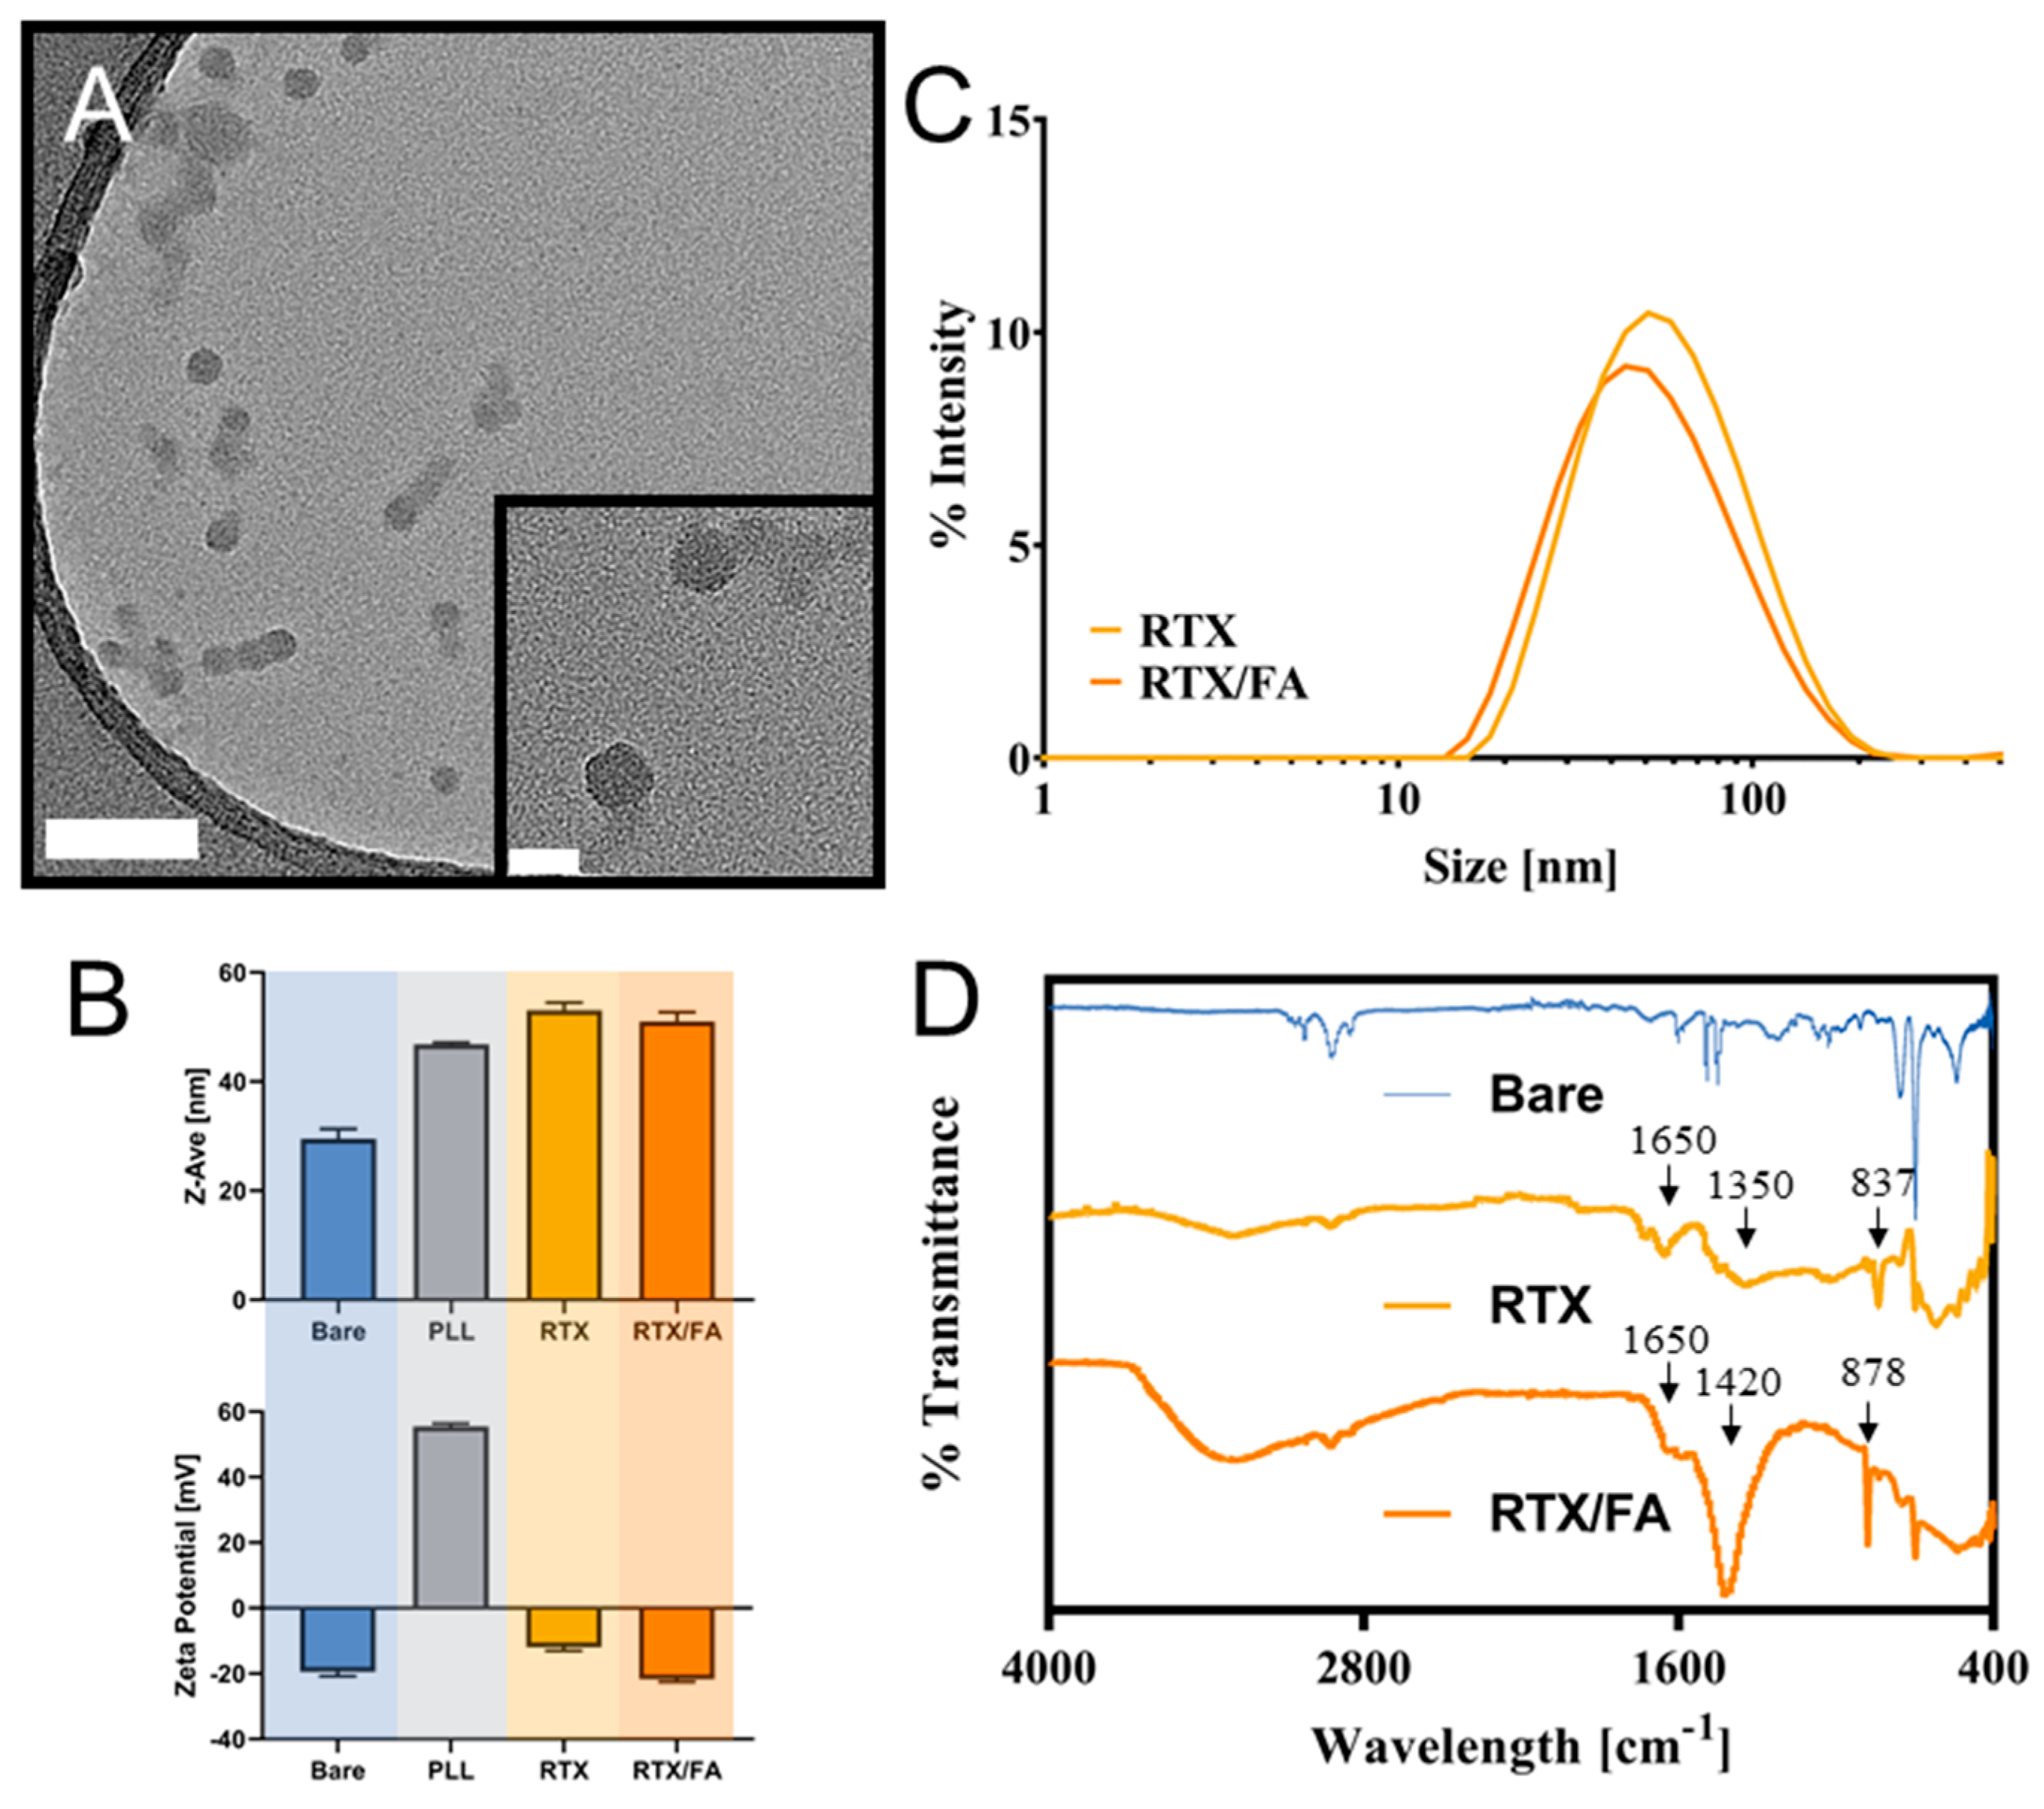
3.2. Nanoparticle Characterization
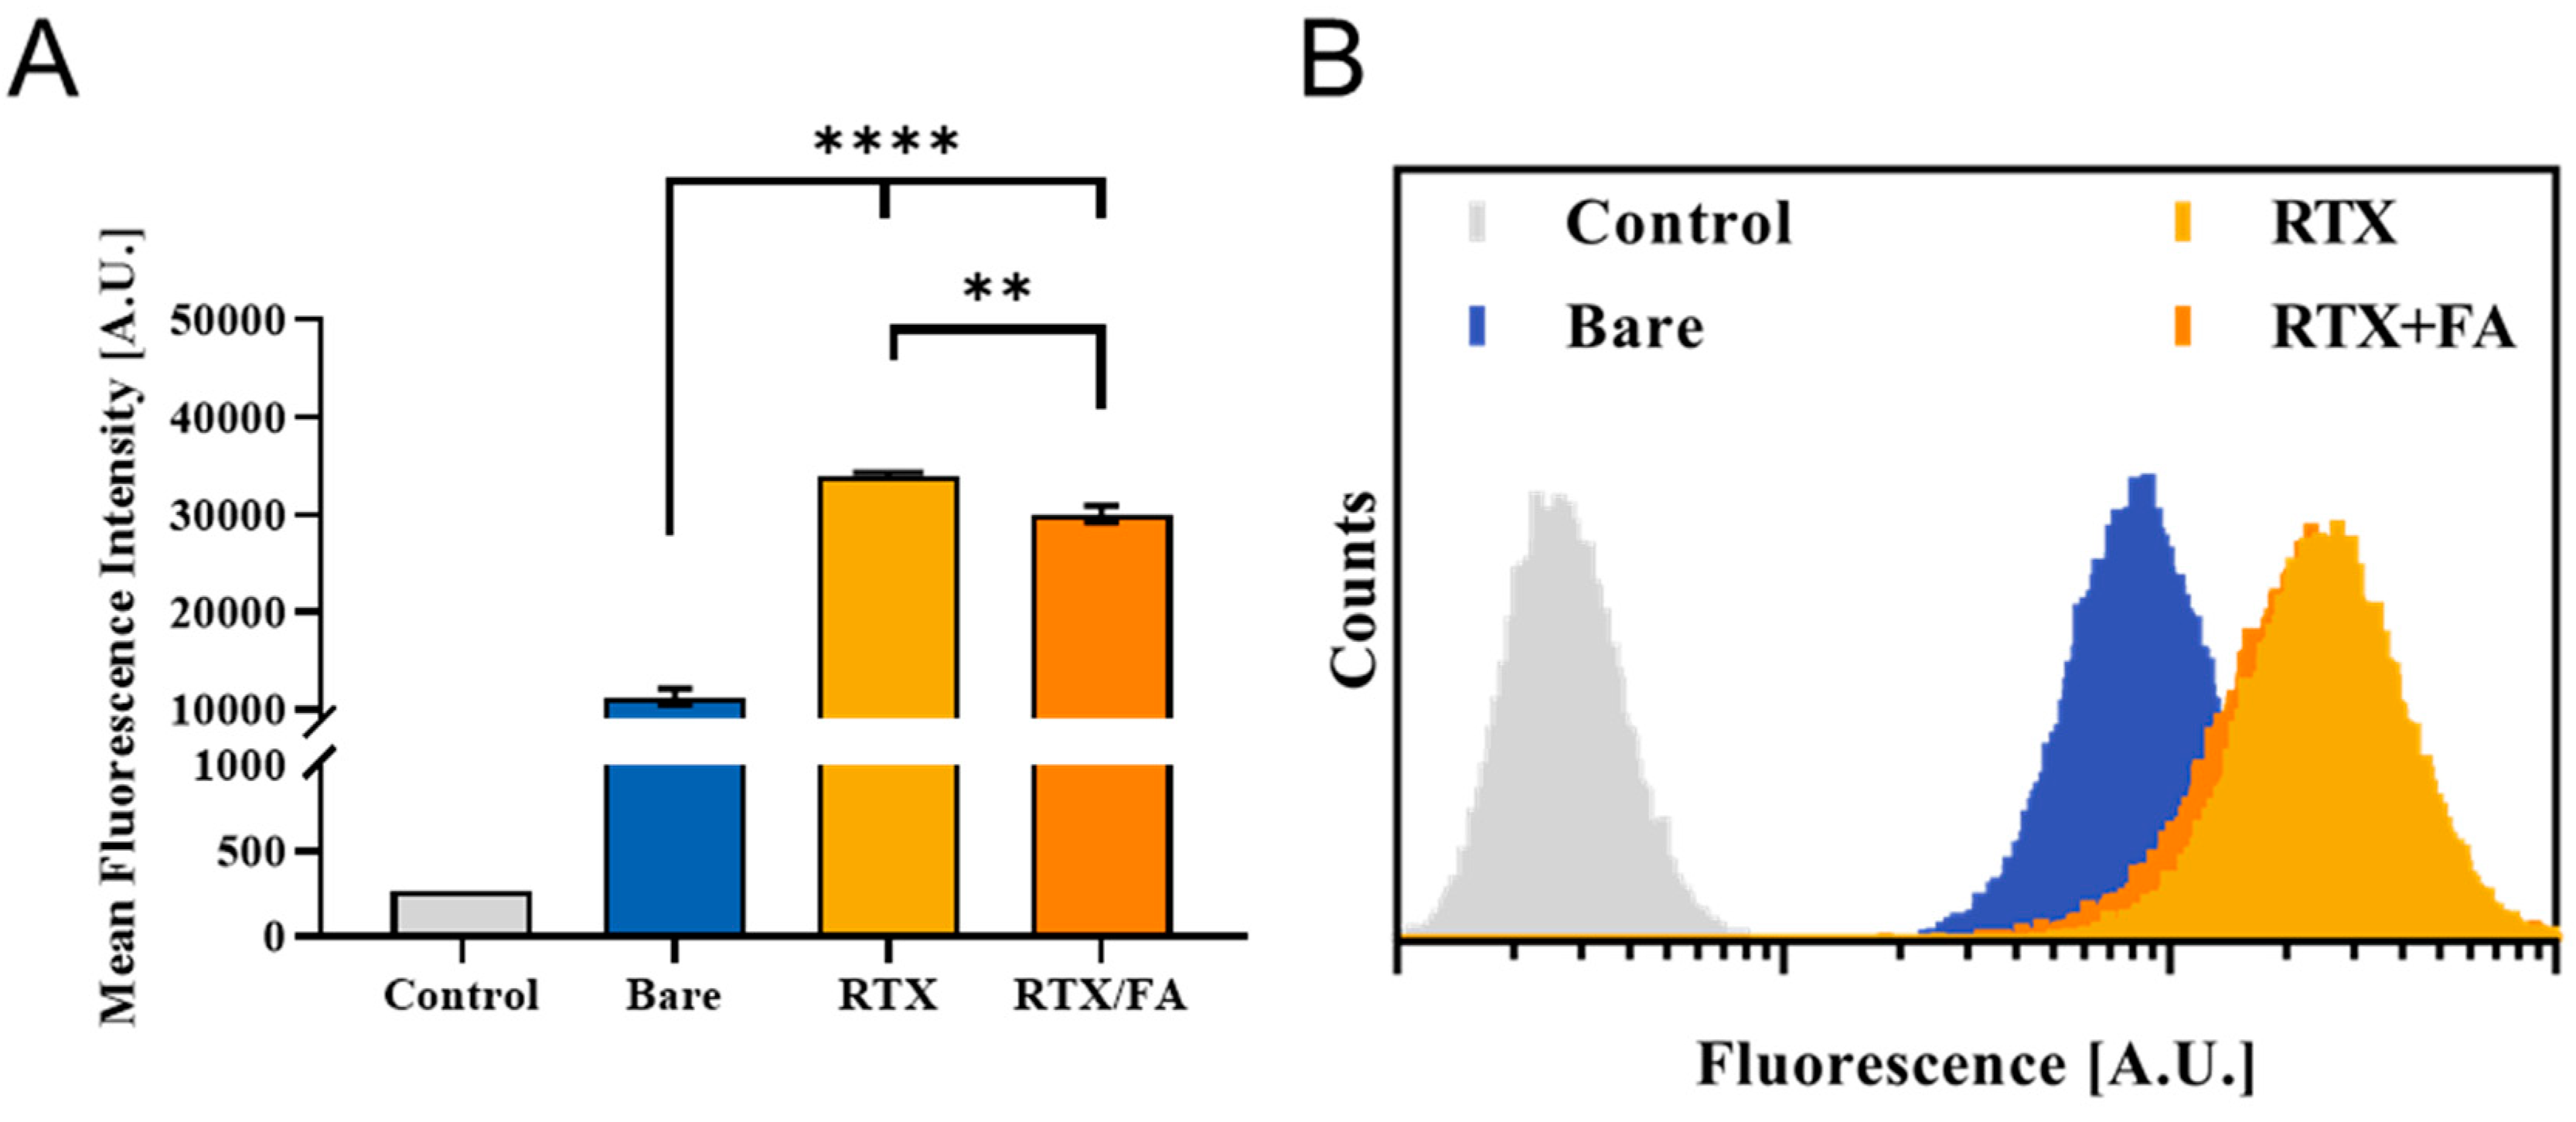
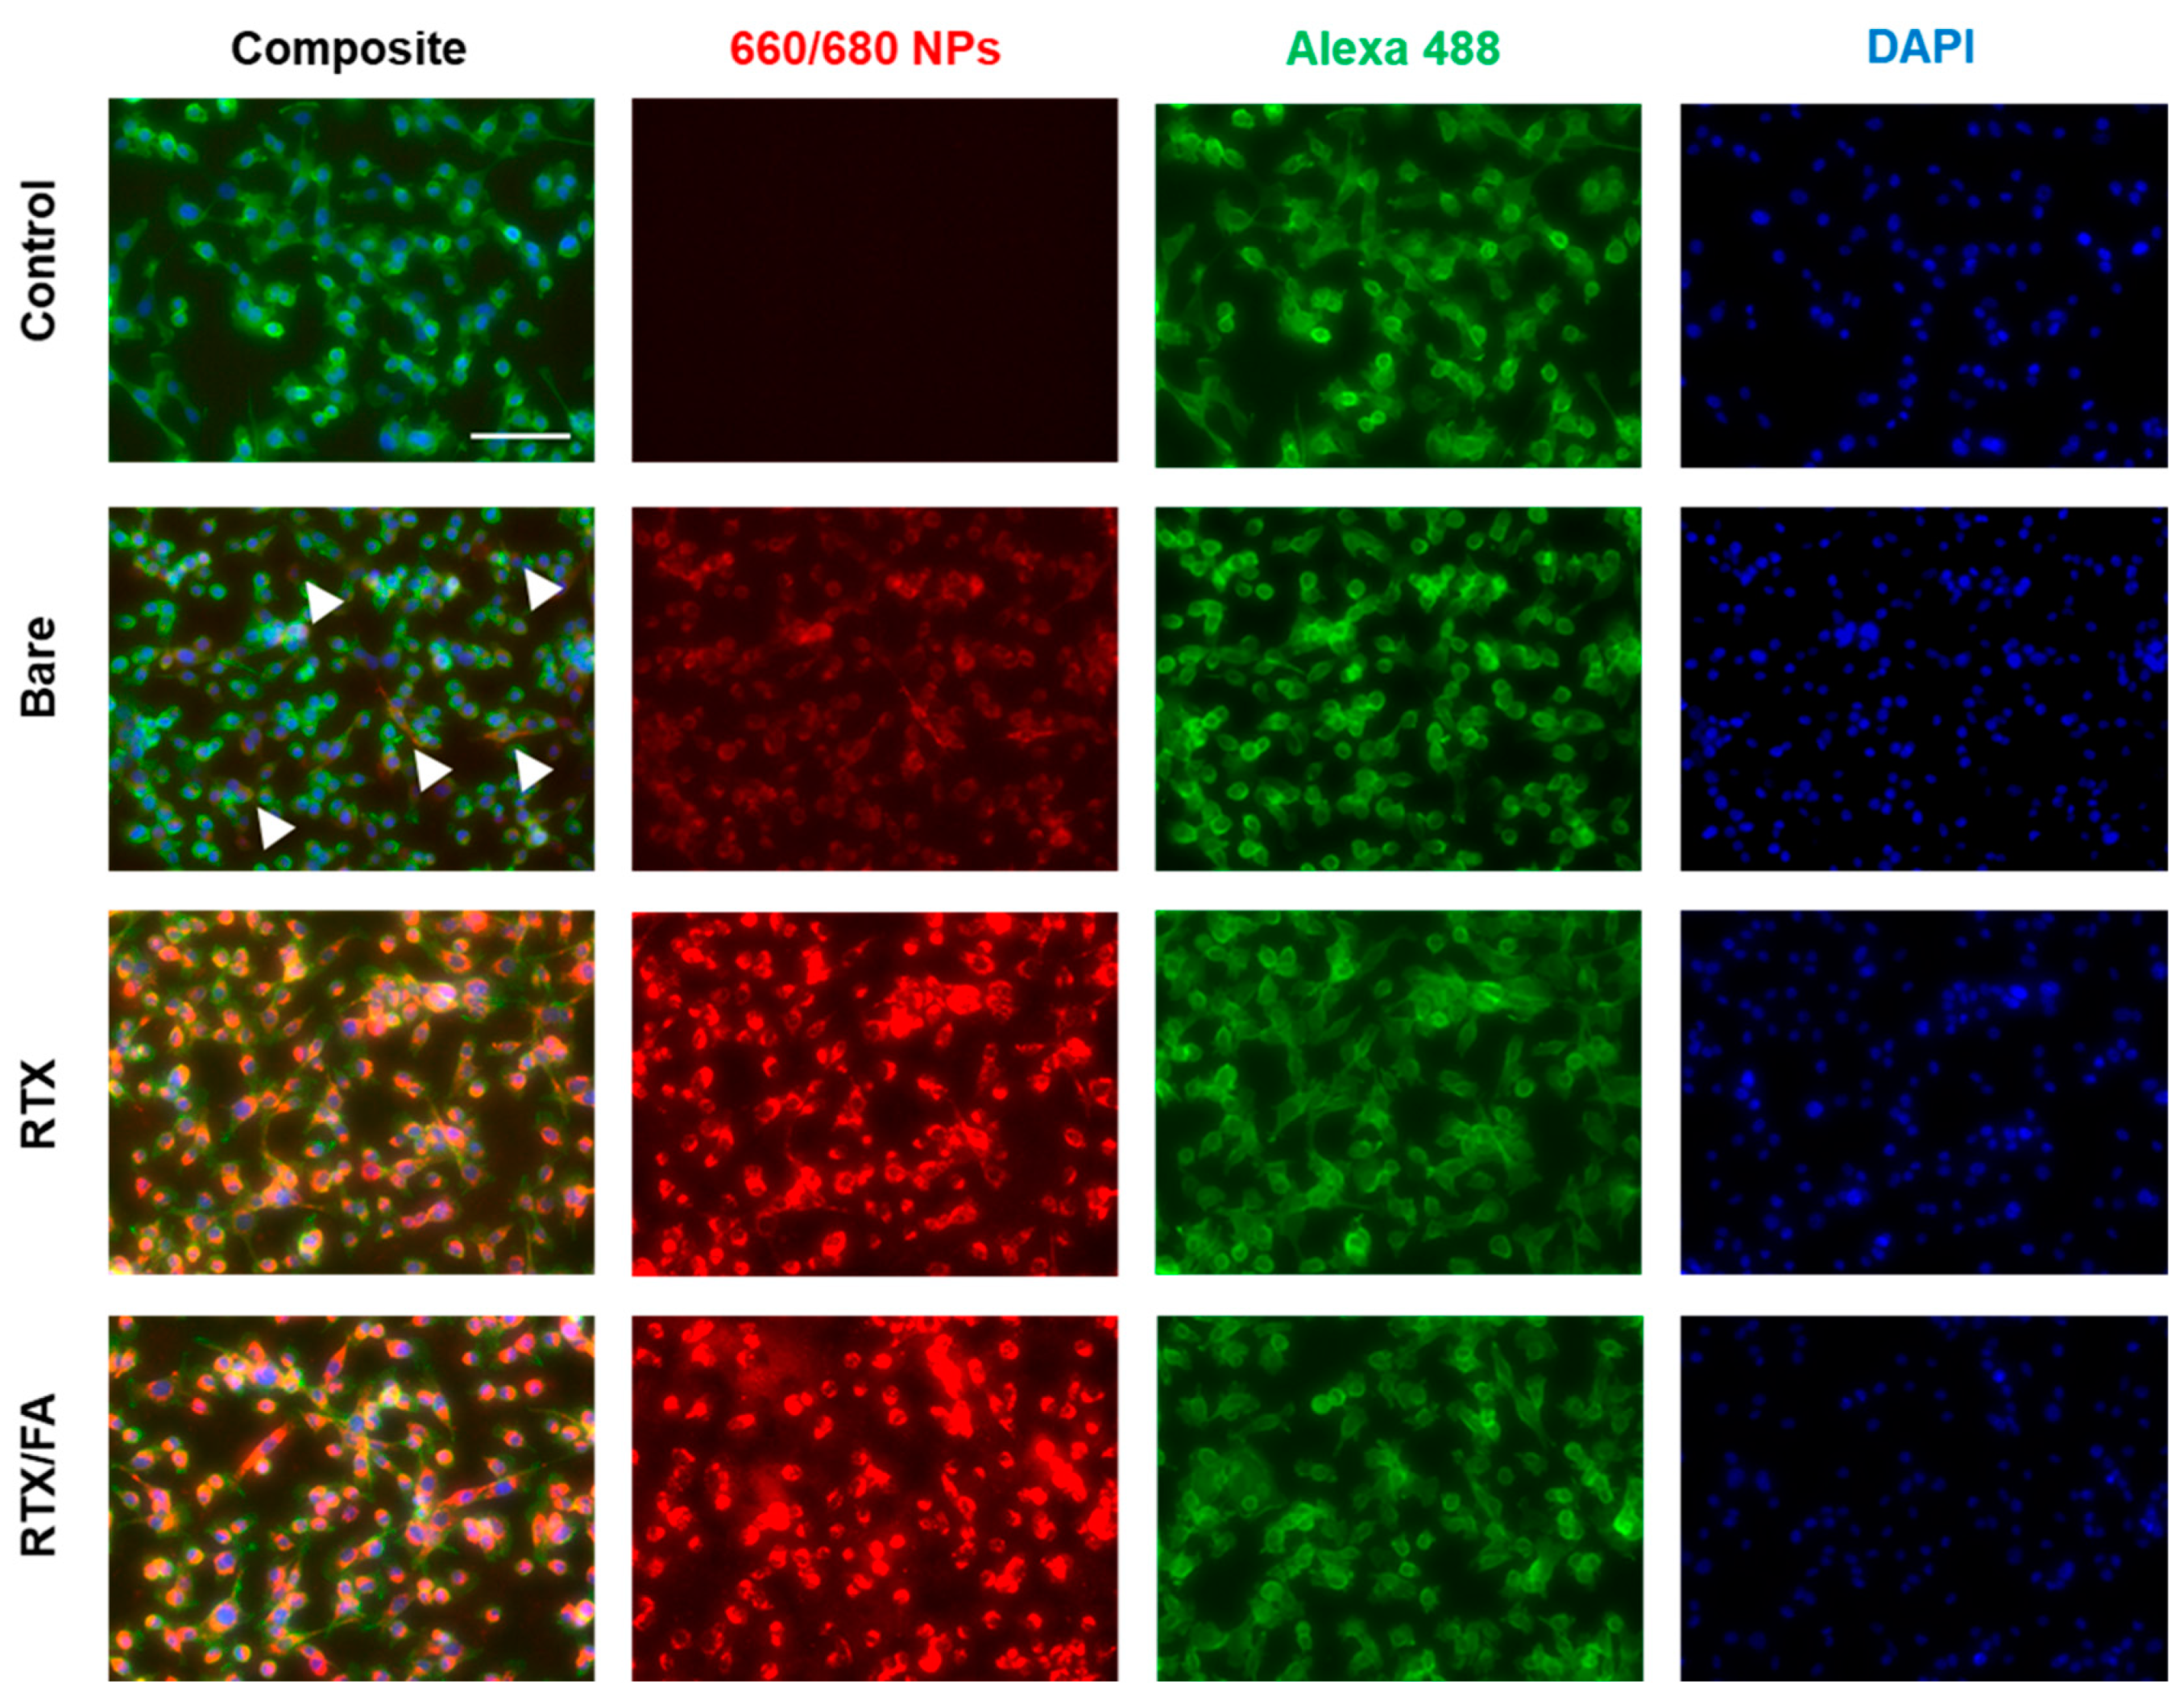
3.3. Cell Uptake
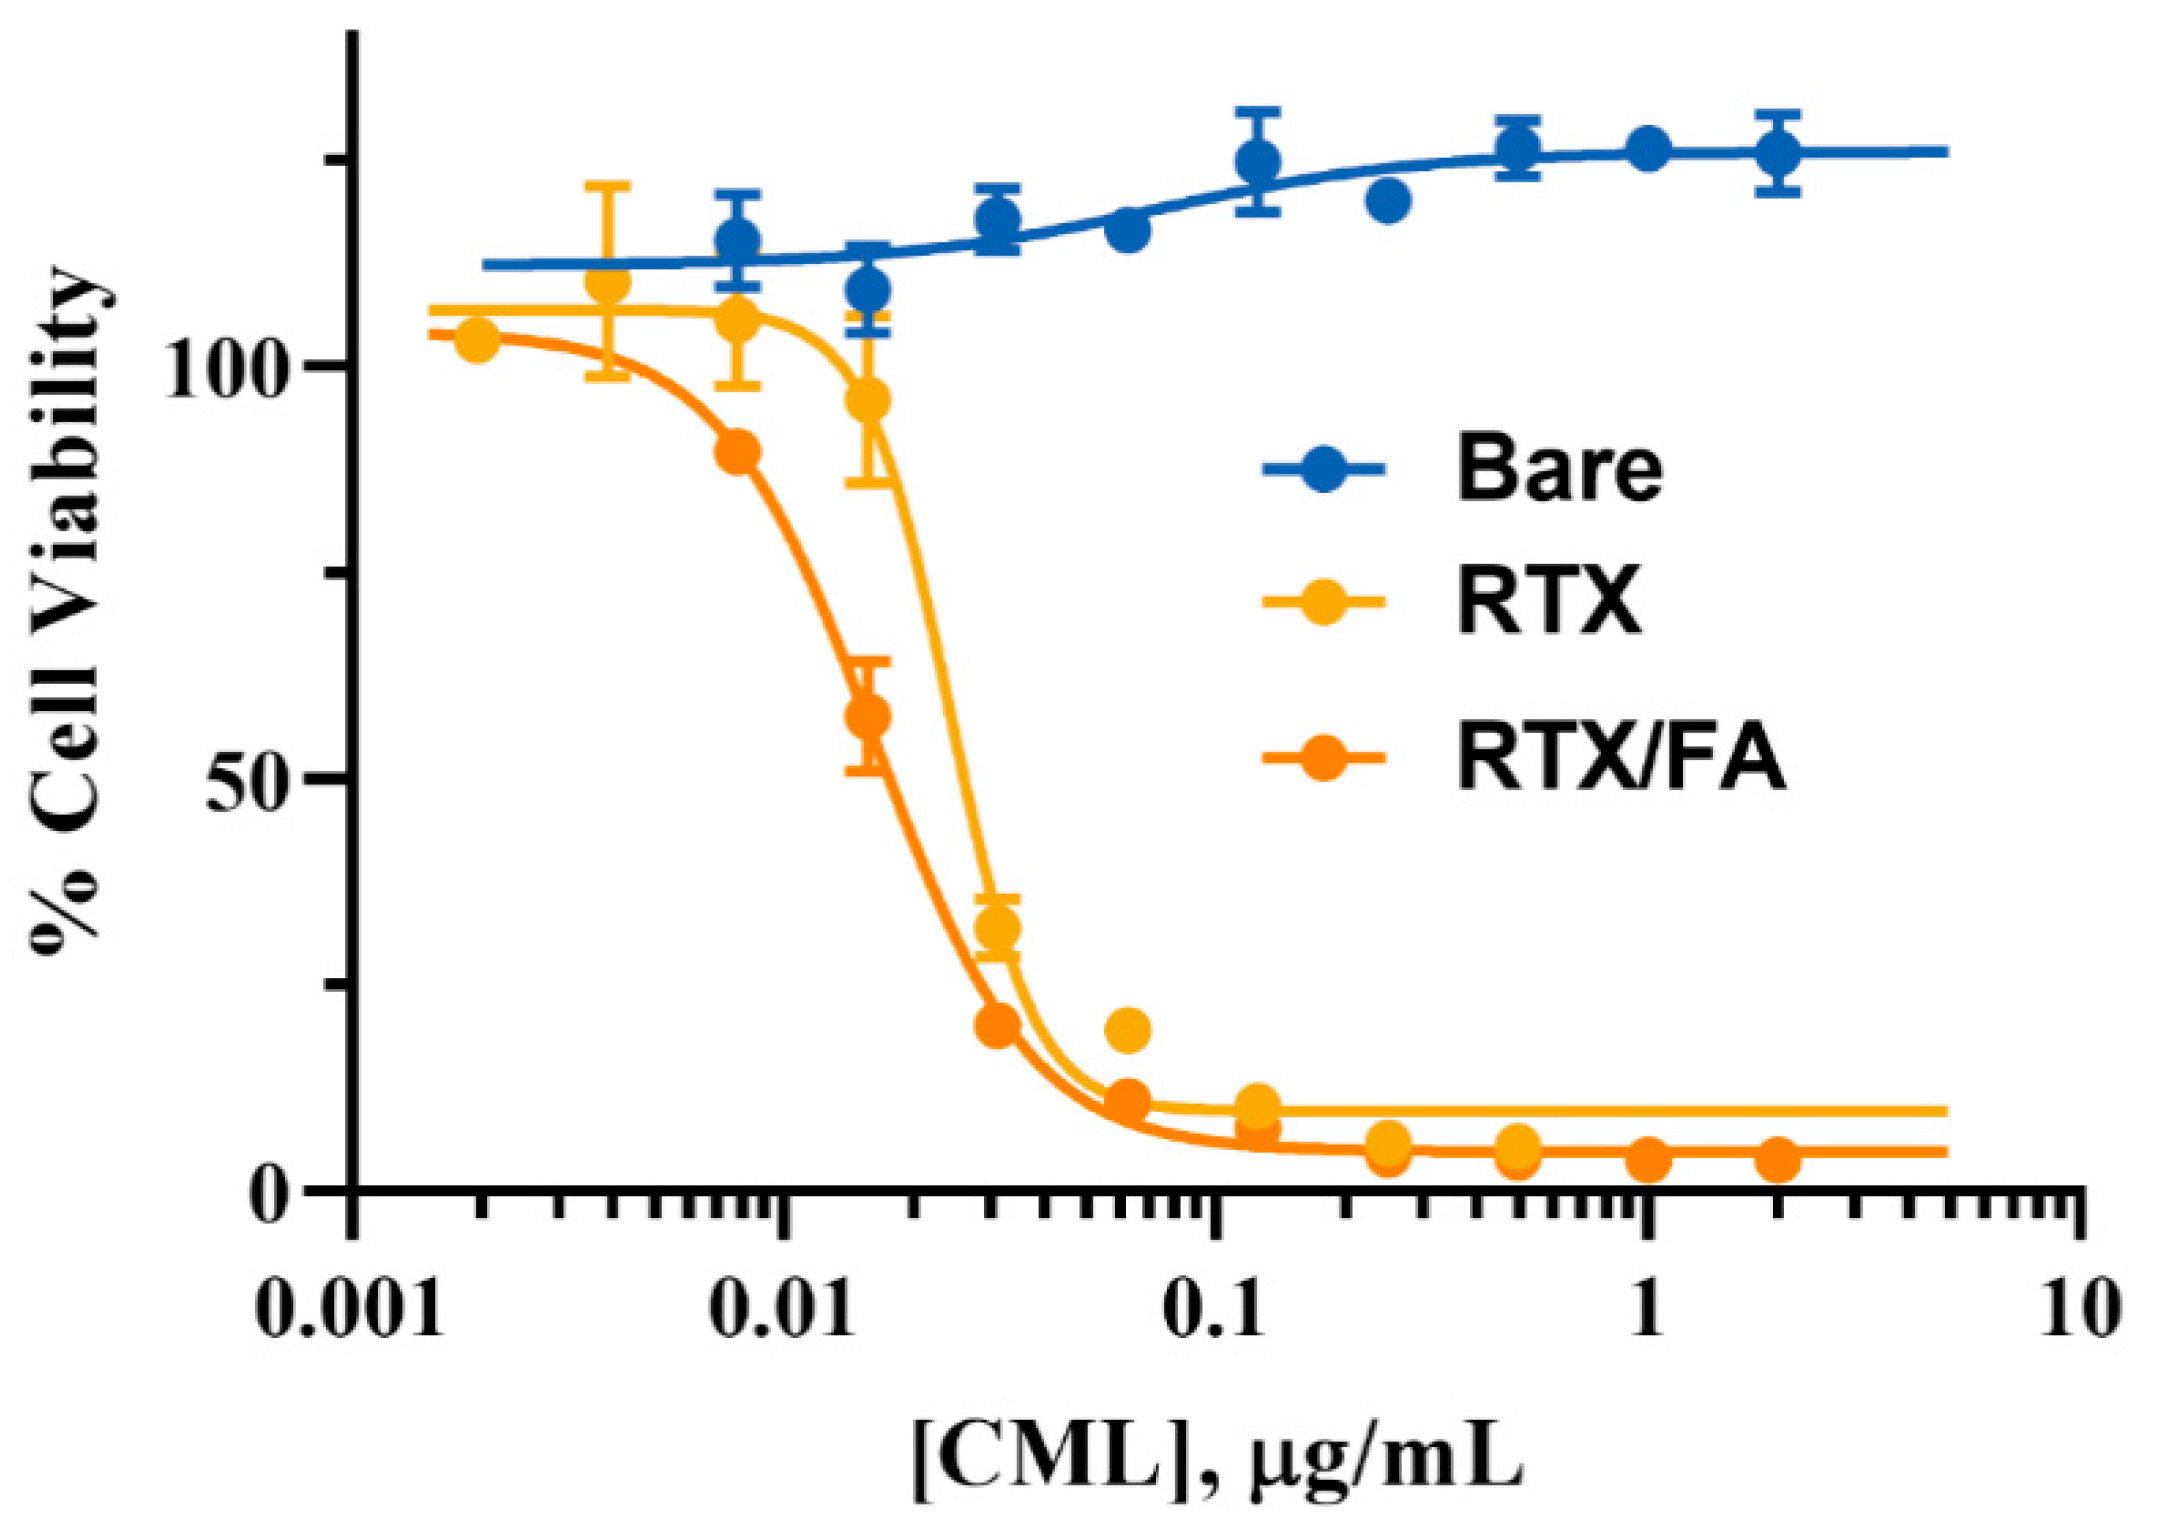
3.4. Cell Viability
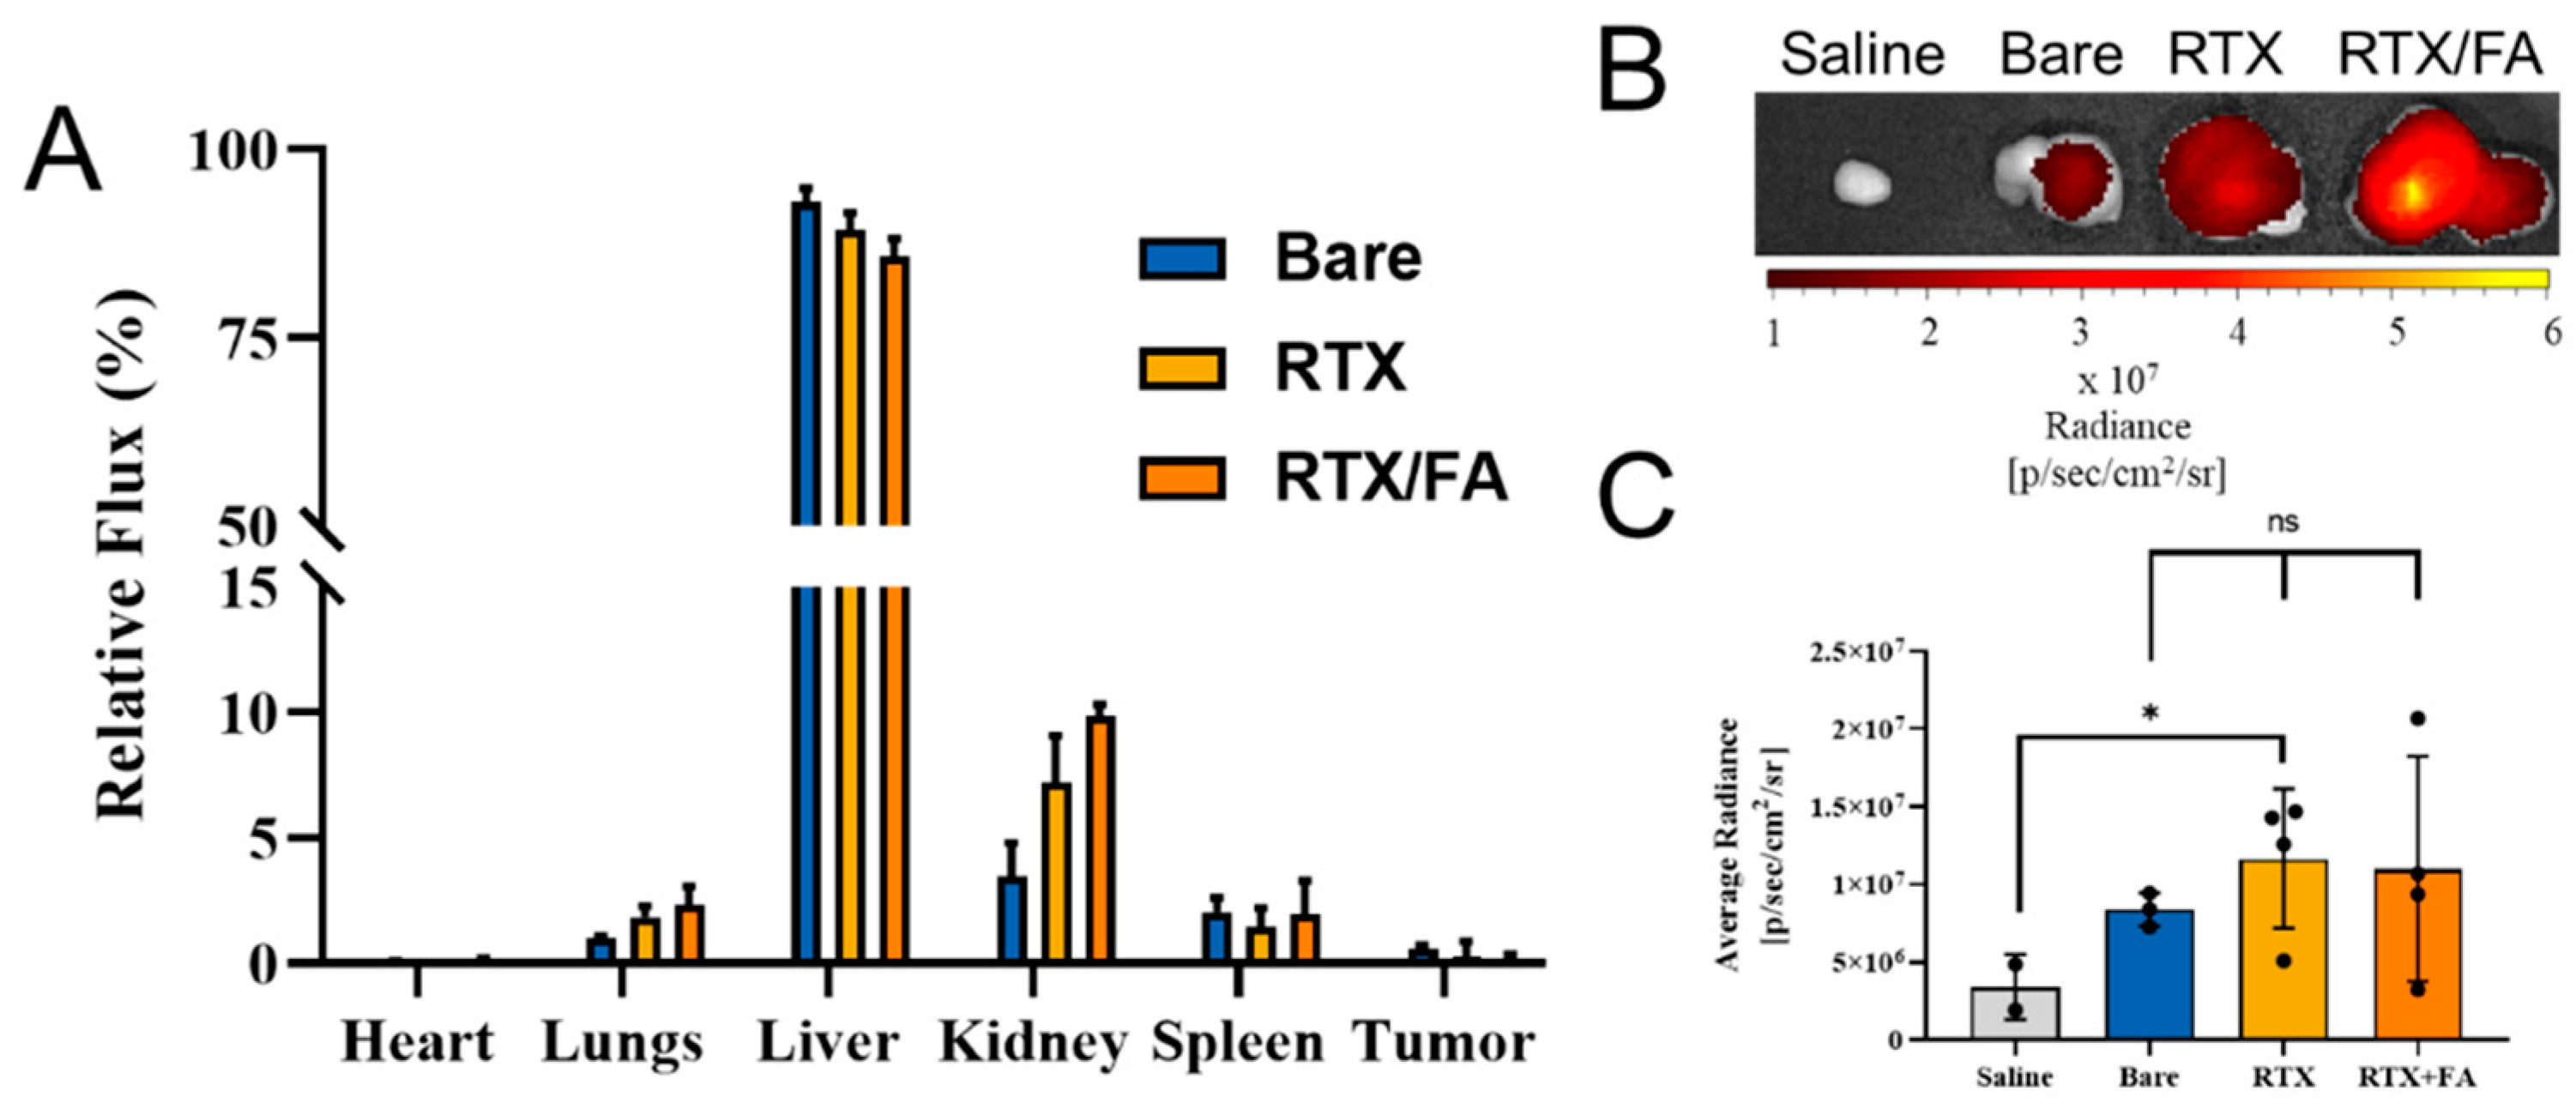
3.5. Biodistribution
4. Conclusions
Supplementary Materials
Author Contributions
Funding
Acknowledgments
Conflicts of Interest
References
- Duthie, S.J.; Hawdon, A. DNA instability (strand breakage, uracil misincorporation, and defective repair) is increased by folic acid depletion in human lymphocytes in vitro. FASEB J. 1998, 12, 1491–1497. [Google Scholar] [CrossRef] [PubMed]
- Vora, A.; Riga, A.; Dollimore, D.; Alexander, K.S. Thermal stability of folic acid. Thermochim. Acta 2002, 392–393, 209–220. [Google Scholar] [CrossRef]
- Varshosaz, J.; Hassanzadeh, F.; Sadeghi-Aliabadi, H.; Firozian, F. Uptake of Etoposide in CT-26 Cells of Colorectal Cancer Using Folate Targeted Dextran Stearate Polymeric Micelles. Biomed Res. Int. 2014, 2014, 1–11. [Google Scholar] [CrossRef] [PubMed]
- Gao, Z.G.; Tian, L.; Hu, J.; Park, I.S.; Bae, Y.H. Prevention of metastasis in a 4T1 murine breast cancer model by doxorubicin carried by folate conjugated pH sensitive polymeric micelles. J. Control. Release 2011, 152, 84–89. [Google Scholar] [CrossRef] [PubMed] [Green Version]
- Werner, M.E.; Copp, J.A.; Karve, S.; Cummings, N.D.; Sukumar, R.; Li, C.; Napier, M.E.; Chen, R.C.; Cox, A.D.; Wang, A.Z. Folate-targeted polymeric nanoparticle formulation of docetaxel is an effective molecularly targeted radiosensitizer with efficacy dependent on the timing of radiotherapy. ACS Nano 2011, 5, 8990–8998. [Google Scholar] [CrossRef] [PubMed] [Green Version]
- Jackman, A.L.; Theti, D.S.; Gibbs, D.D. Antifolates targeted specifically to the folate receptor. Adv. Drug Deliv. Rev. 2004, 56, 1111–1125. [Google Scholar] [CrossRef] [PubMed]
- Liu, S.Q.; Wiradharma, N.; Gao, S.J.; Tong, Y.W.; Yang, Y.Y. Bio-functional micelles self-assembled from a folate-conjugated block copolymer for targeted intracellular delivery of anticancer drugs. Biomaterials 2007, 28, 1423–1433. [Google Scholar] [CrossRef]
- Paulmurugan, R.; Bhethanabotla, R.; Mishra, K.; Devulapally, R.; Foygel, K.; Sekar, T.V.; Ananta, J.S.; Massoud, T.F.; Joy, A. Folate Receptor-Targeted Polymeric Micellar Nanocarriers for Delivery of Orlistat as a Repurposed Drug against Triple-Negative Breast Cancer. Mol. Cancer Ther. 2016, 15, 221–231. [Google Scholar] [CrossRef] [Green Version]
- Jackman, A.; Forster, M.; Ng, M. Targeting thymidylate synthase by antifolate drugs for the treatment of cancer. In Cancer Drug Design and Discovery; Elsevier: Amsterdam, The Netherlands, 2008; pp. 198–224. [Google Scholar]
- Tochowicz, A.; Dalziel, S.; Eidam, O.; O’Connell, J.D.; Griner, S.; Finer-Moore, J.S.; Stroud, R.M. Development and binding mode assessment of N-[4-[2-Propyn-1-yl[(6 S)-4,6,7,8-tetrahydro-2-(hydroxymethyl)-4-oxo-3H-cyclopenta[g]quinazolin-6-yl] amino]benzoyl]-L-γ-glutamyl-D-glutamic acid (BGC 945), a novel thymidylate synthase inhibitor that targets tum. J. Med. Chem. 2013, 56, 5446–5455. [Google Scholar] [CrossRef] [Green Version]
- Gibbs, D.D.; Theti, D.S.; Wood, N.; Green, M.; Raynaud, F.; Valenti, M.; Forster, M.D.; Mitchell, F.; Bavetsias, V.; Henderson, E.; et al. BGC 945, a novel tumor-selective thymidylate synthase inhibitor targeted to α-folate receptor-overexpressing tumors. Cancer Res. 2005, 65, 11721–11728. [Google Scholar] [CrossRef] [Green Version]
- Botwood, N.; James, R.; Vernon, C.; Price, P. Raltitrexed (’Tomudex’) and radiotherapy can be combined as postoperative treatment for rectal cancer. Ann. Oncol. 2000, 11, 1023–1028. [Google Scholar] [CrossRef] [PubMed] [Green Version]
- Van Meerbeeck, J.P.; Gaafar, R.; Manegold, C.; Van Klaveren, R.J.; Van Marck, E.A.; Vincent, M.; Legrand, C.; Bottomley, A.; Debruyne, C.; Giaccone, G. Randomized phase III study of cisplatin with or without raltitrexed in patients with malignant pleural mesothelioma: An intergroup study of the European organisation for research and treatment of cancer lung cancer group and the National Cancer Institute. J. Clin. Oncol. 2005, 23, 6881–6889. [Google Scholar] [CrossRef] [PubMed]
- Reni, M.; Pasetto, L.; Aprile, G.; Cordio, S.; Bonetto, E.; Dell’Oro, S.; Passoni, P.; Piemonti, L.; Fugazza, C.; Luppi, G.; et al. Raltitrexed-eloxatin salvage chemotherapy in gemcitabine-resistant metastatic pancreatic cancer. Br. J. Cancer 2006, 94, 785–791. [Google Scholar] [CrossRef] [PubMed] [Green Version]
- Van Cutsem, E. Raltitrexed (Tomudex(TM)) in combination treatment for colorectal cancer: New perspectives. Eur. J. Cancer 1999, 35, 2–3. [Google Scholar] [CrossRef]
- Wils, J. The establishment of a large collaborative trial programme in the adjuvant treatment of colon cancer. Br. J. Cancer 1998, 77, 23–28. [Google Scholar] [CrossRef] [Green Version]
- Gambacorta, M.A.; Valentini, V.; Coco, C.; Morganti, A.G.; Smaniotto, D.; Miccichè, F.; Mantini, G.; Barbaro, B.; Garcia-Vargas, J.E.; Magistrelli, P.; et al. Chemoradiation with raltitrexed and oxaliplatin in preoperative treatment of stage II-III resectable rectal cancer: Phase I and II studies. Int. J. Radiat. Oncol. Biol. Phys. 2004, 60, 139–148. [Google Scholar] [CrossRef]
- James, R.; Price, P.; Valentini, V. Raltitrexed (Tomudex(TM)) concomitant with radiotherapy as adjuvant treatment for patients with rectal cancer: Preliminary results of phase I studies. Eur. J. Cancer 1999, 35, 19–22. [Google Scholar] [CrossRef]
- Salgado Garrido, J.; Zabalegui, N.; Gil, C.; Monreal, I.; Rodríguez, J.; García-Foncillas, J. Polymorphisms in the thymidylate synthase and dihydropyrimidine dehydrogenase genes predict response and toxicity to capecitabine-raltitrexed in colorectal cancer. Oncol. Rep. 2007, 17, 325–328. [Google Scholar] [CrossRef] [Green Version]
- Laudani, A.; Gebbia, V.; Leonardi, V.; Savio, G.; Borsellino, N.; Cusimano, M.P.; Calabria, C.; Stefano, R.; Agostara, B. Activity and Toxicity of Oxaliplatin Plus Raltitrexed in 5-Fluorouracil Refractory Metastatic Colorectal Adeno-Carcinoma. Anticancer Res. 2004, 24, 1139–1142. [Google Scholar]
- Allen, T.M.; Cullis, P.R. Drug Delivery Systems: Entering the Mainstream. Science (80-.). 2004, 303, 1818–1822. [Google Scholar] [CrossRef] [Green Version]
- Brigger, I.; Dubernet, C.; Couvreur, P. Nanoparticles in cancer therapy and diagnosis. Adv. Drug Deliv. Rev. 2002, 54, 631–651. [Google Scholar] [CrossRef]
- Albanese, A.; Chan, W.C.W. Effect of gold nanoparticle aggregation on cell uptake and toxicity. ACS Nano 2011, 5, 5478–5489. [Google Scholar] [CrossRef] [PubMed]
- Choi, J.; Rustique, E.; Henry, M.; Guidetti, M.; Josserand, V.; Sancey, L.; Boutet, J.; Coll, J.L. Targeting tumors with cyclic RGD-conjugated lipid nanoparticles loaded with an IR780 NIR dye: In vitro and in vivo evaluation. Int. J. Pharm. 2017, 532, 677–685. [Google Scholar] [CrossRef] [PubMed]
- Sarcan, E.T.; Silindir-Gunay, M.; Ozer, A.Y. Theranostic polymeric nanoparticles for NIR imaging and photodynamic therapy. Int. J. Pharm. 2018, 551, 329–338. [Google Scholar] [CrossRef] [PubMed]
- Kuang, Y.; Zhang, K.; Cao, Y.; Chen, X.; Wang, K.; Liu, M.; Pei, R. Hydrophobic IR-780 Dye Encapsulated in cRGD-Conjugated Solid Lipid Nanoparticles for NIR Imaging-Guided Photothermal Therapy. ACS Appl. Mater. Interfaces 2017, 9, 12217–12226. [Google Scholar] [CrossRef] [PubMed]
- Moghimi, S.M.; Hunter, A.C.; Murray, J.C. Long-Circulating and Target-Specific Nanoparticles: Theory to Practice. Pharmacol Rev 2001, 53, 283–318. [Google Scholar]
- Dreaden, E.C.; Morton, S.W.; Shopsowitz, K.E.; Choi, J.H.; Deng, Z.J.; Cho, N.J.; Hammond, P.T. Bimodal tumor-targeting from microenvironment responsive hyaluronan layer-by-layer (LbL) nanoparticles. ACS Nano 2014, 8, 8374–8382. [Google Scholar] [CrossRef] [Green Version]
- Correa, S.; Choi, K.Y.; Dreaden, E.C.; Renggli, K.; Shi, A.; Gu, L.; Shopsowitz, K.E.; Quadir, M.A.; Ben-Akiva, E.; Hammond, P.T. Highly Scalable, Closed-Loop Synthesis of Drug-Loaded, Layer-by-Layer Nanoparticles. Adv. Funct. Mater. 2016, 26, 991–1003. [Google Scholar] [CrossRef] [Green Version]
- Morton, S.W.; Poon, Z.; Hammond, P.T. The architecture and biological performance of drug-loaded LbL nanoparticles. Biomaterials 2013, 34, 5328–5335. [Google Scholar] [CrossRef] [Green Version]
- Rosch, J.G.; Landry, M.R.; Thomas Jr, C.R.; Sun, C. Enhancing chemoradiation of colorectal cancer through targeted delivery of raltitrexed by hyaluronic acid coated nanoparticles. Nanoscale 2019. [Google Scholar] [CrossRef]
- Deng, Z.J.; Morton, S.W.; Ben-Akiva, E.; Dreaden, E.C.; Shopsowitz, K.E.; Hammond, P.T. Layer-by-layer nanoparticles for systemic codelivery of an anticancer drug and siRNA for potential triple-negative breast cancer treatment. ACS Nano 2013, 7, 9571–9584. [Google Scholar] [CrossRef] [PubMed] [Green Version]


© 2020 by the authors. Licensee MDPI, Basel, Switzerland. This article is an open access article distributed under the terms and conditions of the Creative Commons Attribution (CC BY) license (http://creativecommons.org/licenses/by/4.0/).
Share and Cite
Rosch, J.G.; DuRoss, A.N.; Landry, M.R.; Sun, C. Formulation of Folate-Modified Raltitrexed-Loaded Nanoparticles for Colorectal Cancer Theranostics. Pharmaceutics 2020, 12, 133. https://0-doi-org.brum.beds.ac.uk/10.3390/pharmaceutics12020133
Rosch JG, DuRoss AN, Landry MR, Sun C. Formulation of Folate-Modified Raltitrexed-Loaded Nanoparticles for Colorectal Cancer Theranostics. Pharmaceutics. 2020; 12(2):133. https://0-doi-org.brum.beds.ac.uk/10.3390/pharmaceutics12020133
Chicago/Turabian StyleRosch, Justin G., Allison N. DuRoss, Madeleine R. Landry, and Conroy Sun. 2020. "Formulation of Folate-Modified Raltitrexed-Loaded Nanoparticles for Colorectal Cancer Theranostics" Pharmaceutics 12, no. 2: 133. https://0-doi-org.brum.beds.ac.uk/10.3390/pharmaceutics12020133