Development of Processes for Recombinant L-Asparaginase II Production by Escherichia coli Bl21 (De3): From Shaker to Bioreactors

 ,
,  ,
,  ,
,
Abstract
:1. Introduction
2. Materials and Methods
2.1. Reagents
2.2. Microorganism
2.3. Culture Medium
2.4. Production of L-ASNase in Orbital Shaker
2.5. Production of L-ASNase in Bioreactor
2.6. L-asparaginase Activity Assay
2.7. Determination of Cell Dry Weight
2.8. Statistical Analysis
3. Results and Discussion
3.1. Assessment of the Culture Medium
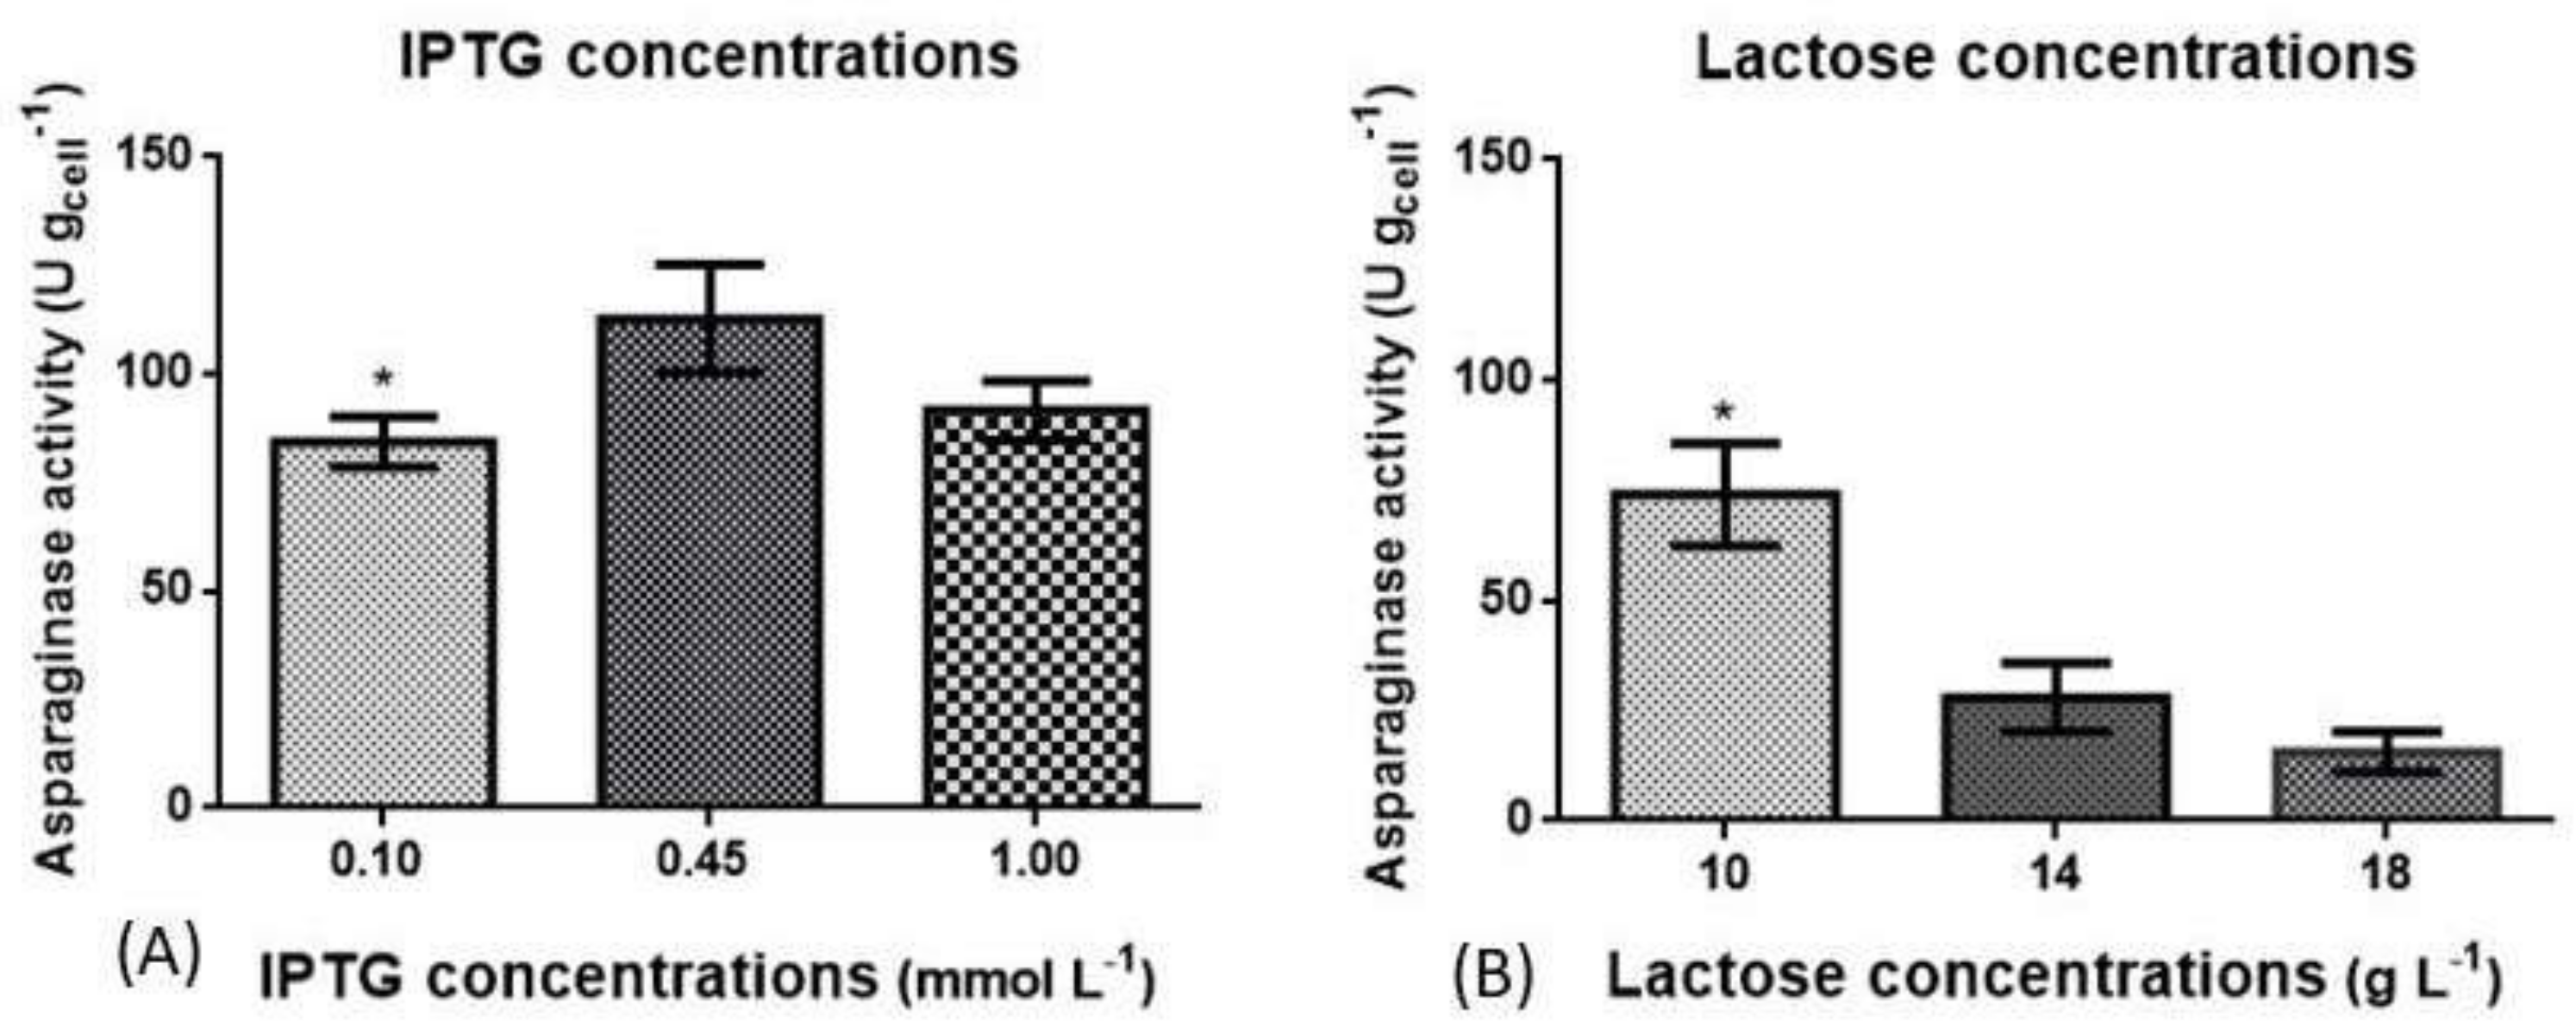
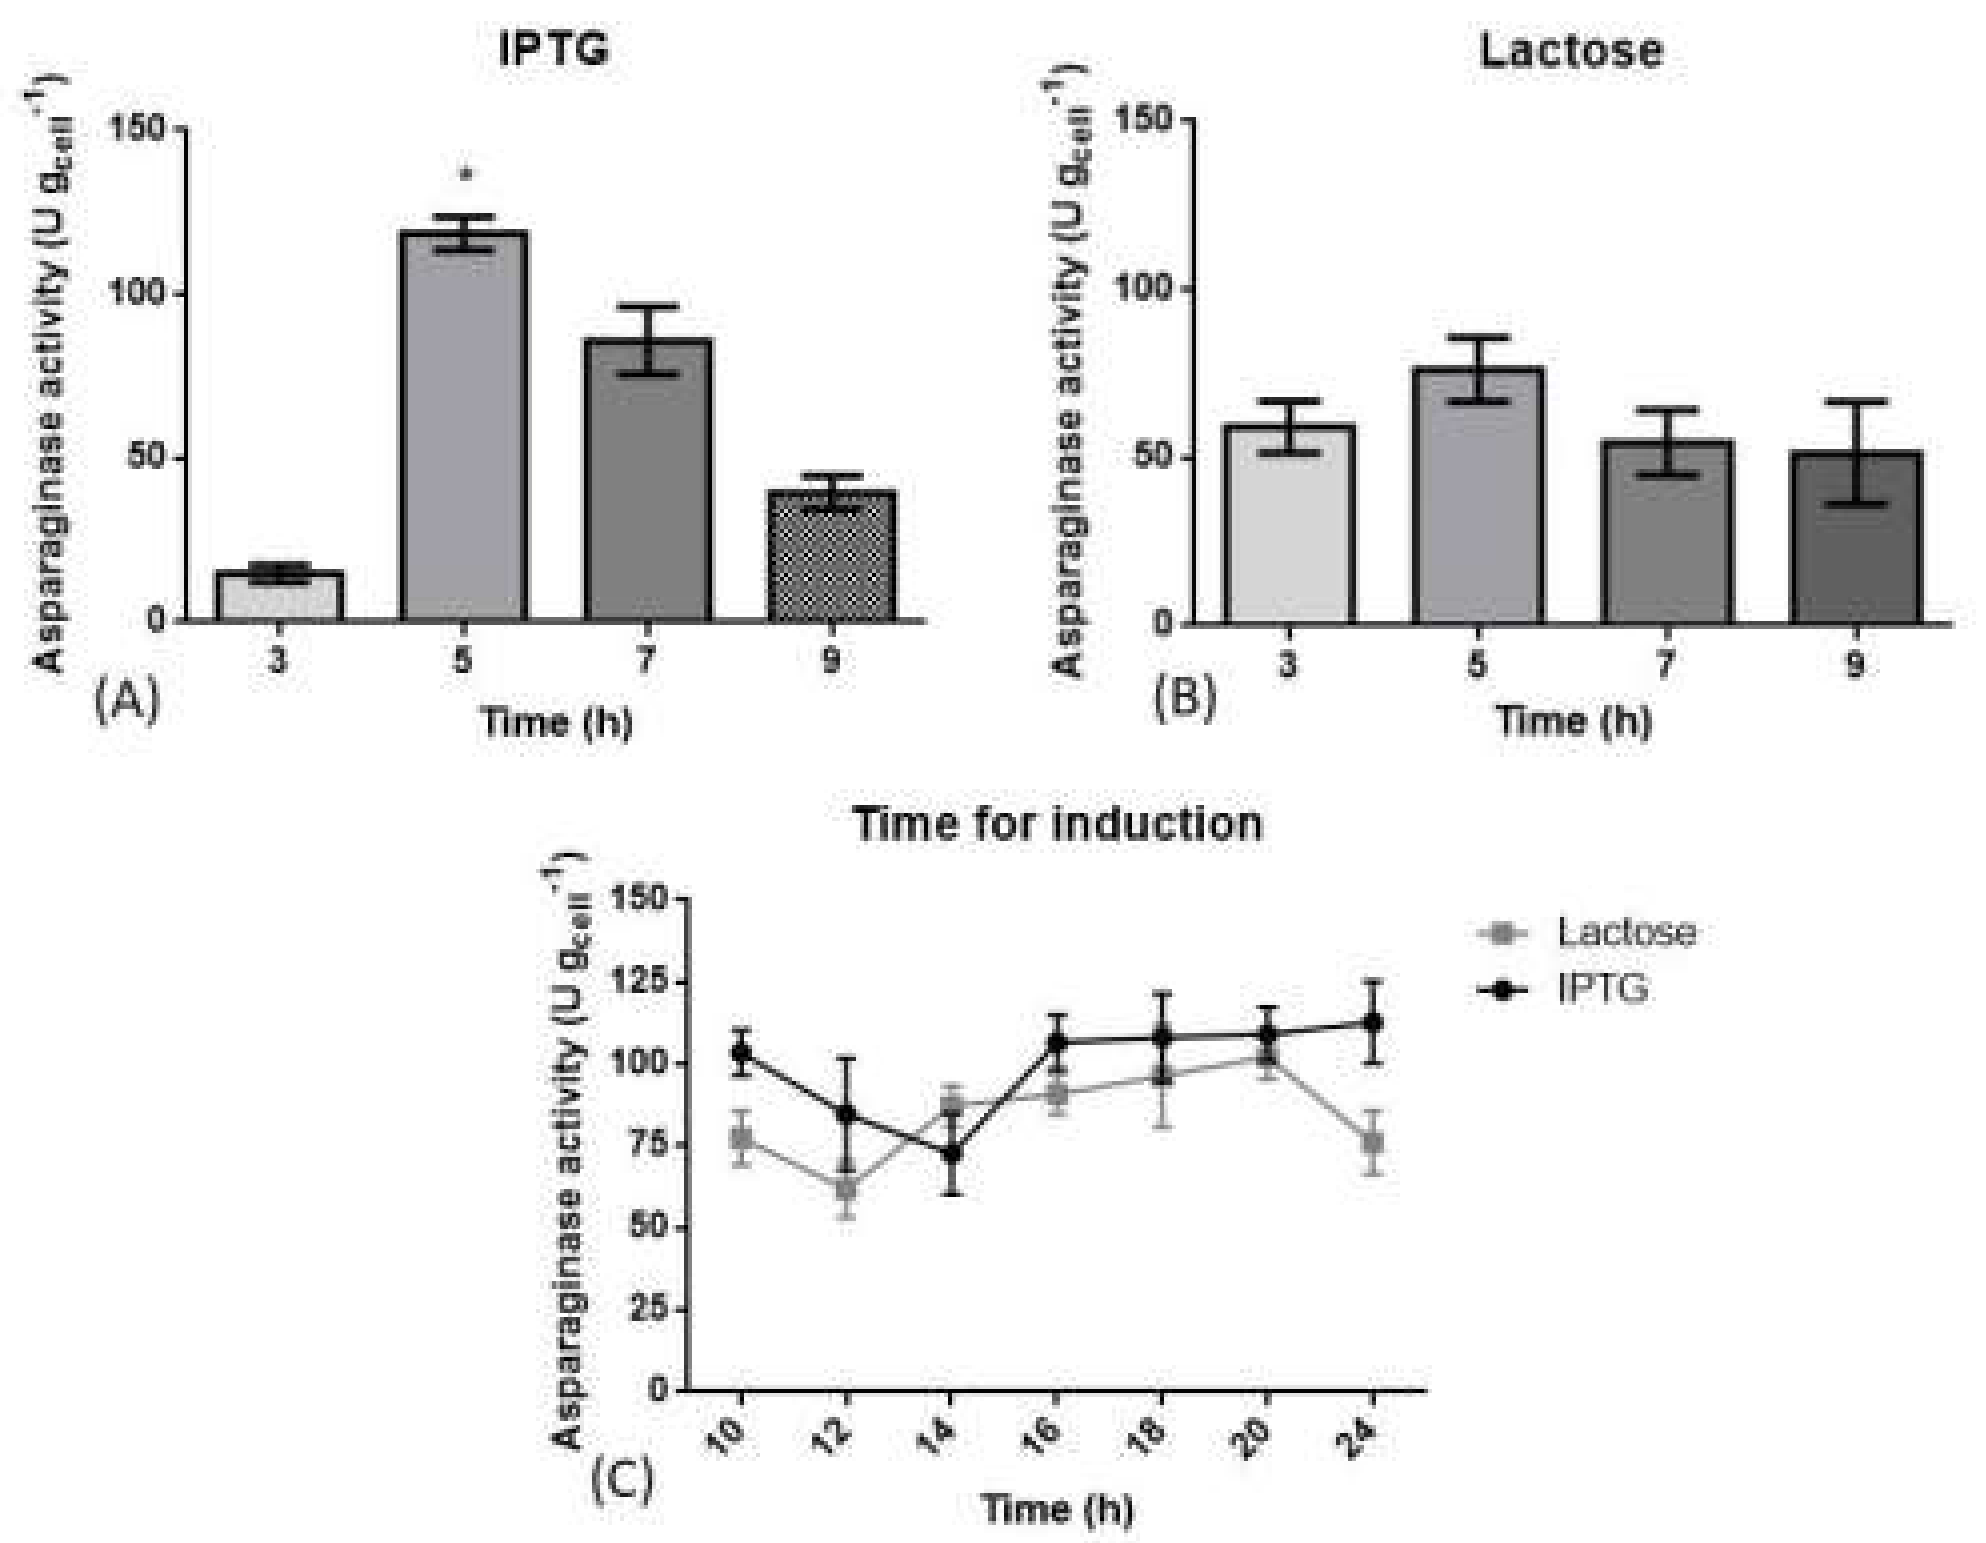
3.2. Optimization of Induction Phase Using Shaker Flasks
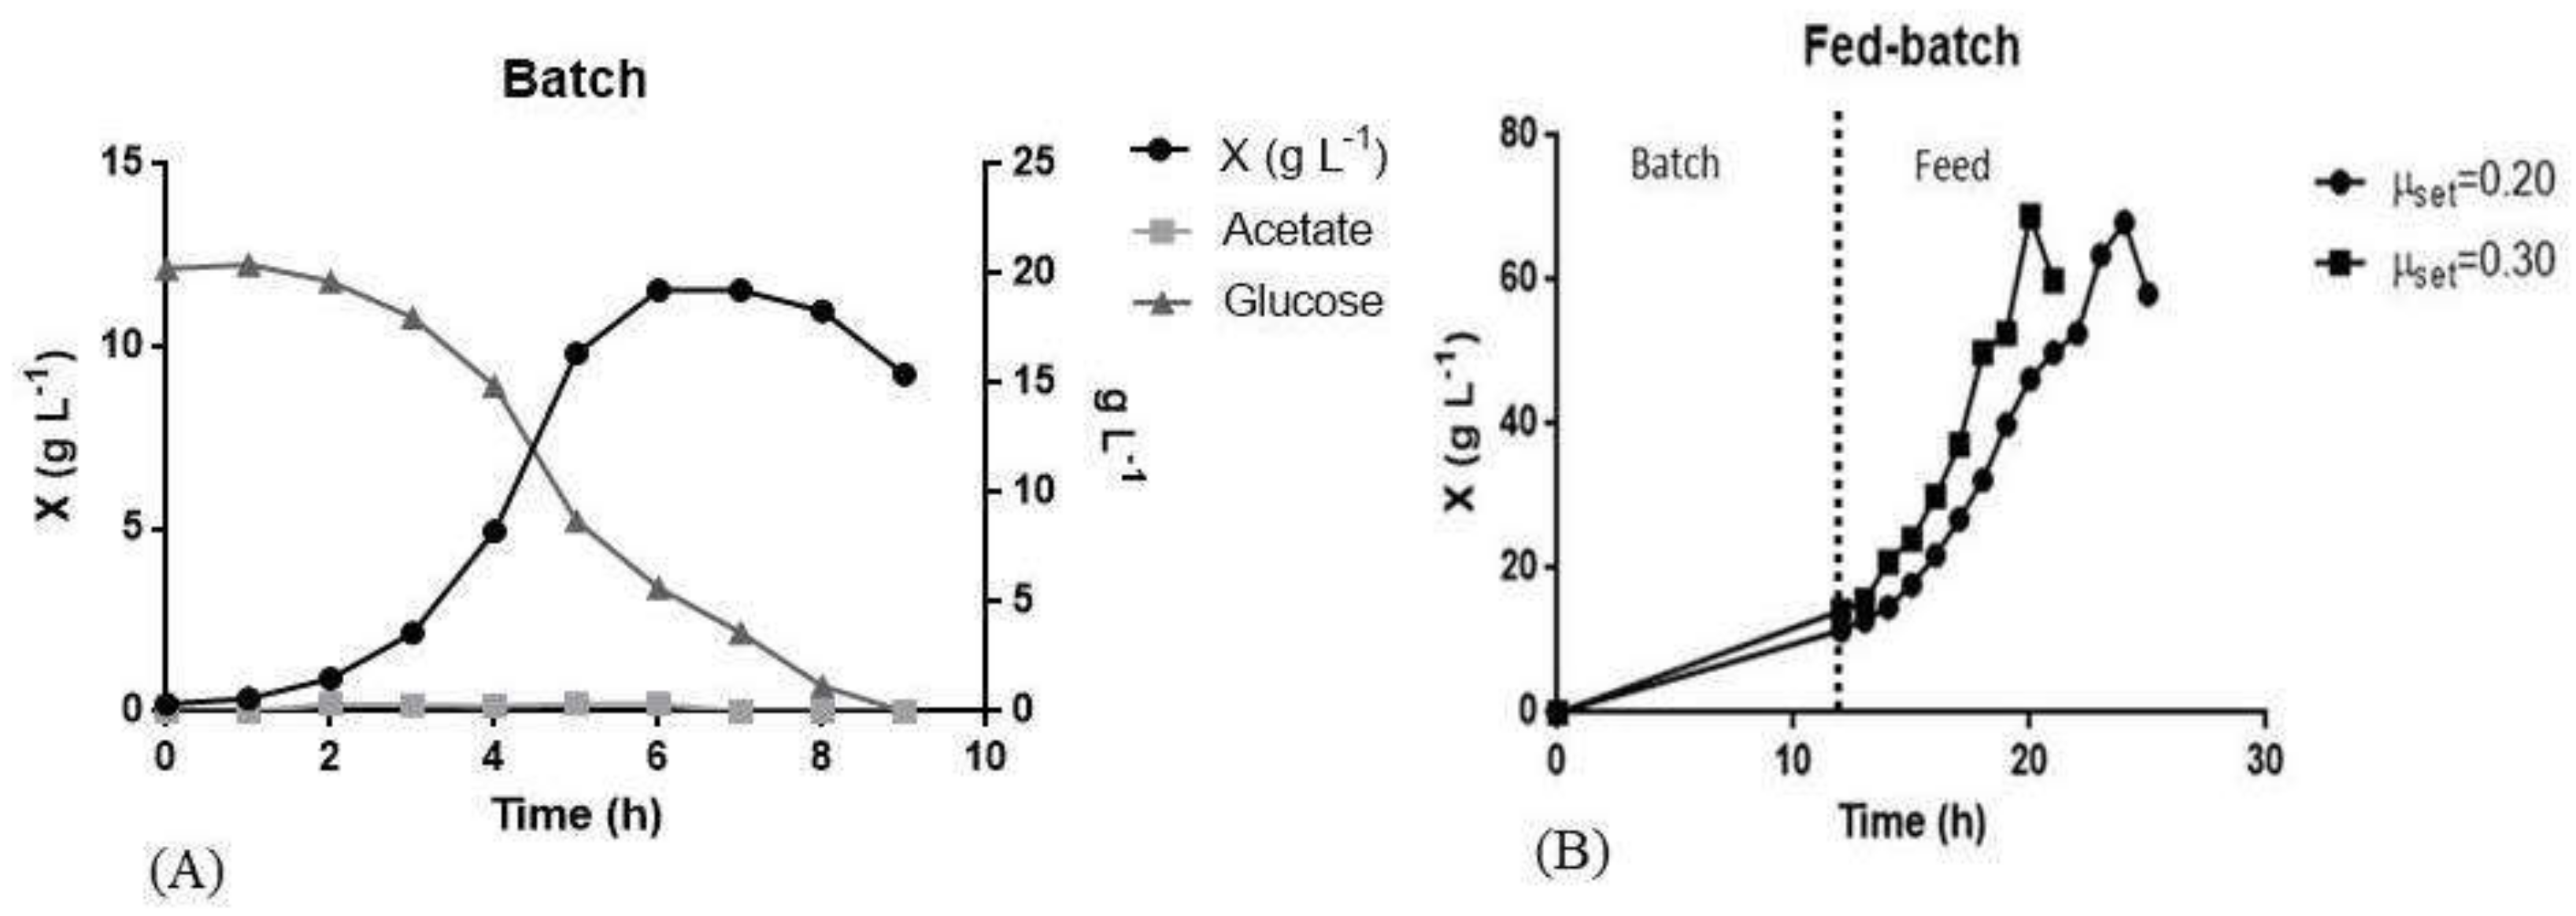
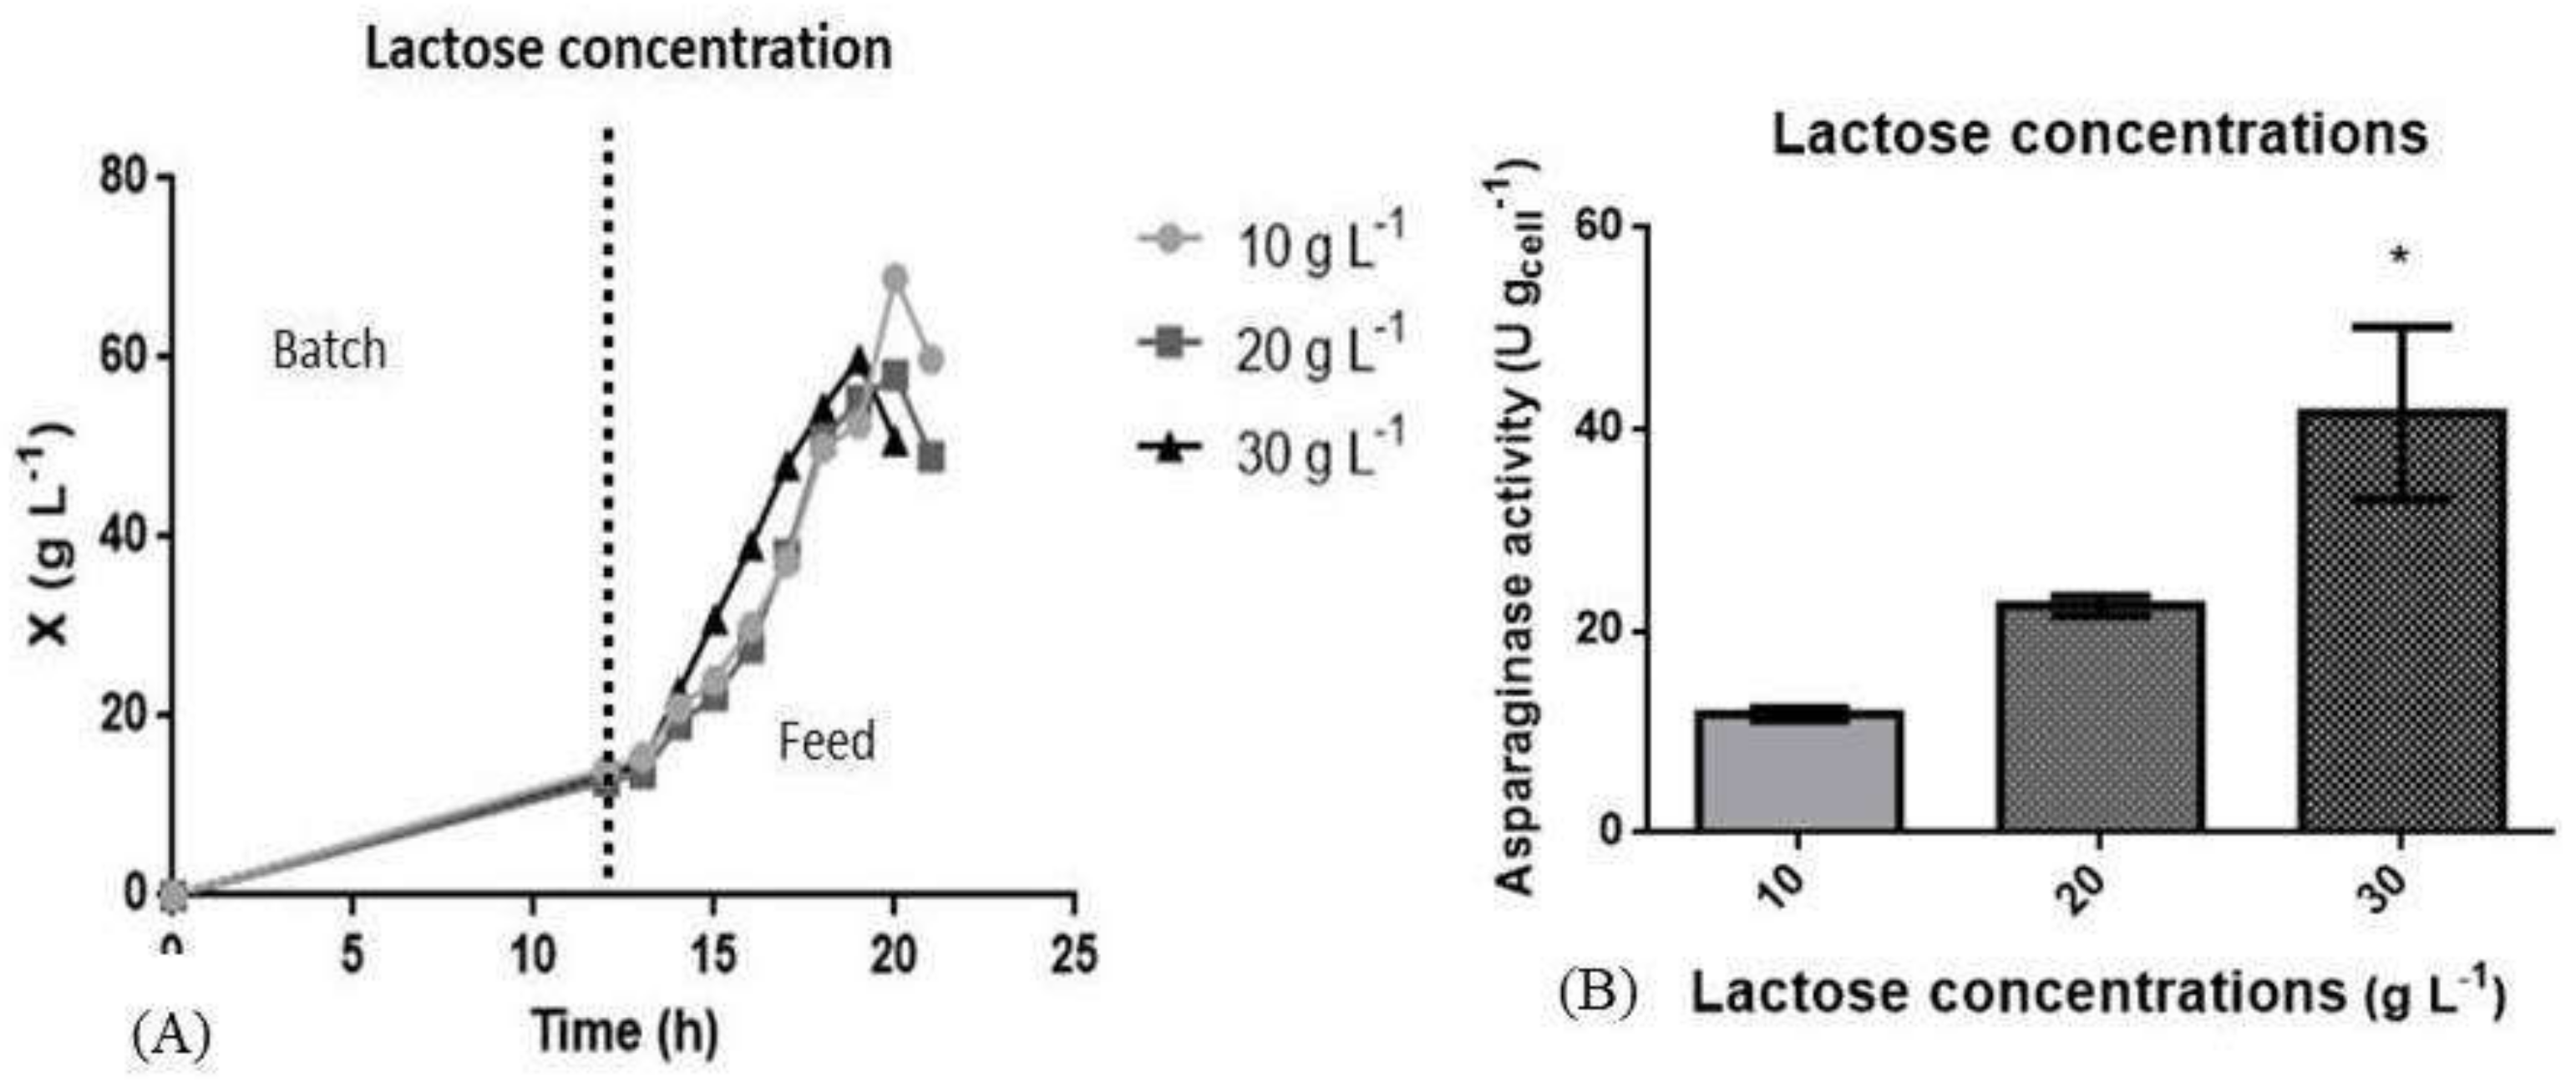
3.3. L Bioreactor Cultivation
4. Conclusions
Author Contributions
Funding
Conflicts of Interest
References
- Lassaletta Atienza, A. Leukemias. Acute lymphoblastic leukemia. Pediatr. Integr. 2016, 20, 380–389. [Google Scholar]
- Emadi, A.; Law, J.Y. MSD Manuals. Available online: https://www.msdmanuals.com (accessed on 15 July 2020).
- Quintanilla-Flores, D.L.; Flores-Caballero, M.Á.; Rodríguez-Gutiérrez, R.; Tamez-Pérez, H.E.; González-González, J.G. Acute Pancreatitis and Diabetic Ketoacidosis following L-Asparaginase/Prednisone Therapy in Acute Lymphoblastic Leukemia. Case Rep. Oncol. Med. 2014, 2014, 139169. [Google Scholar] [CrossRef] [PubMed] [Green Version]
- Cachumba, J.J.M.; Antunes, F.A.F.; Peres, G.F.D.; Brumano, L.P.; Dos Santos, J.C.; Silva, S.S. Da Current applications and different approaches for microbial l-asparaginase production. Braz. J. Microbiol. J. Microbiol. 2016, 47, 77–85. [Google Scholar] [CrossRef] [PubMed] [Green Version]
- Badoei-Dalfard, A. L-asparaginase production in the Pseudomonas pseudoalcaligenes strain JHS-71 isolated from Jooshan Hot-spring. Mol. Biol. Rescarch. Commun. 2016, 5, 1–10. [Google Scholar]
- Zyzak, D.V.; Sanders, R.A.; Stojanovic, M.; Tallmadge, D.H.; Eberhart, B.L.; Ewald, D.K.; Gruber, D.C.; Morsch, T.R.; Strothers, M.A.; Rizzi, G.P.; et al. Acrylamide formation mechanism in heated foods. J. Agric. Food Chem. 2003, 51, 4782–4787. [Google Scholar] [CrossRef]
- Lomelino, C.L.; Andring, J.T.; McKenna, R.; Kilberg, M.S. Asparagine synthetase: Function, structure, and role in disease. J. Biol. Chem. 2017, 292, 19952–19958. [Google Scholar] [CrossRef] [Green Version]
- Silva, T.A.C.E.; Costa, I.M.; Biasoto, H.P.; Lima, G.M.; Silva, C.M.; Pessoa, A.; Monteiro, G. Critical overview of the main features and techniques used for the evaluation of the clinical applicability of L-asparaginase as a biopharmaceutical to treat blood cancer. Blood Rev. 2020, 107417. [Google Scholar] [CrossRef]
- Doriya, K.; Kumar, D.S. Isolation and screening of L-asparaginase free of glutaminase and urease from fungal sp. 3 Biotech 2016, 6, 1–10. [Google Scholar] [CrossRef] [Green Version]
- Lima, G.M.; Effer, B.; Biasoto, H.P.; Feijoli, V.; Pessoa, A.; Palmisano, G.; Monteiro, G. Glycosylation of L-asparaginase from E. coli through yeast expression and site-directed mutagenesis. Biochem. Eng. J. 2020, 156, 107516. [Google Scholar] [CrossRef]
- Woods, D.; Winchester, K.; Towerman, A.; Gettinger, K.; Carey, C.; Timmermann, K.; Langley, R.; Browne, E. From the Children’s Oncology Group: Evidence-Based Recommendations for PEG-Asparaginase Nurse Monitoring, Hypersensitivity Reaction Management, and Patient/Family Education. J. Pediatr. Oncol. Nurs. 2017, 34, 387–396. [Google Scholar] [CrossRef] [Green Version]
- Hunt, I. From gene to protein: A review of new and enabling technologies for multi-parallel protein expression. Protein Expr. Purif. 2005, 40, 1–22. [Google Scholar] [CrossRef] [PubMed]
- Schimidell, W.; Lima, U.A.; Aquarone, E.; Borzani, W. Biotecnologia Industrial: Engenharia Química; Editora Edgard Blucher LTDA: São Paulo, Brazil, 2001. [Google Scholar]
- Lee, S.Y. High cell-density culture of Escherichia coli. Trends Biotechnol. 1996, 14, 98–105. [Google Scholar] [CrossRef]
- Tripathi, N.K.; Shrivastava, A. Recent Developments in Bioprocessing of Recombinant Proteins: Expression Hosts and Process Development. Front. Bioeng. Biotechnol. 2019, 7, 420. [Google Scholar] [CrossRef] [PubMed] [Green Version]
- Baneyx, F. Recombinant protein expression in Escherichia coli. Curr. Opin. Biotechnol. 1999, 10, 411–421. [Google Scholar] [CrossRef]
- Rosano, G.L.; Ceccarelli, E.A. Recombinant protein expression in Escherichia coli: Advances and challenges. Front. Microbiol. 2014, 5, 1–17. [Google Scholar] [CrossRef] [Green Version]
- Riesenberg, D.; Schulz, V.; Knorre, W.A.; Pohl, H.D.; Korz, D.J.; Sanders, E.A.; Roß, A.; Deckwer, W.D. High cell density cultivation of Escherichia coli at controlled specific growth rate. J. Biotechnol. 1991, 20, 17–28. [Google Scholar] [CrossRef]
- Studier, F.W. Protein production by auto-induction in high density shaking cultures. Protein Expr. Purif. 2005, 41, 207–234. [Google Scholar] [CrossRef]
- Santos, J.C.F. Cultivation of Escherichia coli BL21 (DE3) For Production of L-Asparaginase II. Master’s Thesis, University of Sao Paulo, São Paulo, Brazil, 2017. [Google Scholar]
- Babbal; Adivitiya; Mohanty, S.; Khasa, Y.P. Bioprocess optimization for the overproduction of catalytic domain of ubiquitin-like protease 1 (Ulp1) from S. cerevisiae in E. coli fed-batch culture. Enzyme Microb. Technol. 2019, 120, 98–109. [Google Scholar] [CrossRef]
- Chua, L.H.; Tan, S.C.; Liew, M.W.O. Process intensification of core streptavidin production through high-cell-density cultivation of recombinant E. coli and a temperature-based refolding method. J. Biotechnol. 2018, 276–277, 34–41. [Google Scholar] [CrossRef]
- Duan, X.; Zhang, X.; Shen, Z.; Su, E.; Zhao, L.; Pei, J. Efficient production of aggregation prone 4-α-glucanotransferase by combined use of molecular chaperones and chemical chaperones in Escherichia coli. J. Biotechnol. 2019, 292, 68–75. [Google Scholar] [CrossRef]
- Saha, A.; Acharya, B.N.; Priya, R.; Tripathi, N.K.; Shrivastava, A.; Rao, M.K.; Kesari, P.; Narwal, M.; Tomar, S.; Bhagyawant, S.S.; et al. Development of nsP2 protease based cell free high throughput screening assay for evaluation of inhibitors against emerging Chikungunya virus. Sci. Rep. 2018, 8, 10831. [Google Scholar] [CrossRef] [PubMed]
- Bashir, H.; Ahmed, N.; Khan, M.A.; Zafar, A.U.; Tahir, S.; Khan, M.I.; Khan, F.; Husnain, T. Simple procedure applying lactose induction and one-step purification for high-yield production of rhCIFN. Biotechnol. Appl. Biochem. 2016, 63, 708–714. [Google Scholar] [CrossRef] [PubMed]
- Kim, Y.S.; Karisa, N.; Jeon, W.Y.; Lee, H.; Kim, Y.; Ahn, J. High-level production of N-terminal pro-brain natriuretic peptide, as a calibrant of heart failure diagnosis, in Escherichia coli. Appl. Microbiol. Biotechnol. 2019, 103, 4779–4788. [Google Scholar] [CrossRef] [PubMed]
- Tian, H.; Tang, L.; Wang, Y.; Wang, X.; Guan, L.; Zhang, J.; Wu, X.; Li, X. Lactose induction increases production of recombinant keratinocyte growth factor-2 in Escherichia coli. Int. J. Pept. Res. Ther. 2011, 17, 123–129. [Google Scholar] [CrossRef]
- Drainas, C.; Kinghorn, J.R.; Pateman, J.A. Aspartic hydroxamate resistance and asparaginase regulation in the fungus Aspergillus nidulans. J. Gen. Microbiol. 1977, 98, 493–501. [Google Scholar] [CrossRef] [Green Version]
- Ponce, E. Effect of growth rate reduction and genetic modifications on acetate accumulation and biomass yields in Escherichia coli. J. Biosci. Bioeng. 1999, 87, 775–780. [Google Scholar] [CrossRef]
- Lozano Terol, G.; Gallego-Jara, J.; Sola Martínez, R.A.; Cánovas Díaz, M.; De Diego Puente, T. Engineering protein production by rationally choosing a carbon and nitrogen source using E. coli BL21 acetate metabolism knockout strains. Microb. Cell Fact. 2019, 18, 1–19. [Google Scholar] [CrossRef] [Green Version]
- Luli, G.W.; Strohl, W.R. Comparison of growth, acetate production, and acetate inhibition of Escherichia coli strains in batch and fed-batch fermentations. Appl. Environ. Microbiol. 1990, 56, 1004–1011. [Google Scholar] [CrossRef] [Green Version]
- Müller, J.; Beckers, M.; Mußmann, N.; Bongaerts, J.; Büchs, J. Elucidation of auxotrophic deficiencies of Bacillus pumilus DSM 18097 to develop a defined minimal medium. Microb. Cell Fact. 2018, 17, 1–17. [Google Scholar] [CrossRef]
- Jiao, L.; Chi, H.; Lu, Z.; Zhang, C.; Chia, S.R.; Show, P.L.; Tao, Y.; Lu, F. Characterization of a novel type I L-asparaginase from Acinetobacter soli and its ability to inhibit acrylamide formation in potato chips. J. Biosci. Bioeng. 2020, 129, 672–678. [Google Scholar] [CrossRef]
- Mihooliya, K.N.; Nandal, J.; Kumari, A.; Nanda, S.; Verma, H.; Sahoo, D.K. Studies on efficient production of a novel l-asparaginase by a newly isolated Pseudomonas resinovorans IGS-131 and its heterologous expression in Escherichia coli. 3 Biotech 2020, 10, 1–11. [Google Scholar] [CrossRef] [PubMed]
- Safary, A.; Moniri, R.; Hamzeh-Mivehroud, M.; Dastmalchi, S. Highly efficient novel recombinant L-asparaginase with no glutaminase activity from a new halo-thermotolerant Bacillus strain. BioImpacts 2019, 9, 15–23. [Google Scholar] [CrossRef] [Green Version]
- Zhang, Y.; Li, D.; Li, Y. Expression and purification of L-asparaginase from Escherichia coli and the inhibitory effects of cyclic dipeptides. Nat. Prod. Res. 2017, 31, 2099–2106. [Google Scholar] [CrossRef] [PubMed]
- Pokrovskaya, M.V.; Aleksandrova, S.S.; Pokrovsky, V.S.; Veselovsky, A.V.; Grishin, D.V.; Abakumova, O.Y.; Podobed, O.V.; Mishin, A.A.; Zhdanov, D.D.; Sokolov, N.N. Identification of Functional Regions in the Rhodospirillum rubrum L-Asparaginase by Site-Directed Mutagenesis. Mol. Biotechnol. 2015, 57, 251–264. [Google Scholar] [CrossRef] [PubMed]
- Maqsood, B.; Basit, A.; Khurshid, M.; Bashir, Q. Characterization of a thermostable, allosteric L-asparaginase from Anoxybacillus flavithermus. Int. J. Biol. Macromol. 2020, 152, 584–592. [Google Scholar] [CrossRef]
- Chohan, S.M.; Sajed, M.; Naeem, S.U.; Rashid, N. Heterologous gene expression and characterization of TK2246, a highly active and thermostable plant type L-asparaginase from Thermococcus kodakarensis. Int. J. Biol. Macromol. 2020, 147, 131–137. [Google Scholar] [CrossRef]
- Farahat, M.G.; Amr, D.; Galal, A. Molecular cloning, structural modeling and characterization of a novel glutaminase-free L-asparaginase from Cobetia amphilecti AMI6. Int. J. Biol. Macromol. 2020, 143, 685–695. [Google Scholar] [CrossRef]
- Aishwarya, S.S.; Selvarajan, E.; Iyappan, S.; Rajnish, K.N. Recombinant l-Asparaginase II from Lactobacillus casei subsp. casei ATCC 393 and Its Anticancer Activity. Indian J. Microbiol. 2019, 59, 313–320. [Google Scholar] [CrossRef]
- Chohan, S.M.; Rashid, N.; Sajed, M.; Imanaka, T. Pcal_0970: An extremely thermostable L-asparaginase from Pyrobaculum calidifontis with no detectable glutaminase activity. Folia Microbiol. 2018, 64, 313–320. [Google Scholar] [CrossRef]
- Radha, R.; Arumugam, N.; Gummadi, S.N. Glutaminase free L-asparaginase from Vibrio cholerae: Heterologous expression, purification and biochemical characterization. Int. J. Biol. Macromol. 2018, 111, 129–138. [Google Scholar] [CrossRef]
- Sindhu, R.; Manonmani, H.K. Expression and characterization of recombinant L-asparaginase from Pseudomonas fluorescens. Protein Expr. Purif. 2018, 143, 83–91. [Google Scholar] [CrossRef] [PubMed]
- Farag, A.; Ataya, F.; Ali, H.; Hussein, A.; Saeed, H.; El-Sharkawy, A.; Embaby, A.; Soudan, H. Molecular cloning, structural modeling and production of recombinant Aspergillus terreus L. asparaginase in Escherichia coli. Int. J. Biol. Macromol. 2017, 106, 1041–1051. [Google Scholar] [CrossRef]
- Ghasemi, A.; Asad, S.; Kabiri, M.; Dabirmanesh, B. Cloning and characterization of Halomonas elongata L-asparaginase, a promising chemotherapeutic agent. Appl. Microbiol. Biotechnol. 2017, 101, 7227–7238. [Google Scholar] [CrossRef] [PubMed]
- Shi, R.; Liu, Y.; Mu, Q.; Jiang, Z.; Yang, S. Biochemical characterization of a novel L-asparaginase from Paenibacillus barengoltzii being suitable for acrylamide reduction in potato chips and mooncakes. Int. J. Biol. Macromol. 2017, 96, 93–99. [Google Scholar] [CrossRef]
- Kebeish, R.; El-Sayed, A.; Fahmy, H.; Abdel-Ghany, A. Molecular cloning, biochemical characterization, and antitumor properties of a novel L-asparaginase from Synechococcus elongatus PCC6803. Biochemistry 2016, 81, 1173–1181. [Google Scholar] [CrossRef] [PubMed]
- Santos, J.H.P.M.; Costa, I.M.; Molino, J.V.D.; Leite, M.S.M.; Pimenta, M.V.; Coutinho, J.A.P.; Pessoa, A., Jr.; Ventura, S.P.M.; Lopes, A.M.; Monteiro, G. Heterologous expression and purification of active L-asparaginase I of Saccharomyces cerevisiae in Escherichia coli host. Biotechnol. Prog. 2016, 33, 416–424. [Google Scholar] [CrossRef]
- Costa, I.M.; Schultz, L.; De Araujo Bianchi Pedra, B.; Leite, M.S.M.; Farsky, S.H.P.; De Oliveira, M.A.; Pessoa, A.; Monteiro, G. Recombinant L-asparaginase 1 from Saccharomyces cerevisiae: An allosteric enzyme with antineoplastic activity. Sci. Rep. 2016, 6, 1–11. [Google Scholar] [CrossRef]
- Labrou, N.E.; Muharram, M.M. Biochemical characterization and immobilization of Erwinia carotovora L-asparaginase in a microplate for high-throughput biosensing of L-asparagine. Enzyme Microb. Technol. 2016, 92, 86–93. [Google Scholar] [CrossRef]
- Lee, S.J.; Lee, Y.; Park, G.H.; Umasuthan, N.; Heo, S.J.; de Zoysa, M.; Jung, W.K.; Lee, D.W.; Kim, H.; Kang, D.H.; et al. A newly identified glutaminase-free L-Asparaginase (L-ASPG86) from the marine bacterium Mesoflavibacter zeaxanthinifaciens. J. Microbiol. Biotechnol. 2016, 26, 1115–1123. [Google Scholar] [CrossRef] [Green Version]
- Kim, S.K.; Min, W.K.; Park, Y.C.; Seo, J.H. Application of repeated aspartate tags to improving extracellular production of Escherichia coli l-asparaginase isozyme II. Enzyme Microb. Technol. 2015, 79–80, 49–54. [Google Scholar] [CrossRef]
- Kishore, V.; Nishita, K.P.; Manonmani, H.K. Cloning, expression and characterization of l-asparaginase from Pseudomonas fluorescens for large scale production in E. coli BL21. 3 Biotech 2015, 5, 975–981. [Google Scholar] [CrossRef] [PubMed] [Green Version]
- Upadhyay, A.K.; Singh, A.; Mukherjee, K.J.; Panda, A.K. Refolding and purification of recombinant L-asparaginase from inclusion bodies of E. coli into active tetrameric protein. Front. Microbiol. 2014, 5, 1–11. [Google Scholar] [CrossRef] [PubMed]
- Han, S.; Jung, J.; Park, W. Biochemical Characterization of L-Asparaginase in NaCl-Tolerant Staphylococcus sp. OJ82 Isolated from Fermented Seafood. J. Microbiol. Biotechnol. 2014, 24, 1096–1104. [Google Scholar] [CrossRef] [PubMed] [Green Version]
- Pourhossein, M.; Korbekandi, H. Cloning, expression, purification and characterisation of Erwinia carotovora L-asparaginase in Escherichia coli. Adv. Biomed. Res. 2014, 3, 82. [Google Scholar] [CrossRef] [PubMed]
- Roth, G.; Nunes, J.E.S.; Rosado, L.A.; Bizarro, C.V.; Volpato, G.; Nunes, C.P.; Renard, G.; Basso, L.A.; Santos, D.S.; Chies, J.M. Recombinant Erwinia carotovora l-asparaginase II production in Escherichia coli fed-batch cultures. Brazilian J. Chem. Eng. 2013, 30, 245–256. [Google Scholar] [CrossRef] [Green Version]
- Pokrovskii, V.S.; Pokrovskaya, M.V.; Aleksandrova, S.S.; Anrianov, R.M.; Zhdanov, D.D.; Osmel’yanyuk, N.M.; Treshchalina, E.M.; Sokolov, N.N. Physicochemical properties and antiproliferative activity of recombinant Yersinia pseudotuberculosis L-asparaginase. Appl. Biochem. Microbiol. 2013, 49, 18–22. [Google Scholar] [CrossRef]
- Sidoruk, K.V.; Pokrovsky, V.S.; Borisova, A.A.; Omeljanuk, N.M.; Aleksandrova, S.S.; Pokrovskaya, M.V.; Gladilina, J.A.; Bogush, V.G.; Sokolov, N.N. Creation of a producent, optimization of expression, and purifi cation of recombinant Yersinia Pseudotuberculosis L-asparaginase. Bull. Exp. Biol. Med. 2011, 152, 219–223. [Google Scholar] [CrossRef]
- Oza, V.P.; Parmar, P.P.; Patel, D.H.; Subramanian, R.B. Cloning, expression and characterization of l-asparaginase from Withania somnifera L. for large scale production. 3 Biotech 2011, 1, 21–26. [Google Scholar] [CrossRef] [Green Version]
- Pokrovskaya, M.V.; Aleksandrova, S.S.; Pokrovsky, V.S.; Omeljanjuk, N.M.; Borisova, A.A.; Anisimova, N.Y.; Sokolov, N.N. Cloning, expression and characterization of the recombinant Yersinia pseudotuberculosis L-asparaginase. Protein Expr. Purif. 2012, 82, 150–154. [Google Scholar] [CrossRef]
- Eisele, N.; Linke, D.; Bitzer, K.; Na’amnieh, S.; Nimtz, M.; Berger, R.G. The first characterized asparaginase from a basidiomycete, Flammulina velutipes. Bioresour. Technol. 2011, 102, 3316–3321. [Google Scholar] [CrossRef]
- Cho, C.W.; Lee, H.J.; Chung, E.; Kim, K.M.; Heo, J.E.; Kim, J.I.; Chung, J.; Ma, Y.; Fukui, K.; Lee, D.W.; et al. Molecular characterization of the soybean L-asparaginase gene induced by low temperature stress. Mol. Cells 2007, 23, 280–286. [Google Scholar] [PubMed]
- Jianhua, C.; Yujun, W.; Ruibo, J.; Min, W.; Wutong, W. Probing the antigenicity of E. coli L-asparaginase by mutational analysis. Mol. Biotechnol. 2006, 33, 57–65. [Google Scholar] [CrossRef] [PubMed]
- Kotzia, G.A.; Labrou, N.E. Cloning, expression and characterisation of Erwinia carotovora L-asparaginase. J. Biotechnol. 2005, 119, 309–323. [Google Scholar] [CrossRef] [PubMed]
- Krasotkina, J.; Borisova, A.A.; Gervaziev, Y.V.; Sokolov, N.N. One-step purification and kinetic properties of the recombinant l-asparaginase from Erwinia carotovora. Biotechnol. Appl. Biochem. 2004, 39, 215. [Google Scholar] [CrossRef]
- Wang, Y.; Qian, S.; Meng, G.; Zhang, S. Cloning and Expression of L-Asparaginase Gene in Escherichia coli. Appl. Biochem. Biotechnol. 2001, 95, 93–101. [Google Scholar] [CrossRef]
- Harms, E.; Wehner, A.; Jennings, M.P.; Pugh, K.J.; Beacham, I.R.; Rohm, K.H. Construction of expression systems for Escherichia coli asparaginase II and two-step purification of the recombinant enzyme from periplasmic extracts. Protein Expr. Purif. 1991, 2, 144–150. [Google Scholar] [CrossRef]
- Ramadhan, S.H.; Matsui, T.; Nakano, K.; Minami, H. High cell density cultivation of Pseudomonas putida strain HKT554 and its application for optically active sulfoxide production. Appl. Microbiol. Biotechnol. 2013, 97, 1903–1907. [Google Scholar] [CrossRef]
- Lee, Y.L.; Chang, H.N. High Cell Density Culture of a Recombinant Escherichia coli Producing Penicillin Acylase in a Membrane Cell Recycle Fermentor. Biotechnol. Bioeng. 1990, 36, 330–337. [Google Scholar] [CrossRef]
- Khushoo, A.; Pal, Y.; Mukherjee, K.J. Optimization of extracellular production of recombinant asparaginase in Escherichia coli in shake-flask and bioreactor. Appl. Microbiol. Biotechnol. 2005, 68, 189–197. [Google Scholar] [CrossRef]
- Vélez, A.M.; da Silva, A.J.; Luperni Horta, A.C.; Sargo, C.R.; Campani, G.; Gonçalves Silva, G.; de Lima Camargo Giordano, R.; Zangirolami, T.C. High-throughput strategies for penicillin G acylase production in rE. coli fed-batch cultivations. BMC Biotechnol. 2014, 14, 6. [Google Scholar] [CrossRef] [Green Version]
- Lim, H.K.; Lee, S.U.; Chung, S.I.; Jung, K.H.; Seo, J.H. Induction of the T7 promoter using lactose for production of recombinant plasminogen kringle 1-3 in Escherichia coli. J. Microbiol. Biotechnol. 2004, 14, 225–230. [Google Scholar]


| Medium | X (g L−1) | µx (h−1) | Yx/s (g g−1) | L-ASNase Activity (U gcell−1) |
|---|---|---|---|---|
| Defined | 1.80 | 0.55 | 0.31 | 94.77 ± 10 |
| Semi-defined | 1.48 | 0.70 | 0.40 | 39.00 ± 10 |
| Complex | 3.24 | 0.81 | 0.63 | 58.10 ± 5 |
| Gene Origin | Médium | L-ASNase Activity | Inductor | Reference |
|---|---|---|---|---|
| Pseudomonas resinovorans | Defined | 38.88 UI mL−1 Δ | IPTG | [34] |
| Anoxybacillus flavithermus | LB | 165 U mg−1 * Ο | IPTG | [38] |
| Acinetobacter soli | LB | 400 U mg−1 * Ο | IPTG | [33] |
| Thermococcus kodakarensis | LB | 767 U mg−1 * Ο | IPTG | [39] |
| Cobetia amphilecti | LB | 778 U mg−1 * Ο | IPTG | [40] |
| Lactobacillus casei | LB | 0.419 U mg−1 * Ο | IPTG | [41] |
| Bacillus sp | LB | - | IPTG | [35] |
| Pyrobaculum calidifontis | - | 20.13 U L−1 Δ | IPTG | [42] |
| Vibrio cholerae | LB | 2120 U mg−1 * Ο | IPTG | [43] |
| Pseudomonas fluorescens | LB | 26 U mg−1 * Ο | IPTG | [44] |
| Aspergillus terréus | LB | 42.46 U mg−1 * Ο | IPTG | [45] |
| Halomonas elongata | LB | 1510 U mg−1 * Ο | IPTG | [46] |
| Escherichia coli | LB | - | IPTG | [36] |
| Paenibaeillus barengoltzii | LB | 35.2 U mg−1 * Ο | IPTG | [47] |
| Synechococcus elongatus | LB | 45 U mg−1 * Ο | IPTG | [48] |
| Saccharomyces cerevisiae | LB | 110.1 UI mg−1 * Ο | IPTG | [49] |
| Saccharomyces cerevisiae | LB | 196.2 U mg−1 * Ο | IPTG | [50] |
| Erwinia carotovora | LB | 12.5 U mg−1 * Ο | IPTG | [51] |
| Mesoflavibacter zeaxanthinifaciens | LB | 687.1 U mg−1 * Ο | IPTG | [52] |
| Escherichia coli | Defined | 40.8 U mL−1 * Δ | IPTG | [53] |
| Pseudomonas fluorescens | LB | 0.95 UI mg−1 * Ο | IPTG | [54] |
| Rhodospirillum rubrum | LB | 210 U mg−1 *Ο | Lactose | [37] |
| Escherichia coli | LB | 190 U mg−1 * Ο | IPTG | [55] |
| Staphylococcus sp | LB | 113.06 U mg−1 * Ο | IPTG | [56] |
| Erwinia carotovora | LB | 0.72 UI mg−1 * Δ | IPTG | [57] |
| Erwinia carotovora | LB | 9.6 kcal mol−1 Ο | IPTG | [58] |
| Yersinia pseudotuberculosis | LB | - | Arabinose | [59] |
| Yersinia Pseudotuberculosis | LB | 62.7 U mg−1 * Ο | Arabinose | [60] |
| Withania somnifera L. | LB | 55 UI mg−1 * Ο | IPTG | [61] |
| Yersinia pseudotuberculosis | LB | 62.7 UI mg−1 * Ο | Arabinose | [62] |
| Flammulina velutipes | LB | 16 U mL−1 Δ | IPTG | [63] |
| Glycine max | - | - | IPTG | [64] |
| Escherichia coli | LB | 130 U mL−1 Δ | - | [65] |
| Erwinia carotovora | LB | 0.72 U mg−1 * Δ | IPTG | [66] |
| Erwinia carotovora | LB | 630 UI mg−1 * Ο | IPTG | [67] |
| Escherichia coli AS1.357 | LB | 228 U mL−1 Δ | Heat | [68] |
| Escherichia coli | LB | 91 U mg−1 * Ο | IPTG | [69] |
| Escherichia coli | Defined | 1.08 U mg−1 * Δ | Lactose | This work |
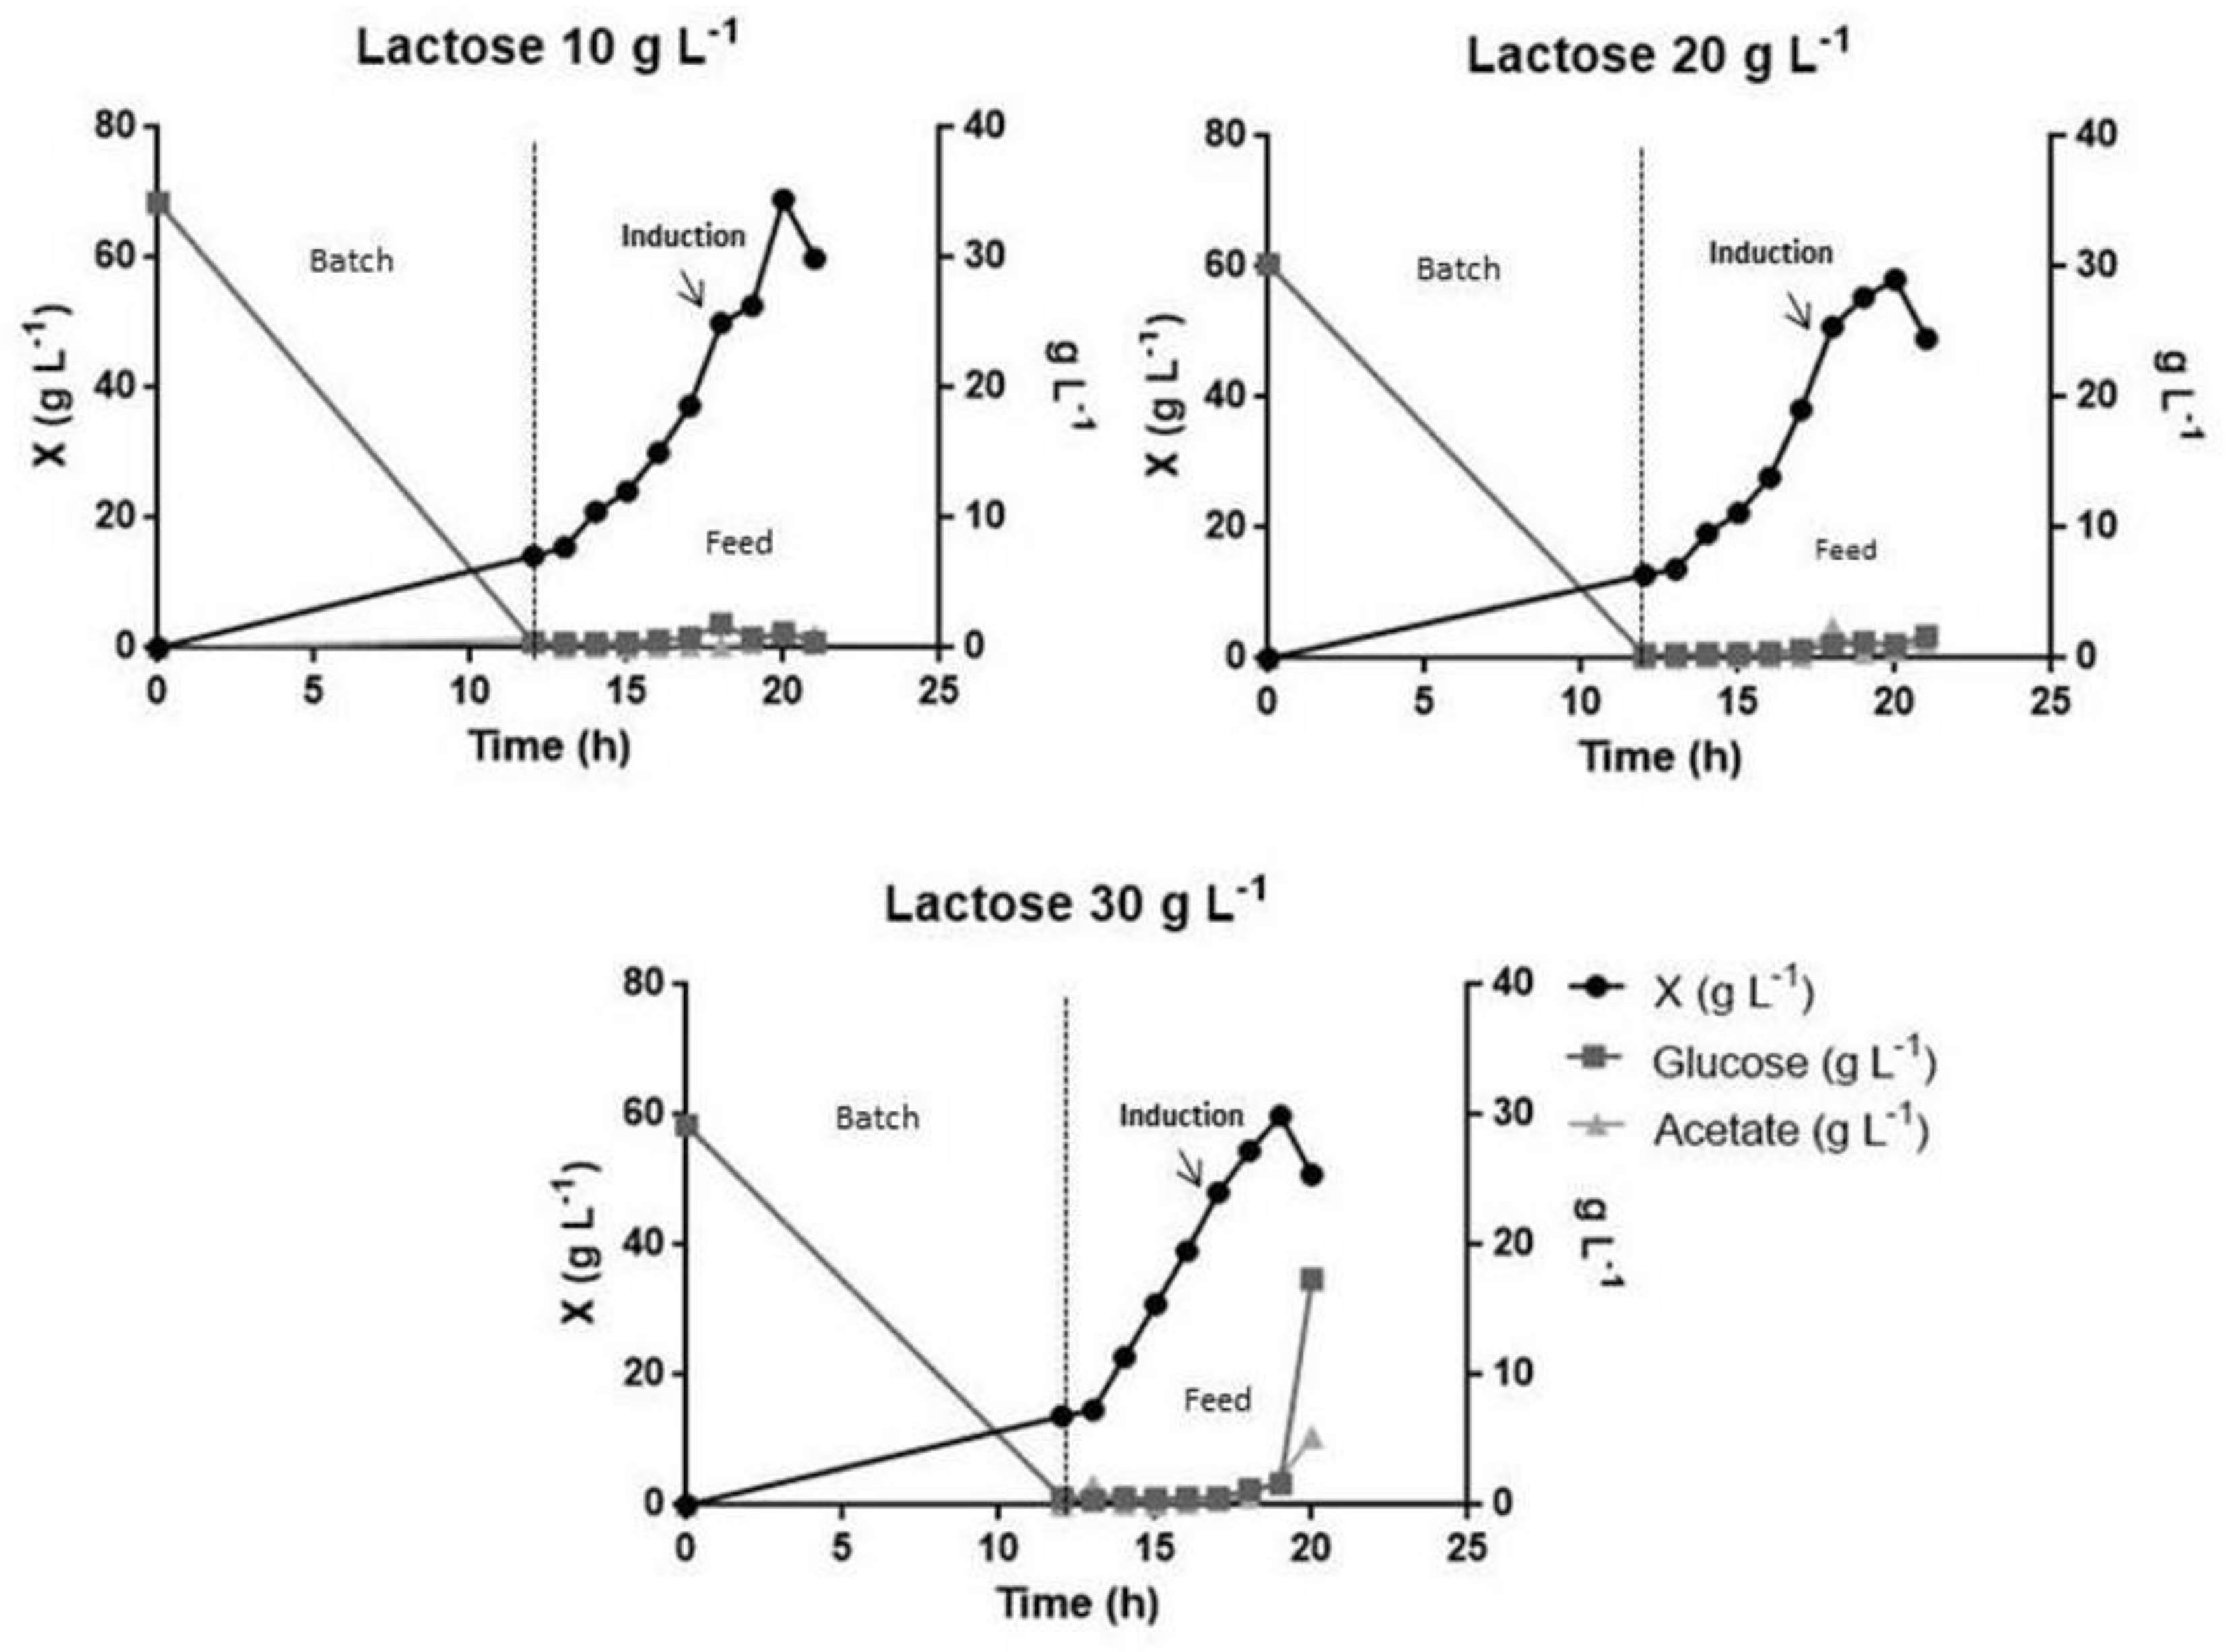
| Fermentation | µx (h−1) | µset (h−1) | X max (g L−1) | Yx/s (g L−1) | Glucose (g L−1) | Acetate (g L−1) | Lactose (g L−1) | |
|---|---|---|---|---|---|---|---|---|
| Batch | 0.79 | - | 11.00 | 0.45 | - | 0.09 | - | |
| Batch fed | - | - | 0.20 | 68.05 | 0.24 | 01.28 | 1.60 | - |
| - | - | 0.30 | 68.98 | 0.25 | 00.86 | 2.56 | - | |
| Induction with lactose | 10 g L−1 | - | 0.30 | 68.96 | 0.25 | 00.40 | 0.96 | 1.21 |
| 20 g L−1 | - | 0.30 | 58.09 | 0.21 | 01.06 | 0.60 | 1.04 | |
| 30 g L−1 | - | 0.30 | 59.90 | 0.31 | 17.35 | 5.25 | 2.36 | |
Publisher’s Note: MDPI stays neutral with regard to jurisdictional claims in published maps and institutional affiliations. |
© 2020 by the authors. Licensee MDPI, Basel, Switzerland. This article is an open access article distributed under the terms and conditions of the Creative Commons Attribution (CC BY) license (http://creativecommons.org/licenses/by/4.0/).
Share and Cite
Barros, T.; Brumano, L.; Freitas, M.; Pessoa, A., Junior; Parachin, N.; Magalhães, P.O. Development of Processes for Recombinant L-Asparaginase II Production by Escherichia coli Bl21 (De3): From Shaker to Bioreactors. Pharmaceutics 2021, 13, 14. https://0-doi-org.brum.beds.ac.uk/10.3390/pharmaceutics13010014
Barros T, Brumano L, Freitas M, Pessoa A Junior, Parachin N, Magalhães PO. Development of Processes for Recombinant L-Asparaginase II Production by Escherichia coli Bl21 (De3): From Shaker to Bioreactors. Pharmaceutics. 2021; 13(1):14. https://0-doi-org.brum.beds.ac.uk/10.3390/pharmaceutics13010014
Chicago/Turabian StyleBarros, Thaís, Larissa Brumano, Marcela Freitas, Adalberto Pessoa, Junior, Nádia Parachin, and Pérola O. Magalhães. 2021. "Development of Processes for Recombinant L-Asparaginase II Production by Escherichia coli Bl21 (De3): From Shaker to Bioreactors" Pharmaceutics 13, no. 1: 14. https://0-doi-org.brum.beds.ac.uk/10.3390/pharmaceutics13010014