
A Comparison of Parent Reports, the Mental Synthesis Evaluation Checklist (MSEC) and the Autism Treatment Evaluation Checklist (ATEC), with the Childhood Autism Rating Scale (CARS)

Abstract
:1. Introduction
2. Methods
2.1. Participants
2.2. Childhood Autism Rating Scale (CARS)
2.3. Autism Treatment Evaluation Checklist (ATEC)
2.4. Complex Language Comprehension Assessment (MSEC)
2.5. Statistical Analysis
3. Results
3.1. Internal Consistency
3.2. Exploratory Factor Analysis of the Complex Language Assessment MSEC
3.3. Confirmatory Factor Analysis of the Complex Language Assessment MSEC
3.4. Exploratory Factor Analysis of the ATEC Subscales
3.5. Confirmatory Factor Analysis of the ATEC Subscales
4. Discussion
4.1. MSEC Complex Language Comprehension analysis of Unidimensionality
4.2. ATEC 1 Expressive Language Subscale Analysis of Unidimensionality
4.3. ATEC 2 Sociability Subscale Analysis of Unidimensionality
4.4. ATEC 3 Sensory Awareness Subscale Analysis of Unidimensionality
4.5. ATEC 4 Health Subscale Analysis of Unidimensionality
4.6. Clinical Implications
Supplementary Materials
Author Contributions
Funding
Institutional Review Board Statement
Informed Consent Statement
Data Availability Statement
Acknowledgments
Conflicts of Interest
References
- American Psychiatric Association. Diagnostic and Statistical Manual of Mental Disorders (DSM-5®); American Psychiatric Pub: Washington, DC, USA, 2013. [Google Scholar]
- Adams, J.B.; Audhya, T.; Geis, E.; Gehn, E.; Fimbres, V.; Pollard, E.L.; Mitchell, J.; Ingram, J.; Hellmers, R.; Laake, D.; et al. Comprehensive Nutritional and Dietary Intervention for Autism Spectrum Disorder—A Randomized, Controlled 12-Month Trial. Nutrients 2018, 10, 369. [Google Scholar] [CrossRef]
- Bibby, P.; Eikeseth, S.; Martin, N.T.; Mudford, O.C.; Reeves, D. Progress and outcomes for children with autism receiving parent-managed intensive interventions. Res. Dev. Disabil. 2002, 23, 81–104. [Google Scholar] [CrossRef] [PubMed]
- Dawson, G.; Rogers, S.; Munson, J.; Smith, M.; Winter, J.; Greenson, J.; Donaldson, A.; Varley, J. Randomized, controlled trial of an intervention for toddlers with autism: The Early Start Denver Model. Pediatrics 2010, 125, e17–e23. [Google Scholar] [CrossRef] [PubMed]
- Grant, R.J. Play-Based Interventions for Autism Spectrum Disorder and Other Developmental Disabilities; Routledge: London, UK, 2016. [Google Scholar]
- Guthrie, W.; Swineford, L.B.; Nottke, C.; Wetherby, A.M. Early diagnosis of autism spectrum disorder: Stability and change in clinical diagnosis and symptom presentation. J. Child Psychol. Psychiatry 2013, 54, 582–590. [Google Scholar] [CrossRef] [PubMed]
- Okoye, C.; Obialo-Ibeawuchi, C.M.; Obajeun, O.A.; Sarwar, S.; Tawfik, C.; Waleed, M.S.; Wasim, A.U.; Mohamoud, I.; Afolayan, A.Y.; Mbaezue, R.N. Early Diagnosis of Autism Spectrum Disorder: A Review and Analysis of the Risks and Benefits. Cureus 2023, 15, e43226. Available online: https://www.cureus.com/articles/169662-early-diagnosis-of-autism-spectrum-disorder-a-review-and-analysis-of-the-risks-and-benefits.pdf (accessed on 26 September 2023). [CrossRef] [PubMed]
- Schreibman, L. Diagnostic features of autism. J. Child Neurol. 1988, 3 (Suppl. S1), S57–S64. [Google Scholar] [CrossRef] [PubMed]
- Frazier, T.W.; Dimitropoulos, A.; Abbeduto, L.; Armstrong-Brine, M.; Kralovic, S.; Shih, A.; Hardan, A.Y.; Youngstrom, E.A.; Uljarević, M. Quadrant Biosciences—As You Are Team. The Autism Symptom Dimensions Questionnaire: Development and psychometric evaluation of a new, open-source measure of autism symptomatology. Dev. Med. Child Neurol. 2023, 65, 1081–1092. [Google Scholar] [CrossRef] [PubMed]
- Parsons, D.; Wilson, N.J.; Vaz, S.; Lee, H.; Cordier, R. Appropriateness of the TOBY Application, an iPad Intervention for Children with Autism Spectrum Disorder: A Thematic Approach. J. Autism Dev. Disord. 2019, 49, 4053–4066. [Google Scholar] [CrossRef] [PubMed]
- Robins, D.L.; Casagrande, K.; Barton, M.; Chen, C.-M.A.; Dumont-Mathieu, T.; Fein, D. Validation of the modified checklist for autism in toddlers, revised with follow-up (M-CHAT-R/F). Pediatrics 2014, 133, 37–45. [Google Scholar] [CrossRef]
- Sikich, L.; Kolevzon, A.; King, B.H.; McDougle, C.J.; Sanders, K.B.; Kim, S.-J.; Spanos, M.; Chandrasekhar, T.; Trelles, M.P.; Rockhill, C.M.; et al. Intranasal Oxytocin in Children and Adolescents with Autism Spectrum Disorder. N. Engl. J. Med. 2021, 385, 1462–1473. [Google Scholar] [CrossRef]
- Venkatesh, S.; Phung, D.; Duong, T.; Greenhill, S.; Adams, B. TOBY: Early intervention in autism through technology. In Proceedings of the SIGCHI Conference on Human Factors in Computing Systems, Paris, France, 27 April–2 May 2013; ACM: New York, NY, USA, 2013; pp. 3187–3196. Available online: http://0-dl-acm-org.brum.beds.ac.uk/citation.cfm?id=2466437 (accessed on 1 March 2017).
- Wetherby, A.M.; Guthrie, W.; Woods, J.; Schatschneider, C.; Holland, R.D.; Morgan, L.; Lord, C. Parent-implemented social intervention for toddlers with autism: An RCT. Pediatrics 2014, 134, 1084–1093. [Google Scholar] [CrossRef]
- Whitehouse, A.J.; Granich, J.; Alvares, G.; Busacca, M.; Cooper, M.N.; Dass, A.; Duong, T.; Harper, R.; Marshall, W.; Richdale, A.; et al. A randomised controlled trial of an iPad-based application to complement early behavioural intervention in Autism Spectrum Disorder. J. Child Psychol. Psychiatry 2017, 58, 1042–1052. [Google Scholar] [CrossRef] [PubMed]
- Rimland, B.; Edelson, S.M. Autism Treatment Evaluation Checklist (ATEC); Autism Research Institute: San Diego, CA, USA, 1999. [Google Scholar]
- Geier, D.A.; Kern, J.K.; Geier, M.R. A comparison of the Autism Treatment Evaluation Checklist (ATEC) and the Childhood Autism Rating Scale (CARS) for the quantitative evaluation of autism. J. Ment. Health Res. Intellect. Disabil. 2013, 6, 255–267. [Google Scholar] [CrossRef] [PubMed]
- Jarusiewicz, B. Efficacy of Neurofeedback for Children in the Autistic Spectrum: A Pilot Study. J. Neurother. 2002, 6, 39–49. [Google Scholar] [CrossRef]
- Charman, T.; Howlin, P.; Berry, B.; Prince, E. Measuring developmental progress of children with autism spectrum disorder on school entry using parent report. Autism 2004, 8, 89–100. [Google Scholar] [CrossRef] [PubMed]
- Klaveness, J.; Bigam, J.; Reichelt, K.L. The varied rate of response to dietary intervention in autistic children. Open J. Psychiatry 2013, 3, 56–60. [Google Scholar] [CrossRef]
- Magiati, I.; Moss, J.; Yates, R.; Charman, T.; Howlin, P. Is the Autism Treatment Evaluation Checklist a useful tool for monitoring progress in children with autism spectrum disorders? J. Intellect. Disabil. Res. 2011, 55, 302–312. [Google Scholar] [CrossRef] [PubMed]
- Mahapatra, S.; Khokhlovich, E.; Martinez, S.; Kannel, B.; Edelson, S.M.; Vyshedskiy, A. Longitudinal Epidemiological Study of Autism Subgroups Using Autism Treatment Evaluation Checklist (ATEC) Score. Autism Dev. Disord. 2018, 50, 1497–1508. [Google Scholar] [CrossRef]
- Vyshedskiy, A.; DuBois, M.; Mugford, E.; Piryatinsky, I.; Radi, K.; Braverman, J.; Maslova, V. Novel Linguistic Evaluation of Prefrontal Synthesis (LEPS) test measures prefrontal synthesis acquisition in neurotypical children and predicts high-functioning versus low-functioning class assignment in individuals with autism. Appl. Neuropsychol. Child 2020, 11, 99–114. [Google Scholar] [CrossRef]
- Braverman, J.; Dunn, R.; Vyshedskiy, A. Development of the Mental Synthesis Evaluation Checklist (MSEC): A Parent-Report Tool for Mental Synthesis Ability Assessment in Children with Language Delay. Children 2018, 5, 62. [Google Scholar] [CrossRef]
- Arnold, M.; Netson, R.; Vyshedskiy, A. Combinatorial language parent-report score differs significantly between typically developing children and those with Autism Spectrum Disorders. J. Autism Dev. Disord. 2024, 54, 326–338. [Google Scholar] [CrossRef]
- Jagadeesan, P.; Kabbani, A.; Vyshedskiy, A. Parent-reported assessment scores reflect ASD severity level in 2- to 7-year-old children. Children 2022, 9, 701. [Google Scholar] [CrossRef]
- Fridberg, E.; Khokhlovich, E.; Vyshedskiy, A. Watching Videos and Television Is Related to a Lower Development of Complex Language Comprehension in Young Children with Autism. Healthcare 2021, 9, 423. [Google Scholar] [CrossRef]
- Vyshedskiy, A.; Khokhlovich, E.; Dunn, R.; Faisman, A.; Elgart, J.; Lokshina, L.; Gankin, Y.; Ostrovsky, S.; deTorres, L.; Edelson, S.M.; et al. Novel prefrontal synthesis intervention improves language in children with autism. Healthcare 2020, 8, 566. [Google Scholar] [CrossRef]
- Vyshedskiy, A.; Khokhlovich, E. Pretend play predicts language development in young children with Autism Spectrum Disorder. Int. J. Play. 2023, 12, 403–419. [Google Scholar] [CrossRef]
- Acosta, A.; Khokhlovich, E.; Reis, H.; Vyshedskiy, A. Dietary factors impact developmental trajectories in young autistic children. J. Autism Dev. Disord. 2023. [Google Scholar] [CrossRef]
- Schopler, E.; Reichler, R.J.; Renner, B.R. The Childhood Autism Rating Scale (CARS); Western Psychological Services: Los Angeles, CA, USA, 2002. [Google Scholar]
- Freire, M.H.; André, A.M.; Kummer, A.M. Test-retest reliability and concurrent validity of Autism Treatment Evaluation Checklist (ATEC). J. Bras. Psiquiatr. 2018, 67, 63–64. [Google Scholar] [CrossRef]
- Al Backer, N.B. Correlation between Autism Treatment Evaluation Checklist (ATEC) and Childhood Autism Rating Scale (CARS) in the evaluation of autism spectrum disorder. Sudan. J. Paediatr. 2016, 16, 17–22. [Google Scholar] [PubMed]
- Schopler, E.; Reichler, R.J.; DeVellis, R.F.; Daly, K. Toward objective classification of childhood autism: Childhood Autism Rating Scale (CARS). J. Autism Dev. Disord. 1980, 10, 91–103. [Google Scholar] [CrossRef]
- Tavakol, M.; Wetzel, A. Factor Analysis: A means for theory and instrument development in support of construct validity. Int. J. Med. Educ. 2020, 11, 245–247. [Google Scholar] [CrossRef] [PubMed]
- Cerny, B.A.; Kaiser, H.F. A study of a measure of sampling adequacy for factor-analytic correlation matrices. Multivar. Behav. Res. 1977, 12, 43–47. [Google Scholar] [CrossRef]
- Feldt, L.S.; Woodruff, D.J.; Salih, F.A. Statistical inference for coefficient alpha. Appl. Psychol. Meas. 1987, 11, 93–103. [Google Scholar] [CrossRef]
- Tavakol, M.; Dennick, R. Making sense of Cronbach’s alpha. Int. J. Med. Educ. 2011, 2, 53–55. [Google Scholar] [CrossRef] [PubMed]
- Li, C.-H. Confirmatory factor analysis with ordinal data: Comparing robust maximum likelihood and diagonally weighted least squares. Behav. Res. Methods 2016, 48, 936–949. [Google Scholar] [CrossRef] [PubMed]
- Hu, L.; Bentler, P.M. Cutoff criteria for fit indexes in covariance structure analysis: Conventional criteria versus new alternatives. Struct. Equ. Model. Multidiscip. J. 1999, 6, 1–55. [Google Scholar] [CrossRef]
- Levin, J.; Khokhlovich, E.; Vyshedskiy, A. Longitudinal developmental trajectories in young autistic children presenting with sleep problems, compared to those presenting without sleep problems, gathered via parent-report using a mobile application. Res. Autism Spectr. Disord. 2022, 97, 102024. [Google Scholar] [CrossRef]
- Forman, P.; Khokhlovich, E.; Vyshedskiy, A. Longitudinal Developmental Trajectories in Young Autistic Children Presenting with Seizures, Compared to those Presenting without Seizures, Gathered via Parent-report Using a Mobile Application. J. Dev. Phys. Disabil. 2023, 35, 331–351. [Google Scholar] [CrossRef]
- Vyshedskiy, A.; Khokhlovich, E. Joint Engagement is Associated with Greater Development of Language and Sensory Awareness in Children with Autism Spectrum Disorder. J. Dev. Phys. Disabil. 2023, 35, 971–985. [Google Scholar] [CrossRef]
- Whitehouse, A.J.O.; Varcin, K.J.; Pillar, S.; Billingham, W.; Alvares, G.A.; Barbaro, J.; Bent, C.A.; Blenkley, D.; Boutrus, M.; Chee, A.; et al. Effect of Preemptive Intervention on Developmental Outcomes among Infants Showing Early Signs of Autism: A Randomized Clinical Trial of Outcomes to Diagnosis. JAMA Pediatr. 2021, 175, e213298. [Google Scholar] [CrossRef]
- Scattone, D.; Raggio, D.J.; May, W. Comparison of the vineland adaptive behavior scales, and the bayley scales of infant and toddler development. Psychol. Rep. 2011, 109, 626–634. [Google Scholar] [CrossRef]
- Miller, L.E.; Perkins, K.A.; Dai, Y.G.; Fein, D.A. Comparison of parent report and direct assessment of child skills in toddlers. Res. Autism Spectr. Disord. 2017, 41, 57–65. [Google Scholar] [CrossRef]
- Dale, P.S.; Bates, E.; Reznick, J.S.; Morisset, C. The validity of a parent report instrument of child language at twenty months. J. Child Lang. 1989, 16, 239–249. [Google Scholar] [CrossRef]
- Ebert, K.D. Convergence between parent report and direct assessment of language and attention in culturally and linguistically diverse children. PLoS ONE 2017, 12, e0180598. [Google Scholar] [CrossRef] [PubMed]
- Gao, D.; Yu, T.; Li, C.-L.; Jia, F.-Y.; Li, H.-H. Effect of parental training based on Early Start Denver Model combined with intensive training on children with autism spectrum disorder and its impact on parenting stress. Zhongguo Dang Dai Er Ke Za Zhi = Chin. J. Contemp. Pediatr. 2020, 22, 158–163. [Google Scholar]
- Geier, D.A.; Kern, J.K.; Geier, M.R. A prospective cross-sectional cohort assessment of health, physical, and behavioral problems in autism spectrum disorders. Maedica 2012, 7, 193. [Google Scholar] [PubMed]
- Javadfar, Z.; Abdollahzad, H.; Moludi, J.; Rezaeian, S.; Amirian, H.; Foroughi, A.A.; Nachvak, S.M.; Goharmehr, N.; Mostafai, R. Effects of vitamin D supplementation on core symptoms, serum serotonin, and interleukin-6 in children with autism spectrum disorders: A randomized clinical trial. Nutrition 2020, 79, 110986. [Google Scholar] [CrossRef] [PubMed]
- World Medical Association World Medical Association Declaration of Helsinki: Ethical principles for medical research involving human subjects. JAMA 2013, 310, 2191–2194. [CrossRef]


| Study | Complex Language Comprehension | Expressive Language | Sociability | Sensory Awareness | Health | |
|---|---|---|---|---|---|---|
| 1 | High-TV users—Low-TV users (N = 3227) [27] | 2.58 (1.04; 0.0128) | −1.26 (0.7; 0.0719) | 1.82 (0.99; 0.0663) | 1.58 (0.85; 0.0631) | 1.05 (1.52; 0.4898) |
| 2 | Control—Language therapy (MITA) (N = 6454) [28] | 4.74 (1.13; <0.0001) | 1.84 (0.77; 0.0172) | 0.46 (1.05; 0.6584) | 0.24 (0.9; 0.7886) | 2.57 (1.62; 0.1119) |
| 3 | No-pretend-play—Pretend-play (N = 7069) [29] | 7.26 (0.72; <0.0001) | 2.95 (0.53; <0.0001) | 0.24 (0.72; 0.7348) | 1.99 (0.6; 0.0009) | −0.76 (1.08; 0.4782) |
| 4 | Control —Gluten-free diet (N = 5553) [30] | 2.97 (0.75; <0.0001) | 0.3 (0.56; 0.5918) | −0.02 (0.76; 0.9746) | 0.93 (0.64; 0.1513) | −0.1 (1.17; 0.9339) |
| 5 | Control—Meat-eating (N = 5553) [30] | 2.4 (0.56; <0.0001) | 0.92 (0.42; 0.0279) | 0.93 (0.55; 0.0944) | 1.89 (0.46; <0.0001) | 0.78 (0.83; 0.3467) |
| 6 | Control—Vegetable-eating (N = 5553) [30] | 2.49 (0.53; <0.0001) | 0.99 (0.4; 0.0137) | 0.6 (0.53; 0.2537) | 1.74 (0.45; 0.0001) | 0.73 (0.79; 0.3538) |
| 7 | Control—Raw-vegetable-eating (N = 5553) [30] | 3.11 (0.74; <0.0001) | 0.66 (0.55; 0.2307) | 0.9 (0.73; 0.2165) | 1.97 (0.62; 0.0014) | −2.46 (1.08; 0.0222) |
| Complex Language Comprehension | Expressive Language | Sociability | Sensory Awareness | Health | ATEC Total | ATEC Total + MSEC | |
|---|---|---|---|---|---|---|---|
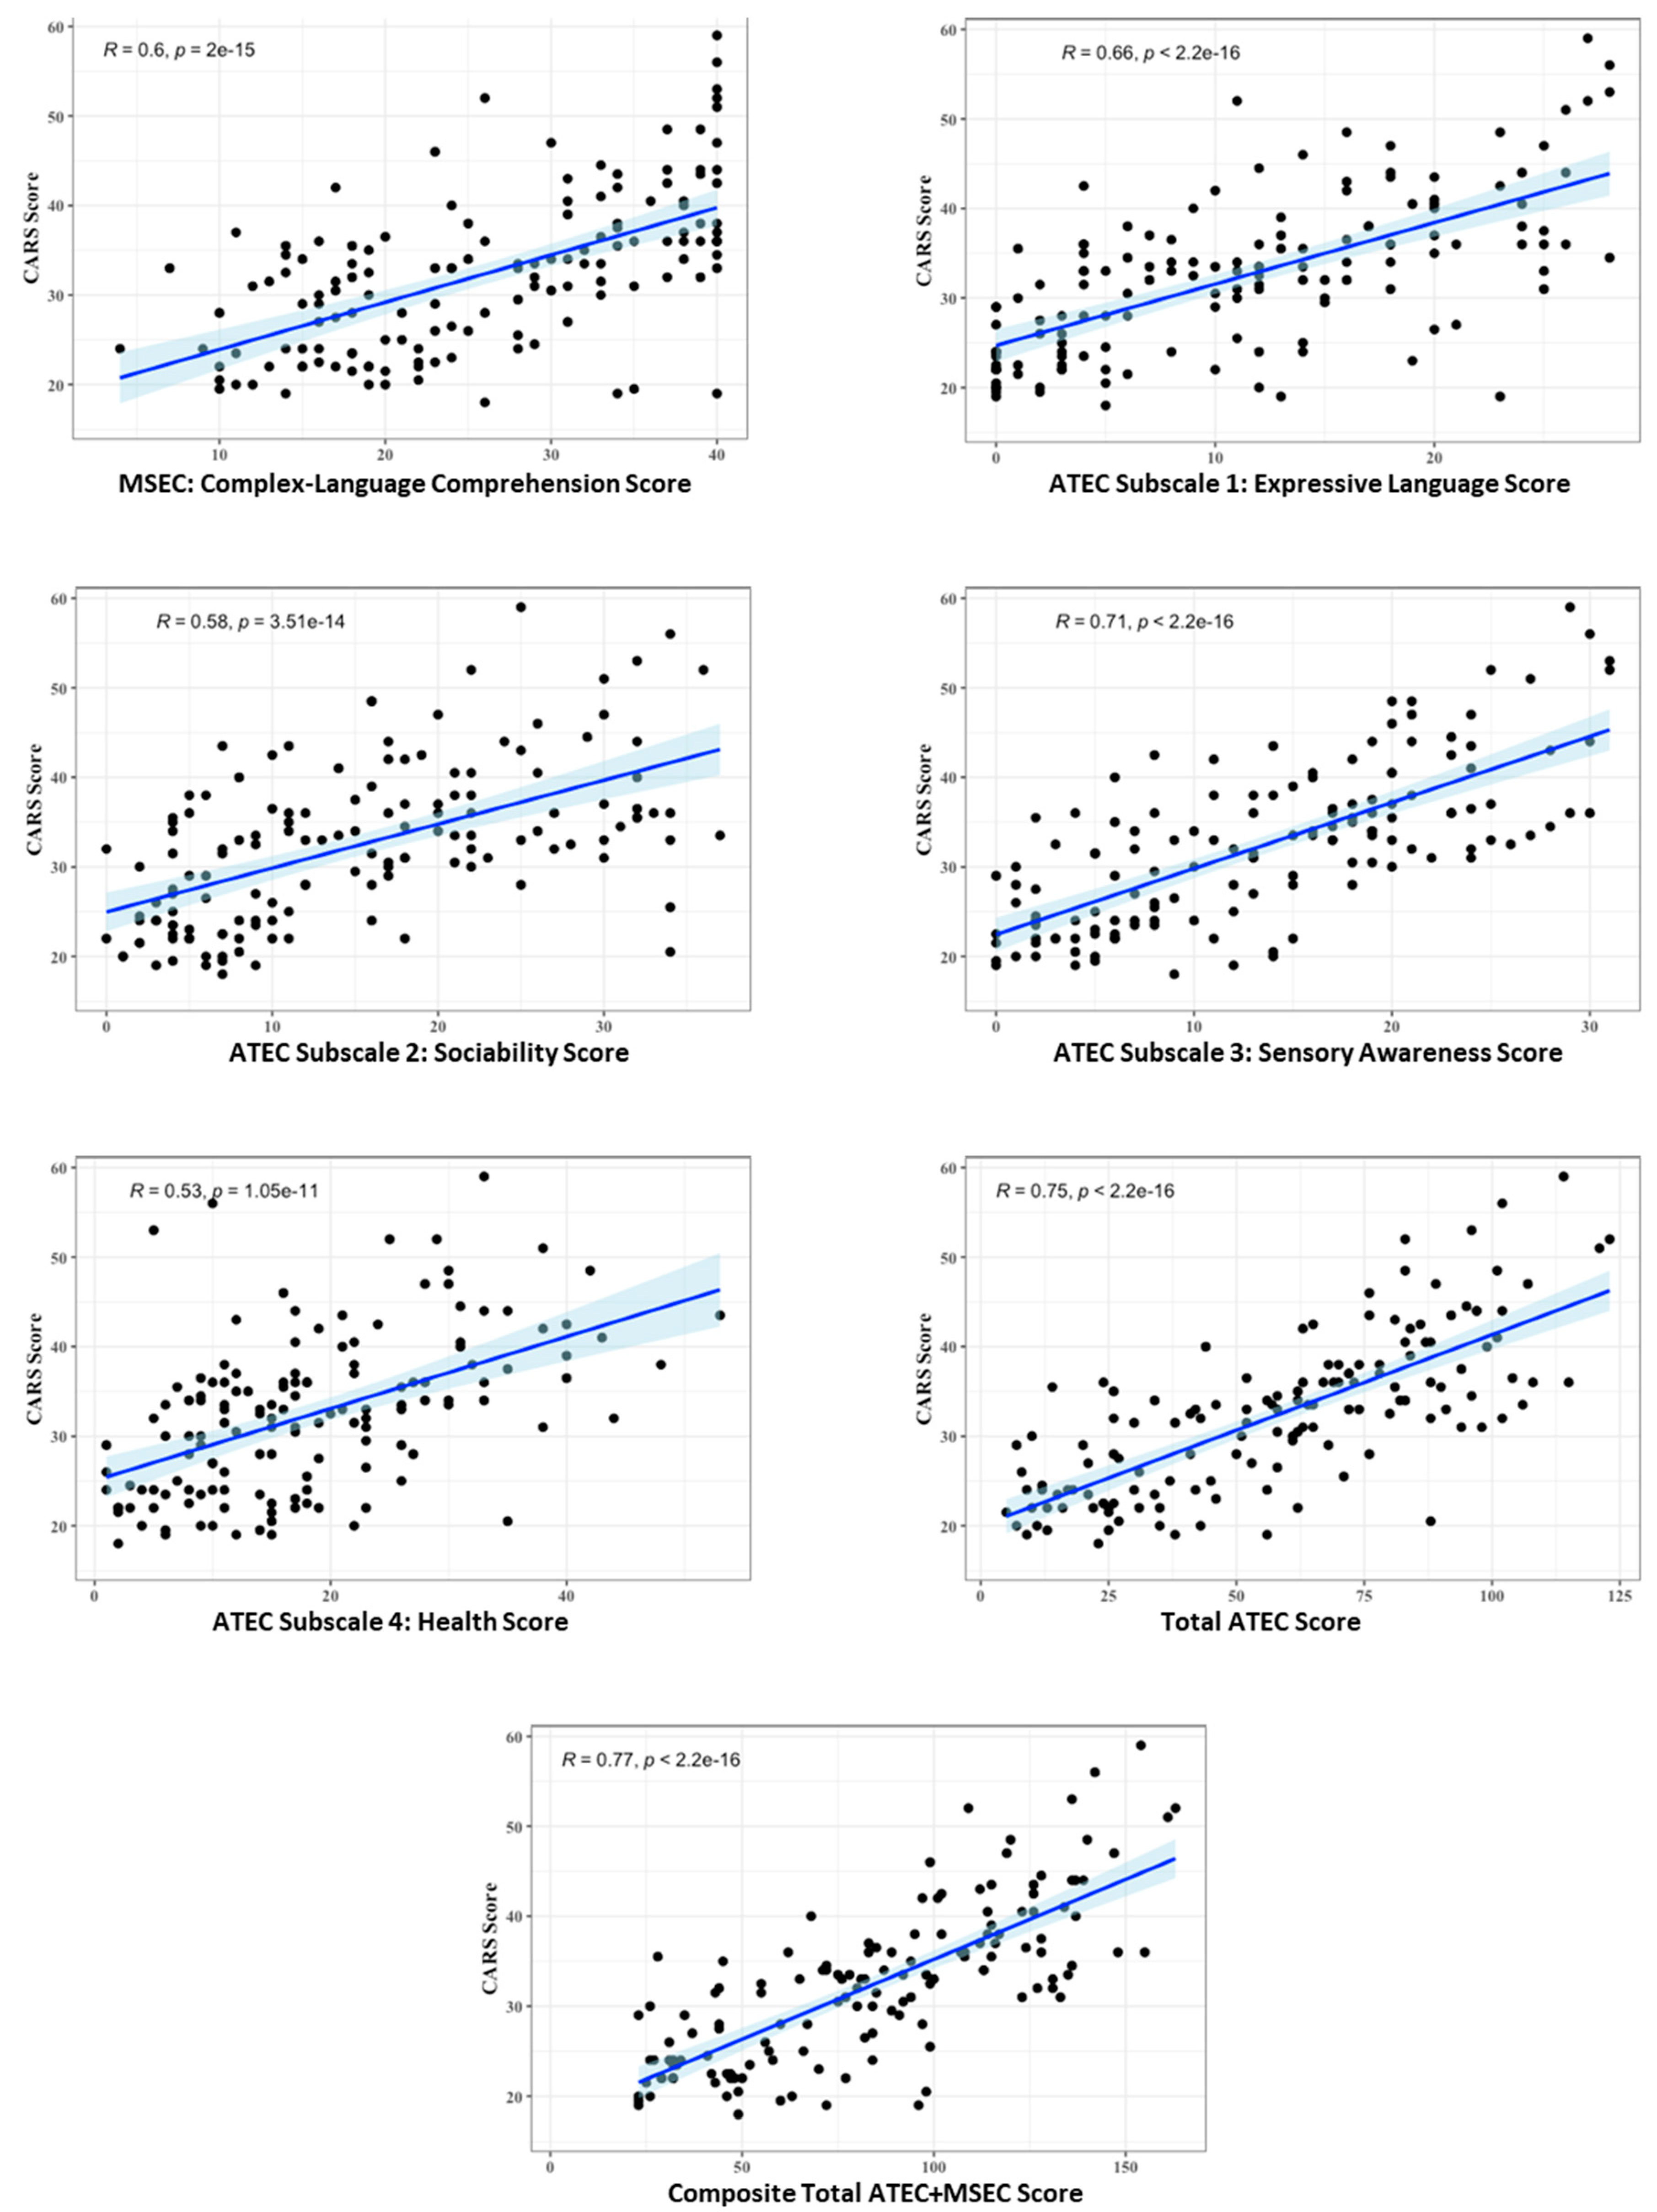
| CARS Total | 0.6 | 0.66 | 0.58 | 0.71 | 0.53 | 0.75 | 0.77 |
| 1. Relating to People | 0.44 | 0.53 | 0.56 | 0.65 | 0.39 | 0.65 | 0.65 |
| 2. Imitation | 0.59 | 0.64 | 0.49 | 0.63 | 0.35 | 0.63 | 0.67 |
| 3. Emotional Response | 0.35 | 0.38 | 0.40 | 0.47 | 0.46 | 0.52 | 0.52 |
| 4. Body Use | 0.37 | 0.48 | 0.23 ** | 0.44 | 0.40 | 0.46 | 0.47 |
| 5. Object Use | 0.55 | 0.59 | 0.51 | 0.63 | 0.45 | 0.66 | 0.68 |
| 6. Adaption to Change | 0.20 * | 0.24 * | 0.36 | 0.32 | 0.46 | 0.43 | 0.40 |
| 7. Visual Response | 0.48 | 0.56 | 0.49 | 0.60 | 0.33 | 0.6 | 0.61 |
| 8. Listening Response | 0.36 | 0.42 | 0.40 | 0.47 | 0.25 ** | 0.46 | 0.47 |
| 9. Taste, Smell, Touch | 0.36 | 0.37 | 0.37 | 0.45 | 0.44 | 0.51 | 0.50 |
| 10. Fear or Nervousness | 0.19 * | 0.14 ^ | 0.20 * | 0.23 ** | 0.18 * | 0.25 ** | 0.25 ** |
| 11. Verbal communication | 0.62 | 0.78 | 0.51 | 0.69 | 0.47 | 0.71 | 0.74 |
| 12. Nonverbal communication | 0.48 | 0.53 | 0.48 | 0.54 | 0.38 | 0.59 | 0.60 |
| 13. Activity Level | 0.36 | 0.32 | 0.35 | 0.39 | 0.27 | 0.41 | 0.43 |
| 14. Intellectual Response | 0.45 | 0.44 | 0.48 | 0.58 | 0.30 | 0.54 | 0.55 |
| 15. General Impression | 0.51 | 0.57 | 0.37 | 0.49 | 0.40 | 0.56 | 0.59 |
| Study | Age Range (Years) | MSEC Complex Language Comprehension | ATEC 1: Expressive Language | ATEC 2: Sociability | ATEC 3: Sensory Awareness | ATEC 4: Health | ATEC Total |
|---|---|---|---|---|---|---|---|
| This study (N = 143) | 2–22 | 0.6 | 0.66 | 0.58 | 0.71 | 0.53 | 0.75 |
| Geier et al. (N = 56) [17] | 2–16 | no data | 0.72 | 0.55 | 0.74 | 0.31 | 0.71 |
| Freire et al. (N = 42) [32] | 2–6 | no data | >0.6 | >0.7 | >0.7 | >0.6 | 0.8 |
| Backer (N = 40) [33] | 3–12 | no data | no data | no data | no data | no data | 0.015 |
Disclaimer/Publisher’s Note: The statements, opinions and data contained in all publications are solely those of the individual author(s) and contributor(s) and not of MDPI and/or the editor(s). MDPI and/or the editor(s) disclaim responsibility for any injury to people or property resulting from any ideas, methods, instructions or products referred to in the content. |
© 2024 by the authors. Licensee MDPI, Basel, Switzerland. This article is an open access article distributed under the terms and conditions of the Creative Commons Attribution (CC BY) license (https://creativecommons.org/licenses/by/4.0/).
Share and Cite
Netson, R.; Schmiedel Fucks, A.; Schmiedel Sanches Santos, A.; Poloni, L.E.P.; Nacano, N.N.; Fucks, E.; Radi, K.; Strong, W.E.; Carnaval, A.A.; Russo, M.; et al. A Comparison of Parent Reports, the Mental Synthesis Evaluation Checklist (MSEC) and the Autism Treatment Evaluation Checklist (ATEC), with the Childhood Autism Rating Scale (CARS). Pediatr. Rep. 2024, 16, 174-189. https://0-doi-org.brum.beds.ac.uk/10.3390/pediatric16010016
Netson R, Schmiedel Fucks A, Schmiedel Sanches Santos A, Poloni LEP, Nacano NN, Fucks E, Radi K, Strong WE, Carnaval AA, Russo M, et al. A Comparison of Parent Reports, the Mental Synthesis Evaluation Checklist (MSEC) and the Autism Treatment Evaluation Checklist (ATEC), with the Childhood Autism Rating Scale (CARS). Pediatric Reports. 2024; 16(1):174-189. https://0-doi-org.brum.beds.ac.uk/10.3390/pediatric16010016
Chicago/Turabian StyleNetson, Rebecca, Andriane Schmiedel Fucks, Andressa Schmiedel Sanches Santos, Lucas Ernesto Pavoski Poloni, Nilson Noboru Nacano, Elielton Fucks, Katarina Radi, William E. Strong, Alice Aparecida Carnaval, María Russo, and et al. 2024. "A Comparison of Parent Reports, the Mental Synthesis Evaluation Checklist (MSEC) and the Autism Treatment Evaluation Checklist (ATEC), with the Childhood Autism Rating Scale (CARS)" Pediatric Reports 16, no. 1: 174-189. https://0-doi-org.brum.beds.ac.uk/10.3390/pediatric16010016