Article

Exposure and Health Risks Posed by Potentially Toxic Elements in Soils of Metal Fabrication Workshops in Mbarara City, Uganda

1
Department of Chemistry, Faculty of Science, Mbarara University of Science and Technology, Mbarara P.O. Box 1410, Uganda
2
Centre for Water, Environment and Development, School of Water, Energy and Environment, Cranfield University, Cranfield MK43 0AL, UK
3
Department of Environmental Health and Disease Prevention, Faculty of Public Health, Lira University, Lira P.O. Box 1035, Uganda
4
Department of Chemistry, College of Natural Sciences, Makerere University, Kampala P.O. Box 7062, Uganda
5
Department of Civil and Environmental Engineering, College of Engineering, Design, Art and Technology, Makerere University, Kampala P.O. Box 7062, Uganda
6
Department of Chemistry, University of Kerala, Thiruvananthapuram 695581, India
7
Department of Chemistry, Faculty of Science, University of Lucknow, Lucknow 226007, India
8
Department of Science and Vocational Education, Lira University, Lira P.O. Box 1035, Uganda
9
Department of Chemistry, Faculty of Science and Technology, Andhra University, Visakhapatnam 530003, India
*
Authors to whom correspondence should be addressed.
J. Xenobiot. 2024, 14(1), 176-192; https://0-doi-org.brum.beds.ac.uk/10.3390/jox14010011
Submission received: 16 November 2023 / Revised: 2 January 2024 / Accepted: 18 January 2024 / Published: 30 January 2024

Abstract

:
Metal fabrication workshops (MFWs) are common businesses in Ugandan cities, and especially those producing metallic security gates, window and door frames (burglar-proof), and balcony and staircase rails. The objective of this study was to comparatively assess the pollution levels and potential health risks of manganese (Mn), chromium (Cr), cadmium (Cd), lead (Pd) and nickel (Ni) in pooled surface soil samples from four 5-, 7-, 8-, and 10-year-old MFWs (n = 28) and a control site (n = 8) in Mbarara City, Uganda. The concentration of the potentially toxic elements (PTEs) was determined using inductively coupled plasma–optical emission spectrometry. Contamination, ecological, and human health risk assessment indices and models were used to identify any risks that the PTEs could pose to the pristine environment and humans. Our results showed that PTE pollution of soils is occuring in the MFWs than at the control site. The mean concentrations of the PTEs (mg kg−1) in the samples were: Mn (2012.75 ± 0.23–3377.14 ± 0.31), Cr (237.55 ± 0.29–424.93 ± 0.31), Cd (0.73 ± 0.13–1.29 ± 0.02), Pb (107.80 ± 0.23–262.01 ± 0.19), and Ni (74.85 ± 0.25–211.37 ± 0.14). These results indicate that the PTEs could plausibly derive from the fabrication activities in these workshops, which is supported by the high values of contamination factors, index of geoaccumulation, and the overall increase in pollution load indices with the number of years of operation of the MFWs. Human health risk assessment showed that there are non-carcinogenic health risks that could be experienced by children who ingest PTEs in the soils from the 7-, 8- and 10-year-old MFWs. The incremental life cancer risk assessment suggested that there are potential cancerous health effects of Cd and Ni that could be experienced in children (who ingest soils from all the four MFWs) and adults (ingesting soils from the 8- and 10-year-old MFWs). This study underscores the need to implement regulatory guidelines on the operation and location of MFWs in Uganda. Further research should be undertaken to investigate the emission of the PTEs during welding operations in the MFWs.

1. Introduction

Urbanization is a proxy of human development and progress [1]. In essence, urbanization in the Western world has been associated with economic growth and industrialization, both of which mutually and intrinsically reinforce each other [2,3]. In developing countries, urbanization is rather rapid, poorly planned, and starkly implemented. Coupled with industrialization, associated energy requirements, and weak regulatory structures, urbanization has accelerated environmental degradation, urban sprawl, slum development, inadequate urban infrastructures, human insecurity, regional inequalities, violence, crime, and social unrest [1,4].
In the 21st century, urbanization is one of the most significant global trends, as evidenced by large social, economic, physical, and environmental transformations. According to the available data, no less than 4.4 billion (56%) of the global population reside in cities, and this proportion is anticipated to reach 68% by the year 2050 [5], or 6 billion by 2045 [5]. If such an expected growth is unmistakable [6], and with the knowledge that more than 80% of the global gross domestic product is being generated in cities, urbanization could ably contribute to sustainable growth through increased productivity and innovation [5]. In Africa, the urban population grew to 567 million people in 2015 from 27 million in 1950, which translates into a 2000% increase [7]. This trend appears to hold true in all parts of the continent. Uganda, the focus of this study, has recently undergone subtle urbanization and industrial transformations, as evidenced by 15 municipalities (Arua, Gulu, Mbale, Jinja, Masaka, Mbarara, and Fort Portal in July 2020; Entebbe and Lira on 1 July 2022; Moroto, Nakasongola, Soroti, Kabale, and Wakiso on 1 July 2023) attaining city statuses [8,9,10]. However, the creation of these cities has resulted in urban restructuring and an increment in anthropogenic activities.
One of the noticeable establishments in African, East African, and, in particular, Ugandan cities and urban centers are metal fabrication workshops (MFWs) [11,12]. They deal in the production of construction materials such as security gates, metallic window and door frames (burglar proofs), and balcony and stare case rails [13,14]. In some parts of Uganda, such as Katwe (Kampala) and Eastern Uganda, MFWs are also involved in the machining and fabrication of industrial and agricultural machines [15,16]. The MFWs are characterized by activities (such as laser, waterjet, power-scissor or plasma-arc cutting, forging, drawing, grinding, punching, stamping, welding, vanishing, forming, brazing, galvanizing, and assembly to create the final product) [11,12,17] that can lead to the release of potentially toxic elements (PTEs) into the environment. The materials used in fabrication (e.g., wire electrode, welding rods and sheets, and filler metals) are made of alloyed steel consisting of PTEs such as manganese (Mn), cadmium (Cd), chromium (Cr), nickel (Ni), vanadium (V), copper (Cu), silicon (Si), cobalt (Co), zinc (Zn), and iron (Fe) [18]. PTEs, sometimes called heavy metals or toxic elements, are those chemical elements that possess high molecular weights and/or densities that are at least five-fold greater than that of water [19]. They are known to induce toxic effects when present in the body at higher concentrations. The toxic effects largely depend on the concentration, valence states, chemical form, routes and duration of exposure, and bio-availability, among other factors [20]. For example, the ferromagnetic metal Ni is an immunotoxic and carcinogenic agent which, depending on the ingested dose and exposure duration, may cause asthma, lung fibrosis, contact dermatitis, cardiovascular diseases, and reproductive toxicity, as well as respiratory tract cancer [21].
The release of PTEs into the environment following the activities of MFWs may contaminate top soil, as well as underground and surface water resources, through leaching and soil erosion [22,23,24]. Previous studies have shown that, in addition to PTEs, welding fumes also contain toxic substances such as carbon monoxide, carbon dioxide, phosgene, asbestos (a heat-protective component used to cover the weld to prevent abrupt cooling), hydrogen fluoride, ozone, and nitrogen oxides, all of which may pose an occupational hazard to welders [25,26]. The International Agency for Research on Cancer (IARC), in 1990, classified welding fumes as a possible human carcinogen (group 2B) [27]. An assessment of welding fumes’ potential carcinogenicity led to their classification as a group 1 carcinogen in humans because empirical studies associated increased risks of lung cancer with the inhalation of such fumes, especially in non-smokers [28,29].
Metal fabrication activities have long been ongoing in Mbarara City, Uganda, due to the city’s rapid growth [30]. To date, no study has examined the emission rate, or the effect of these activities on the contamination of the soils, nearby water sources, and the atmosphere. This study, conducted for the first time in Uganda, assessed the pollution levels and potential human and ecological health risks of PTEs (Mn, Cr, Cd, Pd, and Ni) in surface soil samples from four MFWs in Mbarara City, Western Uganda.

2. Methods

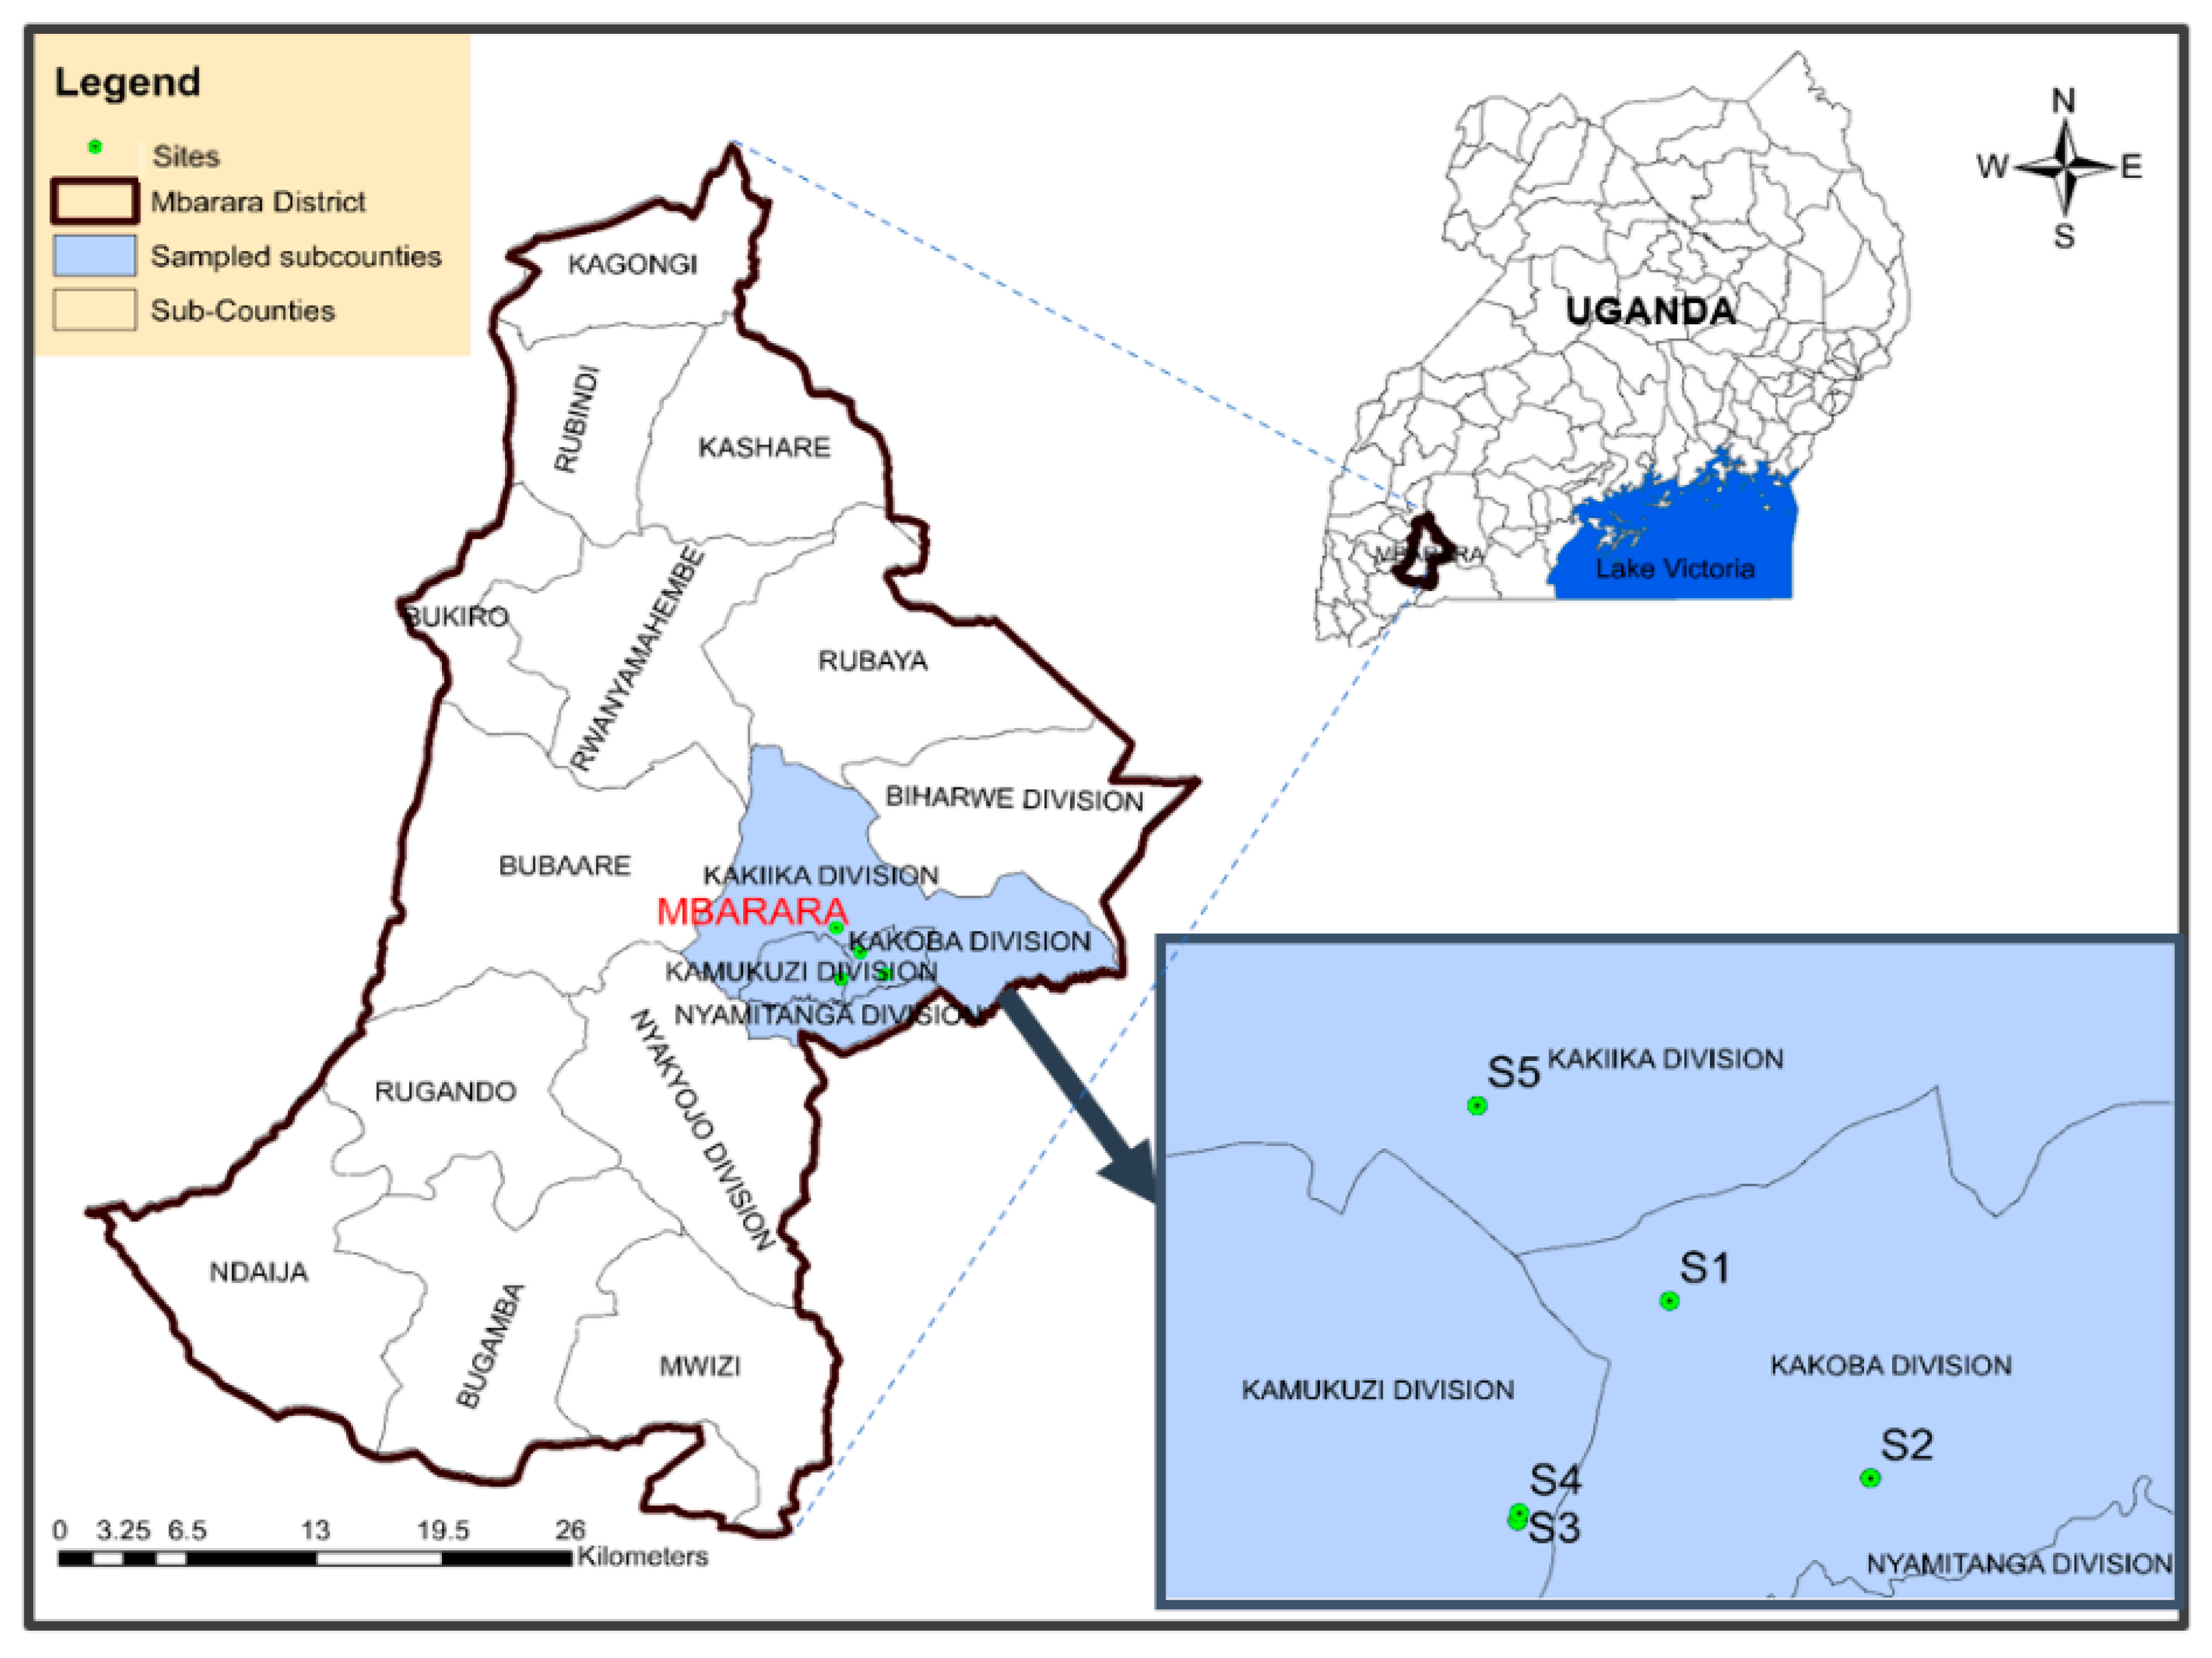
2.1. Study Area Description

Mbarara City is located in Western Uganda (latitude −0.607160 and longitude 30.654503), about 270 km from Kampala City on Kampala-Kabale Road. Its name is traced to the tall green grass “Emburara” (Hyperenia ruffa in binomial taxonomy) which covered the whole area. Its development into an urban center is traced to the appearance of Asian traders up to 1950 [31]. The city covers a total land area of 51.47 square kilometers, built on hilly areas separated by short, small, and shallow valleys. It lies at an average altitude of 1432 m above sea level [32]. It is divided into two constituencies (Mbarara City South and Mbarara City North). These are further divided into six boroughs (Biharwe, Kakiika, Kakoba, Kamukuzi, Nyakayojo, and Nyamitanga) and 23 wards. Mbarara town was granted city status in May 2019, but this only started on 1 July 2020 (Figure 1). Since then, it has remained the principal commercial center of Western Uganda. The city had an estimated population of 221,300 people as of 2020 [33].
In this study, four MFWs were purposely selected, and these were coded as sampling sites S1 (0°35′34.3″ S 30°40′00.2″ E) and S2 (0°36′12.3″ S 30°40′41.4″ E) in City South Division, and S3 (0°36′21.4″ S 30°39′28.9″ E) and S4 (0°36′19.8″ S 30°39′29.3″ E) in City North Division (Figure 1). They had been producing security gates, metallic doors, windows, and double-decker beds (Figure 2) for 5, 7, 8, and 10 years, respectively. A control site for this study (S5; 0°34′52.3″ S 30°39′20.6″ E) was a grassland, purposely selected in Nyarubanga village, Mbarara City North Division, about 5 km from the business area, which is comparatively less populated. Secondly, there were no MFWs that were likely to introduce PTEs into the S5 soils.

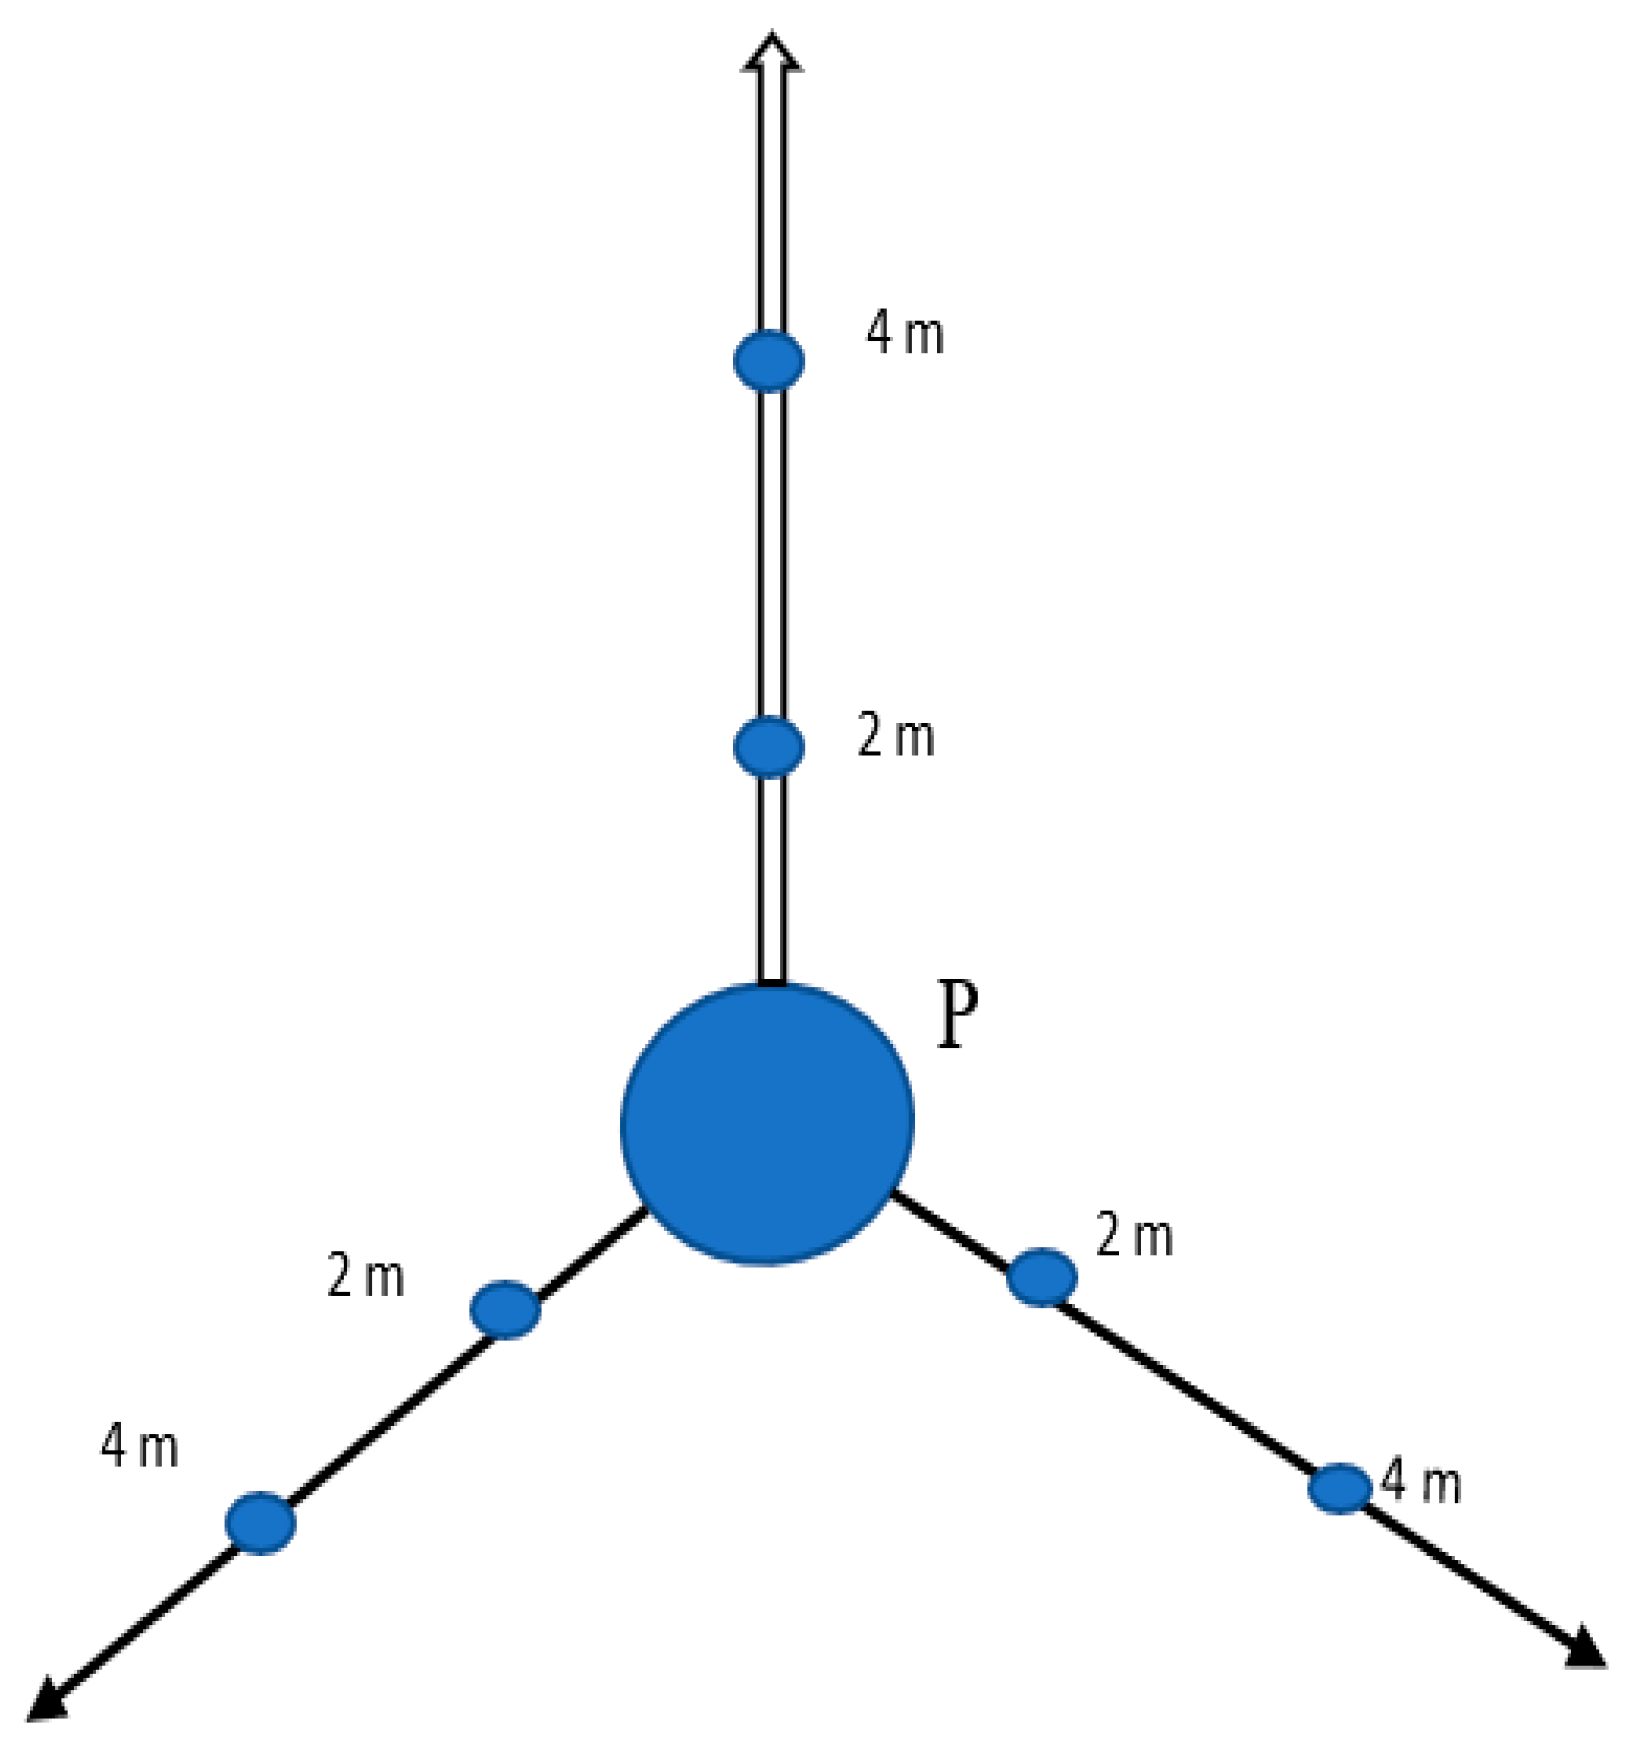
2.2. Sampling Procedure

Soil samples were collected over a period of one month (November 2021) from each of the selected MFWs using systematic–judgmental sampling technique. From each workshop, the soil (about 0.5 kg) was collected using a clean, depth-calibrated soil auger at a depth of 0–30 cm [34]. The auger was cleaned using tissue paper and 70% ethanol after each sample collection. From each workshop, soil samples were collected as follows: (i) the point at which the metal rods and sheets are cut (this constituted the central sampling point (P), (ii) 2 m away from P, and (iii) 4 m away from P. This was carried out in three different directions for each workshop from P, as illustrated in Figure 3.
The soil samples from each workshop were pooled into an analytical sample, mixed, and then packed into labelled clean polythene bags. They were sealed, packed into a cool, dry ice box, and transported to the Chemistry Laboratory of Mbarara University of Science and Technology, Mbarara, Uganda. The soil samples were air-dried for 14 days, ground and sieved through a 0.5 mm sieve, and packed awaiting analysis.

2.3. Determination of PTEs Concentration

The air-dried soil sample (1 g) was weighed into a digestion vessel. To this, 9 mL of 37% hydrochloric acid and 3 mL of 69% nitric acid were added. The vessel and its contents were put in a microwave (Multiwave 3000, Anton Paar, Graz, Austria), and the following operating conditions were employed (ramp time: 5 min; MW power: 1400 W; hold time of 10 min). The contents were cooled for 20 min. After cooling, the digest was transferred into a 100 mL volumetric flask and made up to the mark with deionized water. The soil samples were analyzed for total concentrations of PTEs (Mn, Cr, Cd, Pd, and Ni) using an inductively coupled plasma-optical emission spectrometer (ICP-OES; Optima 7000 DV, Perkin Elmer Inc., Waltham, MA, USA). The wavelengths used were 257.610, 267.716, 214.440, 220.353, and 231.604 nm, respectively.
Quality control and quality assurance activities performed in this study included the analysis of blanks and spiked samples, which provided recoveries in analytically acceptable ranges (from 98.5 to 100.5%). Relative Standard Deviations of the experiments, as a measure of the precision of the analytical method, varied from 4.2% to 4.9%. All the reagents and chemicals used were of high analytical purity, supplied by Sigma-Aldrich (St. Louis, MO, USA), HiMedia Pvt Laboratories (Mumbai, India), or Merck (Darmstadt, Germany), and were used in the analysis as supplied, without further purification.

2.4. Human Exposure and Health Risk Assessment

Health risk assessments were performed to examine the relationship between the environment and human health. The risks were categorized into carcinogenic and non-cancer risks, for both children and adults. The chronic daily intake (CDI) (mg kg−1day−1) of the PTEs through incidental ingestion (CDIING), inhalation (CDIINH), and dermal contact (CDIDC) was calculated using Equations (1)–(3) [35]. The factors used are described in the Supplementary Materials (Table S1) [35,36,37,38,39].
CDI ING = C P T E × I n g R × C V F × F I × E X F × E X D W a b × T a e t
CDI INH = C P T E × I n h R × E X F × E X D P E F × W a b × T a e t
CDI DC = C P T E × S A F × C V F × A F × D A F × E X F × E X D W a b × T a e t

2.4.1. Non-Carcinogenic Health Risk Assessment

The hazard quotient (HQ) was calculated to establish non-cancer risks from the PTEs through the three different exposure routes (Equations (4)–(6)). Due to the known additive effects of PTEs, the hazard index (HI) was established as the sum of the HQ of the individual element through a given exposure pathway (Equation (7)) [40].
HQ ING = C D I I N G R f D I N G
HQ INH = C D I I N H R f D I N H
HQ DC = C D I D C R f D D C
HI = i = 1 n = 5 H Q
where RfDING, RfDINH, and RfDDC are the oral (direct ingestion), inhalation, and dermal reference doses of the specific element. The RfDING = 0.0460, 0.001, 0.01, 0.0035, and 0.02 mg kg−1 for Mn, Cr, Cd, Pb, and Ni, respectively. The corresponding values for RfDINH and RfDDC are 0.0000143, 0.0000286, 0.001, 0.000525, and 0.00540 mg kg−1day−1 and 0.0460, 0.000006, 0.001, 0.035, and 0.0206 mg kg−1day−1 [35,36,37,38,40].

2.4.2. Carcinogenic Health Risk Assessment

The cancer risk (CR), estimated as the incremental lifetime cancer risk for ingestion of the carcinogenic elements (Cd, Pb and Ni), was calculated using Equation (8) [35].
CR = CDI × CSF
where CSF is the ingestion cancer slope factor = 5.01 ×10⁻¹, 8.5 ×10⁻³ and 8.4 × 10⁻¹ mg kg−1day−1, respectively, for Cd, Pb, and Ni [35].

2.5. Assessment of Soil Pollution Levels

To establish the pollution levels of the soil samples from the MFWs, we computed the geoaccumulation indices, as follows: contamination factor, geo-accumulation index, pollution load index, and potential ecological risk index. They were calculated with respect to the concentrations of PTEs in the control site (S5). Firstly, the contamination factor was calculated using Equation (9), suggested by Hakanson [41]. The index of geoaccumulation (Igeo), used by Müller [42] in the first instance, was computed (Equation (10)).
Contamination   factor   ( CF s ) = C P T E S C B K G
I geo = Log 2   C P T E S 1.5   C B K G
where CPTES = element concentration in the soil sample, CBKG = background concentration of the same element in soil from S5, and 1.5 is the background matrix correction factor [43,44]. The classification of these indices (CFs and Igeo) is described in Table S2. To discern the cumulative pollution load in a particular soil sample, the pollution load index (PLDI) was calculated using Equation (11) [40].
PLDI = (CFS1 × CFS2 × CFS3 × CFS4 × CFS5)1/5
where CFS1 to CFS5 are the calculated contamination factors for the five elements analyzed in this study. Lastly, the potential ecological risk index technique based on the work of Hakanson [41] was used to assess the sensitivity of the biotic community to the PTEs. The potential ecological risk coefficient ( E R i ) and potential ecological risk index (PERI) were calculated (Equations (12) and (13)).
E R i = T R i × CF s
PERI = i = 1 i = n E R i
In these equations, T R i = biological toxic factor of the PTEs: Cd = 30, Pb = Ni = 5, Cr = 2 and Mn = 1 [45]. The risk characterization criterion is provided in Table S2.

2.6. Statistical Analysis

The quantitative data were analyzed using GraphPad Prism for Windows (version 9, GraphPad Software, San Diego, CA, USA). Descriptive statistics were summarized as means with standard deviation for the measured PTEs concentration. The data were normalized, and one-way analysis of variance (ANOVA) was used to establish the significant differences in the means within and between groups, using Tukey multiple comparison test. Pearson’s bivariate correlation analysis was used to establish the nature of the interrelationships between the concentration of PTEs in the MFWs, as well as the years in which the workshops had been in existence. The relationship was considered significant at p ≤ 0.05 if not p ≤ 0.01.

3. Results

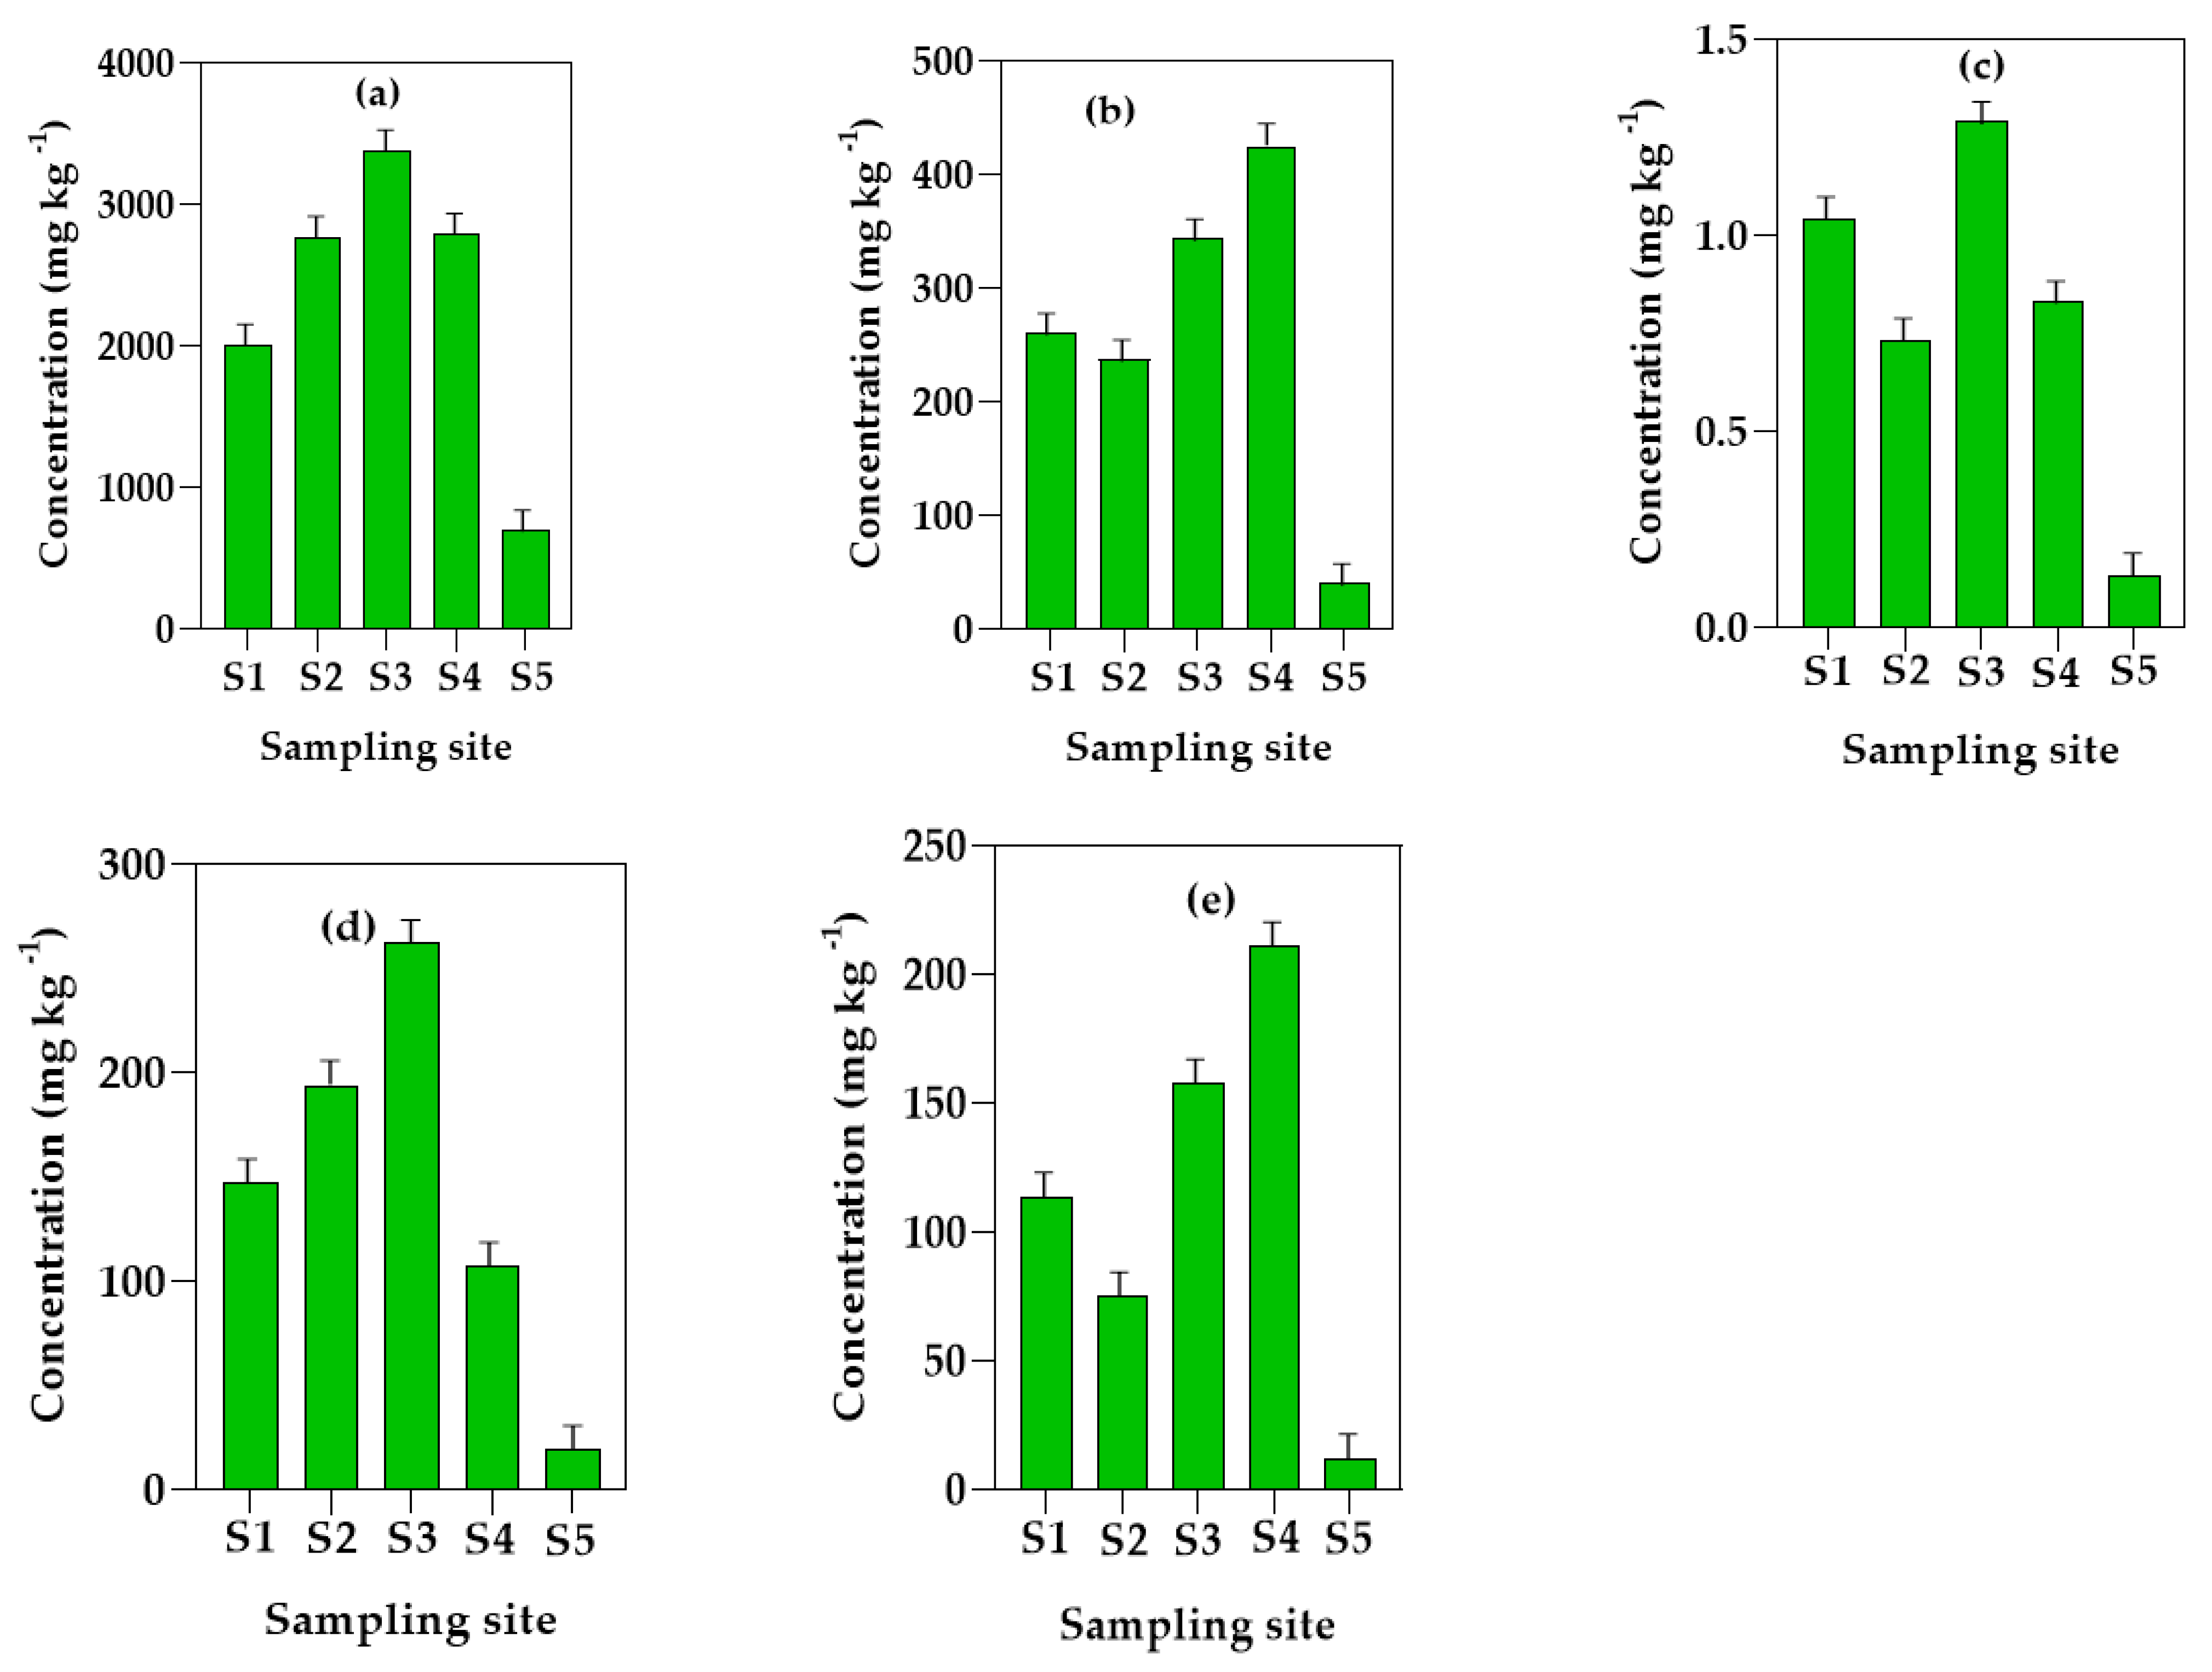
3.1. Concentration of the PTEs in the Soil Samples

The results for the PTEs concentration obtained in the soil samples from the four MFWs and the control site are shown in Figure 4. On average, the mean concentrations of the PTEs followed the order Mn > Cr > Pb > Ni > Cd. These differences between the mean values of the individual PTEs in the MFWs were, however, not statistically significant according to the one-way ANOVA results (p > 0.05). The concentration of Mn ranged from 2012.75 ± 0.23 mg kg−1 at S2 to 3377.14 ± 0.31 mg kg−1 at S4. The concentrations of Mn in the soils from the four MFWs were higher than that of the control site, S5 (695.30 ± 0.004 mg kg−1). Chromium had the second highest concentration among the PTEs in the soil samples. The levels ranged from 237.55 ± 0.29 mg kg−1 at S1 to 424.93 ± 0.31 mg kg−1 at S3. Significant amounts of cadmium were also found in the soils from all the sampling sites but in lower quantities than the rest of the metals. Its total concentration varied from 0.73 ± 0.13 mg kg−1 at S1 to 1.29 ± 0.02 mg kg−1 at S4. Lead was also found in considerable amounts, ranging from 107.80 ± 0.23 mg kg−1 at S3 to 262.01 ± 0.19 mg kg−1 at S4. On the other hand, the concentrations of Ni that were recorded ranged from 74.85 ± 0.25 mg kg−1 at S1 to 211.37 ± 0. 14 mg/kg at S3. In all cases, the values were higher than the corresponding concentrations obtained at the control site (S5).

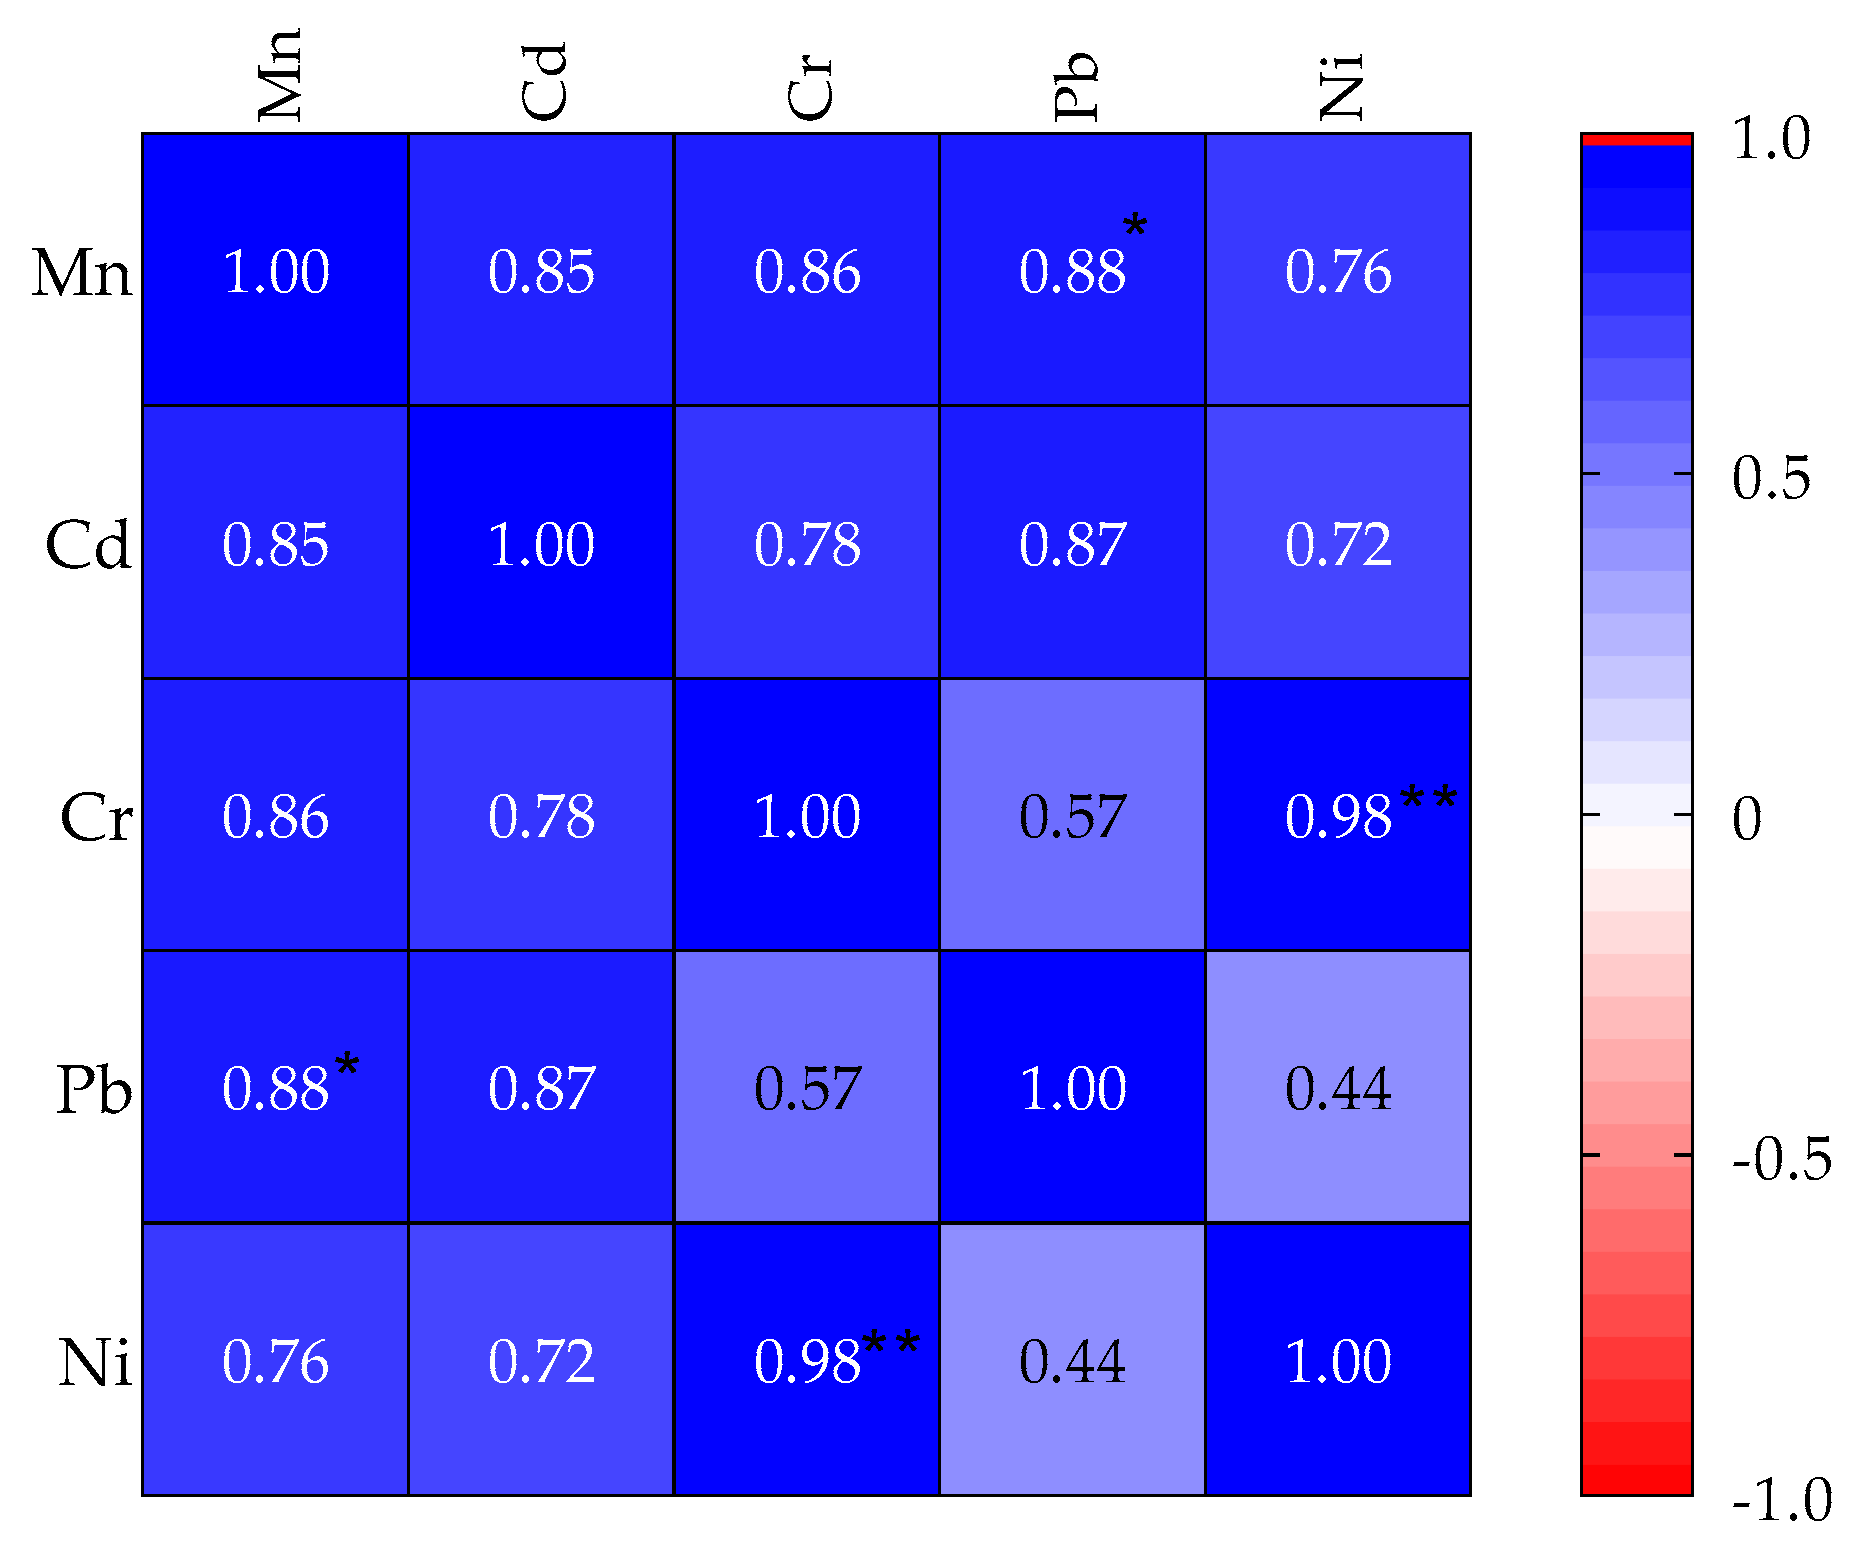
3.2. Inter-Elemental Correlation of the Concentration of the PTEs in the Soil Samples

The results of Pearson’s pairwise correlation (r) for the PTEs concentration in the soil samples from the four MFWs and the control site are shown in Figure 5. On average, there were weak to strong positive correlations between the PTEs (r = 0.44 to 0.98). However, Ni and Cr (r = 0.98, p = 0.0039) and Mn and Pb (r = 0.88, p = 0.051) pairs had strong and significant positive correlations.

3.3. Human Health Risk Assessment Indices

3.3.1. Non-Cancer Risk Results

In this study, the chronic daily intake through incidental ingestion (CDIING) ranged from 9.3 × 10⁻⁶ mg kg−1 day−1 for Cd at S1 by children to 5397.2 × 10−6 mg kg−1 day−1 for Mn ingested by adults at S4 (Table 1). These values were, however, higher than the calculated values for soils sampled from the control site (S5). The hazard indices ranged from 0.0833 at S2 for adults to 1.7531 at S4 for children. With the exception of S1 and S5, there are potential non-cancer health effects that could arise from the ingestion of soil from the MFWs by children.
On the other hand, the calculated CDIINH ranged from 7.7 × 10⁻¹⁵ mg kg−1 day−1 for Cd at S1 by children to 32,810.1 × 10−15 mg kg−1 day−1 for Mn ingested by children at S4 (Table 2). The corresponding average hazard quotients (0.25 × 10⁻¹⁰ to 22,944.13 × 10−10) and hazard indices (1877.67 × 10−10 to 22,945.70 × 10−10) for average chronic intake through inhalation (Table 2) never surpassed 1, suggesting that no adverse health effects would likely be experienced by individuals who inhale the PTEs in soils from the MFWs.
The values for CDIDC ranged from 0.026 × 10⁻⁶ mg kg−1 day−1 for Cr at S1 by children to 120.90 × 10⁻⁶ mg kg−1 day−1 for Mn at S4. For adults, the intakes ranged from 0.046 × 10⁻⁶ mg kg−1 day−1 for Cr at S1 to 215.35 × 10⁻⁶ mg kg−1 day−1 for Mn at S4 (Table 3). None of the computed hazard quotients and hazard indices for the intake of the PTEs in the soils through dermal absorption surpassed 1, attesting to the absence of any discernable health effects for both groups. It is also worth noting that, in all cases, the calculated chronic doses, hazard quotients and indices for the control site (S5) were lower than those of the samples from the MFWs.

3.3.2. Cancer Risk Estimations

The incremental life cancer risk assessment indicated that the risk values ranged from 1.2 × 10⁻⁶ for Pb at S3 to 272.2 × 10⁻⁶ for Cd at S4 (Table 4). Thus, there are potential cancer risks in children who ingest soils from all the four MFWs, as the cancer risk values for Cd and Ni (at S2–S4) and the total cancer risk values were outside the acceptable range of 1 × 10⁻⁶ to 1 × 10⁻⁴ indicated by the US EPA. In this case, Cd and Ni are the major drivers of carcinogenic health effects in children.
For adults, cancer risk values ranged from 0.10 × 10⁻⁶ for Pb at S3 to 141.9 × 10⁻⁶ for Ni at S3. In adults, the individual cancer risk values for Ni and the total cancer risk values at S3 and S4 lay outside the safe limit of 1 × 10⁻⁶ to 1 × 10⁻⁴, alluding to potential carcinogenic health effects. Interestingly, Ni was the sole driver of carcinogenic health effects in adults.

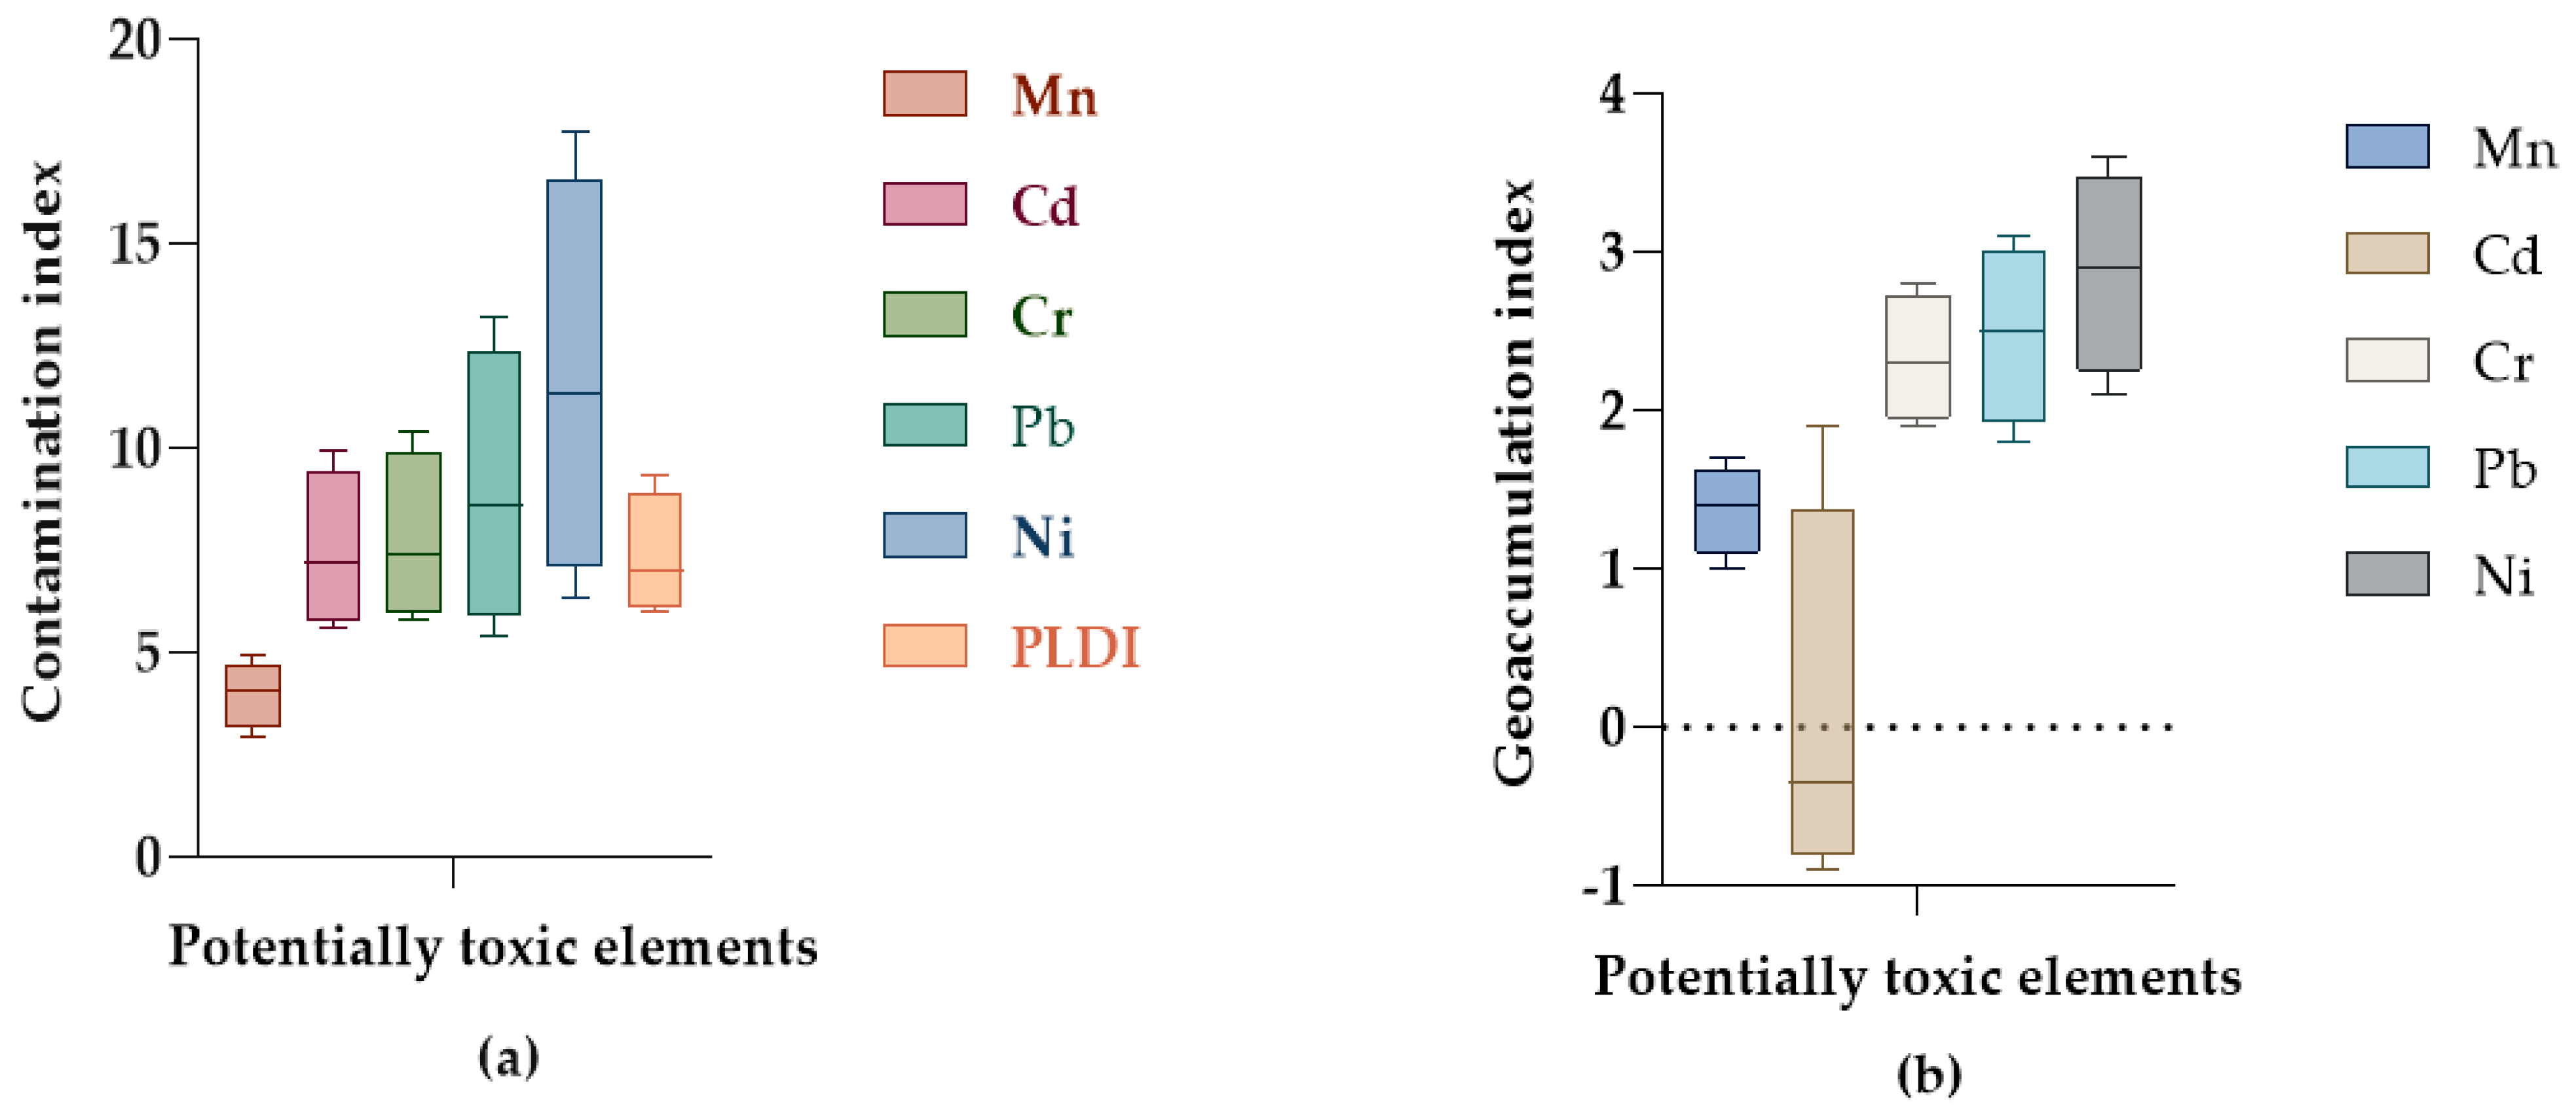
3.4. Pollution Level and Ecological Risk Assessment Indices

The effect of fabrication activities on soil pollution was assessed. The results of CFs, Igeo and pollution load indices for the MFWs are shown in Figure 6. The results of CFs calculation showed that the values in the classification ranged from 1 ≤ CFs ≤ 3 and 3 ≤ CFs < 6 for Mn, and 3 ≤ CFs < 6 to CFs > 6, for all the other PTEs (Figure 6a). For the PLDI (Figure 6a), the calculated values spanned from 6.0 for soils from S1 to 9.3 for soils from S4. Taken together, PTE pollution of the soils tended to increase with the years of operation. The level of pollution showed a positive correlation with the period for which the MFWs had been in existence (r = 0.76, p < 0.05).
On the other hand, the indices of geoaccumulation (Igeo) calculated for the soil samples from the MFWs spanned from −0.9 for Cd at S3 to 3.6 for Ni at S3 (Figure 6b). In this index, the PTEs had the following order: Ni > Pb > Cr > Mn > Cd. An assessment of E R i and PERI due to PTEs contamination of the soils obtained values ranging from 2.9 for Mn at S2 to 297.0 for Cd at S4, and 264.1 at S1 to 400.2 at S4, respectively (Table 5). The risk, in order of severity, followed the chemical sequence: Cd > Ni > Pb > Cr > Mn.

4. Discussion

4.1. Concentration and Inter-Elemental Corrlation of the PTEs in the Soil Samples

Uganda does not have its own guideline limits for PTEs in soils. The World Health Organization (WHO) target values indicate that the desirable maximum levels of PTEs in unpolluted soils are 0.8, 100, 85, and 35 mg kg−1 for Cd, Cr, Pb, and Ni, respectively [46]. All the PTEs exceeded their respective target values in the MFWs, as well as the global averages of the PTEs in the upper continental crust (571.0, 0.40, 59.5, 27.0, and 29.0 mg kg−1 for Mn, Cd, Cr, Pb, and Ni, respectively) reported by previous studies [47,48]. These results indicate that there is PTE contamination of the MFW soils.
The levels of Mn found in MFW soils were from 2.89 to 4.88 times higher than those found in the control site (S5). Mn is known to occur at high levels in soils but the levels observed for soils from the MFWs in this study could be due to the fact that Mn contributes the highest percentage of the composition of steel alloys (11–14.5%) that are used in welding and fabrication [49]. Exposure to Mn, an essential component of welding electrodes and some steels, has been implicated in neurotoxicity and Parkinsonism of welders [50,51].
Chromium, which had the second highest concentration among the PTEs in the soil samples, was from 2.4 to 4.3 times higher than the WHO target value, and from 5.9 to 10.4 times higher than the value at the control site (S5). These high levels could also be attributed to Cr, which is present in welding rods. It is now established that Cr, in hexavalent form (Cr6+), is released during welding operations [52,53,54]. Moreover, welders inhaling Cr6+ are at an increased risk of lung, nasal, sinus, and stomach cancers [55].
Cadmium, another constituent of welding materials, was 0.9 to 1.6 times higher than the WHO target value, and 5.6 to 9.9 times higher than the concentration obtained from the control site (S5). Cadmium is usually plated with substrate materials, such as prefabricated steel, various types of iron, and industrial fasteners, to act as a sacrificial coating [56]. It is a preferred plating material due to its beneficial properties, such as its high resistance to saltwater corrosion, outstanding conductivity, and low electrical resistance during welding. It also provides a low friction surface. When Cd-plated materials are exposed to the atmosphere, Cd corrodes and breaks down before the underlying material. In addition, some Cd may be released into the atmosphere or deposited on the ground during welding, cutting, or grinding [57]. Exposure to welding fumes has been implicated in increased urinary Cd and β2-microglobulinaemia, which implies that it leads to renal tubular dysfunction [58].
Lead, a well-known probable carcinogen, was 1.3 to 3.1 times higher than the WHO target value, and 5.4 to 13.2 times higher than the value at the control site (S5). Lead is added to steel bars and sheets to improve their mechanical properties and corrosion resistance. When exposed to air or water, Pb oxides and carbonates are formed, which protect the underlying metal from further attack. The alloying of medium carbon steel with Pb improves the cutting speeds, grinding, or filling of the steel before welding, and makes it easy to cut steel to the desired shape and smoothen joints [59]. When added, Pb does not mix completely with the metal, since it is slightly soluble in liquid or solid steel. Lead remains separate from the rest of the metal components and mechanically disperses in the steel as submicroscopic metallic inclusions when it solidifies [59]. Through cutting, grinding, filling, and welding, particulates and fumes of Pb can be generated, which end up in the soil. In addition to being a constituent of steel, Pb contamination could also occur as a result of using Pb-based paints such as red oxide to spray finished welded materials. Long-term exposure to Pb is known to induce Pb poisoning and hypertension [60,61]. The World Health Organization has also indicated that at least 900,000 deaths per year, and up to 30% of the global burden of developmental intellectual disability, are due to Pb poisoning [62]. Furthermore, inorganic Pb compounds are probable human carcinogens [63].
Finally, Ni occurred at concentrations ranging from 2.1 to 6.0 times higher than the WHO target value, and 6.3 to 17.7 times higher than the value at the control site (S5). Nickel is a metal used in the plating of steel due to its ability to increase hardening, improve the toughness and ductility of the steel, and greatly enhance resistance to atmospheric corrosion. Also, steel alloys with nickel corrode to a certain extent, after which no further corrosion takes place. Additionally, Ni-based steel is easy to form and weld. All these properties make Ni of great importance in the manufacture of steel. Occupational exposure to Ni in welding has been reported [25], and such exposure has been associated with genotoxicity, carcinogenicity, and immunotoxicity [64].
There is a paucity of published literature on PTEs in soils from MFWs. In a welding workshop in Lagos (Nigeria), Adu et al. [22] reported the presence of Cd (0.248 mg kg−1), Cr (8.6 mg kg−1), Ni (0.96 mg kg−1), Pb (2.469 mg kg−1), Zn (46.875 mg kg−1), and Cu (1.292 mg kg−1) in soils sampled from the area. Although the levels of Cd obtained in their study are comparable to the results of the current study, the other PTEs quantified in this study are higher than those reported in the Nigerian welding workshop. Another, similar study of soils sampled at 0–10 cm in welding workshops at Old Panteka Market, Kaduna (Nigeria), found the following PTEs: Cr (0.001–161.73 mg kg−1), Cu (15.68–3446.43 mg kg−1), Cd (1.28–11.23 mg kg−1), Pb (95.85–1220.45 mg kg−1), and Ni (9.35–170.78 mg kg−1) [23]. The observed differences in the PTE levels in MFW soils in Mbarara City when compared with previous studies could be due to differences in the depth of the sampled soils, the sampling strategies used, the number of years the workshops had been in operation prior to soil sampling, the volume of anthropogenic activities, the physicochemical properties of the soils, and the climatic conditions in the different locations [65].
Considering the positive correlations between the studied PTEs in the soil samples, the significant correlation coefficients between pairs of PTEs are indicative of their origination from a common source, i.e., MFWs’ activities [66,67,68], mutual dependences, or identical behaviors during transport in the environment. Elevated concentrations of siderophilic elements (Ni, Cr, Mn, and Pb) are markers of anthropogenic pollution, supporting the idea that they could have occurred as a result of the metallurgical activities in the MFWs [69].

4.2. Human Health Risks Posed

Pertaining to non-cancer risks, this study established that, with the exception of S1 and S5, there are potential non-cancer health effects that could arise from the ingestion of soils from the MFWs by children. This high level of exposure through ingestion in children could be because of their high hand-to-mouth habit of ingestion of things they come into contact with [35,70]. As expected, exposure to the PTEs through inhalation and dermal contact had hazard quotients that never exceeded 1. These results suggested that no adverse health effects would likely be experienced by individuals who inhale or are exposed through dermal contact with PTEs in the soils from the MFWs. This is supported by the fact that, for such exposures to occur, the soils would have to be inhaled/adsorbed as dust; therefore, these may not be the most common routes of exposure to the PTEs. A previous study in welding workshops from Potiskum town (Nigeria) showed that the highest individual hazard quotient due to ingestion of contaminated soils was contributed by Cr (6.581 × 10⁻²), but all the hazard quotients, as well as the hazard indices, never exceeded 1, indicating no potential non-cancer health risks [24].
The carcinogenic risk assessment results indicated that cancer risks may be experienced in children who ingest soils from all the four MFWs. Cd and Ni were identified as the driving carcinogenic PTEs in children, and therefore this risk could be exacerbated where children’s playgrounds are situated in the vicinity of the MFWs [35]. For adults (representing the general population), cancer risk values ranged from 0.10 × 10⁻⁶ for Pb at S3 to 141.9 × 10⁻⁶ for Ni at S3. In adults, cancer health effects were likely to be mostly driven by Ni. This showed that individuals working in the aged MFWs may be at a higher risk of developing certain cancers. These results are in agreement with a study in Nigeria [24], which concluded that Cr was the main driver of carcinogenic health risks due to the ingestion of PTE-contaminated soils from some welding shops in Potiskum town.

4.3. Soil Pollution Levels and Ecological Risks Posed

The effect of fabrication activities on soil pollution was assessed. The results of the CF assessment showed moderate to considerable pollution with respect to Mn, and moderate to very high pollution by all the other PTEs according to Hakanson’s classification (Table S2) [41]. Our results were comparable to a study by Jimoh et al. [23], where, for CFs, the highest CFs were observed for Pb in the soils of a welding workshop and the lowest in Cr. For the PLDI, all the soils were categorized as polluted (PLDI > 1) by the PTEs, as per the pollution grades of Tomlinson et al. [71]. The positive correlation between the PTE pollution of the soils and the number of years of operation of the MFWs indicates that there is enrichment of the PTEs in the soils. Nevertheless, the volume of the fabricated materials produced by the MFWs could also be another factor contributing to the increased levels of pollution observed.
On the other hand, the Igeo calculations indicated that the MFWs were practically uncontaminated with respect to Cd, except for S1, which showed median contamination levels. All the sites showed median contamination (for Mn) and from median to serious contamination for the other PTEs. A similar study in welding workshops in Nigeria found that Igeo ranged from −0.63 to 1.58 at 0–5 cm and −0.63 to 1.71 at 5–10 cm, respectively, indicating uncontaminated to slightly contaminated soils [23].
An assessment of E R i and PERI revealed that there are considerable ecological risks posed by the PTEs in the MFW soils, specifically with respect to Cd, Ni, and Pb (Table 5). These results attest to the fact that the biodiversity of the studied sites is at low to high ecological risks.

5. Conclusions

The results of this study showed that all the MFWs had variable concentrations of PTEs, which surpassed their WHO target values in unpolluted soils and their levels in the control site by 0.9 to 17.7 times. Therefore, it is probable that the fabrication activities taking place within the MFWs are potential sources of the PTEs in the soils, which puts public health at a risk. Direct ingestion was the main exposure pathway associated with significant health-risk tendencies for soils in the 7-, 8-, and 10-year-old MFWs. The pollution indices (CFs, Igeo, and PLDI) indicated that the soils in the MFWs are considerably to extremely polluted. This indicates a high likelihood that the polluted soils may end up in water sources, thereby compromising water quality. There is, therefore, an urgent need for the development of clear and well-planned policies pertaining to the setting-up of MFWs in Mbarara City and Uganda as a whole. Further studies should investigate the emissions of PTEs, as well as urinary or toenail biomarkers, in the welders of the MFWs.

Supplementary Materials

The following supporting information can be downloaded at: https://0-www-mdpi-com.brum.beds.ac.uk/article/10.3390/jox14010011/s1, Table S1: Values of exposure factors used in health-risk assessments due to PTEs in soils from MFWs in Mbarara City, Uganda; Table S2: Classification values of pollution and risk indices used in study of PTEs in soils from MFWs in Mbarara City, Uganda.

Author Contributions

Conceptualization, E.N. (Eunice Nuwamanya), D.B. and E.N. (Emmanuel Ntambi); methodology, E.N. (Eunice Nuwamanya), D.B., C.K.N., C.A., A.V.K., T.O. and E.N. (Emmanuel Ntambi); software, E.N. (Eunice Nuwamanya) and T.O.; validation, D.B., T.O., S.O., P.O., D.O., B.O. and E.N. (Emmanuel Ntambi); formal analysis, E.N. (Eunice Nuwamanya); investigation, E.N. (Eunice Nuwamanya); resources, E.N. (Eunice Nuwamanya), D.B., T.O., B.O., D.N. and E.N. (Emmanuel Ntambi); data curation, A.V.K., T.O. and E.N. (Emmanuel Ntambi); writing—original draft preparation, E.N. (Eunice Nuwamanya), C.A., A.V.K., T.O., P.O. and B.O.; writing—review and editing, D.B., S.O., P.O., D.O., D.N. and E.N. (Emmanuel Ntambi); visualization, C.K.N., T.O. and D.N.; supervision, D.B. and E.N. (Emmanuel Ntambi). All authors have read and agreed to the published version of the manuscript.

Funding

The article processing charge for this article was in part supported by Cranfield University through its Institutional Open Access Program (No. 2750397).

Institutional Review Board Statement

Not applicable.

Informed Consent Statement

Not applicable.

Data Availability Statement

Data supporting the conclusions of this study are available on request from the authors.

Conflicts of Interest

The authors declare no conflicts of interest.

References

  1. Kuddus, M.A.; Tynan, E.M. Urbanization: A problem for the rich and the poor? Public Health Rev. 2020, 41, 1. [Google Scholar] [CrossRef]
  2. Di Clemente, R.; Strano, E.; Batty, M. Urbanization and economic complexity. Sci. Rep. 2021, 11, 3952. [Google Scholar] [CrossRef]
  3. Hosono, A. Addressing Challenges of Urbanization for Quality of Growth. In SDGs, Transformation, and Quality Growth; Sustainable Development Goals Series; Springer: Singapore, 2022; pp. 121–129. [Google Scholar]
  4. Radoine, H.; Bajja, S.; Chenal, J.; Ahmed, Z. Impact of urbanization and economic growth on environmental quality in western africa: Do manufacturing activities and renewable energy matter? Front. Environ. Sci. 2022, 10, 1012007. [Google Scholar] [CrossRef]
  5. The World Bank. Urban Development. Available online: https://www.worldbank.org/en/topic/urbandevelopment/overview#:~:text=Globally%2C%20over%2050%25%20of%20the,housing%20their%20expanding%20populations%20need (accessed on 19 November 2023).
  6. Balk, D.; Leyk, S.; Montgomery, M.R.; Engin, H. Global Harmonization of Urbanization Measures: Proceed with Care. Remote Sens. 2021, 13, 4973. [Google Scholar] [CrossRef] [PubMed]
  7. Heinrigs, P. Africapolis: Understanding the dynamics of urbanization in Africa. Field Actions Sci. Rep. 2020, 22, 18–23. [Google Scholar]
  8. Mackay, H.; Tusabe, R.; Mugagga, F. Similar, yet different! Comparing Ugandan secondary cities’ food system and nutritional transformations to findings from African primary cities. Urban Transform. 2022, 4, 16. [Google Scholar] [CrossRef] [PubMed]
  9. The Independent. Parliament Approves 15 New Cities for Uganda. Available online: https://www.independent.co.ug/parliament-approves-15-new-cities-for-uganda/ (accessed on 5 November 2023).
  10. Angiro, C.; Abila, P.P.; Omara, T. Effects of industrial effluents on the quality of water in Namanve stream, Kampala Industrial and Business Park, Uganda. BMC Res. Notes 2020, 13, 220. [Google Scholar] [CrossRef] [PubMed]
  11. Nalugyaa, A.; Kiguli, J.; Wafula, S.T.; Nuwematsiko, R.; Mugambe, R.K.; Oputan, P.; Tigaiza, A.; Isunju, J.B.; Ssekamatte, T. Knowledge, attitude and practices related to the use of personal protective equipment among welders in small-scale metal workshops in Nansana Municipality, Wakiso District, Uganda. Health Psychol. Behav. Med. 2022, 10, 731–747. [Google Scholar] [CrossRef] [PubMed]
  12. Itiakorit, B.; Bayiga, E.; Osuret, J. Prevalence and determinants of occupational Injuries among welders in small scale metal workshops in Wakiso District, Uganda. East Afr. Health Res. J. 2021, 5, 106–112. [Google Scholar] [CrossRef] [PubMed]
  13. Yellow. Fabrication. Available online: https://www.yellow.ug/companies/fabrication (accessed on 5 November 2023).
  14. Massa, R. Industrial Training Report at Afro Link Metal Works Uganda Limited; Unpublished Industirla Training Report; Busitema University, Busia, Uganda, 2021.
  15. AGRA-Sustainably Growing Africa’s Food Systems. Exploiting Local Fabrication Capacities to Enhance Post-Harvest. AGRA Impact Series. Available online: https://agra.org/wp-content/uploads/2021/11/Impact-Series_REACTS-and-CARI_Mugenyera-Agro-Machinary-fabricator.pdf (accessed on 25 December 2023).
  16. Kirabira, J.B.; Semakula, A.N.; Makumbi, T. Estimating Energy Conservation Potential Of Local Metal Casting Units In Uganda Using Data Envelopment Analysis. Int. J. Sci. Technol. Res. 2015, 4, 20–26. [Google Scholar]
  17. Productivity SA. The South African Metal Fabrication Sector April 2021. Available online: https://productivitysa.co.za/downloads/ProductivitySA_Metal_Fabrication_Sector.pdf (accessed on 18 December 2023).
  18. Way, M.; Willingham, J.; Goodall, R. Brazing filler metals. Int. Mater. Rev. 2020, 65, 257–285. [Google Scholar] [CrossRef]
  19. Tchounwou, P.B.; Yedjou, C.G.; Patlolla, A.K.; Sutton, D.J. Heavy metal toxicity and the environment. Exp. Suppl. 2012, 101, 133–164. [Google Scholar] [PubMed]
  20. Eid, R.; Arab, N.T.; Greenwood, M.T. Iron mediated toxicity and programmed cell death: A review and a re-examination of existing paradigms. Biochim. Biophys. Acta Mol. Cell Res. 2017, 1864, 399–430. [Google Scholar] [CrossRef]
  21. Genchi, G.; Carocci, A.; Lauria, G.; Sinicropi, M.S.; Catalano, A. Nickel: Human Health and Environmental Toxicology. Int. J. Environ. Res. Public Health 2020, 17, 679. [Google Scholar] [CrossRef]
  22. Adu, A.A.; Aderinola, O.J.; Kusemiju, V. An Assessment of Soil Heavy Metal Pollution by Various Allied Artisans in Automobile, Welding Workshop and Petrol Station in Lagos State, Nigeria. Sci. J. Environ. Eng. Res. 2012, 2012, 1–8. [Google Scholar]
  23. Jimoh, A.; Agbaji, E.B.; Ajibola, V.O.; Funtua, M.A. Application of Pollution Load Indices, Enrichment Factors, Contamination Factor and Health Risk Assessment of Heavy Metals Pollution of Soils of Welding Workshops at Old Panteka Market, Kaduna-Nigeria. Open J. Anal. Bioanal. Chem. 2020, 4, 11–19. [Google Scholar]
  24. Abdullahi, S.; Musa, M.S. Health Risk Assessment of Some Heavy Metals in Soil Samples Around Identified Metal Workshops. FUDMA J. Sci. 2023, 7, 240–245. [Google Scholar] [CrossRef]
  25. Abdullahi, I.L.; Sani, A. Welding fumes composition and their effects on blood heavy metals in albino rats. Toxicol. Rep. 2020, 7, 1495–1501. [Google Scholar] [CrossRef] [PubMed]
  26. Su, T.-Y.; Pan, C.-H.; Hsu, Y.-T.; Lai, C.-H. Effects of Heavy Metal Exposure on Shipyard Welders: A Cautionary Note for 8-Hydroxy-2-Deoxyguanosine. Int. J. Environ. Res. Public Health 2019, 16, 4813. [Google Scholar] [CrossRef]
  27. World Health Organization. International Agency for Research on Cancer. Chromium, Nickel and Welding. In IARC Monographs on the Evaluation of Carcinogenic Risks to Humans; IARC: Lyon, France, 1990; Volume 49, pp. 1–648. [Google Scholar]
  28. Ward, E.M.S.; Schulte, P.A.; Straif, K.; Hopf, N.B.; Caldwell, J.C.; Carreon, T.; DeMarini, D.M.; Fowler, B.A.; Goldstein, B.D.; Hemminki, K.; et al. Research recommendations for selected IARC-classified agents. Environ. Health Perspect. 2010, 118, 1355–1362. [Google Scholar] [CrossRef]
  29. Guha, N.; Loomis, D.; Guyton, K.Z.; Grosse, Y.; El Ghissassi, F.; Bouvard, V.; Benbrahim-Tallaa, L.; Vilahur, N.; Muller, K.; Straif, K.; et al. Carcinogenicity of welding, molybdenum trioxide, and indium tin oxide. Lancet Oncol. 2017, 18, 581–582. [Google Scholar] [CrossRef]
  30. Onyango, S.P.B.; Anguma, S.; Meng, Q. Spatio-Temporal Variation in the Concentration of Inhalable Particulate Matter (PM10) in Uganda. Int. J. Environ. Res. Public Health 2019, 16, 1752. [Google Scholar] [CrossRef] [PubMed]
  31. Mbarara City Government. Mbarara City. Available online: https://mbararacity.go.ug/ (accessed on 5 November 2023).
  32. UN-Habitat. Mbarara Municipality Urban Profile. Available online: https://unhabitat.org/sites/default/files/download-manager-files/Mbarara%20Municipality%20Urban%20Profile%20%20Uganda.pdf (accessed on 5 November 2023).
  33. UBOS. Mbarara Population Statistics. Available online: https://www.citypopulation.de/en/uganda/cities/ (accessed on 5 November 2023).
  34. Oladele, B.B.; Ugbede, F.O.; Arogunjo, A.M.; Ajayi, O.S.; Pereira, A. Gamma spectroscopy study of soil-plant transfer factor characteristics of 40K, 232Th and 226Ra in some crops cultivated in southwestern region of Nigeria. Heliyon 2023, 9, e19377. [Google Scholar] [CrossRef] [PubMed]
  35. Ajeh, E.A.; Modi, F.J.; Omoregi, I.P. Health risk estimations and geospatial mapping of trace metals in soil samples around automobile mechanic workshops in Benin City, Nigeria. Toxicol. Rep. 2022, 9, 575–587. [Google Scholar] [CrossRef]
  36. US EPA. Recommended Use of BW3/4 as the Default Method in Derivation of the Oral Reference Dose. EPA/100/R11/001. Office of the Science Advisor. 2011. Available online: http://www.epa.gov/raf/publications/pdfs/recommended-use-of-bw34.pdf (accessed on 1 October 2021).
  37. US EPA. Risk-Based Concentration Table. United States Environmental Protection Agency. 2010. Available online: http://www.epa.gov/reg3hwmd/risk/human/index.htm (accessed on 1 October 2021).
  38. Ferreira-Baptista, L.; De Miguel, E. Geochemistry and risk assessment of street dust in Luanda, Angola: A tropical urban environment. Atmos. Environ. 2005, 39, 4501–4512. [Google Scholar] [CrossRef]
  39. Omara, T.; Karungi, S.; Kalukusu, R.; Nakabuye, B.; Kagoya, S.; Musau, B. Mercuric pollution of surface water, superficial sediments, Nile tilapia (Oreochromis nilotica Linnaeus 1758 [Cichlidae]) and yams (Dioscorea alata) in auriferous areas of Namukombe stream, Syanyonja, Busia, Uganda. PeerJ 2019, 7, e7919. [Google Scholar] [CrossRef] [PubMed]
  40. Opolot, M.; Omara, T.; Adaku, C.; Ntambi, E. Spatio-temporal Variations and Potential Health Risks of Heavy Metals in Water from River Manafwa, Uganda. Lett. Appl. NanoBioSci 2024, 13, 23. [Google Scholar]
  41. Hakanson, L. An ecological risk index for aquatic pollution control. A sedimentological approach. Water Res. 1980, 14, 975–1001. [Google Scholar] [CrossRef]
  42. Müller, G. Die Schwermetallbelastung der Sedimenten des Neckars und Seiner Nebenflüsse. Chemiker-Zeitung 1981, 6, 157–164. [Google Scholar]
  43. Chen, C.; Kao, C.; Chen, C.; Dong, C. Distribution and accumulation of heavy metals in the sediments of Kaohsiung harbor, Taiwan. Chemosphere 2007, 66, 1431–1440. [Google Scholar] [CrossRef]
  44. Zhang, W.; Feng, H.; Chang, J.; Qu, J.; Xie, H.; Yu, L. Heavy metal contamination in surface sediments of Yangtze river intertidal zone: An assessment from different indexes. Environ. Pollut. 2009, 157, 1533–1543. [Google Scholar] [CrossRef]
  45. Mondal, S.; Singh, G. Pollution evaluation, human health effect and tracing source of trace elements on road dust of Dhanbad, a highly polluted industrial coal belt of India. Environ. Geochem. Health 2021, 43, 2081–2103. [Google Scholar] [CrossRef]
  46. Denneman, C.A.J.; Robberse, J.G. Ecotoxicological Risk Assessment as a Base for Development of Soil Quality Criteria. In Contaminated Soil’90; Springer: Dordrecht, The Netherlands, 1990; pp. 157–164. [Google Scholar]
  47. Kabata-Pendias, A. Trace Elements in Soils and Plants; Kabata-Pendias, A., Pendias, H.K., Eds.; Taylor and Francis: Abingdon, UK, 2011; Volume 548, p. 2010. [Google Scholar]
  48. Xiao, X.; Zhang, J.; Wang, H.; Han, X.; Ma, J.; Ma, Y.; Luan, H. Distribution and health risk assessment of potentially toxic elements in soils around coal industrial areas: A global meta-analysis. Sci. Total Environ. 2020, 713, 135292. [Google Scholar] [CrossRef] [PubMed]
  49. Taube, F. Manganese in Occupational Arc Welding Fumes—Aspects on Physiochemical Properties, with Focus on Solubility. Ann. Occupat. Hyg. 2013, 57, 6–25. [Google Scholar]
  50. Sriram, K.; Lin, G.X.; Jefferson, A.M.; Roberts, J.R.; Andrews, R.N.; Kashon, M.L.; Antonini, J.M. Manganese accumulation in nail clippings as a biomarker of welding fume exposure and neurotoxicity. Toxicol. Indust Health 2012, 2911, 73–82. [Google Scholar] [CrossRef] [PubMed]
  51. Mehrifar, Y.; Bahrami, M.; Sidabadi, E.; Pirami, H. The effects of occupational exposure to manganese fume on neurobehavioral and neurocognitive functions: An analytical cross-sectional study among welders. EXCLI J. 2020, 19, 372–386. [Google Scholar] [PubMed]
  52. Heung, W.; Yun, M.-J.; Chang, D.P.Y.; Green, P.G.; Halm, C. Emissions of Chromium (VI) from Arc Welding. J. Air Waste Manag. Assoc. 2007, 57, 252–260. [Google Scholar] [CrossRef]
  53. Vishnu, B.R.; Sivapirakasam, S.P.; Satpathy, K.K.; Albert, S.K.; Chakraborty, G. Cr6+ reduction in welding fumes by nano composite coatings on stainless steel manual metal arc welding electrodes. Process Saf. Environ. Protect. 2018, 114, 334–346. [Google Scholar]
  54. Mehrifar, Y.; Zeverdegani, S.K.; Rismanchian, M. Chemical pollutants in the respiratory zone of welders: Determination of concentrations and hazard analysis. Work 2020, 67, 591–598. [Google Scholar] [CrossRef]
  55. Riccelli, M.G.; Goldoni, M.; Poli, D.; Mozzoni, P.; Cavallo, D.; Corradi, M. Welding Fumes, a Risk Factor for Lung Diseases. Int. J. Environ. Res. Public Health 2020, 17, 2552. [Google Scholar] [CrossRef]
  56. Menke, J. The Many Sides of Cadmium Plating. In Proceedings of the CORROSION 2003, San Diego, CA, USA, 16–20 March 2003. [Google Scholar]
  57. Zhang, J.; Li, S.-J.; Guo, J.-Y.; Zhang, G.-Y.; Kang, H.; Shi, X.-J.; Zhou, H.; Liang, Y.-F.; Shen, W.-T.; Lei, L.-J. Urinary cadmium and peripheral blood telomere length predict the risk of renal function impairment: A study of 547 community residents of Shanxi, China. Environ. Sci. Pollut. Res. 2022, 29, 71427–71438. [Google Scholar] [CrossRef]
  58. Ding, X.; Zhang, Q.; Wei, H.; Zhang, Z. Cadmium-induced renal tubular dysfunction in a group of welders. Occupat. Med. 2011, 61, 277–279. [Google Scholar] [CrossRef]
  59. Dehghan, S.F.; Mehrifar, Y.; Ardalan, A. The Relationship between Exposure to Lead-Containing Welding Fumes and the Levels of Reproductive Hormones. Ann. Glob. Health 2019, 85, 125. [Google Scholar] [CrossRef]
  60. WHO. Exposure to Lead: A Major Public Health Concern, 2nd ed.; World Health Organization: Geneva, Switzerland, 2021. Available online: https://www.who.int/publications/i/item/9789240037656 (accessed on 6 September 2023).
  61. Saeed, S.; Hasan, S.; Kuldeep, K.; Choudhury, P. Lead Poisoning: A Persistent health Hazard-General and oral aspects. Biomed. Pharmacol. J. 2017, 10, 439–445. [Google Scholar] [CrossRef]
  62. WHO. Lead in Drinking-Water: Health Risks, Monitoring and Corrective Actions. 2022. Available online: https://apps.who.int/iris/rest/bitstreams/1460455/retrieve (accessed on 5 September 2023).
  63. Kim, H.C.; Jang, T.W.; Chae, H.J.; Choi, W.J.; Ha, M.N.; Ye, B.J.; Kim, B.G.; Jeon, M.J.; Kim, S.Y.; Hong, Y.S. Evaluation and management of lead exposure. Ann. Occup. Environ. Med. 2015, 27, 30. [Google Scholar] [CrossRef]
  64. Das, K.; Reddy, R.; Bagoji, I.; Das, S.; Bagali, S.; Mullur, L.; Khodnapur, J.; Biradar, M. Primary concept of nickel toxicity—An overview. J. Basic Clin. Physiol. Pharmacol. 2019, 30, 141–152. [Google Scholar] [CrossRef]
  65. Adekeye, E.A.; Ojo, M.A.; Ajayi, O.O. Contributions of metal welding workshops to environmental pollution in Akure Metropolis, Ondo State, Nigeria. J. Environ. Issues Agric. Dev. Ctries 2011, 3, 1–7. [Google Scholar]
  66. Baguma, G.; Musasizi, A.; Twinomuhwezi, H.; Gonzaga, A.; Nakiguli, C.K.; Onen, P.; Angiro, C.; Okwir, A.; Opio, B.; Otema, T.; et al. Heavy Metal Contamination of Sediments from an Exoreic African Great Lakes’ Shores (Port Bell, Lake Victoria), Uganda. Pollutants 2022, 2, 407–421. [Google Scholar] [CrossRef]
  67. Onen, P.; Akemkwene, R.; Nakiguli, C.K.; Nimusiima, D.; Ruma, D.H.; Khanakwa, A.V.; Angiro, C.; Bamanya, G.; Opio, B.; Gonzaga, A.; et al. Health Risks from Intake and Contact with Toxic Metal-Contaminated Water from Pager River, Uganda. J. Xenobiot. 2023, 13, 544–559. [Google Scholar] [CrossRef] [PubMed]
  68. Nimusiima, D.; Byamugisha, D.; Omara, T.; Ntambi, E. Physicochemical and Microbial Quality of Water from the Ugandan Stretch of the Kagera Transboundary River. Limnol. Rev. 2023, 23, 157–176. [Google Scholar] [CrossRef]
  69. Žibret, G.; Rokavec, D. Household dust and street sediment as an indicator of recent heavy metals in atmospheric emissions: A case study on a previously heavily contaminated area. Environ. Earth Sci. 2010, 61, 443–453. [Google Scholar] [CrossRef]
  70. Burg, W.; Bremmer, H.J.; van Engelen, J.G.M. Oral Exposure of Children to Chemicals via Hand-to-Mouth Contact. RIVM Report 320005004/2007. 2007. Available online: https://www.rivm.nl/bibliotheek/rapporten/320005004.pdf (accessed on 6 September 2023).
  71. Tomlinson, D.L.; Wilson, J.G.; Harris, C.R.; Jeffrey, D.W. Problems in the assessment of heavy-metal levels in estuaries and the formation of a pollution index. Helgol. Mar. Res. 1980, 33, 566–575. [Google Scholar] [CrossRef]
Figure 1. Map showing the location of the studied metal fabrication workshops in Mbarara City boroughs, Uganda. Sampling sites S1–S4 and S5 refer to the metal fabrication workshops and the control site, respectively.
Jox 14 00011 g001
Figure 2. Some of the fabricated products at the metallic fabrication workshops considered in this study: (a) a security gate, (b) a metallic door and window, and (c) metallic double-decker beds.
Jox 14 00011 g002
Figure 3. Approach used when sampling soils from metal fabrication workshops in Mbarara City, Uganda.
Jox 14 00011 g003
Figure 4. Concentration of PTEs in soils from MFWs in Mbarara City, Uganda: (a) manganese, (b) chromium, (c) cadmium, (d) lead, and (e) nickel. The sampling sites S1–S4 and S5 refers to the MFWs and the control site, respectively. The method detection limits for the PTEs were 0.03, 0.25, 0.07, 1.4, and 0.4 mg kg−1 for Mn, Cr, Cd, Pb, and Ni, respectively.
Jox 14 00011 g004
Figure 5. Pearson’s correlation coefficient (r) matrix plot for the interrelationships between the PTEs of the soils from the sampled MFWs in Mbarara City, Uganda. * Significant at the 0.05 level (2-tailed); ** also significant at 0.01 level (2-tailed).
Jox 14 00011 g005
Figure 6. Box-and-whisker plot of (a) contamination factors and pollution load index (PLDI), and (b) geoaccumulation indices of the PTEs in soils from some metal fabrication workshops in Mbarara City, Uganda.
Jox 14 00011 g006
Table 1. Chronic daily intake through the incidental ingestion of PTEs in soils from MFWs in Mbarara City, Uganda.
Age GroupSampling SiteAverage Chronic Daily Intake
(×10−6 mg kg−1 day−1)
Hazard QuotientHazard Index 1
MnCrCdPbNiMnCrCdPbNi
ChildrenS13531.79.3303.7247.995.70.0760.0930.3040.0710.00470.5487
S225,724.213.3333.1188.7144.70.5590.1330.3330.0540.00721.0862
S335,786.310.6424.9137.8270.20.7780.1060.4250.0390.01351.3615
S443,178.116.5543.3335.0201.30.9390.1650.5430.0960.01011.7531
S5889.01.752.0225.4215.20.0190.0170.0520.0070.00080.0958
AdultsS14414.71.1724.6820.1459.810.0960.00120.00250.00580.00300.1085
S23216.71.6727.0715.3390.450.0700.00170.00270.00440.00450.0833
S34472.31.3344.1411.20168.900.0970.00130.00440.00320.00840.1143
S45397.22.0635.68209.36125.810.0120.00210.00360.00600.00630.0300
S51111.20.214.2315.899.520.00240.000210.00040.000450.000480.0039
1 Values in bold exceeded 1, indicating the possibility of non-cancer health effects being experienced by the exposed group.
Table 2. Average hazard quotients and indices for chronic intake through the inhalation of PTEs in soils from MFWs in Mbarara City, Uganda.
Age GroupSampling Site Average Chronic Daily Intake
(×10−15 mg kg−1 day−1)
Hazard Quotient (×10−10)Hazard Index (×10−10)
MnCrCdPbNiMnCrCdPbNi
ChildrenS12683.77.07230.78188.3772.721876.700.250.230.360.131877.67
S219,547.310.1253.12143.39109.9513,699.400.350.250.270.2413,700.50
S327,193.28.05322.87109.34205.3219,016.200.300.320.210.3819,017.40
S432,810.112.54412.84254.56152.9622,944.130.440.410.480.2822,945.70
S5675.51.2939.5319.3211.55472.380.050.0040.040.02472.49
AdultsS13354.640.8918.7515.345.452345.900.030.190.290.082346.49
S22444.31.2720.5711.6568.731709.300.040.210.220.121709.89
S33398.41.0133.548.51128.342376.500.040.340.160.242377.28
S44101.221.5727.1115.9195.62867.990.050.270.300.182868.79
S5844.380.163.2112.077.23590.480.060.030.230.01590.81
Note: Soils from S1–S4 and S5 are soil samples taken from the MFWs and the control site, respectively.
Table 3. Chronic daily intake through dermal contact, hazard quotients, and indices for chronic intake through inhalation of PTEs in soils from MFWs in Mbarara City, Uganda.
Age GroupSampling SiteAverage Chronic Daily Intake
(×10−6 mg kg−1 day−1)
Hazard QuotientHazard Index
MnCrCdPbNiMnCrCdPbNi
ChildrenS198.890.0260.850.690.270.00290.00430.000850.0000190.0000130.008082
S272.060.0370.930.530.410.00160.00620.000930.0000150.0000200.008565
S3100.200.0291.520.380.760.00220.00480.001520.0000110.0000370.008568
S4120.900.0461.230.940.560.00260.00770.001230.0000270.0000270.011584
S524.890.0050.150.070.040.00050.00080.000150.0000020.0000140.001466
AdultsS1176.150.0467.576.182.390.00380.00770.007570.000180.0001160.019410
S2128.350.0668.314.713.610.00280.01100.008310.000130.0001750.022415
S3178.480.05213.553.446.740.00390.00870.013550.000100.0003270.026493
S4215.350.08210.958.355.020.00470.01370.001100.000240.0002430.019983
S544.340.0081.290.630.380.00100.00130.001290.000020.0000180.003628
Note: Soils from S1–S4 and S5 are soil samples taken from the MFWs and the control site, respectively.
Table 4. Cancer risks through incidental ingestion of PTEs in soils from metal fabrication workshops in Mbarara City, Uganda.
Age GroupSampling SiteCancer Risk (×10−6)Total Cancer Risk (×10−6)
CdPbNi
ChildrenS1152.22.180.4234.7
S2166.91.6121.5290.0
S3212.91.2227.0441.1
S4272.22.8169.1444.1
S526.10.212.839.1
AdultsS112.40.1750.262.77
S213.60.1376.089.73
S322.10.10141.9164.1
S417.91.78105.7125.38
S52.10.148.010.24
Values in bold lie outside the US EPA acceptable range of 1 × 10⁻⁶ to 1 × 10⁻⁴.
Table 5. Ecological risks of PTEs in soils from the metal fabrication workshops in Mbarara City, Uganda.
Sampling Site E R i PERIPollution Level
MnCdCrPbNi
S14.0168.011.649.031.5264.1Considerable
S22.9240.012.837.047.5340.2Considerable
S34.1192.020.827.088.5332.4Considerable
S44.9297.016.815.566.0400.2High
Disclaimer/Publisher’s Note: The statements, opinions and data contained in all publications are solely those of the individual author(s) and contributor(s) and not of MDPI and/or the editor(s). MDPI and/or the editor(s) disclaim responsibility for any injury to people or property resulting from any ideas, methods, instructions or products referred to in the content.

