Implementing Sustainably Managed Fisheries Using Ecological Risk Assessment and Bowtie Analysis

1
New South Wales Department of Primary Industries, Fisheries NSW, P.O. Box 5106, Wollongong 2520, Australia
2
Helmholtz-Zentrum Geesthacht (Centre for Materials and Coastal Research), Institute of Coastal Research, Human Dimensions of Coastal Areas, Max-Planck-Straße 1, 21502 Geesthacht, Germany
*
Author to whom correspondence should be addressed.
Sustainability 2018, 10(10), 3659; https://0-doi-org.brum.beds.ac.uk/10.3390/su10103659
Submission received: 20 August 2018
/
Revised: 24 September 2018
/
Accepted: 6 October 2018
/
Published: 12 October 2018
(This article belongs to the Collection Risk Assessment and Management)
Abstract
:Determining the effectiveness of a management system to enable fisheries to harvest sustainably is a key challenge. To fully assess the likelihood that a fishery management system will not achieve its sustainability objectives, the assessment needs to include the whole pathway that leads to the consequences for management objectives. A crucial aspect of the pathway is the inclusion of management controls. Effectiveness of these management controls determines whether the effects of human pressures on ecological components and their impacts are reduced to a level that will not impede management achieving their objectives. Ecological risk assessments do not provide sufficient information to make decisions about what to change specifically in a management system to ensure a fishery is sustainably managed. Bowtie analysis (BTA) is a method that logically connects the relationships between management objectives, management controls, threats, potential impacts of threats on the fishery resource and the consequences of those impacts on achieving the management objectives. The combination of bowtie analysis and ecological risk assessment enables managers, scientists and stakeholders to evaluate different management controls and research options in response to risk factors and track the effectiveness of the management system. We applied a three-step method of bowtie analysis stage 1, quantitative ecological risk assessment and bowtie analysis stage 2 to evaluate fisheries management and science. We demonstrate these steps using a case study of a commercially fished species in New South Wales, Australia.
1. Introduction
Determining the effectiveness of a management system to enable fisheries to harvest sustainably, i.e., so that the fishery resources are being extracted for use now without reducing the ability of future generations to meet their own needs from these resources [1,2], is a key challenge. Part of this challenge is that ecologically sustainable fisheries management must consider the interactions between a fishery and its harvested species and, secondarily, the impacts of a fishery on the environment, as reflected in the ecosystem-based approach to fisheries (EAF) [3,4]. However, such an approach makes implementing, assessing and adapting fisheries to be sustainably managed over the long term much more challenging. One of the major challenges is knowing, (i) what interactions (direct and indirect) between fishing activities and components of the environment need to be managed; (ii) how to manage those interactions; (iii) what the priorities are for implementing management controls; and (iv) where are the gaps in our knowledge; i.e., the what, why, how and when of management [5].
Various tools have been developed to tackle these information needs including ecosystem modelling [6], stock assessments [7], management strategy evaluation [8], ecological risk assessment (ERA) [9] and residual risk assessment (RRA) [10]. Ecological risk assessment, in particular, is being applied widely in fisheries, using a range of methods (e.g., [9,11,12,13]). The purpose of ERAs in fisheries is to assess the risk (i.e., likelihood) that management will not achieve its sustainability objectives for a fishery under its current (or future) approach. The outputs of ERAs include a risk level (either qualitative or quantitative), justification for the level of risk (in terms of evidenced used to determine the risk, and the logic and assumptions applied), the influence of uncertainty, and evaluation of whether the level of risk is acceptable [14]. These results are then used by management and stakeholders to prioritize issues for management and research action (e.g., [15]).
There is a lack of systematic analysis of how management controls address specific issues and evaluation of their effectiveness in fishery management systems. This can lead to piecemeal management and research of fisheries that does not focus consistently on the most important issues to ensure the long-term sustainability of fisheries. This paper provides a possible method to integrate management and research to assess risk and evaluate management effectiveness that is applicable to either data-rich or data-poor fisheries. We aim to demonstrate that the combination of ecological risk assessment (ERA) and bowtie analysis (BTA) [16] enables fisheries management and science to determine what to manage and research and why, how to implement management and monitor its effects, and when best to apply the necessary management and research interventions. Specifically, we will outline the following four steps. First, we describe the essential role the fishery management process plays in setting the context within which to integrate management and research. Second, we use a first-stage BTA (BTA 1) to identify all the links between the risk factors, their impacts on fishery resources, the management controls in place to prevent and/or mitigate these impacts and the consequences of the impacts on achieving the objectives of the fishery. Third, we use an ERA based on the essential elements of BTA 1 to prioritise what is at risk and what is contributing to that risk (i.e., risk factors). Fourth, we return to the bowtie analysis in a second stage (BTA 2) to match prioritised risk factors with management and research actions (i.e., risk treatments) to lower the risk of not achieving the management objectives. We demonstrate these steps using a case study of a commercially fished species in New South Wales (NSW), Australia. Finally, we discuss the advantages and challenges in using these two methods in combination for sustainable fisheries management.
2. Source of the Problem
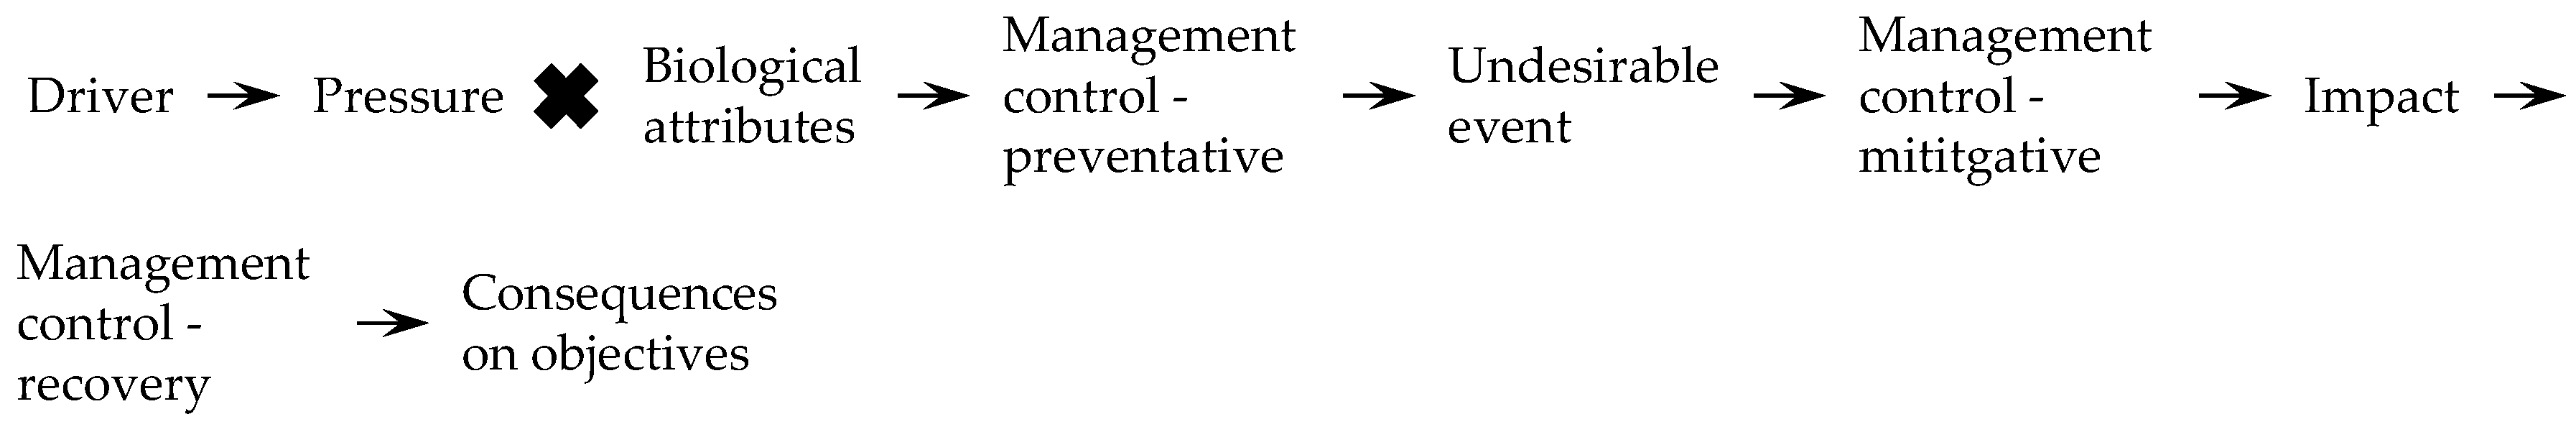
Various methods to integrate management and research into risk assessments have been pursued but in most cases, it remains a challenging problem to overcome, for both data-rich [17] and data-poor fisheries [18]. ERAs do not provide information regarding the effectiveness of the management controls being considered to make decisions about what to change specifically in a management system to ensure a fishery is sustainably managed and what knowledge gaps should be targeted by research to reduce uncertainty of the causal link between fishing and sustainability. The additional information is obtained using separate assessment techniques such as management strategy evaluation, expert and stakeholder opinion using guidelines (e.g., [10]), and/or modelling [19]. However, to fully assess the likelihood (i.e., risk) of a fishery management system not achieving its objectives, the assessment needs to include the whole cause–effect pathways that leads to the consequences on management objectives (Figure 1). A crucial aspect is an assessment of the effectiveness of the management controls [20]. Effectiveness of these management controls determines whether the effects of human pressures on ecological components and their impacts are reduced to a level that will not undermine achieving their management objectives [16,21]. Therefore, they should form an important part of the assessment of risk. ERAs, as they are currently used in fisheries, on the whole do not include management effectiveness in the assessment of risk nor do they clearly link the components of the cause–effect pathway. Applied to an ecosystem approach to management, BTA is a technique used to assess the effectiveness of management controls along cause–effect pathways [16] linking human pressures to their potential effects on an ecological component in order to assess prevention management strategies of these effects on the fishery and its environment and mitigation management strategies of the impacts that cannot be prevented from achieving their objectives (Figure 1).
Using this pathway framework we surveyed nine different ERA methods currently used in fisheries management to determine what components of the pathway (Figure 1) were included (Table 1 and Table 2). Only three management controls are included in assessing the level of risk to an ecological component not being managed sustainably. All these controls were preventative in function. Of these only one study [23] used a quantitative assessment of a management control to modify fishing pressure in determining the level of risk on benthic habitats. The effectiveness of management controls in the other two studies [24,25] were assessed qualitatively using expert opinion and it is not clear how these controls were used to modify fishing pressure. The remaining five methods included measures of impacts which could be used to infer whether management controls were effective, but were not specific enough for management to know what to change to reduce the level of risk. Omitting the contribution management controls make to the level of risk creates two potential issues. One, the level of risk maybe under- or over-estimated; and two, some of the factors contributing to the risk are not clearly identified making it difficult for management to understand what needs to be addressed to lower the risk. Consequently, this potentially leads to the development of management and research actions that are not matched to the risk factors contributing to an ecological component being at risk of unsustainable fishing [26].
3. Essential Role of the Management Context
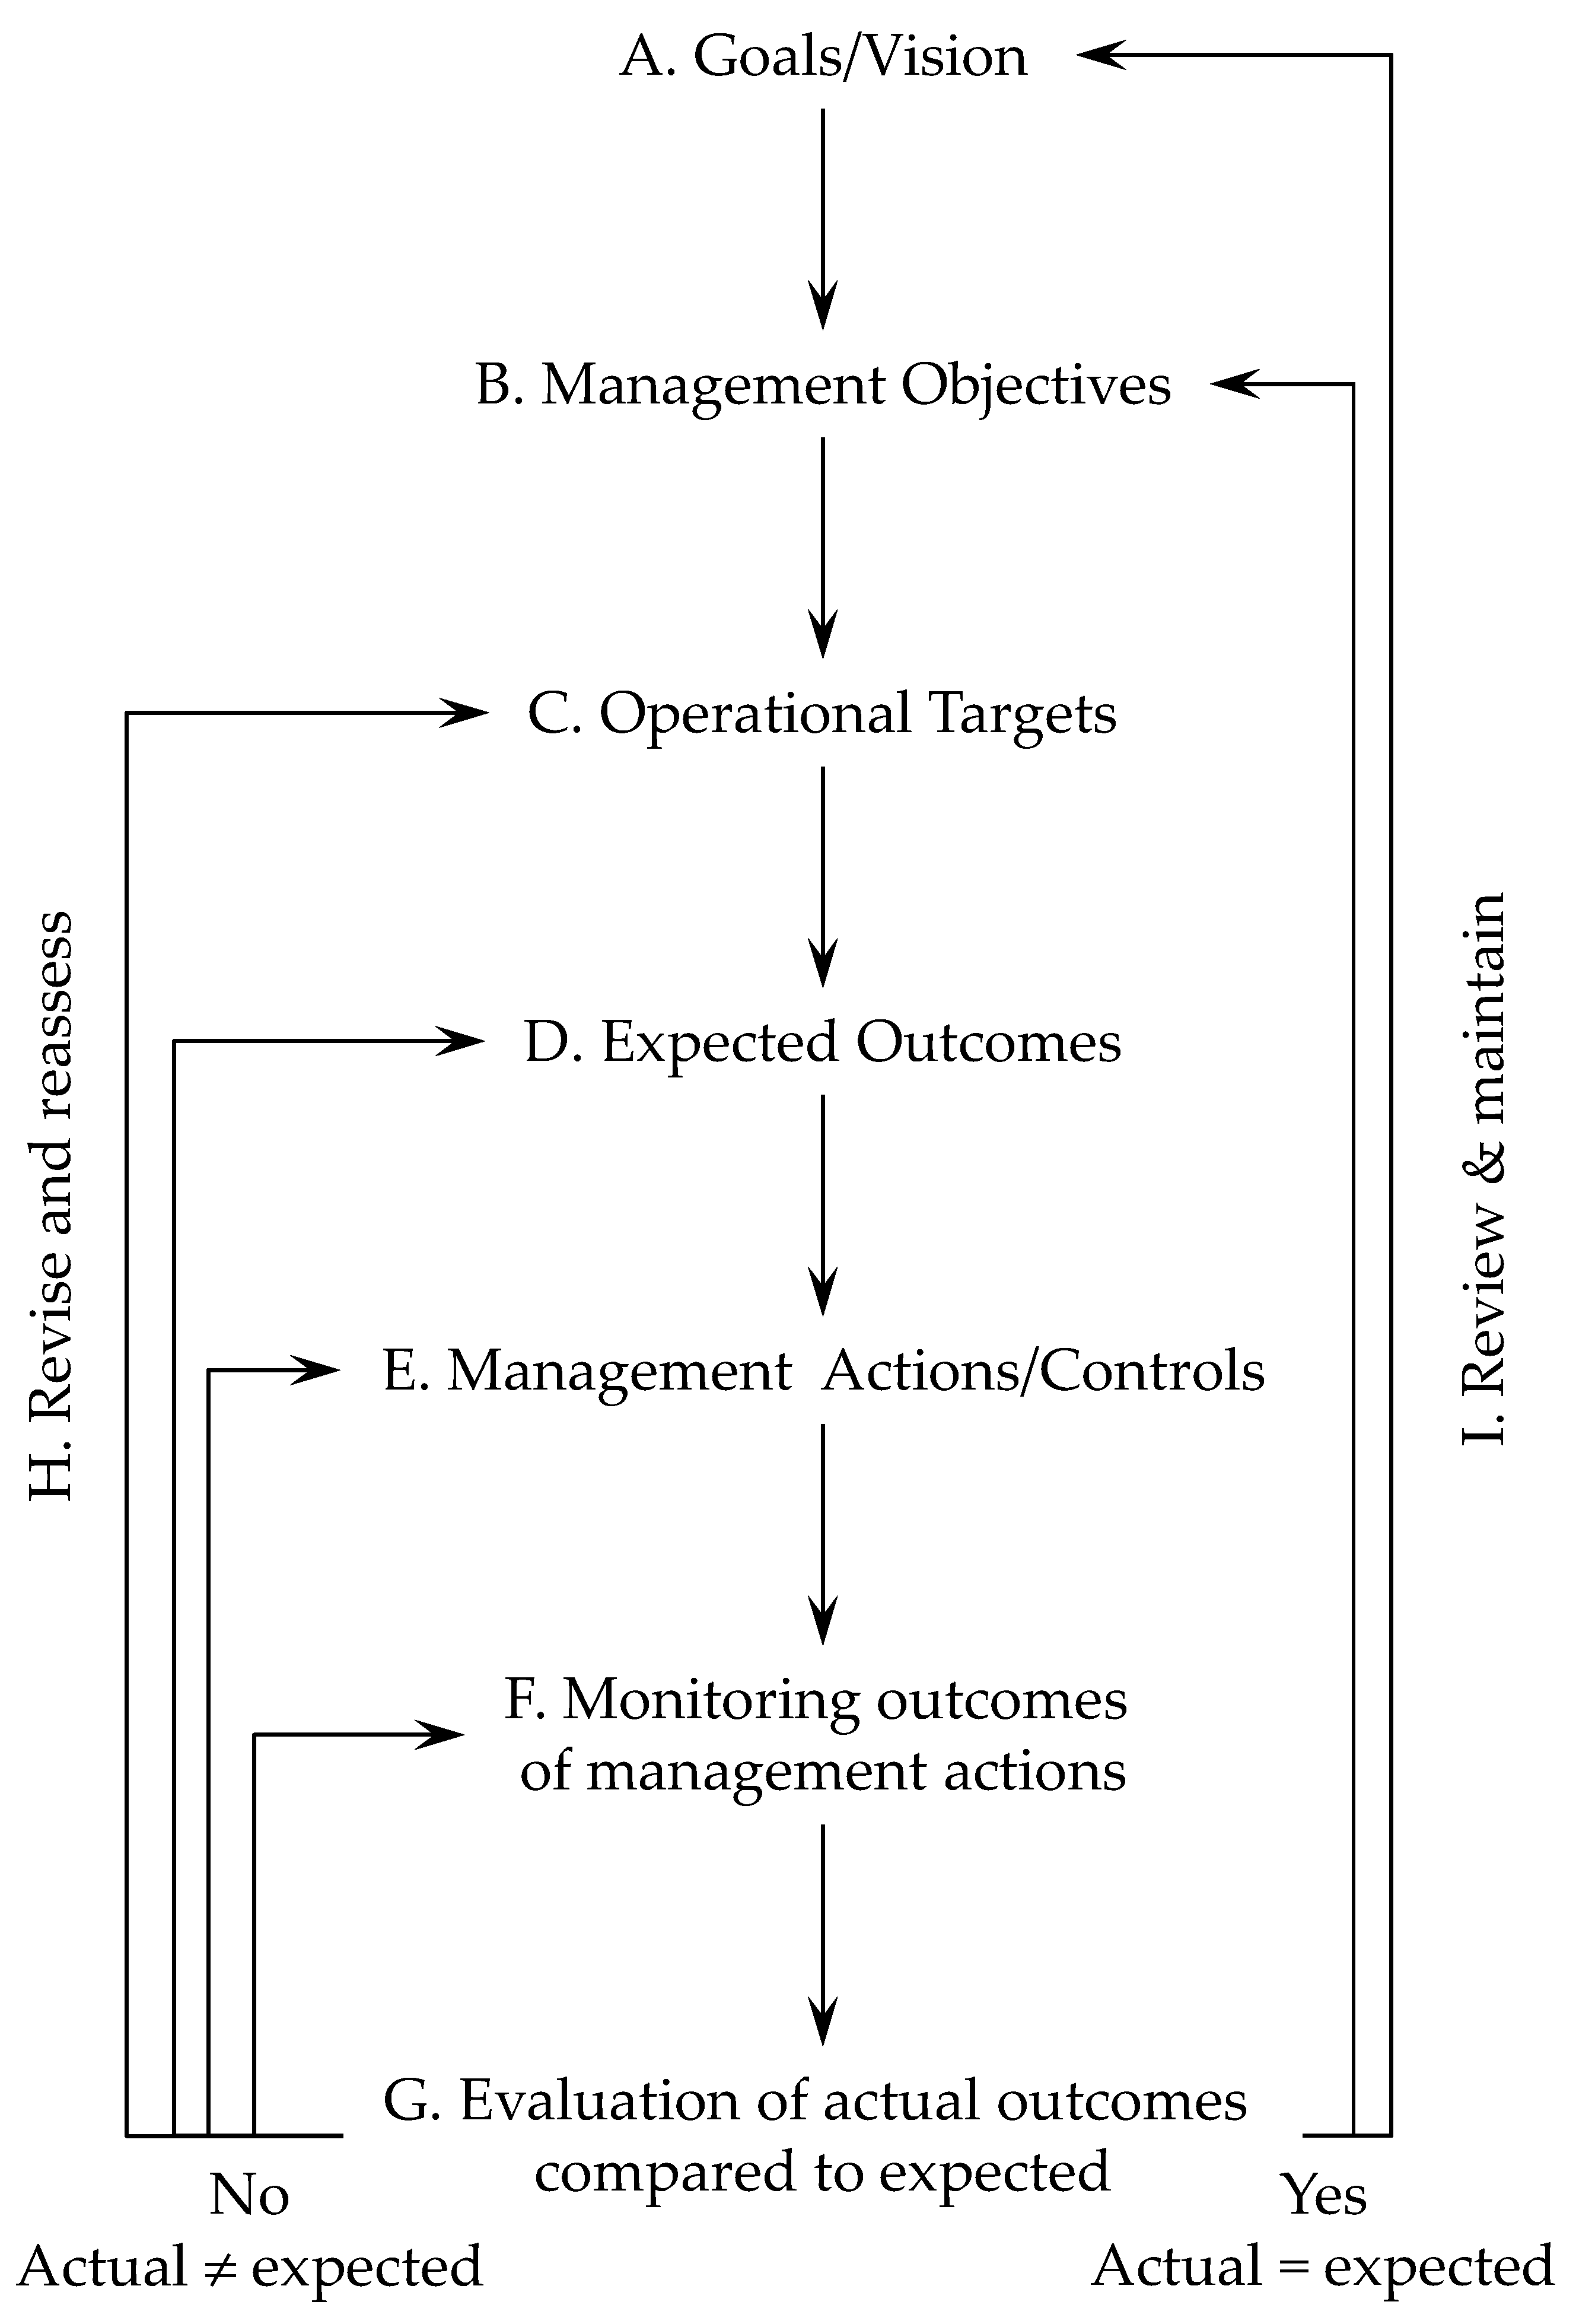
ERA and BTA cannot proceed without being anchored in the fishery management context. In particular, ERA and BTA require clear articulations of management objectives, operational targets, expected outcomes of the management regime and the management actions used to achieve the objectives [30] (Figure 2). Cormier et al. [30] have provided a structured hierarchical approach that can be used to describe a fishery management context. Table 3 lists the key questions to answer for each component of a management context. ERA assesses the likelihood (i.e., risk) of not achieving the management objectives for a fish species or fishery under current or future management controls and level of knowledge. BTA structures and logically links together all the components of a management context and scientific information to enable evaluation of the effectiveness of the management controls to meet management objectives and achieve the goal for the fishery.
4. Embedding the Management Context into an Ecological Risk Assessment and Bowtie Analysis
4.1. First Stage Bowtie Analysis—Structuring the Problems to Be Solved
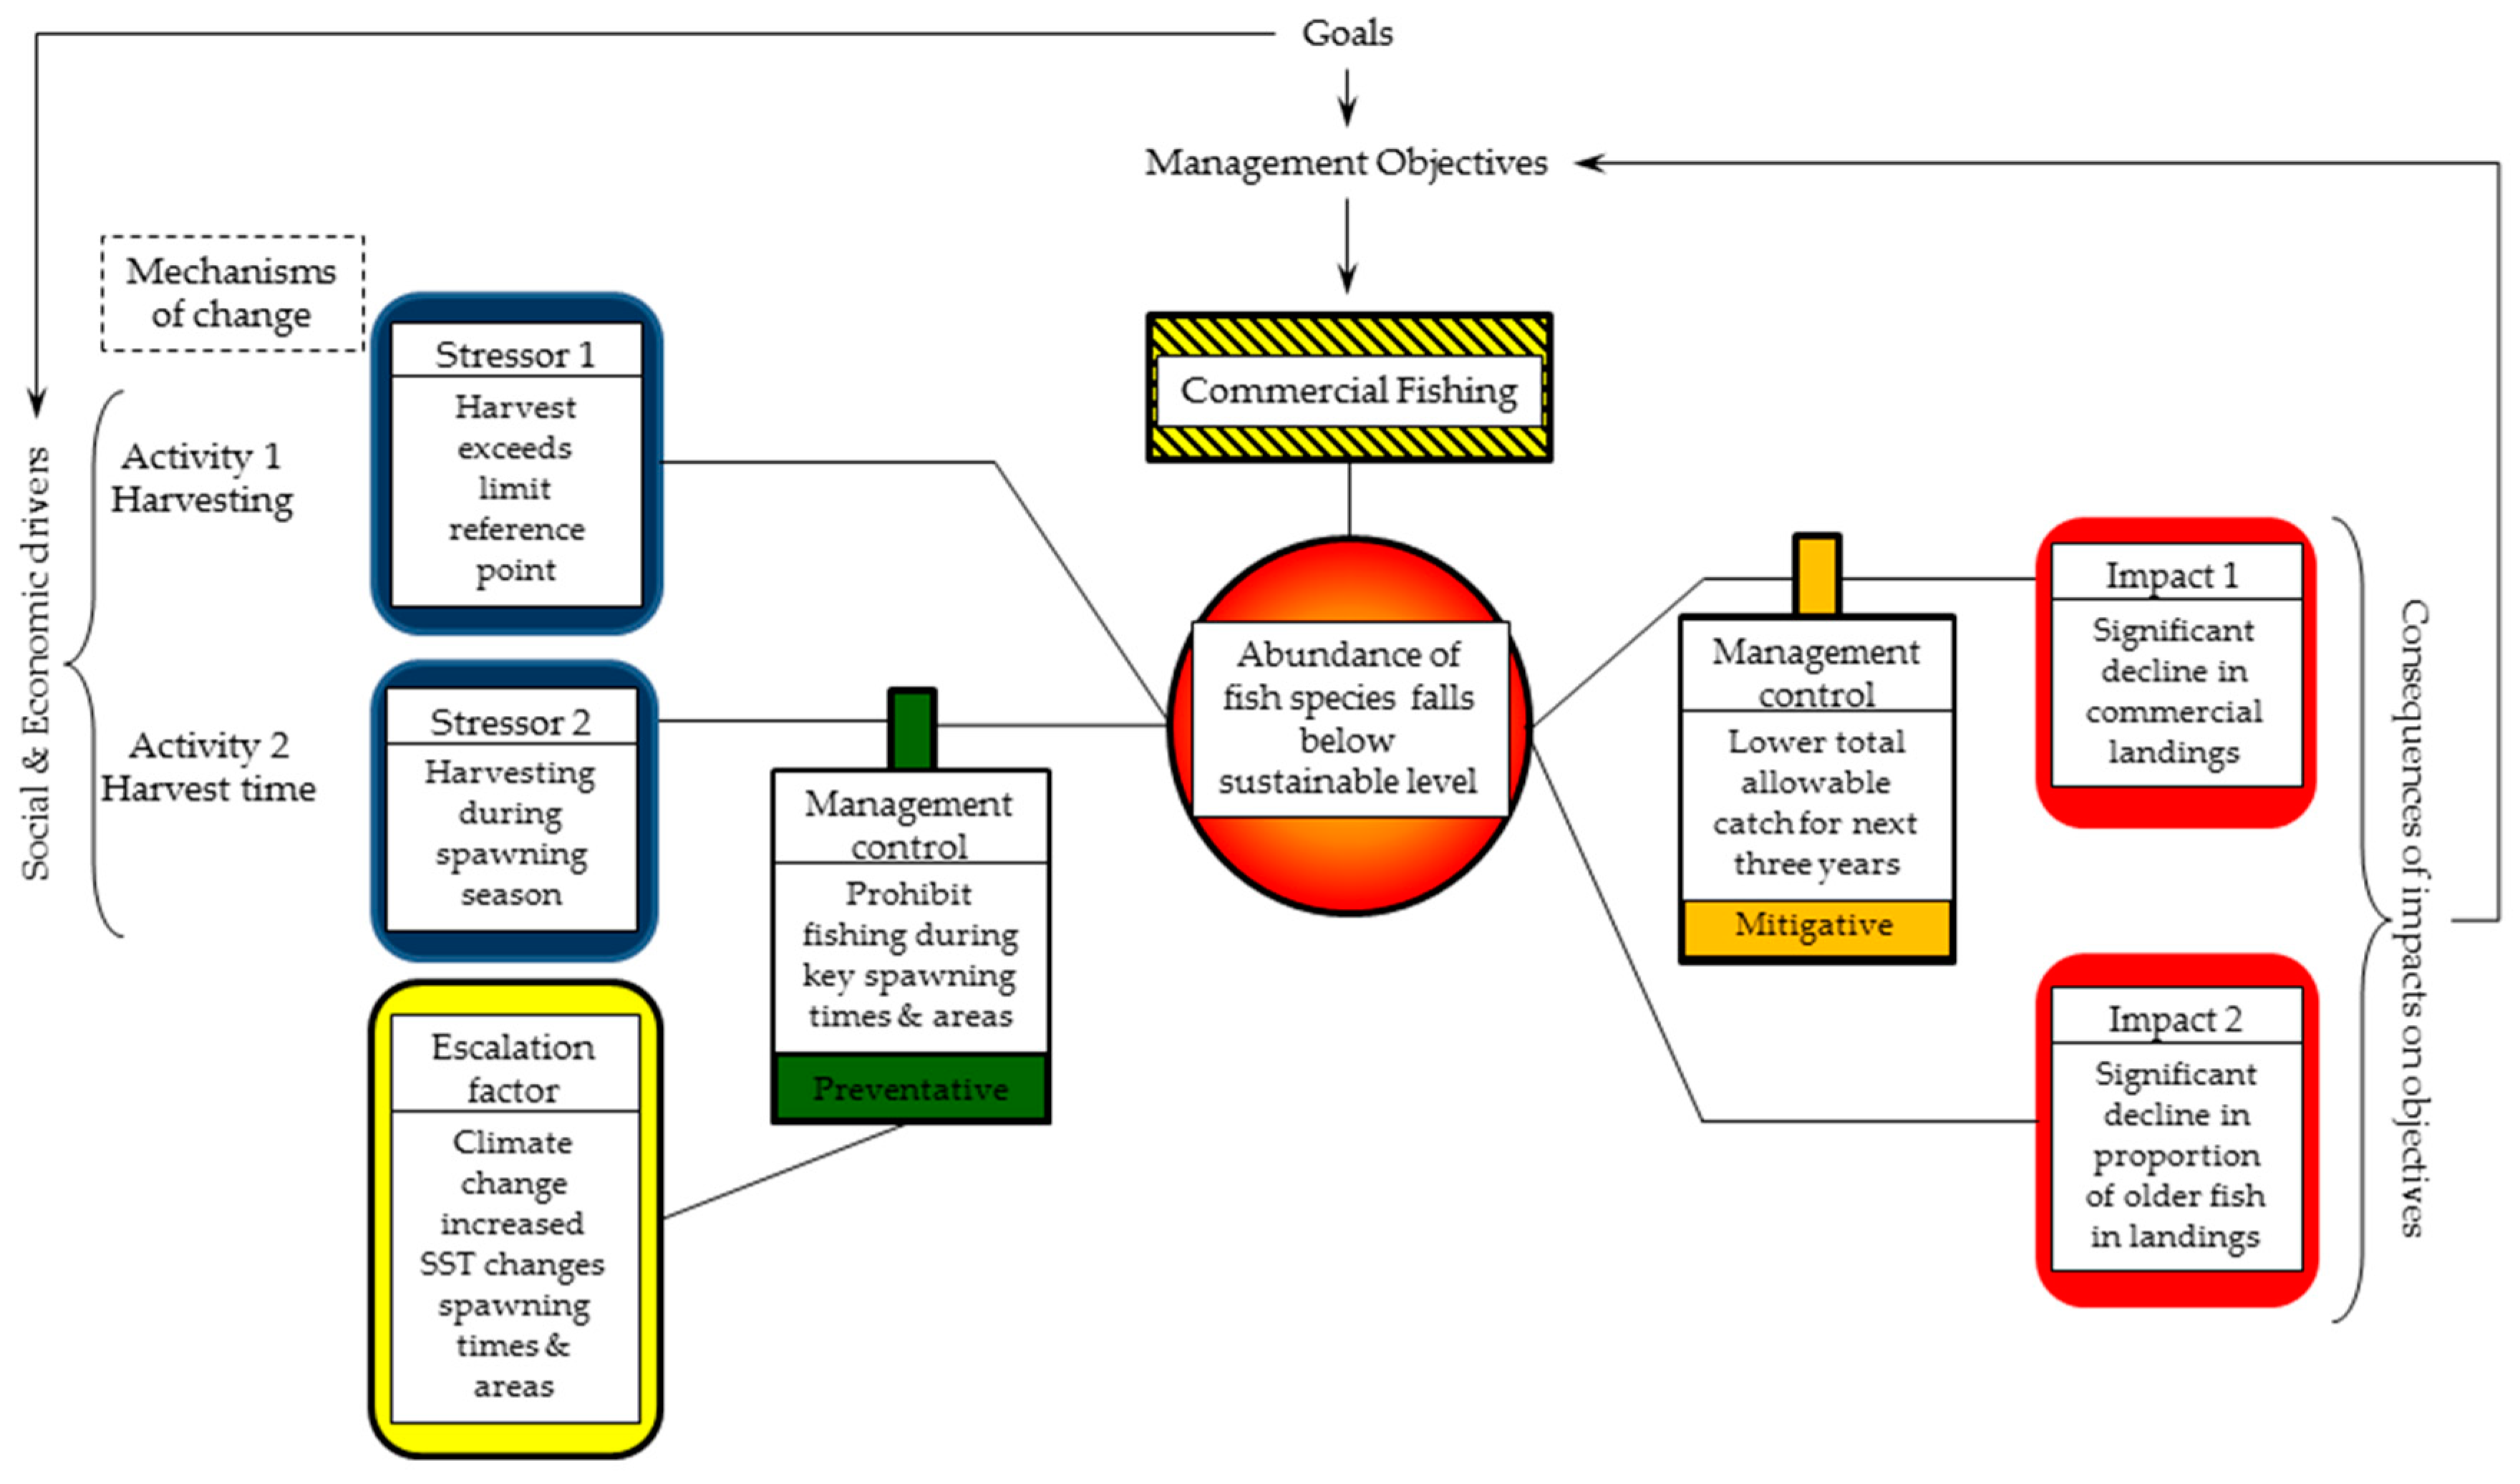
Bowtie analysis is one of the risk assessment techniques of the IEC/ISO 31010 [31]. It is a controls assessment method that forms part of the ISO 31000 risk management process [32]. The purpose of BTA 1 is to logically connect the relationships between management objectives, management controls, threats, potential impacts of threats on the fishery resource and the consequences of those impacts on achieving the management objectives. This provides a structure to identify and analyse all aspects of a management context and the biological and ecological components of fisheries resources that contribute to achieving or not achieving the management objectives [20,33,34]. BTA 1 has six elements—source of the risk (or hazard), undesirable event, causes of the undesirable event, impacts of the event, management controls and escalating factors (Figure 3) [32].
The source of the risk in BTA is the normal human activity management is overseeing, as per its legislative and/or policy mandates. In our case the source is commercial fishing. The undesirable event is the event management wants to avoid or minimise as a result of the operation of the human activity. The undesirable event is determined by the management or operational objectives for the fishery. For example, a management objective for NSW commercial fisheries is to prevent overfishing of target species by commercial fishing. The undesirable event to be avoided is the abundance of adults of a fish species being reduced to the point where there is an increased likelihood of recruitment failure [35].
The next component of a BTA is a list of the possible causes of an undesirable event, the left-hand side of the diagram (Figure 3). Terms such as “threats” or “pressures” are sometimes used instead of causes. However, in the context of NSW fisheries, we have found these terms to be too vague and confusing. Instead we broke down commercial fishing into its individual activities, such as harvesting, discarding, fishing effort, which represented the mechanisms [31] by which the undesirable event could occur. Each activity was then represented by a stressor, which could be measured. A stressor is a physical factor or process produced by an activity that may result in negative effects that can lead to an undesirable event occurring if the factor exceeds a predetermined unacceptable level [36,37]. For example, harvesting of a species that exceeds its limit reference point of a harvest strategy is a stressor that could lead to a decline in the abundance of the species that may lead to recruitment failure. There are two types of stressors in our bowtie analysis—human pressure (HP) and capacity to respond (CTR). Capacity to respond are the biological and ecological characteristics of a species that affects its capacity to respond to fishing pressure which could directly contribute to the undesirable event [38].
Moving to the right-hand side of the BTA (Figure 3), the next step is to list the possible impacts of the undesirable event. In traditional BTA these are usually called consequences [32]. But in an ecological risk management context there is a difference between impacts and consequences. The concept of impacts from the different perspectives of science and management has been discussed by [39]. Science seeks to measure impacts that help test hypotheses about how assemblages of species or populations function and what factors inhibit or facilitate these functions. Thus, science is about detecting whether an impact has occurred, irrespective of its effect on human values. Management needs to measure impacts in a way that identifies target ecological components and locations most in need of controls, i.e., from a management perspective, impact is about priorities according to achieving objectives. Thus, management is about interpreting whether impacts will have consequences on objectives to protect human values and then deciding what to do about it. If these two terms are not clearly distinguished it is easy to conflate them [40]. Therefore, we have defined these terms in the bowtie analysis to clearly distinguish impacts from consequences.
Impacts are significant changes in a fish population if the undesirable event occurs without management intervention. For example, one of the impacts of significant reductions in the adult population of a fish species is a decrease in the proportion of older productive individuals in the population [41,42]. Consequences are the effects of all significant impacts on the ability of management to achieve its objectives. For example, impacts of significant decreases in the proportion of older fish, in the average length of the adult population, significant change in the sex ratio of the population and size of fish at first capture, together have the effect that management will be unlikely to achieve its objective of preventing a species becoming ‘overfished’ (according to the NSW fisheries policy) by commercial fisheries. The distinction between impacts and consequences is that the consequence may not be realised as a result of one impact acting on its own but when multiple impacts are occurring together [20,34].
Preventative management controls (sometimes called management measures) are placed between causes and the undesirable event (Figure 3). These are the regulations, policies, guidelines and/or plans designed to prevent or reduce the likelihood a stressor will cause the undesirable event (left-hand side of the BTA). For example, setting a total allowable catch or total allowable effort quota is a preventive management control to ensure a fishery meets its harvest strategy objective for a species. Mitigative and recovery management controls are placed between the undesirable event and impacts (right-hand side of the BTA) (Figure 3). These are regulations, policies, guidelines and/or plans that reduce the magnitude (scale, duration, intensity) of the impacts or recover (restoration of damage) from the impacts if the undesirable event does occur. For example, a minimum legal length for an ‘overfished’ species is a recovery management control to rebuild a depleted fish population (e.g., [43]).
An escalating factor in BTA is an external factor (outside the control of fisheries management) that can potentially undermine the effectiveness of management controls, both preventative and mitigative. Escalating factors are natural or human activities or processes that may compromise the effectiveness of a management control or exacerbate stressors (Figure 3). Inclusion of external factors enables a fishery management context to link to the management contexts of other human activities outside its direct control and, therefore, account for the effects of multiple stressors potentially increasing the risk of not meeting the management objective of a fishery. For example, catchment run-off may produce the stressor of excessive nutrient loads leading to eutrophication in an estuary, which in turn impairs fish habitats. These impaired fish habitats may not adequately support the development of juveniles of fish species, leading to a reduction in its adult spawning biomass [44]. Natural events can also be escalating factors such as prolonged periods of drought, leading to reduced flows through estuaries and affecting dispersal of larvae to nearshore habitats for settlement and development [45,46].
4.2. Ecological Risk Assessment—Identifying Key Risk Factors
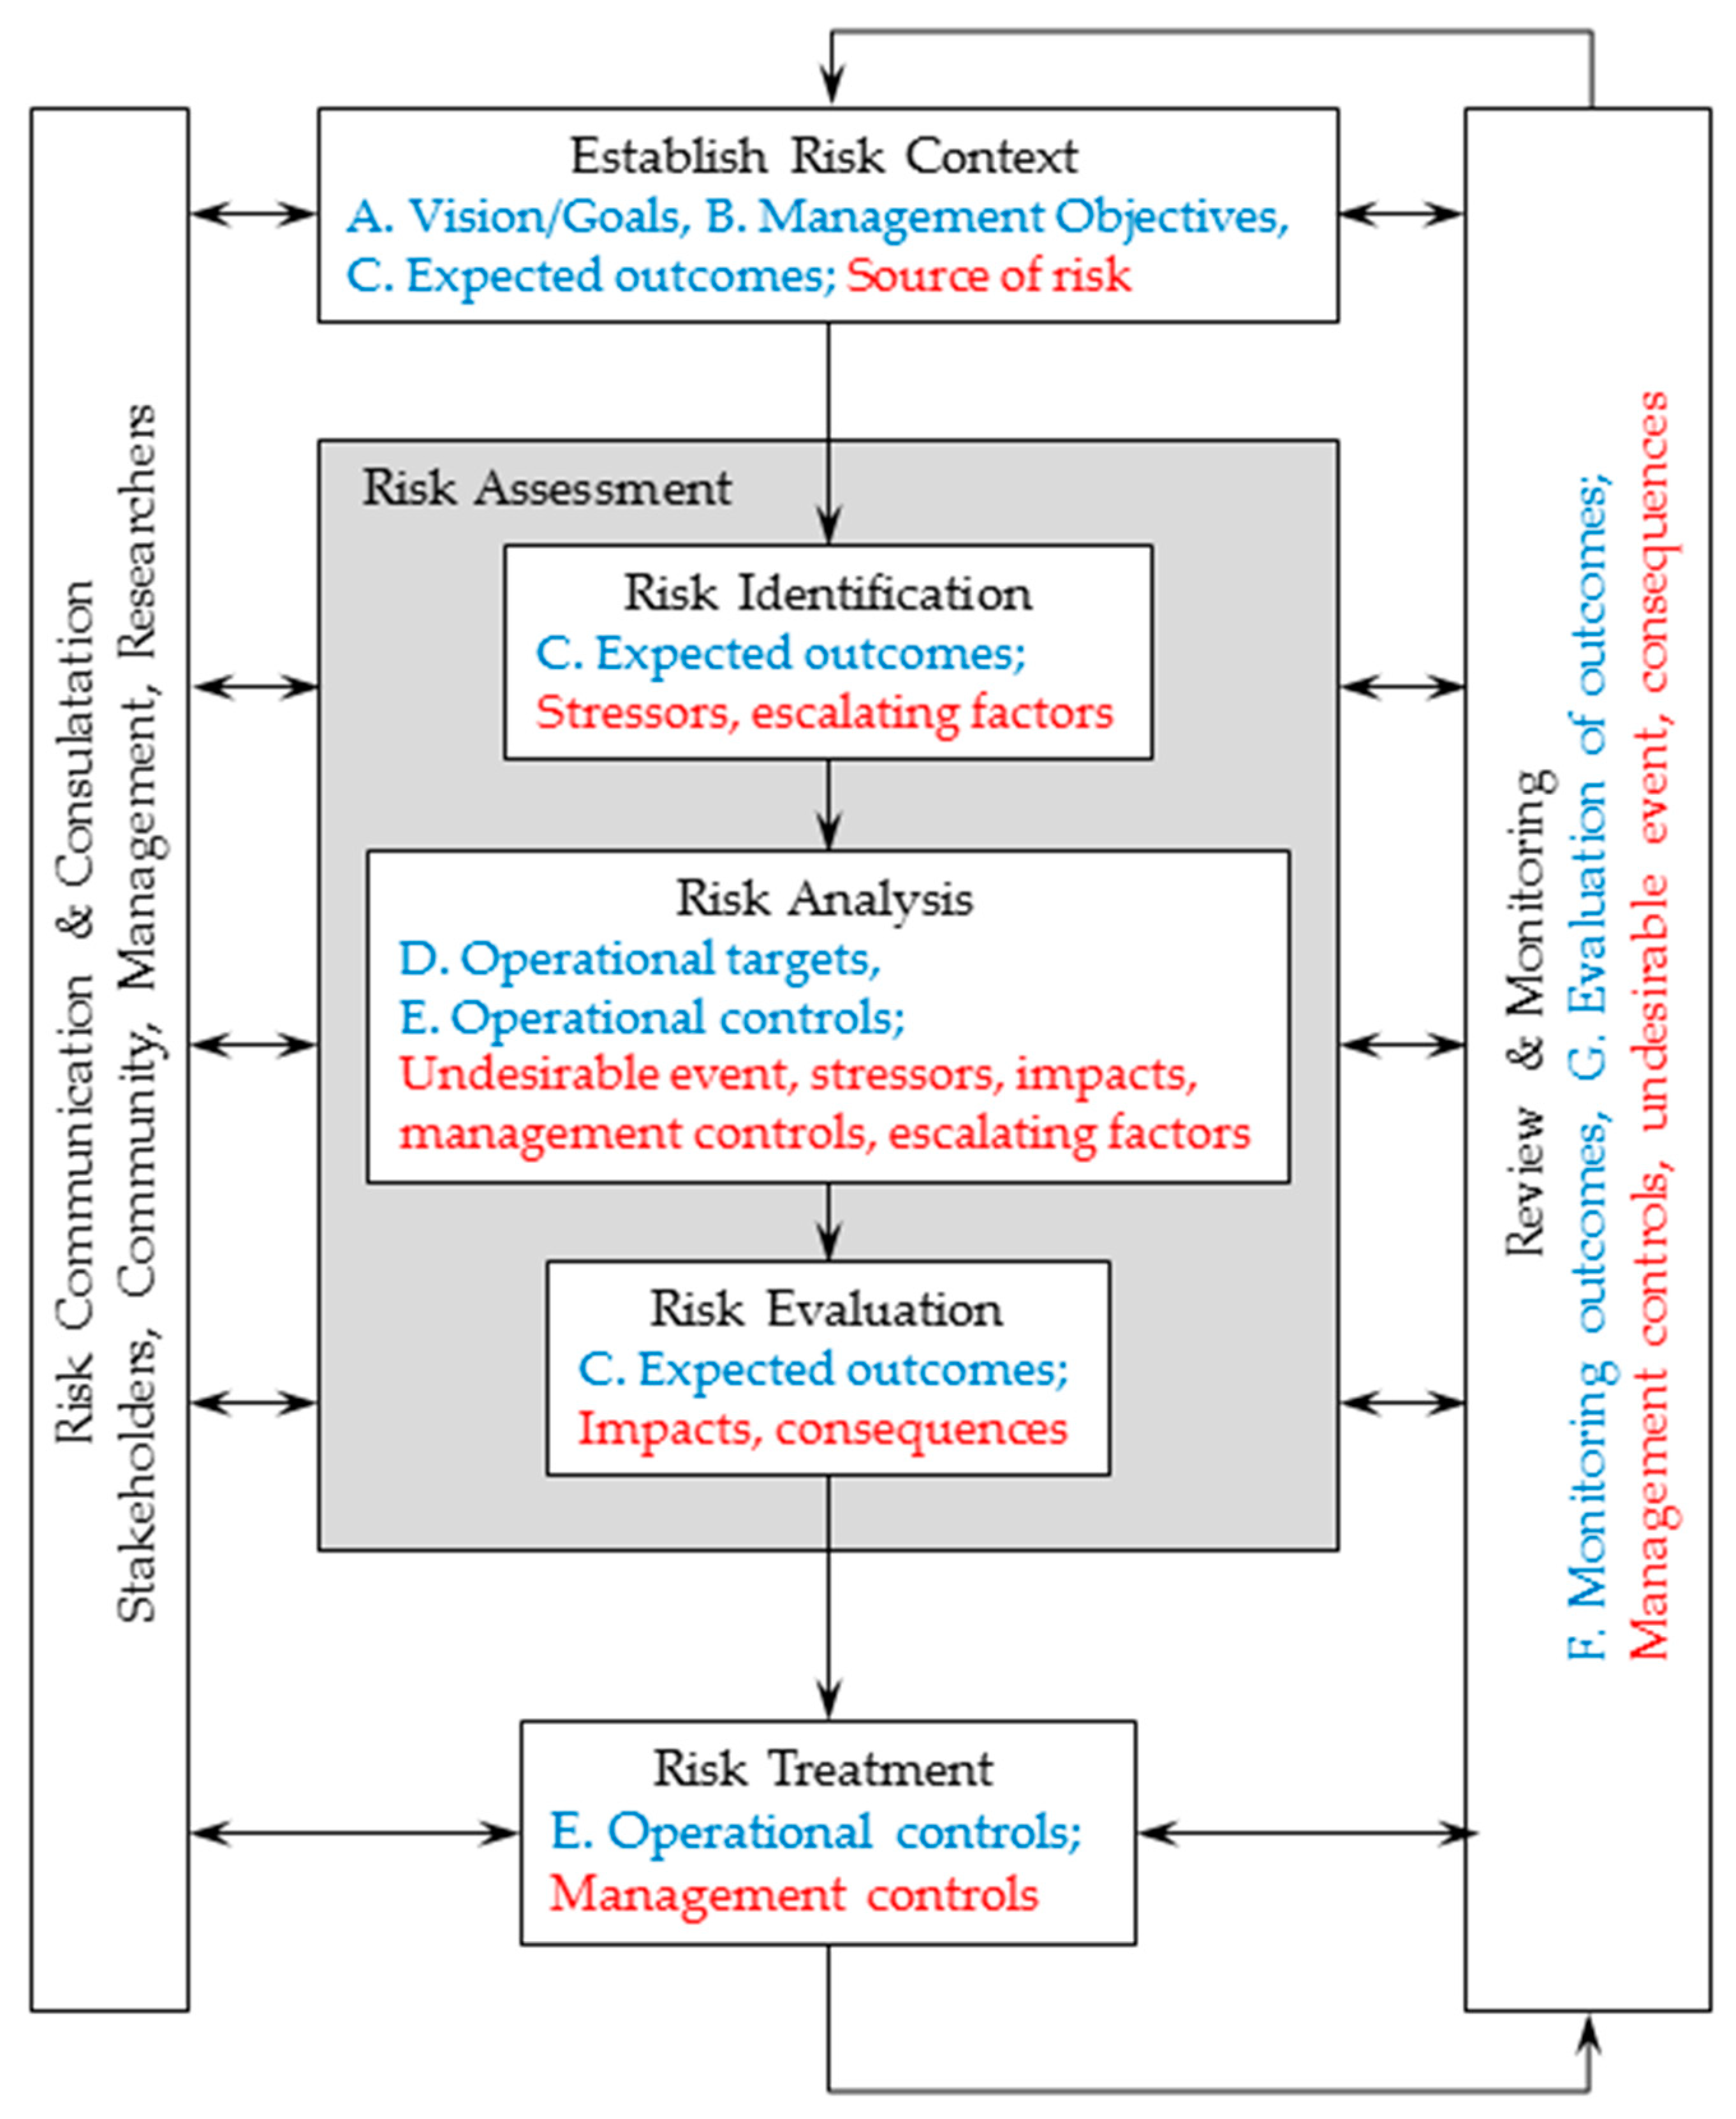
The BTA 1 structures the problems that management needs to assess. The components of BTA 1, stressors, management controls, impacts and escalating factors, contribute the factors for the ERA. These factors are evaluated by the ERA to determine the risk of a fishery being managed unsustainably. The purpose of an ERA [47] connected to a BTA is twofold. First, it assesses the level of risk of not achieving the management objectives for an ecological component (e.g., primary or targeted species of a fishery) under the current management context, and existing knowledge gaps in understanding the dynamics of the ecosystem and management operations. The level of risk enables management and research to prioritise the ecological components to be addressed. Second, and most importantly, the ERA identifies the risk factors contributing to the level of risk for each ecological component. These risk factors are the basis for determining effective risk treatments [26] which include management actions and filling key knowledge gaps. The risk factors are then fed into the second-stage BTA to evaluate how best to allocate effective management and research actions given limited resources. The ERA uses information from the fishery management context and BTA 1 in each of its stages (Figure 4).
Establishing the risk context is the most important [33] but often neglected stage in ERA. It provides the anchor point based on the policy objectives from which everything else flows. The context is set by policy, management and stakeholders and not science. One way to do this is to formulate risk context statements. The risk context statement defines the undesirable event the management objectives are seeking to avoid which occurs as a result of the source of risk being inadequately controlled, the consequence that will affect achieving the objectives and the spatial and temporal scale of the assessment. It uses the source of risk from BTA 1 and the goals, and management objectives from the fishery management context (Table 4). For example, for the management objective of keeping adult abundance of a target species above where recruitment failure could occur, the following risk context statement could be formulated.—The likelihood that fishing pressure [source of risk] has led to reduced adult abundance [undesirable event] such that the fish stock/population of species X will be unable to sustain its current abundance and distribution [consequence on objective] in New South Wales waters [spatial scale] over the next 20 years [temporal scale].
Risk context statements are similar to risk statements [33] but are more explicit about what the focus is of the ERA and the temporal and spatial scale of the assessment.
Risk identification describes the potential causes of the undesirable event and possible impacts if the event were to occur. The identification process uses the stressors, escalating factors and impacts from BTA 1 combined with research results and/or literature reviews to describe the direct or indirect relationships between stressors, the undesirable event and its impacts [20,33,34]. This stage provides transparency and justification for the risk factors in the ERA making it open to outside scrutiny [48]. It also gives the background level of detail that cannot be included in BTA 1 for reasons of simplicity.
Risk analysis assesses and assigns a level of risk to each species being examined; it gives the likelihood that the objectives for a species will be achieved, under current management controls, level of knowledge and a species’ capacity to respond. This stage uses the undesirable event, stressors, impacts and management controls from BTA 1 and operational targets and controls from the fishery management context. The level of risk is estimated by determining the pressure from fishing and other human activities being exerted on a species and the capacity of that species to respond to that pressure, referred to as human pressure (HP) and capacity to respond (CTR) respectively. Details of how HP and CTR components are estimated are given in [26] and the Supplementary Tables S1–S9 and will be demonstrated in the case study. Briefly, the level of HP is estimated by assigning a measure for each stressor (derived from research results and the literature review from the risk identification stage), a decision criteria for each measure as to whether it contributes to the human pressure or is unknown, and then summing all contributing stressors, including unknowns, expressed as a proportion of the total number of stressors used. If data or information are lacking for a stress measure it is assigned as unknown. Similarly, CTR is estimated by using the biological and ecological characteristics of a species that contribute to its ability to maintain, recover or adapt its abundance and distribution under HP, and the current condition of these characteristics. A measure for each characteristic is assigned, based on research results and the literature review, and decision criteria set for each measure to determine whether it contributes to its capacity to respond to the level of HP. If data or information is lacking for a characteristic, they are assigned as unknown. All characteristics of the CTR are summed and expressed as a proportion of the total characteristics used and added to the proportion of unknowns. The risk level for each species is then calculated by multiplying the scores for HP and CTR and then plotting that result as the Euclidean distance from the origin of a 5 × 5 matrix. The risk matrix design is consistent with the rules devised by [49].
The risk level is insufficient to give management and research the direction needed to make decisions about what to address to achieve the management objectives [33]. Therefore, the next step is crucial. Issues arising from the risk analysis stage identify and collate the factors contributing to the risk level for a species [26]. There are four types of risk factors—stressor/impact, management control, ecological and knowledge gaps. Stressor/impact risk factors are those stressors that are contributing to the level of human pressure on a species and indicate that the management controls in place for the stressor are failing in some way or lacking. These risk factors are identified by extracting all stressors that exceed the decision criteria for HP. Management control risk factors are those actions that contribute to either preventing the undesirable event or mitigating the impacts of the undesirable event. These factors are identified by extracting specific management controls that exceed the decision criteria for HP. Ecological risk factors are those characteristics that are contributing to lowering the level of CTR and may indicate that management controls mitigating or recovering the effects of an undesirable event are lacking or insufficient. These factors are extracted in the same way for stressor risk factors but from the CTR component. Knowledge gap risk factors are where data or information about stressors, management controls and/or characteristics are lacking. Knowledge gaps contribute to analytical uncertainty [50] in estimating the level of risk. These factors are identified by extracting all stressor management controls and characteristics scored as unknown from the HP and CTR components. All the prioritised risk factors are then fed into the second stage BTA.
4.3. Second Stage Bowtie Analysis—Evaluating Risk Factors for Effective Risk Treatments
The ERA has determined the likelihood a fishery is not being managed sustainably and all the risk factors in the management system that are contributing to the risk. But managers, scientists and stakeholders need to know where in the management system they occur in order to evaluate which factors would be most effective to address which forms the risk evaluation stage. For example, a knowledge gap about the magnitude of a stressor on the left hand side of a BTA, may need to be filled before an effective preventative management control can be developed. Therefore, BTA 2 represents each of the risk factor types, highlighting in a single diagram where all the issues are in a fishery management system. The structure of the second stage BTA (BTA 2) is the same as the first but is now populated with the results of the ERA (Figure 5).
The BTA 2 enables stakeholders, managers and researchers to evaluate each of the risk factors and assess which risk factors would be most important to address in order to lower the risk of not achieving the management objectives. This may require drilling down into the details of some of the risk factors. For example, a stressor risk factor would require examining the current preventative management controls in place to determine if anything could change to make it more effective, such as changing the selectivity of fishing gear to reduce the catch of undersize fish. Ecological risk factors could be used to determine better implementation of management controls, such as changing the location and timing of seasonal closures to better align with spawning periods. Knowledge gap risk factors can be evaluated to determine what research is required to improve the ERA or improve the effectiveness of management controls or develop recovery or mitigative management controls to reduce impacts. Clearly, given limited resources, not all risk factors can be addressed. The important aspect of the BTA 2 is that all the risk factors can be evaluated by everyone involved in a fishery to determine which are the most important to be addressed, what are the consequences on achieving the management objectives if some factors are not addressed and, therefore, which factors the stakeholders, managers and researchers are prepared to accept.
Risk treatment is the final step in the risk managment process (Figure 4). Once it has been decided which risk factors will be addressed, these can be placed into a risk factor/risk treatment platform [26]. The risk factor/risk treatment platform matches each of the prioritised risk factors with the most effective management and research tools. It also identifies which groups are responsible for or best suited to take responsibility for implementing the risk treatments, enabling authorities and groups outside the fishery management context to be incorporated. For example, a stressor risk factor of excessive nitrogen loads in an estuary may be impacting spawning sites for a species and decreasing successful egg development. Responsibility for controlling catchment inputs would be the local councils in the estuary and a state government authority, not the fishery management authority. Similarly, different research providers might be better equipped to address critical knowledge gap risk factors. For example, government fishery researchers may be better equipped to undertake research on the biology and ecology of fish species and impacts of fishing on long-term changes in the fish populations or stocks [51] whereas university research providers may be better suited to short-medium term research on impacts of heavy metal pollution on fish survival or development [52]. Importantly, the combination of the BTA 2 and the risk factor/risk treatment platform provides a logical justification to apply for funding and/or allocation of budgets to address key risk factors to lower the risk of not achieving the management objectives for a fishery.
5. Discussion
ERA in fisheries are used to determine a level of risk that species will not meet a fisheries management objective. But they have lacked the ability to specifically include and assess the effectiveness of management controls in determining the risk. By adding bowtie analysis, management controls (or lack of them) can be explicitly included and assessed as part of the risk. The combination of bowtie analysis and quantitative ERA provides a logical process to assess the effectiveness of management controls within a given system in achieving the sustainability objectives for a fishery. It goes beyond giving a level of risk, and its justification, for an ecological component. It provides a range of information for research and management to act on. Instead of a list of risk factors it shows the different types of factors and where in the management system these occur. Management and research can then target their responses in areas that will have the greatest effect in lowering the human pressure and increasing the sustainability of the fishery. For example, filling knowledge gaps about the effectiveness of preventative management controls may be a better use of resources and time before developing mitigative management controls to reduce impacts (see Appendix A for examples from the case study).
There are four advantages in using this combined BTA and ERA approach to implement sustainable fisheries management. First, BTA 1 links the whole fishery management system together. It includes the stressors, management controls and potential impacts of the undesirable event. Furthermore, it links the management system to the legislative and policy objectives of a fishery [20,33,34]. These linkages ensure that what is being assessed is relevant to management and puts the focus of the assessment on the undesirable event to be avoided as defined by legislation. By linking the whole fishery management system together, the BTA 1 stage can be conducted as a collaboration in consultation processes with stakeholders, managers, scientists and community members. Such collaboration is aided by the bowtie analysis software which enables all the players to work together to build the system step by step and end with a shared understanding of the system. This encourages learning, understanding, openness and meaningful input from all relevant groups, incorporating a range of different types of knowledge in consultation processes [53].
Second, the risk of not achieving the fisheries management objectives for a fishery is determined by incorporating all relevant components into the ERA. Stressors, management controls (preventative and mitigative) and impacts are all included in the ERA to assess the risk. This is in contrast to most ERA methods in fisheries in which only stressors and impacts are used in the assessment (Table 1) or the effect of management controls are considered after the ERA (e.g., [10]). By including all components of a management system in assessing the risk, the outputs of an ERA become a rich source of information to identify what is contributing to the level of risk. This is the most important aspect of an ERA. The risk level alone is necessary but insufficient to provide managers, stakeholders and scientists with the information needed to determine what to change in the management system to improve the sustainability of a fishery. By identifying the different types of risk factors in the ERA, the specific risk factors that need to be addressed to improve the sustainability of a system are clearly exposed.
Third, mapping the results of the ERA into the BTA 2 stage immediately highlights where in the fishery management system issues occur in a single diagram. In the mulloway case study (Appendix A), for example, the BTA 2 highlighted that knowledge about the effectiveness of the management controls for stressors and impacts was zero. In addition, it showed that escalating factors could interact with, and potentially undermine, 75% of the management controls for ecological factors. Thus BTA 2 enables clear communication and evaluation of the results of the ERA to stakeholders, managers, scientists and community members within the context of the whole fishery management system. Therefore, it provides a platform for open and honest discussion among all groups about what is working, what is not and why. This enables an evaluation of what are the important risk factors to address to improve the sustainability of the fishery management system. This leads to negotiation of which risk factors should be addressed given limited resources and the consequences on achieving management objectives of choosing not to address others.
Four, the approach integrates science and management into a single process, whilst respecting their different inputs and roles in the system. This streamlines the assessment process in contrast to other risk management methods in fisheries. For example, in the ecological risk management method of the Australian Commonwealth fisheries [54] key risk drivers, data deficiency and existing management measures are incorporated in a deliberative manner after the ecological risk assessment by two separate advisory groups, research and management. Whilst guidelines are provided to help with decision-making, the research and management do not appear to be integrated in a systematic way. But the combination of BTA 1, ERA and BTA 2 enables science and management to be integrated from the start and throughout the process. It allows for the development of solutions to issues that can be realistically implemented, monitored and analysed. Meaningful indices for monitoring and evaluation of the system can then be developed using the data from the ERA. The prioritised risk factors for action can be allocated to the appropriate management and research groups according to relevant expertise and responsibilities. Thus, risk factors are matched with the most effective risk treatments that are essential for effective risk management [26]. Consequently, the approach facilitates negotiation and allocation of responses to issues, giving a fishery management agency the logical reasons to engage appropriate groups to address risk factors inside and outside their jurisdiction. It also provides the justification for seeking funding to undertake management and research actions.
There are at least three challenges in using this bowtie ERA approach. First, assessing the sources of uncertainty and its effects on the outcomes is an important component of risk analysis. A thorough review by [55] of studies on cumulative effects assessment on marine ecosystems found that only a limited number actually assessed uncertainty. Astles [26] has identified several sources of uncertainty in the ERA method used in our paper. These uncertainties included the extent to which the relationship between stressors, stress measures and outcomes is correlative or causal, the nature of the relationships between characteristics, measures and their contribution to capacity to respond, decision criteria used, choice of measures used for the metrics, values of the measures, unknown interactions between stressors, ecological components or multiple human pressures and epistemic uncertainty [56]. How these uncertainties can be addressed is discussed at length in [26].
Second, compiling all the data and information for the comprehensive lists of stressors, ecological characters and management controls can be time consuming at first. The lists used for mulloway in the case study were deliberately inclusive of as many potential characteristics and stressors as available as a first pass. But further refinement of the lists is possible after in-depth consultation with fisheries scientists and managers. However, in reality the information required is no different to what would normally be used in fish stock assessments or qualitative deliberative assessments. The main difference is that the data is categorised and systematically organised to distinguish between different types of potential risk factors. Such a systematic approach actually reduces the time at the risk management stage because what is contributing to the risk immediately falls out of the ERA and clearly mapped onto the BTA 2. Decision making can then be focused on how to respond to the issues to achieve the sustainability objectives of the fishery rather than on trying to determine what the issues are.
Third, comprehensive lists of stressors and ecological characters can potentially generate false positive and false negative results in the ERA [26]. Including multiple stressors could over inflate the measure of pressure being exerted on a fish species and hence increase the perceived level of risk, leading to a false positive, identifying a high risk when it is actually low. To address this, the ERA method was biased towards detecting false positives by applying the precautionary principle in assuming there will be an interaction between a stressor and a species in the absence of contrary information. Also, conservative estimates in the decision criteria were biased towards detecting a contribution to a human pressure or not to the capacity to respond. These biases have been applied in other ERA methods for fisheries (e.g., [9]).
6. Conclusions
This paper highlights the importance of including the whole pathway of cause and effect when assessing the sustainability of a fishery management system. In particular, including the different types of management controls, preventative, mitigative and recovery, is essential for a realistic assessment of the risk a fishery is not being managed sustainably. The BTA/ERA combined method is effective in capturing and using the pathway to achieve this. The logical structure of the combined method helps ensure that all relevant components of a fishery management system are described and assessed.
At an operational level implementing sustainable fisheries management requires managers knowing what to change and/or maintain in the system in order to achieve their objectives. It also requires scientists knowing what to monitor in order to detect when and what might be causing the fishery to become unsustainable. The BTA/ERA method provides managers and scientists with this important information at these operational levels. BTA maps out the whole fishery management system, logically connecting sources of change, stressors, management controls and impacts to the undesirable event and the consequences of this on achieving the fishery objectives. This clearly identifies to managers and scientists which stressors and impacts are being managed and how, and which are not being managed. The ERA then assesses the likelihood that the system will achieve the sustainability objectives using measures and decision criteria of stressors, management effectiveness, ecological characteristics and impacts. These components of the ERA help managers and scientists develop meaningful indicators to monitor the operation of the system and highlight where there are important knowledge gaps to address to improve understanding of the system. Furthermore, the BTA/ERA method makes the operational level transparent to stakeholders and updateable with routine monitoring data and new information as management controls are modified [57]. It enables stakeholders to see what is being managed, why and how.
The BTA/ERA method is a valuable tool for stakeholder and community engagement. It makes the complexity of a fishery management system accessible to all. Rather than simplifying a fishery management system by stripping out important detail, the BTA/ERA method takes this detail and organizes it in a logical structure. It can be used to engage all the relevant players from the beginning of a review of a fishery to help build a collective understanding of the system and include everyone’s issues. This opens up channels of communication through a common language about the management system. Consequently, BTA/ERA enables managers, scientists, stakeholders and communities to communicate, evaluate, negotiate and allocate the most relevant issues to be addressed to implement sustainable fisheries management at an operational level.
Supplementary Materials
The following are available online at https://0-www-mdpi-com.brum.beds.ac.uk/2071-1050/10/10/3659/s1, Table S1: State scale human pressure stressors, measures, rationale, metrics, decision criteria, data and results for mulloway, Table S2: Example of metric calculation for catch trends of mulloway, Table S3: Example calculation of metric for the proportion of 3-yea-old fish in samples, Table S4: Example calculation of the proportion of mulloway caught at optimal size, Table S5: Example calculation of proportion of samples > minimal legal length (MLL) of mulloway, Table S6: Calculation of metrics for the proportional change in fishing days for mulloway, Table S7: Calculation of metric for the proportional change in catch rate using CPUE for mulloway, Table S8: Calculation of seagrass loss in estuaries accessible to mulloway, Table S9: Calculation of total nitrogen (TN) in estuaries accessible to mulloway, Table S10: State scale capacity to respond characteristics, measures, rationale, metrics, decision criteria and results for mulloway, Table S11: Marine bioregion scale of capacity to respond for the Tweed of characteristics, measures, rationale, metrics, decision criteria and results for mulloway, Table S12: Marine bioregion scale of capacity to respond for the Manning of characteristics, measures, rationale, metrics, decision criteria and results for mulloway, Table S13: Marine bioregion scale of capacity to respond for the Hawkesbury of characteristics, measures, rationale, metrics, decision criteria and results for mulloway, Table S14: Marine bioregion scale of capacity to respond for Batemans of characteristics, measures, rationale, metrics, decision criteria and results for mulloway. References [58,59,60,61,62,63,64,65,66,67,68,69,70,71,72,73,74,75] are mentioned in Appendix. References [76,77,78,79,80,81,82,83,84,85,86,87,88,89,90,91,92,93,94,95,96,97,98,99,100,101,102,103,104,105,106,107,108,109,110,111,112,113] are mentioned in Supplementary Materials.
Author Contributions
Conceptualization, K.A. and R.C.; Methodology, K.A.; Software, BowTieXP Advanced software (release version 8.4.1, 2017 CGE Risk Management Solutions); Validation, R.C.; Formal Analysis, K.A. and R.C.; Investigation, K.A. and R.C.; Resources, K.A.; Data Curation, K.A.; Writing—Original Draft Preparation, K.A.; Writing—Review and Editing, K.A. and R.C.
Funding
This research received no external funding.
Acknowledgments
We thank Jim Craig for providing fisheries catch data and Joe Neilson for calculating the marine park sanctuary zone data. We also thank Julian Hughes and John Stewart for providing helpful comments and three anonymous reviewers for significant improvements of the manuscript.
Conflicts of Interest
The authors declare no conflict of interest.
Appendix A.
Case study of a commercially fished species in New South Wales, Australia, Figure A1: Summarised bowties analysis stage 1, Figure A2: Summarised bowties analysis stage 2. Figure A3: Bowtie analysis stage 2 for mulloway, human pressure component, Figure A4: Bowtie analysis stage 2 for mulloway capacity to respond component.
Appendix A. Case Study of a Commercially Fished Species in New South Wales, Australia
The following case study of Argyrosomus japonicus, a commercially fished species in NSW, is provided to demonstrate how the BTA 1, ERA and BTA 2 methods work in practice. It should be noted that what follows is not an official assessment of the exploitation status of A. japonicus in NSW fisheries nor is it a formal evaluation of the effectiveness of the recovery plan put in place for the species in 2013. Rather, the case study is a working example of how the proposed method could be applied to a real commercial fish species.
A.1. Description of the Commercial Fish Species and Management Context
Argyrosomus japonicus (mulloway) is a coastal species found from the upper reaches of estuaries to depths up to 100–150 m offshore. Small juveniles are found in estuaries and nearshore coastal environments. Sub-adult and adult mulloway occur in estuarine and ocean waters. In estuaries, larger juveniles and sub-adult fish appear to be more abundant in the lower reaches where salinities are nearer to seawater. Large individuals are caught around the mouths of estuaries, in surf zones and around rocky reefs in offshore waters [51]. Mulloway grow to a large size and are relatively long lived. In NSW, the largest mulloway so far recorded was 168 cm TL and the maximum age is currently 34 years. Size at 50% maturity for males is 51 cm (2+ years of age) and for females at 68 cm (3+ years of age). Mulloway are thought to spawn at the mouths of estuaries between November and March in NSW [58]. There is believed to be one continuous stock along the east coast of Australia [59].
In NSW, significant catches of mulloway are taken by the Estuary General (EG), Ocean Hauling (OH) and Ocean Trap and Line (OTL) commercial fisheries. The Estuary Prawn Trawl (EPT) and Ocean Trawl (OT) fisheries also take mulloway as a bycatch species. Mulloway are a very important recreational fish species and catches by this sector are estimated to be larger than commercial landings in NSW [51,60]. Fishery and biological data for this species is substantially incomplete and, therefore, formal quantitative stock-assessment modelling and assessment is not possible. Therefore, Fisheries NSW has a adopted a criteria based resource assessment method of assessing the exploitation status of many of its data poor species [61]. These assessments include data and information from adjoining state fishery jurisdictions which cover parts of the stock range outside NSW [51]. Based on this method, mulloway’s current exploitation status is “overfished” for the following reasons [51]:
- age composition is indicative of an overfished stock;
- the spawning potential ratio is below the recommended threshold;
- fishing mortality is much greater than natural mortality; and
- length and age distributions are excessively effected by recruitment.
The three commercial fisheries Estuary General, Ocean Hauling and Ocean Trap and Line fisheries used in this case study were assessed under the management arrangements that operated up to November 2017. Under the restricted fishery regime, fishers can only enter these fisheries if they hold a commercial fishing license. The fisheries were predominantly managed by input controls that limit the amount of effort commercial fishers can put into their fishing activities, indirectly controlling the amount of fish caught [62]. These controls need to be continually modified in response to changes in fishing technology. Input controls in these fisheries include restrictions on the number of licenses, the size and engine capacity of boats, the types of methods, discarding protocols, when and where methods can be used, the number of fishing lines and/or hooks used, the construction and number of traps, the construction of and number of nets, spatial zoning of fishing operations, time and place fishery closures, and the areas and times at which fishers work [63,64,65]. From December 2017, these fisheries have been moved to share management regimes in which the number of shares fishers can hold is directly connected to the amount of catch and/or effort they can use [66]. However, many of the input controls from the old regime are, additionally, still applied.
In addition, to the above, in 2013 a species recovery plan was implemented for mulloway. Assessment of the stock indicated that the number of spawning fish was below the level considered critical for ongoing replenishment of the stock, fishing-related mortality on the adult (>70 cm fish) part of the stock was excessive and fishing-related mortality on juveniles excessive [43]. The goal of the recovery plan was to increase the spawning stock size of mulloway by reducing fishing mortality on both the adult and juvenile parts of the stock and instigated the following management controls:
- the recreational bag limit for mulloway was reduced from 5 to 2 fish;
- the minimum legal length for recreational and commercial fishing was increased from 45 cm to 70 cm;
- commercial Estuary General fishers using meshing nets have a by-catch allowance (possession limit) of 10 fish between 45 and 70 cm;
- a 500 kg possession limit for commercial Ocean Hauling.
A.2. Methods
A.2.1. Stage 1 Bowtie Analysis
The bowtie analyses were done using the software BowTieXP Advanced software (release version 8.4.1, 2017 CGE Risk Management Solutions). Under the source of risk of commercial fishing the undesirable event to be avoided was the abundance of adult mulloway being reduced to the point where there is an increased likelihood of recruitment failure. The left-hand side of the BTA for HP was constructed by disaggregating commercial fisheries into their component activities. The stressors produced from these activities that could contribute to the undesirable event were then identified. For example, the activity of harvesting produces a stressor of extraction of biomass that exceeds a limit reference point. This would include all commercial fisheries in NSW that capture mulloway, i.e., estuary general, estuary prawn trawl, ocean trawl, ocean haul, and ocean trap and line. Between each stressor and the undesirable event any preventative management controls in place were identified from the management strategies for each fishery. For example, preventative management controls for discarding included minimum legal length, gear configurations of bycatch reduction devices, discarding protocols and gear selectivity. Again this included all commercial fisheries that capture mulloway. In addition, recreational fishing activities, habitat loss and estuarine water-quality conditions were also included as part of the HP on mulloway. Finally, any escalating factors that could undermine the effectiveness of preventative management controls were identified from literature searches and added to the appropriate controls.
The right-hand side of the BTA for HP shows the potential impacts on the fisheries and fish population dynamics if the undesirable event were to occur. These were identified from the scientific literature and reports of Fisheries NSW. Any mitigative management controls were identified from the management and monitoring strategies in place.
The capacity of mulloway to respond to human pressures had its own bowtie analysis in which the biological and ecological characteristics of mulloway are used to determine whether their CTR is low. Using the chaining tool of BowTieXP the CTR bowtie is linked to the main bowtie as a CTR stressor type. The CTR of a species is a factor that can contribute to the undesirable event occurring. A similar process to constructing the left-hand side of the HP bowtie was done for the CTR bowtie. Mulloway’s biological and ecological characteristics were identified from the scientific literature that contribute to its capacity to respond to the human pressure being exerted on it. These included spawning type, reproductive effort, spawning site protection, breeding span and site fidelity. Preventative management controls in place to maintain these characteristics were identified from a wide range of habitat protection and fishing activity management plans in place. Escalating factors that could undermine these controls from the scientific literature were also added.
A.2.2. Ecological Risk Assessment (ERA)
The ERA used measures of the stressors, management controls and/or impacts to assess the level of human pressure being exerted on mulloway. These measures, their rationale and decision criteria are detailed in Supplementary Tables S1–S9. Human pressure data for the ERA were obtained from a variety of sources. Annual catch rates, effort and landings were extracted from the commercial landings database collected by Fisheries NSW. Length data were provided by the long-term port monitoring program run by Fisheries NSW in which fish lengths of commercial catches are made at regional fishermen’s cooperatives and the Sydney Fish Markets. Only samples in which >99% of fish were measured were used, which excluded 6% of the total data set. In 2009, there was a change in the way commercial fishers reported their catch and all commercial fishery data used were from 2009 onwards. However, some stressors at some spatial scales were not measured every year, such as length data, and so only data for the last four years were included. Recreational fishing data were obtained from the NSW section of two recreational fishing surveys completed in 2000/2001 and 2013/2014 financial years, the latter being the most recent [60]. Environmental data on the water quality of estuaries was obtained from the monitoring, evaluating and reporting program for assessing the condition of NSW estuaries [67]. Spatial data of estuarine habitats was obtained from vegetated habitat mapping surveys conducted by Fisheries NSW [68]. All spatial data were standardised as proportions of total areas of each of the five NSW marine bioregions for the regional scale or all NSW coastal and estuarine waters for the state scale.
Measures were determined from the above data sources by calculating metrics for each stressor, management control or impact (hereafter referred to collectively as stressors). A metric-based approach allows a greater range of data to be used in data limited fisheries compared to model-based stock assessment methods [69]. For all stressors that had a time element (e.g., landings over time) a metric was derived that captured the proportional change in magnitude over the time period and the frequency (number of years) showing decline or increase within that period. If both the magnitude of cumulative proportional change and the frequency was greater than pre-determined precautionary decision criteria then the stressor was contributing to the HP on mulloway. For stressors that did not have a time element (e.g., optimal size at first capture) metrics were calculated as proportions for the latest year of data. For example, optimal size at first capture taken in each fishery was determined as the proportion of samples between 80–100 cm total length.
The ERA used measures of the biological and ecological characteristics of mulloway and its habitats to determine the level of CTR. These measures, their rationale and decision criteria are detailed in Supplementary Tables S10–S14. Metrics were based on reproductive resilience and environmental condition data. Reproductive resilience is the capacity of a population to maintain the level of reproductive success needed for long-term population stability despite human and environmental perturbations [38,70]. Data were obtained from published scientific literature on mulloway, government status reports and assessments and spatial data of marine habitats and sanctuary zones. All spatial data were standardised as proportions of total areas of marine bioregions or marine state waters.
CTR and HP metrics were calculated at two spatial scales—statewide and bioregion (mulloway is commercial fished in four of the five marine bioregions within NSW). This enabled risk levels to be determined at two scales. Issues arising were identified from the HP and CTR analyses. These were divided into the different types of risk factors. Stressor/impact risk factors were identified by extracting all measures that scored a 1. Knowledge gap risk factors in the HP analysis were identified by extracting all measures that were labelled “U”. Ecological risk factors were identified from the issues arising from the CTR analysis by extracting all measures of biological and ecological characteristics that scored a 0, indicating that these were insufficient to contribute to mulloway’s capacity to respond to human pressure. Ecological knowledge gap risk factors were identified by extracting all biological and ecological characteristics labelled “U” from the CTR analysis.
A.2.3. Stage 2 Bowtie Analysis
The results of the ERA for mulloway at the state scale were applied to the BTA 2. The BTA 2 showed where all the different risk factors discussed above occur in the whole management system. This was done very simply in the Bowtie Advanced software by changing the colours and fills according to the types of risk factors and revealing the descriptions of the risk factors in each of the boxes of the bowtie. To keep it simple for the purpose of the paper, the BTA 2 was not differentiated into the different commercial fishing sectors.
A.3. Results
A.3.1. Stage 1 Bowtie Analysis
Figure A1 presents a summarised form of the BTA 1 to make it visually clear [21]. There were 13 HP stressors that could potentially contribute to this undesirable event (Figure A1). These stressors included harvesting exceeding control rules, discarding, unreported catch, expanding fishing areas, increase in the number of fishers targeting mulloway, harvesting during the spawning season, recreational harvesting exceeding commercial, mortality from recreational fish hooking, spearfishing targeting older larger fish and impaired habitats for adult and juvenile survival. One escalating factor was also contributed. Climate change stressors, such as increased sea surface temperate, are escalating factor stressors that may change the distribution of the species and, therefore, could affect the distribution of fishing areas and effort within and among estuaries and ocean zones.
Figure A1.
Summarised Bowtie analysis stage 1 for mulloway, combining human pressure and capacity to respond components and showing the percentage (number) of measures used. Colouring is consistent with that used in Figure 3 and Figure 5. Comm. F—commercial fishing, Rec F—recreational fishing, Hab—habitat, CC—climate change, Ad—adult, Juv—juvenile (including larvae), HC—harvest control rule, WQ—water quality, Popn—population dynamics, OF—overfishing/overfished, Data Q—data quality, Preventative, M—mitigative.

There were 14 management controls to prevent or minimise stressors from leading to the undesirable event (Table A1). Four harvest control rules, including those of the recovery plan, are in place to limit harvesting. Five gear and fisher behaviour controls were used to reduce discarding and one spatial control to limit fishing intensity. Four stressors had no specific preventative management controls outside the general input controls of the fisheries—harvesting during spawning season, increased recreational fishing effort, and habitat loss for juvenile and adult habitat.

Table A1.
Summary of the number of stressors, characteristics, management controls and escalating factors included in the bowtie analysis stage 1 for mulloway. HP—human pressure, CTR—capacity to respond.
Table A1.
Summary of the number of stressors, characteristics, management controls and escalating factors included in the bowtie analysis stage 1 for mulloway. HP—human pressure, CTR—capacity to respond.
| Component | Management Controls—Preventative | Escalating Factors | Management Controls—Mitigative | ||||||
|---|---|---|---|---|---|---|---|---|---|
| HP Stressors: | 13 | 1 | Impacts: | 10 | |||||
| Commercial fishing | 6 | 10 | Biomass | 2 | |||||
| Recreational fishing | 4 | 3 | Population dynamics | 4 | |||||
| Habitat | 3 | 1 | Overfishing | 2 | |||||
| CTR Characteristics: | 23 | 1 | Overfished | 1 | |||||
| Adult | Juvenile | Spatial | 3 | 3 | Data quality | 1 | 1 | ||
| Fixed | 5 | Harvest control | 2 | 2 | |||||
| Population dynamics | 6 | 1 | Water quality | 1 | 1 | ||||
| Habitat | 5 | 2 | |||||||
| Climate change | 3 | 1 | |||||||
Twenty three characteristics were used to assess CTR, 19 for adults and four for juveniles (Table A1). These included fixed biological characters, population dynamics, habitat metrics and climate change effects. Six preventative management controls were in place for CTR characteristics and one escalating factor.
There were 10 potential impacts resulting from the undesirable event that had effects on biomass, population dynamics, overfishing, overfished and data quality. There were no clear mitigative management controls identified for these impacts, except for data quality (Table A1).
A.3.2. Ecological Risk Assessment
The risk of not achieving the management objective for mulloway at a state level was moderately high (Table A2). But at a regional scale the risk level was moderately high for the Tweed marine bioregion and moderate for the Manning, Hawkesbury and Batemans marine bioregions (Table A2).
Table A2.
Scores of the results for the ERA of mulloway for state and bioregions. HP—human pressure, CTR—capacity to respond, M—moderate, MH—moderately high.
Table A2.
Scores of the results for the ERA of mulloway for state and bioregions. HP—human pressure, CTR—capacity to respond, M—moderate, MH—moderately high.
| Scale | HP | CTR | Risk Score | Level |
|---|---|---|---|---|
| State | 0.81 | 0.66 | 0.53 | MH |
| Bioregion: | ||||
| Tweed | 0.69 | 0.79 | 0.55 | MH |
| Manning | 0.48 | 0.52 | 0.25 | M |
| Hawkesbury | 0.68 | 0.53 | 0.36 | M |
| Batemans | 0.58 | 0.53 | 0.31 | M |
At the state scale, 10 stressor/impact risk factors, two pressure stressors and eight impact stressors, were identified as contributing to the MH level of risk. Impact stressors indicate that the undesirable event could be occurring to some extent due to cumulative effects of pressure stressors that at present are not able to be measured. For commercial fishing compliance to harvest control rules in some sectors contributed to the human pressure on mulloway. Fishers possessing more than 10 fish between 45–70 mm were estimated to be high [71] for Estuary General using commercial mesh net methods. This indicates that these fishers are not changing their practices to comply with the new rules. However, there is currently no actual data of the number of fishers complying with this harvest control rule (HCR). Recreational discarding had increased which may include fish that were gut hooked. Studies have shown that gut-hooked mulloway have low survival rates [72], although the use of circle hooks can minimize gut hooking. However, the proportion of gut-hooked fish released in recreational fishing is unknown.
Impact stressors at the state scale included declines in landings for commercial and recreational fisheries, changes in catch composition in some commercial sectors, altered population structure and changes in catch rates. The cumulative proportional change in landings of mulloway for estuarine and coastal fisheries between 2009/2010 to 2016/2017 was negative and there were five years of declining landings during this period. Similarly, recreational line fishing in estuaries and coastal areas also declined. The catch composition of the Ocean Trap and Line fishery using handline methods showed the cumulative proportional change of mature 3-year-old fish was negative between 2011/2012 to 2016/2017 with two years of declines during this period. Size at first capture for Estuary General using commercial mesh net methods and Ocean Trap and Line using handline methods showed that the proportion of fish in samples at the optimum size range was very low (0.08 and 0.082 respectively) in 2016/2017. In addition, the cumulative proportional change of fish less that the minimum legal length (MLL) was very large (0.77) and there were three years in which this proportion increased. This may indicate that the size selectivity for commercial mesh nets for mulloway is inadequate. The level of fishing mortality was determined to be much greater than natural mortality [51] which is a reflection in part of the above stressors.
At the state scale there were 21 knowledge gap risk factors for stressors across commercial and recreational fishing. In commercial fisheries there is a lack of information across multiple fishing sectors for compliance to harvest control rules, level of harvesting during the spawning season, rates of discarding, gear selectivity in excluding undersize fish, operational effectiveness of bycatch reduction devices in trawl fisheries and unreported catch. In recreational fishing knowledge gaps exist for compliance to harvest control rules, the proportion of large (>80 cm) fish taken by spearfishers, proportion of fish released with gut hooks, and the total annual harvest of recreational catch of mulloway taken by all methods (including charter and spearfishing). In addition, the extent of habitat damage from estuarine and ocean trawling and habitat loss in estuaries is also unknown. Such losses and damage may affect mulloway abundances indirectly by impacting prey availability to larvae, juveniles and adults. Two escalating risk factors were the effects of climate change stressors (e.g., increase in sea surface temperature) on the distribution of mulloway among estuaries and coastal areas [73] which may result in fishers changing their fishing grounds and the level of targeting of the species by commercial and recreational sectors.
At the state scale there were 13 ecological risk factors. Five of these are relatively fixed in that they are unlikely to change by management intervention. These were extent of parental care, period spent spawning and gonad development, adult migration and spatial life cycle using more than one ecosystem to complete their life cycle. Other ecological risk factors that could respond positively to management intervention were spawning potential ratio, breeding span, juvenile and adult habitat protection and successful recruitment. Breeding spans for estuarine and coastal samples (35% and 36% respectively) were below that expected if a proportion of fish were able to reach their maximum size. Habitat protection in sanctuary zones within marine parks for spawning areas, juvenile and adult foraging areas were 1%, 16% and 3% respectively. Successful recruitment of 2-year olds into estuarine fisheries has had a cumulative percentage decrease of 34% over the last three years and in Ocean Trap and Line all line methods 100%. The spawning potential ratio was substantially less than the desired 25% (11–17%) [51] that is in part a reflection of some of the above ecological risk factors.
At the state scale, this identified 12 ecological knowledge gaps. Seven of these knowledge gaps were proportion of spawning sites available outside sanctuary zones in minimally disturbed areas, sex-specific breeding spans, proportion of larval recruitment to estuaries, site fidelity of juveniles within fished estuaries across the state, feeding behaviour of adults, operational sex ratio (current versus pre-decline stocks) and genetic structure of east coast populations. Five knowledge gaps related to the effects of climate change on the spawning, breeding probability, recruitment, development and diet of the species.
At regional scales, three stressor risk factors were the same in all four marine bioregions but differed in magnitude. These were an increase in proportion of fishing days for Ocean Trap and Line all-line methods, declines in the proportion of landings for EG commercial mesh net methods and Ocean Trap and Line all line methods. The Tweed and Hawkesbury bioregions had the largest number of stressor risk factors (8 and 7 respectively) contributing to their moderately high risk levels. The Tweed and Hawkesbury bioregions had the largest cumulative decline in all line catches by the OTL fishery but for commercial mesh net methods in the EG fishery the largest declines occurred in regions 3 and 4 within the Manning bioregion. The largest proportion of fish below the MLL in samples was recorded for the Hawkesbury bioregion but there was no data for this metric for the Tweed and Batemans bioregions. Tweed had the largest proportion of estuaries with high to very high nutrient inputs and the largest loss of seagrass habitat.
Four ecological risk factors were common among regional scales. Three were related to habitat protection within sanctuary zones, being spawning sites, juvenile habitats and adult foraging areas. The largest proportion of habitat that was protected occurred in the Batemans marine bioregion for juvenile habitat of 13%. The remaining protected areas were less than 4% and in the Tweed marine bioregion less than 3%.
The common thread in knowledge gap risk factors for HP and CTR was the lack of consistency in data across the bioregions and estuaries. Data for some measures were only available in some bioregions or estuaries at some times, but not always the same estuaries or bioregions across time.
A.3.3. Stage 2 Bowtie Analysis
Figure A2 presents a summarised form of the BTA 2 to make it visually clear [21] and the complete bowties are presented in Figure A3 and Figure A4. Examining the CTR section of BTA 2 shows there are currently 11 (47.8%) ecological characteristics contributing to mulloway’s low capacity to respond to human pressures and nine (39%) characteristics for which there is no information. The CTR score could change, increase or decrease, if these knowledge gaps were filled. The majority of the management control preventive risk factors for CTR had poor to very poor effectiveness. The escalating factor of climate change potentially interacted with six of these preventative management controls indicating that the effectiveness of these controls could be undermined as climate change impacts on the east coast of Australia increase over time.
Figure A2.
Summarised bowtie analysis stage 2 for mulloway, combining human pressure and capacity to respond components showing the percentage (number) of different risk factors. Colouring is consistent with that used in Figure 3 and Figure 5. RF—risk factor, Non RF—non risk factor, KG—knowledge gap, MC interactions—management controls interacting with escalating factors, Po—poor, VP—very poor.

The HP section of BTA 2 includes the stressor and impact risk factors. Three (21.4%) stressors and five (50%) impacts are contributing to the human pressure on mulloway. There are eight (57.1%) stressors and two (20%) impacts for which there is no information. Consequently, the HP score could increase or decrease if these knowledge gaps were filled. This could substantially affect the level of risk that mulloway is not being sustainably managed. What is most striking is the lack of knowledge about the effectiveness of all the management controls currently in place for human pressures. Research into the effectiveness of these management controls as they actually operate within the fisheries could improve the HP score and hence risk level, by reducing the analytical uncertainty. The escalating factor of climate change potentially interacts with only one of the management controls. But as more understanding about climate change escalation factors becomes available, interactions with management control effectiveness may become more complex [74].
Figure A3.
Bowties analysis stage 2 for mulloway, human pressure component. For colouring key see Figure 3. Risk factors (RF): ![Sustainability 10 03659 i001]() —stressor RF,
—stressor RF, ![Sustainability 10 03659 i002]() —stressor knowledge gap RF,
—stressor knowledge gap RF, ![Sustainability 10 03659 i003]() —Non RF,
—Non RF, ![Sustainability 10 03659 i004]() —preventative management control knowledge gap RF,
—preventative management control knowledge gap RF, ![Sustainability 10 03659 i005]() —mitigative management control knowledge gap RF,
—mitigative management control knowledge gap RF, ![Sustainability 10 03659 i006]() —biomass impact RF,
—biomass impact RF, ![Sustainability 10 03659 i007]() —population structure impact RF,
—population structure impact RF, ![Sustainability 10 03659 i008]() —overfished impact RF,
—overfished impact RF, ![Sustainability 10 03659 i009]() —overfishing impact RF,
—overfishing impact RF, ![Sustainability 10 03659 i010]() —Data impact RF.
—Data impact RF.
 —stressor RF,
  —stressor knowledge gap RF,
  —Non RF,
  —preventative management control knowledge gap RF,
  —mitigative management control knowledge gap RF,
  —biomass impact RF,
  —population structure impact RF,
  —overfished impact RF,
  —overfishing impact RF,
  —Data impact RF.
Figure A3.
Bowties analysis stage 2 for mulloway, human pressure component. For colouring key see Figure 3. Risk factors (RF): ![Sustainability 10 03659 i001]() —stressor RF,
—stressor RF, ![Sustainability 10 03659 i002]() —stressor knowledge gap RF,
—stressor knowledge gap RF, ![Sustainability 10 03659 i003]() —Non RF,
—Non RF, ![Sustainability 10 03659 i004]() —preventative management control knowledge gap RF,
—preventative management control knowledge gap RF, ![Sustainability 10 03659 i005]() —mitigative management control knowledge gap RF,
—mitigative management control knowledge gap RF, ![Sustainability 10 03659 i006]() —biomass impact RF,
—biomass impact RF, ![Sustainability 10 03659 i007]() —population structure impact RF,
—population structure impact RF, ![Sustainability 10 03659 i008]() —overfished impact RF,
—overfished impact RF, ![Sustainability 10 03659 i009]() —overfishing impact RF,
—overfishing impact RF, ![Sustainability 10 03659 i010]() —Data impact RF.
—Data impact RF.
—stressor RF, —stressor knowledge gap RF, —Non RF, —preventative management control knowledge gap RF, —mitigative management control knowledge gap RF, —biomass impact RF, —population structure impact RF, —overfished impact RF, —overfishing impact RF, —Data impact RF.
Figure A4.
Bowtie analysis stage 2 for mulloway, capacity to respond component. For colouring key see Figure 3. Risk factors (RF): ![Sustainability 10 03659 i011]() —Non RF,
—Non RF, ![Sustainability 10 03659 i012]() —ecological RF,
—ecological RF, ![Sustainability 10 03659 i013]() —ecological knowledge gap RF,
—ecological knowledge gap RF, ![Sustainability 10 03659 i014]() —preventative management control knowledge gap RF,
—preventative management control knowledge gap RF, ![Sustainability 10 03659 i015]() —management control RF.
—management control RF.
 —Non RF,
  —ecological RF,
  —ecological knowledge gap RF,
  —preventative management control knowledge gap RF,
  —management control RF.
Figure A4.
Bowtie analysis stage 2 for mulloway, capacity to respond component. For colouring key see Figure 3. Risk factors (RF): ![Sustainability 10 03659 i011]() —Non RF,
—Non RF, ![Sustainability 10 03659 i012]() —ecological RF,
—ecological RF, ![Sustainability 10 03659 i013]() —ecological knowledge gap RF,
—ecological knowledge gap RF, ![Sustainability 10 03659 i014]() —preventative management control knowledge gap RF,
—preventative management control knowledge gap RF, ![Sustainability 10 03659 i015]() —management control RF.
—management control RF.
—Non RF, —ecological RF, —ecological knowledge gap RF, —preventative management control knowledge gap RF, —management control RF.
A.4. Discussion
The combination of bowtie analysis and quantitative ERA provided a logical process to assess the effectiveness of management controls within the NSW management system in achieving the sustainability objectives for the species. It provided a range of information for research and management to act on. For example, the case study revealed that mulloway had the largest risk of not being sustainably managed in the Tweed marine bioregion. This bioregion corresponded to the area where the largest catches of mulloway are taken (a stressor risk factor) on the coast and in estuaries by commercial and recreational fisheries [51,60]. Given that mulloway show a high level of fidelity to estuaries [43] (an ecological risk factor), management and research actions focused within this marine bioregion might be the most effective use of resources in lowering the risk to mulloway being managed unsustainably compared to a state-wide approach. Management actions only in the estuaries within this bioregion could include increased compliance monitoring of adherence to control rules by EG fishers that were implemented in the recovery plan [43]. This would provide valuable information about the influence of fisher behaviour on the effectiveness of management controls (e.g., [75]). BTA 2 and the ERA showed that the largest proportion of knowledge gaps occurred for stressor risk factors and preventative management controls (Figure A2). Therefore, research actions to fill knowledge gaps could be focused only in the Tweed bioregion to improve the consistency of biological and fishery data available in space and time. Knowledge gap risk factors to fill include the level of harvesting during the spawning season, rates of discarding across commercial fishing sectors, and operational effectiveness of bycatch reduction devices in trawl fisheries and the level of unreported catch from ports within this bioregion. This would improve the estimate of risk to mulloway being managed unsustainably within the bioregion that is most heavily fished.
The ERA and BTA 2 also provided information to test assumptions made in the study developing a recovery plan for mulloway. For example, Silberschneider et al. [43] concluded that greater protection for juveniles and spawning aggregations would be partially achieved through the establishment of marine parks along the coast of NSW. It suggested that these, in combination with fishing closures for grey nurse shark, would be sufficient protection in the short term. Our analysis revealed that in the areas where mulloway are most heavily fished, marine park sanctuary zones (which are the only zones that provide protection from all water-based human activities in NSW) consisted of <3% of the area in the Tweed bioregion and zero in the Hawkesbury. This information enables managers and scientists to evaluate whether the original assumption in the study for the recovery plan was valid and assess whether the spatial extent and locations of sanctuary zones is providing adequate protection of juveniles and spawning aggregations for mulloway.
A single species was chosen to be used in the case study so that the applicability of the method could be demonstrated more clearly. But one of the limitations of this single species case study is that it has not considered the effect of species interactions. For example, mulloway is a key predator targeting squid and smaller fish species as their prey. Natural or fishing induced variability in the abundance and distribution of their prey species may affect spawning, biomass, movement, catchability and landings. Such interactions would be included when assessing multiple species in a fishery using the chaining tool in the Bowtie Analysis software (CGE Risk Management Solutions, Leidschendam, The Netherlands).
References
- Hilborn, R.; Fulton, E.A.; Green, B.S.; Hartmann, K.; Tracey, S.R.; Watson, R.A. When is a fishery sustainable? Can. J. Fish. Aquat. Sci. 2015, 72, 1433–1441. [Google Scholar] [CrossRef] [Green Version]
- Brundtland, G. (Ed.) Our Common Future: The World Commission on Environment and Development; Oxford University Press: Oxford, UK, 1987; 59p. [Google Scholar]
- Shelton, P.A.; Sinclair, A.F. It’s time to sharpen our definition of sustainable fisheries management. Can. J. Fish. Aquat. Sci. 2008, 65, 2305–2314. [Google Scholar] [CrossRef]
- Garcia, S.M.; Cochrane, K.L. Ecosystem approach to fisheries: A review of implementation guidelines. ICES J. Mar. Sci. 2005, 62, 311–318. [Google Scholar] [CrossRef]
- Astles, K.L. A systematic approach to estimating ecological risk in marine fisheries. CAB Rev. Perspect. Agric. Vet. Sci. Nutr. Nat. Resour. 2008, 3, 1–16. [Google Scholar] [CrossRef]
- Morrison, M.; Jones, E.G.; Parsons, D.M.; Grant, C.M. Habitats and areas of particular significance for coastal finfish fisheries management in New Zealand: A review of concepts and life history knowledge, and suggestions for future research. In New Zealand Aquatic Environment and Biodiversity Report; Ministry for Primary Industries: Wellington, New Zealand, 2014; 156p. [Google Scholar]
- Methot, R.D., Jr.; Wetzel, C.R. Stock synthesis: A biological and statistical framework for fish stock assessment and fishery management. Fish. Res. 2013, 142, 86–99. [Google Scholar] [CrossRef]
- Sainsbury, K.J.; Punt, A.E.; Smith, A.D.M. Design of operational management strategies for achieving fishery ecosystem objectives. ICES J. Mar. Sci. 2000, 57, 731–741. [Google Scholar] [CrossRef] [Green Version]
- Hobday, A.J.; Smith, A.D.M.; Stobutzki, I.C.; Bulman, C.; Daley, R.; Dambacher, J.M.; Deng, R.A.; Dowdney, J.; Fuller, M.; Furlani, D.; et al. Ecological risk assessment for the effects of fishing. Fish. Res. 2011, 108, 372–384. [Google Scholar] [CrossRef]
- AFMA. Residual Risk Assessment Teleost and Chondrichthyan Species; Report for the Otter Board Trawl Method of the Commonwealth Trawl Sector; Australian Government: Canberra, Australia, 2014; 30p.
- Battista, W.; Karr, K.; Sarto, N.; Fujita, R. Comprehensive Assessment of Risk to Ecosystems (CARE): A cumulative ecosystem risk assessment tool. Fish. Res. 2017, 185, 115–129. [Google Scholar] [CrossRef]
- Braccini, J.M.; Gillanders, B.M.; Walker, T.I. Hierarchical approach to the assessment of fishing effects on non-target chondrichthyans: Case study of Squalus megalops in southeastern Australia. Can. J. Fish. Aquat. Sci. 2006, 63, 2456–2466. [Google Scholar] [CrossRef]
- Miriam, O.; Martone, R.; Hannah, L.; Greig, L.; Boutillier, J.; Patton, S. An Ecological Risk Assessment Framework (ERAF) for Ecosystem-based Oceans Management in the Pacific Region; DFO Canadian Science Advisory Secretariat: Ottawa, ON, Canada, 2015; 59p. [Google Scholar]
- Fletcher, W.J. Review and refinement of an existing qualitative risk assessment method for application within an ecosystem-based management framework. ICES J. Mar. Sci. 2014, 72, 1043–1056. [Google Scholar] [CrossRef] [Green Version]
- Fletcher, W.J. The application of qualitative risk assessment methodology to prioritise issues for fisheries management. ICES J. Mar. Sci. 2005, 62, 1576–1587. [Google Scholar] [CrossRef]
- Creed, I.F.; Cormier, R.; Laurent, K.L.; Accatino, F.; Igras, J.; Henley, P.; Friedman, K.B.; Johnson, L.B.; Crossman, J.; Dillon, P.J.; et al. Formal integration of science and management systems needed to achieve thriving and prosperous Great Lakes. Bioscince 2016, 66, 408–418. [Google Scholar] [CrossRef]
- Dichmont, C.M.; Fulton, E.A.; Gorton, R.; Sporcic, M.; Little, L.R.; Punt, A.E.; Dowling, N.; Haddon, M.; Klaer, N.; Smith, D.C. From data rich to data-limited harvest strategies—Does more data mean better management? ICES J. Mar. Sci. 2017, 74, 670–686. [Google Scholar] [CrossRef]
- Harford, W.J.; Babcock, E.A. Aligning monitoring design with fishery decision-making: Examples of management strategy evaluation for reef-associated fisheries. Aquat. Living Resour. 2016, 29, 205. [Google Scholar] [CrossRef]
- Smith, A.D.; Sainsbury, K.J.; Stevens, R.A. Implementing effective fisheries-management systems–management strategy evaluation and the Australian partnership approach. ICES J. Mar. Sci. 1999, 56, 967–979. [Google Scholar] [CrossRef]
- Cormier, R.; Elliott, M.; Rice, J. Putting on a bow-tie to sort out who does what and why in the complex arena of marine policy and management. Sci. Total Environ. 2019, 648, 293–305. [Google Scholar] [CrossRef] [PubMed]
- Kishchuk, B.E.; Creed, I.F.; Laurent, K.L.; Nebel, S.; Kreutzweiser, D.; Venier, L.; Webster, K. Assessing the ecological sustainability of a forest management system using the ISO Bowtie Risk Management Assessment Tool. Forest. Chron. 2018, 94, 25–34. [Google Scholar] [CrossRef] [Green Version]
- Patrício, J.; Elliott, M.; Mazik, K.; Papadopoulou, K.; Smith, C.J. DPSIR—Two decades of trying to develop a unifying framework for marine environmental management? Front. Mar. Sci. 2016, 3, 177. [Google Scholar] [CrossRef]
- Pitcher, C.R. Quantitative indicators of environmental sustainability risk for a tropical shelf trawl fishery. Fish. Res. 2014, 151, 136–147. [Google Scholar] [CrossRef]
- Fletcher, W.J.; Chesson, J.; Fisher, M.; Sainsbury, K.J.; Hundloe, T.; Smith, A.D.M.; Whitworth, B. National ESD Reporting Framework for Australian Fisheries: The ‘How To’ Guide for Wild Capture Fisheries; FRDC Project 2000/145; Fisheries Research and Development Corporation: Canberra, Australia, 2002.
- Zhou, S.; Griffiths, S.P. Sustainability Assessment for Fishing Effects (SAFE): A new quantitative ecological risk assessment method and its application to elasmobranch bycatch in an Australian trawl fishery. Fish. Res. 2008, 91, 56–68. [Google Scholar] [CrossRef]
- Astles, K.L. Linking risk factors to risk treatment in ecological risk assessment of marine biodiversity. ICES J. Mar. Sci. 2015, 72, 1116–1132. [Google Scholar] [CrossRef]
- Newman, S.J.; Brown, J.I.; Fairclough, D.V.; Wise, B.S.; Bellchambers, L.M.; Molony, B.W.; Lenanton, R.C.J.; Jackson, G.; Smith, K.A.; Gaughan, D.J.; et al. A risk assessment and prioritisation approach to the selection of indicator species for the assessment of multi-species, multi-gear, multi-sector fishery resources. Mar. Policy 2018, 88, 11–22. [Google Scholar] [CrossRef]
- Pitcher, C.R.; Ellis, N.; Jennings, S.; Hiddink, J.G.; Mazor, T.; Kaiser, M.J.; Kangas, M.I.; McConnaughey, R.A.; Parma, A.M.; Rijnsdorp, A.D.; et al. Estimating the sustainability of towed fishing-gear impacts on seabed habitats: A simple quantitative risk assessment method applicable to data-limited fisheries. Methods Ecol. Evol. 2017, 8, 472–480. [Google Scholar] [CrossRef]
- Williams, A.; Dowdney, J.; Smith, A.D.M.; Hobday, A.J.; Fuller, M. Evaluating impacts of fishing on benthic habitats: A risk assessment framework applied to Australian fisheries. Fish. Res. 2011, 112, 154–167. [Google Scholar] [CrossRef]
- Cormier, R.; Elliott, M. SMART marine goals, targets and management—Is SDG 14 operational or aspirational, is ‘Life Below Water’ sinking or swimming? Mar. Poll. Bull. 2017, 123, 28–33. [Google Scholar] [CrossRef] [PubMed]
- IEC/ISO. Risk Management—Risk Assessment Techniques; IEC/ISO 31010; International Organisation for the Standardization: Geneva, Switzerland, 2009; 176p. [Google Scholar]
- International Standard. Risk Management—Risk Assessment Techniques (IEC/ISO 31010:2009); International Electrotechnical Commission: Geneva, Switzerland, 2010. [Google Scholar]
- Cormier, R.; Kelble, C.R.; Anderson, M.R.; Allen, J.I.; Grehan, A.; Gregersen, Ó. Moving from ecosystem-based policy objectives to operational implementation of ecosystem-based management measures. ICES J. Mar. Sci. 2016, 74, 406–413. [Google Scholar] [CrossRef]
- Cormier, R.; Elliott, M.; Kannen, A. IEC/ISO Bow-Tie Analysis of Marine Legislation: A Case Study of the Marine Strategy Framework Directive; ICES Cooperative Research Report No. 342; International Council for the Exploration of the Sea: Copenhagen, Denmark, 2018; 56p, ISBN 978-87-7482-216-5. [Google Scholar]
- Larcombe, J.; Noriega, R.; Stobutzki, I. (Eds.) Reducing Uncertainty in Fisheries Stock Status; Australian Bureau of Agricultural and Resource Economics and Sciences (ABARES), Research Report; Australian Government: Canberra, Australia, 2015; 231p.
- Suter, G.W. Ecological risk assessment and ecological epidemiology for contaminated sites. Hum. Ecol. Risk Assess 2006, 12, 31–38. [Google Scholar] [CrossRef]
- Tang, L.; Wang, L.; Li, Q.; Zhao, J. A framework designation for the assessment of urban ecological risks. Int. J. Sustain. Dev. World Ecol. 2018, 25, 387–395. [Google Scholar] [CrossRef] [Green Version]
- Lowerre-Barbieri, S.; DeCelles, G.; Pepin, P.; Catalán, I.A.; Muhling, B.; Erisman, B.; Cadrin, S.X.; Alós, J.; Ospina-Alvarez, A.; Stachura, M.M.; Tringali, M.D. Reproductive resilience: A paradigm shift in understanding spawner-recruit systems in exploited marine fish. Fish Fish. 2017, 18, 285–331. [Google Scholar] [CrossRef]
- Parker, I.M.; Simberloff, D.; Lonsdale, W.M.; Goodell, K.; Wonham, M.; Kareiva, P.M.; Williamson, M.H.; Von Holle, B.M.; Moyle, P.B.; Byers, J.E.; et al. Impact: Toward a framework for understanding the ecological effects of invaders. Biol. Invasions 1999, 1, 3–19. [Google Scholar] [CrossRef]
- Simberloff, D.; Martin, J.L.; Genovesi, P.; Maris, V.; Wardle, D.A.; Aronson, J.; Courchamp, F.; Galil, B.; García-Berthou, E.; Pascal, M.; Pyšek, P. Impacts of biological invasions: What’s what and the way forward. Trends Ecol. Evol. 2013, 28, 58–66. [Google Scholar] [CrossRef] [PubMed] [Green Version]
- Birkeland, C.; Dayton, P.K. The importance in fishery management of leaving the big ones. Trends Ecol. Evol. 2005, 20, 356–358. [Google Scholar] [CrossRef] [PubMed] [Green Version]
- Gwinn, D.C.; Allen, M.S.; Johnston, F.D.; Brown, P.; Todd, C.R.; Arlinghaus, R. Rethinking length-based fisheries regulations: The value of protecting old and large fish with harvest slots. Fish Fish. 2015, 16, 259–281. [Google Scholar] [CrossRef]
- Silberschneider, V.; Gray, C.A. Arresting the Decline of the Commercial and Recreational Fisheries for Mulloway (Argyrosomus japonicus); Fisheries Final Report Series, No. 82; NSW Department of Primary Industries: Cronulla, Australia, 2005.
- Sundblad, G.; Bergström, U.; Sandström, A.; Eklöv, P. Nursery habitat availability limits adult stock sizes of predatory coastal fish. ICES J. Mar. Sci. 2014, 71, 672–680. [Google Scholar] [CrossRef]
- Gillson, J. Freshwater flow and fisheries production in estuarine and coastal systems: Where a drop of rain is not lost. Rev. Fish. Sci. 2011, 19, 168–186. [Google Scholar] [CrossRef]
- Gillson, J.; Suthers, I.; Scandol, J. Effects of flood and drought events on multi-species, multi-method estuarine and coastal fisheries in eastern Australia. Fish. Manag. Ecol. 2012, 19, 54–68. [Google Scholar] [CrossRef]
- International Standard. Risk Management—Guidelines; ISO 31000:2018(E); International Organisation for Standardisation: Geneva, Switzerland, 2018; 16p. [Google Scholar]
- Burgman, M. Risks and Decisions for Conservation and Environmental Management; Cambridge University Press: Cambridge, UK, 2005. [Google Scholar]
- Cox, L.A. What’s wrong with risk matrices? Risk Anal. 2008, 28, 497–512. [Google Scholar] [PubMed]
- Suter, G.W., II; Barnthouse, L.W.; O’Neill, R.V. Treatment of risk in environmental impact assessment. Environ. Manag. 1987, 11, 295–303. [Google Scholar] [CrossRef]
- Stewart, J.; Hegarty, A.; Young, C.; Fowler, A.M.; Craig, J. (Eds.) Status of Fisheries Resources in NSW 2013–2014; NSW Department of Primary Industries: Mosman, Australia, 2015; 391p.
- Jones, H.J.; Swadling, K.M.; Butler, E.C.; Macleod, C.K. Complex patterns in fish-sediment mercury concentrations in a contaminated estuary: The influence of selenium co-contamination? Estuar. Coast. Shelf Sci. 2014, 137, 14–22. [Google Scholar] [CrossRef]
- Biedron, I.S.; Knuth, B.A. Toward shared understandings of ecosystem-based fisheries management among fishery management councils and stakeholders in the US Mid-Atlantic and New England regions. Mar. Polocy 2016, 70, 40–48. [Google Scholar] [CrossRef]
- AFMA. Guide to AFMA’s Ecological Risk Management; Australian Government: Canberra, Australia, 2017; 119p.
- Stelzenmüller, V.; Coll, M.; Mazaris, A.D.; Giakoumi, S.; Katsanevakis, S.; Portman, M.E.; Degen, R.; Mackelworth, P.; Gimpel, A.; Albano, P.G.; et al. A risk-based approach to cumulative effect assessments for marine management. Sci. Total Environ. 2018, 612, 1132–1140. [Google Scholar] [CrossRef] [PubMed]
- Hayes, K.R. Uncertainty and Uncertainty Analysis Methods. Issues in Quantitative and Qualitative Risk Modelling with Application to Import Risk Assessment; ACERA Project (0705) CSIRO: Hobart, Australia, 2011; 131p. [Google Scholar]
- Goble, R.; Bier, V.M. Risk Assessment Can Be a Game-Changing Information Technology—But Too Often It Isn’t. Risk Anal. 2013, 33, 1942–1951. [Google Scholar] [CrossRef] [PubMed]
- Silberschneider, V.; Gray, C.A. Synopsis of biological, fisheries and aquaculture-related information on mulloway Argyrosomus japonicus (Pisces: Sciaenidae), with particular reference to Australia. J. Appl. Ichthyol. 2008, 24, 7–17. [Google Scholar] [CrossRef]
- Hughes, J. Mulloway. In Status of Fisheries Resources in NSW 2013-2014; Stewart, J., Hegarty, A., Young, C., Fowler, A.M., Craig, J., Eds.; NSW Department of Primary Industries: Mosman, Australia, 2015; pp. 219–220. [Google Scholar]
- West, L.D.; Stark, K.E.; Murphy, J.J.; Lyle, J.M.; Ochwada-Doyle, F.A. Survey of Recreational Fishing in New South Wales and the ACT, 2013/14; Fisheries Final Report Series No. 149; NSW Department of Primary Industries: Mosman, Australia, 2015; 170p.
- Scandol, J.P. A Framework for Assessment of Harvested Fish Resources in NSW; NSW Department of Primary Industries—Fisheries Resource Assessment Series 15; NSW Department of Primary Industries: Cronulla, Australia, 2004; p. 44.
- NSW Fisheries. Fishery Management Strategy for the Estuary Prawn Trawl Fishery; NSW Fisheries: Cronulla, Australia, 2003; 173p.
- Morison, A.K. Input and output controls in fisheries management: A plea for more consistency in terminology. Fish. Manag. Ecol. 2004, 11, 411–413. [Google Scholar] [CrossRef]
- NSW Fisheries. Fishery Management Strategy for the Estuary General Fishery; NSW Fisheries: Cronulla, Australia, 2003; 155p.
- NSW Department of Primary Industries. Fishery Management Strategy for the Ocean Trawl Fishery; NSW Department of Primary Industries: Cronulla, Australia, 2007; 118p.
- NSW Department of Primary Industries. NSW Commercial Fisheries Share Linkage and Management Arrangements; NSW Department of Primary Industries: Mosman, Australia, 2017; 64p.
- Roper, A.; Creese, R.; Scanes, P.; Stephens, K.; Williams, R.; Dela-Cruz, J.; Coade, G.; Coates, B. NSW Estuaries—Understanding Condition and Influencing Management; Sydney, Department of Environment, Climate Change and Water: Sydney, Australia, 2010; 16p.
- Creese, R.G.; Glasby, T.M.; West, G.; Gallen, C. Mapping the Habitats of NSW Estuaries; Fisheries Final Report Series, No. 113; Industry and Investment NSW: Port Stephens, Australia, 2009; 95p.
- Berkson, J.; Thorson, J.T. The determination of data-poor catch limits in the United States: Is there a better way? ICES J. Mar. Sci. 2015, 72, 237–242. [Google Scholar] [CrossRef]
- Stewart, J.; Hegarty, A.M.; Young, C.; Fowler, A.M. Sex-specific differences in growth, mortality and migration support population resilience in the heavily exploited migratory marine teleost Mugil cephalus (Linnaeus 1758). Mar. Freshw. Res. 2018, 69, 385–394. [Google Scholar] [CrossRef]
- Stewart, J. Monitoring and Assessment of the Impact of Management Changes under the Mulloway Recovery Program; Internal Review Report; DPI Fisheries NSW: Mosman, Australia, 2017; 14p. [Google Scholar]
- McGrath, S.P.; Reichelt-Brushett, A.J.; Butcher, P.A.; Cairns, S.C. Absorption of metals in mulloway (Argyrosomus japonicus) after ingesting nickel-plated carbon-steel hooks. Mar. Envion. Res. 2014, 99, 188–197. [Google Scholar] [CrossRef] [PubMed]
- Roessig, J.M.; Woodley, C.M.; Cech, J.J., Jr.; Hansen, L.J. Effects of global climate change on marine and estuarine fishes and fisheries. Rev. Fish Biol. Fish. 2004, 14, 251–275. [Google Scholar] [CrossRef]
- Pankhurst, N.W.; Munday, P.L. Effects of climate change on fish reproduction and early life history stages. Mar. Freshw. Res. 2011, 62, 1015–1026. [Google Scholar] [CrossRef]
- Boonstra, W.J.; Birnbaum, S.; Björkvik, E. The quality of compliance: Investigating fishers’ responses towards regulation and authorities. Fish Fish. 2017, 18, 682–697. [Google Scholar] [CrossRef]
- Dowling, N.A.; Dichmont, C.M.; Haddon, M.; Smith, D.C.; Smith, A.D.M.; Sainsbury, K. Guidelines for developing formal harvest strategies for data-poor species and fisheries. Fish. Res. 2015, 171, 130–140. [Google Scholar] [CrossRef]
- Stewart, J. Evidence of age-class truncation in some exploited marine fish populations in New South Wales, Australia. Fish. Res. 2011, 108, 209–213. [Google Scholar] [CrossRef]
- Henry, G.W.; Lyle, J.M. The National Recreational and Indigenous Fishing Survey; Final Report to the Fisheries Research and Development Corporation, Project 99/158; NSW Fisheries Final Report Series No. 40; NSW Fisheries: Cronulla, Australia, 2003; 188p.
- Pinheiro, H.T.; Joyeux, J.-C. The role of recreational fishermen in the removal of target reef fishes. Ocean Coast. Manag. 2015, 112, 12–17. [Google Scholar] [CrossRef]
- Young, M.A.L.; Foale, S.; Bellwood, D.R. Dynamic catch trends in the history of recreational spearfishing in Australia. Conserv. Biol. 2015, 29, 784–794. [Google Scholar] [CrossRef] [PubMed]
- Griffiths, S.P.; Fay, G. Integrating recreational fisheries data into stock assessment: Implications for model performance and subsequent harvest strategies. Fish. Manag. Ecol. 2015, 22, 197–212. [Google Scholar] [CrossRef]
- Van Overzee, H.M.; Rijnsdorp, A.D. Effects of fishing during the spawning period: Implications for sustainable management. Rev. Fish Biol. Fish. 2015, 25, 65–83. [Google Scholar] [CrossRef]
- Gray, C.A. Management implications of discarding in an estuarine multi-species gill net fishery. Fish. Res. 2002, 56, 178–192. [Google Scholar] [CrossRef]
- Stewart, J.; Ferrell, D.J. Escape panels to reduce by-catch in the New South Wales demersal trap fishery. Mar. Freshw. Res. 2002, 53, 1179–1188. [Google Scholar] [CrossRef]
- Gray, C.A.; Kennelly, S.J.; Hodgson, K.E.; Ashby, C.J.T.; Beatson, M.L. Retained and discarded catches from commercial beach-seining in Botany Bay, Australia. Fish. Res. 2001, 50, 205–219. [Google Scholar] [CrossRef]
- Liggins, G.W.; Kennelly, S.J. By-catch from prawn trawling in the Clarence River estuary, New South Wales, Australia. Fish. Res. 1996, 25, 347–367. [Google Scholar] [CrossRef]
- Broadhurst, M.K.; Kennely, S.J. Reducing bycatch of juvenile fin fish (Mulloway) in the Hawkesbury river prawn-trawl fishery using square mesh panels in codends. Fish. Res. 1994, 19, 321–333. [Google Scholar] [CrossRef]
- Kennelly, S.J.; Liggins, G.W.; Broadhurst, M.K. Retained and discarded by-catch from oceanic prawn trawling in New South Wales, Australia. Fish. Res. 1998, 36, 217–236. [Google Scholar] [CrossRef]
- Broadhurst, M.K.; Suuronen, P.; Hulme, A. Estimating collateral mortality from towed fishing gear. Fish Fish. 2006, 7, 80–218. [Google Scholar] [CrossRef]
- Butcher, P.A.; Broadhurst, M.K.; Reynolds, D.; Reid, D.D.; Gray, C.A. Release method and anatomical hook location: Effects on short-term mortality of angler-caught Acanthopagrus australis and Argyrosomus japonicus. Dis. Aquat. Organ. 2007, 74, 17–26. [Google Scholar] [CrossRef] [PubMed]
- Fowler, A.M.; Parkinson, K.; Booth, D.J. New poleward observations of 30 tropical reef fishes in temperate south eastern Australia. Mar. Biodivers. 2017, 47, 1–6. [Google Scholar] [CrossRef]
- Rudd, M.B.; Branch, T.A. Does unreported catch lead to overfishing? Fish Fish. 2017, 18, 313–323. [Google Scholar] [CrossRef]
- Aguilera, S.E.; Cole, J.; Finkbeiner, E.M.; Le Cornu, E.; Ban, N.C.; Mark, H.; Carr, M.H.; Joshua, E.; Cinner, J.E.; Larry, B.; et al. Managing Small-Scale Commercial Fisheries for Adaptive Capacity: Insights from Dynamic Social-Ecological Drivers of Change in Monterey Bay. PLoS ONE 2015, 10, e0118992. [Google Scholar] [CrossRef] [PubMed]
- Van Oostenbrugge, H.J.A.E.; Powell, J.P.; Smit, J.P.G.; Poos, J.; Kraak, S.B.M.; Buisman, E.F.C. Linking catchability and fisher behaviour under effort management. Aquat. Living Resour. 2008, 21, 265–273. [Google Scholar] [CrossRef] [Green Version]
- Hilborn, R.; Walters, C.J. Quantitative Fisheries Stock Assessment. Choice, Dynamics and Uncertainty; Chapman and Hall: New York, NY, USA, 1992. [Google Scholar]
- Zhou, S.; Punt, A.E.; Smith, A.D.M.; Ye, Y.; Haddon, M.; Dichmont, C.M.; Smith, D.C. An optimized catch-only assessment method for data poor fisheries. ICES J. Mar. Sci. 2017, 75, 964–976. [Google Scholar] [CrossRef]
- Fauconnet, L.; Rochet, M.-J. Fishing selectivity as an instrument to reach management objectives in an ecosystem approach to fisheries. Mar. Polocy 2016, 64, 46–54. [Google Scholar] [CrossRef]
- Parsons, D.F.; Suthers, I.M.; Cruz, D.O.; Smith, J.A. Effects of habitat on fish abundance and species composition on temperate rocky reefs. Mar. Ecol. Prog. Ser. 2016, 561, 155–171. [Google Scholar] [CrossRef]
- Malcolm, H.A.; Jordan, A.; Creese, R.G.; Knott, N.A. Size and age are important factors for marine sanctuaries: Evidence from a decade of systematic sampling in a subtropical marine park. Aquat. Conserv. Mar. Freshw. Ecosyst. 2016, 26, 1090–1106. [Google Scholar] [CrossRef]
- Beck, M.W.; Heck, K.L.; Able, K.W.; Childers, D.L.; Eggleston, D.B.; Gillanders, B.M.; Halpern, B.; Hays, C.G.; Hoshino, K.; Minello, T.J.; et al. The identification, conservation and management of estuarine and marine nurseries for fish and invertebrates. BioScince 2001, 51, 633–641. [Google Scholar] [CrossRef]
- Seitz, R.D.; Wennhage, H.; Bergström, U.; Lipcius, R.N.; Ysebaert, T. Ecological value of coastal habitats for commercially and ecologically important species. ICES J. Mar. Sci. 2013, 71, 648–665. [Google Scholar] [CrossRef] [Green Version]
- Williams, R.J.; Watford, F.A.; Balashov, V. Kooragang Wetland Rehabilitation Project: History of Changes to Estuarine Wetlands of the Lower Hunter River; NSW Fisheries Final Report Series 22; NSW Fisheries: Cronulla, Australia, 2000; p. 85.
- Yeager, L.A.; Keller, D.A.; Burns, T.R.; Pool, A.S.; Fodrie, F.J. Threshold effects of habitat fragmentation on fish diversity at landscapes scales. Ecology 2016, 97, 2157–2166. [Google Scholar] [CrossRef] [PubMed]
- Payne, N.L.; Smith, J.A.; Meulen, D.E.; Taylor, M.D.; Watanabe, Y.Y.; Takahashi, A.; Marzullo, T.A.; Gray, C.A.; Cadiou, G.; Suthers, I.M. Temperature dependence of fish performance in the wild: Links with species biogeography and physiological thermal tolerance. Funct. Ecol. 2016, 30, 903–912. [Google Scholar] [CrossRef]
- Silberschneider, V.; Gray, C.A.; Stewart, J. Age, growth, maturity and the overfishing of the iconic sciaenid, Argyrosomus japonicus, in south-eastern, Australia. Fish. Res. 2009, 95, 220–229. [Google Scholar] [CrossRef]
- Convention on Biological Diversity, Aichi Biodiversity Targets. Target 11. 1993. Available online: https://www.cbd.int/sp/targets/rationale/target-11/ (accessed on 1 February 2018).
- Wiecek, D.; Laine, R. Shoalhaven City Council Estuary Ecosystem Health Report Cards 2010–2011; Technical Report; Office of Environment and Heritage: Sydney, Australia, 2012; 19p.
- Barnes, T.C.; Junge, C.; Myers, S.A.; Taylor, M.D.; Rogers, P.J.; Ferguson, G.J.; Lieschke, J.A.; Donnellan, S.C.; Gillanders, B.M. Population structure in a wide-ranging coastal teleost (Argyrosomus japonicus, Sciaenidae) reflects marine biogeography across southern Australia. Mar. Freshw. Res. 2016, 67, 1103–1113. [Google Scholar] [CrossRef]
- Mirimin, L.; Macey, B.; Kerwath, S.; Lamberth, S.; Bester-van der Merwe, A.; Cowley, P.; Bloomer, P.; Roodt-Wilding, R. Genetic analyses reveal declining trends and low effective population size in an overfished South African sciaenid species, the dusky kob (Argyrosomus japonicus). Mar. Freshw. Res. 2016, 67, 266–276. [Google Scholar] [CrossRef]
- Ovenden, J.R.; Berry, O.; Welch, D.J.; Buckworth, R.C.; Dichmont, C.M. Ocean’s eleven: A critical evaluation of the role of population, evolutionary and molecular genetics in the management of wild fisheries. Fish Fish. 2015, 16, 125–159. [Google Scholar] [CrossRef]
- Payne, N.L.; van der Meulen, D.E.; Suthers, I.M.; Gray, C.A.; Taylor, M.D. Foraging intensity of wild mulloway Argyrosomus japonicus decreases with increasing anthropogenic disturbance. Mar. Biol. 2015, 162, 539–546. [Google Scholar] [CrossRef]
- Ferguson, G.J.; Ward, T.M.; Geddes, M.C. Do recent age structures and historical catches of mulloway, Argyrosomus japonicus (Sciaenidae), reflect freshwater inflows in the remnant estuary of the Murray River, South Australia? Aquat. Living Resour. 2008, 21, 145–152. [Google Scholar] [CrossRef]
- Rossi, T.; Nagelkerken, I.; Pistevos, J.C.; Connell, S.D. Lost at sea: Ocean acidification undermines larval fish orientation via altered hearing and marine soundscape modification. Biol. Lett. 2016, 12, 20150937. [Google Scholar] [CrossRef] [PubMed]
Figure 1.
Illustration of the link between components of the pathway between human pressures and consequences on management objectives. (Derived from the Drivers–Pressures–State change–Impact–Response (DPSIR) framework [22]).
Figure 1.
Illustration of the link between components of the pathway between human pressures and consequences on management objectives. (Derived from the Drivers–Pressures–State change–Impact–Response (DPSIR) framework [22]).

Figure 2.
Flow diagram of the management context showing how each component builds on the one before.
Figure 2.
Flow diagram of the management context showing how each component builds on the one before.

Figure 3.
Structure of a first stage bowtie analysis (BTA 1) and its linkage to goals, management objectives, drivers and consequences. Yellow and black box—source of risk, orange yellow circle—undesirable event, blue box—stressors, red box—impacts, green bar—preventative management controls, yellow bar—mitigative management controls, yellow box—escalation factor, SST—sea surface temperature.

Figure 4.
The ecological risk assessment components within the risk management process consistent with ISO 31000:2018(E) [32] risk management standard showing inputs from the management context components (blue text) and from the first stage BTA (red text).
Figure 4.
The ecological risk assessment components within the risk management process consistent with ISO 31000:2018(E) [32] risk management standard showing inputs from the management context components (blue text) and from the first stage BTA (red text).

Figure 5.
Conceptual diagram of a second stage BTA showing how different risk factors (RF) from the ERA are incorporated. Stressor boxes show the type of stressor risk factor, management control boxes and bars show effectiveness risk factor, impact boxes show type of impact risk factor. Colouring is the same as in Figure 3 but different intensities and hatching indicate the different risk factor types. Medium blue—stressor RF, light blue—knowledge gap, green white hatch—very poor effectiveness RF, yellow horizontal hatch—unknown effectiveness RF, dark red—abundance change RF, medium red—population structure change RF.

Table 1.
Summary of some of the different ecological risk assessment methods used in fisheries (listed in alphabetical order). (a) Compared to the components of the pathway between human pressures and consequences on management objectives (see Figure 1).
Table 1.
Summary of some of the different ecological risk assessment methods used in fisheries (listed in alphabetical order). (a) Compared to the components of the pathway between human pressures and consequences on management objectives (see Figure 1).
| ERA Method Reference | Driver | Pressure | Biological Attributes | Management Control—Preventative | Undesirable Event | Management Control—Mitigative | Impact | Management Control—Recovery | Risk Estimation |
|---|---|---|---|---|---|---|---|---|---|
| [11] | - | E | V, P, EF | - | Ocean ecosystems impacted by multiple human activities | - | F, PI | - | Ranks threats affecting a species or system |
| [14,24] | Various | S | V, P | Various | Overfishing of ecosystem components | - | F, PI | - | Prioritises ecological components requiring action and degree of action required |
| [9] (Level 2) | - | S | V, P, EF | - | Relative abundance of ecological components is unsustainable | - | F, PI | - | Identifies which ecological components are at high risk from impacts of fishing |
| [27] | Various | - | V, P | - | Overfishing of multiple species | - | PI | - | Identifies if overfishing is occurring for which suite of species |
| [13] (Level 2) | - | E | V, P | - | Ecosystem components unacceptably impacted by human stressors | - | PI | - | Ranks stressors affecting an ecological component |
| [23] | - | E | V, P | BRD | Irreversible habitat damage | - | - | - | Identifies where and what habitat types are most intensely fished for management focus |
| [28] | - | E | V, P | - | Irreversible benthic habitat damage | - | F | - | Assesses benthic status of habitats to impacts of towed fishing gear |
| [29] | - | S, E | V, P | - | Irreversible habitat damage | - | - | - | Identifies where and what habitat types are most intensely fished for management focus |
| [25] | - | S | P | Selectivity fishing gear, BRD | Overfishing of bycatch species | - | F | - | Assesses impact of fishing on bycatch species |
Table 2.
The proportion of measures (number) used for each component in the pathway. E—exposure, S—susceptibility, V—vulnerability, P—productivity, EF—ecosystem function, F—fishery impact. PI—population change impact, Dash—absent.
Table 2.
The proportion of measures (number) used for each component in the pathway. E—exposure, S—susceptibility, V—vulnerability, P—productivity, EF—ecosystem function, F—fishery impact. PI—population change impact, Dash—absent.
| Components: | Pressure | Biological Attributes | Impacts | ||||||
|---|---|---|---|---|---|---|---|---|---|
| ERA Method Reference | Driver | Exposure/Susceptibility | Productivity | Vulnerability | Ecosystem Function | Management Controls | Fishery Impact | Population Change Impact | Total No. Measures |
| [11] | 0 | 0.06 (2) | 0.24 (8) | 0.32 (11) | 0.21 (7) | 0 | 0.12 (4) | 0.06 (2) | 34 |
| [14,24] | 0.07 (1) | 0.14 (2) | 0.07 (1) | 0.07 (1) | 0 | 0.21 (3) | 0.29 (4) | 0.14 (2) | 14 |
| [9] (Level 2) | 0 | 0.23 (3) | 0.15 (2) | 0.08 (1) | 0.08 (1) | 0.08 (1) | 0.08 (1) | 0.31 (4) | 13 |
| [27] | 0.10 (1) | 0 | 0.60 (6) | 0.10 (1) | 0 | 0 | 0.20 (2) | 0 | 10 |
| [13] (Level 2) | 0 | 0.24 (4) | 0.53 (9) | 0.12 (2) | 0 | 0 | 0 | 0.12 (2) | 17 |
| [23] | 0 | 0.2 (1) | 0.2 (1) | 0.40 (2) | 0 | 0.20 (1) | 0 | 0 | 5 |
| [28] | 0 | 0.17 (1) | 0.33 (2) | 0.33 (2) | 0 | 0 | 0.17 (1) | 0 | 6 |
| [29] | 0 | 0.27 (3) | 0.09 (1) | 0.64 (7) | 0 | 0 | 0 | 0 | 11 |
| [25] | 0 | 0.67 (4) | 0 | 0 | 0 | 0 | 0.33 (2) | 0 | 6 |
Table 3.
Components of each of the processes in the management context and the key questions each needs to answer. Derived from [30].
Table 3.
Components of each of the processes in the management context and the key questions each needs to answer. Derived from [30].
| Process | Component | Key Questions |
|---|---|---|
| Strategic Planning | A. Goals (long term 10+ years) (from legislation, policies) | 1. What are the environmental, economic and social values desired to be protected? 2. What is the desired state of the fishery resources to be achieved? |
| Management Control | B. Management Objectives (medium term 3–5 years) (from management plans, regulations) | 3. What needs to be achieved to reach these goals? |
| Operational Control | C. Operational targets (short term 1 year) (from management plans) | 4. What specific targets are required to accomplish the management objectives? (e.g., effort limits, catch limit reference points) |
| D. Expected outcomes (from management plans) | 5. If the targets were met what specifically would be different in the state of the fished species and fishery compared to now within the timeframe? | |
| E. Operational controls(from compliance plans, operational plans) | 6. What management actions, controls and procedures need to be implemented to put into effect the management objectives and achieve the expected outcomes? | |
| F. Monitoring | 7. What needs to be measured, when and how to detect whether expected outcomes are being achieved by the operational controls? | |
| G. Evaluation | 8. What needs to be analysed and how, in order to evaluate whether actual outcomes of operational controls match the expected outcomes to achieve management objectives? | |
| Adaptive management | H. Revise and reassess—Actual ≠ expected outcomes | 9. What changes need to be made to components C–F to better achieve the management objectives? |
| I. Review and maintain—Actual = expected outcomes | 10. What resources and improvements are required to ensure the management objectives and goals continue in the desired direction? |
Table 4.
Example of the elements that contribute to forming risk context statements for an ERA.
| Element | Content |
|---|---|
| Source of risk | Commercial fishing, including specific aspects such as fishing mortality, fishing pressure. |
| Goal | Prevent overfishing of target species by commercial fishing. |
| Management objective | Abundance of adults remains above the point where recruitment failure could occur. |
| Risk context | The likelihood that fishing pressure has led to reduced adult abundance such that the fish stock will be unable to sustain its current abundance and distribution in New South Wales (NSW) waters over the next 20 years. |
© 2018 by the authors. Licensee MDPI, Basel, Switzerland. This article is an open access article distributed under the terms and conditions of the Creative Commons Attribution (CC BY) license (http://creativecommons.org/licenses/by/4.0/).
Share and Cite
MDPI and ACS Style
Astles, K.L.; Cormier, R. Implementing Sustainably Managed Fisheries Using Ecological Risk Assessment and Bowtie Analysis. Sustainability 2018, 10, 3659. https://0-doi-org.brum.beds.ac.uk/10.3390/su10103659
AMA Style
Astles KL, Cormier R. Implementing Sustainably Managed Fisheries Using Ecological Risk Assessment and Bowtie Analysis. Sustainability. 2018; 10(10):3659. https://0-doi-org.brum.beds.ac.uk/10.3390/su10103659
Chicago/Turabian StyleAstles, Karen L., and Roland Cormier. 2018. "Implementing Sustainably Managed Fisheries Using Ecological Risk Assessment and Bowtie Analysis" Sustainability 10, no. 10: 3659. https://0-doi-org.brum.beds.ac.uk/10.3390/su10103659
Note that from the first issue of 2016, this journal uses article numbers instead of page numbers. See further details here.