The Impact of Risk Perceptions of Food Ingredients on the Restaurant Industry: Focused on the Moderating Role of Corporate Social Responsibility


Department of Casino Tourism, Kangwon Tourism College, Taebaek-si, Gangwon-do 26034, Korea
Sustainability 2018, 10(9), 3132; https://0-doi-org.brum.beds.ac.uk/10.3390/su10093132
Submission received: 2 August 2018
/
Revised: 16 August 2018
/
Accepted: 31 August 2018
/
Published: 3 September 2018
(This article belongs to the Special Issue Marketing of Sustainable Food and Drink)
Abstract
:This study investigated the causal relationships between international tourists’ perceived sustainability of Jeju Island, South Korea and environmentally responsible behavior, revisit intention, and positive word-of-mouth communication. Perceived sustainability was employed as a multidimensional construct comprised of economic, cultural, and environmental aspects. Data were collected from international tourists that visited Jeju Island. The results indicated that environmentally responsible behavior was influenced positively by cultural sustainability, and negatively by environmental sustainability. Revisit intention and positive word-of-mouth communication were significantly affected by the three dimensions of sustainability. Based on the findings, associated implications were suggested for sustainable destination management of Jeju Island.
1. Introduction
Over the past few decades, people have become increasingly concerned over food security issues, which has negatively affected consumer choices [1]. For example, food security has a substantial influence on a consumer’s concern for health risks and food consumption [2]. Within the food service industry, vegetables, fruit, and meat are particularly concerning ingredients to consumers because they are significantly influenced by climate change, country of origin, environmental pollution, the unethical behaviors of producers and distributors, and genetically modified processes [3]. Food security incidents can bring enormously negative outcomes to food service enterprises, such as decreased consumption of certain dishes among consumers, negative images of the enterprise and lack of willingness to purchase [1]. Furthermore, it undermines consumers’ trust in the food service industry, specific enterprises, certain foods and even the process by which food gets to the table.
Recently, several food service enterprises have been struck with nasty controversy surrounding food security. A recent example was when there was an ecoli outbreak which affected both Chipotle and Trader Joes [4]. In Chipotle’s case, the contamination came from just 1 of 21 possible ingredients in a meal. The impact of the crisis still lingers, and consumers are still skeptical of Chipotle and the quality of the food they may receive. Consequently, if consumers don’t know much about how food ingredients were produced, distributed, stored, and cooked before being served, such an outbreak will not only increase their uncertainty about restaurants as well as their dishes, but also make them want to prepare their own food at home [3]. In other words, a certain type of risk perception of food ingredients among restaurant consumers may be present at all stages of food consumption, and may reduce the reputation and financial performance of the restaurant [1].
Clearly, lack of knowledge of the food service supply chain and preparation practices causes a heightened sense of skepticism, as well as product uncertainty in the restaurant’s ability to prevent the incident from happening again. One way for restaurants to decrease uncertainty is to invest in managing consumers’ levels of knowledge of these processes (e.g., menu labeling initiatives to ensure high quality of food ingredients of restaurants and to reflect the public awareness of health security among restaurant consumers). Having an information program surrounding an enterprise’s supply chain management could help increase a restaurant’s reputation and eventually financial performance in the event of a crisis [5]. While this sounds intense, in an age where consumers ask for calorie counts on menus, gluten-free and organic options identified on menus, it may not seem too outrageous to also indicate the source, storage and preparation processes that the restaurant engages in.
Many consumers are hesitant to consume restaurant dishes due to uncertainty about the ingredients, production, packaging, distribution, storage, and preparation [1]. Dr. Douglas Powell, a retired food-safety professor at Kansas State University, stated, “Restaurants were paying attention to all that staff, but they weren’t paying attention to micro-level food safety” [6]. To further complicate the situation, restaurants have blamed suppliers or producers for food contamination [4]. Heightened attention to food security and safety issues which have been covered in the media have only increased consumers’ worry about food safety in restaurants. Higher levels of trust, loyalty and knowledge lead to decreased uncertainty. Thus, understanding how to increase trust in the restaurant, knowledge of the supply chain management process, and loyalty to the restaurant might lead to increased food consumption by consumers and less divergence to other restaurants.
Maloni and Brown have proposed using corporate social responsibility (CSR) applications as a way of building stronger supply chains for the restaurant industry [7]. CSR programs might include programs related to health, safety, use of biotechnology, human rights practices along the supply chain, environmental ingredients, environmental processes, use of pesticides, animal welfare practices, and fair trade. However, the food service industry needs to focus on CSR activities relevant to health security, in particular, to enhance positive perceptions of restaurants among customers. Interestingly, despite this aspect, their study only focused on food ingredient suppliers and CSR initiatives. More recently, Zingg et al. investigated the causal relationship between consumers’ risk perceptions of the food supply chain and their food-consumption decisions [1]. Although their study suggested several steps that describe a food supply chain from a consumer’s perspective, they did not demonstrate how to decrease consumers’ risk perceptions along the food supply chain. Thus, filling the gap left by both Maloni and Brown’s study [7] and Zingg et al.’s study [1], this study suggests increased CSR programming in order to reduce consumers’ risk perceptions of food ingredients, thereby in turn helping restaurants to increase their consumers’ trust and loyalty (i.e., positive word-of-mouth, intention to revisit, recommendation to others, and willingness to pay more).
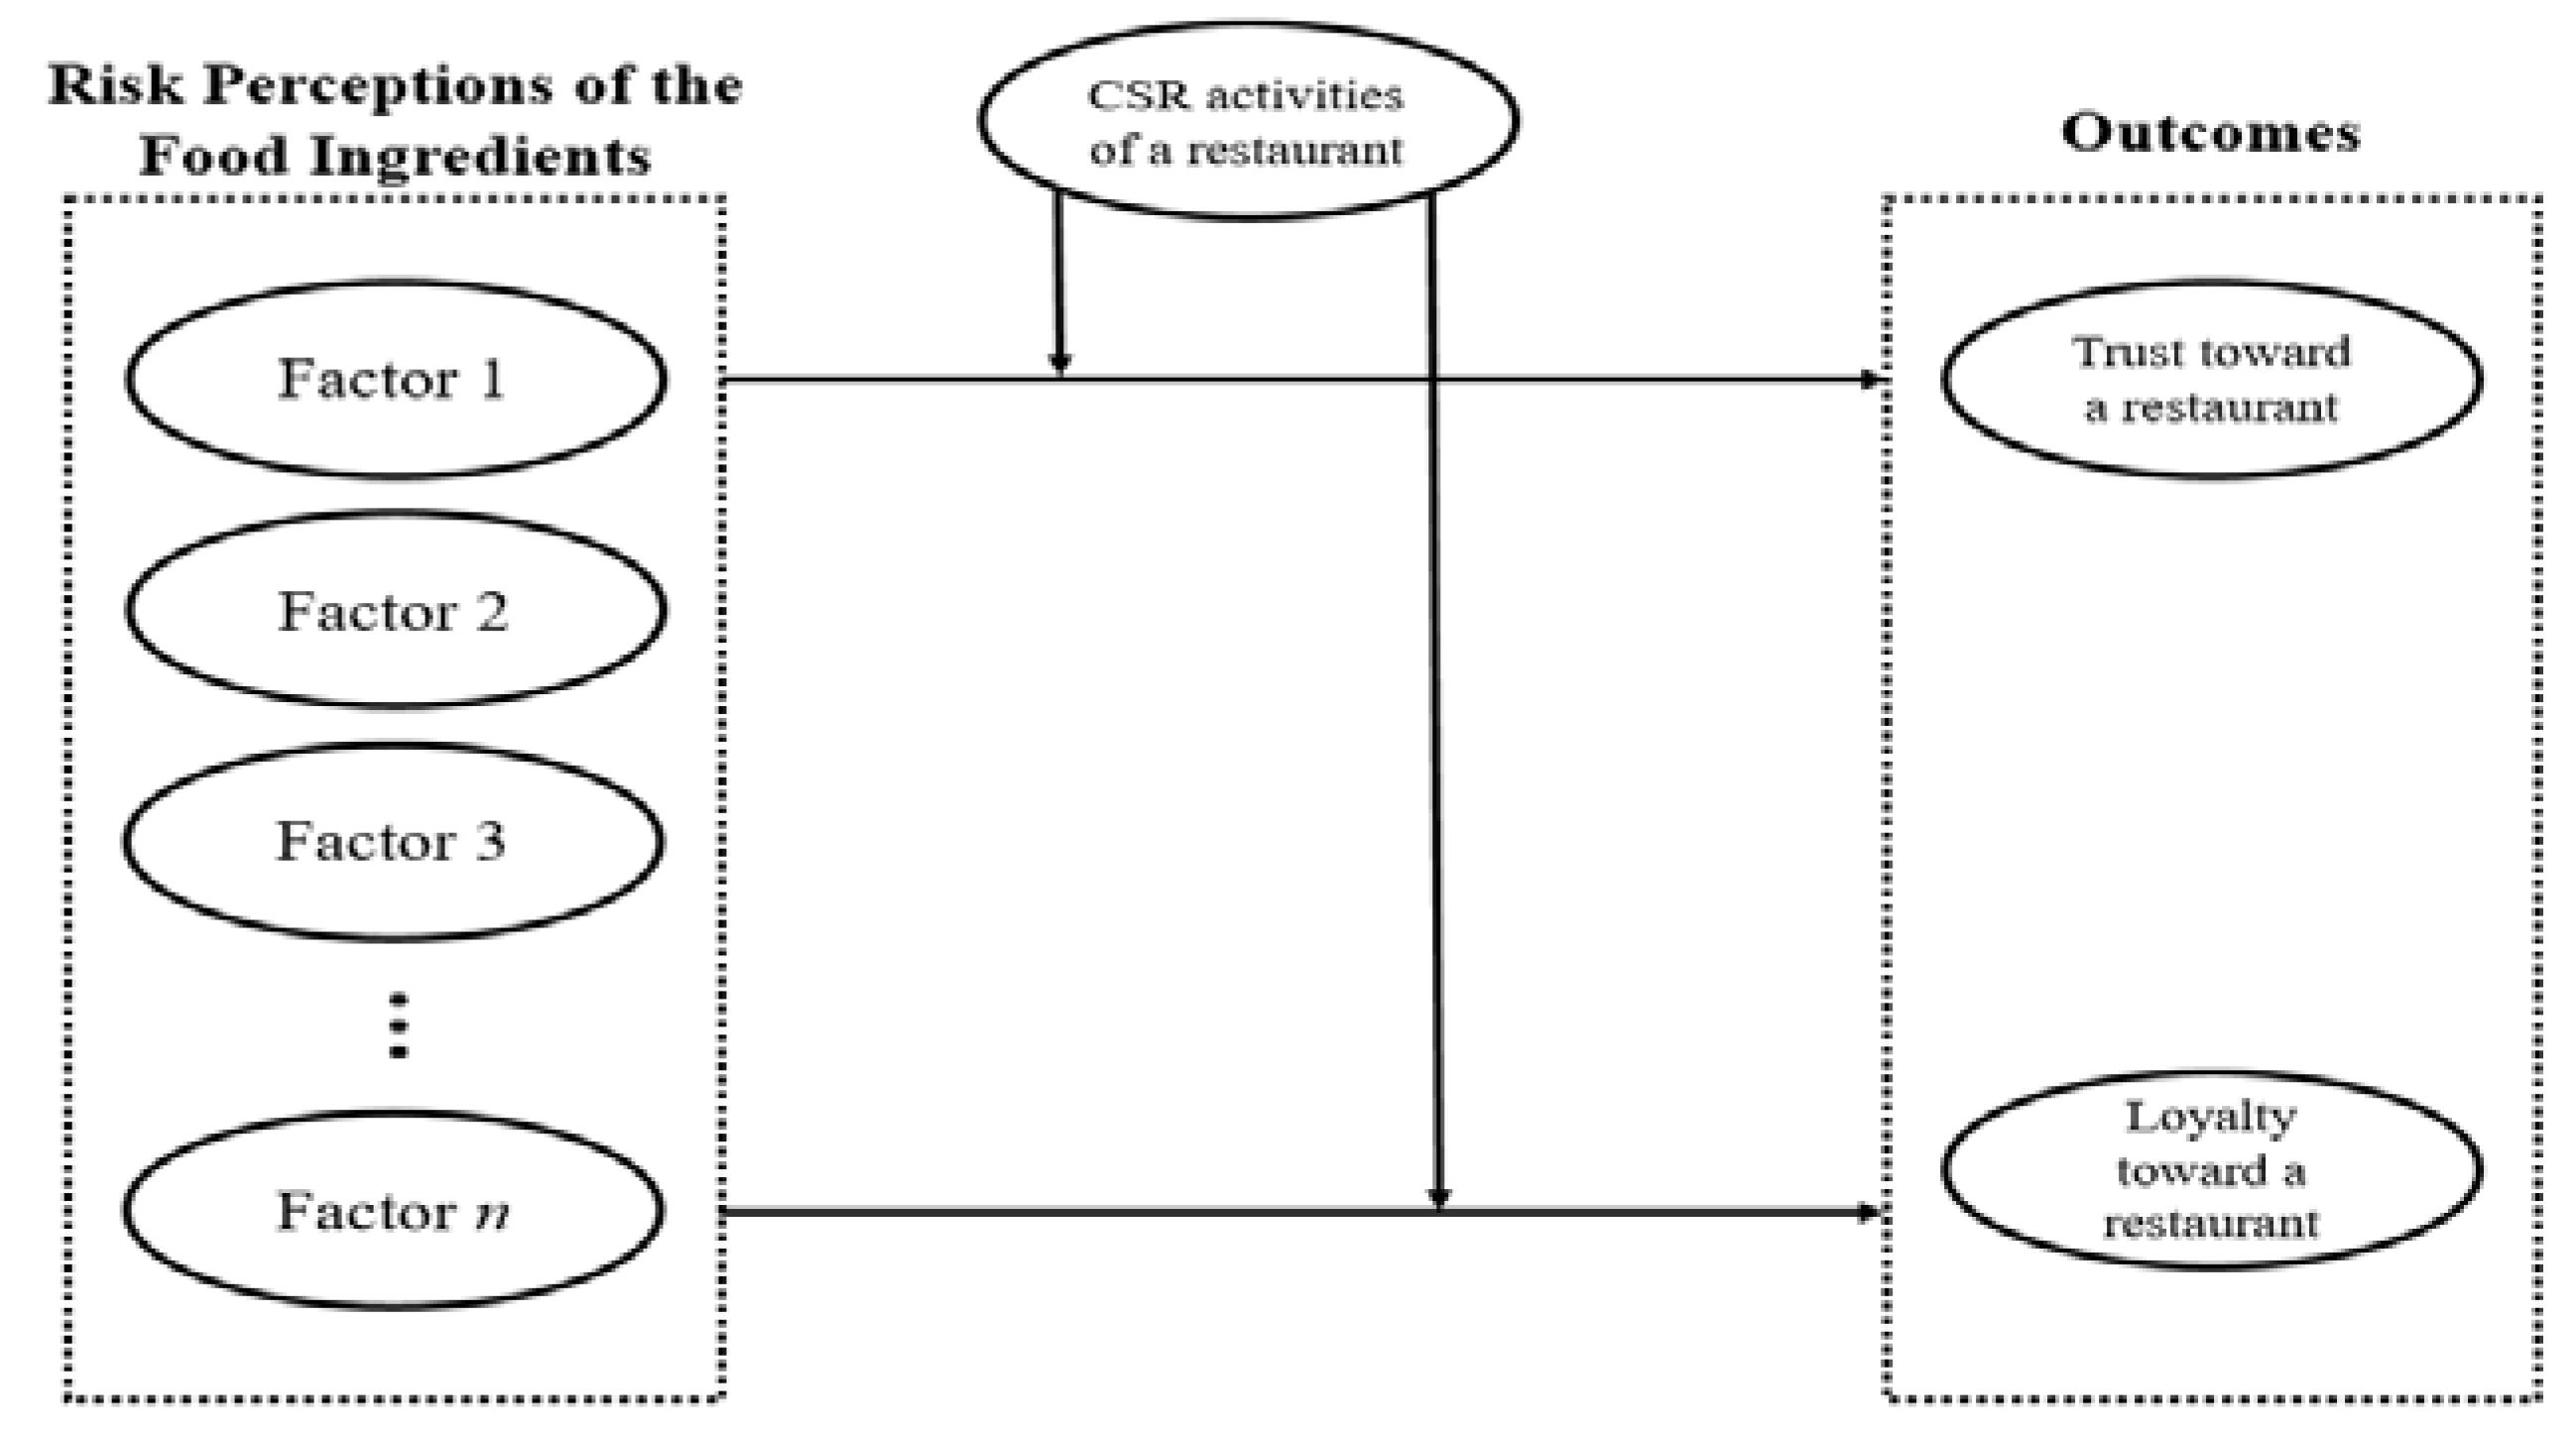
The purpose of this study is to explore the risk perception dimensions of restaurant consumers and their knowledge of that risk along the food supply chain in restaurants. Another purpose of this study is to examine the impact of risk perceptions on consumers’ trust and loyalty toward a restaurant. The other purpose of this study is to investigate how a restaurant’s socially responsible corporate activities could moderate the influence of risk perception on consumers’ trust and loyalty toward a restaurant (see Figure 1).
2. Literature Review
2.1. Risk Perception of Food Ingredients
In this study, “risk perception” regarding a restaurant’s food ingredients is defined as the total food ingredient transport process from production, harvest/slaughter, and manufacturing to storage to distribution to the restaurant and restaurant sales to consumers [1] (p. 1006). Risk perceptions of a restaurant’s food ingredients can describe all of the stages where major food insecurity issues are perceived by consumers [8]. This is also based on the notion that a consumer’s risk perceptions can dominate multiple levels of consideration in food consumption, leading the consumer to avoid particular food products or categories for a period of time [1]. Hence, this study helps identify risk clusters of consumers, which will be disseminated in several distinct socially responsible educational materials for restaurant managers to use for educated consumers.
2.2. Corporate Social Responsibility
Restaurants have initiated a wide range of corporate social responsibility (CSR) activities, including providing nutritional and healthy food information, local sourcing, product protection for the natural environment, charity for the community and workplace [9]. Of these activities, providing a healthy place to eat has become a way of communicating CSR initiatives in the restaurant industry [9]. For example, if a restaurant considers one of its core values to be to provide clear, health-associated ingredient information on a food product, its customers can identify a healthier option [10]. According to Herrick [11], a restaurant needs to accurately communicate information with integrity, establish trust, and depict a willingness to accept accountability for its food products’ long-term safety, as well as their quality [9]. Indication of a restaurant’s promotion of healthy eating, therefore, needs to be initiated as a CSR activity.
2.3. Trust and Loyalty
Trust refers to “a willingness to rely on an exchange partner in whom one has confidence” [12] (p. 315). Trust helps a restaurant to develop and establish an enterprise-customer relationship to maintain the restaurant’s value [9]. If a restaurant initiates societal marketing activities, its stakeholders, including consumers, will trust the restaurant, which can be a driver of restaurant loyalty [13]. Established trust helps a restaurant build its reputation and supports the overall quality of products, as well as services [14].
Loyalty has been a critical strategic impetus for business managers who strive to gain a competitive advantage in an oversaturated market [15]. Loyalty refers to a deeply held commitment to consistently re-visit a preferred store in the future, despite marketing activities and situational impacts that have the potential to lead to a switch in behavior [16]. Moreover, loyal customers tend to revisit the same store, are more willing to pay a premium price, and are more likely to provide positive word-of-mouth communications [17]. Hence, strengthening customer loyalty among current customers is critical for restaurant administrators to attain a competitive advantage.
According to perceived risk theory, if there is imperfect information regarding a product, consumers are less likely to make purchase decisions for the product as well as to positively evaluate it [18]. In the food service context, products with various food ingredients may increase restaurant consumers’ uncertainty (or risk perception) of food ingredients (e.g., how they should be stored, cooked, and served for the food products) [19]. Thus, a lack of information about a restaurant’s food ingredients may increase consumers’ risk perception of them, which may in turn decrease trust and loyalty toward the restaurant brand. However, the impacts of risk perception on trust and loyalty toward the restaurant brand may be decreased by its CSR activities, according to attribution theory [20]. The theory assumes that consumers tend to understand a company’s motives, which are embedded in their social marketing activities [21]. Hence, consumers are more likely to elaborate on the CSR activities when perceiving the social involvement of the company. The specific attributions underlying the CSR initiatives are able to affect consumers’ evaluations of the company [22]. Thus, when consumers perceive a food service company’s CSR activities, the influences of its food ingredients on trust and loyalty toward the company are likely to be weaker.
3. Methods
3.1. Sample and Data Collection
The data collection was performed between January and February of 2017 in major cities of South Korea (i.e., Seoul, Incheon, Seongnam, and Busan). The surveys were conducted at Ashley, VIPS, and Outback Steakhouse. These restaurant companies have been well recognized by domestic consumers and have been representative of popular branded restaurants in the country. In addition, they have extensively implemented CSR activities (e.g., donations to local communities and non-profit organizations) compared to other small and mid-sized restaurant companies. Well-trained graduate students majoring in hospitality and tourism management visited each restaurant’s outlets and requested owners or store managers to distribute the developed questionnaire to their customers. Participants were screened to make sure that only customers who were more than 18 years old were asked to participate in the survey. If one of the customers at a table did fill out the questionnaire, free desserts or beverage menu items (i.e., a $10 gift certificate) were offered to the tables as a reward in order to minimize non-response bias. Consequently, a total of 350 responses were collected, but 12 responses were disregarded because of incomplete responses and missing information, resulting in an 83% response rate. Thus, a total of 338 respondent surveys were used for the data analysis.
3.2. Survey Design
All constructs were measured with multiple-item scales developed and tested in previous studies and scored on a 7-point scale, ranging from “1 = strongly disagree” to “7 = strongly agree”. Risk perceptions of the supply chain are multifaceted. Preliminary survey items were generated from the related literature review pertaining to food safety risk assessment, risk perceptions in the meat supply chain, risk perceptions in menus, and the food service industry [1,23,24]. Trust was measured with four items indicating the perceived reliability and credibility of a restaurant [25]. Three items were adapted for measuring three types of behavioral loyalty (recommendation, revisit, and willingness to pay more) [26]. Lastly, this study will refer to Kim and Ham’s study [9] to measure a restaurant’s CSR activities.
4. Results
4.1. Sample Characteristics
Much more than half of the participants were female (n = 207; 61.2%) compared to male (n = 131; 38.8%). The age varied, with 29.0% being 18–29 years of age (n = 97), 29.6% being 30–39 years of age (n = 99), 32.6% being 40–49 years of age (n = 109), and 8.7% being over 50 years of age (n = 29). 40.5% had a degree from a four-year university (n = 104), 26.5% had a degree from a two-year college, and 31.0% had a diploma (n = 104). The annual income per household was distributed in the range of $40,000–$49,999 (n = 132, 39.1%), followed by $50,000–$59,999 (n = 84, 24.9%) and more than $60,000 (n = 57, 16.9%).
4.2. Measurement Model
Prior to further analysis, exploratory factor analysis (EFA) was conducted. Using the varimax procedure, principal component analysis was performed. As indicated in Table 1, three dimensions of risk perception of food ingredients were derived from EFA with eigenvalues (greater than 1): food ingredients for restaurant operation, food ingredients for health, and food ingredients management. A Kaiser–Meyer–Olkin Measure of Sampling Adequacy of 0.943 and a Bartlett’s Test of Sphericity of 5156.341 (d.f. = 91, p < 0.001) showed that the data were suitable for identifying three independent dimensions [27]. Also, all factor loadings of each dimension were greater than 0.50, which is considered statistically significant [28]. All dimensions’ reliability coefficients exceeded the minimum standard of 0.70 recommended by Nunnally and Bernstein [29]. The three dimensions explained 81.17% of the variance of the data.
Subsequently, the measurement model, which consists of all measures, was subjected to confirmatory factor analysis (CFA) for validity test. The result indicated good fits: χ2 = 640.480, d.f. = 194 (χ2/d.f. = 3.301), p < 0.001, RMSEA = 0.074, NFI = 0.903, CFI = 0.930, IFI = 0.930, TLI = 0.916 (see Table 2). Four items, whose factor loadings were below 0.40, were removed during a purification process. As a result, all standardized factor loadings exceeded 0.50 (p < 0.01), which indicates evidence of convergent validity [30].
To check discriminant validity, this study compared the proportion of variance extracted (AVE) in each construct to the coefficients’ square representing its correlation with other constructs [31]. All constructs’ AVEs exceeded the respective squared correlation estimate, showing evidence of discriminant validity (see Table 3).
4.3. Structural Model and Test of Hypotheses
The conceptual framework was empirically tested by AMOS 20.0 (IBMSPSS, Chicago, IL, USA) using a covariance matrix. The overall model fit indices addressed in the model did fit the data well: χ² = 440.972, d.f. = 125 (χ2/d.f. = 3.528), p < 0.001, RMSEA = 0.071, NFI = 0.921, CFI = 0.942, IFI = 0.942, TLI = 0.929. Maximum likelihood estimates for the proposed model’s parameters are indicated in and Table 4.
First, the proposed model predicted that the risk perception of food ingredient dimensions would affect trust. More specifically, the structural equation modeling results indicated that trust was significantly negatively affected by food ingredients for restaurant operation (coefficient = −0.232, t-value = −2.627, p < 0.01) and food ingredients management (coefficient = −0.469, t-value = −4.013, p < 0.01). However, food ingredients for health was not statistically significant (coefficient = −0.114, t-value = −0.917, p > 0.01). Second, the proposed model predicted that the risk perception of food ingredient dimensions would also influence loyalty. More specifically, the results illustrated that loyalty was significantly negatively influenced by food ingredients for restaurant operation (coefficient = −0.378, t-value = −3.338, p < 0.01) and food ingredients management (coefficient = −0.467, t-value = −3.180, p < 0.01). However, food ingredients for health was not statistically significant (coefficient = 0.200, t-value = 1.269, p > 0.05). The empirical findings of this study were congruent with prior results that perception of food safety was negatively associated with brand evaluations, attitudes, and purchase [32,33,34].
To test the moderating role of CSR activities of a restaurant in the relationships between risk perception and trust/loyalty, chi-square difference test using multi-group approach was used [30]. As the first step, the author divided the samples into two groups (i.e., high vs. low) based on the participants’ mean scores on perception of CSR activities of a restaurant. The unconstrained model, which allows all coefficients to differ between the divided groups (i.e., high and low), was compared to the constrained model, which was set to make the groups equal [35,36]. Table 5 displays statistically significant differences in the influences of risk perception on trust/loyalty between the high and low CSR perception groups. There were significant differences in four of the six paths: food ingredients for restaurant operation to trust (Δχ2(1) = 5.031, p < 0.01); food ingredients management to trust (Δχ2(1) = 17.996, p < 0.01); food ingredients for restaurant operation to loyalty (Δχ2(1) = 5.223, p < 0.05); and food ingredients management to loyalty (Δχ2(1) = 7.007, p < 0.01). These findings were congruent with previous ones suggesting that in risk situations, consumers are more likely to rely on sources of information, including interpersonal sources, advertising, positive word of mouth, and social activities when evaluating a brand or product [34,37,38].
5. Discussion
The aim of this study was to underscore the critical role of CSR activities of a restaurant brand in reducing the influence of risk perception of food ingredients on trust and loyalty toward the restaurant brand. While many consumers have become aware of food safety due to environmental issues and unethical businesses of a restaurant; nevertheless, a way of reducing the influence within the food service industry has not been well proposed. Furthermore, in the food service industry, uncertainty and issues of food ingredients may cause consumers not to eat out, as well as making them hesitant to visit a restaurant. Moreover, even though there have been a lot of food ingredients issues and unethical restaurant operations (e.g., expiration dates, kitchen and storage sanitation, etc.), there is a lack of research regarding the interrelationship between restaurant consumers’ risk perceptions of food ingredients and favorable outcomes (i.e., trust and loyalty toward the restaurant brand) with a moderator to reduce the impact of risk perceptions on the outcomes. Accordingly, this study investigated the impact of risk perception of food ingredients on trust and loyalty among restaurant consumers in South Korea. The empirical findings illustrated that when restaurant consumers have higher levels of risk perception of food ingredients (i.e., food ingredients for restaurant operation and food ingredients management), they are less likely to exhibit trust and loyalty toward a restaurant brand. However, interestingly, the influences of risk perception of food ingredients will be significantly weaker if the restaurant brand implements CSR activities.
This study identified three independent dimensions (i.e., food ingredients for restaurant operation, food ingredients for health, and food ingredients management) of risk perception of food ingredients and investigated their influences on both trust and loyalty toward a restaurant brand among restaurant consumers. The empirical results imply that as opposed to one dimension, risk perceptions of three dimensions of food ingredients provide a more powerful explanation of restaurant consumers’ trust and loyalty toward a restaurant brand. This contribution is managerially important, as a restaurant brand may need to effectively and efficiently manage food ingredients to save overall costs. Also, this study contributes to the literature and the food service industry by proposing a new moderator that can reduce the influence of risk perception on trust and loyalty toward a restaurant brand. This result may be significant, as the ultimate goal of the sustainable restaurant industry is to reduce uncertainty regarding food ingredients and to provide healthy foods to their consumers in an ethical manner. However, food ingredients for health did not significantly influence either trust or loyalty toward a restaurant brand. This result could be due to the fact that restaurant consumers might sufficiently recognize the influences of food ingredients on their health (e.g., how each food ingredient contributes to their body). Also, restaurant consumers are more likely to care about food ingredient management and food ingredients for restaurant operation than food ingredients for health from a statistical perspective. Such a tendency of restaurant consumers could result in these findings.
From a managerial perspective, the findings demonstrated that disclosure of food ingredients could be an effective CSR activity in terms of reducing risk perception of food ingredients among restaurant consumers. Restaurant companies have implemented various CSR activities (e.g., charitable giving, donation, community service, etc.). To effectively invest in CSR initiatives, however, restaurant brands may need to focus much more on a CSR activity based on their core product (e.g., menus and food ingredients) than other activities that are not relevant to foods. Restaurant companies can gain a competitive advantage by developing and implementing CSR activities with respect to food ingredients. This study empirically investigated that the provision of food ingredient information is effective in reducing the impact of risk perception of food ingredients on trust and loyalty. More specifically, in annual reports, restaurant companies may need to explain how they administrate food ingredients, how food ingredients are treated and stored, and whom they are working with. Most importantly, restaurant companies may need to use annual reports as a communication tool with their consumers. This is because menus do not have enough space to explain food ingredients of each food.
By expanding prior studies, overall, this study proposed to investigate the impacts of risk perception of food ingredients on trust and loyalty, as well as the moderating role of CSR activities of a restaurant in the relationship, simultaneously. To date, the extant literature on food safety has mostly focused on the relationship between risk perception and attitudes/behavior toward a restaurant brand. However, CSR activities have also been viewed as an essential variable in enhancing trust and loyalty among general consumers. Therefore, this research tried to expand the food risk literature.
6. Conclusions
Although consumers have recognized food safety and their perception of food ingredients has played a critical role in the food consumption process, prior research has not adequately investigated the drivers of reducing the influence of risk perception on attitudes and behavior among restaurant consumers. Accordingly, this study identified the dimensions of risk perception of food ingredients and then examined the impacts of three dimensions of perceived risk perception of food ingredients on satisfaction and loyalty among restaurant consumers in South Korea. The empirical results contribute to the existing literature on risk perception in the food service industry and call for additional studies extending the proposed framework with potential factors (e.g., satisfaction, commitment, attitudes, etc.). The factors might affect the risk perception of food ingredients and formation of trust and trust toward a restaurant brand among consumers. In addition, other moderators between risk perception and loyalty (e.g., gender, preference, previous experiences with a restaurant brand, etc.) could enhance the explanatory power of restaurant consumers’ risk perception of food ingredients that predicts their trust and loyalty toward the restaurant brand. Lastly, replicated research with an emphasis on perceived sustainability instead of CSR activities as a moderator is also suggested, as results might differ, and sustainable business strategies could be accordingly accommodated. Although this study provides several implications for the food service literature and industry, the approach of owners or store managers distributing the questionnaires to customers might have biased the empirical findings, since they might not control whether the customers who participated in this study responded to only one questionnaire. Hence, future research should control for double response bias in order to increase the level of external validity.
Author Contributions
For research articles with several authors, a short paragraph specifying their individual contributions must be provided. The following statements should be used “All the authors conceived and designed the research and D.-W.K. wrote all sections and analyzed the data”.
Funding
This research received no external funding.
Acknowledgments
The author(s) received no financial support for the research, authorship, and/or publication of this article.
Conflicts of Interest
The authors declare no conflict of interest.
References
- Zingg, A.; Cousin, M.E.; Connor, M.; Siegrist, M. Public risk perception in the total meat supply chain. J. Risk Res. 2013, 16, 1005–1020. [Google Scholar] [CrossRef]
- Verbeke, W.; Frewer, L.J.; Scholderer, J.; De Brabander, H.F. Why consumers behave as they do with respect to food safety and risk information. Anal. Chim. Acta 2007, 586, 2–7. [Google Scholar] [CrossRef] [PubMed]
- Sofos, J.N. Challenges to meat safety in the 21st century. Meat. Sci. 2008, 78, 3–13. [Google Scholar] [CrossRef] [PubMed]
- Berfield, S. Inside Chipotle’s Contamination Crisis: Smugness and Happy Talk about Sustainability Aren’t Working Anymore. 2015. Available online: https://www.bloomberg.com/features/2015-chipotle-food-safety-crisis/ (accessed on 20 July 2018).
- Issanchou, S. Consumer expectations and perceptions of meat and meat product quality. Meat. Sci. 1996, 43, 5–19. [Google Scholar] [CrossRef]
- Bloomberg. Bloomberg Businessweek. 2015. Available online: https://www.bloomberg.com/businessweek (accessed on 18 July 2018).
- Maloni, M.J.; Brown, M.E. Corporate social responsibility in the supply chain: An application in the food industry. J. Bus. Ethics 2006, 68, 35–52. [Google Scholar] [CrossRef]
- Grunert, K.G. Food quality and safety: Consumer perception and demand. Eur. Rev. Agric. Econ. 2005, 32, 369–391. [Google Scholar] [CrossRef]
- Kim, E.; Ham, S. Restaurants’ disclosure of nutritional information as a corporate social responsibility initiative: Customers’ attitudinal and behavioral responses. Int. J. Hosp. Manag. 2016, 55, 96–106. [Google Scholar] [CrossRef]
- Jones, P.; Comfort, D.; Hillier, D. Healthy eating and the UK’s major food retailers: A case study in corporate social responsibility. Br. Food. J. 2006, 108, 838–848. [Google Scholar] [CrossRef]
- Herrick, C. Shifting blame/selling health: Corporate social responsibility in the age of obesity. Sociol. Health Ill. 2009, 31, 51–65. [Google Scholar] [CrossRef] [PubMed]
- Moorman, C.; Zaltman, G.; Deshpande, R. Relationships between providers and users of market research: The dynamics of trust within and between organizations. J. Mark. Res. 1992, 29, 314–328. [Google Scholar] [CrossRef]
- Vlachos, P.A.; Tsamakos, A.; Vrechopoulos, A.P.; Avramidis, P.K. Corporate social responsibility: Attributions, loyalty, and the mediating role of trust. J. Acad. Mark. Sci. 2009, 37, 170–180. [Google Scholar] [CrossRef]
- Paine, L.S. Does ethics pay? Bus. Ethics Q. 2000, 10, 319–330. [Google Scholar] [CrossRef]
- Wu, C.H.J.; Liang, R.D. The relationship between white-water rafting experience formation and customer reaction: A flow theory perspective. Tourism Manag. 2011, 32, 317–325. [Google Scholar] [CrossRef]
- Oliver, R.L. Whence consumer loyalty? J. Mark. 1999, 63, 33–44. [Google Scholar] [CrossRef]
- Chi, C.G.Q.; Qu, H. Examining the structural relationships of destination image, tourist satisfaction and destination loyalty: An integrated approach. Tourism Manag. 2008, 29, 624–636. [Google Scholar] [CrossRef]
- Angulo, A.M.; Gil, J.M. Risk perception and consumer willingness to pay for certified beef in Spain. Food Qual. Prefer. 2007, 18, 1106–1117. [Google Scholar] [CrossRef] [Green Version]
- Klerck, D.; Sweeney, J.C. The effect of knowledge types on consumer-perceived risk and adoption of genetically modified foods. Psychol. Mark. 2007, 24, 171–193. [Google Scholar] [CrossRef]
- Jones, E.; Davis, K. The attribution process in person perception. Adv. Exp. Soc. Psychol. 1965, 2, 220–266. [Google Scholar]
- Becker-Olsen, K.L.; Cudmore, B.A.; Hill, R.P. The impact of perceived corporate social responsibility on consumer behavior. J. Bus. Res. 2006, 59, 46–53. [Google Scholar] [CrossRef] [Green Version]
- Campbell, M.; Kirmani, A. Consumer’s use of persuasion knowledge: The effects of accessibility and cognitive capacity on perceptions of an influence agent. J. Consum. Res. 2000, 27, 69–83. [Google Scholar] [CrossRef]
- Buchholz, U.; Run, G.; Kool, J.L.; Fielding, J.; Mascola, L. A risk-based restaurant inspection system in Los Angeles County. J. Food. Protect. 2002, 65, 367–372. [Google Scholar] [CrossRef]
- Kozup, J.C.; Creyer, E.H.; Burton, S. Making healthful food choices: The influence of health claims and nutrition information on consumers’ evaluations of packaged food products and restaurant menu items. J. Mark. 2003, 67, 19–34. [Google Scholar] [CrossRef]
- Napoli, J.; Dickinson, S.J.; Beverland, M.B.; Farrelly, F. Measuring consumer-based brand authenticity. J. Bus. Res. 2014, 67, 1090–1098. [Google Scholar] [CrossRef]
- Ladhari, R.; Brun, I.; Morales, M. Determinants of dining satisfaction and post-dining behavioral intentions. Int. J. Hosp. Manag. 2008, 27, 563–573. [Google Scholar] [CrossRef]
- Lee, Y.K.; Lee, C.K.; Lee, S.K.; Babin, B.J. Festivalscapes and patrons' emotions, satisfaction, and loyalty. J. Bus. Res. 2008, 61, 56–64. [Google Scholar] [CrossRef]
- Hair, J.F.; Anderson, R.E.; Tatham, R.E.; Black, W.C. Multivariate Data Analysis, 5th ed.; Prentice Hall: Upper Saddle River, NJ, USA, 1998; ISBN 9780138948580. [Google Scholar]
- Nunnally, J.C.; Bernstein, I.H. Psychometric Theory. In Psychology; McGraw-Hill: New York, NY, USA, 1994; ISBN 0070474656. [Google Scholar]
- Kim, M.S.; Thapa, B.; Kim, H. International tourists’ perceived sustainability of Jeju Island, South Korea. Sustainability 2017, 10, 73. [Google Scholar] [CrossRef]
- Fornell, C.; Larcker, D.F. Evaluating structural equation models with unobservable variables and measurement error. J. Mark. Res. 1981, 18, 39–50. [Google Scholar] [CrossRef]
- Chen, M.F.; Li, H.L. The consumer’s attitude toward genetically modified foods in Taiwan. Food Qual. Prefer. 2007, 18, 662–674. [Google Scholar] [CrossRef]
- Grewal, D.; Gopalkrisnan, R.I.; Gotlieb, J.; Levy, M. Developing a deeper understanding of post-purchase perceived risk and behavioural intentions in a service-setting. J. Acad. Mark. Sci. 2007, 35, 250–258. [Google Scholar] [CrossRef]
- Tuu, H.H.; Olsen, S.O. Food risk and knowledge in the satisfaction-repurchase loyalty relationship. Asia Pac. J. Mark. Logist. 2009, 21, 521–536. [Google Scholar] [CrossRef]
- Jöreskog, K.G.; Sörbom, D. LISREL 8: Structural Equation Modeling with the SIMPLIS Command Language; Lawrence Erlbaum Associates: Hillsdale, NJ, USA, 1993; ISBN 0894980335. [Google Scholar]
- Jang, Y.J.; Kim, W.G.; Lee, H.Y. Coffee shop consumers’ emotional attachment and loyalty to green stores: The moderating role of green consciousness. Int. J. Hosp. Manag. 2015, 44, 146–156. [Google Scholar] [CrossRef]
- Gurhan-Canli, Z.; Batra, R. When corporate image affects product evaluations: The moderating role of Perceived risk. J. Mark. Res. 2004, 41, 197–205. [Google Scholar] [CrossRef]
- Yeung, R.M.W.; Yee, W.M.S. Consumer perception of food safety related risk: A multiple regression approach. J. Int. Food Agribus. Mark. 2005, 17, 195–222. [Google Scholar] [CrossRef]
Figure 1.
Conceptual framework.


Table 1.
Results of exploratory factor analysis for risk perception.
| Constructs and Items | Factor Loading | Eigen Value | Variance Explained |
|---|---|---|---|
| Food ingredients for restaurant operation (α = 0.964) | 5.657 | 40.408 | |
| Food ingredients’ expiration date | 0.810 | ||
| Standards of hygiene in food ingredients | 0.870 | ||
| Level of pesticide residues in good ingredients | 0.805 | ||
| Restaurant care when handling food ingredients | 0.794 | ||
| The safety of food ingredients | 0.790 | ||
| Ethical production of food ingredients | 0.779 | ||
| Food storage | 0.760 | ||
| Hygiene at the food ingredients’ production stage | 0.662 | ||
| Food ingredients for health (α = 0.912) | 3.515 | 25.108 | |
| Additives in food ingredients | 0.788 | ||
| Food ingredients from an environmentally friendly production facility | 0.769 | ||
| Organic ingredients | 0.744 | ||
| Food ingredients management (α = 0.845) | 2.192 | 15.654 | |
| Food ingredients’ packaging | 0.901 | ||
| Food ingredients’ transport to restaurant | 0.701 | ||
| Food ingredients’ storage at restaurant | 0.589 |
Table 2.
Results of confirmatory factor analysis for measurement model 1.
| Constructs and Items | Factor Loading | t-Value |
|---|---|---|
| Food ingredients for restaurant operation (α = 0.943) | ||
| Food ingredients’ expiration date | 0.872 | Fixed |
| Standards of hygiene in food ingredients | - | - |
| Level of pesticide residues in good ingredients | 0.887 | 23.190 |
| Restaurant care when handling food ingredients | 0.930 | 25.671 |
| The safety of food ingredients | 0.853 | 21.396 |
| Ethical production of food ingredients | - | - |
| Food storage | 0.845 | 21.015 |
| Hygiene at the food ingredients’ production stage | - | - |
| Food ingredients for health (α = 0.912) | ||
| Additives in food ingredients | 0.843 | Fixed |
| Food ingredients from an environmentally friendly production facility | 0.902 | 21.685 |
| Organic ingredients | 0.905 | 21.842 |
| Food ingredients management (α = 0.845) | ||
| Food ingredients’ packaging | 0.777 | Fixed |
| Food ingredients’ transport to restaurant | 0.892 | 17.324 |
| Food ingredients’ storage at restaurant | 0.750 | 14.303 |
| Trust (α = 0.908) | ||
| I think this restaurant is trustworthy. | 0.895 | Fixed |
| I think this restaurant is competent. | 0.889 | 22.992 |
| I think this restaurant is honest. | 0.804 | 19.131 |
| I have confident in the quality of this restaurant. | 0.781 | 18.203 |
| Loyalty (α = 0.918) | ||
| I will certainly recommend this restaurant to friends and acquaintances (recommendation). | 0.936 | Fixed |
| This restaurant will be my first choice if I stay in the area again (revisit). | 0.825 | 21.614 |
| I would pay a higher price than the competitors charge for the benefits that I received from this restaurant (willingness to pay more). | 0.906 | 26.301 |
| CSR activities of a restaurant (α = 0.842) | ||
| I think the restaurant offering food ingredient information is aware of health issues. | 0.656 | Fixed |
| I think the restaurant offering food ingredient information fulfills its social responsibility. | 0.799 | 12.259 |
| I think the restaurant offering food ingredient information shows its commitment toward society by improving the welfare of the communities. | 0.852 | 12.801 |
| I think the restaurant offering food ingredient information satisfies consumers’ needs. | - | - |
| I think the restaurant offering food ingredient information protects consumers’ rights. | 0.750 | 11.674 |
1 χ2 = 640.480, d.f. = 194 (χ2/d.f. = 3.301), p < 0.001, RMSEA = 0.074, NFI = 0.903, CFI = 0.930, IFI = 0.930, TLI = 0.916.
Table 3.
Construct intercorrelations (Φ), mean, standard deviation (SD), CCR, and AVE
| Constructs | Mean | SD | FIRO | FIH | FIM | Trust | Loyalty | CSR |
|---|---|---|---|---|---|---|---|---|
| FIRO | 3.951 | 1.366 | 1 | |||||
| FIH | 3.746 | 1.293 | 0.685 ** | 1 | ||||
| FIM | 3.562 | 1.207 | 0.617 ** | 0.669 ** | 1 | |||
| Trust | 4.168 | 1.013 | −0.453 ** | −0.366 ** | −0.365 ** | 1 | ||
| Loyalty | 4.394 | 1.168 | −0.266 ** | −0.272 ** | −0.319 ** | 0.423 ** | 1 | |
| CSR | 4.498 | 1.036 | −0.274 ** | −0.264 ** | −0.342 ** | 0.514 ** | 0.606 ** | 1 |
| CCR a | 0.944 | 0.914 | 0.849 | 0.908 | 0.920 | 0.850 | ||
| AVE b | 0.771 | 0.781 | 0.654 | 0.712 | 0.793 | 0.589 |
FIRO: Food ingredients for restaurant operation, FIH: Food ingredients for health, FIM: Food ingredients management, CSR: CSR activities of a restaurant, ** p < 0.01, * p < 0.05, a Composite construct reliability, b Average variance extracted.
Table 4.
Standardized parameter estimates.
| Path | Standardized Estimates | Standardized Error | t-Value |
|---|---|---|---|
| Food ingredients for restaurant operation → Trust | −0.232 | 0.070 | −2.627 ** |
| Food ingredients for health → Trust | −0.114 | 0.111 | −0.917 |
| Food ingredients management → Trust | −0.469 | 0.118 | −4.013 ** |
| Food ingredients for restaurant operation → Loyalty | −0.378 | 0.067 | −3.338 ** |
| Food ingredients for health → Loyalty | 0.200 | 0.105 | 1.269 |
| Food ingredients management → Loyalty | −0.467 | 0.111 | −3.180 ** |
** p < 0.01, * p < 0.05.
Table 5.
Chi-square difference tests and standardized structural estimates of low and high CSR perception.
Table 5.
Chi-square difference tests and standardized structural estimates of low and high CSR perception.
| Path | Standardized Estimates (t-Value) | Chi-Square Difference | |
|---|---|---|---|
| Low (n = 177) | High (n = 161) | ||
| Food ingredients for restaurant operation → Trust | −0.494 ** (−3.064) | −0.039 (−0.361) | 5.031 ** |
| Food ingredients for health → Trust | −0.306 (−1.801) | 0.092 (0.558) | 2.511 |
| Food ingredients management → Trust | −0.827 ** (−4.932) | 0.013 (0.129) | 17.996 ** |
| Food ingredients for restaurant operation → Loyalty | −0.695 ** (−3.596) | −0.308 * (−2.027) | 3.591 |
| Food ingredients for health → Loyalty | −0.629 ** (−2.627) | −0.052 (−0.261) | 5.223 * |
| Food ingredients management → Loyalty | −0.815 ** (−3.374) | 0.052 (−0.430) | 7.007 ** |
** p < 0.01, * p < 0.05.
© 2018 by the author. Licensee MDPI, Basel, Switzerland. This article is an open access article distributed under the terms and conditions of the Creative Commons Attribution (CC BY) license (http://creativecommons.org/licenses/by/4.0/).
Share and Cite
MDPI and ACS Style
Koo, D.-W. The Impact of Risk Perceptions of Food Ingredients on the Restaurant Industry: Focused on the Moderating Role of Corporate Social Responsibility. Sustainability 2018, 10, 3132. https://0-doi-org.brum.beds.ac.uk/10.3390/su10093132
AMA Style
Koo D-W. The Impact of Risk Perceptions of Food Ingredients on the Restaurant Industry: Focused on the Moderating Role of Corporate Social Responsibility. Sustainability. 2018; 10(9):3132. https://0-doi-org.brum.beds.ac.uk/10.3390/su10093132
Chicago/Turabian StyleKoo, Dong-Woo. 2018. "The Impact of Risk Perceptions of Food Ingredients on the Restaurant Industry: Focused on the Moderating Role of Corporate Social Responsibility" Sustainability 10, no. 9: 3132. https://0-doi-org.brum.beds.ac.uk/10.3390/su10093132
Note that from the first issue of 2016, this journal uses article numbers instead of page numbers. See further details here.