The Sustainability of Energy Substitution in the Chinese Electric Power Sector


1
Business School of Yango University, Fuzhou 350015, China
2
Hunan Rural Credit Cooperative, Changsha 410208, China
3
College of Finance, Feng Chia University, Taichung 40724, Taiwan
4
Department of Finance, Fintech Center, and Big Data Research Center, Asia University, Taichung 41354, Taiwan
5
Department of Medical Research, China Medical University Hospital, Taichung 40447, Taiwan
6
Department of Economics and Finance, Hang Seng University of Hong Kong, Hong Kong 999077, China
*
Author to whom correspondence should be addressed.
Sustainability 2020, 12(13), 5463; https://0-doi-org.brum.beds.ac.uk/10.3390/su12135463
Submission received: 8 May 2020
/
Revised: 30 June 2020
/
Accepted: 2 July 2020
/
Published: 7 July 2020
(This article belongs to the Special Issue Behavioral Business and Behavioral Financial Economics with Applications)
Abstract
:The Chinese electric power industry, including its coal industry and other energy industries that are not efficient, contributes to China’s serious energy shortages and environmental contamination. The governing authority considers energy conservation to be one of the most prominent national targets, and has formulated various plans for decarbonizing the power system. Applying the trans-log cost function, this paper examined the trans-log cost function to analyze the potential inter-factor substitution among energy, capital and labor. We also investigated what role human capital played in energy substitution for the electric power sector during the period from 1981 to 2017. Three key results were derived: (1) energy is price-insensitive, (2) there exists large substitution sustainability between both capital and labor with energy, and (3) human capital input not only enhances the extent of energy substitutability with capital and labor but also is a substitute to energy itself. These findings imply that the liberalization of the electric price mechanism is conducive to lessening energy use and augmenting non-energy intensiveness, and that energy conservation technology could become more sustainable by investing more capital in the electricity sector, thereby achieving a capital–energy substitution and a decrease of CO2 emissions. We further suggest that the priority for the Chinese electric power industry should be to attach more importance to increasing human capital input.
Keywords:
energy substitution; inter-factor substitution; trans-log cost function; electric power industry; sustainabilityJEL Classification:
H32; L69; Q411. Introduction
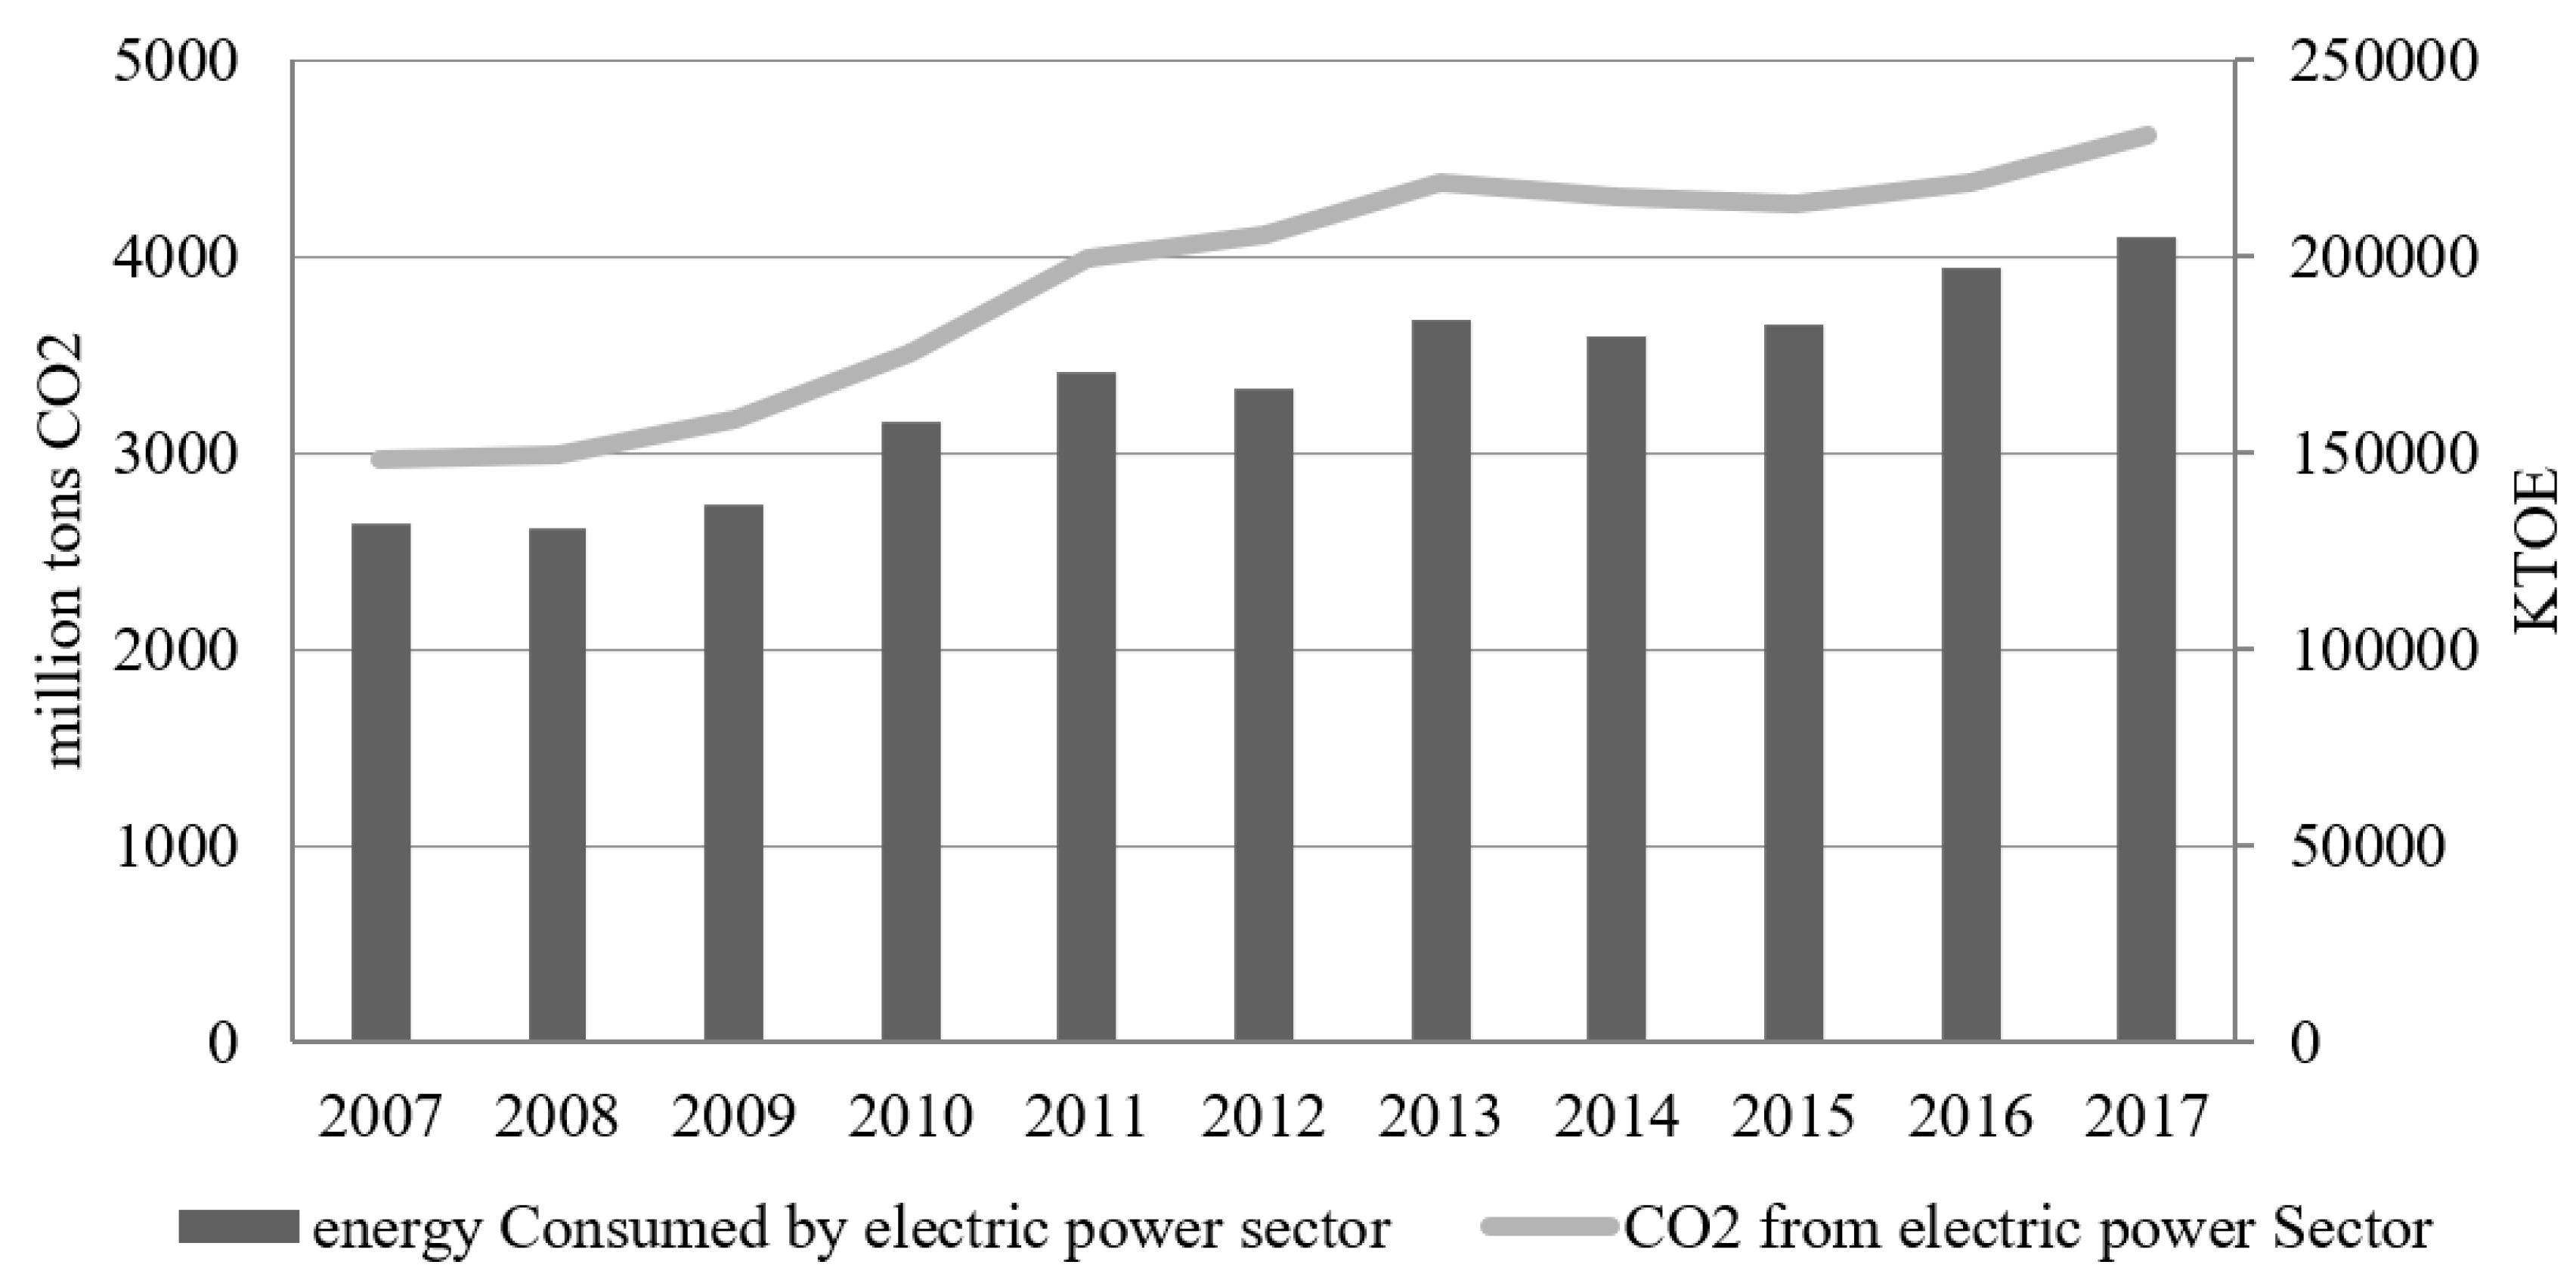
China, the world’s current largest energy consumer, is now confronting a big challenge in seeking equilibrium between sustainable development and economic growth. By the end of 2017, China consumed 3077 billion tons of oil equivalent (TOE), ranking first in the world, and this will likely continue soaring during the process of industrialization and urbanization, which will further intensify the imbalance between energy supply and demand. China has seven cities listed among the ten most contaminated international cities, implying that the pollution levels in China are higher than the World Health Organization (WHO) standards [1]. No other country depends on coal to the degree that China does, and no sector in China depends on coal to the degree that the electricity sector does. The electric power industry has a key role in economic development and people’s welfare, directly or indirectly linking with all significant sectors in China. However, electricity generation leads to several issues, which are mainly correlated with the emission of greenhouse gases (GHGs) and energy consumption, resulting in global environmental deterioration. The electric power industry, with a large proportion of inefficient generating units, is predominately coal-based, and contributes to most of China’s serious energy shortages and environmental contamination. It is also the largest global source of GHG emissions (International Energy Agency, IEA, 2012). Figure 1 illustrates that the enhanced energy consumption of the Chinese electricity sector moved along with the consequential CO2 emissions in the past ten years.
China has a considerably imbalanced energy structure, with an abundance of coal and hydropower, but deficiencies in both oil and gas. Owing to reserve limitations, thermal power occupies a dominant position (67.3%) in the Chinese power generation mix, while the proportions of hydro, nuclear and wind power are relatively low. In general, thermal power generation uses coal with roughly 28% ash content, which is much higher than other power generation modes, thus making itself a dominant producer of pollutant emissions such as SO2, NOX and flue dust, which contaminate the ecosystem and atmosphere. Furthermore, though the energy efficiency of the electric power industry has increased substantially during the last decade, there is still a hard gap to surmount between China and other developed economic entities. The energy intensity of electricity generation is higher than the average level of other developed countries. As a result, the electricity sector is the largest consumer of coal resources and the key contributor to severe environmental problems. To specify, the electric power industry accounted for almost 50% of Chinese CO2 emissions in 2017, according to the statistics in the IEA database.
The elasticities of energy substitution are involved in many important issues, including investment subsidies, carbon and gas emissions, and capital, carbon and fuel taxes [2]; thus, it is a major target and tool for environmental policymakers and planners to grasp the ability to convert production factors. In such an international environment, energy substitution research is vital for both the theoretical enrichment of energy economics and practical applications of national environmental and energy policies. The electric power industry is particularly crucial for the field because it accounts for almost half of the national greenhouse gas emissions, and an even larger proportion of the whole country’s consumption of primary energy resources.
China has enacted a host of policies and laws targeted at energy conservation and environmental protection related to the electric power industry in order to attain sustainable development; for example, the Revised Energy Conservation Law, and China’s plans for both energy and nuclear power developments. Safarzadeh et al. [3] suggested that China, the USA and Sweden are the countries addressed the most on industrial energy efficiency programs and their applications. This further underlines the importance of investigating whether there is any possible energy substitution in this sector. However, as far as we know, there has been no study in the literature on China’s inter-factor substitution sustainability with respect to the electric power industry until now. This paper helps fill the essential gap in this aspect. Employing the trans-log cost function, this research examines the substitution between non-energy and energy factors, and particularly explores the peculiar role of human capital input in moving the Chinese electric power industry towards a low-carbon system over the 1981–2017 period.
The remainder of the article is organized as follows. We give a brief review of the major empirical literature of energy and non-energy substitution in Section 2. Section 3 introduces the data sources, followed in Section 4 by a discussion of the methodologies employed in this study. Section 5 discusses the estimated results, provides the scenario analysis and investigates the unique impact of human capital input. Section 6 gives the conclusions and policy implications.
2. Literature Review
Since Berndt and Wood [4] wrote about the study of energy substitution, the sign and magnitude of energy elasticities of substitution have been broadly debated by researchers associated with numerous regions and industries, with divergent results [5]. The empirical literature in academia has so far discovered proof of both complementarity and substitutability for energy and other traditional inputs. Christopoulos and Tsiona [6] and Arnberg and Bjorner [7] insisted that energy and non-energy are strong complements, while Welsch and Ochsen [8], Koetse et al. [9] and Lin and Xie [10] found assertive evidence of energy and non-energy being substitutable. However, Halvorsen and Ford [11] and Field and Grebenstein [12] discovered ‘mixed results’ on energy and non-energy substitutability.
The relationships between non-energy and energy inputs vary across studies because academics applied different approaches, use different periods in their studies and use different datasets [12]. Some scholars attempted to explore the internal causes, including Apostolakis [2], who reviewed the early literature and noticed that most studies employing time-series data sorted energy and non-energy as complements, while most studies employing pooled data classified them as substitutes. He concluded that the principal explanation for this distinction was that the time-series mainly showed short-term effects, while pooled cross-section data mainly expressed long-term influence. This notwithstanding, Fondel and Schmidt [13] held the view that cross-price-elasticity depended on the factors’ cost shares. Kander and Schon [14] estimated the energy—capital substitutability in Sweden over the period 1970–2000 and obtained a similar result to the former study.
The literature on inter-factor substitution in developing countries is very limited (Presley et al. [15]), especially in China [12,16]. The restricted amount of work on this topic is due to the fact that few scholars have paid attention to the feasibility of substitution between energy and other classical factors, and the few existing papers appear quite unrealistic as there are many econometric mistakes, including model misspecification and a short period of data. As Ma et al. [17] stated, “new and more representative datasets and more appropriate robust econometric techniques are needed to explore the estimation of the elasticities of the substitution of energy–capital and energy–labor and the demand for energy in China.” Further study on the interplay of energy and other traditional inputs is urgent. In recent years, scholars have filled this gap in the literature by analyzing inter-factor or inter-fuel substitution on an economy-wide level. For instance, Lu and Zhou [18] gauged the own-price elasticities and Allen elasticities of inter-factor substitution in the manufacturing sector, and found capital–labor and labor–energy to be strong substitutes, and capital-energy to be a strong complement. Guo et al. [16] calculated the own-price elasticities and Morishima elasticities and found strong evidence of energy–capital and energy-labor substitutability in the Chinese industrial sector. Su et al. [19] utilized the production function to examine the elasticities of substitution between capital stock, labor and energy for China. He and Lin [20] revealed both heterogeneity and asymmetric effects in the energy–capital substitutability of the manufacturing sectors in China, while Wei et al. [21] examined inter-factor substitution in China’s high-tech industries, and found that the effect of factor substitution has gradually increased in recent years.
Whereas studies of China’s energy substitution are limited, academics have ignored the electricity sector, and the non-energy inputs have always been limited to capital and labor. To date, there has been no study available to researchers or policymakers and planners that has estimated inter-factor substitution whilst considering human capital for China’s electricity generation industry. This paper intends to fill this gap.
3. Data and Methodology
We conducted this study by employing the following inputs: capital stock (), energy use (), labor use () and human capital stock (). The total cost series () consisted of capital stock, aggregate energy use, labor use and human capital stock. The four-factor share series were estimated using four-factor inputs and the total cost series.
We followed the literature to construct the four-factor price indices as follows: the aggregate energy price index () is counted as the fuel and power price index, which is provided by the China Statistical Yearbook (CSY). The capital stock price index () given by [14] satisfies
where is the capital price, is the depreciation rate, is the nominal interest rate, τ is the marginal corporate income tax rate, is the capital real price gradient, and is the capital real price. In particular, when τ = 0, = 1, and = , represents the actual inflation rate. We used the labor price index () to represent the labor wage rate, which is the ratio of the total wage payment over total employment in the Chinese electric power industry. We used the GDP deflator index to represent the index () of the human capital stock price. We used the fixed assets price index and the weighted index of the consumer price index to estimate the GDP deflator index to deflate GDP, because the GDP deflator is not available in the CSY, and capital costs and labor are the main components that form GDP in China. The base year for all four-factor price indices was 1981. All of the above indicators were obtained for the Chinese electric power industry, and for each year from 1981 to 2017, offering a time database with 36 observations.
The four principal data sources in this study are the State Development Planning Commission of China (SDPC), the China Energy Yearbook (CEY), the CSY, and the China Industry Economy Yearbook (CIEY). The data of capital investment, employment, wages, the consumer price index, and a fixed assets price index are obtained from CSY. However, we cannot get any statistics for both capital stock and human capital stock from CSY. Thus, we used the perpetual inventory method to estimate the capital stock/human capital stock series, as shown in the following equation:
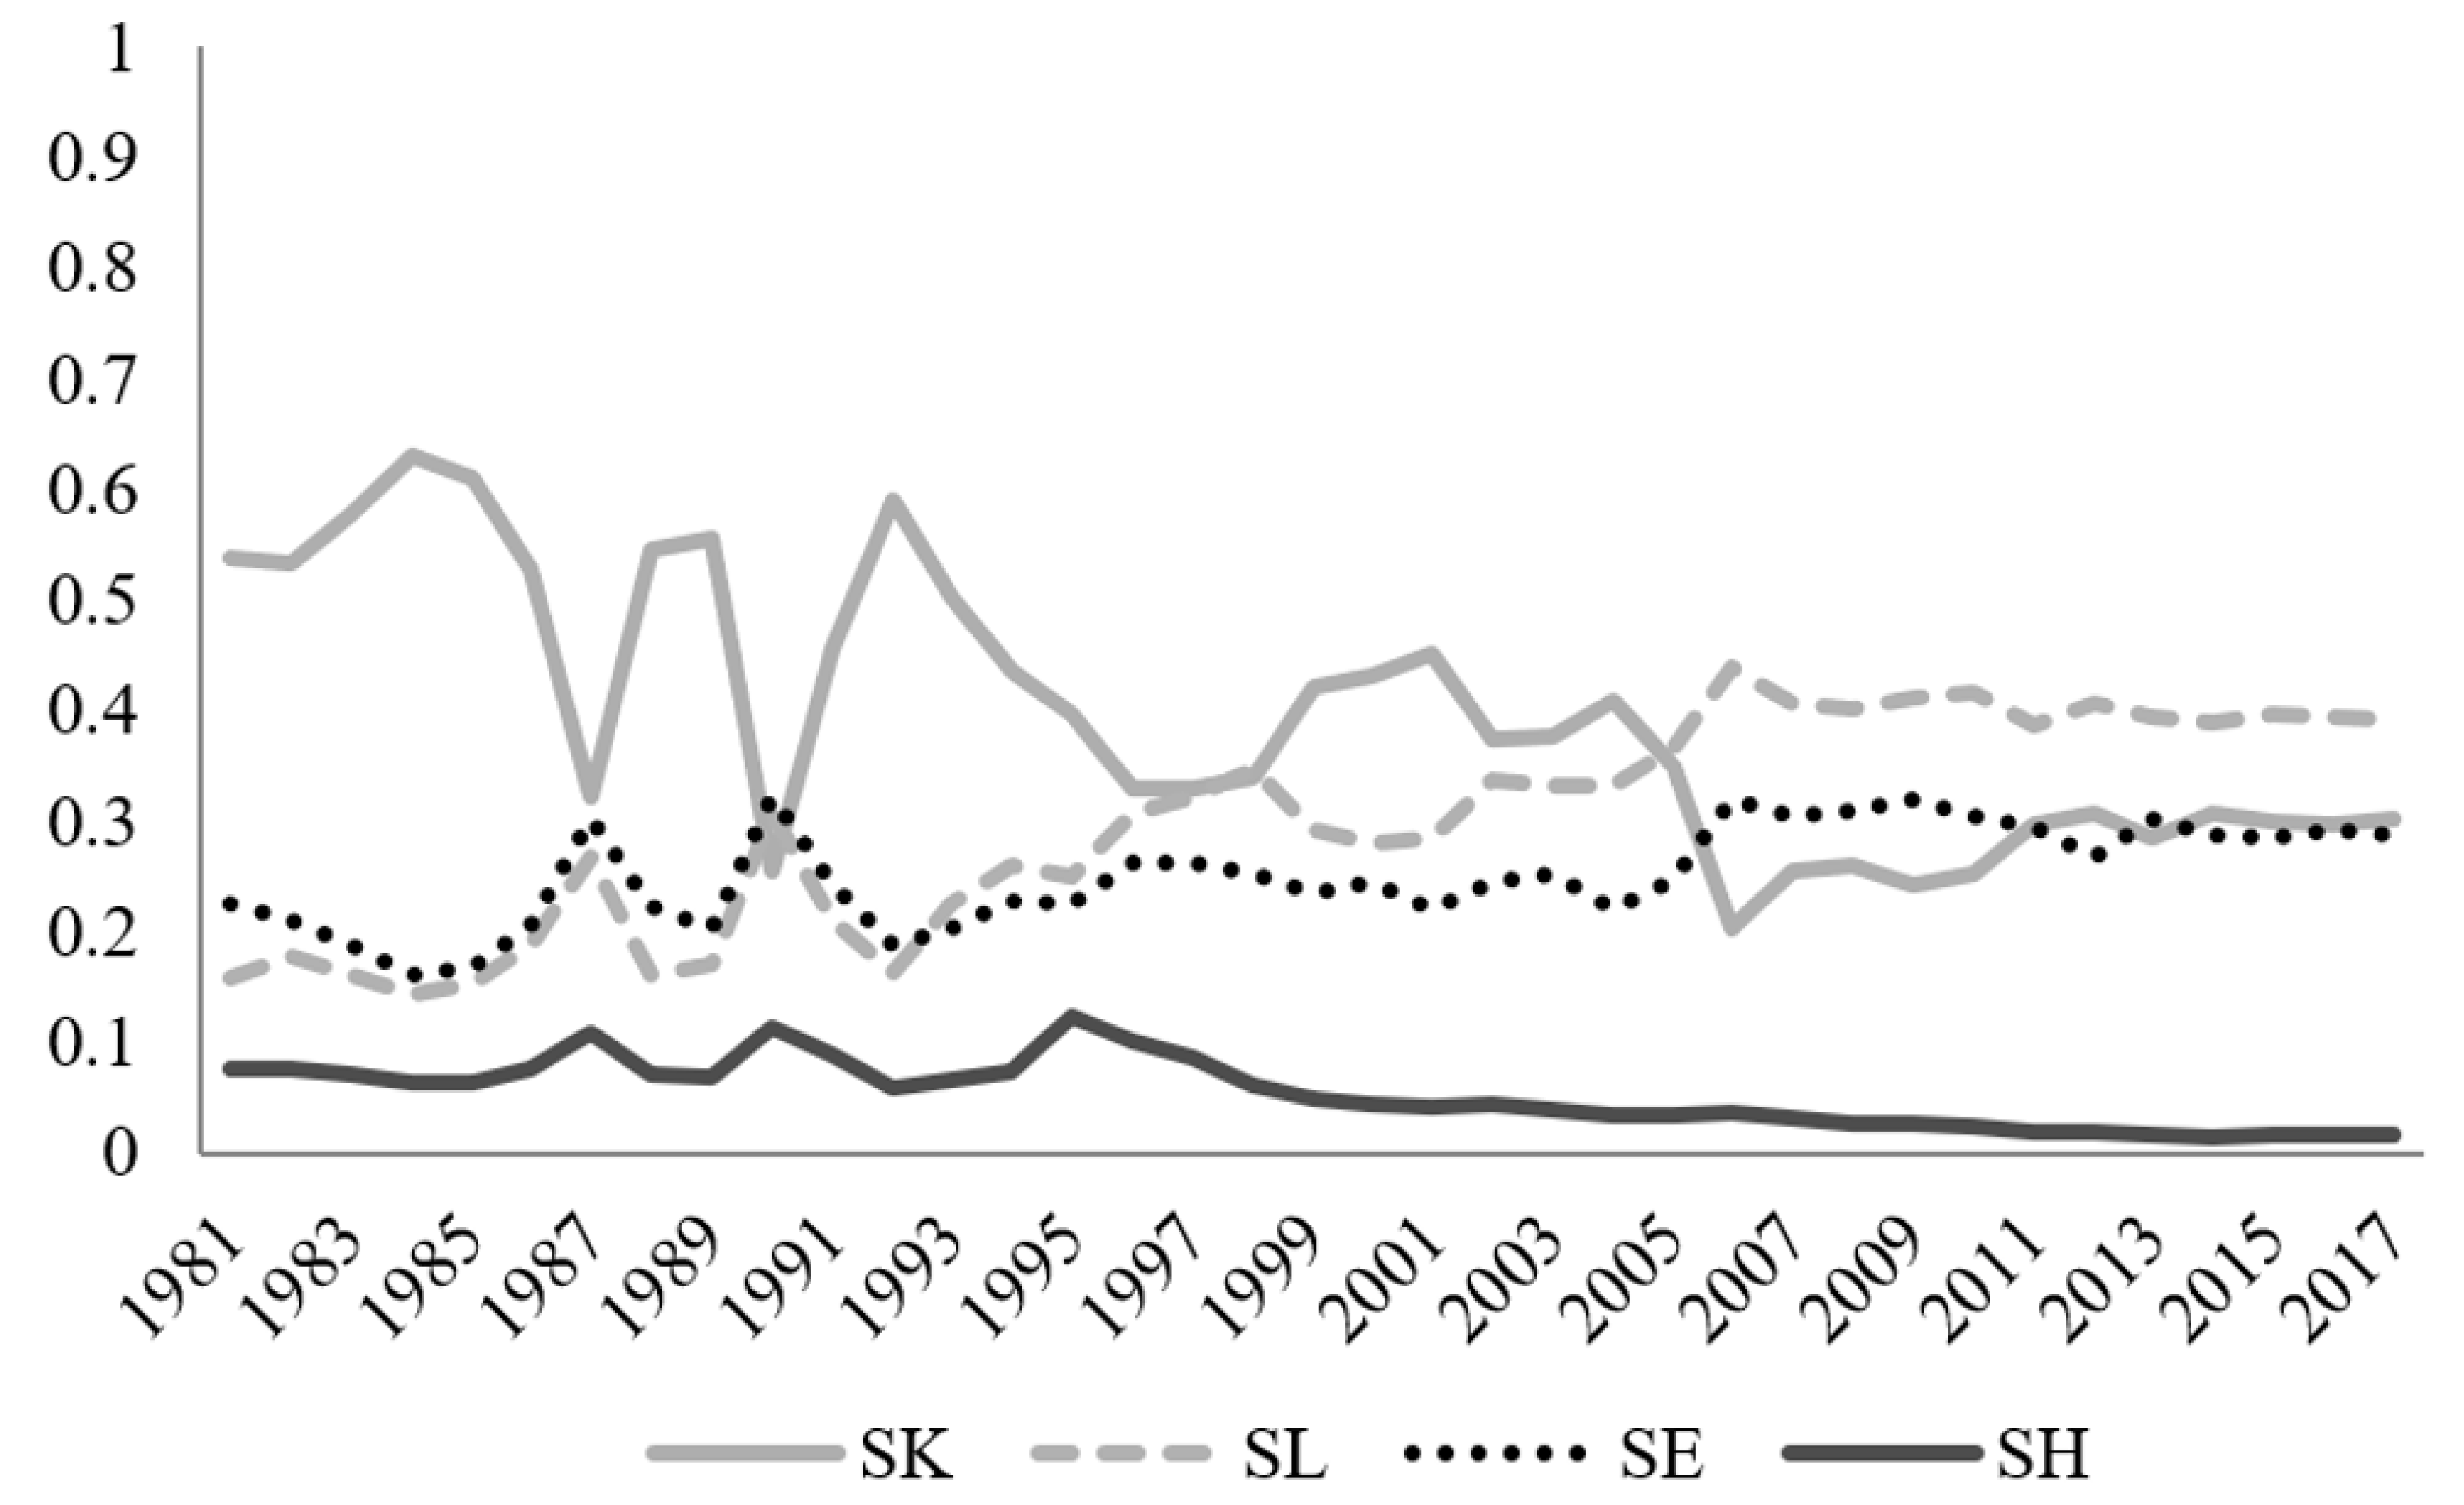
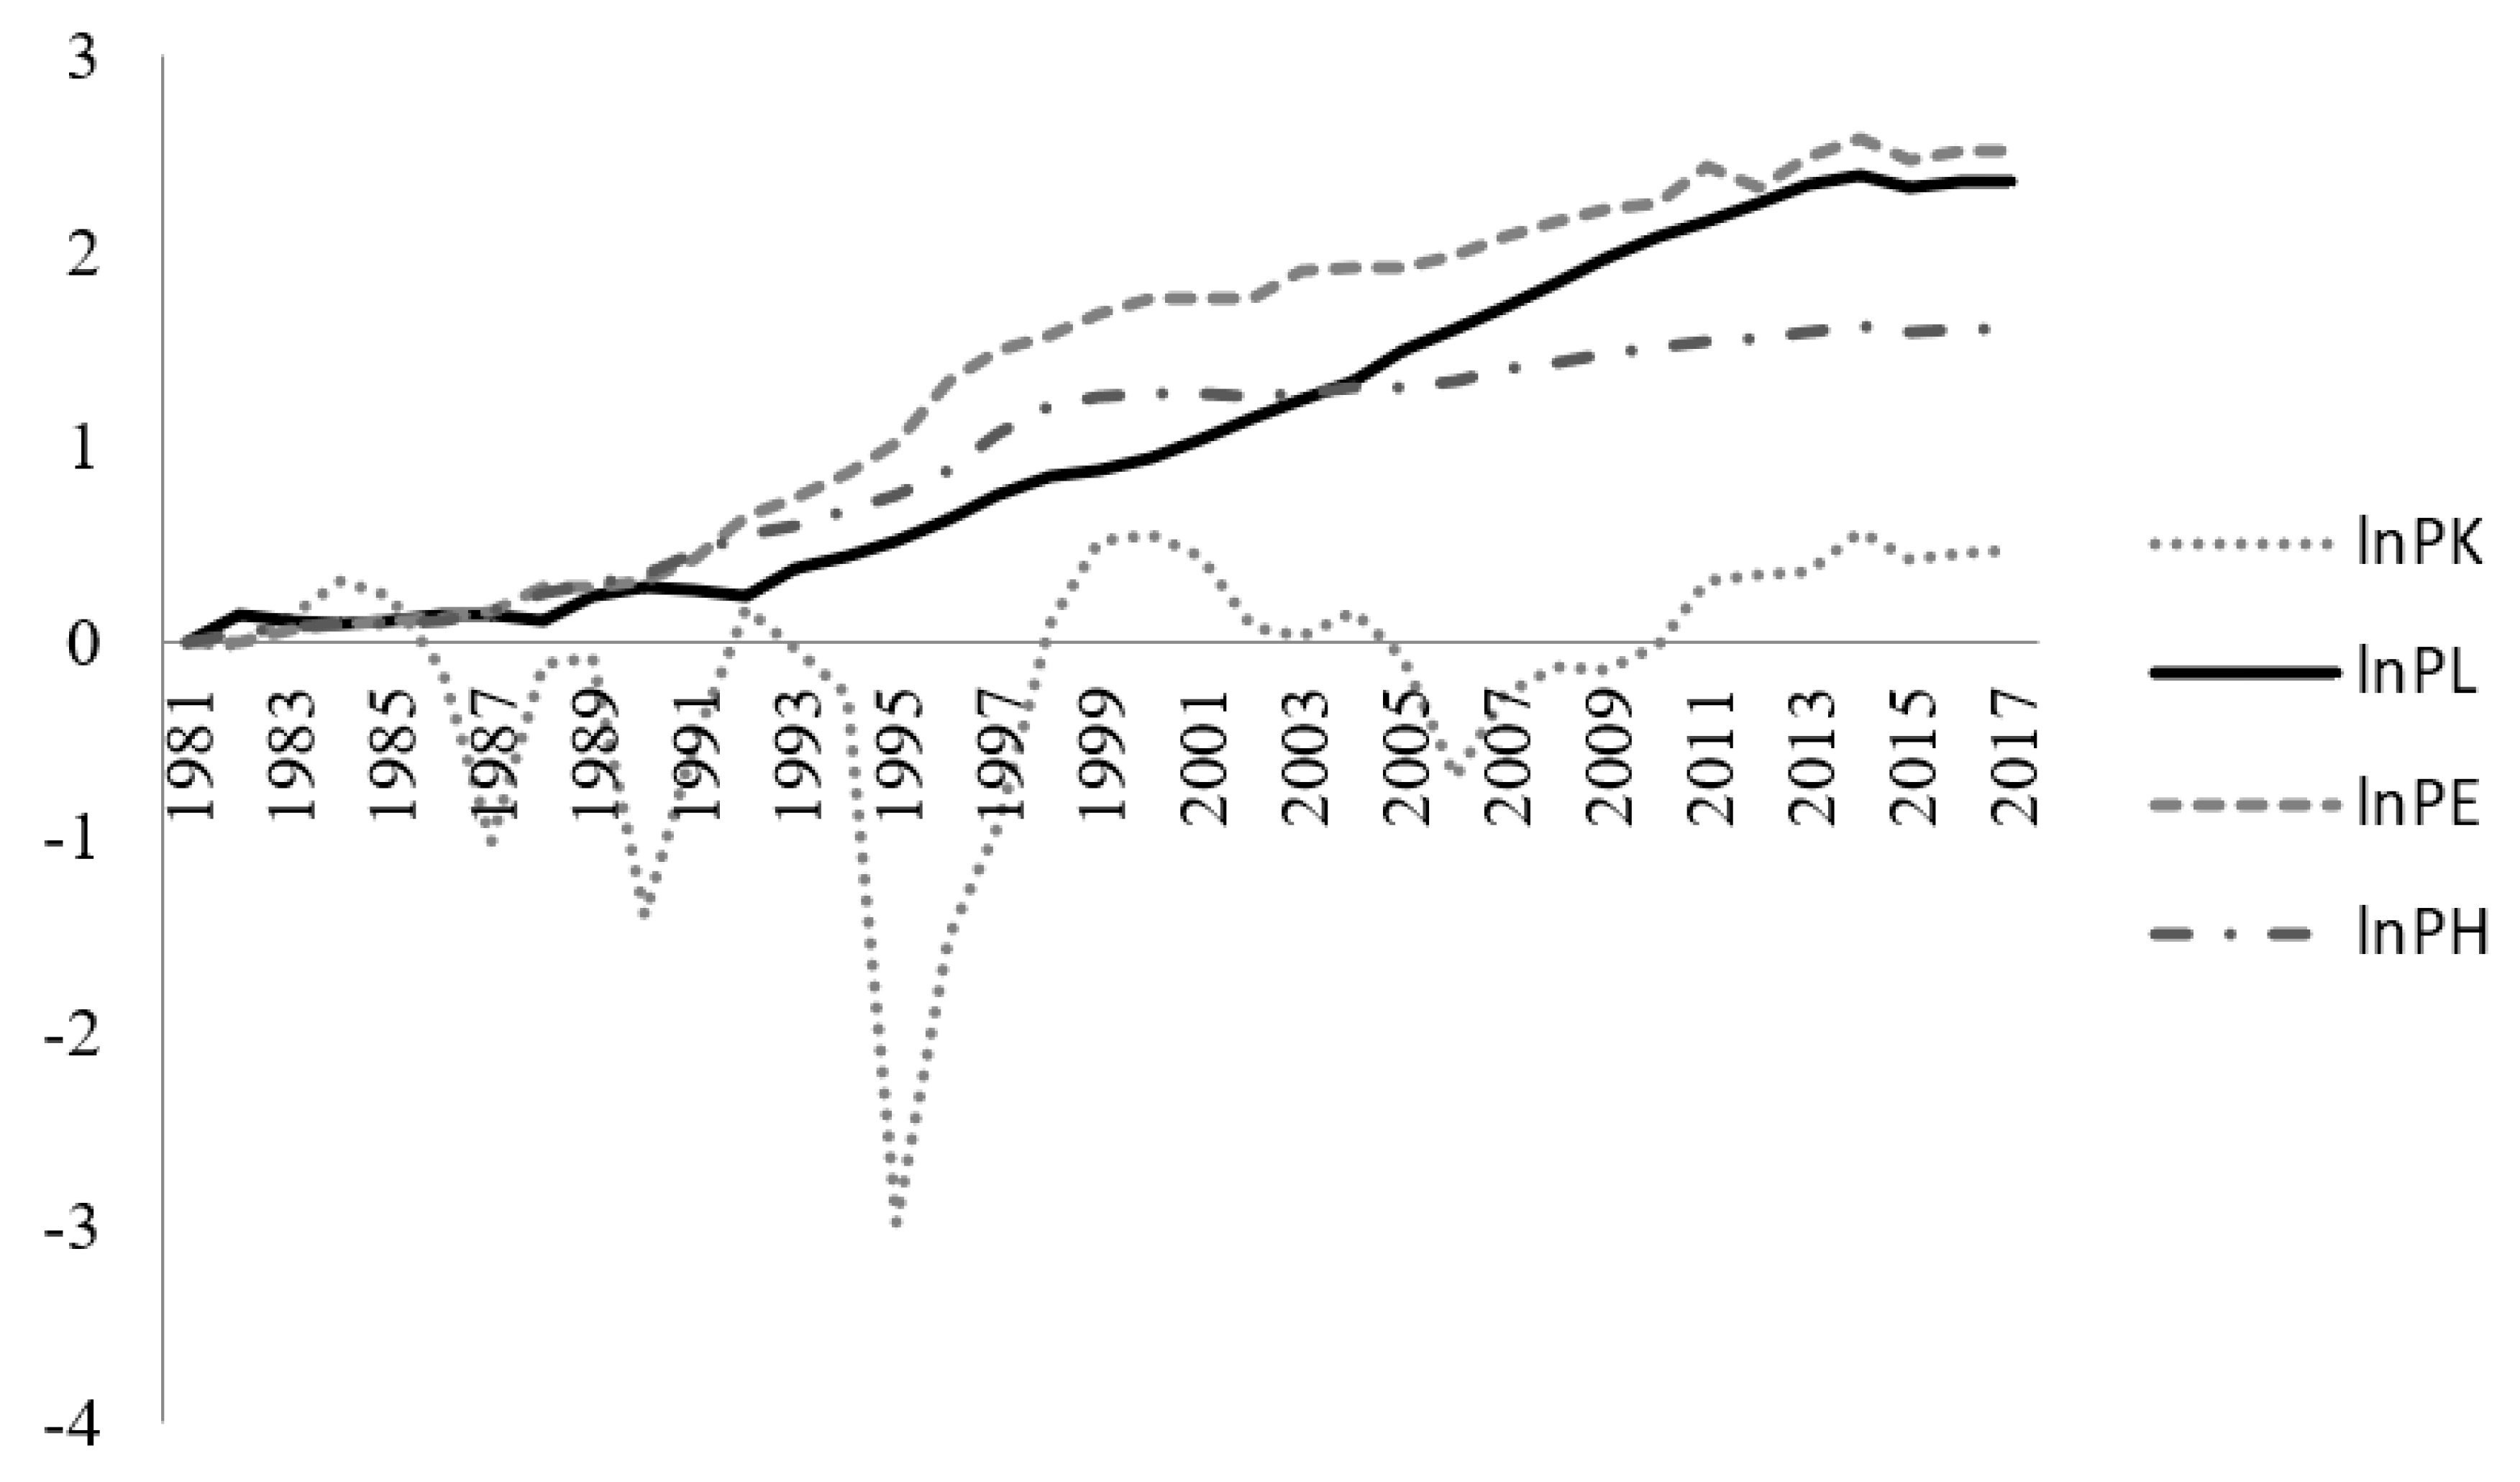
which estimates the capital stock/human capital stock at time t, where stands for the capital/human capital depreciation rate and is the current capital/human capital investment. Our estimates of both capital stock and human capital stock are consistent with Jiao and Jiao [22]. The CEY offers detailed data about the consumption of primary energy in the electric power industry by year, and the conversion coefficient between each energy source and standard coal. The SDPC offers fuel price data from 150 city price bureaus, but we only selected the coal price and converted it to the standard coal price. The CIEY provides detailed data on the major economic indexes of China’s electric power industry. The cost shares and price index for each factor during the study period are shown in Figure 2 and Figure 3. Figure 2 shows the time series plots of the cost shares of factors for the electric power industry in China. The change in the share of capital factor is strongly opposed to the change in the share of both labor factor and energy factor. This implies that energy–capital and energy–labor are substitutable. On the other hand, Figure 3 shows the changes in the indices of factor prices for the electric power industry in China. From the figure, it can be seen that the prices of China’s capital factor were low, and increased significantly in recent years. The prices of other factors have risen steadily also. The increases in both labor and energy factor prices have been the highest in recent years. This reflects to a certain extent that China’s factor marketization is relatively low, and that factor prices, especially capital prices, are subject to certain distortions.
4. Methodologies
There is generally a dilemma when we estimate a production function, because input factors are probably endogenous and thus violate the basic necessary condition that the ordinary least squares must be unbiased. This problem can be circumvented by using factor prices in the cost function, and thus it is common in the energy economics literature to use a trans-log cost function to quantify energy demand elasticities [23]. Furthermore, as a second-order approximation, the trans-log cost function allows us to avoid specifying a particular production function and supposing constant or equal elasticities of substitution [24].
The three-factor production function is
where is the output, and , and denote the capital input, labor input and energy input, respectively. If both the factor price and output level are determined by an exogenous element, then Equation (3) could be described by the following cost function:
where is the total cost and , and indicate the factor price indices of capital, labor and energy, respectively. If we apply the trans-log cost function model, Equation (4) is depicted as follows:
where both and represent indices for the inputs, while and are the price of input factor and the unobserved error term at time , and the parameter is the intercept. By applying Shephard’s lemma, we obtained the firm’s system of cost-minimizing demand functions, which are the conditional factor demands obtained by differentiating Equation (5) with respect to the following input price:
where represents input . We assume constant returns to scale and no neutral technological change. Then, the following three-factor cost-share equation can be derived:
where indicates the cost-minimizing cost share of factor at time . In order to explore the impact of human capital input, we incorporated the human capital input, giving us the following four-factor cost-share equation:
where represents the human capital input. Equation (3) can be applied to approximate any unknown cost and any production function when we choose the proper special set of parameters. We set the symmetry restrictions to follow
which means that the cross-derivatives are the same. The following regularity conditions are required to satisfy the linear homogeneity at price:
The Allen partial elasticities of substitution at time can be obtained by
while the own-price elasticities and the cross-price elasticities of factor demand can be obtained by Equations (13) and (14), respectively, by using estimated parameters from Equation (5) [23]:
Starting from the two-factor inputs Hicks-type elasticity of substitution [25], related studies continued to develop three-factor inputs models. For example, cross-price elasticity (CPE), Allen elasticity substitution (AES), and Morishima elasticity substitution (MES) [26,27] are among the most popular methods being used for substitution elasticity. After AES was proposed, it has been widely used in empirical studies of multi-factor substitution [28]. Since it is difficult to use the AES to measure the relative price changes in a multi-factor production system, Morishima elasticity appears to be a more useful tool for the measurement of energy to non-energy substitution [29]. There are numerous empirical studies, for example, Sickles and Streitwieser [30] and Nguyen and Reznek [31], applying the MES model to estimate the inter-factor elasticities of substitution. In this paper, there are more than two input factors in the production systems. Thus, we employ the MES model to modify AES and apply two different measuring methods; that is, the Morishima elasticity method and the cross-price elasticity method. Therefore, the CPE measures the percentage change of the non-energy demand induced by a one percent change of energy price, while the MES requires the price of factor j to be flexible and holds other prices constants, and measures the percentage change of the non-energy ratio if the energy price increases by 1%. This approach is more appropriate because it can be used to measure the income effect of factor inputs, which cannot be estimated if one applied the Allen model. It is defined as [10]
Changes in demand for other factors are caused by changes in factor prices mainly based on the substitution effect and income effect. The difference between Morishima elasticities and CPE is that Morishima elasticities consider both substitution and income effects, but CPE only considers the substitution effect. The difference between CPE and Morishima elasticities is similar to the distinction between economic measures and engineering measures of substitution [32]. Different research objectives will prefer to adopt different measures. For instance, energy policy planning that requires information on actual changes will prefer to use cross-price elasticities, while academics studying the substitution potential in industries will be inclined to use Morishima elasticities.
5. Results and Discussion
Using the models presented in Section 3, we exhibit their estimates in this section. We first exhibit and discuss the estimated parameters of the models, and then we display and interpret both the derived elasticities and the scenario analysis.
5.1. Estimation Results
We exhibit the estimated coefficients of the share equations and the trans-log cost function in Table 1 for the electricity generation industry. We first remove the labor share equation from two factor share equations including both aggregate energy and capital share due to the adding-up restriction, and estimate the one total factor cost equation and two factor share equations. The R2 for the aggregate energy share equation, the total factor cost equation and the capital share equation are 0.92, 0.99 and 0.81, respectively. All estimates for the parameters are statistically significant and have the right signs, inferring that the estimated total factor cost function is appropriate and behaves properly because the input demand function is concave in price and strictly positive (Berndt and Wood [4]).
5.2. Derived Demand Elasticities
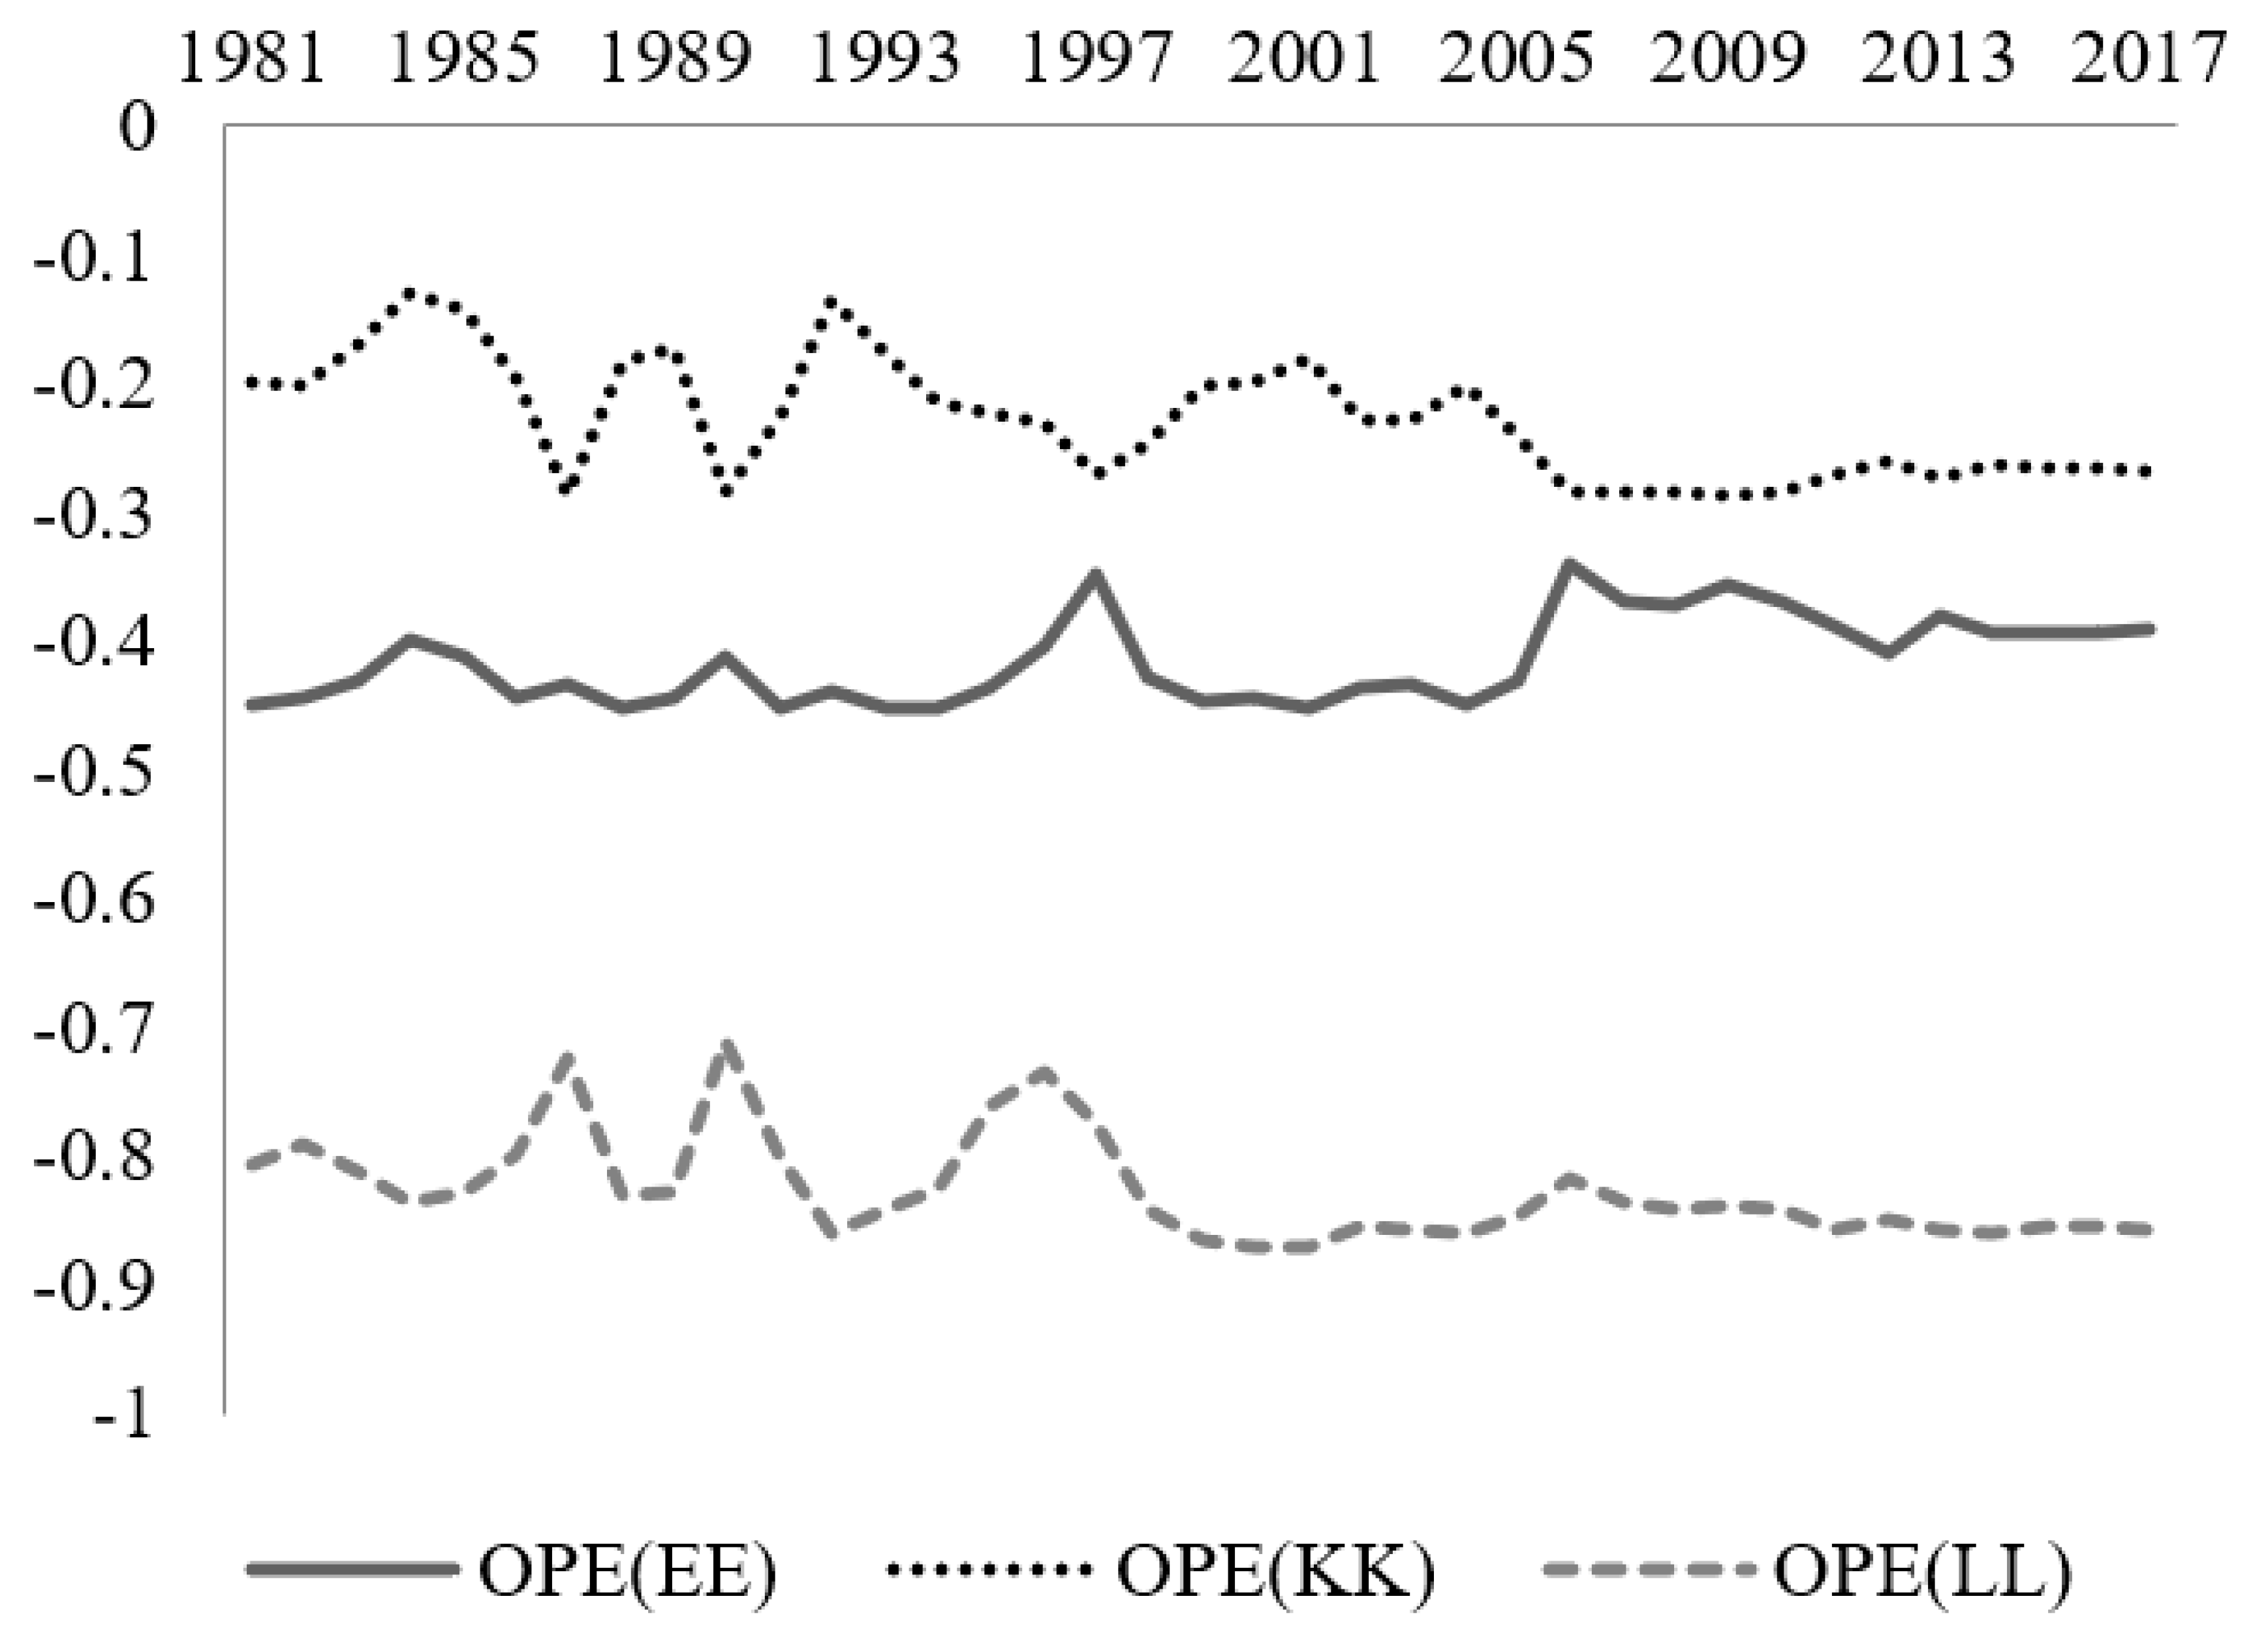
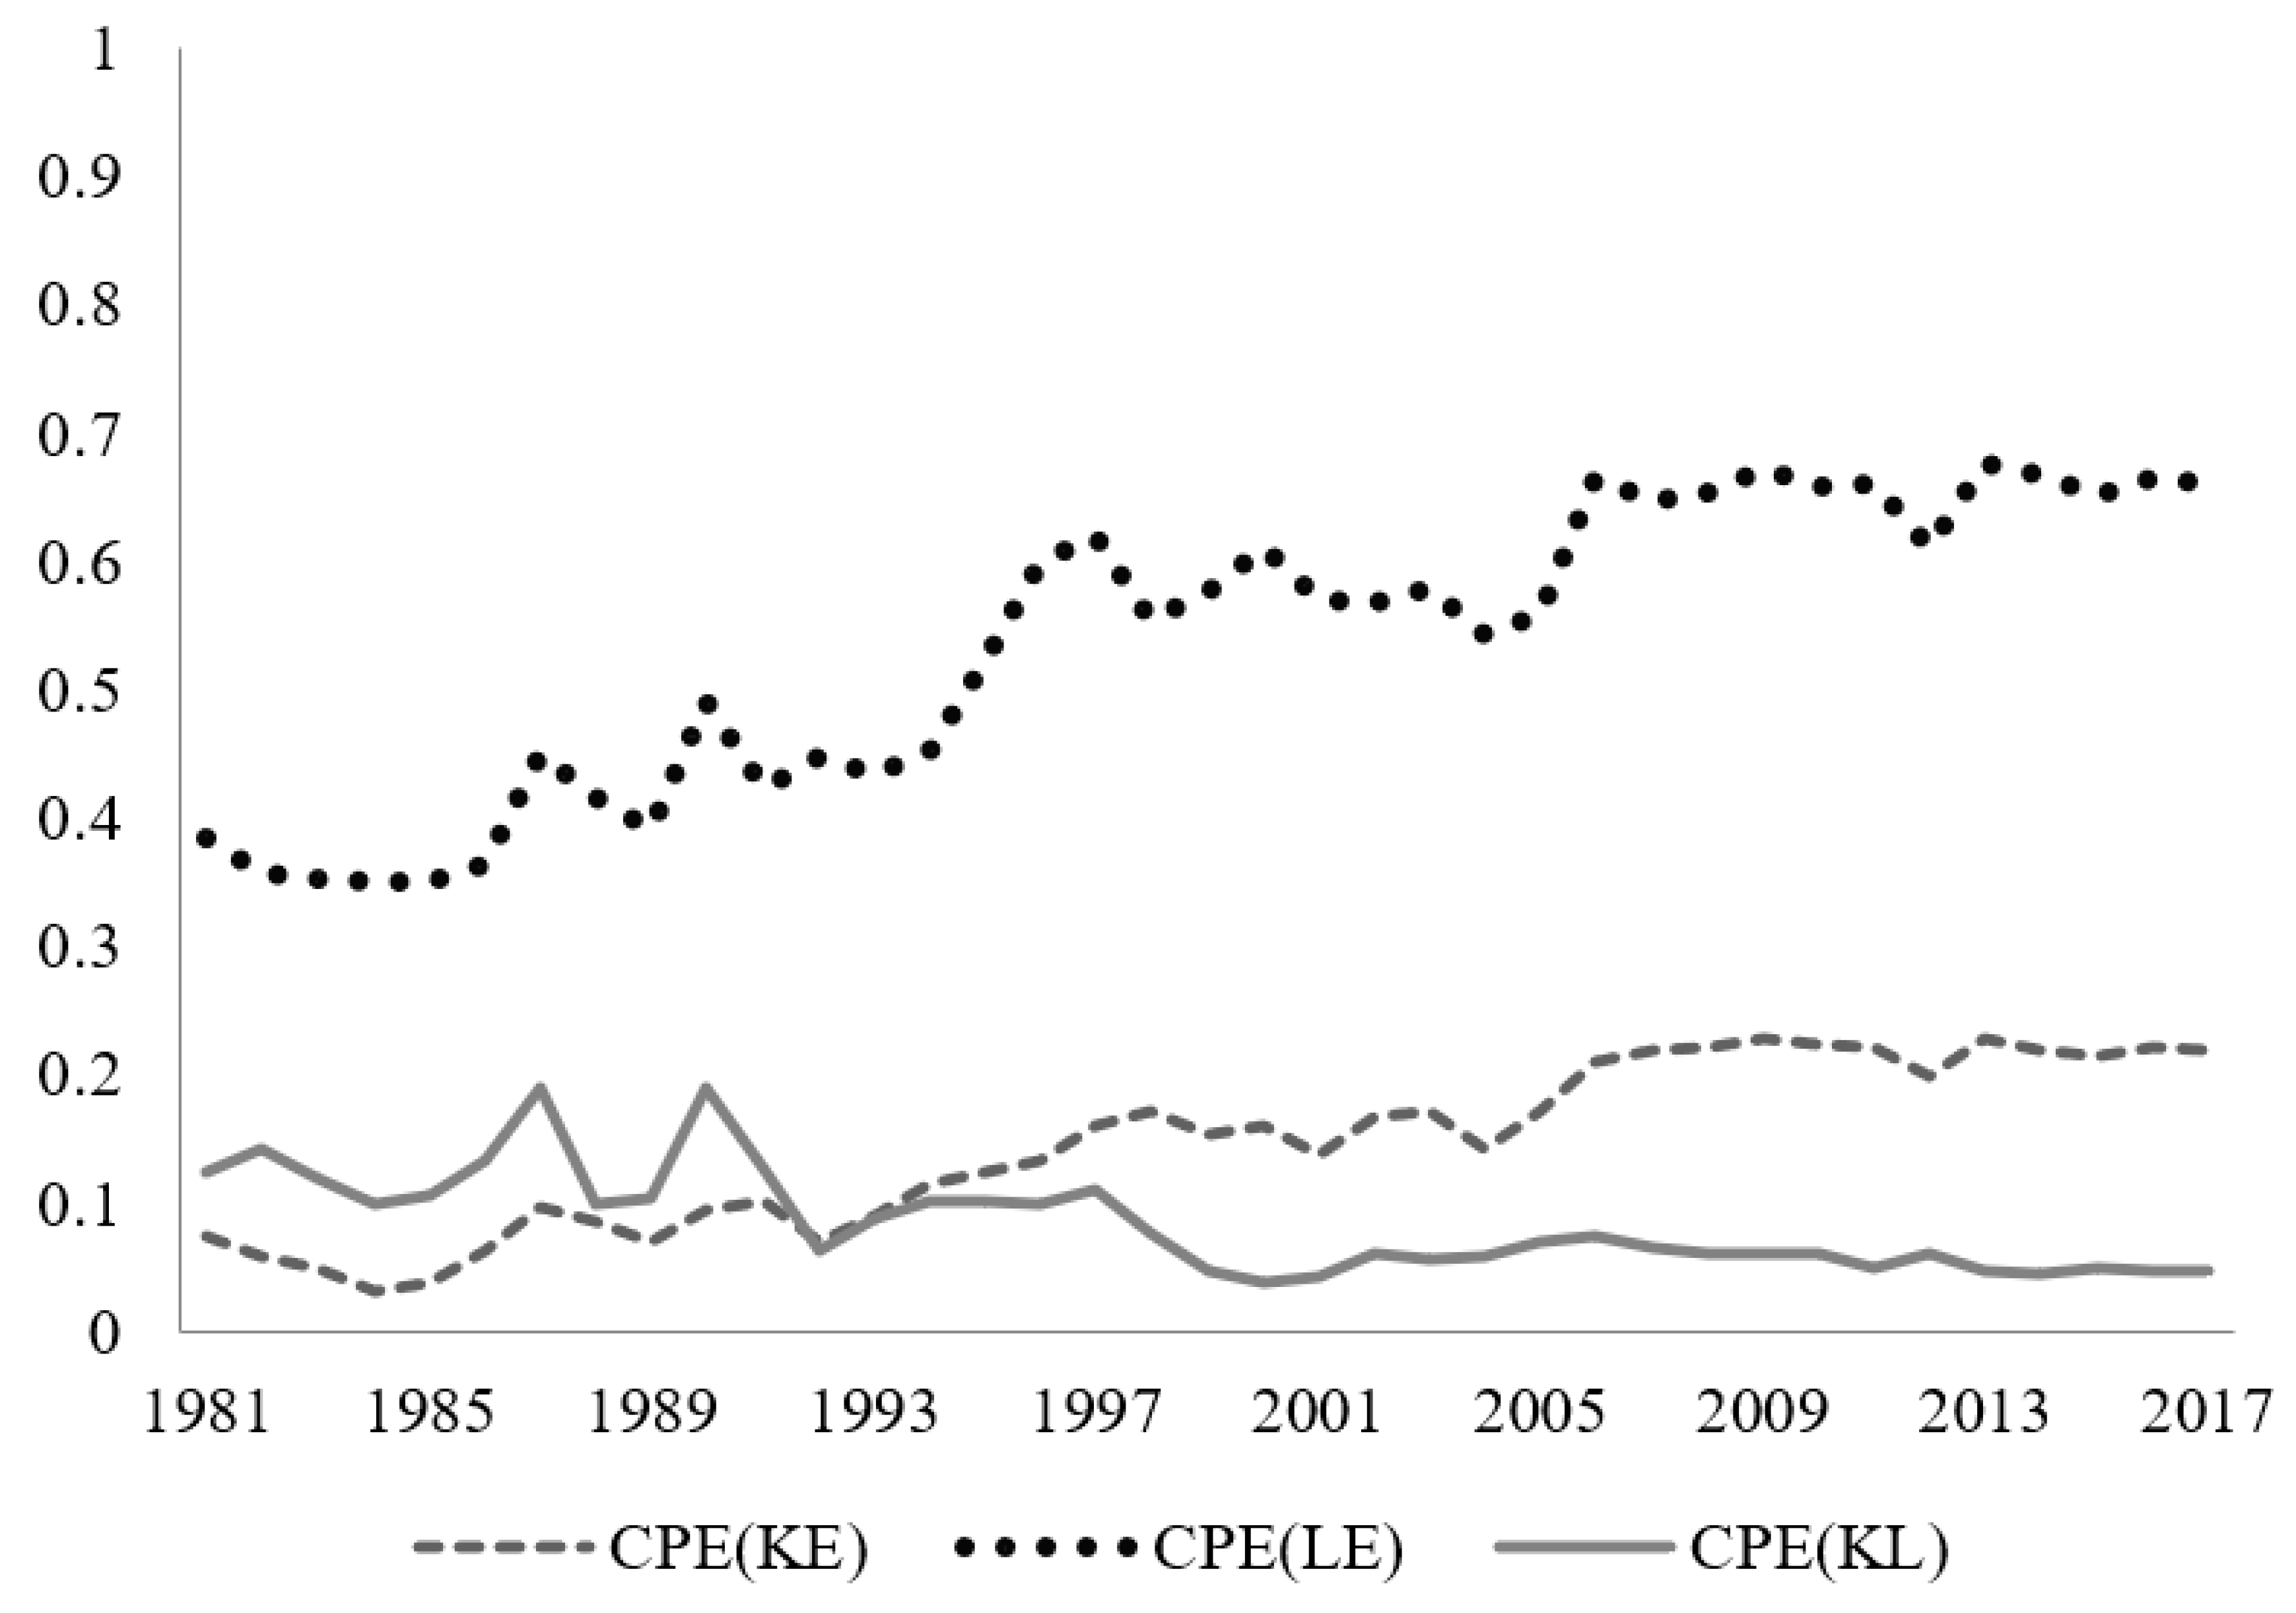
We then apply Equations (13)–(15) based on the estimated parameters presented in Table 1 to compute the own- and cross-price elasticities and Morishima elasticities of factor demand. The own- and cross-price elasticities are plotted in Figure 4 and Figure 5. We observe several notable features, as follows:
- (i)
- Consistent with all the existing economic theories, all own-price elasticities have negative signs. Each factor is responsive to the change in its price. The median own-price elasticities for energy, capital and labor are 0.4089, 0.221 and 0.8216, respectively. The demands in both labor and energy are more sensitive to the change in their price than that of capital. The magnitude and direction of the elasticity of own-price have been used in some empirical studies, including Costantini et al. [33] and Sharimakin [3].
- (ii)
- When considering the cross-price elasticities of capital demand, we find positive elasticities with respect to the price of energy. The estimated results of the cross-price elasticities imply that both capital and energy have substantial substitution sustainability, demonstrating a slightly upward trend. This indicates more potential for alleviating energy supply shortages with higher capital investment in China’s electric industry, thus discovering an effective way of saving energy.
- (iii)
- Likewise, we find positive elasticities with respect to the price of energy regarding the cross-price elasticities of labor demand, inferring that both energy and labor appear to be significantly substitutable. Additionally, both labor and capital are substitutes with values for the cross-price elasticities of substitution at 0.0873. Substitution between energy and labor necessarily arises from technical innovation, in the context that technological development brings the mechanization and automation of the electric industry and enables many things that were originally done manually to be accomplished with more energy consumption, setting some surplus labor free.
- (iv)
- As can be noted, labor demand is more sensitive to the energy price change than capital, for a median CPE(KE) of 0.1337 and a median CPE(LE) of 0.5336. Compared with overseas countries such as the US, there is less potential for energy substitution when the price of energy rises [34].
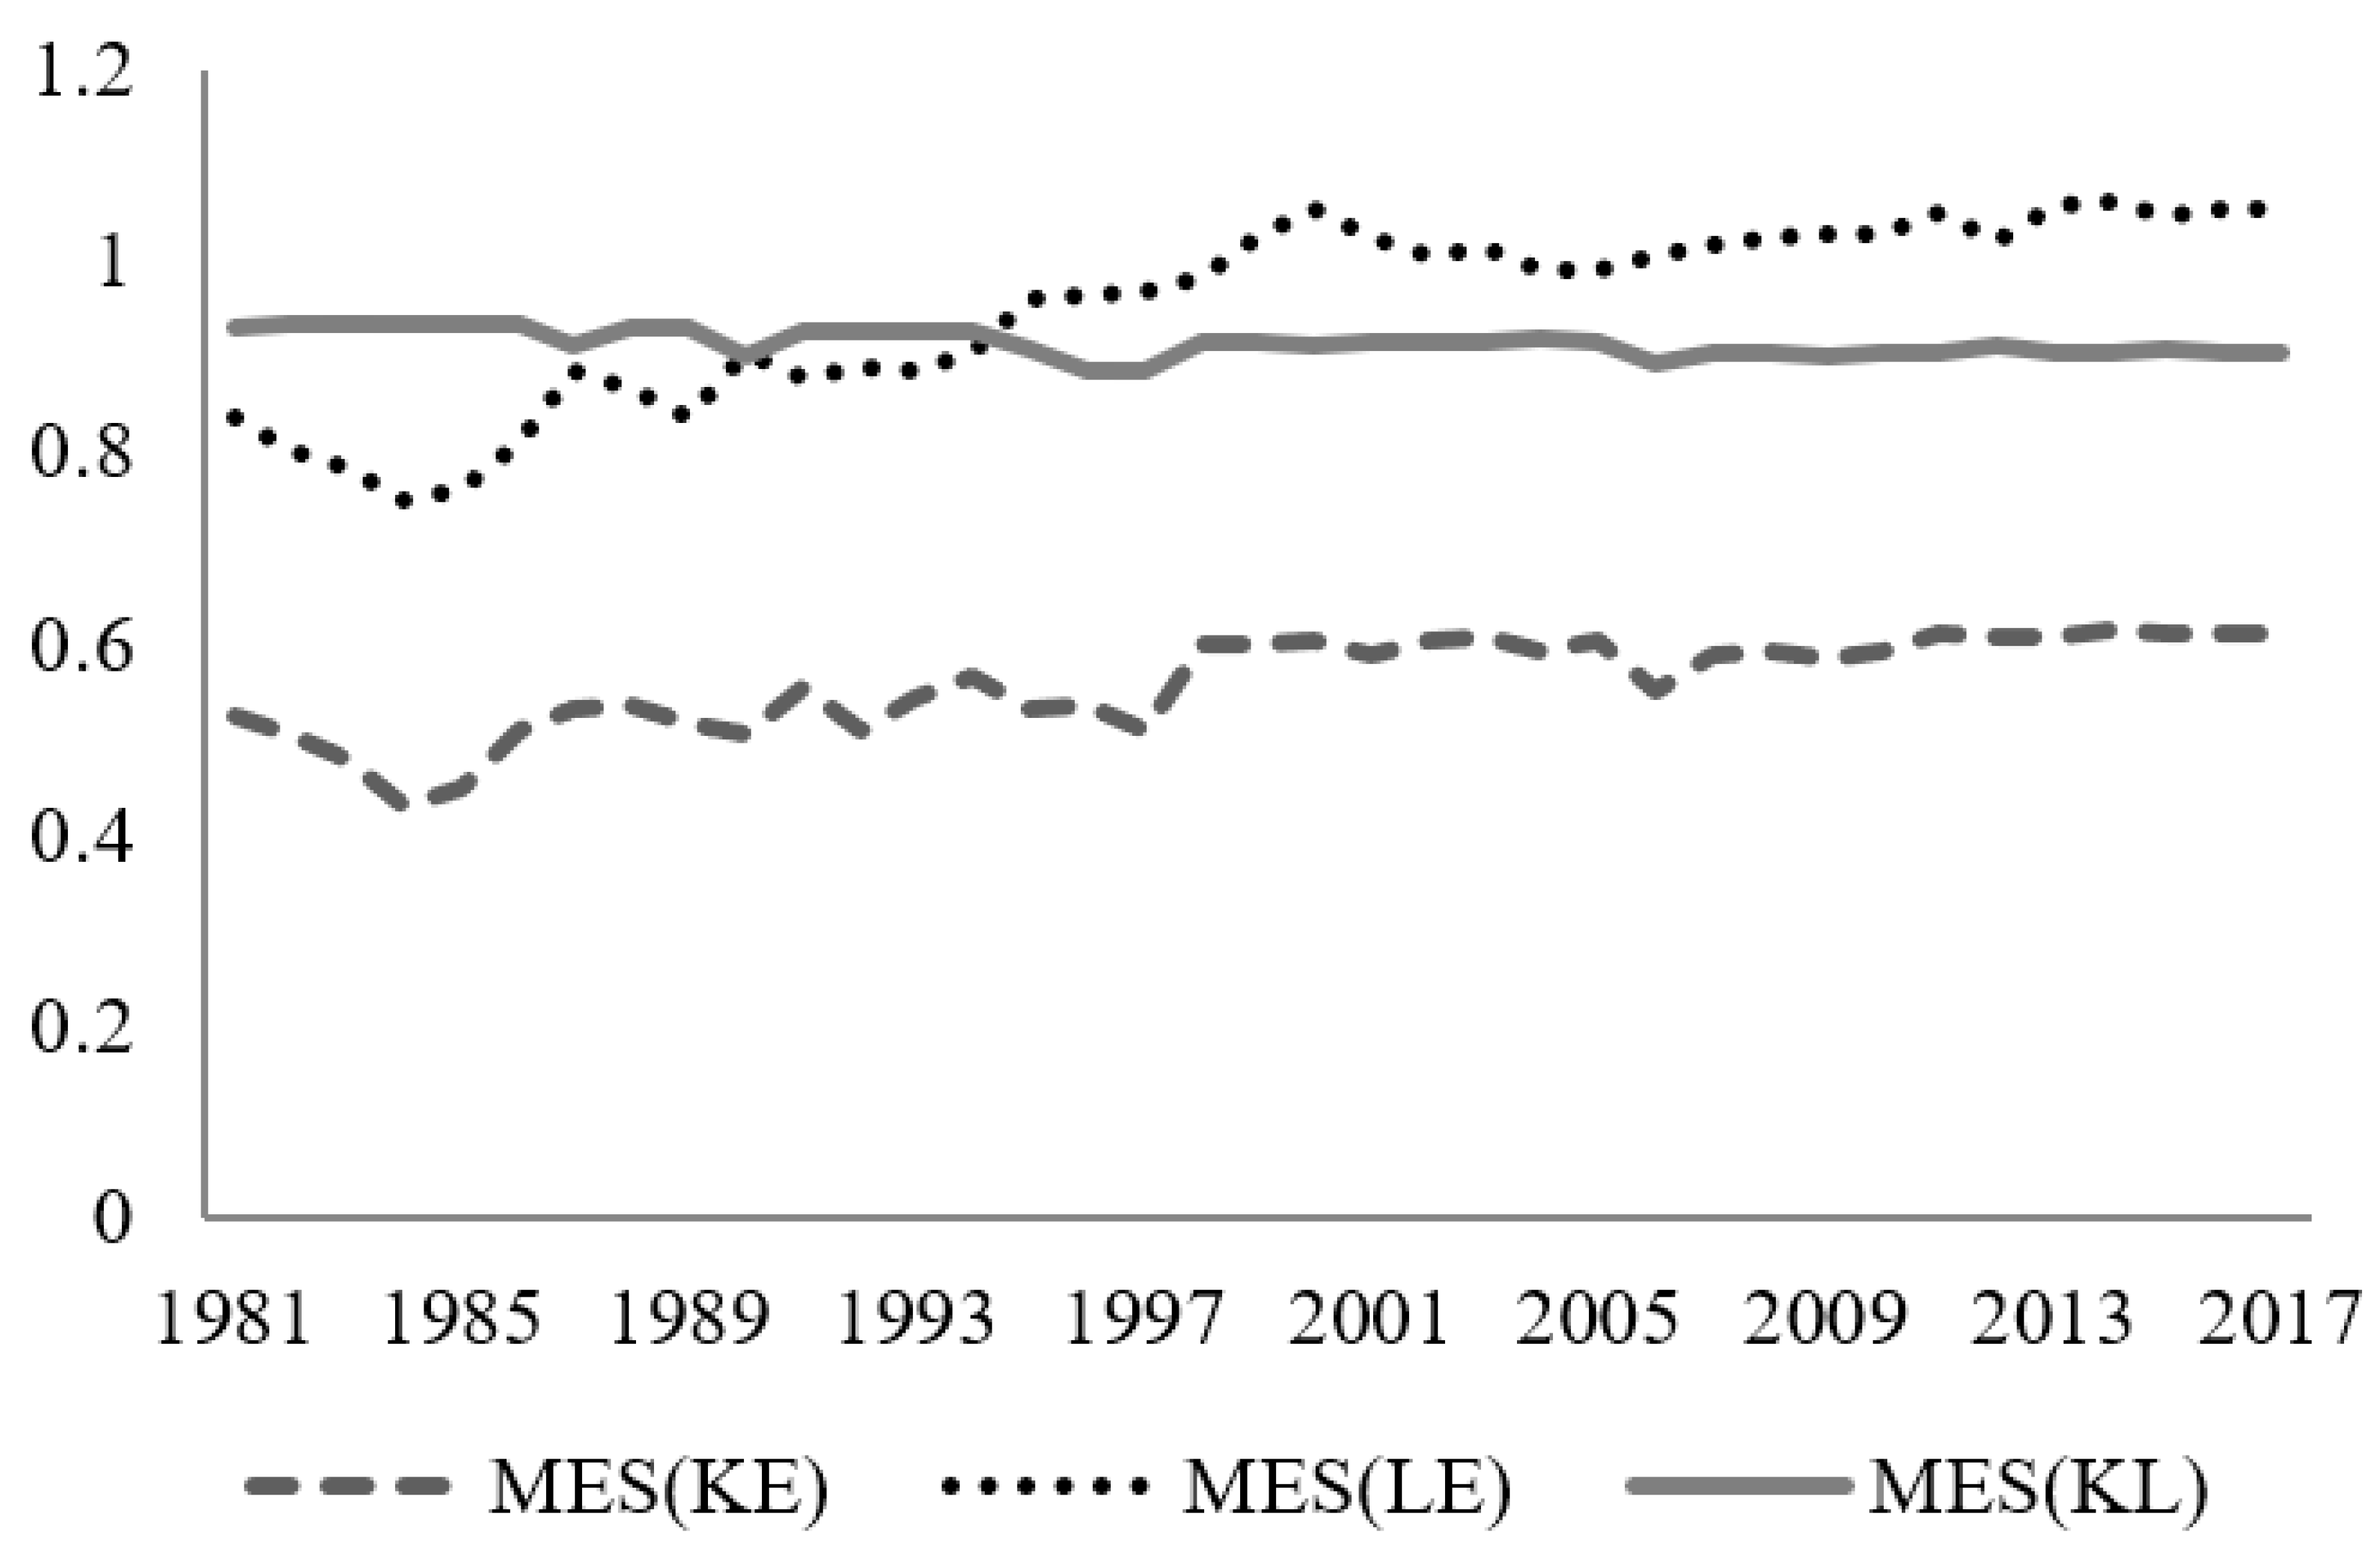
The implied Morishima elasticities are depicted in Figure 6. The result provides several important conclusions, as shown in the following:
- (i)
- The estimated results imply that both capital and energy are substitutable, and similarly, labor is also a substitute for energy, indicating that both capital and labor demand are elastic to changes in energy price.
- (ii)
- The Morishima elasticities outnumber the corresponding cross-price elasticities in general, especially for capital and labor. The result is consistent with the findings of Koetse et al. [9], who found a distinction between Morishima elasticities and cross-price elasticities.
- (iii)
- Labor demand is more sensitive to energy-price change than capital, because MES(KE) = 0.5408 and MES(LE) = 0.9426, inferring that holding other variables constant, energy prices increase 1%, and the demand ratio for both capital–energy and labor–energy will rise 0.5408% and 0.9426%, respectively.
- (iv)
5.3. Scenario Analysis
In order to further explore the CO2 emission reduction shock and the resultant potential energy conservation of the capital–energy substitution in China’s electricity industry, we computed both CO2 emission reduction potentials and energy saving under different scenarios (displayed in Table 2). The results in Table 2 were obtained by adopting the Morishima elasticities of capital–energy substitution, energy use and CO2 emission per unit of energy used in the electricity industry of China in 2014. The scenarios are the enhancement of capital input by both 5% and 10%. This underscores the potential of the Chinese electric power sector to realize emission reductions along with rising capital investment in energy conservation technology. To specify, when other factors remain constant, a 10% increase in the capital input results in a 17.96 Mtoe (million tons of oil equivalents) increase in the energy consumption savings in the electric power industry, bringing about a CO2 emission reduction of 44.54 million tons.
5.4. The Role of Human Capital in Inter-Factor Substitution
Incorporating the human capital inputs in the trans-log model using Equation (8), we observe obvious changes in the Morishima elasticities. The estimated equations at this stage include one total factor cost equation and three factor share equations (aggregate energy, capital and labor shares; the human capital share equation is taken away due to adding-up the restriction). Compared with the corresponding original Morishima elasticities obtained in the three-factor model in the same term, we focus on the changes in the Morishima elasticities of both capital and labor, and examine the Morishima elasticities of human capital. The results of these calculations are displayed in Table 3. From the table, we observe the following:
- (i)
- Both capital and energy are substitutable, and similarly, labor is substantially substitutable with energy.
- (ii)
- In general, the Morishima elasticities of labor outnumber the corresponding Morishima elasticities of capital.
- (iii)
- Compared with the Morishima elasticities between the two cost-share equations, both labor and capital demand are more sensitive to energy-price change in the four-factor model, because both MES(KE) * and MES(LE) * increase by 23.96 and 12.31 points, respectively. This shows that human capital does contribute to both China’s energy conservation and emissions reduction, and that it is useful to raise the factor elasticity of substitution, and optimize resource allocation and utilization.
- (iv)
- Human capital is a significant substitute to energy itself, with a median Morishima elasticity of 1.0522. This shows that human capital is more substitutable to energy than capital.
6. Conclusions and Implications
As far as we know, there has been no study in the existing literature on Chinese inter-factor substitution sustainability, especially in the electric power industry. This research fills in the essential gap in the literature by investigating the inter-factor elasticity of substitution between capital, labor, human capital, energy and the role of human capital in the substitution of the Chinese electricity generation industry by employing the trans-log cost function.
The empirical analyses document made several findings. First, we observe that the own-price elasticities of energy are statistically significant, and all are inelastic. There are many factors contributing to the inelasticity of energy demand, and the considerably low level of energy prices may be one of the prominent reasons. The current energy price level is not capable of producing incentives to spur industries to change their consumers’ behavior. The government should make greater efforts to liberalize energy price in order to promote energy conservation and emissions reduction. Second, substitutability was detected between capital and energy, and between human capital and energy. Capital–energy substitutability could be mostly ascribed to applications of energy conservation technologies via capital purchases, which were subsequently supported using the scenario analysis, offering an important channel of GHGs mitigation. They indicate that the Chinese electric power industry can switch from carbon-emitting energy to capital, thus achieving the goal of gradually boosting its industrial economy, as well as relieving the negative impact on the environment. Third, by highlighting that labor and the energy inputs are substitutes, we conclude that the development of technology will likely reduce labor intensiveness. This shows that the electric industry has incentives for releasing the surplus labor force by obtaining more energy consumption in the context of advancing electricity generation technology. Lastly, our results provide evidence to support our conjecture that human capital indeed plays a crucial role in the course of inter-factor substitution. It contributes to shortening the industrial transition time and optimizing the allocation of the inputs. In other words, human capital should not only increase the substitutability between capital–energy and labor–energy, but also reduce the Chinese electric power industry’s reliance on energy, since there is significant substitution sustainability between human capital and energy (1.0522). This would alleviate the situation under which China is suffering severe energy constraints and environmental pollution. Therefore, a major increase in the share of human capital as a portion of the production inputs will contribute to the transformation towards a low-carbon and energy-saving electric power system.
A principal issue for energy policy planning is the possibility of non-energy factors to substitute for energy, and the influences of substitution on future economic development. The results of this research offer essential policy implications for China. First, there are many factors which contribute to the inelasticity of demand for energy, where the level of energy prices could be one of the most essential reasons. Competition is the foundation in any market, and the electricity sector is no exception. Since there is a lot of imperfection in the Chinese market, particularly in the electricity industry, it is a challenge for the Chinese government to boost electricity price reform and deregulate rules to release more potential energy conservation. The current electric price mechanism is unable to truly reveal the resource scarcity and the environmental costs, lagging far behind the market demand [28]. The resource tax on fossil energy is too low to fully reflect their un-renewability, and energy subsidies are the main cause of China’s high energy intensity. Hence, they should also be gradually reduced until they are abolished. Furthermore, subject to regulated coal market prices, the electricity price mechanism cannot steer and accelerate energy conservation and emissions reduction. Efforts should include raising fossil fuel prices by using economic methods like energy or environmental taxes, removing subsidies for non-renewable energy, and enhancing the linkage between coal price and electricity price. Second, since all inputs are estimated to be substitutes, there appears to be a possibility for the government to promote an increase in the use of alternative factors. The substitutions between capital and labor, and between labor and energy show that the electric industry has the potential to realize a transition from being a labor-intensive to a capital-intensive sector by using the consistent accumulation of capital. With capital being substitutable with energy, it will reduce the energy demand and promote energy conservation technology through the capital investment in each enterprise, thereby booming the tempo of the capital–energy substitution. More capital input could help to improve energy efficiency, and thus accomplish the goal of energy conservation in China’s heavy industry [35]. Therefore, policies that aim at deepening financial mechanism reform should be prioritized. Energy supply shortages and GHG emissions may be mitigated by carrying out effective economic strategies and regulatory policies to decrease instituting rates. In addition, capital subsidies and favorable taxes targeted at lessening capital expenditure should also be implemented. Third, given that human capital serves as not only a catalyst but also an actor in inter-factor substitution, it becomes even more important to stimulate the factor switching process and reduce energy use by utilizing more human capital. There is immense potential for energy conservation to be liberated by obtaining more human capital accumulation, as China lags far behind the global average level in governmental expenditure on human capital investment. Policymakers’ attention should be focused on enhancing direct financial support or subsidies for education and training, boosting the legislative progress, freeing up the labor market to spur private incentives and establishing a supervision mechanism to monitor the movement of government funds.
Although China has made considerable efforts to impel energy conservation and emissions reduction in the electricity sector, they still have a long way to go. To reconstruct a decarbonized electric power sector, the government’s future policies should concentrate on: (1) accomplishing the reestablishment of an energy price system and the consummation of relevant regulations and laws, (2) stimulating human capital investment and utilization, (3) improving the appraisal system and supervision mechanism for the power sector in order to motivate the enthusiasm of governments and enterprises in energy conservation and emissions reduction, and (4) encouraging domestic fundamental research and sustainable development abilities.
This paper studied the sustainability of energy substitution in the Chinese electric power sector. Extensions of our paper could include applying our approach to study other energy issues (Lv, et al., 2019 [35]; Lean, et al., 2010, 2012, 2015 [24,30,36]), other resource issues (Woo, et al., 2012, [37]) and other industries (Guo, et al., 2010, 2015, 2018, 2019, 2020 [16,38,39,40,41]; Moslehpour, et al., 2018, 2019 [42,43]; Mou, et al., 2018 [44]; Nguyen, et al., 2020 [45]). Academics could also apply our approach to study other markets; for example, stock markets (Batmunkh, et al., 2018 [5]; Cheng, et al., 2019 [32]; Demirer, et al., 2019 [46]), funds (Gupta, et al., 2019 [47]; Abid, et al., 2014 [1]; Chiang, et al., 2008 [23]; Lean, et al., 2012 [36]; Levy, 2020 [48]; Li, et al., 2018 [29]), commodity (Yuan, et al., 2020) [49], warrant (Wong, et al., 2018 [50]) and futures (Clark, et al., 2016 [51]; Qiao, et al., 2012, 2013 [52,53]). There are many other issues to which academics can apply our approach; see, for example, Woo, et al., (2020) [54] and Chang et al., (2018) [55] for more information.
Author Contributions
Data curation, Y.L. and Y.X.; formal analysis, Y.-C.W. and W.-K.W.; methodology, Y.L. and Y.X.; supervision, Y.-C.W.; writing—original draft, Y.L. and Y.X.; Writing—review and editing, Y.-C.W. and W.-K.W. All authors have read and agreed to the published version of the manuscript.
Funding
The work described in this paper was supported by the China Postdoctoral Science Foundation (Grant No. 2018M633168).
Conflicts of Interest
The authors declare no conflict of interest.
References
- Abid, F.; Leung, P.L.; Mroua, M.; Wong, W.K. International diversification versus domestic diversification: Mean-variance portfolio optimization and stochastic dominance approaches. J. Risk Financ. Manag. 2014, 7, 45–66. [Google Scholar] [CrossRef]
- Apostolakis, B.E. Energy–Capital substitutability/complementarity: The dichotomy. Energy Econ. 1990, 12, 48–58. [Google Scholar] [CrossRef]
- Safarzadeh, S.; Rasti-Barzoki, M.; Hejazi, S.R. A review of optimal energy policy instruments on industrial energy efficiency programs, rebound effects, and government policies. Energy Policy 2020, 139, 111342. [Google Scholar] [CrossRef]
- Berndt, E.R.; Wood, D.O. Technology, prices, and the derived demand for energy. Rev. Econ. Stat. 1975, 57, 259–268. [Google Scholar] [CrossRef]
- Munkh-Ulzii, B.J.; McAleer, M.; Moslehpour, M.; Wong, W.K. Confucius and Herding Behaviour in the Stock Markets in China and Taiwan. Sustainability 2018, 10, 4413. [Google Scholar] [CrossRef] [Green Version]
- Christopoulos, D.K.; Tsionas, E.G. Allocative inefficiency and the capital-energy controversy. Energy Econ. 2002, 24, 305–318. [Google Scholar] [CrossRef]
- Arnberg, S.; Bjorner, T.B. Substitution between energy, capital and labor within industrial companies: A micro panel data analysis. Resour. Energy Econ. 2007, 29, 122–136. [Google Scholar] [CrossRef]
- Welsch, H.; Ochsen, C. The determinants of aggregate energy use in west Germany: Factor substitution, technological change, and trade. Energy Econ. 2005, 27, 93–111. [Google Scholar] [CrossRef]
- Koetse, M.J.; De Groot, H.L.; Florax, R.J. Capital-energy substitution and shifts in factor demand: A meta-analysis. Energy Econ. 2008, 30, 2236–2251. [Google Scholar] [CrossRef] [Green Version]
- Lin, B.Q.; Xie, C.P. Energy substitution effect on transport industry of China-based on trans-log production function. Energy 2014, 67, 213–222. [Google Scholar] [CrossRef]
- Halvorsen, R.; Ford, J. Substitution among energy, capital and labour inputs in U.S. manufacturing. In Capital and Labour Inputs in U.S. Manufacturing. Advances in the Economics of Energy and Resources 1; Pindyck, R.S., Ed.; Jai Press: Greenwich, CT, USA, 1978. [Google Scholar]
- Field, B.C.; Grebenstein, C. Capital-Energy substitution in U.S. manufacturing. Rev. Econ. Stat. 1980, 62, 207–212. [Google Scholar] [CrossRef]
- Frondel, M.; Schmidt, C.M. The Real Elasticity of Substitution: An Obituary; Discussion paper No. 341; Department of Economics, University of Heidelberg: Heidelberg, Germany, 2000; Available online: www.uni-heidelberg.de/institute/fak18/publications/papers/dp341.pdf (accessed on 15 April 2020).
- Kander, A.; Schön, L. The energy-capital relation of Sweden 1870–2000. Struct. Chang. Econ. Dyn. 2007, 18, 291–305. [Google Scholar] [CrossRef] [Green Version]
- Presley, K.W.; Lin, B.; Appiah, M.O. Delving into Liberia’s energy economy: Technical change, inter-factor and inter-fuel substitution. Renew. Sustain. Energy Rev. 2013, 24, 122–130. [Google Scholar]
- Guo, J.; Guo, C.H.; Ling, Y. Energy rebound effect of the industrial sector in China. Quant. Tech. Econ. Res. 2010, 11, 114–126. [Google Scholar]
- Ma, H.; Oxley, L.; Gibson, J. China’s energy economy: A survey of the literature. Econ. Syst. 2010, 34, 105–132. [Google Scholar] [CrossRef]
- Lu, C.J.; Zhou, D.M. The positive demonstration of energy substitution on China: Based on the revision of the model of Allen Substitution. Quant. Tech. Econ. Res. 2008, 5, 30–42. [Google Scholar]
- Su, X.M.; Zhou, W.S.; Nakagami, K.I.; Ren, H.B.; Mu, H.L. Capital stock-labor-energy substitution and production efficiency study for China. Energy Econ. 2012, 34, 1208–1213. [Google Scholar] [CrossRef]
- He, Y.; Lin, B. Heterogeneity and asymmetric effects in energy resources allocation of the manufacturing sectors in China. Energy 2019, 170, 1019–1035. [Google Scholar] [CrossRef]
- Wei, Z.; Han, B.; Han, L.; Shi, Y. Factor substitution, diversified sources on biased technological progress and decomposition of energy intensity in China’s high-tech industry. J. Clean. Prod. 2019, 231, 87–97. [Google Scholar] [CrossRef]
- Jiao, B.; Jiao, Z. Estimation of China’s human capital stock: 1978–2007. Economist 2010, 9, 27–33. [Google Scholar]
- Chiang, T.C.; Lean, H.H.; Wong, W.K. Do REITs Outperform Stocks and Fixed-Income Assets? New Evidence from Mean-Variance and Stochastic Dominance Approaches. J. Risk Financ. Manag. 2008, 1, 1–37. [Google Scholar] [CrossRef] [Green Version]
- Lean, H.H.; McAleer, M.; Wong, W.K. Market efficiency of oil spot and futures: A mean-variance and stochastic dominance approach. Energy Econ. 2010, 32, 979–986. [Google Scholar] [CrossRef] [Green Version]
- Hicks, J.R. The Theory of Wages; Macmillan: London, UK, 1932. [Google Scholar]
- Allen, R.G.D.; Hicks, J.R. A reconsideration of the theory of value. Economica 1934, 1, 52–76. [Google Scholar]
- Blackorby, C.; Russell, R.R. The Partial Elasticity of Substitution; Discussion paper No. 75–1, economics; University of California: San Diego, CA, USA, 1975. [Google Scholar]
- Thompson, P.; Taylor, T.G. The capital-energy substitutability debate: A new look. Rev. Econ. Stat. 1995, 77, 565–569. [Google Scholar] [CrossRef]
- Li, Z.X.; Li, X.G.; Hui, Y.C.; Wong, W.K. Maslow Portfolio Selection for Individuals with Low Financial Sustainability. Sustainability 2018, 10, 1128. [Google Scholar] [CrossRef] [Green Version]
- Lean, H.H.; McAleer, M.; Wong, W.K. Preferences of risk-averse and risk-seeking investors for oil spot and futures before, during and after the Global Financial Crisis. Int. Rev. Econ. Financ. 2015, 40, 204–216. [Google Scholar] [CrossRef]
- Nguyen, S.V.; Reznek, A.P. Factor substitution in small and large U.S. manufacturing establisnments. Small Bus. Econ. 1993, 5, 37–54. [Google Scholar] [CrossRef]
- Cheng, A.W.W.; Chow, N.S.C.; Chui, D.K.H.; Wong, W.K. The Three Musketeers relationships between Hong Kong, Shanghai and Shenzhen before and after Shanghai-Hong Kong Stock Connect. Sustainability 2019, 11, 3845. [Google Scholar] [CrossRef] [Green Version]
- Costantini, V.; Crespi, F.; Paglialunga, E. Capital–energy substitutability in manufacturing sectors: Methodological and policy implications. Eurasian Bus. Rev. 2019, 9, 157–182. [Google Scholar] [CrossRef]
- Shaik, S.; Yeboah, O.A. Does climate influence energy demand? A regional analysis. Appl. Energy 2018, 212, 691–703. [Google Scholar] [CrossRef]
- Lv, Z.H.; Chu, A.M.Y.; McAleer, M.; Wong, W.K. Modelling Economic Growth, Carbon Emissions, and Fossil Fuel Consumption in China: Cointegration and Multivariate Causality. Int. J. Environ. Res. Public Health 2019, 16, 4176. [Google Scholar] [CrossRef] [Green Version]
- Lean, H.H.; Phoon, K.F.; Wong, W.K. Stochastic dominance analysis of CTA funds. Rev. Quant. Financ. Account. 2013, 40, 155–170. [Google Scholar] [CrossRef] [Green Version]
- Woo, C.K.; Wong, W.K.; Horowitz, I.; Chan, H.L. Managing a scarce resource in a growing Asian economy: Water usage in Hong Kong. J. Asian Econ. 2012, 23, 374–382. [Google Scholar] [CrossRef]
- Guo, X.; Wong, W.K.; Xu, Q.F.; Zhu, L.X. Production and Hedging Decisions under Regret Aversion. Econ. Model. 2015, 51, 153–158. [Google Scholar] [CrossRef]
- Guo, X.; Li, G.-R.; McAleer, M.; Wong, W.K. Specification Testing of Production in a Stochastic Frontier Model. Sustainability 2018, 10, 3082. [Google Scholar] [CrossRef] [Green Version]
- Guo, X.; Wong, W.K. Comparison of the production behaviour of regret-averse and purely risk-averse firms. Estud. Econ. 2019, 46, 157–171. [Google Scholar]
- Guo, X.; Egozcue, M.; Wong, W.K. Production theory under price uncertainty for firms with disappointment aversion. Int. J. Prod. Res. 2020. forthcoming. [Google Scholar] [CrossRef]
- Moslehpour, M.; Pham, V.K.; Wong, W.-K.; Bilgiçli, İ. E-Purchase Intention of Taiwanese Consumers: Sustainable Mediation of Perceived Usefulness and Perceived Ease of Use. Sustainability 2018, 10, 234. [Google Scholar] [CrossRef] [Green Version]
- Moslehpour, M.; Altantsetseg, P.; Mou, W.M.; Wong, W.K. Organizational Climate and Work Style: The Missing Links for Sustainability of Leadership and Satisfied Employees. Sustainability 2019, 11, 125. [Google Scholar] [CrossRef] [Green Version]
- Mou, W.M.; Wong, W.K.; McAleer, M. Financial Credit Risk Evaluation Based on Core Enterprise Supply Chains. Sustainability 2018, 10, 3699. [Google Scholar] [CrossRef] [Green Version]
- Nguyen, H.M.; Vuong, T.H.G.; Nguyen, T.H.; Wu, Y.C.; Wong, W.K. Sustainability of Both Pecking Order and Trade-off Theories in Chinese Manufacturing Firms. Sustainability 2020, 12, 3883. [Google Scholar] [CrossRef]
- Demirer, R.; Gupta, R.; Lv, Z.H.; Wong, W.K. Equity Return Dispersion and Stock Market Volatility: Evidence from Multivariate Linear and Nonlinear Causality Tests. Sustainability 2019, 11, 351. [Google Scholar] [CrossRef] [Green Version]
- Gupta, R.; Lv, Z.H.; Wong, W.K. Macroeconomic Shocks and Changing Dynamics of the U.S. REITs Sector. Sustainability 2019, 11, 2776. [Google Scholar] [CrossRef] [Green Version]
- Levy, H. The Investment Home Bias with Peer Effect. J. Risk Financ. Manag. 2020, 13, 94. [Google Scholar] [CrossRef]
- Yuan, X.; Tang, J.; Wong, W.-K.; Sriboonchitta, S. Modeling Co-Movement among Different Agricultural Commodity Markets: A Copula-GARCH Approach. Sustainability 2020, 12, 393. [Google Scholar] [CrossRef] [Green Version]
- Wong, W.K.; Lean, H.H.; McAleer, M.; Tsai, F.T. Why are Warrant Markets stained in Taiwan but not in China? Sustainability 2018, 10, 3748. [Google Scholar] [CrossRef] [Green Version]
- Clark, E.A.; Qiao, Z.; Wong, W.K. Theories of risk: Testing investor behaviour on the Taiwan stock and stock index futures markets. Econ. Inq. 2016, 54, 907–924. [Google Scholar] [CrossRef] [Green Version]
- Qiao, Z.; Clark, E.; Wong, W.K. Investors’ preference towards risk: Evidence from the Taiwan stock and stock index futures markets. Account. Financ. 2014, 54, 251–274. [Google Scholar] [CrossRef]
- Qiao, Z.; Wong, W.K.; Fung, J.K.W. Stochastic dominance relationships between stock and stock index futures markets: International evidence. Econ. Model. 2013, 33, 552–559. [Google Scholar] [CrossRef]
- Woo, K.Y.; Mai, C.; McAleer, M.; Wong, W.K. Review on Efficiency and Anomalies in Stock Markets. Economies 2020, 8, 20. [Google Scholar] [CrossRef] [Green Version]
- Chang, C.-L.; McAleer, M.; Wong, W.K. Big Data, Computational Science, Economics, Finance, Marketing, Management, and Psychology: Connections. J. Risk Financ. Manag. 2018, 11, 15. [Google Scholar] [CrossRef] [Green Version]
Figure 1.
Energy consumption and CO2 emission in the electric power sector of China. Source: the International Energy Agency.
Figure 1.
Energy consumption and CO2 emission in the electric power sector of China. Source: the International Energy Agency.

Figure 2.
Cost shares of factors for the electric power industry in China.

Figure 3.
Indices of factor prices for the electric power industry in China.

Figure 4.
Own-price elasticities.

Figure 5.
Cross-price elasticities.

Figure 6.
Morishima elasticities.


Table 1.
Estimation results of the cost share equation.
| Coefficient | Regression Estimate | Standard Error |
|---|---|---|
| 0.6687 ** | 0.0140 | |
| 0.1122 a | - | |
| 0.2191 ** | 0.0160 | |
| 0.1268 ** | 0.0270 | |
| 0.0036 a | - | |
| 0.0746 ** | 0.0170 | |
| −0.0279 a | - | |
| −0.0989 ** | 0.0177 | |
| 0.0243 a | - |
Note: ** indicates that the coefficient is significant at a 5% level; a due to adding up, standard errors are not provided.
Table 2.
Energy saving and CO2 emission reduction of China’s electricity industry under different scenarios in 2014.
Table 2.
Energy saving and CO2 emission reduction of China’s electricity industry under different scenarios in 2014.
| Year | Scenario 1: Capital Increased by 5% | Scenario 2: Capital Increased by 10% | ||
|---|---|---|---|---|
| Energy Savings (Mtoe) | CO2 Emission Reduction (Million Metric Tons) | Energy Savings (Mtoe) | CO2 Emission Reduction (Million Metric Tons) | |
| 2014 | 8.98 | 22.27 | 17.96 | 44.54 |
Table 3.
Morishima elasticities.
| Year | MES(KE) * | Rate of Change (%) | MES(LE) * | Rate of Change (%) | MES(HE) * |
|---|---|---|---|---|---|
| 1981 | 0.7235 | 37.9935 | 1.1828 | 41.7715 | 1.067 |
| 1982 | 0.7114 | 41.0668 | 1.1352 | 41.4403 | 1.053 |
| 1983 | 0.6984 | 45.5910 | 1.1459 | 46.1794 | 1.0303 |
| 1984 | 0.6725 | 56.2863 | 1.1531 | 53.9931 | 1 |
| 1985 | 0.6807 | 51.6711 | 1.1381 | 49.3962 | 1.0087 |
| 1986 | 0.7057 | 39.1364 | 1.1109 | 37.2837 | 1.048 |
| 1987 | 0.6955 | 31.0286 | 1.084 | 22.7216 | 1.1354 |
| 1988 | 0.723 | 34.7623 | 1.1789 | 35.8649 | 1.0641 |
| 1989 | 0.7095 | 37.9009 | 1.1409 | 36.2920 | 1.0445 |
| 1990 | 0.6573 | 29.7730 | 1.0635 | 17.7480 | 1.1529 |
| 1991 | 0.7172 | 29.3417 | 1.1086 | 26.6248 | 1.0838 |
| 1992 | 0.6988 | 37.2888 | 1.1419 | 28.7228 | 1.0242 |
| 1993 | 0.699 | 29.0382 | 1.0614 | 19.8374 | 1.0439 |
| 1994 | 0.7022 | 23.9541 | 1.049 | 16.0398 | 1.0713 |
| 1995 | 0.5617 | 127.2249 | 1.0245 | 6.8300 | 1.2144 |
| 1996 | 0.4211 | 25.4768 | 1.0321 | 6.9312 | 1.1995 |
| 1997 | 0.558 | 9.6698 | 1.0105 | 4.3043 | 1.1545 |
| 1998 | 0.6798 | 13.3189 | 1.0102 | 2.7984 | 1.0897 |
| 1999 | 0.7021 | 17.2120 | 1.0295 | 0.6649 | 1.0606 |
| 2000 | 0.7112 | 17.7094 | 1.0445 | 0.8919 | 1.0583 |
| 2001 | 0.7004 | 18.9740 | 1.0233 | 0.0685 | 1.0273 |
| 2002 | 0.6917 | 14.6337 | 1.0115 | 0.8073 | 1.059 |
| 2003 | 0.6967 | 15.0050 | 1.0176 | 0.4144 | 1.0533 |
| 2004 | 0.688 | 16.2948 | 0.9957 | 0.4844 | 1.0068 |
| 2005 | 0.6824 | 13.4120 | 0.9988 | 0.8889 | 1.0332 |
| 2006 | 0.5997 | 8.8385 | 1.0089 | 0.2584 | 1.1162 |
| 2007 | 0.6513 | 10.5210 | 1.013 | 0.5107 | 1.0756 |
| 2008 | 0.6576 | 10.9312 | 1.0161 | 0.9359 | 1.0597 |
| 2009 | 0.6445 | 10.5299 | 1.0169 | 1.1471 | 1.0564 |
| 2010 | 0.6495 | 9.7314 | 1.0089 | 1.7241 | 1.0188 |
| 2011 | 0.6785 | 11.2660 | 1.0155 | 3.3041 | 0.9534 |
| 2012 | 0.6707 | 10.4215 | 0.9947 | 2.3943 | 0.9235 |
| 2013 | 0.6742 | 10.9064 | 1.0164 | 3.7409 | 0.9173 |
| 2014 | 0.6809 | 10.9138 | 1.0113 | 4.6573 | 0.8704 |
| 2015 | 0.6753 | 10.7472 | 1.0075 | 3.5975 | 0.9037 |
| 2016 | 0.6768 | 10.8558 | 1.0117 | 3.9986 | 0.8971 |
| 2017 | 0.6777 | 10.8389 | 1.0102 | 4.0845 | 0.8904 |
| Mean | 0.6709 | 25.4126 | 1.0547 | 14.3068 | 1.0396 |
Note: MES(KE) *, MES(LE) * and MES(HE) * represent the Morishima elasticities of capital, labor and human capital in the four-factor trans-log model, respectively.
© 2020 by the authors. Licensee MDPI, Basel, Switzerland. This article is an open access article distributed under the terms and conditions of the Creative Commons Attribution (CC BY) license (http://creativecommons.org/licenses/by/4.0/).
Share and Cite
MDPI and ACS Style
Li, Y.; Xia, Y.; Wu, Y.-C.; Wong, W.-K. The Sustainability of Energy Substitution in the Chinese Electric Power Sector. Sustainability 2020, 12, 5463. https://0-doi-org.brum.beds.ac.uk/10.3390/su12135463
AMA Style
Li Y, Xia Y, Wu Y-C, Wong W-K. The Sustainability of Energy Substitution in the Chinese Electric Power Sector. Sustainability. 2020; 12(13):5463. https://0-doi-org.brum.beds.ac.uk/10.3390/su12135463
Chicago/Turabian StyleLi, Ying, Yue Xia, Yang-Che Wu, and Wing-Keung Wong. 2020. "The Sustainability of Energy Substitution in the Chinese Electric Power Sector" Sustainability 12, no. 13: 5463. https://0-doi-org.brum.beds.ac.uk/10.3390/su12135463
Note that from the first issue of 2016, this journal uses article numbers instead of page numbers. See further details here.