Life Cycle Assessment of Aquaculture Stewardship Council Certified Atlantic Salmon (Salmo salar)


Environmental Studies, Eckerd College 4200 54th Ave N, St Petersburg, FL 33711, USA
*
Author to whom correspondence should be addressed.
Sustainability 2020, 12(15), 6079; https://0-doi-org.brum.beds.ac.uk/10.3390/su12156079
Submission received: 25 June 2020
/
Revised: 14 July 2020
/
Accepted: 21 July 2020
/
Published: 29 July 2020
(This article belongs to the Section Sustainable Food)
Abstract
:Salmon aquaculture has grown rapidly and is expected to continue to grow to meet consumer demand. Due to concerns about the environmental impacts associated with salmon aquaculture, eco-labeling groups have developed standards intended to hold salmon producers accountable and provide a more sustainable option to consumers. This study utilized life cycle assessment (LCA) to quantify the environmental impacts of salmon raised to Aquaculture Stewardship Council (ASC) certification standards in order to determine if ASC certification achieves the intended reductions in impact. We find that environmental impacts, such as global warming potential, do not decrease with certification. We also find that salmon feed, in contrast to the on-site aquaculture practices, dominates the environmental impacts of salmon aquaculture and contributes to over 80% of impacts in ozone depletion, global warming potential, acidification, and ecotoxicity. Based on these findings, we recommend that eco-labeling groups prioritize reducing the environmental impacts of the feed supply chain.
1. Introduction
Aquaculture, as a global industry, has grown rapidly over the past several decades as demand for seafood has increased [1] and wild stocks have decreased [2]. Between 2010 and 2017, world-wide fish aquaculture production increased by 41%, or 15 million tons of fish [3]. Salmonids, such as salmon and trout, have been the highest-valued seafood product in global trade since 2013 [3]. Production of farmed Atlantic salmon, the focus of this study, has grown faster than other major food sectors [2], with 70% of salmon consumed being an aquaculture product [4].
As salmon aquaculture has increased, so has concern about its environmental impacts. The primary concerns relate to excess feed and salmon waste discharge [5,6]. Salmon waste and excess feed can contribute to high levels of nitrogen and phosphorus in the local environment [5] stimulating phytoplankton blooms [6]. Critics of salmon farming also raise concerns about ecological impacts such as pathogenic interaction between wild and farmed fish and fish escapes.
Attempts have been made to minimize the environmental impact of salmon farming through the use of land-based aquaculture or marine bag systems. Land-based circulation systems raise fish in facilities on shore, drawing water from local ocean channels or recirculating freshwater throughout the site [7]. Other techniques, such as the marine bag system, replace nets in conventional net-pen systems with impermeable bags through which water is continuously pumped [7]. While these systems reduce some ecological problems associated with salmon farming, these methods also exhibit a higher overall environmental impact. A life cycle assessment conducted on these alternative salmon farming methods indicated that increased material and energy use contributes to higher global warming potential (GWP), acidification, and non-renewable resource depletion vs. conventional salmon farming, with the increases ranging from minimal (0.5%) to large (500%) [7].
Regulations have been established to manage the environmental impacts of aquaculture in the countries that are major producers of salmon aquaculture, including the United States [8], Canada [9], Chile [10], and Norway [11]. While these regulations provide baseline requirements, many groups consider current regulations inadequate [12]. Because the Atlantic salmon industry is growing but contentious, third party certifications have been developed with the intention to produce reliable products for consumers and to hold fish producers to higher standards. These certifications can allow companies to protect their reputation and limit production costs, while also addressing the demands of activists [12]. Certification involves setting environmental and social standards, auditing to confirm compliance with standards, labeling products or institutions that meet standards, and running an organization to perform certification [12].
The Aquaculture Stewardship Council (ASC) is a prominent, nongovernmental organization that has developed aquaculture certifications for the highest demand species in global markets. ASC is financially supported by food retailers, hospitality companies, restaurant chains, seafood producers, fish feed producers, and seafood processors [13]. According to the ASC, their Salmon Standard was created to offer a superior and economically viable product while minimizing environmental and social impacts [14]. To protect local wildlife, certified sites consistently test for sea lice, follow strict medicine guidelines, meet numerous water quality standards throughout the harvest cycle, and cannot be placed in a High Conservation Value Area [14].
Additionally, sites must formulate their feed with specific marine and agricultural ingredient standards, include chain-of-custody certifications for feed ingredients, follow fair labor agreements, and educate local communities on any impacts of their farm [14,15]. Regarding marine ingredients, the ASC Salmon Standard and ASC Feed Standard limit the percentage of fishmeal and fish oil in feed, require third-party chain-of-custody certification for fishmeal and fish oil by the ISEAL Alliance, and restrict by-products or trimmings that come from vulnerable marine species [14]. Agricultural-based ingredients must undergo a risk assessment and be sourced in a manner that complies with local laws or moratoriums, all soy must be certified by the Roundtable for Responsible Soy (RTRS), and salmon producers must disclose if genetically modified ingredients were used in their feed.
While these certifications make claims about reducing environmental impacts, comprehensive analysis is essential to test these assertions. Few methods exist to scientifically and quantitatively evaluate the impacts of aquaculture [16]. However, life cycle assessment (LCA) has been widely used as a key method to study aquaculture since the early 2000s [17]. LCA is a comprehensive method to identify and quantify the environmental impacts of a product, process, or activity throughout its entire lifespan through a standardized method [18]. Calculating environmental impact categories, LCA is a scientifically and quantitatively sound method to compare food production systems [19]. Using LCA, the inputs and outputs throughout the whole life cycle of a product or process are considered: extraction and processing of raw materials; manufacturing, transportation, and distribution; use and maintenance; and recycling and disposal [18]. Since LCA can identify key environmental impacts that should be considered in certification, LCA is an ideal measurement of seafood sustainability or third-party certifications [20]. Several comparative LCA studies have been conducted with farmed salmon and other food production systems [21,22,23,24,25,26] and salmon farming methodology [7,27]. Additionally LCA has been used to show lower environmental impacts in ASC certified pond aquaculture systems [28], but the same has not been demonstrated for marine pen aquaculture.
This study analyzed the life cycle environmental impacts of a Canadian Aquaculture Stewardship Council certified salmon farm in order to (1) show the environmental impacts of Aquaculture Stewardship Council certified salmon farms, and (2) compare impacts to historical data of noncertified farms.
2. Materials and Methods
2.1. Site Characteristics
This study analyzed an ASC certified Atlantic salmon farming site in British Columbia, Canada, that uses conventional floating net-pen systems during one grow-out cycle from November 2016 to May 2018. To operate the site, all equipment, fuel, feed, smolts, or goods used on site were brought in by boat. Employees lived on site in company-provided housing for one-week shifts. During this grow-out cycle, this site produced 2,895,275 kg of harvest-ready salmon from 554,106 fish.
2.2. Typical Salmon Farming Methodology
Large-scale producers of Atlantic salmon tend to farm salmon in a similar manner. The salmon lifecycle generally begins at a land-based freshwater facility where brood stock, mature salmon that produce all eggs and smelt, are kept. In hatcheries, eggs are fertilized, and juvenile smolts are produced. After smoltification, the physiological process through which salmon become able to live in marine environments, the fish are transferred to marine pens for a grow-out season [6,23]. During the grow-out season, salmon are raised from a juvenile smolt to an adult, harvest-ready salmon in floating marine net-pens. Net-pens are typically constructed with a metal frame strung with high-density polyethylene (HDPE) nets to isolate the farmed fish from the local wildlife. During each phase of the salmon’s life, they are fed specialized feeds to mimic their natural diet and provide high nutritional content for consumers. The process of grow-out typically takes 18–24 months depending on the size of the smolts delivered to the site.
2.3. Specific Site Methodology
On this salmon farm, workers spend one week living and working on the farm in crews. Employees live in a floating house on site powered with a diesel generator (House operations) and propane. To emulate a long fall and prevent salmon from sexually maturing, large lights are powered by light generators throughout the winter.
Silos of fish feed are held in a floating feed shed. Fish are fed multiple times a day with a hands-free feeding system that is based inside the shed. All of the electricity inside of the feed shed is powered by the feed generator, a diesel generator.
The site is located in an area in which there are higher levels of harmful plankton blooms or environmental changes compared to other salmon farming sites in British Columbia. The net-pen compressors are used to oxygenate the water, which decreases mortalities and increases respiration rates of fish.
2.4. Goal and Scope
The environmental impacts associated with producing Aquaculture Stewardship Council certified salmon in British Columbia, Canada, were quantified according to the International Organization for Standardization (ISO) standards 14040 and 14044 [18,29] using SimaPro® v8.4.0 software. These ISO standards outline basic guidelines and requirements for conducting a life cycle assessment. The functional unit of the present study is one kilogram of harvest-ready salmon. This LCA covers the production of salmon from smolts through grow-out until they are deemed market-ready at approximately 3 to 5 kg.
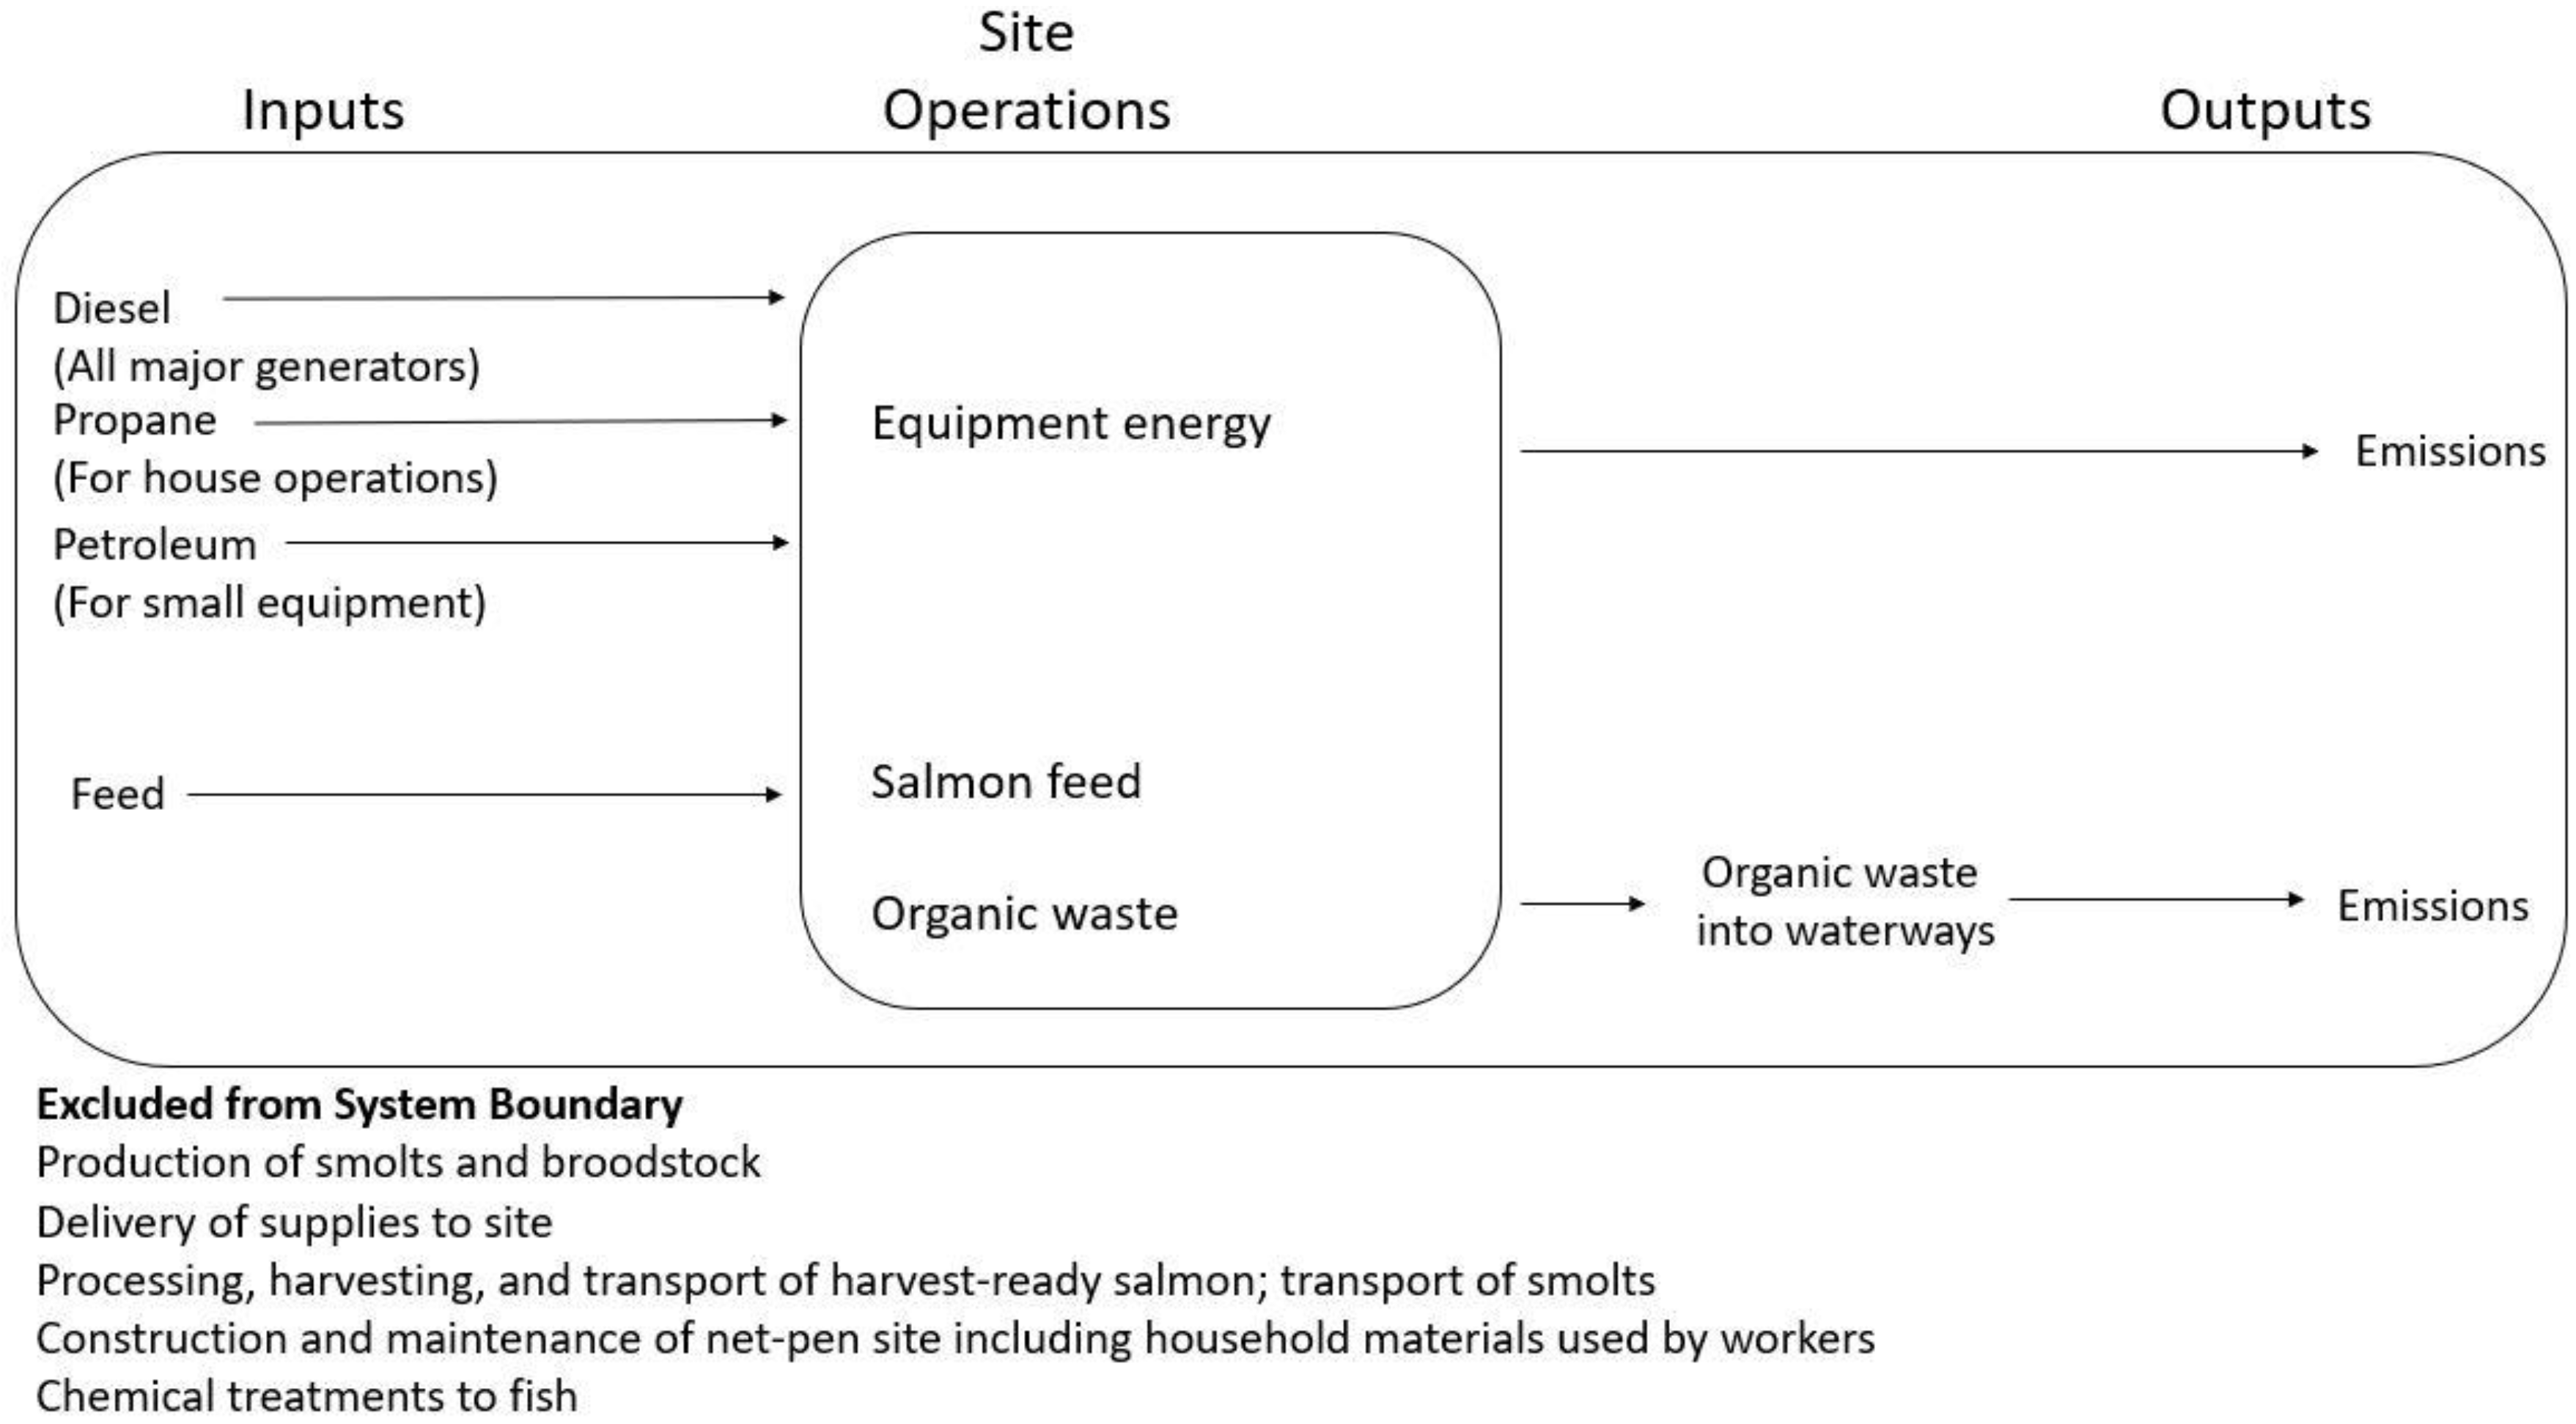
These system boundaries include the majority of the energy and materials that flow throughout the farm during the grow-out stage of salmon farming. Included in the system boundaries are the equipment energy, salmon feed, and organic waste; these three components comprise site operations (Figure 1). Equipment energy includes all diesel, gasoline, and propane used on site. Diesel was the primary fuel on site and was used to electrify the feed shed with its power feeding machinery, light the farm, heat or cool the site house for workers, power appliances within the site house, compress air to aerate net-pens, and clean the net-pens. Propane was used to power cooking and refrigeration for site houses and petroleum was used to power small equipment or boats. Salmon feed includes all the feed given to the salmon throughout the grow-out cycle. Organic waste consists of the salmon feed waste and fecal waste that is produced by the fish.
Two elements (2) that are specifically excluded from the system boundary include the production of brood stock and smolts, as these processes do not occur on site. Previous studies have shown that rearing smolts has minor contributions to the environmental impacts of salmon aquaculture [7]. A study by Ayer and Tyedmers [7] found that smolt production contributed to 0.04% of total GWP on site. Additionally, transport of smolts from hatcheries to net-pens by trucks and live-haul boats and deliveries of supplies are excluded from system boundaries, because they are outside the bounds of farm operations. Processing, harvesting, and transport of the harvest-ready salmon occur off site, are not regulated by ASC standards [14], and are thus excluded from the study.
The farm site construction, household materials, and chemical treatments were also excluded from the current study. Construction, manufacturing, and maintenance of the floating farm site and manufacturing of machinery used on site is also outside the boundaries of the study because the impacts of manufacturing extend well beyond the 18–24 months of harvest assessed. The impacts of the construction or maintenance of household materials used by workers such as food, clothing, protective gear, or other household items used by farm staff also extend past the period of time assessed and were not included. Impacts of all chemical treatments administered to the fish, such as pharmaceuticals, supplements, or medicated feed administered, are not reflected within the study, as appropriate models are not available to analyze their environmental impacts.
2.5. Life Cycle Inventory (LCI)
This study analyzed all relevant inputs and outputs associated with the grow-out of salmon aquaculture. Primary data, or data collected from the site, were collected via records, interviews, and observations regarding the use of fuels and farm operations. Specific records collected include diesel consumption and generator records, fish production records, feed consumption records, and biochemical oxygen demand (BOD) data. This project also utilizes two sources of secondary data; the Agri-footprint LCA database [30] was used to model salmon feed ingredients, and the U.S. LCI database [31] was used to model equipment energy use on site.
2.5.1. LCI: Equipment Energy
Diesel was the main energy source for the generators (feeding shed, site house, and lighting shed), net-pen air compressors, and net-washing air compressors on site. Hours of use for generators and net-pen compressors came directly from recorded logs from each farm site. Kilowatt-hour ratings of generators and net-pen compressors were used to generate diesel consumption values in liters (L). Data for the frequency of net washing and diesel consumption of machinery came from boat workers and farm site managers. Values for propane and petroleum usage (L) came directly from recorded fuel logs.
2.5.2. LCI: Salmon Feed
The exact feed composition used on site was not disclosed by the feed vendor, so a nonorganic feed model from Pelletier and Tyedmers [32] was used as a basis for the present study. This model represents an average conventional feed used in British Columbia, Canada. The site provided protein-to-lipid-to-carbohydrate feed ratios total consumption for six feed variations. These data were used to adjust the generic feed model to more closely resemble the specific feed variations used on site.
2.5.3. LCI: Organic Waste
Organic waste was measured through biochemical oxygen demand (BOD). BOD measures the potential for inorganic or organic matter to cause oxygen depletion in natural waters [33]. Biodegradation tests, such as BOD, are frequently used as a proxy for organic waste input to the marine environment [33], and many life cycle assessments on aquaculture systems utilize BOD to approximate nutrient input [34].
BOD values were measured by the farm site in compliance with ASC standards. Nitrogen (N) and carbon (C) content of feed and total fish biomass growth during the grow-out cycle were used to determine the BOD for each harvest cycle. Calculated conversion factors were used to quantify the BOD through known kg of C and N in each kg of feed. Standardized Canadian Atlantic salmon conversion factors from the Global Aquaculture Performance Index (GAPI) were used to determine the BOD on site [35]. BOD is used by GAPI as a key discharge measurement tool to assess the sustainability of finfish aquaculture species by location [36].
2.6. Life Cycle Impact Assessment (LCIA) Methodology
The Intergovernmental Panel on Climate Change (IPCC) 2013 I00a and the Tool for Reduction and Assessment of Chemicals and Other Environmental Impacts (TRACI) 2013 Impact methodology were used to report impacts for this study. IPCC 2013 100a is a life cycle assessment methodology developed by the Intergovernmental Panel on Climate Change that quantifies the global warming potential (GWP) of a process over 100 years in kg CO2 equivalents (eq). IPCC results were used to compare the present study to previous, noncertified salmon aquaculture studies. TRACI, or Tool for the Reduction and Assessment of Chemical and Other Environmental Impacts, is a life cycle assessment metric developed by the U.S. Environmental Protection Agency [37]. The impact categories ozone depletion (kg CFC eq), GWP (kg CO2 eq), smog formation (kg O3 eq), acidification (kg SO2 eq), eutrophication (kg N eq), and ecotoxicity (CTUe) for aquatic ecotoxicity impacts) were quantified in the present study because they best represent the environmental impacts experienced on aquaculture sites. TRACI also quantifies human health impacts and fossil fuel depletion, but these impacts are not explicitly addressed in this study. TRACI was utilized to gain a comprehensive understanding of environmental impacts, while IPCC only provides one measured impact, GWP, which can be compared to published data sources. Full TRACI results with human health and fossil fuel depletion results are available in Appendix A.
3. Results
3.1. General Results
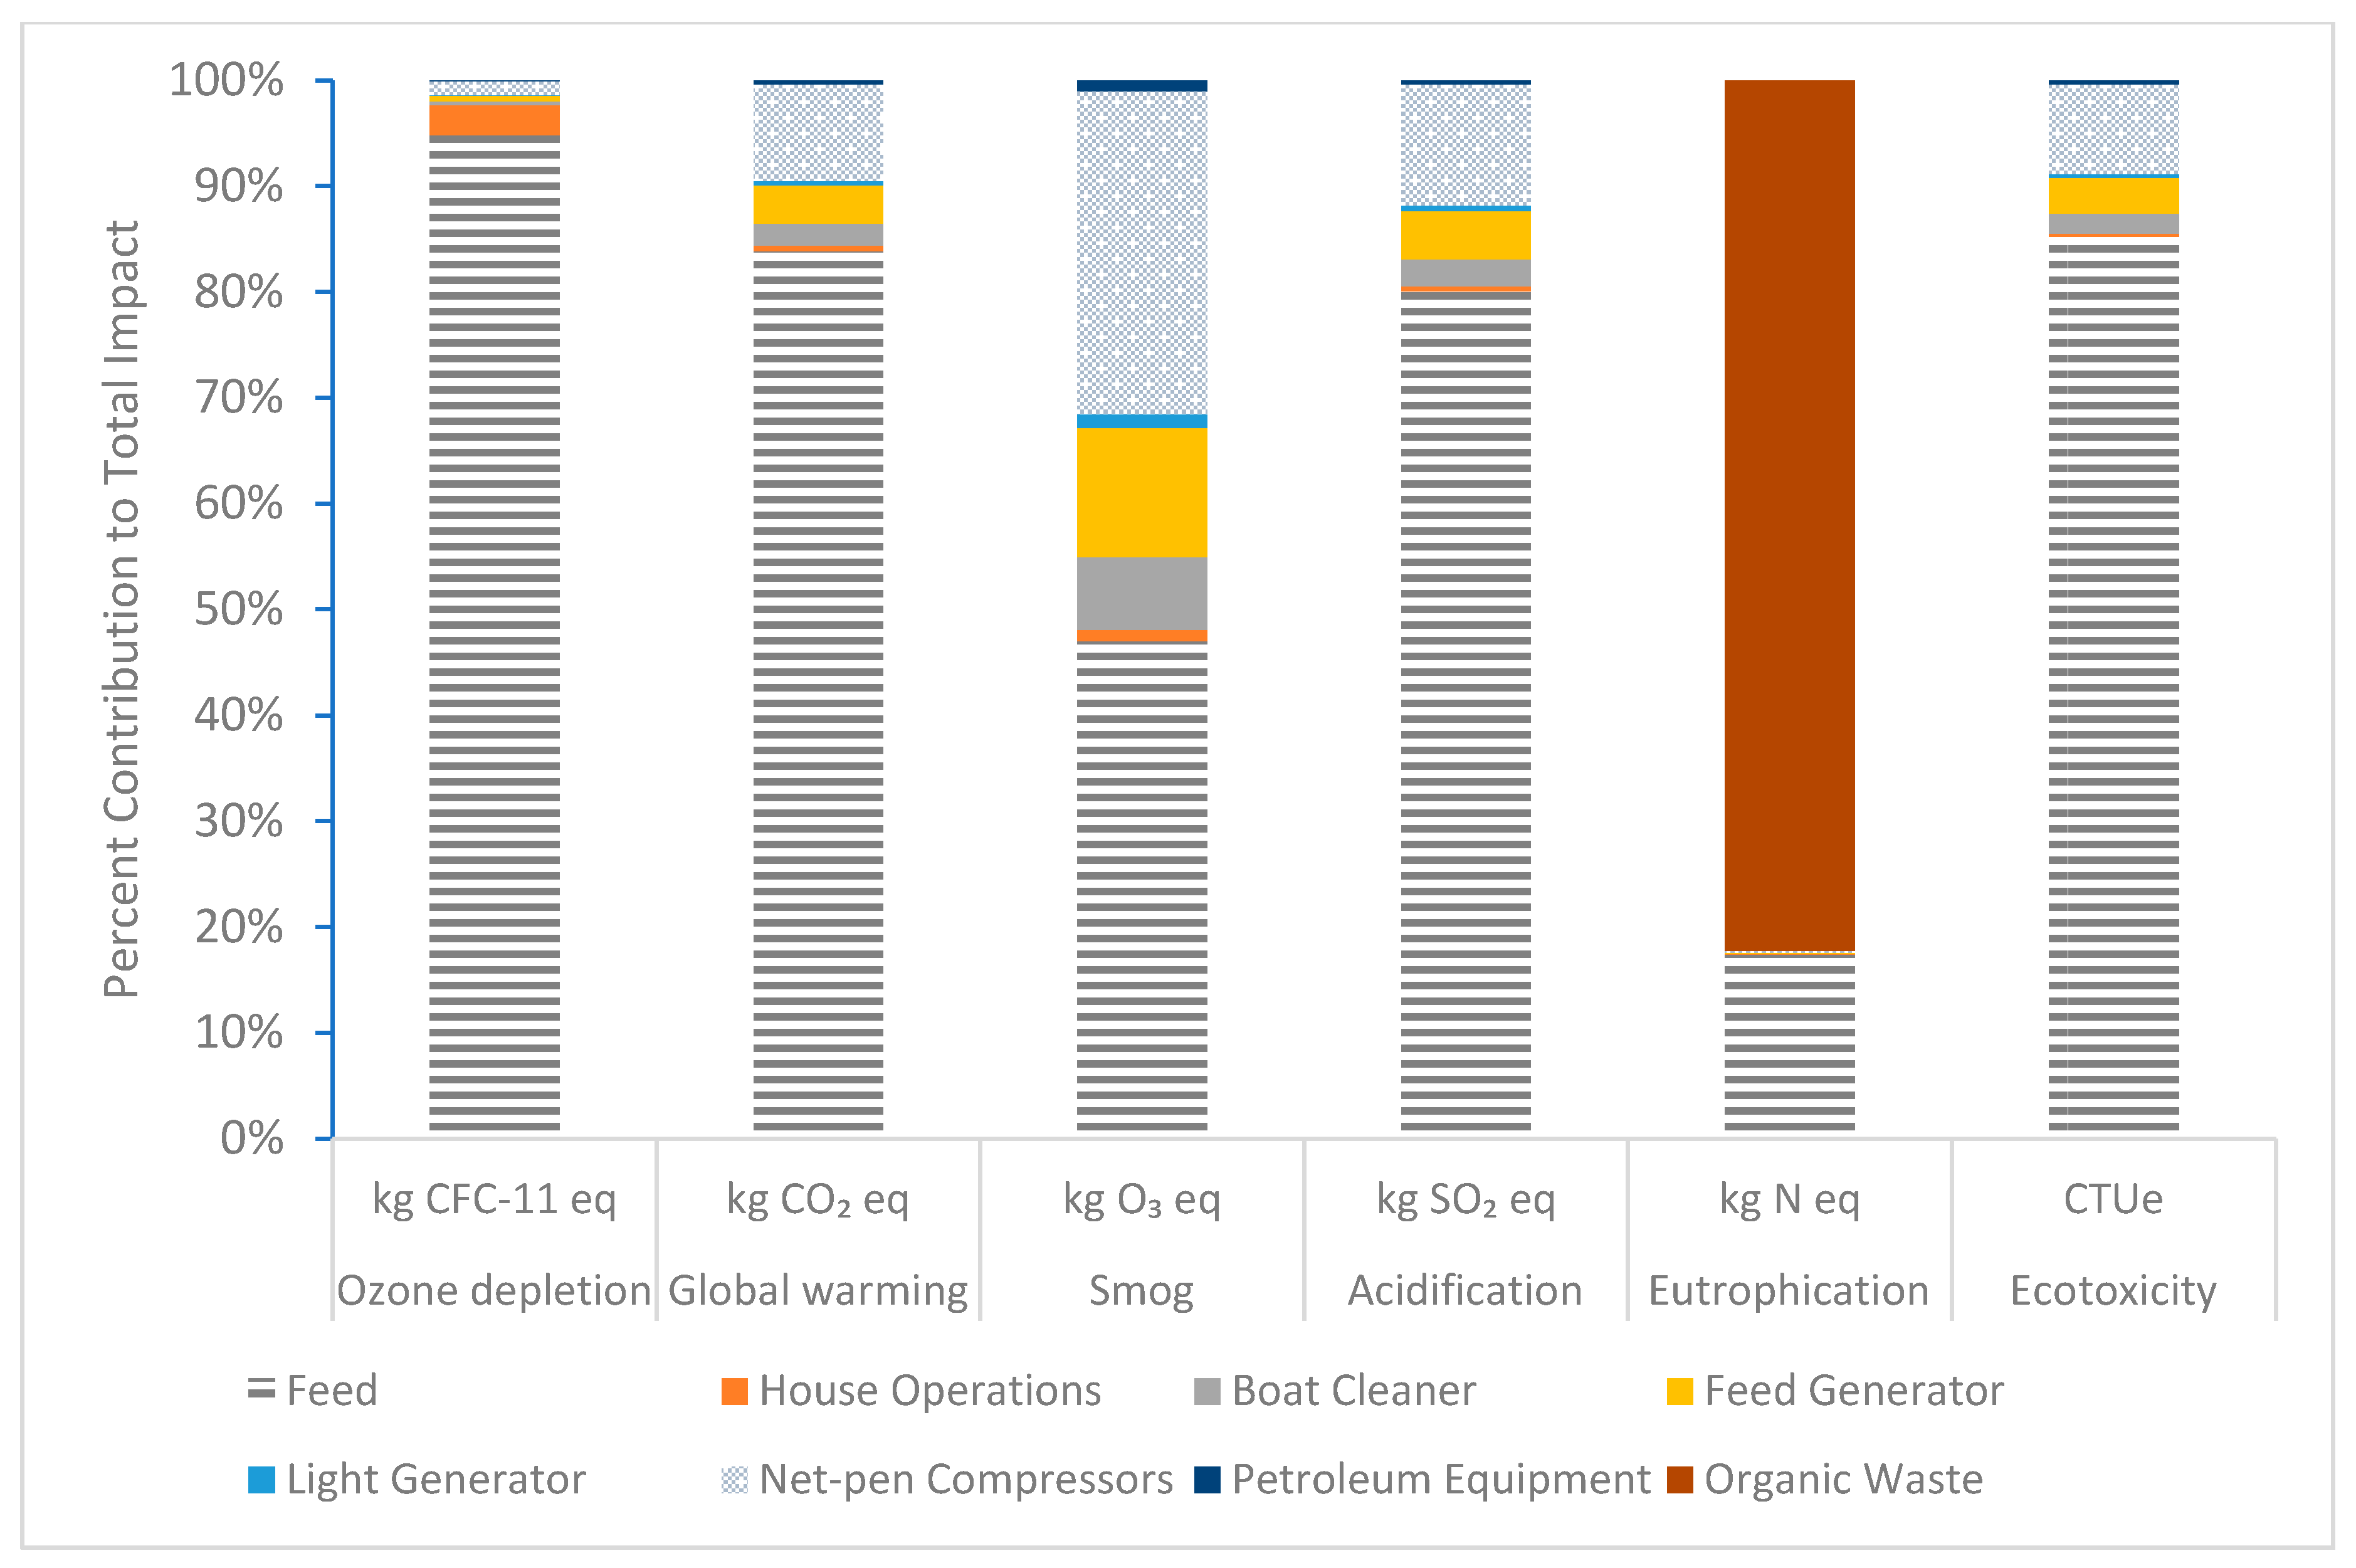
Salmon feed had the largest effect on the overall environmental impact of salmon in all measured categories except eutrophication. Notably, salmon feed contributed over 80% of environmental impact in all impact categories, except for smog formation or eutrophication (Figure 2). These impacts are due to the large quantity of feed that is used in comparison to fuel or other materials. Organic waste dominated eutrophication impacts, contributing 82.2%, but did not contribute to any other impact categories. Equipment energy accounted for 16.5% of the total GWP and 53% of smog impacts measured on site (Figure 2). Of the energy-based inputs, the net-pen compressors and feed generator contributed to the highest level of GWP at 9.14% and 3.64%, respectively (Figure 2).
Overall, the TRACI results show that one kg of salmon contributed to 2.28 kg CO2 eq of GWP (Table 1). Combined site equipment contributed to 16.2% of GWP (Figure 2), whereas salmon feed produced 83.8% of GWP (Figure 2). Using IPCC methodology, one kg of salmon contributed to 2.26 kg CO2 eq of GWP (Table 2). This is remarkably similar to the GWP result from TRACI, with the less than 1% differences due to small variations between TRACI and IPCC in how global warming potential is calculated.
3.2. Equipment Energy
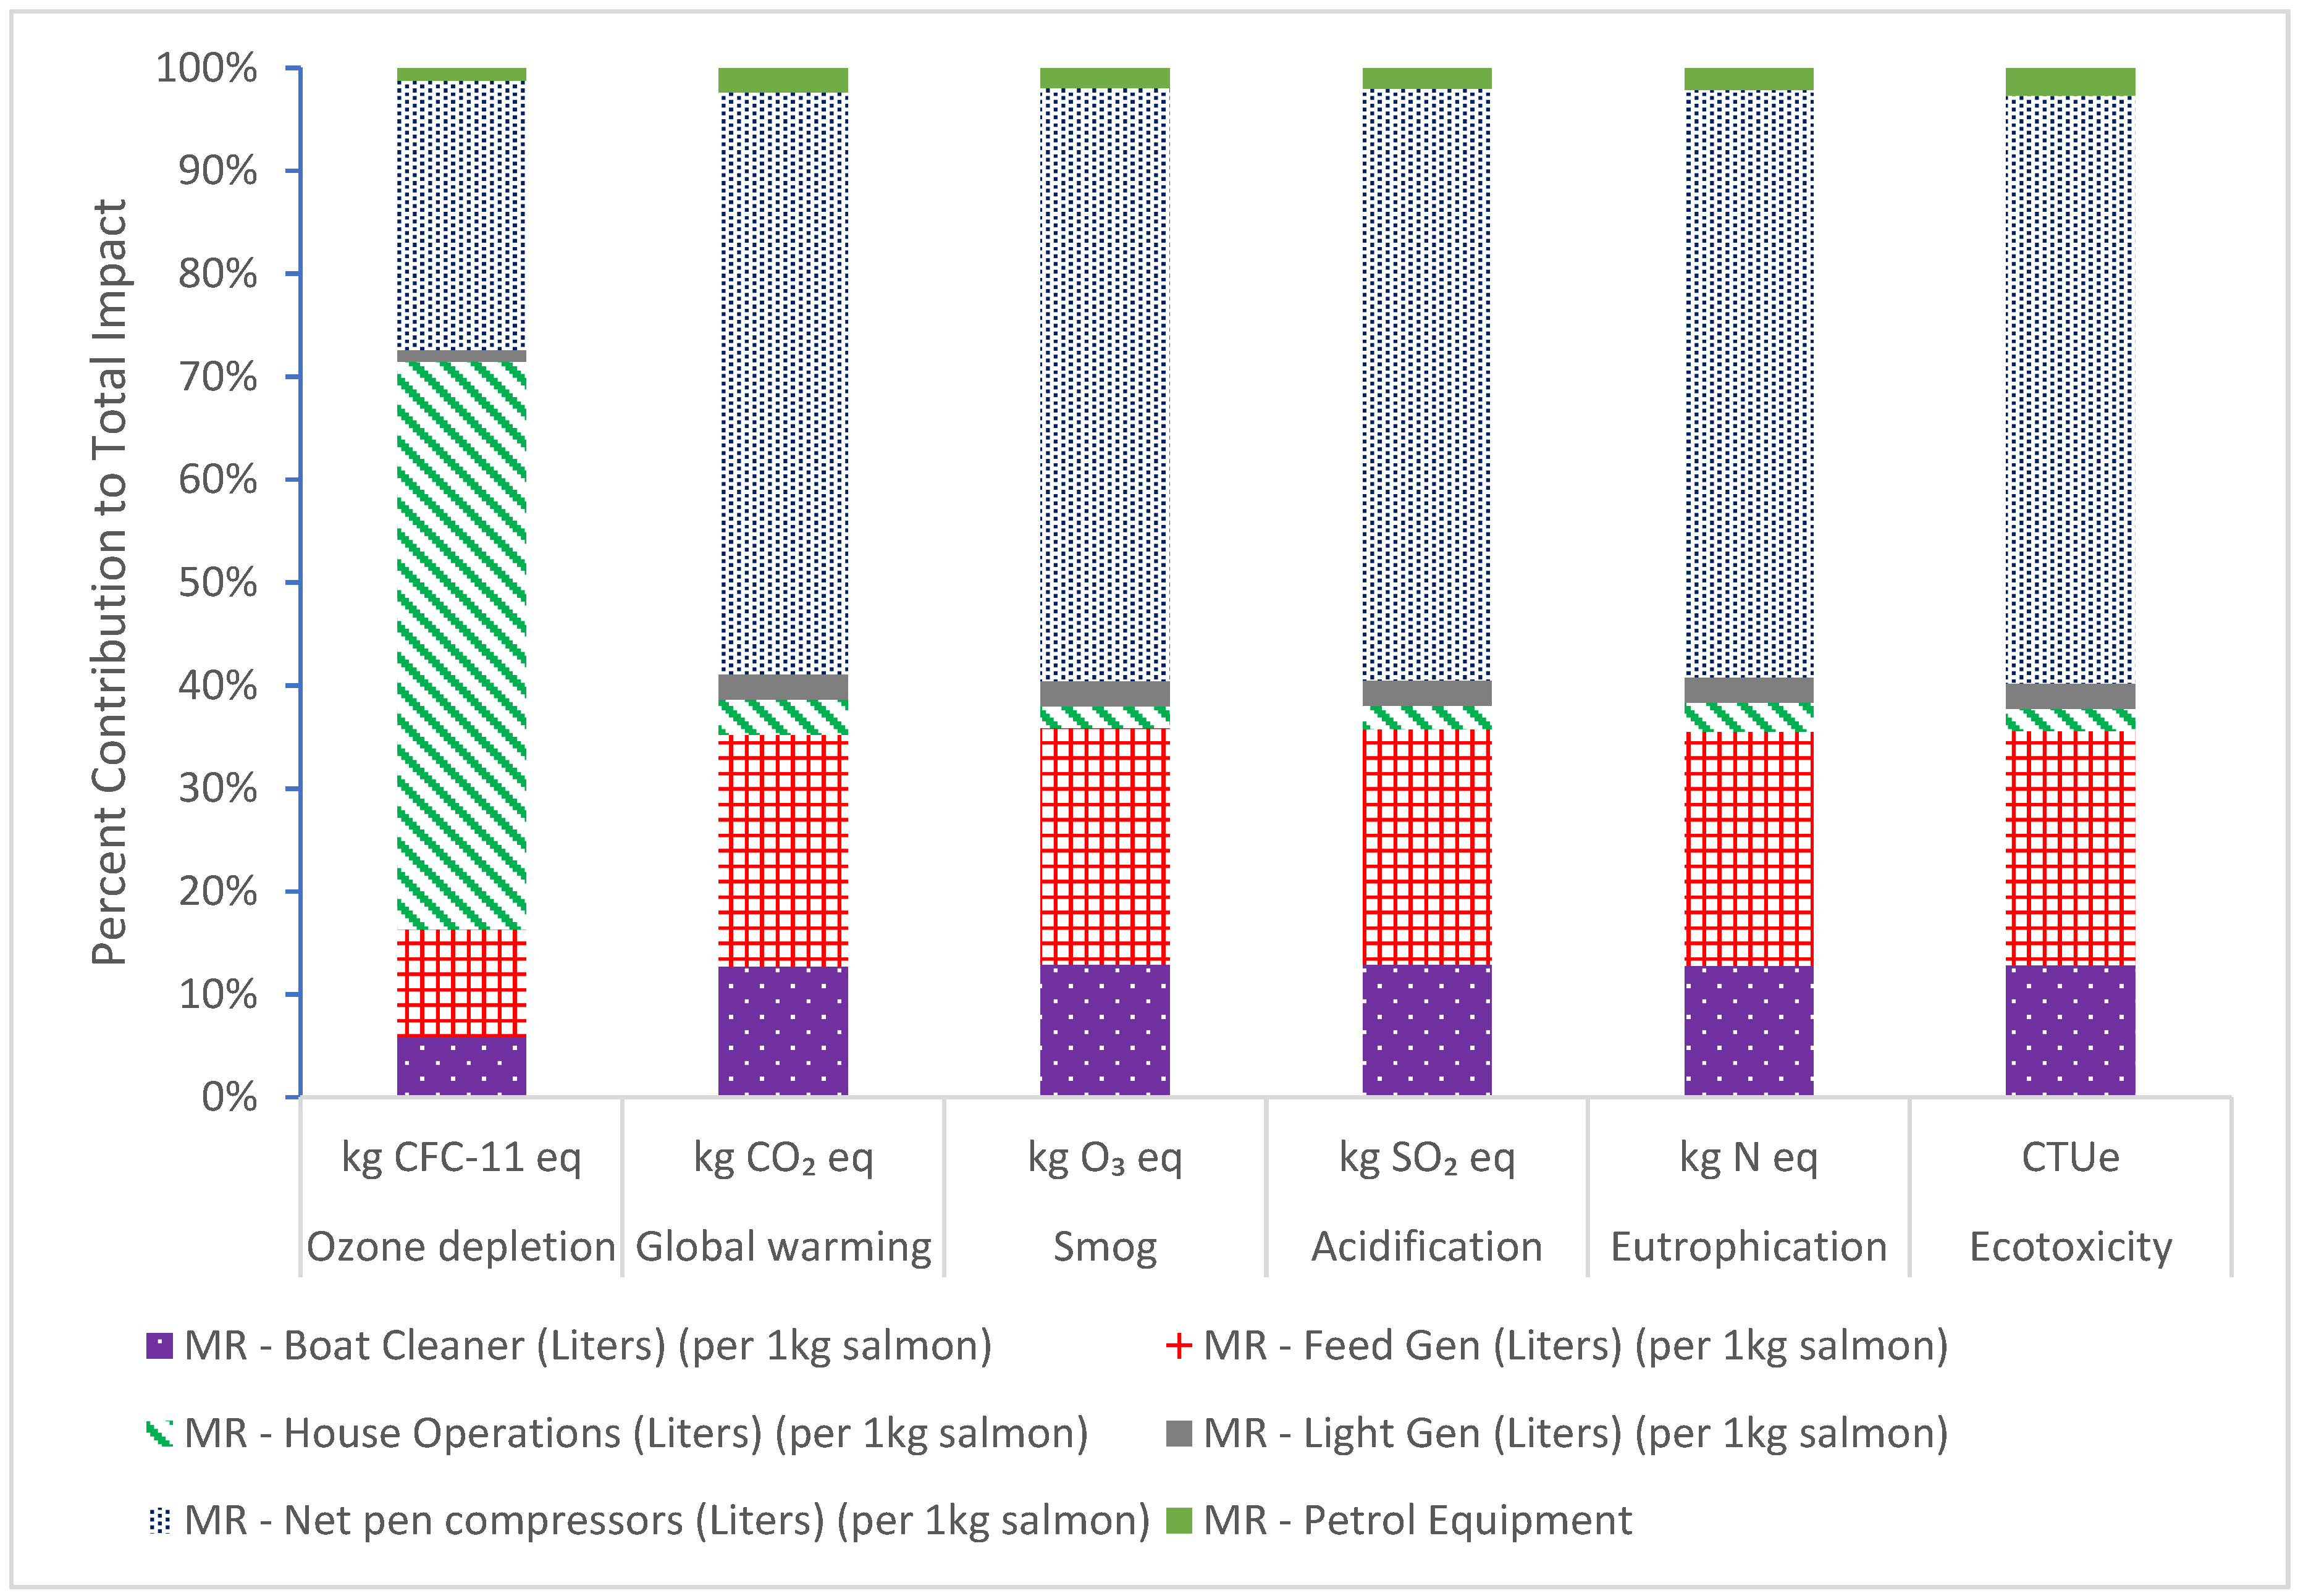
Equipment energy includes diesel used for generators, net-pen air compressors, and net-washing air compressors, as well as propane used for some appliances (house operations) and gasoline used in small boats. Net-pen compressors are responsible for the majority of total diesel consumption and associated GWP.
The other generators and equipment were generally responsible for environmental impacts in proportion to their fuel usage. The noticeable exception is the ozone depletion impact of House Operations, which accounted for 55.2% of ozone depletion (Figure 3). Values for ozone depletion are higher for house operations since propane, a large contributor to ozone depletion, is used for cooking and refrigeration in the site house.
3.3. Salmon Feed
Salmon feed contributed to the highest overall impacts in nearly all measured categories except smog and eutrophication. Furthermore, salmon feed accounted for 94.8% of ozone depletion, 80.1% of acidification impacts, and 85.2% of ecotoxicity impacts (Figure 2). The dominance of salmon feed is due to the quantity of feed needed to raise one kg of salmon and the impacts associated with producing the materials for feed. To produce one kg of harvest-ready salmon requires 1.34 kg of salmon feed. In comparison, to produce one kg of harvest-ready salmon requires only 0.0735 kg of diesel.
Agricultural Products vs. Marine-Based Products in Salmon Feed
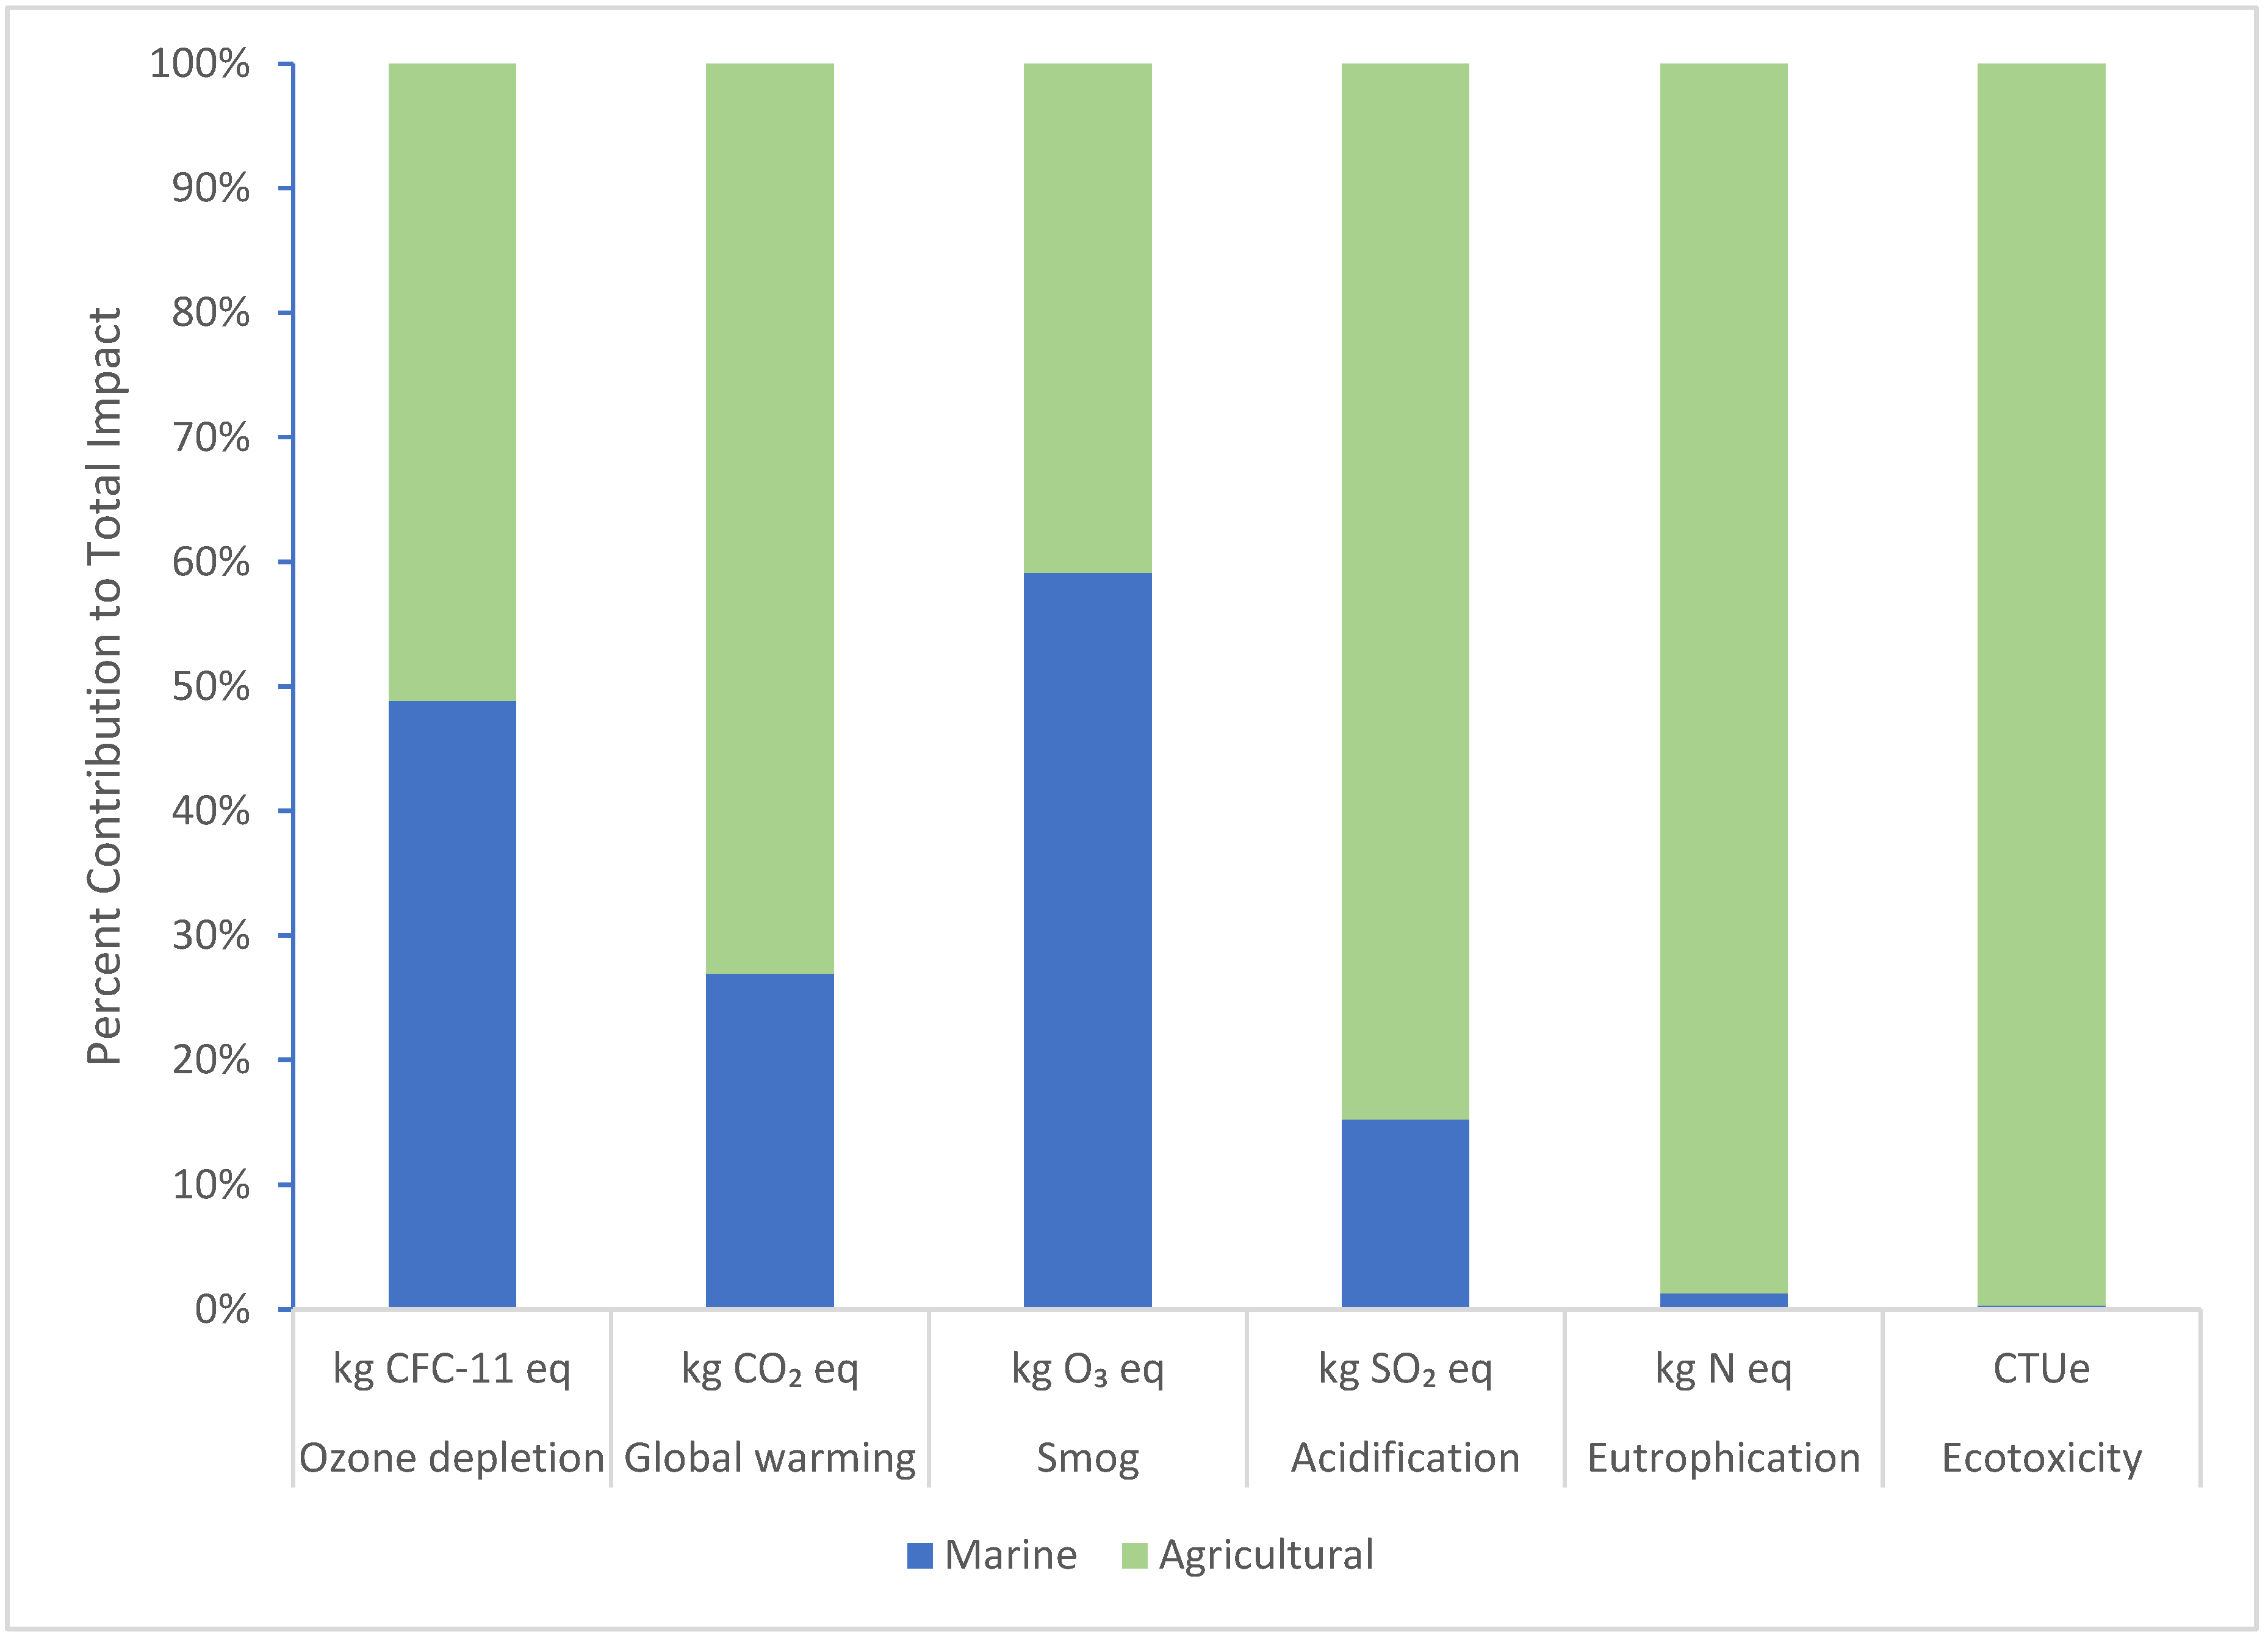
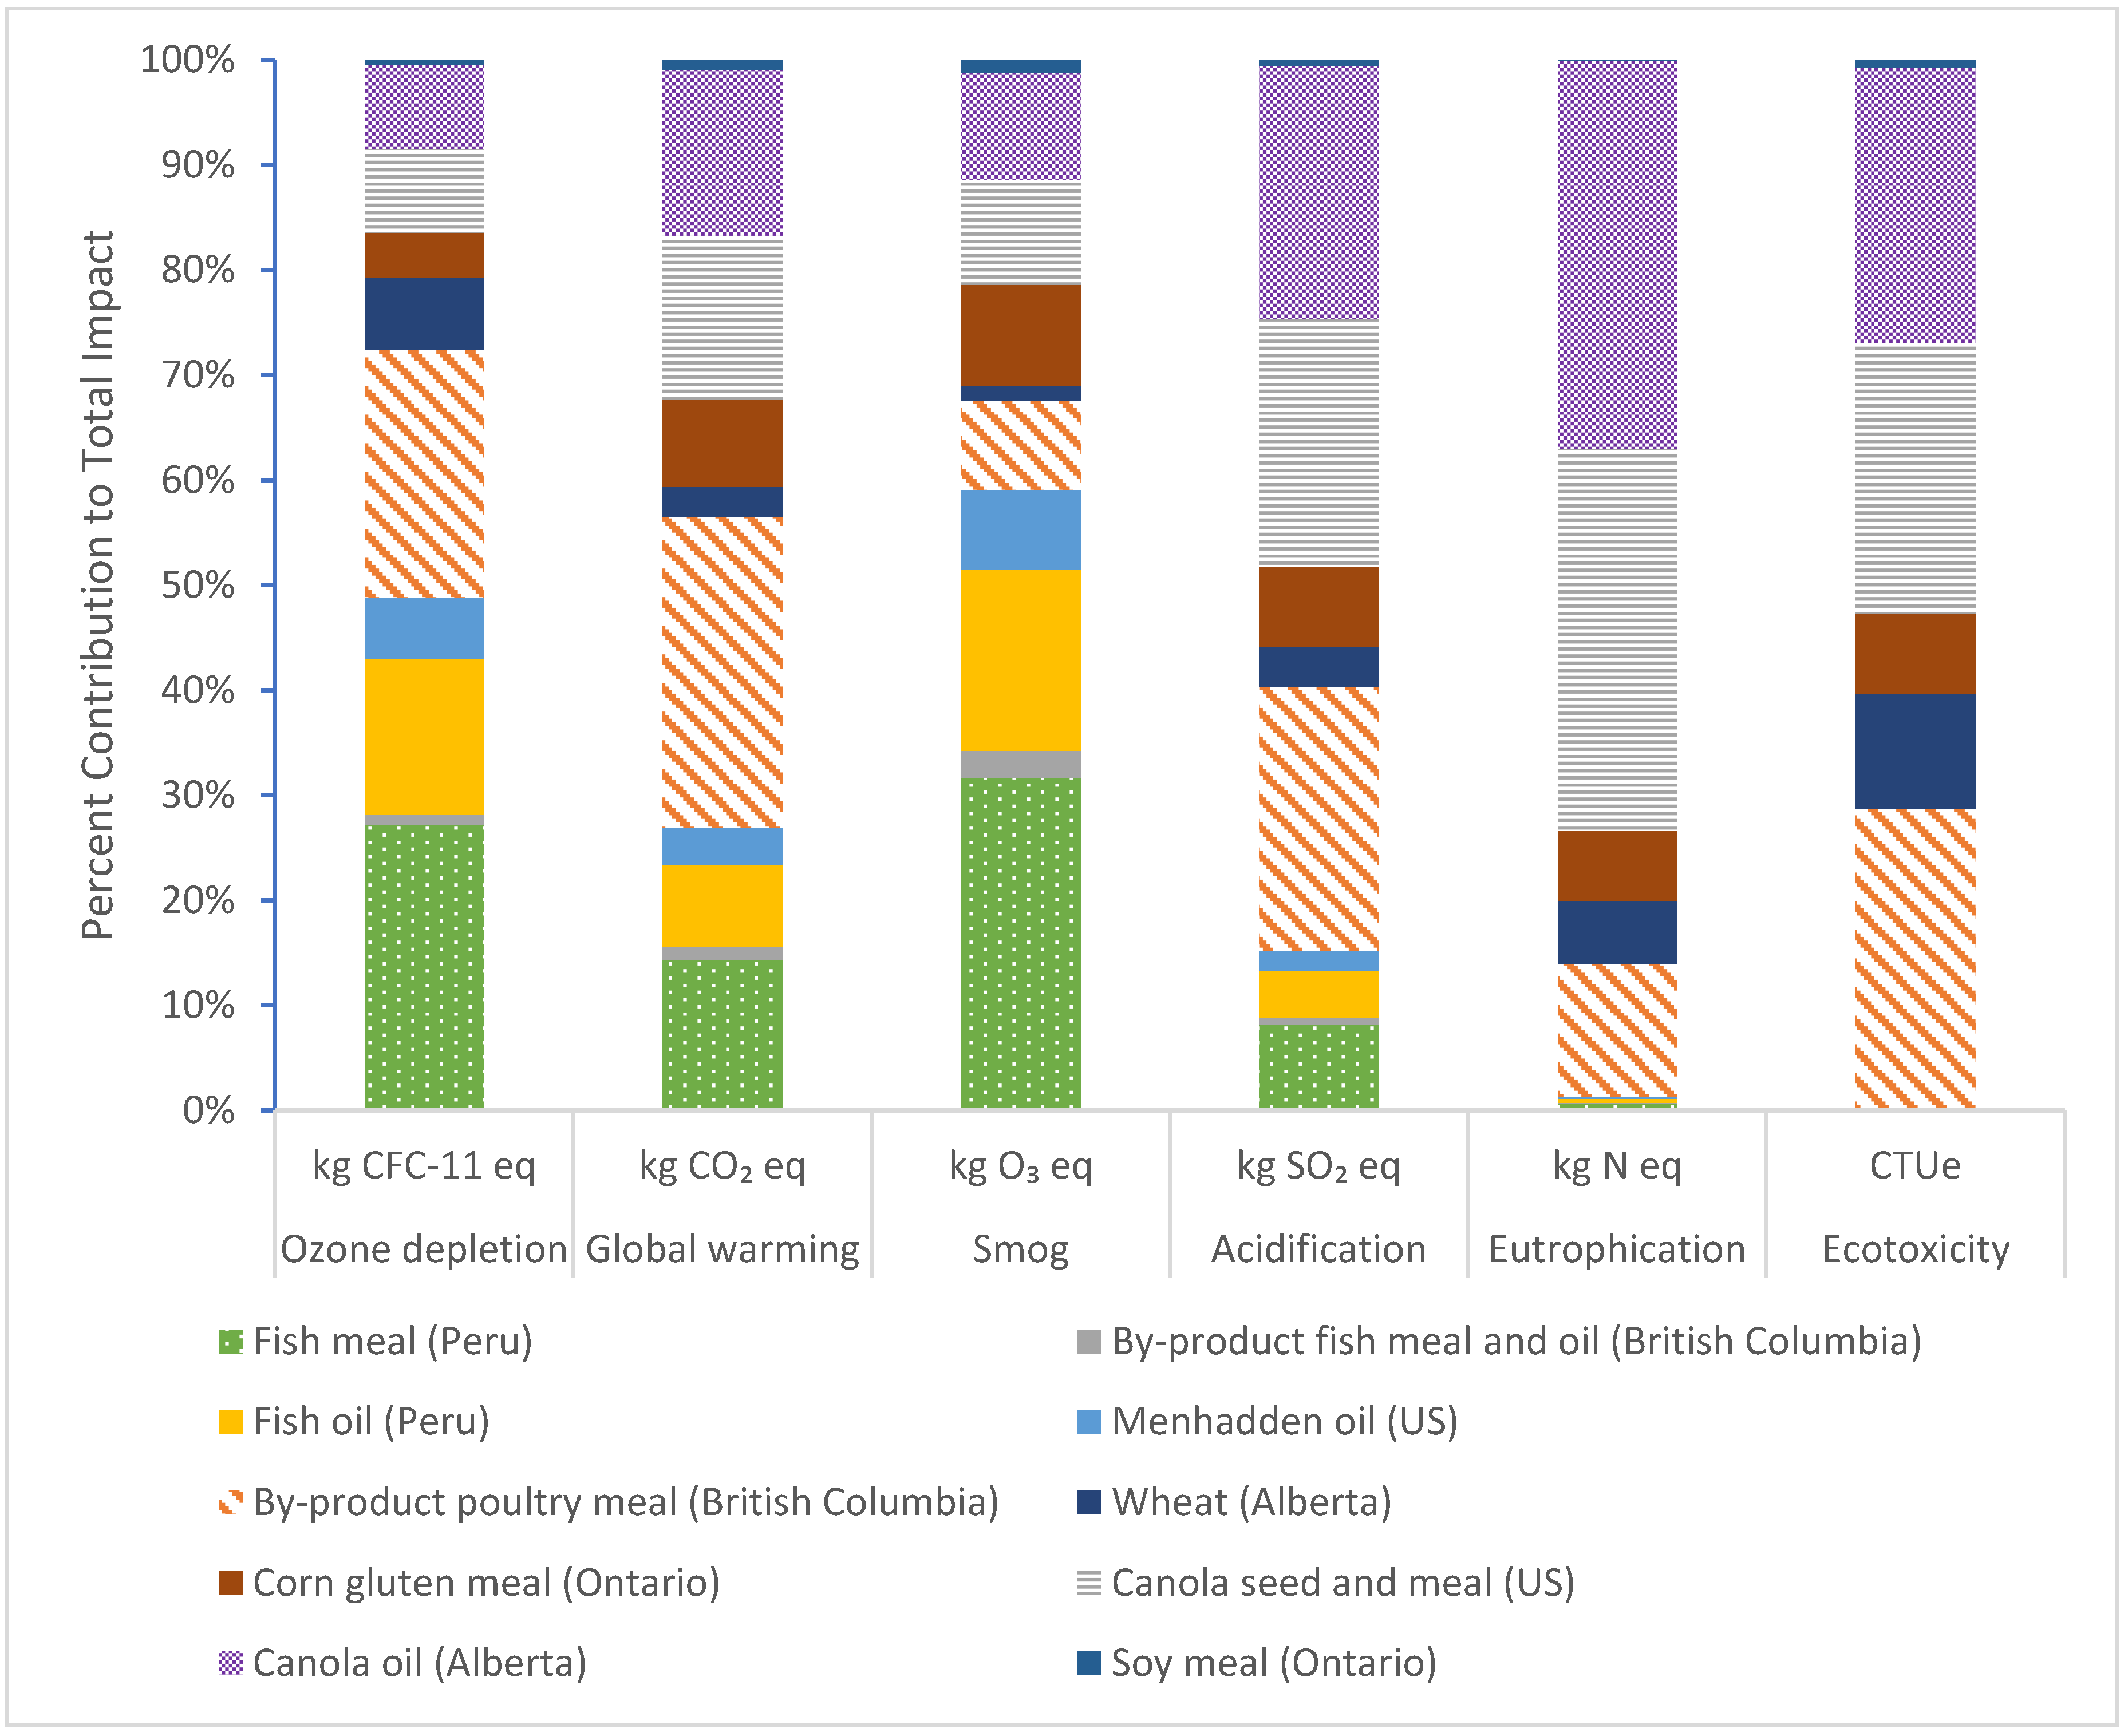
There is considerable variation in impact between the agricultural and marine-based products in salmon feed, but there is not a consistent trend across all impact categories. Agricultural feed components include by-product poultry meal, wheat, corn gluten meal, canola seed and meal, canola oil, and soy meal, while marine-based ingredients include fish meal, by-product fish meal and oil, fish oil, and menhaden oil. Agricultural products lead impacts in GWP, acidification, eutrophication, and ecotoxicity, while impacts are more evenly distributed in ozone depletion and smog (Figure 4). Breaking the salmon feed down by components, the highest impact materials were generally chicken by-product, canola oil, canola seed and meal, and fish meal (Figure 5).
4. Conclusions
4.1. ASC and Certification
ASC certification has been found to reduce environmental impacts of aquaculture in previous studies of other species [28]. However, the GWP results of this study are comparable to other published LCAs of non-ASC certified salmon aquaculture (Table 3). Nhu et al. found that following ASC standards for Pangius pond aquaculture substantially reduced the associated environmental impacts due to changes to farming methodology [28]. In contrast, ASC standards for salmon farming do not require substantial changes to conventional net-pen aquaculture techniques, although it does require greater reporting.
The lack of substantial difference between ASC certified salmon and other salmon models indicates that the aquaculture techniques that are required by ASC certification do not greatly decrease the global warming potential (and likely the other impacts). A major factor in the similarity of results between the ASC certified and other published results is that feed dominates the environmental impact of salmon aquaculture (Figure 2). Feed production is typically done by several large companies, resulting in strong similarities in salmon feed. Therefore, the environmental impacts of salmon net-pen aquaculture will tend to be comparable whether they have been certified by ASC or not, as long as they are raised using similar amounts of feed.
4.2. Formulating Salmon Feed to Reduce Environmental Impacts
It has been demonstrated that salmon feed can be formulated to produce lower carbon emissions without compromising fish health. An LCA conducted on Norwegian salmon diets illustrates that specific combinations of ingredients can be selected to reduce the carbon footprint of salmon feed while maintaining a consistent feed conversion ratio, the grams of feed required to increase salmon body weight by one gram [38]. Hognes et al. found that lower carbon footprints can be achieved when using ingredients from American fisheries rather than European fisheries or by-products from poultry, a common agricultural ingredient used to replace marine-based ingredients [38]. Similarly, Maiolo et al. found that replacing fishmeal with insect meal and/or poultry by-product reduces the environmental impacts of aquaculture [39]. Furthermore, Couture et al. found that single cell proteins (SCPs), such as yeasts, can reduce the impacts of salmon aquaculture when replacing soy in feed [40].
5. Discussion
5.1. Environmental Impacts of Wild vs. ASC Certified Salmon
While aquaculture salmon is typically responsible for more than 2 kg of carbon per kg of fish, an LCA of wild pink salmon, the species accounting for 50% of wild salmon consumption, found that wild salmon is only responsible for 0.59 kg CO2 eq of GWP per kg of fish [41]. Because the study followed the shipment of salmon from the Pacific to the United Kingdom, over 25% of the GWP was due to transport of the fish, and less than 35% of the GWP of the salmon was caused by fishing [41]. Thus, from a carbon perspective, purse seine fishing is more efficient than conventional net-pen aquaculture, and consuming wild salmon is preferable. However the LCA of wild salmon does not take into account species loss or other ecological impacts of fishing. Furthermore, the growing global demand for 2.5 million metric tons of salmon [42] cannot realistically be supplied by wild stocks. Therefore, while wild salmon is a more carbon-conscious choice vs. ASC-certified salmon, it is not a realistic option to supply global markets. Reducing the environmental impact of the salmon industry will require improving salmon aquaculture to reduce the impact of feed and other site operations.
5.2. Influence of Site Selection on Environmental Impact
There are often tradeoffs in environmental conditions when choosing a net-pen aquaculture site. The results of this analysis suggest that farms looking to reduce their environmental impact should seek a site that minimizes feed loss above most other considerations. At certain farm sites, particularly high currents can cause net-pens to rise with the tides to become almost parallel with the water. This can cause increased pellet loss, which inadvertently increases the generalized environmental impacts of the site, including eutrophication. Sites with lower current speeds often experience higher levels of harmful plankton blooms or lower levels of dissolved oxygen, as did the site examined in this study. However, the equipment that improves these conditions, such as net-pen compressors, has a much lower impact on GWP and other environmental impact categories than wasted salmon feed (Figure 2). Thus, careful site location can be used as a method to lower the environmental impact of salmon aquaculture. The dominant impact of salmon feed suggests that minimizing feed loss is more important than minimizing fuel usage when trying to reduce the environmental impact of salmon aquaculture.
5.3. Avenues for Future Research
Currently, ASC requires third-party certification for sourcing of fish meal, fish oil, and soy and is currently developing a standard for agricultural ingredients to address deforestation, soil protection, labor practices, and the use of pesticides, herbicides, and water [15].
This type of comprehensive standard for salmon feed is needed in order to manage salmon fisheries in a manner that effectively minimizes negative impacts on the environment while supplying food and social benefits [43]. A comprehensive standard will need data developed through thorough studies of the ecological and environmental impacts of common feed ingredients. LCAs will be needed for each ingredient, processing procedure, and farming or harvesting technique in order to identify ingredients and techniques with the lowest environmental impacts. In addition, ecological assessments on the impacts for each ingredient could determine impacts that cannot be readily quantified within an LCA, such as biodiversity loss.
With this information, a feed standard could be developed to regulate feed composition, ensuring that use of high-impact ingredients is minimized or excluded. This feed standard would ideally be supported by a chain-of-custody certification, allowing feed ingredients to be certified at each stage of production, transportation, etc.
In addition to the need for a more comprehensive examination of feed, there are also not adequate models to quantify the environmental impacts of some chemical and pharmaceutical treatments used in salmon aquaculture. Further studies are needed to establish standard models for medicated feeds, veterinary treatments, and supplements to broaden the scope of aquaculture LCA studies.
Furthermore, since the ASC standards are built to address ecological and social impacts that do not fit easily within a life cycle assessment, it is difficult to model benefits of policies such as reduced overfishing, greater community involvement, and lowered fish escapes. Methodologies used to analyze the sustainability of fisheries managed with Ecosystem-Based Fisheries Management principles alongside an LCA may be the best process to determine the full environmental effects of ASC certification.
Author Contributions
Both authors contributed to conceptualization, methodology, software, validation, and formal analysis, investigation, data curation, writing, visualization, and project administration. All authors have read and agreed to the published version of the manuscript.
Funding
This research received no external funding.
Conflicts of Interest
The authors declare no conflict of interest.
Appendix A. Additional LCA Results

Table A1.
Full impact of site operations on impact categories defined by TRACI analysis of 1 kg of ASC harvest-ready salmon during one grow-out season from November 2016 to May 2018 in British Columbia, Canada.
Table A1.
Full impact of site operations on impact categories defined by TRACI analysis of 1 kg of ASC harvest-ready salmon during one grow-out season from November 2016 to May 2018 in British Columbia, Canada.
| Impact category | Total | Feed Generator | House Operations | Light Generator | Net-Cleaning Compressor | Net-Pen Compressors | Petroleum Equipment | Salmon Feed | Organic Waste |
|---|---|---|---|---|---|---|---|---|---|
| Ozone depletion (kg CFC-11 eq) | 2.95 × 10⁻⁸ | 1.58 × 10⁻¹⁰ | 8.37 × 10⁻¹⁰ | 1.71 × 10⁻¹¹ | 8.92 × 10⁻¹¹ | 3.97 × 10⁻¹⁰ | 1.86 × 10⁻¹¹ | 2.79 × 10⁻⁸ | 0 |
| Global warming (kg CO2 Eq) | 2.28 | 0.0831 | 0.0127 | 0.00899 | 0.0469 | 0.209 | 0.00881 | 1.91 | 0 |
| Smog (kg O3 eq) | 0.293 | 0.0356 | 0.00329 | 0.00385 | 0.0201 | 0.0893 | 0.00305 | 0.137 | 0 |
| Acidification (kg SO2 eq) | 0.0240 | 0.00109 | 0.000108 | 0.000118 | 0.000617 | 0.00275 | 9.61 × 10⁻⁵ | 0.0192 | 0 |
| Eutrophication (kg N eq) | 0.110 | 8.50 × 10⁻⁵ | 1.05 × 10⁻⁵ | 9.19 × 10⁻⁶ | 4.79 × 10⁻⁵ | 0.000213 | 7.95 × 10⁻⁶ | 0.0192 | 0.0907 |
| Carcinogenics (CTUh) | 4.92 × 10⁻⁸ | 1.44 × 10⁻⁹ | 1.62 × 10⁻¹⁰ | 1.56 × 10⁻¹⁰ | 8.13 × 10⁻¹⁰ | 3.62 × 10⁻⁹ | 1.7 × 10⁻¹⁰ | 4.29 × 10⁻⁸ | 0 |
| Non carcinogenics (CTUh) | 1.96 × 10⁻⁶ | 1.37 × 10⁻⁸ | 1.34 × 10⁻⁹ | 1.48 × 10⁻⁹ | 7.72 × 10⁻⁹ | 3.44 × 10⁻⁸ | 1.61 × 10⁻⁹ | 1.90 × 10⁻⁶ | 0 |
| Respiratory effects (kg PM2.5) | 0.000932 | 2.17 × 10⁻⁵ | 2.64 × 10⁻⁶ | 2.35 × 10⁻⁶ | 1.23 × 10⁻⁵ | 5.45 × 10⁻⁵ | 1.44 × 10⁻⁶ | 0.000837 | 0 |
| Ecotoxicity (CTUe) | 10.4 | 0.350 | 0.0334 | 0.0378 | 0.197 | 0.878 | 0.0412 | 8.86 | 0 |
| Fossil fuel depletion (MJ surplus) | 2.66 | 0.168 | 0.0255 | 0.0182 | 0.0949 | 0.422 | 0.0198 | 1.91 | 0 |
Table A2.
Impact of 1 kg of salmon feed using TRACI.
| Impact Category | Total | Fish Meal (Peru) | By-Product Fish Meal and Oil (British Columbia) | Fish Oil (Peru) | Menhaden Oil (U.S.) | By-Product Poultry Meal (British Columbia) | Wheat (Alberta) | Corn Gluten Meal (Ontario) | Canola Seed and Meal (U.S.) | Canola Oil (Alberta) | Soy Meal (Ontario) |
|---|---|---|---|---|---|---|---|---|---|---|---|
| Ozone depletion (kg CFC-11 eq) | 2.79 × 10⁻⁸ | 7.60 × 10⁻⁹ | 2.65 × 10⁻¹⁰ | 4.14 × 10⁻⁹ | 1.64 × 10⁻⁹ | 6.59 × 10⁻⁹ | 1.92 × 10⁻⁹ | 1.18 × 10⁻⁹ | 2.23 × 10⁻⁹ | 2.26 × 10⁻⁹ | 1.11 × 10⁻¹⁰ |
| Global warming (kg CO2 eq) | 1.91 | 0.275 | 0.0223 | 0.150 | 0.0681 | 0.567 | 0.0540 | 0.158 | 0.298 | 0.303 | 0.0179 |
| Smog (kg O3 eq) | 0.137 | 0.0434 | 0.00364 | 0.0237 | 0.0105 | 0.0116 | 0.00194 | 0.0132 | 0.0137 | 0.0140 | 0.00173 |
| Acidification (kg SO2 eq) | 0.0192 | 0.00157 | 0.000124 | 0.000856 | 0.000379 | 0.00482 | 0.000737 | 0.00146 | 0.00454 | 0.00461 | 0.000114 |
| Eutrophication (kg N eq) | 0.0192 | 0.000133 | 1.18 × 10⁻⁵ | 7.27 × 10⁻⁵ | 3.38 × 10⁻⁵ | 0.00243 | 0.00115 | 0.00128 | 0.00699 | 0.00711 | 3.73 × 10⁻⁶ |
| Carcinogenics (CTUh) | 4.29 × 10⁻⁸ | 4.24 × 10⁻¹⁰ | 3.75 × 10⁻¹¹ | 2.31 × 10⁻¹⁰ | 1.08 × 10⁻¹⁰ | 5.51 × 10⁻⁹ | 1.12 × 10⁻⁹ | 2.86 × 10⁻⁹ | 1.61 × 10⁻⁸ | 1.64 × 10⁻⁸ | 7.09 × 10⁻¹¹ |
| Non carcinogenics (CTUh) | 1.9 × 10⁻⁶ | 2.74 × 10⁻⁹ | 1.92 × 10⁻¹⁰ | 1.50 × 10⁻⁹ | 6.27 × 10⁻¹⁰ | 3.29 × 10⁻⁷ | 9.17 × 10⁻⁸ | 2.70 × 10⁻⁷ | 5.98 × 10⁻⁷ | 6.08 × 10⁻⁷ | 1.37 × 10⁻⁹ |
| Respiratory effects (kg PM2.5 eq) | 8.37 × 10⁻⁴ | 0.000115 | 8.99 × 10⁻⁶ | 6.27 × 10⁻⁵ | 2.74 × 10⁻⁵ | 0.000181 | 2.98 × 10⁻⁵ | 6.38 × 10⁻⁵ | 0.000170 | 0.000173 | 4.95 × 10⁻⁶ |
| Ecotoxicity (CTUe) | 8.86 | 0.0150 | 0.00124 | 0.00816 | 0.00366 | 2.52 | 0.968 | 0.681 | 2.28 | 2.32 | 0.0653 |
| Fossil fuel depletion (MJ surplus) | 1.91 | 0.466 | 0.0385 | 0.254 | 0.114 | 0.230 | 0.0451 | 0.232 | 0.257 | 0.261 | 0.0148 |
References
- Harvey, B. Regional Review on Status and Trends in Aquaculture Development in North America, 2015; Food and Agriculture Organization of the United Nations: Rome, Italy, 2017. [Google Scholar]
- Food and Agriculture Organization (FAO). The State of World Fisheries and Aquaculture 2016. Contributing to Food Security and Nutrition for All; FAO of the United Nations: Rome, Italy, 2016. [Google Scholar]
- Food and Agriculture Organization (FAO). FAO Yearbook. Fishery and Aquaculture Statistics 2016; FAO of the United Nations: Rome, Italy, 2016. [Google Scholar]
- World Wide Fund for Nature (WWF). The 2050 Criteria: Guide to Responsible Investment in Agricultural, Forest, and Seafood Commodities; WWF: Washington, DC, USA, 2012. [Google Scholar]
- Mente, E.; Pierce, G.J.; Santos, M.B.; Neofitou, C. Effect of feed and feeding in the culture of salmonids on the marine aquatic environment: A synthesis for European aquaculture. Aquac. Int. 2006, 14, 499–522. [Google Scholar] [CrossRef]
- Taranger, G.L.; Karlsen, Ø.; Bannister, R.J.; Glover, K.A.; Husa, V.; Karlsbakk, E.; Kvamme, B.O.; Boxaspen, K.K.; Bjørn, P.A.; Finstad, B. Risk assessment of the environmental impact of Norwegian Atlantic salmon farming. ICES J. Mar. Sci. 2014, 72, 997–1021. [Google Scholar] [CrossRef] [Green Version]
- Ayer, N.W.; Tyedmers, P.H. Assessing alternative aquaculture technologies: Life cycle assessment of salmonid culture systems in Canada. J. Clean. Prod. 2009, 17, 362–373. [Google Scholar] [CrossRef]
- FishWatch: U.S. Seafood Facts. Available online: https://www.fisheries.noaa.gov/species/atlantic-salmon-farmed (accessed on 28 June 2019).
- Nguyen, T.; Williams, T. Aquaculture in Canada; Library of Parliament: Ottowa, ON, Canada, 2013. [Google Scholar]
- FAO. Fisheries & Aquaculture-National Aquaculture Sector Overview-Chile. Available online: http://www.fao.org/fishery/countrysector/naso_chile/en#tcN7010A (accessed on 28 June 2019).
- ASC. History. Available online: https://www.asc-aqua.org/about-us/history/ (accessed on 20 April 2019).
- Bush, S.R.; Belton, B.; Hall, D.; Vandergeest, P.; Murray, F.J.; Ponte, S.; Oosterveer, P.; Islam, M.S.; Mol, A.P.; Hatanaka, M. Certify sustainable aquaculture? Science 2013, 341, 1067–1068. [Google Scholar] [CrossRef] [PubMed]
- ASC. Partners and Supporters. Available online: https://www.asc-aqua.org/about-us/partners-and-supporters/ (accessed on 20 April 2019).
- Audit Manual-ASC Salmon Standard V1.1-April 2017. Available online: https://www.asc-aqua.org/wp-content/uploads/2017/07/ASC-Salmon-Audit-Manual_v1.1-1.pdf (accessed on 20 April 2019).
- ASC Responsible Feed Standard, Second Draft. Available online: https://www.asc-aqua.org/wp-content/uploads/2017/06/ASC-Responsible-Feed-Standard_v0.2.pdf (accessed on 20 April 2019).
- Diana, J.S. Aquaculture production and biodiversity conservation. BioScience 2009, 59, 27–38. [Google Scholar] [CrossRef]
- Bohnes, F.A.; Laurent, A. LCA of aquaculture systems: Methodological issues and potential improvements. Int. J. Life Cycle Assess. 2019, 24, 324–337. [Google Scholar] [CrossRef] [Green Version]
- International Organization for Standardization (ISO). ISO 14040: Environmental Management-Life Cycle Assessment-Principles and Framework; The International Organization for Standardization: Geneva, Switzerland, 1997. [Google Scholar]
- Mungkung, R.; De Haes, H.U.; Clift, R. Potentials and limitations of life cycle assessment in setting ecolabelling criteria: A case study of thai shrimp aquaculture product (5 pp). Int. J. Life Cycle Assess. 2006, 11, 55–59. [Google Scholar] [CrossRef]
- Cao, L.; Diana, J.S.; Keoleian, G.A. Role of life cycle assessment in sustainable aquaculture. Rev. Aquac. 2013, 5, 61–71. [Google Scholar] [CrossRef] [Green Version]
- Ellingsen, H.; Aanondsen, S.A. Environmental impacts of wild caught cod and farmed Salmon-a comparison with chicken (7 pp). Int. J. Life Cycle Assess. 2006, 11, 60–65. [Google Scholar] [CrossRef]
- Ziegler, F.; Winther, U.; Hognes, E.S.; Emanuelsson, A.; Sund, V.; Ellingsen, H. The Carbon Footprint of Norwegian Seafood Products on the Global Seafood Market: Carbon Footprint of Norwegian Seafood on Global Market. J. Ind. Ecol. 2013, 17, 103–116. [Google Scholar] [CrossRef]
- Buchspies, B.; Tölle, S.J.; Jungbluth, N. Life Cycle Assessment of High-Sea Fish and Salmon Aquaculture; ESU-Services Ltd.: Schaffhausen, Switzerland, 2011. [Google Scholar]
- Turolla, E.; Castaldelli, G.; Fano, E.A.; Tamburini, E. Life Cycle Assessment (LCA) Proves that Manila Clam Farming (Ruditapes philippinarum) is a Fully Sustainable Aquaculture Practice and a Carbon Sink. Sustainability 2020, 12, 5252. [Google Scholar] [CrossRef]
- Tamburini, E.; Turolla, E.; Fano, E.A.; Castaldelli, G. Sustainability of Mussel (Mytilus galloprovincialis) Farming in the Po River Delta, Northern Italy, Based on a Life Cycle Assessment Approach. Sustainability 2020, 12, 3814. [Google Scholar] [CrossRef]
- Dullah, H.; Malek, M.A.; Hanafiah, M.M. Life Cycle Assessment of Nile Tilapia (Oreochromis niloticus) Farming in Kenyir Lake, Terengganu. Sustainability 2020, 12, 2268. [Google Scholar] [CrossRef] [Green Version]
- Pelletier, N.; Tyedmers, P.; Sonesson, U.; Scholz, A.; Ziegler, F.; Flysjo, A.; Kruse, S.; Cancino, B.; Silverman, H. Not All Salmon Are Created Equal: Life Cycle Assessment (LCA) of Global Salmon Farming Systems; ACS Publications: Washington, DC, USA, 2009. [Google Scholar]
- Nhu, T.T.; Schaubroeck, T.; Henriksson, P.J.; Bosma, R.; Sorgeloos, P.; Dewulf, J. Environmental impact of non-certified versus certified (ASC) intensive Pangasius aquaculture in Vietnam, a comparison based on a statistically supported LCA. Environ. Pollut. 2016, 219, 156–165. [Google Scholar] [CrossRef] [PubMed]
- International Organization for Standardization (ISO). ISO 14044: Environmental Management: Life Cycle Assessments: Requirements and Guidelines; The International Organization for Standardization: Geneva, Switzerland, 2006. [Google Scholar]
- Durlinger, B.; Koukouna, E.; Broekema, R.; Paassen, V.M.; Scholten, J. Agri-Footprint 4.0-Part 1: Methodology and Basic Principles; Agri-Footprint: Gouda, The Netherlands, 2017. [Google Scholar]
- U.S. Life Cycle Inventory Database. Available online: https://www.lcacommons.gov/nrel/search (accessed on 25 March 2019).
- Pelletier, N.; Tyedmers, P. Feeding farmed salmon: Is organic better? Aquaculture 2007, 272, 399–416. [Google Scholar] [CrossRef]
- Hudson, N.; Baker, A.; Ward, D.; Reynolds, D.M.; Brunsdon, C.; Carliell-Marquet, C.; Browning, S. Can fluorescence spectrometry be used as a surrogate for the Biochemical Oxygen Demand (BOD) test in water quality assessment? An example from South West England. Sci. Total Environ. 2008, 391, 149–158. [Google Scholar] [CrossRef] [PubMed]
- Pelletier, N.; Tyedmers, P. Life Cycle Considerations for Improving Sustainability Assessments in Seafood Awareness Campaigns. Environ. Manag. 2008, 42, 918–931. [Google Scholar] [CrossRef] [PubMed]
- Volpe, J.P.; Gee, J.; Ethier, V.; Beck, M.; Wilson, A.; Stoner, J.A. Global Aquaculture Performance Index (GAPI): The First Global Environmental Assessment of Marine Fish Farming. Sustainability 2013, 5, 3976–3991. [Google Scholar] [CrossRef] [Green Version]
- Volpe, J.; Beck, M.; Ethier, V.; Gee, J.; Wilson, A. Global Aquaculture Performance Index; University of Victoria: Victoria, BC, Canada, 2010. [Google Scholar]
- Bare, J.; Young, D.; Qam, S.; Hopton, M.; Chief, S. Tool for the Reduction and Assessment of Chemical and Other Environmental Impacts (TRACI); US Environmental Protection Agency: Washington, DC, USA, 2012.
- Hognes, E.S.; Ziegler, F.; Sund, V. Carbon Footprint and Area Use of Farmed Norwegian Salmon; SINTEF Fisheries and Aquaculture: Trondheim, Norway, 2011. [Google Scholar]
- Maiolo, S.; Parisi, G.; Biondi, N.; Lunelli, F.; Tibaldi, E.; Pastres, R. Fishmeal partial substitution within aquafeed formulations: Life cycle assessment of four alternative protein sources. Int. J. Life Cycle Assess. 2020. [Google Scholar] [CrossRef]
- Couture, J.; Geyer, R.; Øvrum Hansen, J.; Kuczenski, B.; Øverland, M.; Palazzo, J.; Sahlmann, C.; Lenihan, H. Environmental Benefits of Novel Nonhuman Food Inputs to Salmon Feeds. Environ. Sci. Technol. 2019, 53. [Google Scholar] [CrossRef] [PubMed]
- Fulton, S. Fish and Fuel: Life Cycle Greenhouse Gas Emissions Associated with Icelandic Cod, Alaskan Pollock, and Alaskan Pink Salmon Fillets Delivered to the United Kingdom. Master’s Thesis, Dalhousie University, Halifax, NS, Canada, August 2010. [Google Scholar]
- WWF. Farmed Salmon Industries. Available online: https://www.worldwildlife.org/industries/farmed-salmon (accessed on 22 April 2019).
- ASC. About the ASC. Available online: https://www.asc-aqua.org/about-us/about-the-asc/ (accessed on 1 May 2019).
Figure 1.
System boundary diagram.

Figure 2.
Percent contribution of all site operations (TRACI).

Figure 3.
Percent contribution of equipment energy use (TRACI).

Figure 4.
Percent contribution of salmon feed by source, agricultural or marine-based (TRACI).

Figure 5.
Percent contribution of salmon feed by ingredient (TRACI).

Table 1.
Results for 1 kg of Aquaculture Stewardship Council (ASC) harvest-ready salmon (TRACI).
| Total | Feed Generator | House Operations | Light Generator | Net-Cleaning Compressor | Net-Pen Compressors | Petroleum Equipment | Salmon Feed | Organic Waste | |
|---|---|---|---|---|---|---|---|---|---|
| Ozone depletion (kg CFC-11 eq) | 2.95 × 10⁻⁸ | 1.58 × 10⁻¹⁰ | 8.37 × 10⁻¹⁰ | 1.71 × 10⁻¹¹ | 8.92 × 10⁻¹¹ | 3.97 × 10⁻¹⁰ | 1.86 × 10⁻¹¹ | 2.79 × 10⁻⁸ | 0 |
| GWP (kg CO2 eq) | 2.28 | 0.0831 | 0.0127 | 0.00899 | 0.0469 | 0.209 | 0.00881 | 1.91 | 0 |
| Smog (kg O3 eq) | 0.293 | 0.0356 | 0.00329 | 0.00385 | 0.0201 | 0.0893 | 0.00305 | 0.137 | 0 |
| Acidification (kg SO2 eq) | 0.024 | 0.00109 | 0.000108 | 0.000118 | 0.000617 | 0.00275 | 9.61 × 10⁻⁵ | 0.0192 | 0 |
| Eutrophication (kg N eq) | 0.11 | 0.000085 | 1.05 × 10⁻⁵ | 9.19 × 10⁻⁶ | 4.79 × 10⁻⁵ | 0.000213 | 7.95 × 10⁻⁶ | 0.0192 | 0.0907 |
| Ecotoxicity (CTUe) | 10.4 | 0.35 | 0.0334 | 0.0378 | 0.197 | 0.878 | 0.0412 | 8.86 | 0 |
Table 2.
Global warming potential (GWP) results for 1 kg of ASC harvest-ready salmon (Intergovernmental Panel on Climate Change (IPCC) 100a).
Table 2.
Global warming potential (GWP) results for 1 kg of ASC harvest-ready salmon (Intergovernmental Panel on Climate Change (IPCC) 100a).
| Total | Feed Generator | House Operations | Light Generator | Net-Cleaning Compressor | Net-Pen Compressors | Petroleum Equipment | Salmon Feed | Organic Waste | |
|---|---|---|---|---|---|---|---|---|---|
| GWP (kg CO2 eq) | 2.26 | 0.00909 | 0.0127 | 0.211 | 0.0474 | 0.00909 | 0.00893 | 1.89 | 0 |
© 2020 by the authors. Licensee MDPI, Basel, Switzerland. This article is an open access article distributed under the terms and conditions of the Creative Commons Attribution (CC BY) license (http://creativecommons.org/licenses/by/4.0/).
Share and Cite
MDPI and ACS Style
Sherry, J.; Koester, J. Life Cycle Assessment of Aquaculture Stewardship Council Certified Atlantic Salmon (Salmo salar). Sustainability 2020, 12, 6079. https://0-doi-org.brum.beds.ac.uk/10.3390/su12156079
AMA Style
Sherry J, Koester J. Life Cycle Assessment of Aquaculture Stewardship Council Certified Atlantic Salmon (Salmo salar). Sustainability. 2020; 12(15):6079. https://0-doi-org.brum.beds.ac.uk/10.3390/su12156079
Chicago/Turabian StyleSherry, Jesse, and Jennifer Koester. 2020. "Life Cycle Assessment of Aquaculture Stewardship Council Certified Atlantic Salmon (Salmo salar)" Sustainability 12, no. 15: 6079. https://0-doi-org.brum.beds.ac.uk/10.3390/su12156079
Note that from the first issue of 2016, this journal uses article numbers instead of page numbers. See further details here.