The Use of Drones in Disaster Aerial Needs Reconnaissance and Damage Assessment – Three-Dimensional Modeling and Orthophoto Map Study


Internal Security Institute, The Main School of Fire Service, 01-629 Warsaw, Poland
Sustainability 2020, 12(15), 6080; https://0-doi-org.brum.beds.ac.uk/10.3390/su12156080
Submission received: 22 June 2020
/
Revised: 11 July 2020
/
Accepted: 28 July 2020
/
Published: 29 July 2020
(This article belongs to the Special Issue Recent Developments in the Field of Risk and Crisis Management towards Realization of the Sustainable Development Goals)
Abstract
:The aim of this research is to provide disaster managers with the results of testing three-dimensional modeling and orthophoto mapping, so as to add value to aerial assessments of flood-related needs and damages. The relevant testing of solutions concerning the real needs of disaster managers is an essential part of the pre-disaster phase. As such, providing evidence-based results of the solutions’ performance is critical with regard to purchasing them and their successful implementation for disaster management purposes. Since disaster response is mostly realized in complex and dynamic, rather than repetitive, environments, it requires pertinent testing methods. A quasi-experimental approach, applied in a form of a full-scale trial meets disaster manager’s requirements as well as addressing limitations resulting from the disaster environment’s characteristics. Three-dimensional modeling and orthophoto mapping have already proven their potential in many professional fields; however, they have not yet been broadly tested for disaster response purposes. Therefore, the objective here is to verify the technologies regarding their applicability in aerial reconnaissance in sudden-onset disasters. The hypothesis assumes that they will improve the efficiency (e.g., time) and effectiveness (e.g., accuracy of revealed data) of this process. The research verifies that the technologies have a potential to facilitate disaster managers with more precise damage assessment; however, their effectivity was less than expected in terms of needs reconnaissance. Secondly, the overall assessment process is heavily burdened by data processing time, however, the technologies allow a reduction of analytical work.
1. Introduction
The Sustainable Development Goal 11, formulated as “making cities and human settlements safe, resilient and sustainable”, is highly focused on disaster management processes, including disaster response. The United Nations assumes that by 2030, there will be a global reduction in the number of deaths from, and people affected by, disasters. Furthermore, it may be possible to substantially reduce the direct economic losses, measured in global gross domestic product, caused by disasters, including water-related disasters such as floods, with a focus on protecting people in vulnerable situations. With this goal, the United Nations has specified two targets aimed at; firstly, decreasing the number of deaths, and missing and affected persons, related to disasters per 100,000 people globally, and secondly limiting the direct economic losses resulting from disasters, including damages to critical infrastructure and disruption of basic services [1]. New technologies can greatly contribute to these goals and targets by being widely introduced and implemented in the field of disaster management, e.g., drones, satellites, robots and software [2]. The importance of this process can be seen in the high investment realized by individual countries, as well as international organizations. For example, the EU has allocated significant budgets for research and development projects on innovative solutions (e.g., the EU DRIVER + [3], ENCIRCLE [4], RESPONDRONE [5] projects).
The highly destructive impact of disasters results in numerous directly and indirectly affected human beings, with outcomes including loss of lives as well as damage to property and the natural environment [6]. Therefore, disaster managers’ decisions play a crucial role in mitigating their impact [7]. The efficiency and effectiveness of these decisions are dependent on the quality of the decision support systems (solutions) being used as a part of standard operating procedures [8]. The research and testing of solutions in a realistic set up prior to their implementation in disaster response is therefore a must in order to ensure that disaster managers are sufficiently supported by new technologies in their crucial decisions. One of the requirements of pertinent decisions is access to data that offers a reliable and timely contribution to the process as the input data is collected and checked [9]. Furthermore, data needs to be processed into a form that is usable and appropriate for the decision maker’s analytical work. This is the final effort, which should lead to a decision.
Decision making during disaster response is a highly complicated and exhausting process, due to working in highly uncertain, complex, dynamic environments. Furthermore, disaster managers are mentally burdened by the potential consequences of their decisions resulting in human life loss [10]. Things become even more complicated as disaster response is an interdisciplinary process, involving many stakeholders, the affected population and responders. Furthermore, major disasters, as high-impact, low-probability events, are not very common. As a consequence, they are, to a certain extent, unpredictable and not repetitive; thus they are barely comparable one to another. Disasters always have different contexts, as they happen in different societies, geographical locations, etc. They challenge different types of systems with different disaster readiness and society resilience levels. All these factors prove that disaster managers require new solutions to facilitate their efforts [9,11,12,13,14].
Nowadays, the spectrum of solutions claiming to facilitate disaster response is very broad, and is constantly increasing. Disaster managers benefit from this by getting a broad pool of alternatives to choose from; however, they are often doomed to base their decisions on commercial information alone. Therefore, the relevant testing of solutions in relation to real needs is an essential part of a pre-disaster phase, which will provide evidence-based results concerning the solution’s performance under testing conditions, critical for effective purchasing decisions and successful implementations that meet the needs of disaster managers [12,15]. Therefore, creating a test environment that mirrors real conditions is a challenging task, possible only to the extent to which one is able to test comparable solutions [16,17].
One of the rapidly developing sectors that already significantly influences disaster management is the use of Unmanned Aerial Vehicles (UAVs) [18,19]. Drones and other UAVs are claimed to soon become a commonly used standard in disaster response. They are deployed to support situational awareness, for example by providing information from aerial observation, sampling and/or measuring aerial contamination, transporting necessary items, etc. [20]. This technology opens up a broad spectrum of new possibilities that contribute positively to disaster management [19,21,22], and it is perceived as a very promising one for a national and international disaster response, e.g., in the context of the Union Civil Protection Mechanism [23]. To be able to fulfil their specific functionality, UAVs are always equipped with appropriate additional tools, such as cameras for observation, detectors for measuring contamination, etc. Therefore, a UAV is a universal platform which is able to be adapted and combined with other tools in order to fulfil specific tasks, depending on the operational need [12]. One of the basic functionalities of UAVs is aerial observation, which is used for needs reconnaissance or damage assessments in sudden-onset, but also slow-onset, disasters [24,25,26,27,28,29].
Drone flights are already being used for these purposes, providing disaster managers with two-dimensional footage or aerial images using the latest data, increasing their situational awareness [28,30,31,32]. The purposes of UAV usage in disaster management are broadly discussed in many publications; however, a vast majority of these papers are devoted to analyses of making use of two-dimensional aerial observations. Restas states that drones are usable tools for flood response on the operational and tactical levels, where they facilitate the monitoring of dykes, flooded and threatened areas, with special focus on rapid damage aerial assessment. Drones’ mission parameters should include in any scenarios that may develop, such that they can provide real time information for better decision making [25,26]. Sharma et al. confirm the efficiency of UAV’s aerial assessment, asserting that they provide better situational awareness in Indian-based disasters, including recognizing damage to infrastructure, but not providing calculable results [33]. Erderlj et al. found drones to be highly facilitative tools in relation to major floods, with respect to damage assessment and their rapid reconstruction support [27]. Adams and Friedland analyzed a number of case studies on past disasters wherein drones were used for reconnaissance purposes, e.g., for roads and bridge damage. In some cases, there were orthophoto maps, quality digital elevation models, dense surface models (DSM) and other disaster area characteristics produced. These products were used for measuring distances so as to assist disaster managers. They claim that researching UAV-based disaster data collection protocols for assessing disaster areas would be worthwhile [34]. Grogan et al. explore the latest literature on the use of unmanned aerial vehicles in search and rescue operations, concluding that research and literature exist on broad-scoped optimization procedures, accounting for uncertainty in aspects of the search procedures, and they claim also that, with online and real time optimization techniques, search and rescue (SAR) drones will begin to have the ability to relay information back to disaster managers, allowing the drones and rescuers to begin to react to victims’ needs faster [35]. Felice et al. tested a three-dimensional modeling environment with buildings, but mainly focused on coverage and wireless link reliability aspects, not on the efficiency and effectiveness of the product for disaster needs and damage reconnaissance [36].
Amongst the available publications presenting results on the efficiency of aerial two-dimensional footage and images for SAR, there is also a publication by the European Emergency Number Association (EENA) in cooperation with the company DJI, who develop and manufacture civilian drones, and Black Channel, an Irish research firm. The organizations carried out a series of tests in the UK, Ireland, Italy, Denmark and Iceland. The results are published in a report entitled the Drone Efficacy Study in 2018 [31]. The researchers compared the efficiency of standard SAR methods realized with (research teams plus) drone support (aerial assessment), and without it (control teams searching only from the ground). The search targets wore swift water rescue suits that were fully body length, with boots but no head cover, black below the waste and yellow above. This clothing simulated lost persons. The SAR teams searched for one person, who was each time located in a different place, over numerous runs. The results showed that the teams working with drone support were more efficient, on average 3 min faster in locating the victim than those working without a drone. However, the research teams were less effective since they succeeded in finding the victim on only 77% of the occasions, while the SAR teams working without drone support succeeded in 85% of cases. So, it looks as if drone two-dimensional footage and aerial images facilitate SAR reconnaissance by increasing its efficiency, however, they do not have a positive influence on the effectiveness of the operation compared to standard SAR operations from the land.
WeRobotics, a non-profit organization, also carried out many tests of drones, mainly for humanitarian reasons [37]. For a few years now, the company has promoted a network called “flying labs”. Within this concept, they run different trials with drones in order to find the best possible solutions, mainly for humanitarian response. The methodology used since 2015 for these trials involves searching for different-colored markers distributed in different locations, on the ground and in different locations. The markers, which are placed prior to the trial participants’ arrival, are typically 1 m by 1 m in size, and each color represents an indicator of interest to humanitarians, e.g., yellow—survivor, blue—landslide, and red—disaster damage. Both the colors and the number of different markers are customized based on the local priorities [38]. The trials’ findings concentrated on the process of the aerial reconnaissance, rather than the results of it. One of the findings is that there is clearly a need to establish standard protocols for drone reconnaissance so as to make the cooperation between the pilot and analytical team more effective.
A literature review shows that there is a significant need to test drones in order to find new flight protocols, with special attention being paid to the measuring parameters of such operations, e.g., time-consumption versus reconnaissance accuracy. Most of the available research involves qualitative studies confirming the need for, and claiming the efficiency and effectiveness of, UAV disaster aerial assessments, while not, however, providing solid real or experimental measurements of these parameters. Furthermore, there is a deficiency of meaningful research analyzing the use of such products for three-dimensional modeling and orthophoto mapping for disaster reconnaissance purposes.
The above examples of the published results on the usage of drones for disaster response prove that there is obvious potential for using them for these purposes. They do, however, require further research effort in order to cover the lack of solid measurable data on the efficiency and effectiveness of drone operations in disaster reconnaissance. Furthermore, the literature review shows that up till now, research work has mainly concentrated on testing the potential of two-dimensional footage and aerial images in disaster assessment. However, there is no study concerning to what extent other products generated from aerial images, like three-dimensional models and orthophoto maps, could facilitate disaster managers in their efforts, e.g., in needs reconnaissance and damage assessments during a major disaster.
The aim of the research is to provide disaster managers with the findings revealed by testing three-dimensional modeling and orthophoto mapping for the potential added value they can bring to aerial assessments of flood-related needs and damage. Three-dimensional modeling and orthophoto mapping have already proven their potential in many professional fields, e.g., in building design, however they have not yet been broadly tested for disaster response. The need to test three-dimensional models and orthophoto maps for disaster aerial reconnaissance is clearly expressed by disaster research societies [5].
Via comparison to the achievements of similar technologies in other domains, the hypothesis formulated for this research assumes that three-dimensional and orthophoto mapping will improve aerial assessments of flood-related needs and damages [37,39,40]. The hypothesis is substantiated by the fact that a three-dimensional model enables the user to see a building’s elevations from different angles, which is not possible from a two-dimensional perspective. With this functionality being used in building design, it is expected that the reconnaissance of disaster-related needs will be more effective, due to the more accurate investigation of all aspects of flooded buildings.
The objective of the research is to verify the technologies in full-scale field conditions, investigating the impact on efficiency (e.g., time) and effectiveness (e.g., accuracy of revealed data) of aerial reconnaissance in sudden-onset disasters. This research builds upon the previous results already published, especially relating to the testing methods, however also exploring other products of drone aerial assessments, such as three-dimensional modeling and orthophoto mapping, concerning their usability for disaster response purposes.
2. Materials and Methods
Due to the multispectral and non-repeatable character of disasters, optimal research methods for these phenomena require a quasi-experimental approach [41]. This approach provides the means to address the challenge in an appropriate manner. Quasi-experiments are most likely to be conducted in field settings, as in this research case. Quasi-experimental approaches enable the running of tests without a random distribution of participant. Random assignment in the case of testing disaster response processes is difficult or impossible to achieve, since the tested solution is aimed at disaster response gaps and the operational needs of a tailored disaster managers group, in this case specialized in disaster aerial reconnaissance [42].
Quasi-experiments are conducted to evaluate the effectiveness of an intervention introduced into a process. In this research, a new solution is embedded into a disaster response procedure related to needs and damage aerial assessments. One modernization that the solution brings to the process is the manipulation of independent variables relevant to the quasi-experiment [43]. Since quasi-experiment participants are not randomly assigned, and disaster environments by their character are not repeatable, quasi-experiments naturally do not eliminate the problem of confounding variables. However, as a result it provides new knowledge concerning highly probable responses to a given problem. Therefore, in terms of internal validity, quasi-experiments are located somewhere between correlational studies and true experiments. Notably, disaster response is a highly complex sociotechnical process, closely binding human behaviors corresponding to social sciences with technical interaction corresponding to technical sciences. Thus, both correlational studies and true experiments are difficult to implement in testing highly complex disaster response processes.
Correlation studies are hard to achieve due to the non-repeatable conditions of every trial organized for testing the decision making process. The results would be heavily biased by every case of different human behaviours, interactions and mental disposition on the day. Secondly, the collection of a representative number of observations would require the organization of numerous test runs, involving a highly complex field set-up which would be enormously time- and work-consuming, highly expensive, and finally would provide biased data.
Disaster response is mostly realized in complex, dynamic and non-repetitive environments. Therefore, it requires pertinent testing methods. Such environments constitute the research domain for testing the decision making processes of disaster managers. Therefore, the setting of stable and certain conditions (vital for true experiments) and the maintaining of the core characteristics of a disaster environment are mutually exclusive.
Neither correlation study nor true experiment is therefore valid for this phenomenon. The most appropriate is something in between, named a quasi-experiment. Realized in the form of a trial, it meets the requirements of disaster response processes research. Such requirements are met by disaster practitioners’ driven approach, manifested in the direct and close involvement of disaster managers in the entire testing process of the solution they are interested in, starting from operational gaps identification, right up to consulting on the evaluation method. Simply put, the research is triggered by their needs and done mainly for them. Secondly, as previously mentioned, the quasi-experimental approach includes the limitation of the unrepetitive character of disaster environments, by targeting a non-randomized population, but one which is specifically selected, e.g., on the criterion of the declared operational needs.
Three-dimensional modeling and orthophoto mapping have already proven their potential in many professional fields, although they have not yet been broadly tested for disaster response purposes. Therefore, the objective was to verify the technologies in field conditions as regards their impact on aerial reconnaissance in sudden-onset disasters. The hypothesis assumed is that they will improve the efficiency (e.g., time) and effectiveness (e.g., accuracy of revealed data) of this process.
There was a quasi-experimental design implemented in the research in the form of a full-scale trial [16,17,44]. The method was designed to examine highly complex phenomena which are difficult to replicate for test purposes. Real-life disaster environments are the best testing ground. Quasi-experimental is an approach that resembles experimental research, but does not fulfil all of the requirements of an experiment. Although the independent variable is manipulated, the participants are not randomly assigned to conditions or orders of conditions [43]. Because the independent variable is manipulated before the dependent variable is measured, quasi-experimental research eliminates the directionality problem. However, because participants are not randomly assigned—making it likely that there are other differences between conditions—quasi-experimental research does not eliminate the problem of confounding variables. In terms of internal validity, therefore, quasi-experiments are generally somewhere between correlational studies and true experiments. The method is therefore perceived as the optimal one to verify formulated hypotheses concerning performance in such an unpredictable and unrepeatable environment. In a quasi-experimental setup, observations are made about an intervention. In the surveyed case, three-dimensional models and orthophoto map usage is considered as an intervention in the baseline process.
The quasi-experiment (trial) conducted for the research purposes of this paper was organized within the framework of a European project [3]. The trial had an outdoor character and was carried out within an area of 27 hectares normally used for firefighter training close to Warsaw (Poland). The relatively large area, located in the river catchment of the Vistula and Narew rivers, was optimal to simulate flooding conditions, and thus reflect the flooding environment. Two consecutive tests were organized, dedicated to 1) needs reconnaissance by recognizing the needs of the affected population trapped in flooded buildings, and 2) assessment of damage (levee collapse) caused by the flood.
Both of these were conducted as quasi-experiments with a non-equivalent groups design [42,45]. Independent groups (control and research groups) of disaster managers were tasked to analyze data gained from a drone flight and presented in different forms (1—as two-dimensional footage and flight images (control teams); and 2—a three-dimensional model and orthophoto map (research teams)). Their analytical work was finalized with a decision on flood-related needs and damage assessments.
In total there were 16 disaster managers taking part in the trial from 13 European countries including Bulgaria, Estonia, Latvia, Lithuania, Croatia, Hungary, Israel, Italy, Poland, Slovakia, the Netherlands, Sweden and the United Kingdom. There were eight fire officers, four emergency medical technicians (EMTs), two police officers, and two regional crisis centres operators. All those involved were practitioners with more than 10 years’ experience in disaster management on a regional or national level, having been responsible for operational and strategic decisions. The group included two females.
The participants were split into 8 pairs (teams) in non-equivalent group designs [42,45]. The control teams of disaster managers (3 pairs out of 8) got two-dimensional footage and pictures, while the research teams (5 pairs out of 8) received three-dimensional models and orthophoto maps (manipulated intervention as a researched factor) generated from the same drone flight. The drone flights lasted 13 min for the needs reconnaissance sessions and 15 min for the damage assessment sessions. According to a comparison study done as part of the quasi-experimental approach, both the control teams and research teams were not randomly assigned, but were reasonably selected to minimize differences between them, e.g., on profession, etc. Therefore, in each of the 8 teams, there was a fire officer. The other participants were split between control and research groups in a balanced manner in terms of represented profession and gender. This means that there were two EMTs, one police officer and one crisis centre operator in the control and research groups. Furthermore, there was one female in each of the groups.
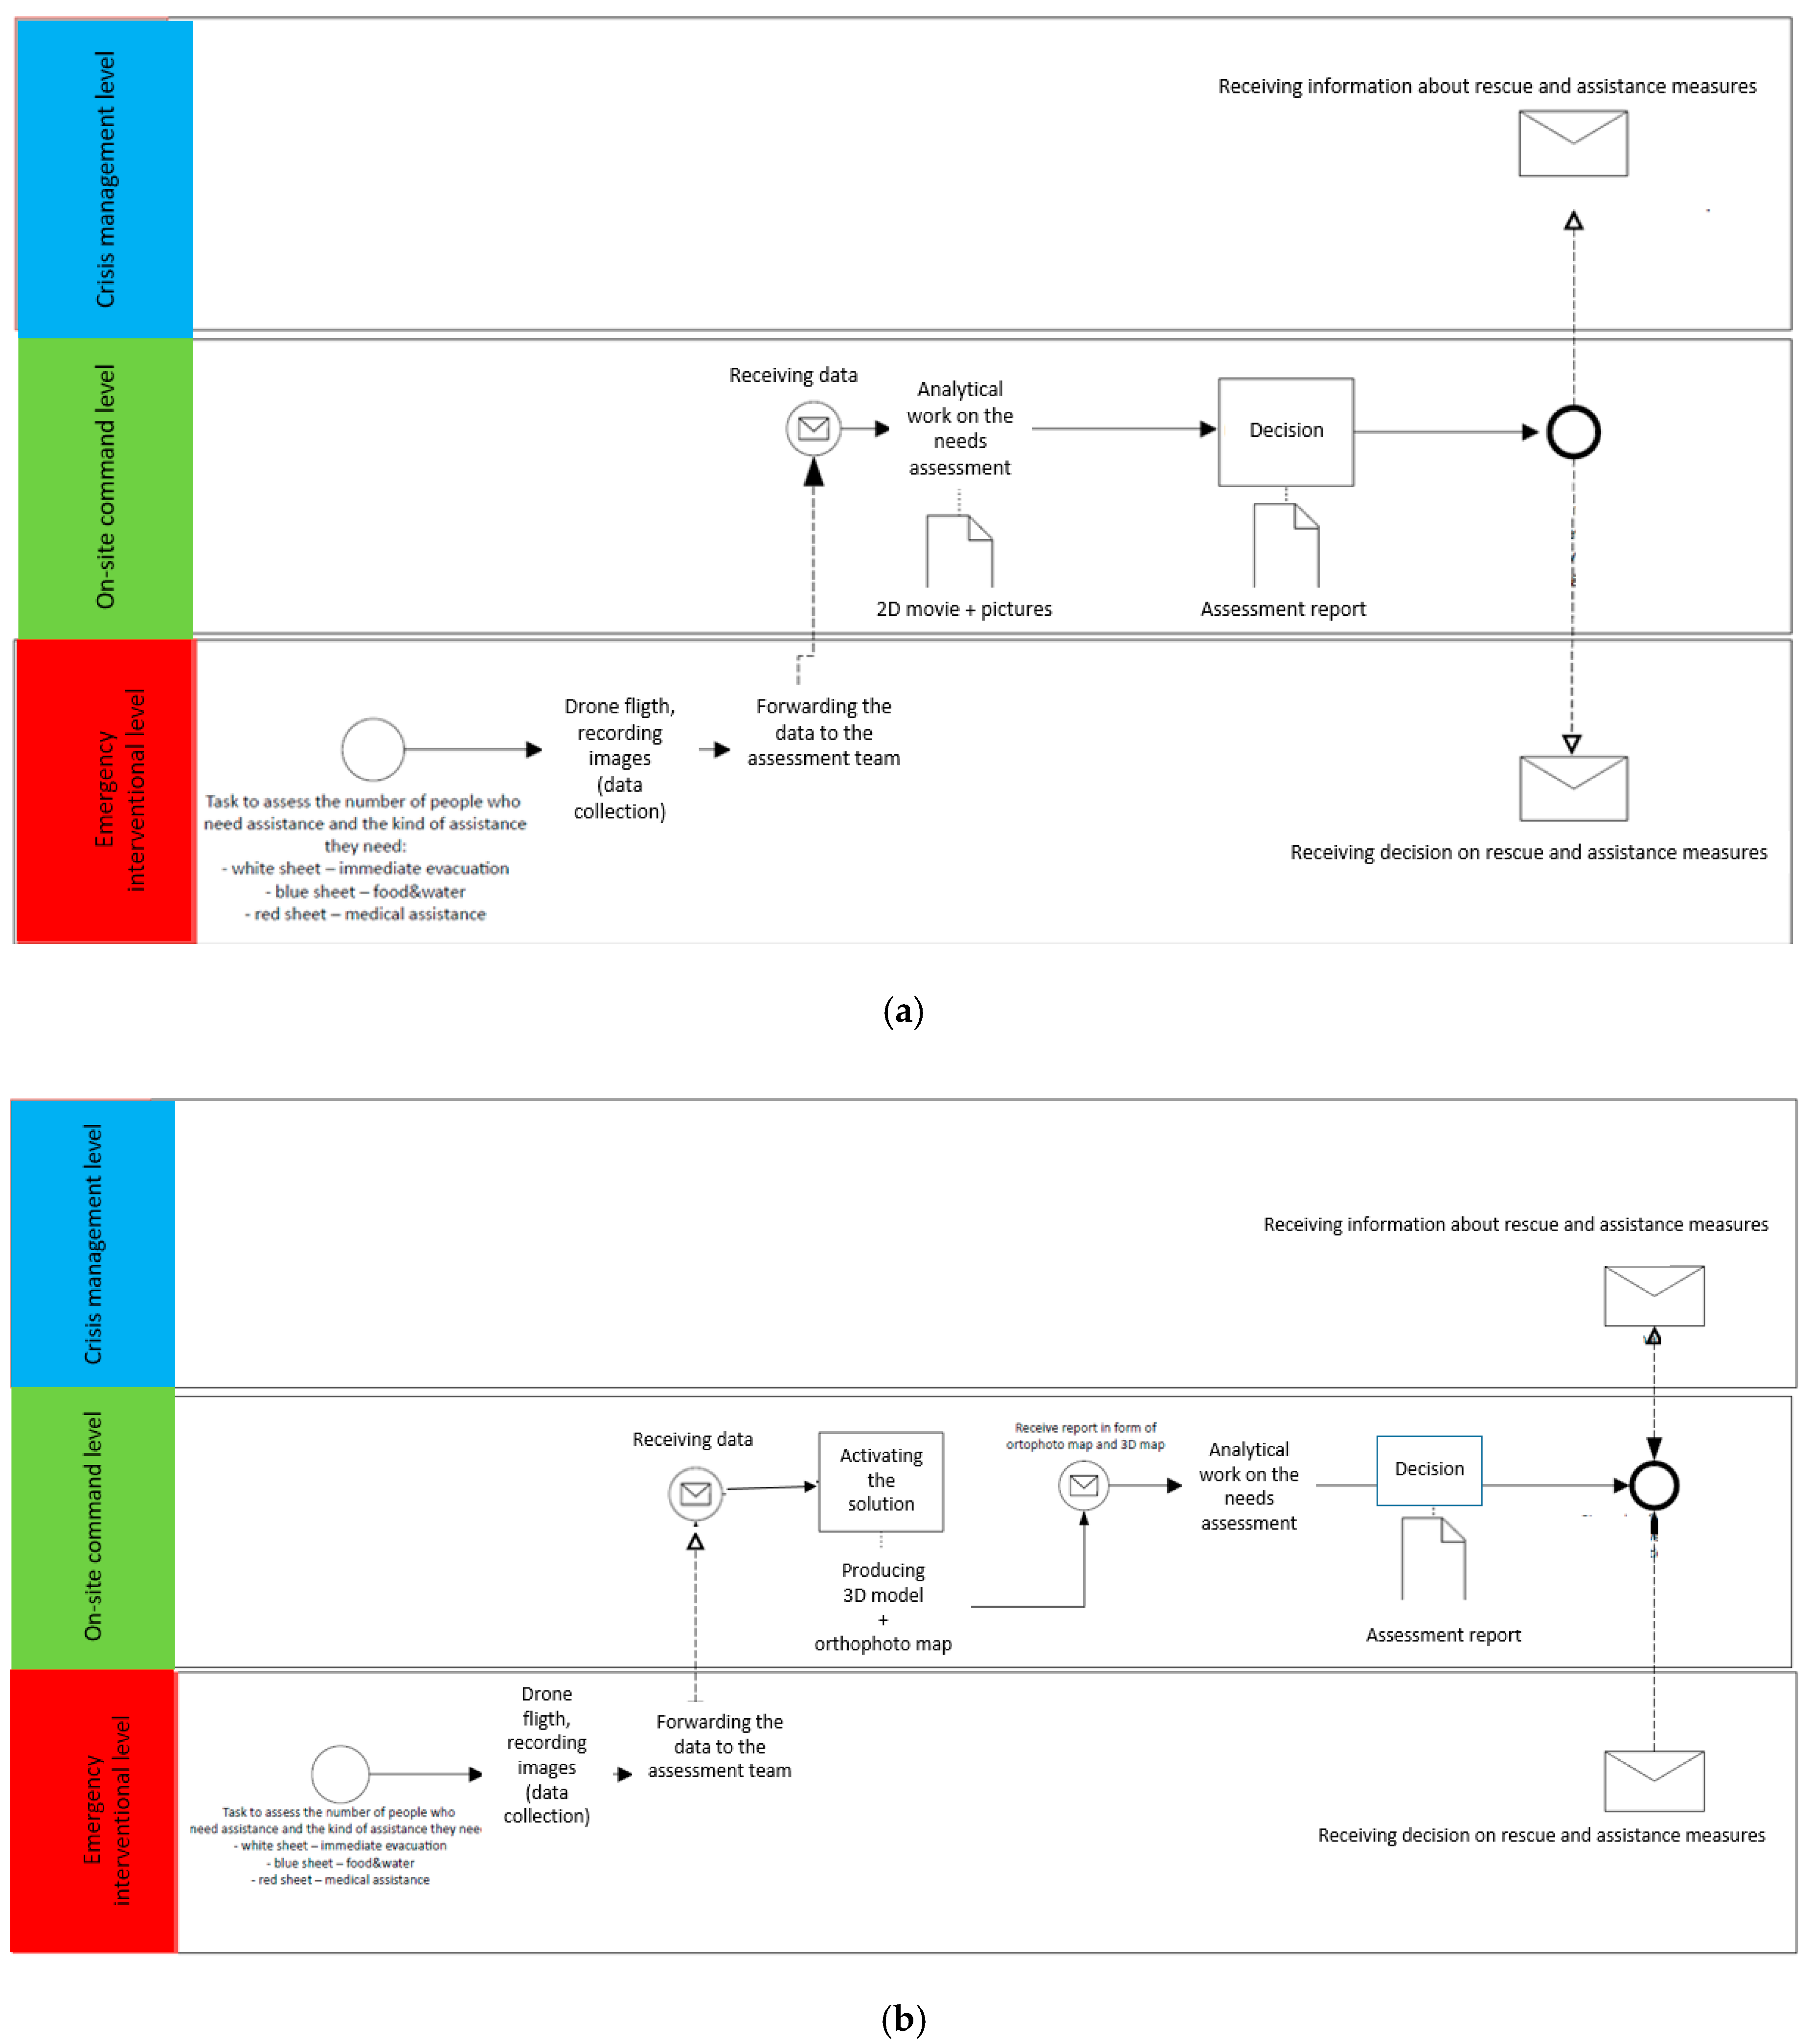
For the research purposes, flow charts of the decision making process were designed for both surveyed cases, 1) the traditional method, referred to as the baseline, and 2) the one implementing the new solution, referred to as the innovation line. The charts were shaped to understand the existing (control test) and the potentially new method of performing aerial reconnaissance (research test). Both are presented in Figure 1. Aerial reconnaissance in disasters—decision making process flow: (a) baseline protocol, control test; (b) innovation line protocol, research test. What differentiates the two flows is an additional activity included in the research test (innovation line). This extra step relates to generating the intervention factor (three-dimensional model and orthophoto map). It means that the potential implementation of the new solution in the future would require changing a standard procedure related to running aerial assessments, in order to enable the production of additional analytical products, such as three-dimensional models and/or orthophoto maps. The charts represent process flows which were the same for both sessions (1—needs reconnaissance, and 2—damage assessments); however, as mentioned before, there were two separate drone flights for each, respectively 13 min and 15 min long.
For both surveyed sessions, needs reconnaissance and damage assessment, the objective was the same: an improvement of the decision making process, based on the products of drone aerial reconnaissance. The objective was to be measured by the following indicators:
- shortening the decision time (decision efficiency);
- improving accuracy of the decision making (decision effectiveness).
The quasi-experimental set-up for research purposes in the needs reconnaissance session reflected a standard procedure used in Poland for visually signalling the needs of people trapped in flooded buildings. In such situations, the affected individuals are informed to hang different colored sheets or other materials out of windows and on the roofs of their buildings. The color codes for signaling needs to first responders are as follow:
- white—urgent evacuation;
- blue—water and food;
- red—medical assistance.
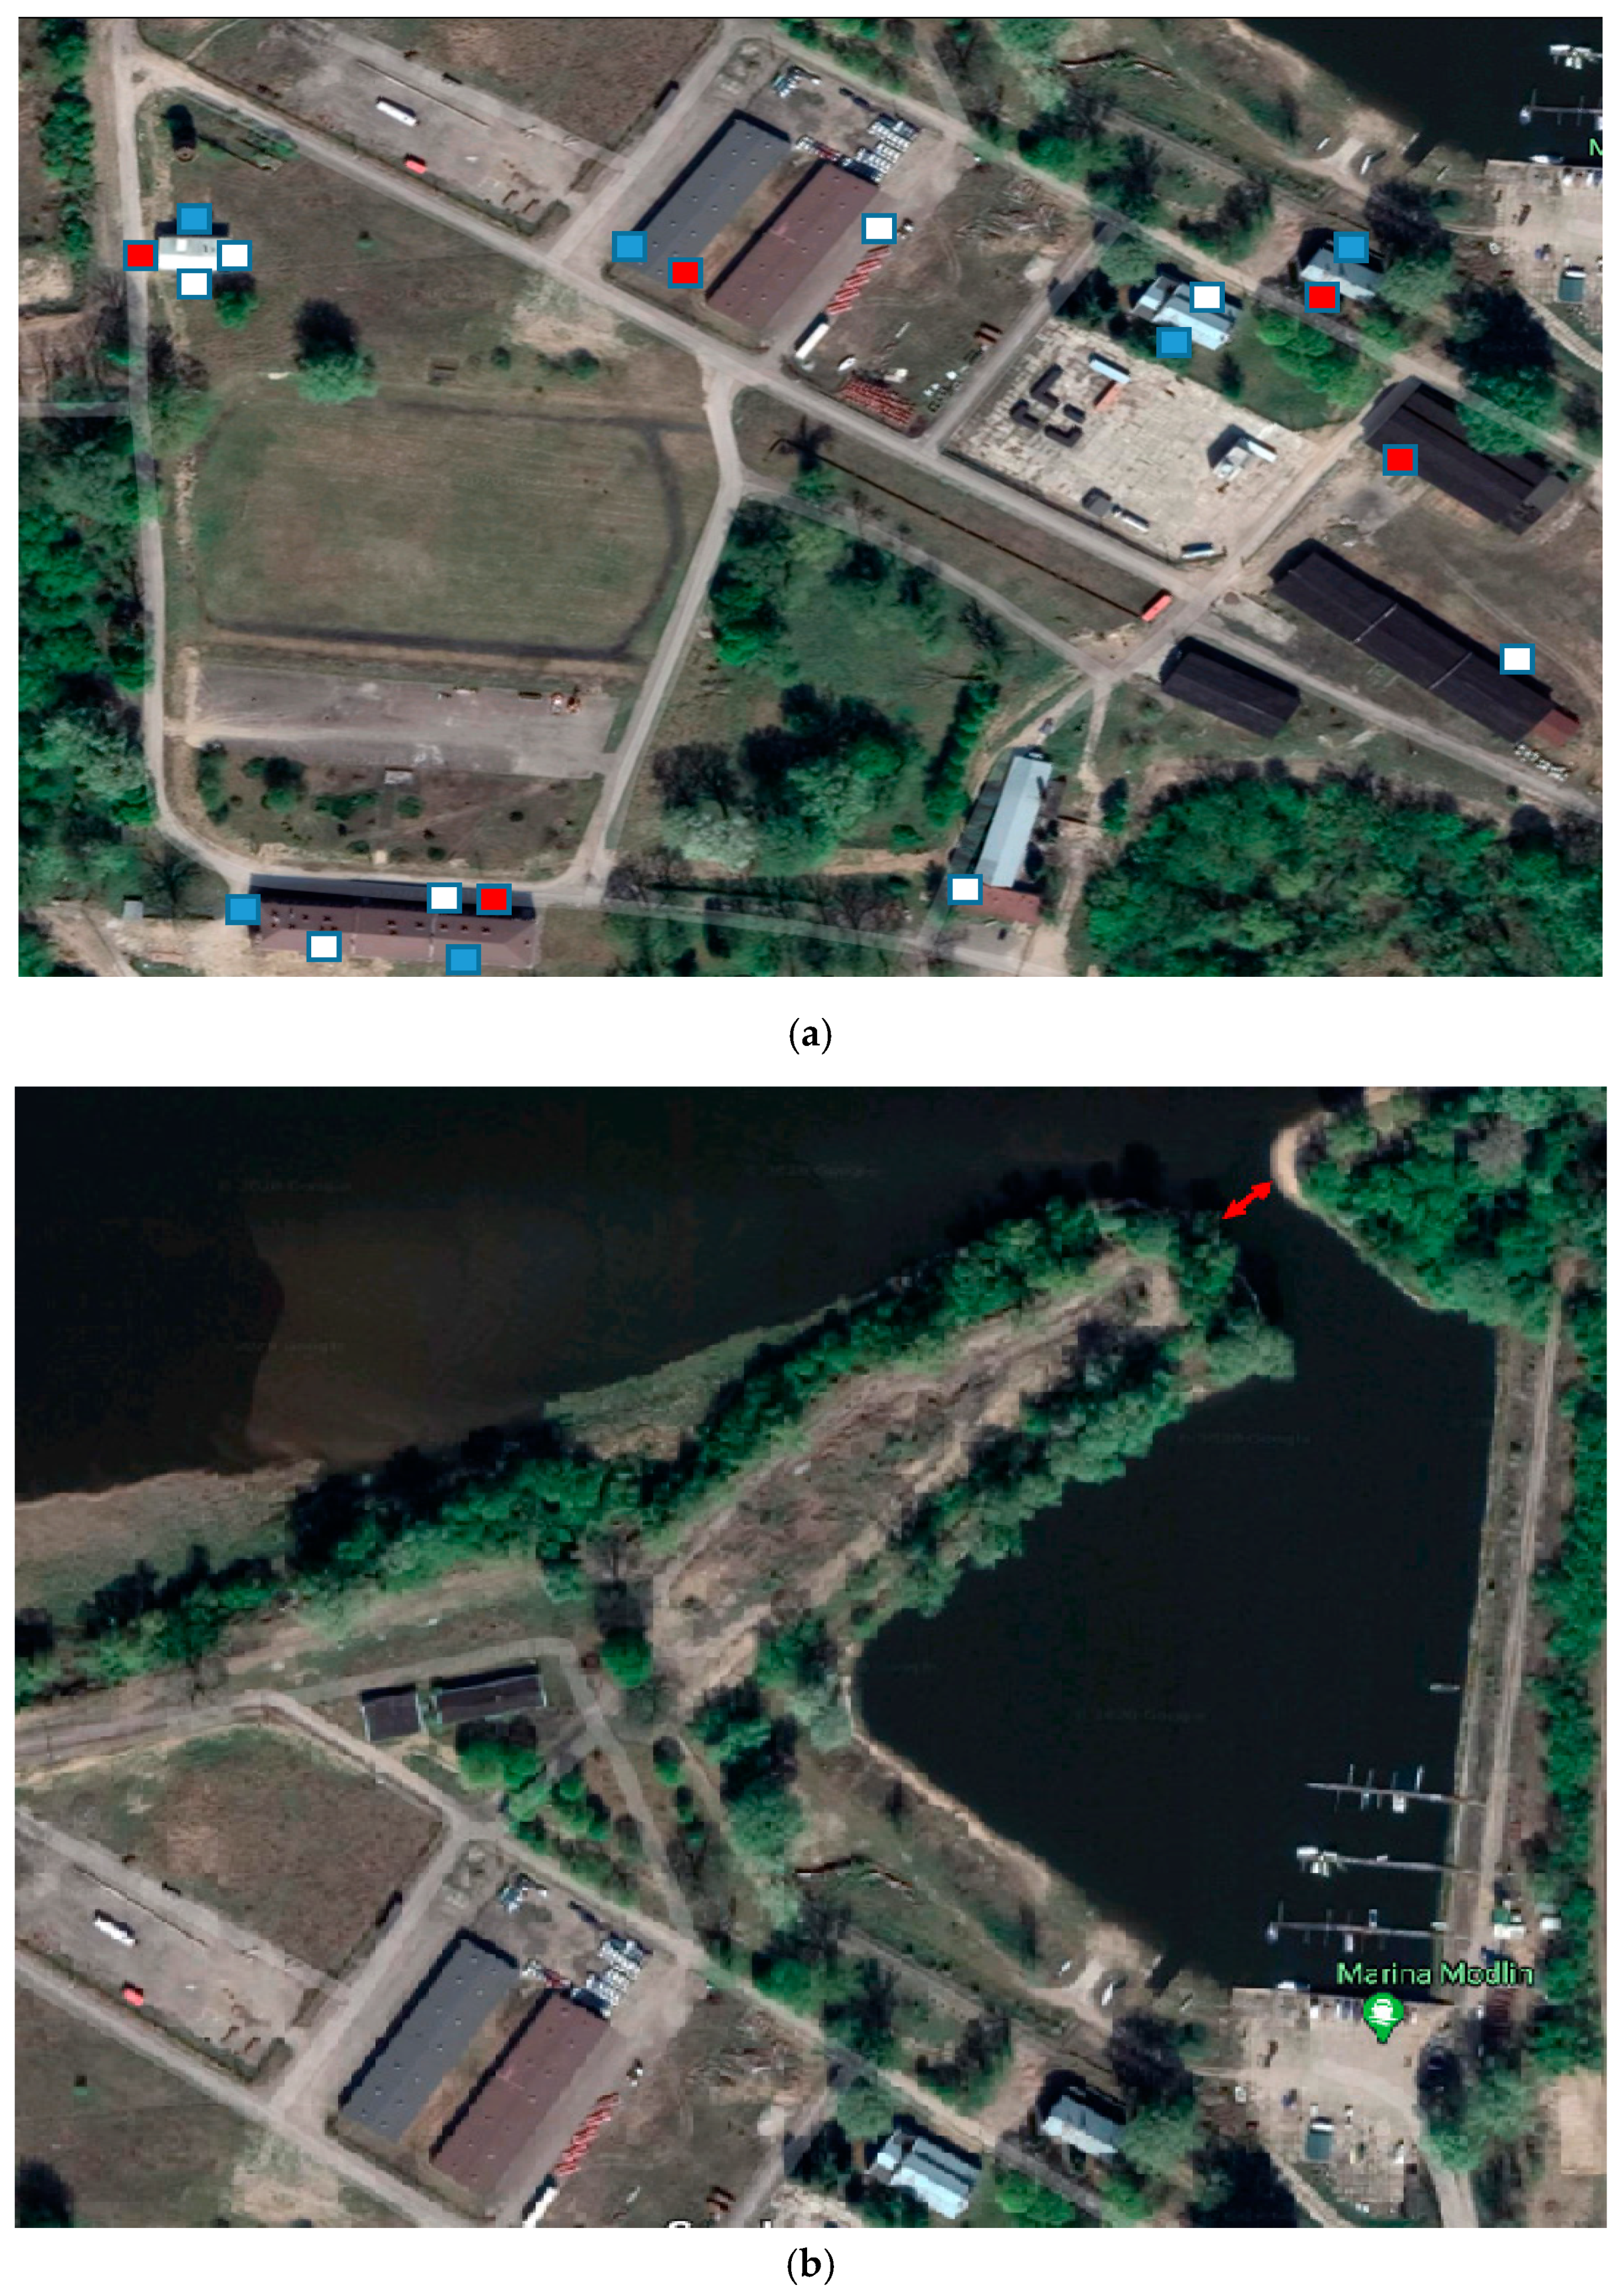
There were in total 19 different colored sheets hung on the buildings in windows (different sites and levels of the buildings) and on roofs as a “ground truth” for the research (see Figure 2a).
The damage assessment session was designed to define the size of a levee collapse (simulated by the port entry—see Figure 2b). Prior to the trial, the size of the port entry was measured with an electronic meter from the ground. The result of this measurement served as a further “ground truth”.
In both sessions, the “ground truth” information was not shared with the practitioners testing the solution. Effectively, this data constituted reference data for the survey.
Table 1 presents the data collection plan implemented in the research, including a brief scenario to contextualize the task given to the practitioners during the test [47]. Secondly, it defines deeper key performance indicators (KPIs) surveyed in the research.
The weakness of the utilized method is typical for a quasi-experiment. Mainly, it relates to the impossibility of having a representative result, typical for correlation methods, as well as a highly objective result, typical for a true experiment. The limitation of the method is that it is highly difficult to repeat the test numerous times in the same conditions. To mitigate this weakness and limitation there was a meta-evaluation process implemented in the trial. In addition to collecting the quantitative data, there was also a qualitative approach used. A questionnaire-based survey was conducted to complete the results of the trial with the disaster managers’ perceptions of the new solution and the test organization. This process was designed and executed as a meta-evaluation of the research process. Since a quasi-experiment does not eliminate the problem of confounding variables [42], it is highly recommended to monitor the conditions of the test so as to avoid unforeseen biases influencing the results, for example caused by the trial set-up. On one hand, implementing mixed methods enables a double check and verification of the findings revealed in the quantitative approach (e.g., process time-consumption) by a qualitative questionnaire approach, asking for opinions (e.g., on the efficiency of the surveyed process). On the other hand, mixed methods provide information on the quality of the trial (e.g., on the appropriateness of the trial technical set up). With this data, it is possible to monitor if there have been any organizational circumstances which could unwittingly influence the results. Besides questioning the participants, there were also observers assigned to monitor the entire process in this respect.
The questionnaires used in the trial were developed by the research team designing and realizing the trial, mainly consisting of academics and disaster management practitioners from the Main School of Fire Service in Warsaw (Poland), Crisis Information Centre at the Space Research Centre Polish Academy of Science in Warsaw (Poland) and University of Munster (Germany). The process of designing the questionnaires was based on the research work done in the DRIVER + project [3]. The dataset for this research is securely stored at the Main School of Fire Service in Warsaw (Poland), as the leading university in this survey.
3. Results
The results are organized in subsections reflecting the two separate tests: the needs reconnaissance and the damage assessment. Each of the subsections present data revealed concerning the efficiency and the effectiveness of the trialed decision making protocols, respectively for the baseline (control teams) and innovation line (research teams) runs. The efficiency of the implemented decision making protocols is represented by the average time-consumption, starting from data collection, through data processing, data analyzing, and finally leading to the decision [19]. The effectiveness is based on the accuracy of the decisions taken by the decision makers in relation to the “ground truth”.
Furthermore, the results of the meta-evaluation process are presented as well. This part of the research was done in order to check the validity of the overall process of testing from the perspective of solution implementation and the testing conditions.
3.1. Needs Reconaisance
3.1.1. Decision Efficiency
Table 2 presents the results for implementation of the solution using the baseline (control teams) and the innovation line (researched teams) protocols. Time-consumption, representing the efficiency of the trialed protocols, is presented for each phase of the overall process. Data processing includes transferring data from the drone’s memory card to a device, enabling the data to be analyzed. For control groups, it was a simple copy and paste process (1 min), while for the research groups the process included internet transfer of the data to the solution, as well as producing a three-dimensional model and orthophoto map. Thus, processing time includes two elements: data transfer, including data conversion, and three-dimensional model and orthophoto map generation. This process consumes most of the overall decision making time.
The approximate time for data transfer via the internet in the given internet conditions was 50 min. It could be shorter where a higher speed internet connection is available, or completely eliminated if the solution was implemented on the disaster site and the data was transferred to the solution by, for example, using a memory card (as it was for the baseline run). Using the solution in the field is technically possible, as revealed in the meta-evaluation (see Section 3.3.1.).
Time consumed for the generation of the three-dimensional model and orthophoto map can also be reduced, since it is highly dependent on the file size of the pictures provided by the drone flight. However, a shorter processing time in this respect will result in the lower quality of the final product.
It is worth noting that the pure analytical work of the research teams, presented in the table as ‘decision making including data analyses’, appeared to be shorter. It is 9 min shorter on average for the research teams (working with a three-dimensional model and an orthophoto map) than for the control teams (working with two-dimensional footage and drone images). It put a positive light on the assumption that the three-dimensional model and orthophoto map facilitate the disaster managers by making the analytical work in needs reconnaissance shorter. The decreased analytical component duration, as well as the increased total data processing time, must be combined with the results of the decision, so as to represent its effectiveness.
3.1.2. Decision Effectiveness
Neither the control teams nor the research teams identified all of the locations and colors (‘ground truth’) of the sheets with 100% accuracy in their assessments. The main difference noted was that the control teams only overlooked some of them, but they did avoid identifying incorrect locations. The research teams made both types of errors; in some cases they did not identify a location and/or identified incorrect locations. Table 3 presents the average results of the needs reconnaissance for the control teams and research teams, in relation to the real number and the locations of the sheets on site (“ground truth”) in number/percent.
The control teams correctly identified all “medical assistance” needs (red sheets), while the largest number of locations not identified were “evacuation needs” (white sheets). Although the control teams may have omitted a need in some cases, they never identified an incorrect location, which would thereby mislead the needs reconnaissance. The total effectiveness level of the needs reconnaissance for the control teams is 77%, while for the research teams it is slightly lower; 66%. For both “water and food” and “medical assistance” needs, the control teams performed better than the research teams. However, for “evacuation” needs, the research teams provided slightly better result (2% more recognized needs) than the teams working with traditional tools. On the other hand, for this type of need, the research teams compromised the result of the reconnaissance by incorrectly identifying two locations, while the control teams made no such errors.
3.2. Damage Assessment
3.2.1. Decision Efficiency
Similar to the needs reconnaissance session, the damage assessment was analyzed through the prism of time-consumption, from both perspectives; first, the entire decision making process (from the data collection phase to the final decision), and second, particular components of this process.
Table 4 presents the average results for time-consumption in relation to the teams and phases. Again, the data processing time, 91 min, constitutes the heavy burden of the overall process in the researched protocol. It significantly prolongs the entire process, in comparison to the traditional way of performing needs reconnaissance.
Comparing decision making times, including analytical work on the generated products, with the previous session, the time was shorter on average for the research teams. In this case, it was found that working with a three-dimensional model and orthophoto map was 4 min quicker in coming to the final decision. This finding confirms what was also revealed in the needs reconnaissance session (see Section 3.1.1.).
3.2.2. Decision Effectiveness
The practitioners were tasked with assessing the size of the entry to the port, simulating a breached levee. Their deliberations were undertaken on the basis of the same drone flight (15 min) for both the control and the research teams. Prior to the test, reference data was surveyed by measuring the size of the port entry. The measurement of the so called “ground truth” was 23.4 m.
Table 5 presents the aerial assessments of the opening size in relation to the real size. The research teams were made more accurate in this respect by including the real size in their average assessments. The control teams’ average assessments were slightly lower, and underestimated the real size of the opening (‘ground truth’). In addition, the average deviation for the control teams was 3.8 m, while the research teams deviated by only 0.5 m. Since in some cases the practitioners only estimated an interval between the minimum and maximum size they observed, the deviation was calculated from the highest assessed scores, due to the fact that it is reasonable to entertain the worst case scenario for the breached levee.
3.3. Meta-Evaluation
The meta-evaluation process aimed at identifying potential biases in the solution performances and trialing conditions, which could have biased the revealed results regarding the efficiency and effectiveness of the decision making processes [47]. In addition, the survey, based on questionnaires filled out by the participants and the observers of the trial, revealed some expected areas of future development that would permit the solutions to even better meet the end-users needs. Data was collected via the Likert scale, by marking one out of five possible answers to a given statement from strongly disagree (coded –2) to strongly agree (coded +2) [48,49].
3.3.1. Perception of the Trialled Solution
The participants, as well as the observers of the trial, were surveyed for their perceptions of the solution’s performance in the proposed decision making protocol. Both groups were requested to elaborate respectively on their experiences and observations concerning general criteria reflecting how the solution facilitates decision makers in:
- the preparation of a comprehensive overview of the situation;
- th edecision making process.
There were 13 practitioners (n = 13) and 6 observers (n = 6) who gave their answers in the questionnaires. Table 6 presents the average results of this survey. Both the practitioners and the observers had a positive perception of the solution as facilitating a comprehensive overview of the disaster, as well as a decision making process. There were no dissenting views in relation to the formulated statements.
In addition, the participants (n = 13) were surveyed on the basis of a further 21 detailed criteria, enquiring into the experiences gained during the trial. Figure 3 presents the average results of the participants’ opinions of the solution. Each of the criteria were scored as being positive (above zero, which was coded as a neutral attitude towards the given statement). However, they realized that learning how to use the solution is not so easy, and requires more time than was available during the training prior the trial (criterion: quickly learned how to use). As a result of this aspect, they also perceived the solution as being not so easy to set up and to use. Despite this, the participants recognized the solution as not stressful to use and easy to pack away after use. Furthermore, they declared they would use the solution again, probably for further testing purposes, since at this stage they are not fully convinced the solution is necessary for implementation.
3.3.2. Perception of the Testing Conditions
The participants (n = 13) and the observers (n = 6) were also asked about the testing conditions in the trial. This survey was conducted to ensure that the final results of the trial were not biased, e.g., by mirroring the reality of disaster management conditions in an insufficient manner, and through that imparting of inaccurate relevance to the overall findings.
Table 7 presents the results of this part of the survey. All in all, the ratings of the criteria both by the practitioners and the observers were evaluated as positive, which gives the premise to consider the trial findings as having been tested under relevant conditions. The highest ratings, in both groups, were given to the organizational set up clarity and the scenario clarity criteria. This proves that the responders did not identify major problems that could have biased the testing process, and that they understood the context of the given disaster situation, as well as their tasks. Furthermore, the respondents evaluated the number of the people testing the solution, as well as their competences, as adequate for the given disaster response tasks. Last but not least, the training on the solution, conducted prior the trial, did not score as highly, but still positively. This confirms the assumption expressed above—that the training on the solution could perhaps have been longer and more detailed.
4. Discussion
4.1. Efficiency
The efficiency of the overall decision process for the research teams, both for needs reconnaissance and damage assessment, exhbits a significant burden in terms of the data processing time required to produce the three-dimensional model and orthophoto map. This would have implications, especially in sudden-onset disaster response conditions (e.g., fast flood or breached levee). The duration of this component in the overall process is largely determined by the data processing time, including the data conversion and transferring required to generate the three-dimensional model and orthophoto map. This element strictly depends on the file size of the drone flight pictures, and can be reduced significantly if the solution is implemented at the disaster site (physical provision of the solution at the disaster scene is technically possible), or by better internet transfer. As the trial showed, in this way the processing time, mainly involving transferring the data through the internet, would decrease by approximately 50 min in the surveyed case. Adapting the protocol for the solution to the disaster site would make the overall time of the decision only 22 min longer for needs reconnaissance, and 13 min longer for damage assessment, which could be considered as partly satisfactory. However, it does not enable a reduction in the total time consumption of the researched decision making protocol below the baseline result, which was confirmed in both sessions. Therefore, another means of achieving efficiency improvement should be investigated and developed. One possible option would be the development of data processing capabilities, which would make the time of three-dimensional model- and orthophoto map-production shorter.
A clearly positive result of the tests is that in both cases, needs reconnaissance and damage assessment, the pure decision making, including the analytical work of the teams on the given products, was shorter for the three-dimensional model and orthophoto map than for the traditional products. What is more, in this shorter time, the teams were more effective with their decisions, at least in the damage assessment session, but also for “evacuation” needs identification in the needs reconnaissance session.
Thus, the efficiency of the overall process of needs reconnaisance and damage assessment is reduced due to the greater time-consumption involved in using the three-dimensional model and orthophoto map. However, the positive finding is that the efficiency of the phase dedicated to pure analitical work, not including the logistical and organizational aspects, increases, since the time-consumption of this particular component of decision making is reduced.
Later in this paper, these findings are combined with the effectiveness of the decisions.
4.2. Effectiveness
4.2.1. Needs Reconnaissance
No team working with the three-dimensional model and orthophoto map, or with two-dimensional footage and drone images, correctly identified all the locations and colors of the sheets with 100% accuracy. In general, in the control teams (baseline), there were more (three out of four) needs identified, while in the research teams (innovation line) only two out of four needs were identified. This proves there is still some room for improvement in both the evaluated methods of disaster needs reconnaisnace. The traditional method (two-dimensional footage and drone images) proved to be more effective for “water and food” need (blue color) and “medical assistance” (red color). The opposite was the case with the “evacuation” need (white color). Here, the three-dimensional model and orthophoto map appeared to be sligthly better, however these teams made some mistakes in identifying needs in incorrect locations. This type of mistake did not happen at all with the practitioners working in the control teams. The identifying of incorrect locations by the teams working with three-dimensional models and orthophoto maps also happened in the case of “medical assistance” (red color), in addition to the “evacuation” need. As reported by the practitoners working with the solution, it might have been the case that the sunlight reflected from glass surfaces such as windows led to false positives; this was found to be a highly probable reason in discussions with the practitioners, as well as in the after-action analysis of the generated products. This thesis can also be confirmed by the fact that the three-dimensional model and orthophoto-map is generated from drone pictures. Therefore, it is possible that in the particular moment of taking a picture, the image catches the sun’s reflection [35]. This is considered to be an aspect of the three-dimensional imaging which could mislead deicsion makers. In comparison, two-dimensional footage from an aerial recoonaisance is a “moving” product, which, by moving perspectives as the drone flight proceeds, limits this type of error. Put simply, sun flashes in recorded footage could be easier to exlude by an observer in dubious situations. This type of inaccurate reconnaissance could have consequences in terms of suboptimal civil protection resource deployment (e.g., evacuation boats or helicopters), for example by sending the assets to incorrect locations where the needs do not actually exist. Taking into consideration the efficiency elabotated in the earlier section, as well as the effectiveness of the three-dimensional reconnaissance results, it would seems to be valuable to survey other options that can provide quicker three-dimensional visualizations and exlude sun reflections, e.g., stereoscopic footage.
In relation to the “evacuation” need, there are relatively high numbers of locations which were not identified by both types of team; control and research. This suggests that the use of the white color should be reconsidered as the color to be used for signaling the needs of the affected population in a visual manner. In this respect, the red color seems to be the most effecitve. Futhermore, a shortcoming of three-dimensional modeling is the excluding of sheets not been identified in an image due to windy conditions. Such a situation can happen, for example if the wind turns the sheet parallel to the line of the camera lens at the moment the image is capture. This can result in the sheet not appearing in the three-dimensional model at all.
The needs reconnaisance session demonstrated that, in general, the effectiveness of the decision is not enhanced by the tested solution, which means that there is scope for improvement of the solution. A peculiar increase of effectiveness was identified in the case of reconnaissance of “evacuation” needs; however, this was negatively impacted by a small perecentage of incorrect locations being identified.
4.2.2. Damage Assessment
Flood modeling dynamics simulation software requires precise data input, such as river flow speed or the width of a breach in a damaged levee, to provide realiable prognosis. The more accurate and relevant the data provided to the software, the greater the probability of generating a realistic model of upcoming flood development. Such information might be used for further calculation of intensity of the outflow. Moreover, three-dimensional models and orthophoto maps of the area might serve further analysis, including in distance, height or area measurements. Therefore, using drones to provide aerial reconnaissance of remote and difficult-to-access areas is a highly interesting option for disaster managers, since it delivers them data crucial for their main task, which is decision making.
The trial of damage assessment showed that estimating the widths of openings in damaged levees caused by the high pressure of flood water can be more accurately assessed from three-dimensional models and orthophoto maps than from two-dimensional footage and drone images. The research teams were able to make more accurate estimations of the real sizes of the opening. In contrast, the control teams underestimated the width of the opening in their assessments, which could result in providing false data as an input to further analysis in the flood simulation modeling tools. A smaller opening size of the breach will lead to the underestimation of the flood risk related to the emergency situation, which can cause greater losses and create operational problems for disaster management.
Summing-up, the damage assessment can be improved by using three-dimensional models and orthophoto maps for analytical purposes and making decisions. These products proved themselves by facilitating the process of providing more accurate estimations of the size of the breach in the levee, which in turn generates more relevant and updated data for further flood development analysis. This real time data from the site of a developing disaster can serve as a realiable input to flood simulation modeling systems.
4.3. Meta-Evaluation
Meta-evaluation was conducted during the trial in order to monitor potential biases during the test’s preparation and execution.
The participants perceived the solution as not so easy to be learned how to use it. Therefore, the training on the solution (2 h) organized prior the trial could have been longer, so as to minimize biases related to the novelty of the solution usage. As can be expected, the more experiences the participants have with the solution, the better the results on the efficiency and effectiveness of the process will be. Thus, a realistic assumption is that the achieved results presented in the paper constitute the bottom level of the innovation line, in respect to the time-consumption and accuracy of the aerial reconnaissance using three-dimensional models and orthophoto maps. Gaining more experience of using the proposed protocol would bring a further reduction of the time-consumption (efficiency increase), and improve the accuracy of the assessments (effectiveness increase), especially as participants recognized the solution as not stressful to be used and declared they would use the solution again.
Besides the above-elaborated aspect, the results of the meta-evaluation showed that there were no serious issues related to the practitioners’ profiles, participation or other organizational aspects that could affect the tests in an unacceptable manner. All of the surveyed aspects were evaluated positively, both by the practitioners and the observers of the tests. Therefore, there was no critical error identified which could disqualify the results of the tests.
5. Conclusions
Researching and testing innovative solutions is an essential part of the preparatory phase in disaster management. This process is challenging and requires specific methods, as the disaster response, for which the solutions are designed, is a complex, dynamic and uncertain environment. In addition, the spectrum of solutions with some potential to be effective in disaster response is very broad, and constantly increasing. Therefore, it requires research and the application of new testing methods, which are tailored to provide relevant solutions that are practical for use by disaster management practitioners.
The solution tested in the trial showed some potential in facilitating disaster managers in major floods, in respect to needs reconnaissance and damage assessment. As such, the solution products in the form of three-dimensional models and orthophoto maps can be used in disaster management, and should be explored further in order to contribute to the realization of the UN Sustainable Development Goal 11. The products, if used in the aerial assessment of disaster needs and damages, could contribute to a reduction of the number of deaths from, and people affected by, disasters, as well as limiting direct losses resulting from these events.
The objective of the research was achieved by successful testing of three-dimensional models and orthophoto maps for aerial disaster-related needs and damage reconnaissance. Having fulfilled the aim, it is valid to conclude that the technologies proved their potential applicability in facilitating disaster managers with more precise damage assessment; however, they were less useful than expected in needs reconnaissance. Getting more accurate real time data from three-dimensional models and orthophoto maps leads to better decisions, especially in damage assessment, whilst limiting uncertainty in following disaster response measures, like the real time modeling of flood development after a levee breach.
Secondly, a less positive results is that the overall assessment process is heavily burdened by data processing time; therefore, there is a need for further research concerning how to reduce the processing time related to generation of the three-dimensional models and orthophoto maps. A reduction of this time burden could be partially achieved by organizational and logistic measures, e.g., by setting up this solution on the disaster site where feasible. However, even then it does not reduce the total decision making time in a fully satisfactory manner. Nevertheless, the three-dimensional model and orthophoto map solution had a positive effect on the reduction of one key component of the decision making protocol, which is the reducing of the duration of the analytical work with the given products. Notably, compared to the traditional protocol, the participants using the products made decisions faster, measured from the moment they received the products for analytical work. In the case of damage assessment, the higher efficiency also resulted in higher effectiveness given more accurate decisions concerning the size of the breached levee. This positive effect on effectiveness did not happen for disaster needs reconnaissance, where only one (‘evacuation need’; white color) out of the three marked needs was recognized with a slightly better accuracy.
On top of this, the research also revealed room for improvement in terms of what is expected by practitioners from the surveyed solution. This knowledge is highly important for solution providers, who can refine their solution development strategies by ensuring the best fit possible between the solution and the practitioners’ needs.
The recommended further research and development works must focus on:
- reducing the processing time of the three-dimensional model and orthophoto map production;
- reducing the negative side-effects of the product’s usage for disaster aerial assessments, including elimination of sun reflections, and addressing uncaptured objects in drone pictures (e.g., sheets not recognized due the wind influancing their position while drone pictures were taken);
- further studies based on the same methodology of assessing the efficiency and effectiveness of these products for disaster aerial assessments, to confirm or verify the findings from this research;
- The published results of such research would significanlty extend the very limited number of publications in focusing on three-dimensional model and otrhophoto map usage for disaster management purposes. The usability of such solutions is in general claimed to be high in many domains, however it has not been tested in depth for disaster management, as it is lacking solid experimental data. In so doing, such solutions will achieve the greatest possible acceptance on the European and global market, while contributing succesfully to the goal of disaster resilience.
Funding
This research was funded by the SEVENTH FRAMEWORK PROGRAMME OF THE EUROPEAN COMMUNITY FOR RESEARCH AND TECHNOLOGICAL DEVELOPMENT, grant number 607798 and the MINISTRY OF SCIENCE AND HIGHER EDUCATION OF THE REPUBLIC OF POLAND, grant number 3851/7.PR/17/2018/2. The APC was funded by the Main School of Fire Service in Warsaw (Poland).
Acknowledgments
The authors gratefully acknowledge the contribution of many researchers in the DRIVER+ project who participated in designing, preparation, execution and evaluation of the quasi-experiment (trial), and in particular that of Marcin Smolarkiewicz, Wiktor Gawroński, Adrian Bralewski, Karolina Bralewska, Grzegorz Bełtowski, Piotr Kolmann (the Main School of Fire Service, Poland); Jakub Ryzenko, Emil Wrzosek, Joanna Tymińska, Anna Foks-Ryznar (the Space Research Centre of the Polish Academy of Science) and Adam Widera (University of Munster, Germany). Last but not least, appreciation to Jon Hall (the Resilience Advisors Network) and Aidan Dempsey (Wicklow County Fire Service, Ireland) for English grammatical correctness check of the manuscript.
Conflicts of Interest
The author declares no conflict of interest.
References
- Sustainable Development Goals. Available online: https://sustainabledevelopment.un.org/?menu=1300 (accessed on 13 March 2020).
- Wang, Y.; Fang, Z.; Hong, H.; Peng, L. Flood susceptibility mapping using convolutional neural network frameworks. J. Hydrol. 2020, 582, 124482. [Google Scholar] [CrossRef]
- DRIVER+ Project. Available online: https://www.driver-project.eu/ (accessed on 15 January 2020).
- ENCIRCLE Project. Available online: http://encircle-cbrn.eu/ (accessed on 20 January 2020).
- RESPONDRONE Project. Available online: https://respondroneproject.com/ (accessed on 22 January 2020).
- Emblemsvåg, J. On probability in risk analysis of natural disasters. Disaster Prev. Manag. Int. J. 2008, 17, 508–518. [Google Scholar] [CrossRef]
- Zwęgliński, T. Metodologiczne podstawy teorii ewaluacji ćwiczeń w zakresie zarządzania kryzysowego i ochrony ludności. In Racjonalizacja Zarządzania Jednolitymi Formacjami Umundurowanymi Odpowiedzialnymi za Bezpieczeństwo Wewnętrzne; Wiśniewski, B., Zwęgliński, T., Eds.; Szkoła Główna Służby Pożarniczej: Warsaw, Poland, 2019; pp. 252–277. [Google Scholar]
- Julmi, C. When rational decision-making becomes irrational: A critical assessment and re-conceptualization of intuition effectiveness. Bus. Res. 2019, 12, 291–314. [Google Scholar] [CrossRef] [Green Version]
- Kurz, F.; Rosenbaum, D.; Leitloff, J.; Maynberg, O.; Reinartz, P. A real time camera system for disaster and traffic monitoring. In Proceedings of the International Conference on Sensors and Models in Photogrammetry and Remote Sensing 2011, Tehran, Iran, 18–19 May 2011; pp. 1–6. [Google Scholar]
- Wiśniewski, B.; Kozioł, J.; Falecki, J. Podejmowanie Decyzji w Sytuacjach Kryzysowych; Wyższa Szkoła Policji: Szczytno, Poland, 2017; pp. 105–112. [Google Scholar]
- Perwaiz, A.; Sinha, S. Post disaster needs assessment for resilient recovery using space applications and innovative technologies. In Science and Technology in Disaster Risk Reduction in Asia; Elsevier BV: Amsterdam, The Netherlands, 2018; pp. 343–365. [Google Scholar]
- Römer, H.; Kiefl, R.; Henkel, F.; Wenxi, C.; Nippold, R.; Kurz, F.; Kippnich, U. Using airborne remote sensing to increase situational awareness in civil protection and humanitarian relief—The importance of user involvement. In Proceedings of the International Archives of the Photogrammetry, Remote Sensing and Spatial Information Sciences, Prague, Czech, 12–19 July 2016; Volume XLI-B8, pp. 1363–1370. [Google Scholar]
- Oddo, P.; Bolten, J.D. The Value of Near Real-Time Earth Observations for Improved Flood Disaster Response. Front. Environ. Sci. 2019, 7, 127. [Google Scholar] [CrossRef] [Green Version]
- Marturano, F.; Ciparisse, J.-F.; Chierici, A.; D’Errico, F.; Di Giovanni, D.; Fumian, F.; Rossi, R.; Martellucci, L.; Gaudio, P.; Malizia, A. Enhancing Radiation Detection by Drones through Numerical Fluid Dynamics Simulations. Sensors 2020, 20, 1770. [Google Scholar] [CrossRef] [PubMed] [Green Version]
- Zwęgliński, T.; Smolarkiewicz, M. Exercising in a Radioactive Environment—A Case Study from CBRNE Exercise in Chernobyl Exclusion Zone. Saf. Fire Technol. 2019, 54, 160–166. [Google Scholar] [CrossRef]
- Hendriks, M.; Vullings, E.; van Campen, S.; Hameete, P. An interoperability Framework for Trials and Exercises. In Proceedings of the 30th International Forum for the Military and Civil Simulation, Training and Education Community (ITEC), Stockholm, Sweden, 13–16 May 2019. [Google Scholar]
- Foks-Ryznar, A.; Ryzenko, J.; Trzebińska, K.; Tymińska, J.; Wrzosek, E.; Zwęgliński, T. Trial as a pragmatic and systematic approach for assessing new solutions in crisis management and rescue operations. In Proceedings of the International Society for Optical Engineering (SPIE): 44th Wilga 2019 Symposium on Photonics Applications in Astronomy, Communications, Industry, and High-Energy Physics Experiments, Wilga, Poland, 26 May–2 June 2019; p. 253. [Google Scholar]
- Gilman, D. Unmanned Aerial Vehicles in Humanitarian Response; OCHA Policy and Studies Series; UN Office for the Coordination of Humanitarian Affairs: Geneva, Switzerland, 2014. [Google Scholar]
- Feltynowski, M.; Zawistowski, M. Opportunities Related to the Use of Unmanned Systems in Emergency Services. Bezpieczp. Tech. Pozar. 2018, 51, 126–136. [Google Scholar] [CrossRef]
- Feltynowski, M.; Zawistowski, M. Threats Related to the Use of Unmanned Systems in Emergency Services. Bezpieczp. Tech. Pozar. 2018, 51, 138–149. [Google Scholar] [CrossRef]
- Meyer, M. The new killer drones: Understanding the strategic implications of next-generation unmanned combat aerial vehicles. Int. Aff. 2015, 91, 765–780. [Google Scholar] [CrossRef]
- Hodgson, J.C.; Mott, R.; Baylis, S.; Pham, T.; Wotherspoon, S.; Kilpatrick, A.D.; Segaran, R.R.; Reid, I.; Terauds, A.; Koh, L.P. Drones count wildlife more accurately and precisely than humans. Methods Ecol. Evol. 2018, 9, 1160–1167. [Google Scholar] [CrossRef] [Green Version]
- Centre for Strategy and Evaluation Services. Evaluation Study of Definitions, Gaps and Costs of Response Capacities for the Union Civil Protection Mechanism; D7 Final Report; Centre for Strategy and Evaluation Services: Otford, UK, 2019; pp. 109–114. Available online: https://ec.europa.eu/echo/sites/echo-site/files/capacities_study_final_report_public.pdf (accessed on 5 March 2020).
- Meier, P. Humanitarian Drone/UAV Missions: Towards Best Practices; We Robotics: Geneva, Switzerland, 2015; p. 6. Available online: https://docs.google.com/document/d/1xyjOBVe4cz7F-Ed1lGzeT4ZPmC2tJ0JiDUyzWo1Ci9U/edit# (accessed on 22 May 2020).
- Restas, R. Disaster Management Supported by Unmanned Aerial Systems (UAS) Focusing Especially on Natural Disasters. Zeszy. Naukowe SGSP 2017, 61, 25–34. [Google Scholar]
- Restas, A. Drone Applications for Supporting Disaster Management. World J. Eng. Technol. 2015, 3, 316–321. [Google Scholar] [CrossRef] [Green Version]
- Erdelj, M.; Chowdhury, K.R.; Akyildiz, I.F.; Natalizio, E. Help from the Sky: Leveraging UAVs for Disaster Management. IEEE Pervasive Comput. 2017, 16, 24–32. [Google Scholar] [CrossRef]
- Duarte, D.; Nex, F.; Kerle, N.; Vosselman, G. Satellite Image Classification of Building Damages Using Airborne and Satellite Image Samples in a Deep Learning Approach. ISPRS Ann. Photogram. Remote. Sens. Spat. Inf. Sci. 2018, 4, 89–96. [Google Scholar] [CrossRef] [Green Version]
- Perera, A.G.; Khanam, F.-T.-Z.; Al-Naji, A.; Chahl, J. Detection and Localisation of Life Signs from the Air Using Image Registration and Spatio-Temporal Filtering. Remote Sens. 2020, 12, 577. [Google Scholar] [CrossRef] [Green Version]
- Juszczyk, K. Szybciej, więcej i taniej. In Rynek Dronów w Polsce. Świt w Dolinie Śmierci; Kosieliński, S., Ed.; Instytut Mikromakro: Warszawa, Poland, 2017; pp. 106–109. [Google Scholar]
- Eyerman, J.; Crispino, G.; Zamarro, A.; Durscher, R. Drone Efficacy Study (DES): Evaluating the Impact of Drones for Locating Lost Persons in Search and Rescue Events; DJI: Shenzhen, China; European Emergency Number Association: Brussels, Belgium, 2018; pp. 15–21. [Google Scholar]
- Meier, P. Digital Humanitarians: How Big Data is Changing the Face of Humanitarian Response; Taylor and Francis Press: Park Drive, UK, 2015; pp. 73–92. [Google Scholar]
- Sharma, K.; Devarani, R.; Gangwar, A.; Chakrabarty, R. Efficacy and Utilization of Unmanned Aerial System (Uas) as Operational Tools for Disaster Management in India. Preprints 2018, 7, 10259–10264. [Google Scholar] [CrossRef]
- Adams, S.; Friedland, C.J. A Survey of Unmanned Aerial Vehicle (UAV) Usage for Imagery Collection in Disaster Research and Management. Available online: https://www.researchgate.net/publication/266465037_A_Survey_of_Unmanned_Aerial_Vehicle_UAV_Usage_for_Imagery_Collection_in_Disaster_Research_and_Management (accessed on 12 April 2020).
- Grogan, S.; Gamache, M.; Pellerin, R. The Use of Unmanned Aerial Vehicles and Drones in Search and Rescue Operations—A Survey. In Proceedings of the PROLOG 2018, Hull, UK, 28–29 June 2018. [Google Scholar]
- Di Felice, M.; Trotta, A.; Bedogni, L.; Chowdhury, K.R.; Bononi, L. Self-organizing aerial mesh networks for emergency communication. In Proceedings of the 2014 IEEE 25th Annual International Symposium on Personal, Indoor, and Mobile Radio Communication (PIMRC), Washington, DC, USA, 2–5 September 2014; pp. 1631–1636. [Google Scholar] [CrossRef]
- Soesilo, D.; Meier, P.; Lessard-Fontaine, A.; Du Plessis, J.; Stuhlberger, C.; Fabbroni, V. Drones in Humanitarian Action. A Guide to the Use of Airborne Systems in Humanitarian Crises; FSD Report; Swiss Foundation for Mine Action: Geneva, Switzerland, 2017; pp. 23–34. Available online: https://irevolution.files.wordpress.com/2011/07/drones-in-humanitarian-actionemail.pdf (accessed on 28 May 2020).
- Back to the Future: Drones in Humanitarian Action. Available online: https://blog.werobotics.org/2019/11/12/back-to-the-future-drones-in-humanitarian-action/ (accessed on 1 March 2020).
- Laing, R.; Leon, M.; Mahdjoubi, L.; Scott, J. Integrating Rapid 3D Data Collection Techniques to Support BIM Design Decision Making. Procedia Environ. Sci. 2014, 22, 120–130. [Google Scholar] [CrossRef] [Green Version]
- Verykokou, S.; Doulamis, A.; Athanasiou, G.; Ioannidis, C.; Amditis, A. UAV-based 3D modelling of disaster scenes for Urban Search and Rescue. In Proceedings of the 2016 IEEE International Conference on Imaging Systems and Techniques (IST), Chania, Greece, 4–6 October 2016; pp. 106–111. [Google Scholar]
- Craig, B.; Hannum, K. Experimental and quasi-experimental evaluation. In The Handbook of Leadership Development Evaluation; Hannum, K., Martineau, J.W., Reinelt, C., Eds.; The Center for Creative Leadership Handbook of Coaching in Organizations: Greensboro, NC, USA, 2015; pp. 19–47. [Google Scholar]
- Price, P.C. Quasi-Experimental Research. In Research Methods of Psychology; Price, P.C., Jhangiani, R.S., Chiang, I.A., Eds.; The Saylor Foundation: Washington, DC, USA, 2015; pp. 125–142. Available online: https://opentextbc.ca/researchmethods/ (accessed on 26 February 2020).
- Cook, T.D.; Campbell, D.T. Quasi-Experimentation: Design & Analysis Issues in Field Settings; Houghton Mifflin: Boston, MA, USA, 1979; pp. 43–88. [Google Scholar]
- Schröter, E.; Kiefl, R.; Neidhardt, E.; Gurczik, G.; Dalaff, C.; Lechner, K. Trialing Innovative Technologies in Crisis Management—“Airborne and Terrestrial Situational Awareness” as Support Tool in Flood Response. Appl. Sci. 2020, 10, 3743. [Google Scholar] [CrossRef]
- DRIVER+ Project Summary of Trial Poland. Available online: https://www.driver-project.eu/events-old/trials/trial-1/ (accessed on 1 June 2020).
- Google Map. Available online: https://www.google.pl/maps (accessed on 30 January 2020).
- Stufflebeam, D.L.; Zhang, G. The CIPP Evaluation Model: How to Evaluate for Improvement and Accountability; The Guilford Press: New York, NY, USA, 2017; pp. 20–56. [Google Scholar]
- Jamieson, S. Likert scales: How to (ab)use them. Med. Educ. 2004, 38, 1217–1218. [Google Scholar] [CrossRef] [PubMed]
- McLeod, S.A. Likert Scale. Simply Psychology. Available online: https://www.simplypsychology.org/likert-scale.html (accessed on 3 January 2020).
Figure 1.
Aerial reconnaissance in disasters—decision making process flow: (a) baseline protocol, control test; (b) innovation line protocol, research test.
Figure 1.
Aerial reconnaissance in disasters—decision making process flow: (a) baseline protocol, control test; (b) innovation line protocol, research test.

Figure 2.
Reference data overview: (a) Distribution of colored sheets at the trial area; (b) River port entry simulating the levee collapse caused by the flood pressure [46].
Figure 2.
Reference data overview: (a) Distribution of colored sheets at the trial area; (b) River port entry simulating the levee collapse caused by the flood pressure [46].

Figure 3.
Practitioners’ perception of the solution: average results.


Table 1.
Data collection plan.
| Session | Scenario | Task | Indicator (KPI) |
|---|---|---|---|
| Needs assessment | An area of about 30 hectares is flooded. In the flooded buildings there are still people trapped who require urgent evacuation and other assistance. Therefore, to signal their required individual need they must hang colored flags/sheets on the windows, balconies and roofs of the flooded buildings. | Identify the colored sheets (control group with pictures + two-dimensional footage; research group with three-dimensional model + orthophoto map). | KPI 1—time required to make decision on number, locations and colors of sheets. KPI 2—the accuracy of the decision determined as an error in identified sheets. |
| Damage assessment | The pressure of the flood water weakens and softens levees. Urgent: A new breach has formed in the levee through which a significant amount of water is spreading in an uncontrolled manner. Since the levees are saturated, there is no precise way of measuring the size of the opening from the land. The collapsed section of the levee is only accessible from the air. | Assess the flood breakage size. Information needed for further outflow dynamics calculation. | KPI 3—time required to assess the size of the levee collapse. KPI 4—accuracy determined as a difference between assessed opening size and the real/measured width. |
Table 2.
Average time of decision making process in needs reconnaissance session.
| Type of Teams | Drone Flight | Data Processing | Decision Making Including Data Analysis | Total Decision Making Process | Time Difference | Approximate Total Decision Making When Using the Solution at the Disaster Site | Approximate Time Difference When Using the Solution at the Disaster Site |
|---|---|---|---|---|---|---|---|
| Control | 13 min. | 1 min. | 39 min. | 53 min. | 53 min. | ||
| Research | 82 min. | 30 min. | 125 min. | +72 min. | 75 min. | +22 min. |
Table 3.
Accuracy of the needs identification.
| Type of Need | Type of Teams | Correctly Identified Needs (Location and Color) Number of Sheets/Percentage in Relation to the “ground truth” | Incorrectly Identified Needs | |
|---|---|---|---|---|
| Identifying Incorrect Locations | Locations Missed, not Identified | |||
| Evacuation | Control | 4.7/58%1 | 0/0% | 3.3/42%1 |
| Research | 4.2/60%1 | 2/29%1 | 2.8/40%1 | |
| Water and food | Control | 5/83% | 0/0% | 1/17% |
| Research | 3.2/53% | 0/0% | 2.8/47% | |
| Medical assistance | Control | 5/100% | 0/0% | 0/0% |
| Research | 4.2/91%1 | 0.4/9%1 | 0.4/9%1 | |
| TOTAL | Control | 14.7/77% | 0/0% | 4.3/23% |
| Research | 11.6/66%1 | 2.4/14%1 | 6/34%1 | |
1 Percentage results do not total 100% due to instances of identifying a need in a location where there was no sheet (e.g., the practitioners indicated a location misled by sun reflection on a window with white sheeting).
Table 4.
Average time of decision making process in damage assessment session.
| Type of Teams | Drone Flight | Data Processing | Decision Making Including Data Analysis | Total Decision Making Process | Time Difference | Approximate Total Decision Making Time When Using the Solution on the Disaster Site | Approximate Time Difference When Using the Solution on the Disaster Site |
|---|---|---|---|---|---|---|---|
| Control | 15 min. | 1 min. | 14 min. | 30 min. | 53 min. | ||
| Research | 91 min. | 10 min. | 116 min. | +86 min. | 66 min. | +13 min. |
Table 5.
Average assessment results of the size of the dike breakage.
| Type of Teams | Size of the Breakage (“ground truth”) | Average Estimation (min-max) |
|---|---|---|
| Control | 23.4 m | 18.3 m–22.7 m1 |
| Research | 21.9 m–23.8 m1 |
1 In some cases the practitioners have not given the exact width of the opening size, estimating only an interval between the minimum and maximum size observed.
Table 6.
Practitioners’ and observers’ perceptions of the solution’s performance.
| Criterion | Role in the Trial | Average Score |
|---|---|---|
| The solution supports: | ||
| preparation of a comprehensive overview of the situation | Practitioners | +1.15 |
| Observers | +1.17 | |
| decision making | Practitioners | +1.00 |
| Observers | +0.80 |
Table 7.
Average perception of the testing conditions.
| Criterion | Role in the Trial | Average Score |
|---|---|---|
| Sufficient number of practitioners to test the solution | Practitioners | +0.83 |
| Observers | +1.67 | |
| The practitioners’ proficiency in testing the solution | Practitioners | +1.00 |
| Observers | +1.67 | |
| Sufficient training on the solution before the trial | Practitioners | +0.89 |
| Observers | +1.50 | |
| Trial technical set up clarity | Practitioners | +0.83 |
| Observers | +1.50 | |
| Trial organizational set up clarity | Practitioners | +1.28 |
| Observers | +1.67 | |
| Scenario clarity | Practitioners | +1.11 |
| Observers | +1.67 |
© 2020 by the author. Licensee MDPI, Basel, Switzerland. This article is an open access article distributed under the terms and conditions of the Creative Commons Attribution (CC BY) license (http://creativecommons.org/licenses/by/4.0/).
Share and Cite
MDPI and ACS Style
Zwęgliński, T. The Use of Drones in Disaster Aerial Needs Reconnaissance and Damage Assessment – Three-Dimensional Modeling and Orthophoto Map Study. Sustainability 2020, 12, 6080. https://0-doi-org.brum.beds.ac.uk/10.3390/su12156080
AMA Style
Zwęgliński T. The Use of Drones in Disaster Aerial Needs Reconnaissance and Damage Assessment – Three-Dimensional Modeling and Orthophoto Map Study. Sustainability. 2020; 12(15):6080. https://0-doi-org.brum.beds.ac.uk/10.3390/su12156080
Chicago/Turabian StyleZwęgliński, Tomasz. 2020. "The Use of Drones in Disaster Aerial Needs Reconnaissance and Damage Assessment – Three-Dimensional Modeling and Orthophoto Map Study" Sustainability 12, no. 15: 6080. https://0-doi-org.brum.beds.ac.uk/10.3390/su12156080
Note that from the first issue of 2016, this journal uses article numbers instead of page numbers. See further details here.