Article

Developing UAV-Based Forest Spatial Information and Evaluation Technology for Efficient Forest Management

1
Department of Environmental Science and Ecological Engineering, Korea University, Seoul 02841, Korea
2
Environmental GIS/RS Center, Korea University, Seoul 02841, Korea
3
Geomatics Research Institute, Saehan Aero Survey Co., Ltd., Seoul 07265, Korea
*
Author to whom correspondence should be addressed.
Sustainability 2020, 12(23), 10150; https://0-doi-org.brum.beds.ac.uk/10.3390/su122310150
Submission received: 20 October 2020 / Revised: 30 November 2020 / Accepted: 1 December 2020 / Published: 4 December 2020

Abstract

:
Forest spatial information is regularly established and managed as basic data for national forest planning and forest policy establishment. Among them, the grade of vegetation conservation shall be investigated and evaluated according to the value of vegetation conservation. As the collection of field data over large or remote areas is difficult, unmanned aerial vehicles (UAVs) are increasingly being used for this purpose. Consequently, there is a need for research on UAV-monitoring and three-dimensional (3D) image generation techniques. In this study, a new method that can efficiently collect and analyze UAV spatial data to survey and assess forests was developed. Both UAV-based and LiDAR imaging methods were evaluated in conjunction with the ground control point measurement method for forest surveys. In addition, by fusing the field survey database of each target site and the UAV optical and LiDAR images, the Gongju, Samcheok, and Seogwipo regions were analyzed based on deep learning. The kappa value showed 0.59, 0.47, and 0.78 accuracy for each of the sites in terms of vegetation type (artificial or natural), and 0.68, 0.53, and 0.62 accuracy in terms of vegetation layer structure. The results of comparative analysis with ecological natural maps by establishing vegetation conservation levels show that about 83.9% of the areas are consistent. The findings verified the applicability of this UAV-based approach for the construction of geospatial information on forests. The proposed method can be useful for improving the efficiency of the Vegetation Conservation Classification system and for conducting high-resolution monitoring in forests worldwide.

1. Introduction

Green infrastructure is receiving attention as an effective means to mitigate the consequences of climate change [1]. Green infrastructure raises the quality of human life and provides ecological services within parks, forests, wetlands, and greenbelt areas. Thus, green infrastructure has become a topic of interest among scientists, politicians, and practitioners [2,3,4,5,6]. Forest ecosystems, which are a crucial part of the green infrastructure within a region, can lower air temperatures, prevent landslides, and help to mitigate climate change through carbon storage [7]. Establishing species and forest information so that these various functions of forest ecosystem can be harmonized, and monitoring the process of change can be seen as a basic task for forest management [8]. In South Korea, a Vegetation Conservation Classification system is used to carry out forest surveys and assessments with geospatial information. Vegetation conservation classification assesses the integrity of vegetation structure, vegetation type, diameter at breast height (DBH) of artificial forests, and rarely distributed species [9]. As field surveys of the entire area of South Korea are not feasible, sample surveys are performed and satellite imagery is used [10]. While satellite images have allowed for a high spatial coverage, these data are not well suited for the monitoring of local areas. The use of satellite data is also constrained by the revisit cycle.
The National Ecosystem Survey determines grades for the Vegetation Conservation Classification system by applying criteria such as the plant colony distribution patterns, plant species compositions, and vegetation structure (stratification), and more broadly, the type of vegetation (natural/artificial forest) and vegetation stratification. South Korea has conducted extensive research on remote techniques that can be used to evaluate the horizontal structure such as the vegetation distribution, but limited research has been conducted on remote techniques that can be used to obtain vertical forest data such as the vegetation stratification [11]. Current active remote sensing technologies such as LiDAR have the potential to be used for the construction of the three-dimensional (3D) forest structure [12,13,14,15,16,17,18]. Notably, airplane-borne LiDAR systems have been used successfully in forested areas [19]. However, there are differences, such as those in resolution, accuracy, and frequency, on top of the cost being very high.
Unmanned aerial vehicles (UAVs), which allow for efficient take-off and landing, were first developed and used mainly for military purposes such as reconnaissance and targeting. Currently, as vehicles have become smaller and lighter and various sensors have been developed, their scope of application has expanded to include various fields such as agriculture, telecommunications, weather observations, personal photography, and even disaster management [20]. UAV systems currently represent a low-cost in comparison to aircrafts, an agile and autonomous opportunity for various fields, and these systems may be useful as an alternative to satellites and aircrafts for forest inventory determination [14,21]. Moreover, as UAV system-based spatial data acquisition and analysis procedures have become more advanced, related research and business applications have become more common [22,23,24,25,26]. Previously, UAV-optical sensors were frequently installed, but following the recent development in UAV-based LiDAR sensors, it has become possible to construct forest point clouds on a small budget [14]. UAVs are advantageous due to their (a) spatial resolution, which offers a solution for local scale analysis at the level of individual trees [27]; and (b) temporal resolution where rapid deployment is crucial [28,29]. Miniaturized UAV-specific sensors thus represent a state-of-the-art solution for many recent environmental applications [28] and for deriving forestry parameters [30,31]. In South Korea, a forest resource information database was designed using drone-based images [32]. The vegetation layer was analyzed using UAV-LiDAR based on deep learning [11]. For this reason, UAVs are now being widely used in various forestry works such as small-scale forest resource surveys [33,34,35], large-scale forest surveys [36], forest pest damage monitoring [26,37,38,39,40], and even wildfire monitoring [41,42].
In this study, we first established accurate and up-to-date horizontal and vertical vegetation information of forests through UAV-based optics and LiDAR sensor-specific imaging and analysis. Secondly, the field survey data were established, some areas were trained by applying the Artificial Neural Networks (ANNs) technique, and the rest were divided into test and verification areas to analyze vegetation types and vegetation structures. Finally, by analyzing and verifying the classification of vegetation conservation, we aimed to develop effective vegetation protection grade determination technology based on drones.

2. Study Area and Materials

2.1. Study Areas

By focusing on nationwide climate zones and the vegetation distribution in South Korea, this study first selected target areas representing the eastern, western, and southern regions. The Gongju area has a continental climate, the Samcheok area has an oceanic climate, and the Seogwipo area has a temperate monsoon climate. Then, through preliminary site surveys, the study areas were narrowed down to forest areas of approximately 1 km2 that would allow for convenient UAV access and image recording. Subsequently, three areas were selected as the final study areas: [80 San, Boheung-li, Woseng-myeon, Gongju-si, Chungcheongnam-do], [43 San, Deuksan-li, Geunduk-myeon, Samcheok-si, Gangwon-do], and [10 San, Harye-li, Namwon-eup, Seogwipo-si, Jeju-do] (Figure 1). The study areas contained diverse vegetation and forest structures as well as abundant grasslands and shrubs, and these areas were chosen to establish a diverse geospatial vegetation database on forests in South Korea. According to the forest map, it can be determined that the main species are Quercus variabilis in Gongju, Pinus densiflor in Samcheok, and Cryptomeria sp in Seogwipo. (see Figure 2).

2.2. UAV Data Collection

The UAVs can be divided broadly into fixed-wing and rotary-wing UAVs. As different types feature different payloads, the weights of the sensors that could be installed had to be considered when choosing the vehicle. As sufficient space for take-off and landing was not available over the forests, this study selected a fixed-wing (vertical take-off) vehicle for optical imaging, and a rotary-ring vehicle was selected for LiDAR imaging, as it featured sufficient payloads given the weight of the LiDAR sensor (Table 1). Additionally, GNSS/INS (Global Navigation Satellite System/Inertial Navigation System) was used to ensure the stable flight of the UAVs and acquire the location data for the recorded images. As UAVs are unable to carry heavy sensors that are used in conventional manned aerial photogrammetric surveys, lightweight MEMS (microelectromechanical systems)-based sensors were used.
In accordance with Article 10 (GCP Measurement Method) of “Guidelines for Public Survey Work Using UAVs,” [43] ground control points (GCPs) were created and installed in black and white colors that could easily be distinguished from surroundings. Finally, the mission was designed by setting the flight height, overlap, and other parameters in consideration of the terrain, ground altitude, and obstacles (e.g., transmission towers, utility poles, and high-rise buildings) along the flight path (Figure 3 and Figure 4). The take-off, landing, and flight path were configured by evaluating the weather in the study areas, the vehicle battery efficiency, and stability, which were identified in advance. Unlike optical image-recording that is carried out at the same height, UAV-LiDAR imaging requires the employment of a terrain-follow method because of the limited LiDAR range and for maintaining a specified number of points that reach the ground [20]. Accordingly, this study arranged the flight plan by using terrain data from Google Earth and Digital Surface Model (DSM) data generated through the UAV-optical imaging of the study areas to obtain information on the topography. UAV image processing software <Photo Scan> is used. It is performed by computer vision methods using automatic image matching technology. The SIFT (Scale-Invariant Feature Transform) algorithm is used to match the image with the feature point extraction method. Point cloud and DSM are created through SfM (Structure form Motion) method. Furthermore, the acquisition of high-accuracy and high-resolution orthophotographs with outstanding quality requires that multiple factors such as the weather factors and solar elevation angle are taken into account while deciding the best time for recording. In this research, the crown density according to the time series of forest trees and the penetration of the LiDAR points served as decisive factors. The first recording of images was conducted between September and October of 2019, and the second recording was performed between November and December.

2.3. Field Survey Data for Learning and Verification

In the forest vegetation survey, we applied the vegetation evaluation technique and criteria as set by the National Institute of Environmental Research (2012). The structure, geography, ecology, and movements of the vegetation colony occupying the space were assessed in view of the origins of the vegetation colony, the rarity in distribution, the restoration of the vegetation (historicity that reflects resilience), and the major species present. By considering the major types of vegetation in each area, a total of nine, five, and six quadrats (20 m × 20 m) were installed in Gongju, Samcheok, and Seogwipo, respectively, and in consideration of the vegetation changes, precise actual vegetation mapping was performed twice, namely, in summer (May, June, and July) and winter (November and December) to construct a database (Figure 5). The survey showed that Gongju registered a high concentration of trees that included Quercus variabilis, Quercus acutissima, Pinus rigida, and Larix kaempferi. The floral survey identified 10 orders, 16 families, 21 genera, and 28 species. The age class is 3,4 class, and the area of the 2, 3, 4 layer of the vegetation structure was investigated. In Samcheok, a total of five types of vegetation were observed, with a high distribution of individual trees consisting of Pinus densiflora and Pinus thunbergii. Here, the floral survey identified 12 orders, 15 families, 18 genera, and 25 species. The age class is 2,3 class, and the area of the 2, 3 layer of the vegetation structure was investigated. In Seogwipo, a total of eight types of vegetation were found, with a high distribution of trees including Cryptomeria sp. and Pinus thunbergii. Here, the floral survey identified 14 orders, 16 families, 16 genera, and 17 species. The age class is 3,4 class, and the area of the 4 layer of the vegetation structure was investigated.

3. Methods

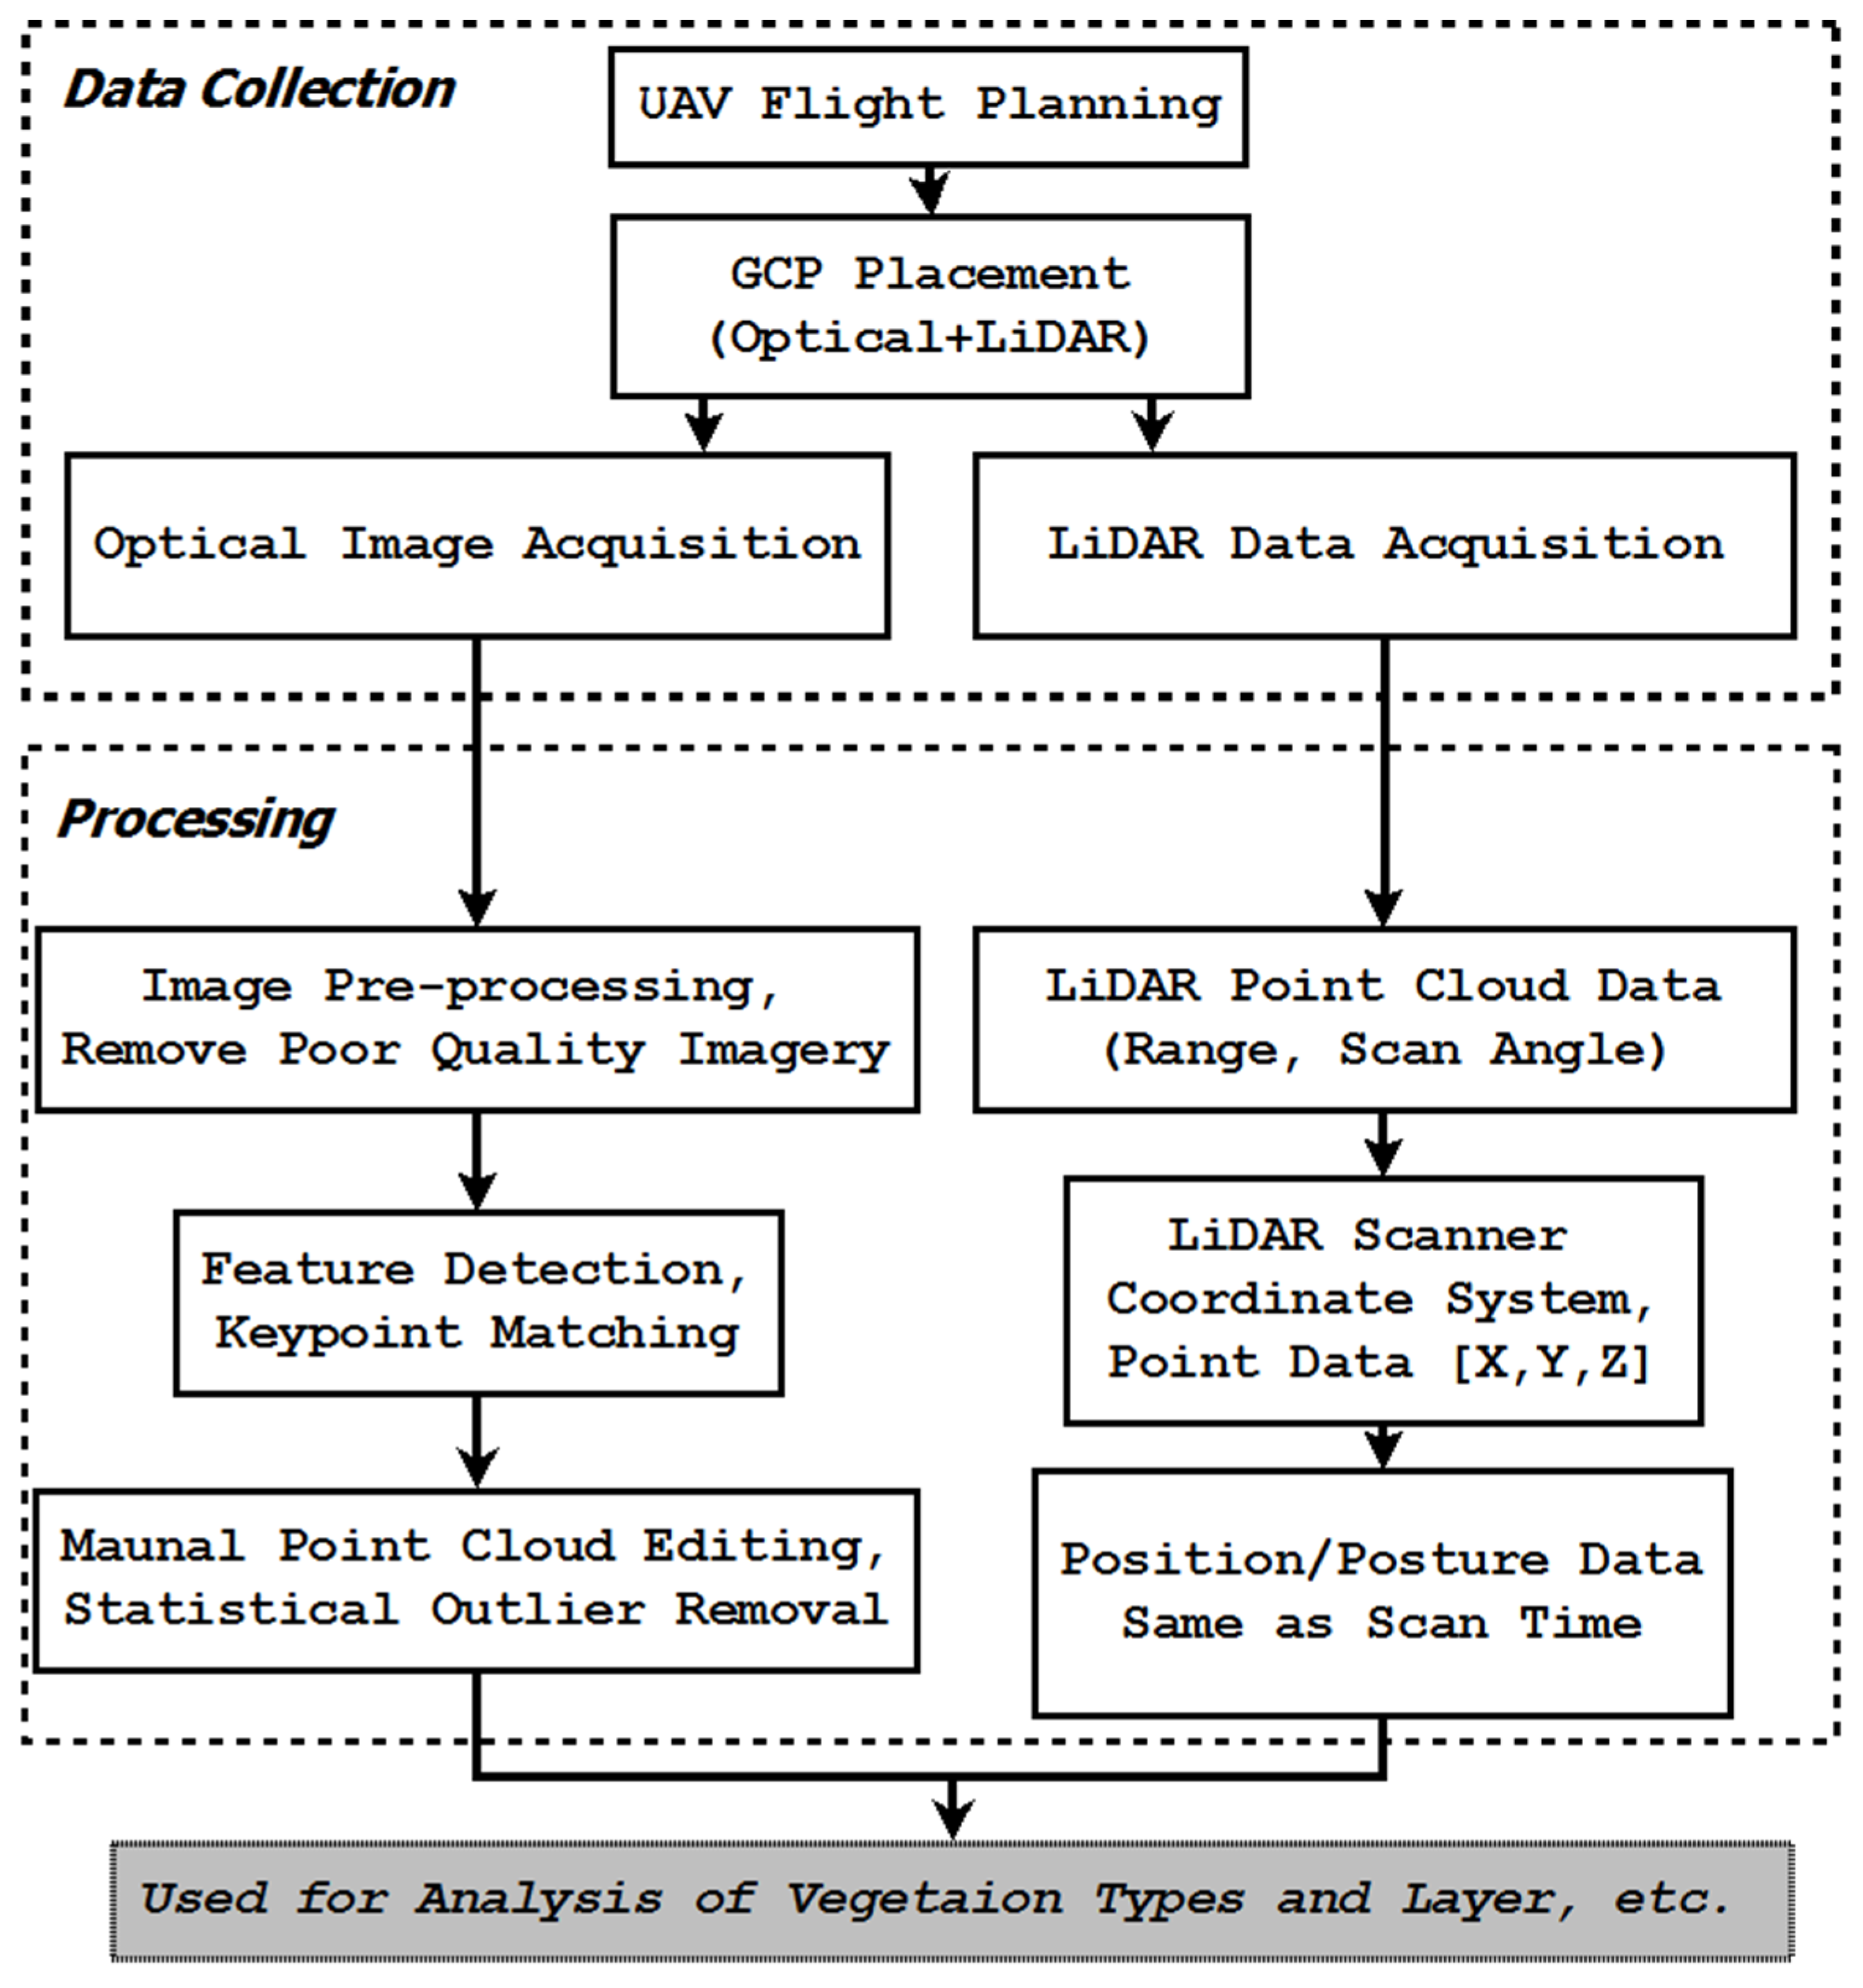
3.1. Construction of the UAV-Optical Image and UAV-LiDAR Data

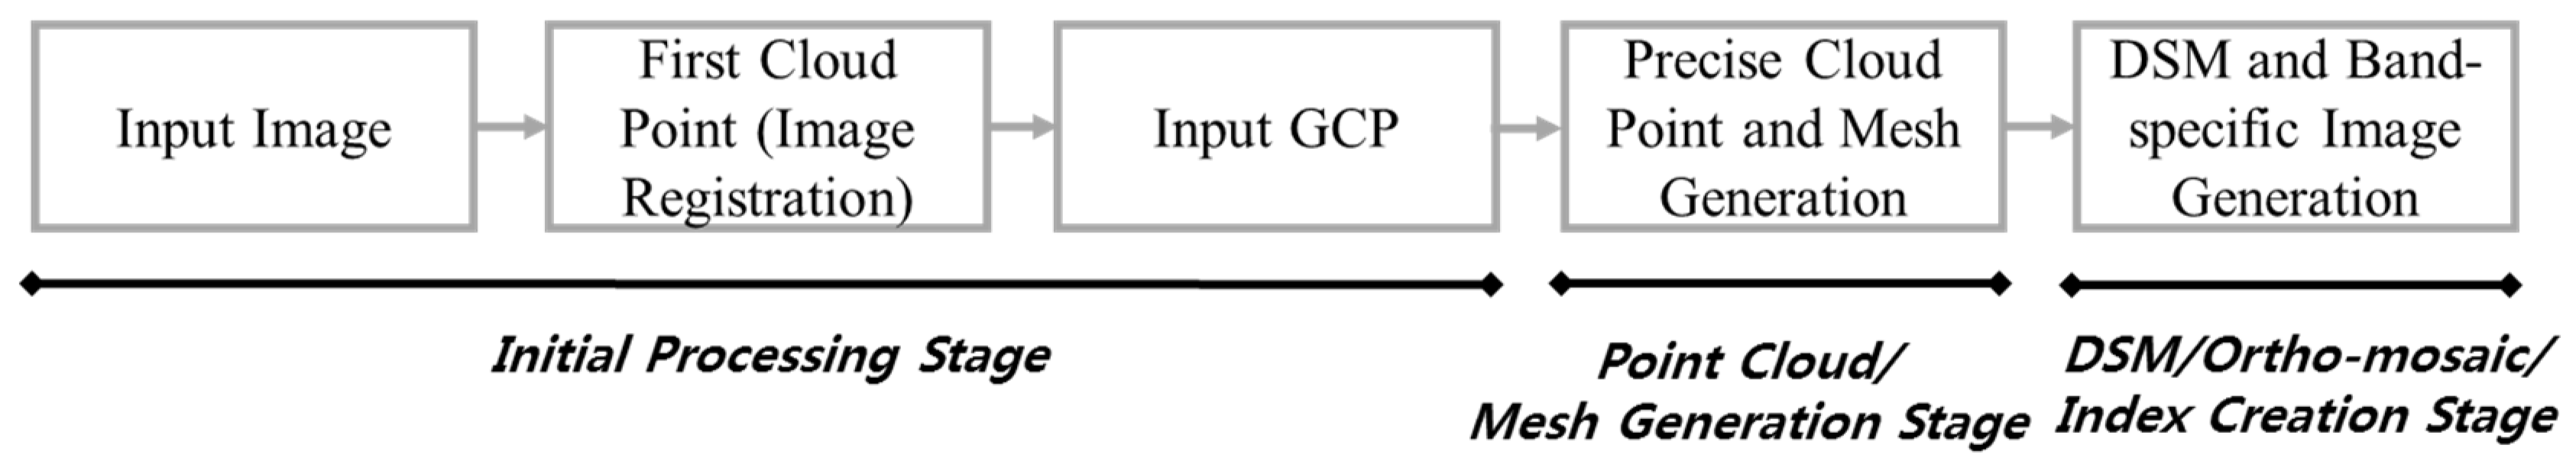
3.1.1. Construction of the UAV-Optical Image Data

In order to construct the UAV optical image, the commercial software <PhotoScan> for UAV image processing is used. The construction of the UAV-optical image data first involved the search for candidate characteristics on various scales. Subsequently, characteristics were selected through assessments of their stability, and following the determination of correspondence among the characteristics of the images, geometric calibration was performed with AAT (Automatic Aerial Triangulation), which is the most suitable technique for UAV image registration [44]. After the image quality and output format were configured, the point cloud and mesh were generated through processing. Finally, the orthophotographs were collected for different study areas (Figure 6 and Figure 7).

3.1.2. Construction of the UAV-LiDAR Data

As for the UAV-LiDAR data, the data on the location and posture of the UAV platform that were provided by GNSS/INS were combined with the distance data as acquired from LiDAR. Georeferencing was performed by calculating the 3D coordinates for the positions from which the laser beam was reflected, based on the ground coordinate system, using the equation shown below. The obtained data were made up of points. A text file with horizontal (X,Y) position, vertical (Z, Orthometric height) position and reflection intensity was saved and analyzed. The point cloud is created based on the TM coordinate system used in the national base map. In this study, TILab’s TLmaker software was used to create a point cloud of LiDAR data. These data were transformed into DSM data and Digital Terrain Data (DTD) that could be used to classify the trees and ground surface areas (Figure 8).
[ X L o c a l Y L o c a l Z L o c a l ] = [ X G I L o c a l Y G I L o c a l Z G I L o c a l ] + R G I L o c a l [ R L G I [ ( ρ + Δ ρ ) + sin θ 0 ( ρ + Δ ρ ) + cos θ ] + [ X L G I Y L G I Z L G I ] ]
X l o c a l Y l o c a l Z l o c a l : Ground coordinate system, X G I Y G I Z G I : GPS/INS coordinate system. R G I L o c a l : Rotation matrix converting from GPS/INS coordinate system to ground coordinate system. R L G I : Rotation matrix converting from sensor coordinate system to GPS/INS coordinate system, θ : Scanning angle.

3.2. Usage and Analysis of UAVs in Determining Grades for the Vegetation Conservation Classification

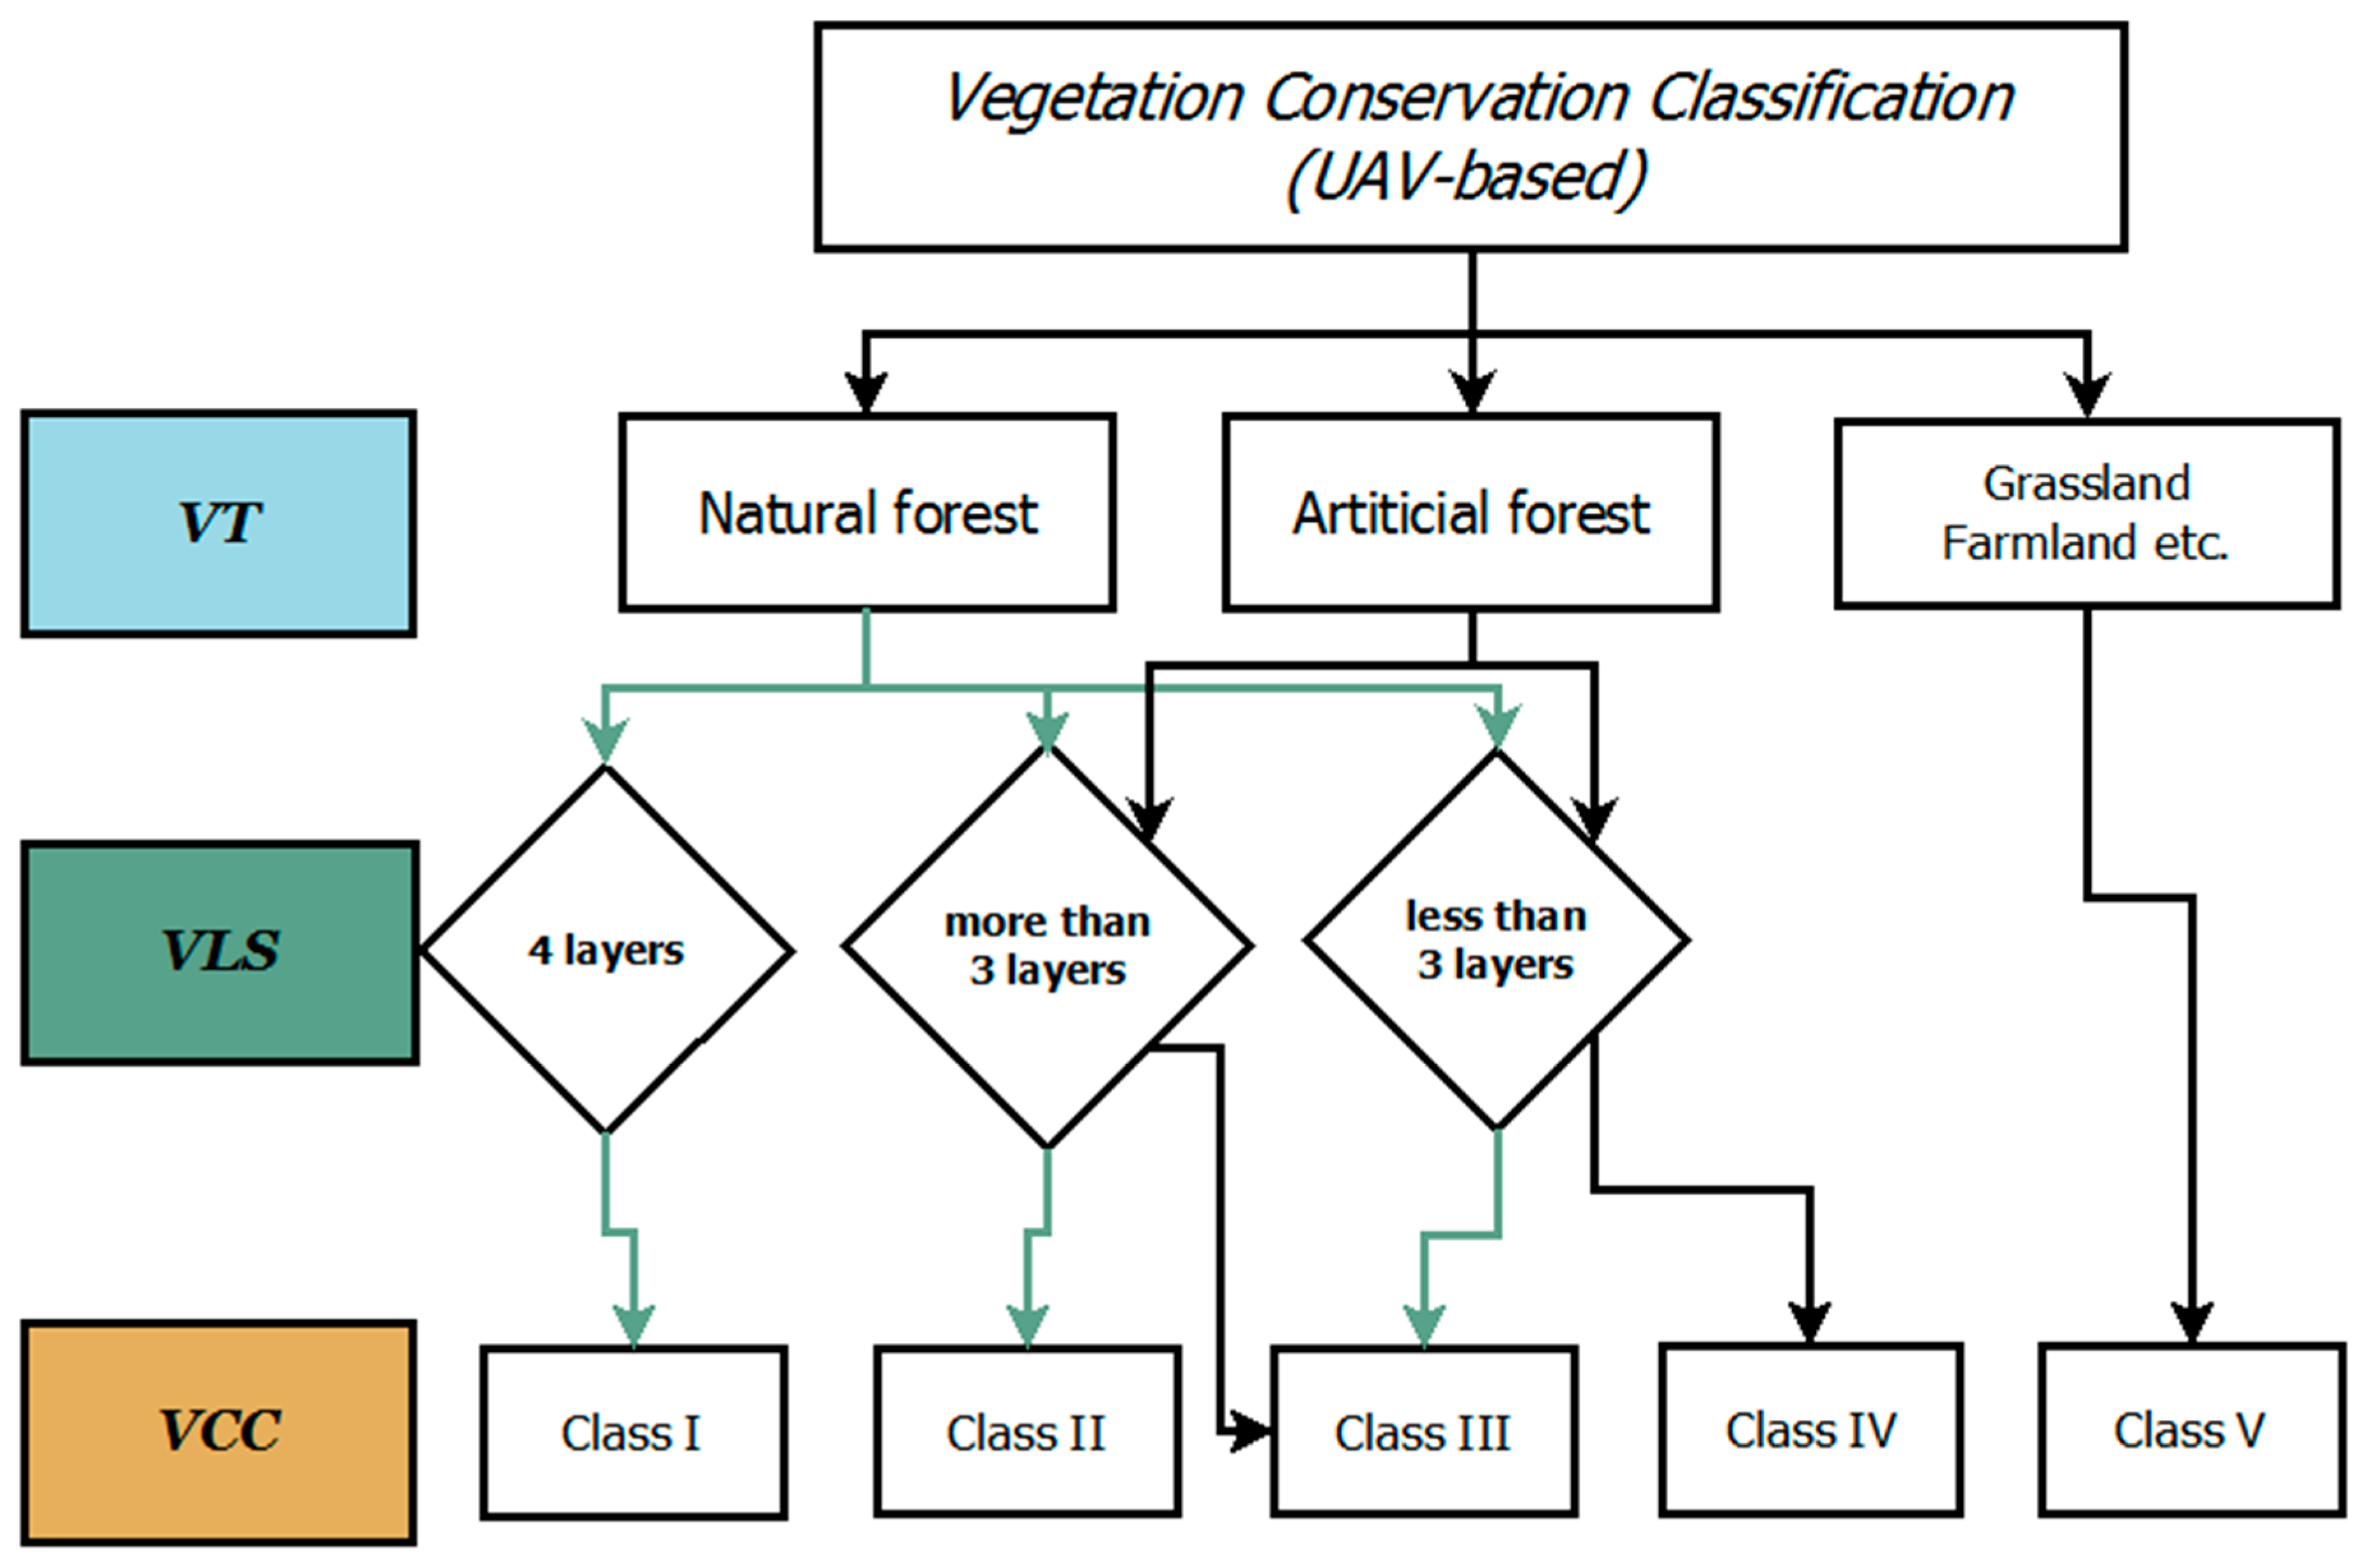
3.2.1. Usage in Determining Grades for the Vegetation Conservation Classification

Assessments for the Vegetation Conservation Classification system in Korea, which form an important part of the National Ecosystem Survey, require evaluations of the distribution pattern of plant colonies, plant species composition, and vegetation structure (stratification), as well as data on the diameter at breast height (DBH) for forest plantations. Stable forest vegetation has a four-layer structure vertically and is rated high if the colony’s hierarchy and stratification remain intact from the perspective of conservation ecology. The existing criteria for the Vegetation Conservation Classification system involve broad criteria such as the vegetation classification (natural/artificial forest) and vegetation stratification (Table 2).
Unlike natural forests that register a vertical structure composed of various tree varieties, artificial forests have one or two layers with trees of the same variety. Based on such characteristics, the UAV-based data were used to identify the vegetation stratification. To determine the presence or absence of vegetation, NDVI is used for analysis. In addition, in order to determine the presence/absence of a layer based on the height of the vegetation, the Voxel concept is used to collect the number of points in the grid for each 0.5 m height unit. By choosing 10 m × 10 m as the basic classification unit, effective vegetation conservation classification was carried out.

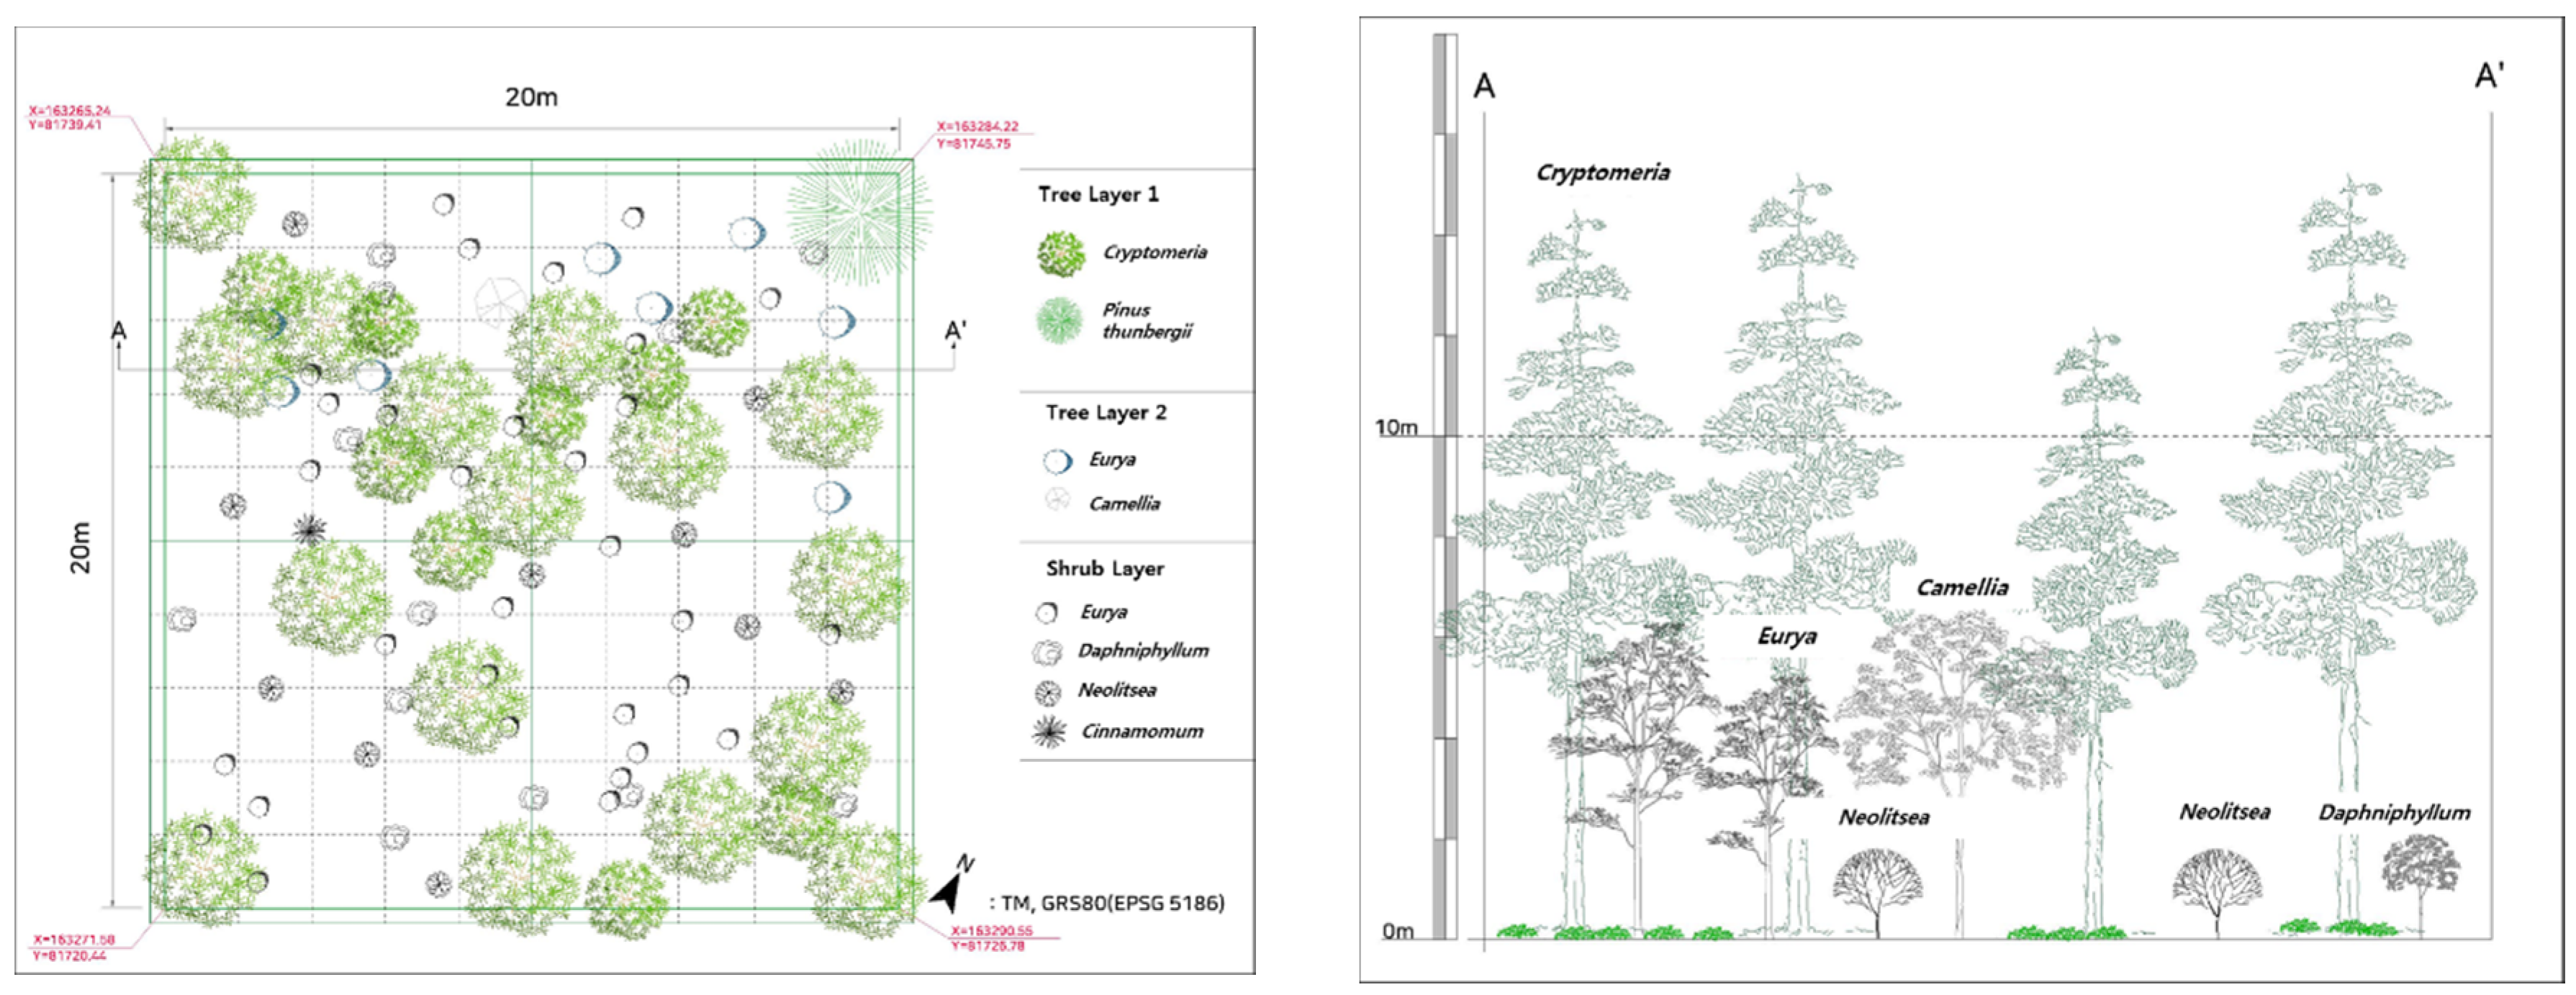
3.2.2. Analysis of the Vegetation Types and Stratification in the Study Areas

(1) Based on the spectroscopic characteristics of the vegetation, as shown in the optical images, and the shapes of individual trees, as found in the LiDAR data, the types of vegetation were identified with a CNN (convolutional neural network) and NN (neural network) [11], which are deep-learning techniques specialized for image processing. To develop and test the model, 10 m × 10 m grids were selected through random sampling and were used as training (49%), validation (21%), and testing (30%) datasets. The data were trained by using NNs until the maximum performance was achieved with the validation data, and then, the test dataset was analyzed with the trained NN to perform the classification of the vegetation types (Figure 9).
(2) To evaluate the vegetation stratification using the UAV optical–LiDAR data, 10 m × 10 m grids were created by processing the LiDAR point cloud data for different areas. The number of points within a radius of 8 m from the center of each grid was searched, and by using the concept of sub-voxel processing, data were saved by each 0.5 m in height. The database constructed through site surveys was set as the true values for different layers (tree layer, understory, shrub layer, herb layer) in the different areas and was used to perform the quantitative analysis. Additionally, the random sampling technique was used to select datasets for training (49%), validation (21%), and testing (30%).

3.3. Development of the UAV Data-Based Evaluation Technique for the Vegetation Conservation Classification

In accordance with the existing criteria for the Vegetation Conservation Classification system, “the UAV Data-Based Evaluation Technique for the Vegetation Conservation Classification” was implemented with the following procedures. In the first phase, the collected optical images, LiDAR data, and the outcomes of vegetation classification (natural/artificial forest) were applied to classify the areas into types such as a natural forest, artificial forest, secondary grassland, and urban area. In the second phase, the vegetation stratification in the forests was classified by using disturbance information on a forest community, i.e., in a disturbed space, the individual trees or varieties that are first arrivals settle and grow to form a single-layer vertical structure within an even-aged forest. In the third phase, the above assessment criteria and results were applied to evaluate the Vegetation Conservation Classification (Figure 10).

4. Results and Discussion

4.1. Position Accuracy Verification between UAV-Optics and UAV-LiDAR

The optical images and LiDAR data were overlapped, and 10 similar points between the optical images (DSM) and LiDAR (point cloud) were randomly selected to test the relative accuracy of the horizontal and vertical positions. As a result, average errors for each area were derived as follows: Gongju (0.05 m horizontally and 0.36 m vertically), Samcheok (0.07 m horizontally and 0.19 m vertically), and Seogwipo (0.06 m horizontally and 0.32 m vertically). Characteristically for forest areas, larger errors occurred in some locations far from the GCPs as a consequence of the difficulty involved in the installation and distribution of GCPs. Overall, all areas maintained similar levels of accuracy (Table 3).

4.2. Results for the Analysis of the Vegetation Types and Stratification in the Study Areas

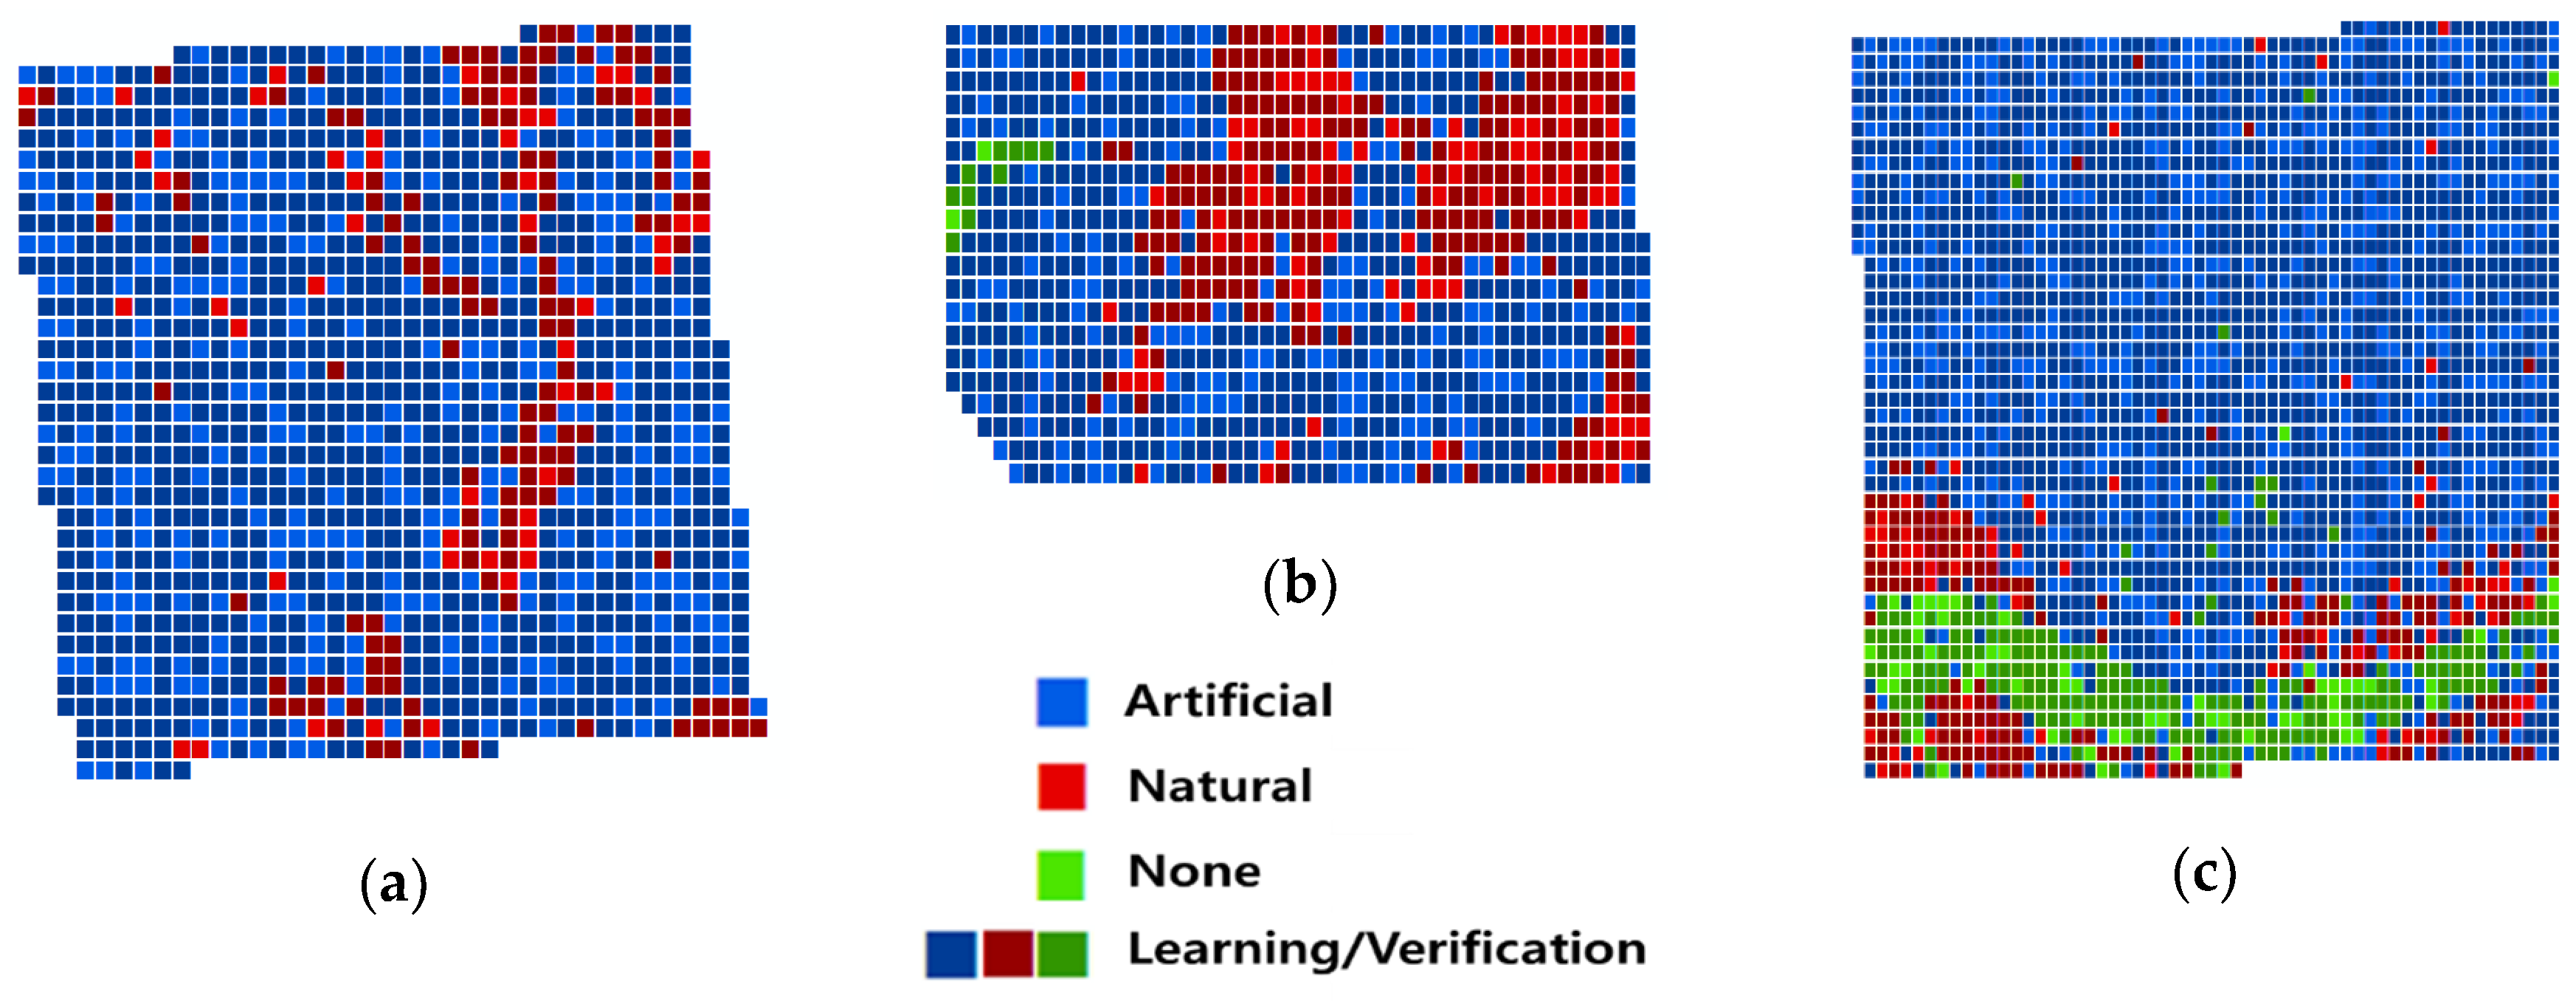
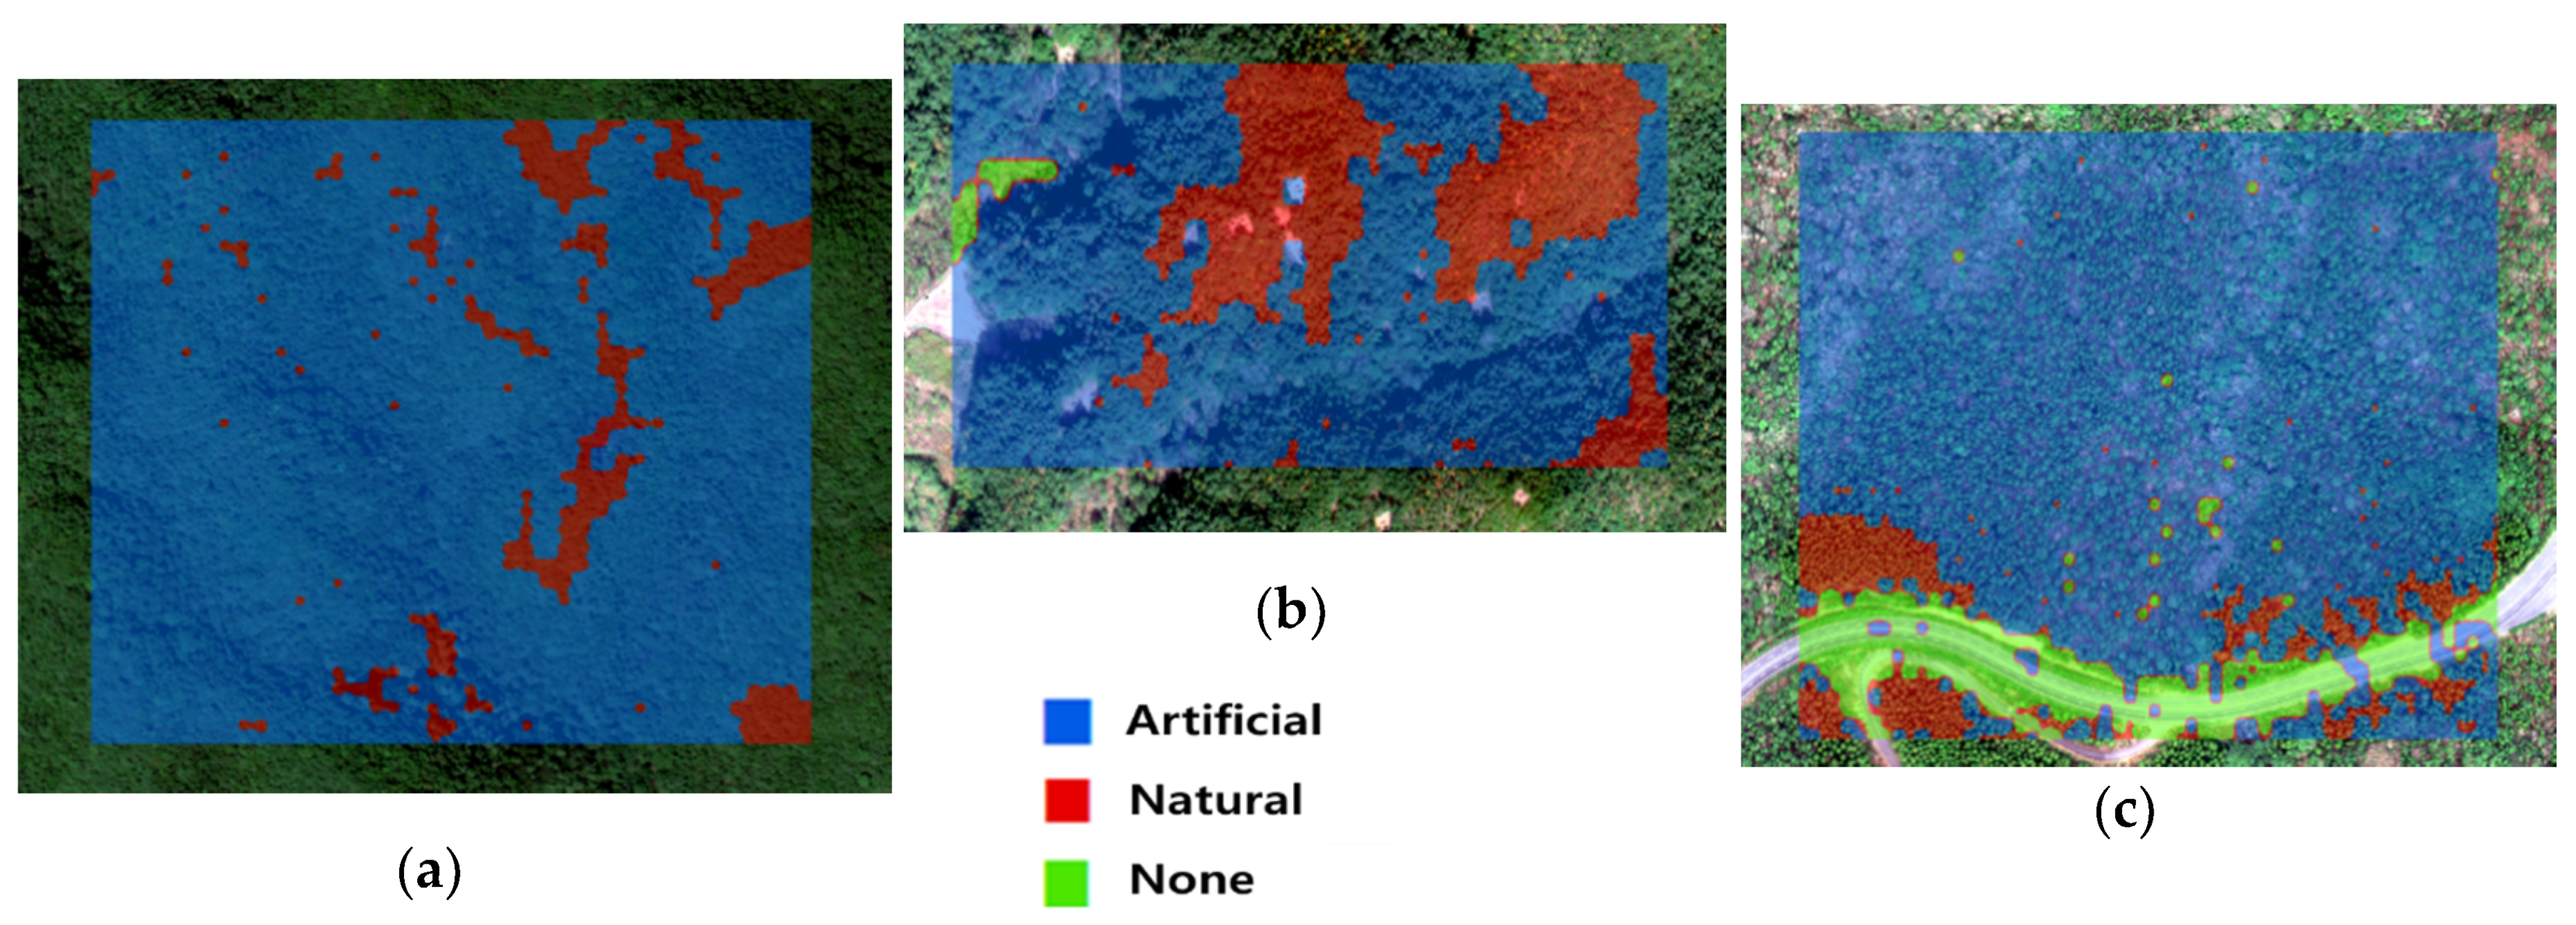
4.2.1. Results for the Analysis of the Vegetation Types (Natural/Artificial Forest)

The UAV-based optical images, LiDAR data, and CNN and NN results were used to classify and analyze the types of vegetation. The classification of the natural/artificial forests in Gongju yielded an accuracy of 89.67% and a kappa value of 0.59. These values of Samcheok were lower at an accuracy of 70.49% and kappa value of 0.47. The Kappa value obtained in the Samcheok area shows the chance of an accidental match. Such results were obtained because these site surveys focused on the classification of the natural/artificial forest habitat and did not consider all of the data available (e.g., locations of tombs) in the target area. Additionally, LiDAR points could not be effectively collected from the valleys because of terrain features, which presumably led to the compromised classification performance, and in turn, a lower accuracy. The classification of the vegetation types into natural/artificial forest in Seogwipo yielded an accuracy of 91.76% and kappa value of 0.78 (Figure 11). This area registered the highest accuracy for the classification of the vegetation types among the three study areas. It can be inferred that it was easier to classify the vegetation types in this area because of its gently sloped terrain and less dense vegetation compared to that of Gongju and Samcheok. Thus, the analysis indicated that the accuracy was higher in areas with less dense vegetation than in areas where denser vegetation was present. The results also indicated that the classification accuracy was higher in gentler terrain than on steep slopes because the LiDAR points could be more stably acquired in the former areas. Importantly, the findings suggest that the employment of CNN and NN algorithms is technically feasible for implementing classifications of vegetation types (natural/artificial forest).

4.2.2. Results for the Analysis of the Vegetation Stratification

The absence or presence of potential layers in the vegetation within the study areas was analyzed in accordance with the spectroscopic properties of the optical images and the distribution patterns of the LiDAR point data. The overlapped stratification is shown in the Figure 11. Some of the areas registered extremely wide or narrow layers (herb layer, shrub layer, understory, and tree layer); hence, the accuracy alone was deemed to be insufficient to achieve an objective performance assessment. Accordingly, the assessment of the models’ performances also incorporated Cohan’s kappa value that considers the possibility that the site survey and the model-based classification matched by chance. The analysis of all the layers in Gongju yielded an accuracy of 92.62% and a kappa value of 0.68. The analysis of all the layers in Samcheok yielded an accuracy of 92.32% and a kappa value of 0.53. The analysis of all the layers in Seogwipo yielded an accuracy of 86.00% and a kappa value of 0.62 (Figure 12).

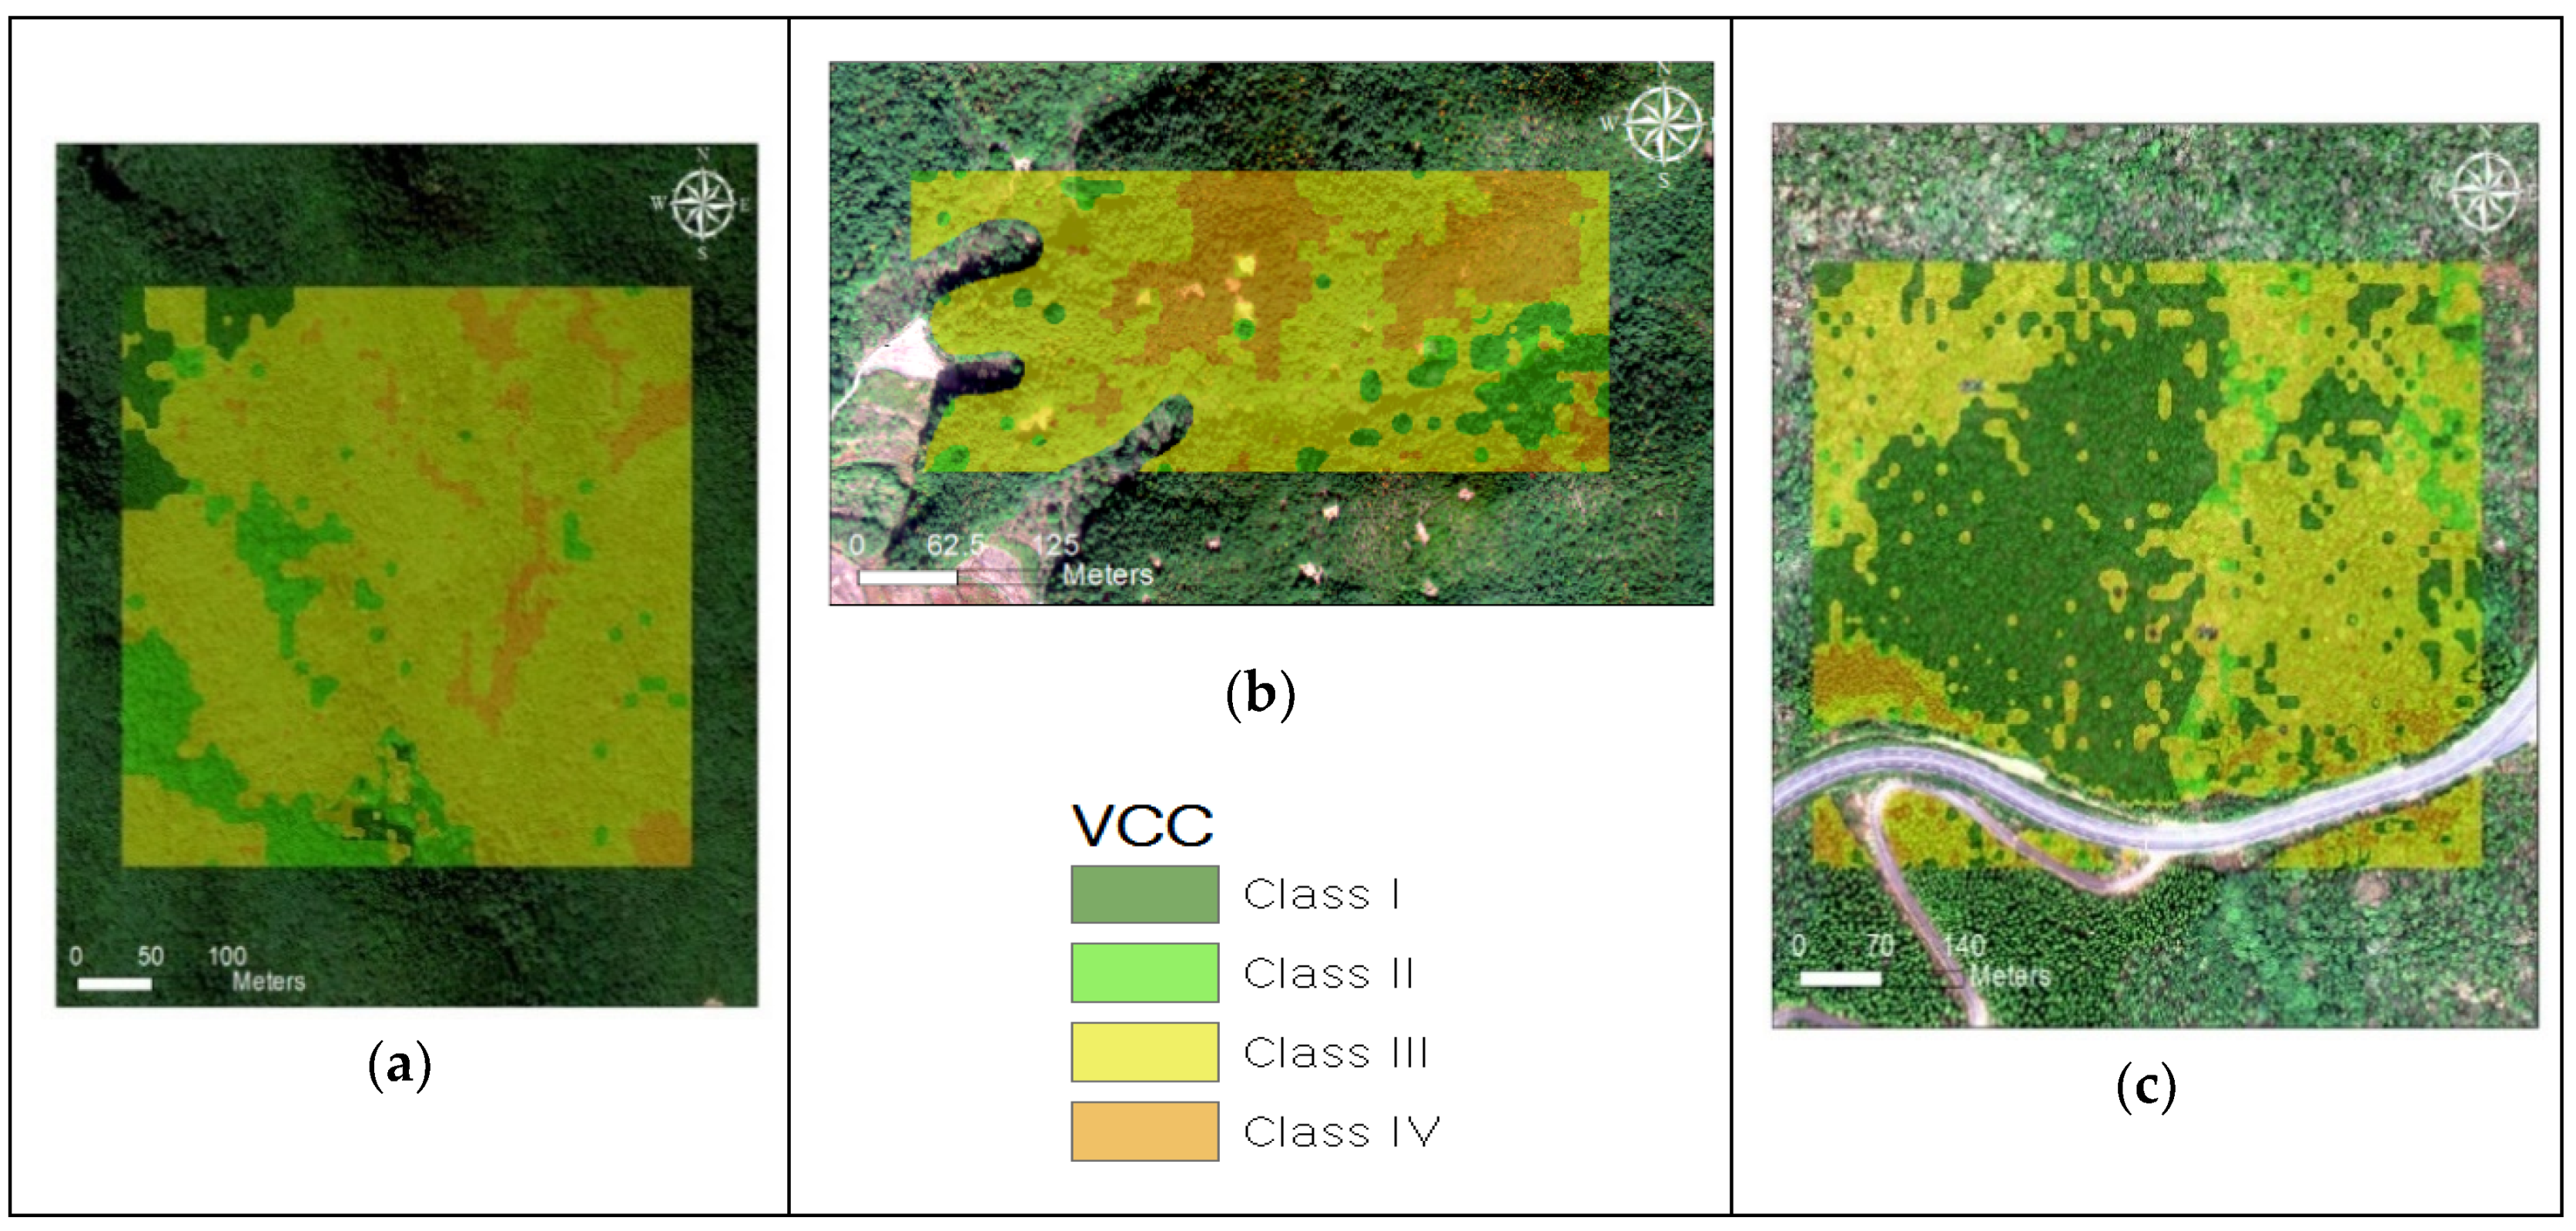
4.3. Results for the Analysis of the UAV-Based Vegetation Conservation Classification Evaluation Technique

By applying the criteria for the Vegetation Conservation Classification system to “the UAV Data-Based Evaluation Technique for the Vegetation Conservation Classification” that has been developed.
In the evaluation results for the study area in Gongju with the Vegetation Conservation Classification system, the Grade III area was the largest at 101,798 m2, followed by the Grade II area at 16,187 m2, Grade IV area at 10,300 m2, and Grade I area at 5446 m2. In the evaluation results for the study area in Samcheok, the Grade III area was the largest at 47,233 m2, followed by Grade IV area at 21,309 m2, Grade I area at 6500 m2, and Grade II area at 1784 m2. In the evaluation results for the study area in Seogwipo, the Grade III area was the largest at 108,867 m2. As this area characteristically covers primitive forests, the second largest distribution was the ecologically excellent Grade I at 91,591 m2, followed by Grade IV at 11,307 m2, and Grade II at 10,170 m2 (Figure 13, Table 4).

4.4. Comparison with the Ecological Zoning Map Grades

To test the results of the evaluation of the Vegetation Conservation Classification system, this study used an Ecological Zoning Map that has a high level of completeness in terms of legality and geospatial database construction. Articles 12 and 13 of Chapter 2 of the Ecological Zoning Map [45] Construction Guidelines state that the construction of Grade I on the Ecological Zoning Map should cover areas that fall under Grades I and II of the Vegetation Conservation Classification system, and the construction of Grade II on the Ecological Zoning Map should cover areas that fall under Grades III and IV. Accordingly, the tentative application of this grouping to the study areas in Gongju yielded areas of 13,018 m2 as Grade I and 67,982 m2 as Grade II on the Ecological Zoning Map, while Grade III and special management areas were not represented. The existing Ecological Zoning Map grading for the study area in Gongju had a value of 81,000 m2 for Grade II, and thus, the area results derived in this study showed some discrepancy (Figure 14). Such a difference was likely observed because there was a large difference in the scale of the maps between the high-resolution UAV images used for the analysis and the Ecological Zoning Map, whose classification covered the entire country. Ecological zoning maps are usually provided in the form of shapes, but in the guide for ecological zoning maps, the minimum area is estimated to be 2500 m2 when the grid is used as a unit for evaluation. The minimum evaluation area of UAV data used in this study is 1 m2, therefore, 13,018 m2 of the first-class area with excellent environmental ecology could be derived from the results of the existing second-class target site. Given such differences, the Ecological Zoning Map classification that used UAV information was deemed to be capable of more precise and accurate geospatial database construction and classifications than the existing Ecological Zoning Map classification. As the two classification systems showed similar results, the tentative results for the new Vegetation Conservation Classification evaluation technique in the study area in Gongju could represent relatively significant changes.

5. Conclusions and Implications

In this study, as a method for sustainable and efficient forest monitoring, various sensors were mounted on a drone to record forest vegetation to establish precise and up-to-date vegetation information. The possibility of developing and utilizing the technology for determination of vegetation conservation classification based on vegetation type and layer structure analysis through a deep-learning method was presented. In order to reduce the relative error between UAV-based optical data and LiDAR data in complex forest topography, a method of flying along the surface was used. Some vertical relative errors occurred in the Samcheok, Seogwipo, and Gongju areas. Due to the proximity problem of drones, the point density is not uniform because the height and slope are not constant. Therefore, it is considered necessary to adjust the flight trajectory and recording method to collect accurate vegetation information in consideration of accurate contour lines. In the analysis based on deep learning, higher accuracy has been obtained in both vegetation type analysis and vegetation layer structure analysis. However, if the vertical error of the target area is improved, it is expected that a better result for layer analysis can be obtained. In addition, the learning data did not include areas such as burial mounds in the Samcheok area. It is believed that when constructing an on-site survey database, if other survey data are constructed together and used as learning data for deep learning analysis, the accuracy will be further improved. Additional considerations of the flight time of a UAV and the scanning scope in the study area during high-resolution grading assessments may lead to further improvements. A reliable method should allow for the testing of the absolute data accuracy by using a number of check points. However, as the site conditions may impose difficulties, an additional effective method that can test the accuracy of the optical and LiDAR data in forest areas needs to be developed. In assessments of the Vegetation Conservation Classification system, the rarely distributed categories and the habitats of important species need to be surveyed through site surveys, and on-site data are also needed to evaluate plant distributions. Notably, the DBH for forest plantations has limitations such as uneven trunk shapes and high margins of error due to the low penetration of the LiDAR points used to construct UAV-based databases for a target area of 1 km2 or larger [46]. Remedying such shortcomings will enable wide-ranging applications of this new approach, not only in improving the efficiency of forest monitoring, but also in the development and implementation of sustainability plans for forests.
The following tasks are needed to further increase the possibility of using drones in the assessment of effective vegetation conservation classification. The range of the target area is set in consideration of the available time of the current UAV flight. Considering the density of LiDAR points, it uses a scanning method that follows the terrain. Considering the permeability of UAV-based LiDAR, UAV photography should be carried out in each season (Summer: Tree height, location. Winter-terrain, tree trunk, etc.), and various databases should be constructed according to regional and temporal characteristics. Based on this, if the analysis results of vegetation type and vegetation layer structure and field survey results (DBH, rare and important species habitat) are integrated and used, it is considered that effective vegetation protection grade classification can be carried out.

Author Contributions

Conceptualization, Y.Z. and S.J.; methodology, Y.Z. and H.S.; software, H.-w.J., W.-k.L., and S.C.; formal analysis, Y.Z.; resources, C.P.; writing—original draft preparation, Y.Z.; writing—review and editing, S.J. and Y.K.; visualization, Y.Z.; supervision, S.J.; project administration, S.H. All authors have read and agreed to the published version of the manuscript.

Funding

This research was funded by [Korea Environment Industry & Technology Institute (KEITI)] grant number [No.2020002990009, No. 2016000210001].

Conflicts of Interest

The authors declare no conflict of interest.

References

  1. Gang, J.E. Urban Renewal Strategy for Adapting to Climate Change: Use of Green Infrastructure on Flood Mitigation; Report of Korean Environment Institute; Korean Environment Institute: Sejong, Korea, 2011; pp. 7–85. [Google Scholar]
  2. Mell, I.; Allin, S.; Reimer, M.; Wilker, J. Strategic green infrastructure planning in Germany and the UK: A transnational evaluation of the evolution of urban greening policy and practice. Int. Plan. Stud. 2017, 22, 333–349. [Google Scholar] [CrossRef] [Green Version]
  3. Lafortezza, R.; Davies, C.; Sanesi, G.; Konijnendijk, C. Green Infrastructure as a tool to support spatial planning in European urban regions. iforest Biogeosci. For. 2013, 6, 102–108. [Google Scholar] [CrossRef] [Green Version]
  4. Schiappacasse, P.; Müller, B. Planning Green Infrastructure as a Source of Urban and Regional Resilience—Towards Institutional Challenges. Urbani Izziv 2015, 26, S13–S24. [Google Scholar] [CrossRef]
  5. Mell, I.C. Green infrastructure: Reflections on past, present and future praxis. Landsc. Res. 2017, 42, 135–145. [Google Scholar] [CrossRef] [Green Version]
  6. Seiwert, A.; Rößler, S. Understanding the term green infrastructure: Origins, rationales, semantic content and purposes as well as its relevance for application in spatial planning. Land Use Policy 2020, 97, 104785. [Google Scholar] [CrossRef]
  7. Lee, D.G.; Kim, H.G. Addressing Climate Change Problems with Green Infrastructure. J. Korea Environ. Stud. 2014, 53, 10. [Google Scholar]
  8. Lee, W.K.; Kim, M.I.; Song, C.H.; Lee, S.G.; Cha, S.E.; Kim, G.S. Application of Remote Sensing and Geographic Information System in Forest Sector. J. Cadastre Land Inf. 2016, 46, 27–42. [Google Scholar]
  9. Government Complex-sejong. Criteria for Evaluation and Classification of Vegetation Conservation; Related to Article 13; National Law Information Center of Korea, Government Complex-Sejong: Sejong, Korea, 2015.
  10. Korea Ministry of Environment. Regulations on Methods of Survey of Natural Environment and Criteria for Classification of Grades, etc.; Korea Ministry of Environment: Sejong, Korea, 2015.
  11. Cha, S.E.; Jo, H.W.; Lim, C.H.; Song, C.H.; Lee, S.G.; Kim, J.W.; Park, C.Y.; Jeon, S.W.; Lee, W.K. Estimating the Stand Level Vegetation Structure Map Using Drone Optical Imageries and LiDAR Data based on an Artificial Neural Networks (ANNs). Korean J. Remote Sens. 2020, 36, 653–666. [Google Scholar]
  12. Longo, M.; Keller, M.; dos-Santos, M.N.; Leitold, V.; Pinagé, E.R.; Baccini, A.; Saatchi, S.; Nogueira, E.M.; Batistella, M.; Morton, D.C. Aboveground biomass variability across intact and degraded forests in the Brazilian Amazon. Glob. Biogeochem. Cycles 2016, 30, 1639–1660. [Google Scholar] [CrossRef] [Green Version]
  13. Leitold, V.; Morton, D.C.; Longo, M.; Dos-Santos, M.N.; Keller, M.; Scaranello, M. El Nino drought increased canopy turnover in Amazon forests. N. Phytol. 2018, 219, 959–971. [Google Scholar] [CrossRef] [Green Version]
  14. Sankey, T.; Donager, J.; McVay, J.; Sankey, J.B. UAV lidar and hyperspectral fusion for forest monitoring in the southwestern USA. Remote Sens. Environ. 2017, 195, 30–43. [Google Scholar] [CrossRef]
  15. Webster, C.; Westoby, M.; Rutter, N.; Jonas, T. Three-dimensional thermal characterization of forest canopies using UAV photogrammetry. Remote Sens. Environ. 2018, 209, 835–847. [Google Scholar] [CrossRef] [Green Version]
  16. Lucas, R.M.; Lee, A.C.; Bunting, P.J. Retrieving forest biomass through integration of CASI and LiDAR data. Int. J. Remote Sens. 2008, 29, 1553–1577. [Google Scholar] [CrossRef]
  17. Srinivasan, S.; Popescu, S.C.; Eriksson, M.; Sheridan, R.D.; Ku, N.-W. Multi-temporal terrestrial laser scanning for modeling tree biomass change. For. Ecol. Manag. 2014, 318, 304–317. [Google Scholar] [CrossRef]
  18. Wagner, W.; Hollaus, M.; Briese, C.; Ducic, V. 3D vegetation mapping using small-footprint full-waveform airborne laser scanners. Int. J. Remote Sens. 2008, 29, 1433–1452. [Google Scholar] [CrossRef] [Green Version]
  19. van Leeuwen, M.; Nieuwenhuis, M. Retrieval of forest structural parameters using LiDAR remote sensing. Eur. J. For. Res. 2010, 129, 749–770. [Google Scholar] [CrossRef]
  20. Sung, H.C.; Zhu, Y.Y.; Jeon, S.W. Study on Application Plan of Forest Spatial Informaion Based on Unmanned Aerial Vehicle to Improve Environmental Impact Assessment. J. Korean Environ. Res. Technol. 2019, 22, 14. [Google Scholar]
  21. Dandois, J.; Olano, M.; Ellis, E. Optimal Altitude, Overlap, and Weather Conditions for Computer Vision UAV Estimates of Forest Structure. Remote Sens. 2015, 7, 13895–13920. [Google Scholar] [CrossRef] [Green Version]
  22. Moon, H.-S.; Lee, W.-S. Development and Verification of a Module for Positioning Buried Persons in Collapsed Area. J. Korea Acad. Ind. Coop. Soc. 2016, 17, 427–436. [Google Scholar]
  23. Lee, Y.S.; Lee, D.G.; Yu, Y.G.; Lee, H.J. Application of Drone Photogrammetry for Current State Analysis of Damage in Forest Damage Areas. J. Korean Soc. Geospat. Inf. Syst. 2016, 24, 49–58. [Google Scholar]
  24. Park, Y.J.; Jung, K.Y. Availability Evaluation for Generation of Geospatial Information using Fixed Wing UAV. J. Korean Soc. Geospat. Inf. Syst. 2014, 22, 159–164. [Google Scholar]
  25. Shahbazi, M.; Théau, J.; Ménard, P. Recent applications of unmanned aerial imagery in natural resource management. Gisci. Remote Sens. 2014, 51, 339–365. [Google Scholar] [CrossRef]
  26. Park, K.J.; Jung, K.Y. Investigation and Analysis of Forest Geospatial Information Using Drone. J. Korea Acad. Ind. Coop. Soc. 2018, 19, 6. [Google Scholar]
  27. Brovkina, O.; Cienciala, E.; Surový, P.; Janata, P. Unmanned aerial vehicles (UAV) for assessment of qualitative classification of Norway spruce in temperate forest stands. Geo Spat. Inf. Sci. 2018, 21, 12–20. [Google Scholar] [CrossRef] [Green Version]
  28. Müllerová, J.; Brůna, J.; Bartaloš, T.; Dvořák, P.; Vítková, M.; Pyšek, P. Timing Is Important: Unmanned Aircraft vs. Satellite Imagery in Plant Invasion Monitoring. Front. Plant Sci. 2017, 8, 1–13. [Google Scholar] [CrossRef] [Green Version]
  29. Komárek, J.; Klouček, T.; Prošek, J. The potential of Unmanned Aerial Systems: A tool towards precision classification of hard-to-distinguish vegetation types? Int. J. Appl. Earth Obs. Geoinf. 2018, 71, 9–19. [Google Scholar] [CrossRef]
  30. Panagiotidis, D.; Abdollahnejad, A.; Surový, P. Determining tree height and crown diameter from high-resolution UAV Determining tree height and crown diameter from high-resolution UAV imagery. Int. J. Remote Sens. 2017, 38, 1–19. [Google Scholar] [CrossRef]
  31. Surový, P.; Almeida Ribeiro, N.; Panagiotidis, D. Estimation of positions and heights from UAV-sensed imagery in tree plantations in agrosilvopastoral systems. Int. J. Remote Sens. 2018, 39, 4786–4800. [Google Scholar] [CrossRef]
  32. Oh, S.J. Database Design for Management of Forest Resources using a Drone. J. Converg. Cult. Technol. 2019, 5, 251–256. [Google Scholar]
  33. Dandois, J.P.; Ellis, E.C. High spatial resolution three-dimensional mapping of vegetation spectral dynamics using computer vision. Remote Sens. Environ. 2013, 136, 259–276. [Google Scholar] [CrossRef] [Green Version]
  34. Lisein, J.; Pierrot-Deseilligny, M.; Bonnet, S.; Lejeune, P. A Photogrammetric Workflow for the Creation of a Forest Canopy Height Model from Small Unmanned Aerial System Imagery. Forests 2013, 4, 922–944. [Google Scholar] [CrossRef] [Green Version]
  35. Puliti, S.; Ørka, H.; Gobakken, T.; Næsset, E. Inventory of Small Forest Areas Using an Unmanned Aerial System. Remote Sens. 2015, 7, 9632–9654. [Google Scholar] [CrossRef] [Green Version]
  36. Puliti, S.; Ene, L.T.; Gobakken, T.; Næsset, E. Use of partial-coverage UAV data in sampling for large scale forest inventories. Remote Sens. Environ. 2017, 194, 115–126. [Google Scholar] [CrossRef]
  37. Dash, J.; Pearse, G.; Watt, M.; Paul, T. Combining Airborne Laser Scanning and Aerial Imagery Enhances Echo Classification for Invasive Conifer Detection. Remote Sens. 2017, 9, 156. [Google Scholar] [CrossRef] [Green Version]
  38. Kim, M.J.; Bang, H.-S.; Lee, J.-W. Use of Unmanned Aerial Vehicle for Forecasting Pine Wood Nematode in Boundary Area: A Case Study of Sejong Metropolitan Autonomous City. J. Korean For. Soc. 2017, 106, 100–109. [Google Scholar]
  39. Lee, S.; Park, S.J.; Baek, G.; Kim, H.; Lee, C.W. Detection of Damaged Pine Tree by the Pine Wilt Disease Using UAV Image. Korean J. Remote Sens. 2019, 35, 359–373. [Google Scholar]
  40. Safonova, A.; Tabik, S.; Alcaraz-Segura, D.; Rubtsov, A.; Maglinets, Y.; Herrera, F. Detection of fir trees (Abies sibirica) damaged by the bark beetle in unmanned aerial vehicle images with deep learning. Remote Sens. 2019, 11, 643. [Google Scholar] [CrossRef] [Green Version]
  41. Merino, L.; Caballero, F.; Martínez-De-Dios, J.R.; Maza, I.; Ollero, A. An unmanned aircraft system for automatic forest fire monitoring and measurement. J. Intell. Robot. Syst. 2012, 65, 533–548. [Google Scholar] [CrossRef]
  42. Yuan, C.; Zhang, Y.; Liu, Z. A survey on technologies for automatic forest fire monitoring, detection, and fighting using unmanned aerial vehicles and remote sensing techniques. Can. J. For. Res. 2015, 45, 783–792. [Google Scholar] [CrossRef]
  43. Government Complex-sejong. Guidelines for Working on Public Surveys Using Unmanned Aerial Vehicles; Related to Article 10; National Law Information Center of Korea, Government Complex-Sejong: Sejong, Korea, 2018.
  44. He, F.; Zhou, T.; Xiong, W.; Hasheminnasab, S.M.; Habib, A. Automated Aerial Triangulation for UAV-Based Mapping. Remote Sens. 2018, 10, 1952. [Google Scholar] [CrossRef] [Green Version]
  45. Government Complex-sejong. Guidelines for Preparing Ecological Zoning Map; Related to Article 12–15; National Law Information Center of Korea, Government Complex-Sejong: Sejong, Korea, 2018. [Google Scholar]
  46. Wieser, M.; Mandlburger, G.; Hollaus, M.; Otepka, J.; Glira, P.; Pfeifer, N. A case study of UAS borne laser scanning for measurement of tree stem diameter. Remote Sens. 2017, 9, 1154. [Google Scholar] [CrossRef] [Green Version]
Figure 1. Locations of the unmanned aerial vehicles (UAV) scanning surveys.
Sustainability 12 10150 g001
Figure 2. Research flow.
Sustainability 12 10150 g002
Figure 3. (a) Ground control points (GCP) fabrication and installation; (b) UAV scan mission design.
Sustainability 12 10150 g003
Figure 4. Data collection and preprocessing workflow for UAV data.
Sustainability 12 10150 g004
Figure 5. Results for the vegetation survey and drawing.
Sustainability 12 10150 g005
Figure 6. Optical image processing flow.
Sustainability 12 10150 g006
Figure 7. Results for the UAV-based optical image construction: (a) Gongju, (b) Samcheok, and (c) Segwipo.
Sustainability 12 10150 g007
Figure 8. Results for the UAV-based LiDAR data construction: (a) Gongju, (b) Samcheok, and (c) Segwipo.
Sustainability 12 10150 g008
Figure 9. Setting up learning/verification zones and grid types for the analysis of vegetation types (artificial/natural forests) in (a) Gongju, (b) Samcheok, and (c) Segwipo.
Sustainability 12 10150 g009
Figure 10. Determination of the vegetable conservation grade using UAV data (VT-Vegetation Type; VLS—Vegetation Layer Structure; VCC—Vegetation Conservation Classification).
Sustainability 12 10150 g010
Figure 11. Classification results for the vegetation types (artificial/natural forests) analyzed by the fusion of UAV optical-LiDAR data: (a) Gongju, (b) Samcheok, and (c) Segwipo.
Sustainability 12 10150 g011
Figure 12. Results for the analysis of the vegetation structure by: (a) Gongju, (b) Samcheok, and (c) Segwipo.
Sustainability 12 10150 g012
Figure 13. Determination of the vegetation conservation classification by target area: (a) Gongju, (b) Samcheok, and (c) Segwipo.
Sustainability 12 10150 g013
Figure 14. Comparison of UAV Ecological Zoning Map Classification Results in Gongju Area: (a) EZM; (b) UAV-EZM.
Sustainability 12 10150 g014
Table 1. Specifications for the drones and sensors used to carry out the research.
CategoryOptical ImageLidar Data
DronesTypes Sustainability 12 10150 i001
<FiteFLY6 Pro>
Sustainability 12 10150 i002
<XW-1400vzx>
Filming speedLess than 1 capture per secondApproximately 300,000 points per second
Size1.5 m × 0.95 m1.4 m × 1.4 m
Spectral bandRed, green, blue, red edge, NIR 1-
Spatial resolutionResolution of approximately 8 cm per pixel for an altitude of 120 m-
Horizontal accuracy1~2 GSD1~2 GSD
Vertical accuracy1~3 GSD2~3 GSD
SensorsTypesMicaSense RedEdge
Sustainability 12 10150 i003
Velodyne Puck VLP-16
Sustainability 12 10150 i004
Flight time30–45 min35–40 min
Point Density
(50 m)
About 100–200 lidar point/m2
Maximum flight altitude1 km-
Payload1 kg6 kg
1 NIR: Near infra-red.
Table 2. Criteria for the evaluation of vegetation conservation classes (Ministry of Environment, 2015).
ClassClassification Standard
Class IA polar forest or similar natural forest that has reached the final stage of vegetation.
Class IIForest vegetation nearly recovered to the point of being close to natural again after a disturbance of the natural vegetation.
Class III
(1)
Forest vegetation where the natural vegetation has been disturbed and is now in the recovery stage or where a human disturbance continues.
(2)
The stratigraphic structure of the colony is unstable, and most of the species do not fully reflect the potential of natural vegetation in the area.
(3)
When the afforestation vegetation is restored to the point where it is difficult to distinguish it from the natural forest.
Class IVArtificial afforestation
Class VSecondary formed grassland vegetation, orchards, paddies, fields, etc.
Table 3. Relative position accuracy (averages).
Sustainability 12 10150 i005 Sustainability 12 10150 i006Gongju Δ X Y =   0.05 m
Δ Z =   0.36 m
Samcheok Δ X Y =   0.07 m
Δ Z =   0.19 m
Segwipo Δ X Y =   0.06 m
Δ Z =   0.32 m
Sustainability 12 10150 i007
Table 4. Results for the determination of the vegetation conservation classification by target area.
DivisionClass IClass IIClass IIIClass IVClass VSum
GongjuArea (m2)544616,187101,79810,300-133,731
Ratio (%)4.0812.1076.127.70-100.00
SamcheokArea (m2)6500178447,23321,309-76,826
Ratio (%)8.462.3261.4827.74-100.00
SeogwipoArea (m2)91,59110,170108,86711,307-221,935
Ratio (%)41.274.5849.055.09-100.00
Publisher’s Note: MDPI stays neutral with regard to jurisdictional claims in published maps and institutional affiliations.

