Analysis of Flood Damage in the Seoul Metropolitan Government Using Climate Change Scenarios and Mitigation Technologies


1
Department of Landscape Architecture and Rural Systems Engineering, Seoul National University, Seoul 08826, Korea
2
Transdisciplinary Program in Smart City Global Convergence, Seoul National University, Seoul 08826, Korea
3
Research Institute of Agriculture and Life Sciences, Seoul National University, Seoul 08826, Korea
4
Interdisciplinary Program in Landscape Architecture, Seoul National University, Seoul 08826, Korea
5
Interdisciplinary Program in Urban Design, Seoul National University, Seoul 08826, Korea
*
Author to whom correspondence should be addressed.
Sustainability 2021, 13(1), 105; https://0-doi-org.brum.beds.ac.uk/10.3390/su13010105
Submission received: 15 October 2020
/
Revised: 20 December 2020
/
Accepted: 22 December 2020
/
Published: 24 December 2020
(This article belongs to the Special Issue Development of Green Infrastructure Design for Sustainable Social-Ecological System)
Abstract
:The social and economic damages caused by climate change have increased rapidly over the last several decades, with increasing instances of heatwaves, floods, and extreme rainfall. In 2011, heavy rain of 110.5 mm/hr caused great damage to the Seoul Metropolitan Government. Most of the causes of flooding in modern cities include a sharp increase in non-permeable pavement and a lack of water circulation facilities. It is predicted that heavy rainfalls will occur in the future, causing large amounts of local damage. In this study, possible future flood damages were analyzed using climate change scenarios based on the Korean Peninsula. ArcGIS was adopted to perform analyses, and Huff curves were employed for precipitation analysis. Water tanks, permeable pavement, and ecological waterways were installed as mitigation technologies. These three technologies can contribute to flooding mitigation by increasing the rainwater storage capacity. This study suggests that all floods can be reduced by RCP 8.5 by 2050 and 2060. Although there will be run-off after 2050, it is believed that technology will significantly reduce the volume and possibility of floods. It is recommended that a one-year analysis should be conducted in consideration of the maintenance aspects that will arise in the future.
1. Introduction
The social and economic damage caused by climate change has increased rapidly. According to NASA, the average temperature of the Earth’s surface in 2018 increased by 0.93 ± 0.07 °C compared to the 1880s [1,2]. Climate change can lead to glacier melting problems, heatwaves, extreme rainfall, and the destruction of species diversity [3].
Thus, the Intergovernmental Panel on Climate Change (IPCC) provides a series of scenarios to minimize damage induced by climate change [4]. The climate change scenario is divided into four stages of representative concentration pathways (RCPs): RCP 2.6/RCP 4.5/RCP 6.0/RCP 8.5. The definition of each RCP scenario is shown in Table 1. This is considered as preemptive information used to evaluate the impact of climate change and minimize damage. The information produced by applying the model in the climate change scenario includes temperature, precipitation, wind, and humidity. Of these, the damage caused by extreme rainfall is still ongoing, and more extreme rainfall is expected in Korean Peninsula in the future.
If greenhouse gases continue to be emitted at the current rate (RCP 8.5), the average temperature is expected to be increased by 6.0 °C, and the precipitation will increase by 20.4% at the end of the 21st century (2070–2099). In the case of RCP 4.5, assuming that some efforts to reduce climate change are realized, the temperature and precipitation are expected to be increased by 3.4 °C and 17.3%, respectively [4]. As the precipitation increases, it is expected that floods will occur more frequently. In the case of RCP 4.5, the highest rainfall is predicted between the year 2040 and the year 2070, with an average of 1466 mm in the Seoul Metropolitan Government. On the other hand, from 2071, the trend will be gradually decreasing, and the average precipitation will be decreased to 1276 mm. On the other hand, RCP 8.5 shows a steadily increasing trend. It is estimated that an average rainfall of 1290 mm will be expected between the year 2040 and the year 2070, and an average rainfall of 1400 mm will be expected after the year 2070 [5].
The social and economic damages that can be caused by extreme rainfall are landslides, city floods, etc. Local rains in Central South Korea in July 2011 caused landslides on Umyeon Mountain. There was up to 110.5 mm/hr of rainfall in Seoul, which caused 69 casualties and approximately USD 27.6 million in economic damage. In other cases, 126.0 mm/hr of rainfall was recorded in July 2001, and around 90.0 mm/hr of heavy rainfall was recorded in 2010 [6]. Furthermore, the sharp increase in non-permeable pavement and a lack of water circulation facilities can be named as the main reasons for flooding in cities [7].
In Korea, which clearly shows summer-concentrated precipitation, the damage from floods is expected to increase, according to the IPCC climate change scenarios. Thus, this study was conducted to analyze the technologies that can improve water circulation functions that take place as rainfall occurs via water tanks, permeable pavement, etc., in cities and consider future damage mitigation.
One of the most recent studies on flood mitigation technology dealt with the design of local governments’ flood response measures, focusing on the design of water tanks for Gangdong-gu areas. In the preceding study, ArcGIS was used only for Gangdong-gu and the ArcHydro plug-in was used to calculate the watershed area of Gangdong-gu. The predicted rainfall data for 2040 and 2070 were analyzed based on the Gangdong-gu RCP 8.5 scenario report [8]. The gap between prior research and this study is that this study expanded to cover the entire Seoul Metropolitan Government. Moreover, the full data of climate change scenario RCP 4.5/RCP 8.5 provided by the Korea Meteorological Administration were analyzed on a time-by-hour basis to determine the effectiveness of the mitigation technology.
In order to adapt to climate change, including floods, a study was conducted that quantified technologies referred to as green infrastructure, such as roof gardens, permeable pavements, and ecological waterways [9,10]. Using a run-off analysis program such as SWMM (Storm Water Management Model), it has been revealed that green infrastructure such as roof gardens can not only reduce peak flow and flooding but also have a positive effect on carbon reduction and temperature reduction.
In another paper related to flood mitigation, flood reduction ecosystem services were evaluated, focusing on Shenzhen, a major city in Southern China. Shenzhen’s capacity for flood mitigation gradually decreased due to changes in land use, which weakened Shenzhen’s resilience. It is argued that the conservation, restoration, and construction of urban ecological spaces should be advanced through the progress of the sponge city plan [11]. In addition, research on selecting vulnerable areas for urban landslides due to floods and designing mitigation facilities is being actively conducted [12].
Recently, a flood risk zone analysis was developed that combines the analytical hierarchy process (AHP), geographic information system (GEE), remote sensing (RS), and Google Earth Engine (GEE) platform [13]. In Russia, three types of data were collected using rain gauge and radar. It was revealed that hydrology model analysis using SWAT (Soil &Water Assessment Tool) could not only improve the rain gauge networks but also help to mitigate urban flooding [14].
Recently, a framework study was also conducted to evaluate community resilience against urban flooding. The flood resilience framework is expected to be applied to sustaining urban planning and flood evacuations [15].
Furthermore, studies related to decision-making on flood mitigation, flood management, and the impact of future changes are being proposed. For example, the information-theoretic Portfolio Decision model (iPDM) was introduced for the optimization of a systemic ecosystem value at the basin scale by evaluating all potential flood risk mitigation plans. iPDM calculates the ecosystem value predicted by all feasible combinations of flood control structures (FCS), considering environmental, social, and economical asset criteria [16]. In another study, a Multi-Criteria Decision Analysis (MCDA) decision framework for optimal decision making in flood protection design. This framework accounts for climate change, increasing urbanization, and evolving socioeconomic features of floods. The MCDA uses as its criteria the annual expected loss, graduality, a newly developed Socio-Economic Vulnerability Index (SEVI), and levee construction cost. It is demonstrated for a central basin of Jakarta, Indonesia [17]. Recently, a real option analysis (ROA) plan was used to enable decision-makers to reflect uncertainties in flood policies. This study assesses the capacity of technology to adapt to flooding, different from the uncertainties of decision-making in these preliminary studies [18]. Another gap is that this study is not directly involved in disaster decision-making. This study quantitatively analyzes the capacity of technologies that can support decision-making. Data from this study can be used to support decision-makers in creating disaster models.
This study was conducted based on the following three objectives. First, a quantitative analysis of urban flood damage in the next 80 years (2021–2100) is made using the climate change scenario (RCP 4.5/RCP 8.5) provided by the Korea Meteorological Administration. Second, the mitigation technologies are selected, and the reduction of the disaster is analyzed (Table 2). Third, we select sustainable disaster reduction facilities by introducing eco-friendly materials for future generations to implement as mitigation technologies.
For the above three research objectives, a local-level hydrology analysis is conducted. In addition, the design is optimized in terms of water circulation through techniques such as ecological waterways.
2. Materials
2.1. Alternative Mitigation Options
To prepare for flooding and to improve the water circulation system, a total of four facilities must be considered. Collective facilities, treatment facilities, storage facilities, and transmission and drainage facilities are provided in Table 2 [19].
This study aims to establish measures to mitigate flood damage by focusing on storage facilities and focuses on flood countermeasures at a future date.
Among the storage facilities, this research uses three technologies: permeable pavement, the water tank, and ecological waterway. Among them, permeable pavement and ecological waterways are classified as green infrastructure. A water tank is usually installed in buildings, parking lots, and urban parks to store rainfall. Water tanks are widely used in Korea because they can be easily installed to secure a large capacity [19]. In the case of water tanks, the design standards of scale are stipulated by the decree, and the current regulations for the enforcement of the waterworks law are consulted [20].
Open areas such as parks and parking lots are required to multiply the area of water collection by more than 0.05 m in the case of buildings or public facilities such as government offices [21]. The criteria are building area multiplied by 0.05 m or ground area multiplied by 0.02 m. Other spaces are calculated by multiplying the collective area by 0.01 m [19]. Water tanks are divided into the roof, ground, underground installation (full space, partial space), and excretion types, depending on the purpose of the building.
The reason for choosing the permeable pavement is that groundwater quantity is increased due to their high permeability rate, which would provide better growth conditions to plants on the surface. Permeable pavement is one of the most popular green infrastructures in Korea to mitigate disasters such as flooding [22]. In this study, geo-grid-reinforced permeable pavement is introduced as a mitigation technology. The use of underground reinforced structures such as geogrids can solve safety problems that have previously been pointed out in water-permeable pavement [23]. It can improve ground safety and increase the water permeability at the bottom of the road pavement [24].
The sectional drawings of permeable pavement utilized in this study were presented by the Seoul Metropolitan Government. The permeable pavement shown in Figure 1 was installed in Gwanak-gu in 2012 and was also used for vehicle driving routes [24]. Compared to asphalt, there was no water flowing or pooling along the surface at the time of the spray test [25]. It was found that the amount of rainwater that can be stored in the 1 m section was 0.296 m3 when the permeable pavement illustrated in Figure 1 was installed at a width of 3 m.
The biggest advantage of using an ecological waterway is that green infrastructure can treat rainwater in large quantities. In addition, eco-friendly materials could make it possible to create an ecological landscape for citizens. However, there is a drawback to the selection of appropriate sites since they are formed along the sidewalk. Ecological waterways are named differently depending on the institution, and there is no clear standard for distinguishing each facility [26].
In this study, infiltration ditches were selected as disaster mitigation techniques. This is because the capacity of infiltration ditches was the greatest when the corresponding geometry had a concrete amount (Width: 1.5 m, Length: 10.0 m, Height: 1.0 m). At the time of measurement of the capacity of each facility, the infiltration ditches had a volume of 5.375 m3.
2.2. Types of Programs
Planning/design programs should be able to review the effects of rainwater mitigating facilities before and after installation and the improvement of water circulation [22,27]. In addition, water and energy balance can be simulated according to landscaping water and the penetration of rainwater in rainwater mitigating facilities. This study used the Hydro plug-in of ArcGIS. The following reasons must be considered when selecting the appropriate program [28].
(1) GIS data can be generated through DEM (Digital Elevation Model) data, and comprehensive analysis of topographical maps, land use status, and vegetation required for hydrologic analysis is possible.
(2) Data linked to the current status of facilities such as sewage pipe network facilities can be created, and other hydrologic analysis program models can be improved.
(3) The simulation results can be visualized, and the GIS data, such as traffic analysis, and the comprehensive results can be shown.
2.3. Target Site
The target site of this study is the Seoul Metropolitan Government. According to the Seoul Metropolitan Government’s comprehensive plan for reducing storm and flood damage, there are a total of 80 sites for river disaster risk zones based on the disaster history, on-site surveys, and opinions of related agencies. It was often caused by a lack of open space for drainage effects or lack of maintenance in the road planning section [29,30].
Since the habitual flooding area provided by Esri was established, it has been easy to estimate the extent of the damage caused by flooding in the future. When the National Flood Risk Map, which is currently being established by the Ministry of the Interior and Safety, is finalized and disclosed for research purposes, this methodology could be applied and expanded to nationwide analysis.
2.4. Data
2.4.1. Climate Change Scenario
This study used climate change scenario RCP 8.5 and RCP 4.5 provided by the climate information portal. Climate change scenario refers to future climate forecast information calculated by applying changes in radiative forcing induced by artificial causes such as greenhouse gas, aerosols, and changes in land use to the global system model. Depending on the type of RCP scenario, it is predicted that future precipitation, temperature, humidity, etc., will vary.
The representative concentration pathway (RCP) is a scenario used in the IPCC 5th assessment report, and the concentration of greenhouse gases is determined by the amount of radiation that human activity emits to the atmosphere.
The RCP scenario also carries uncertainty because it is a model that is predicted based on carbon emissions and human activity. However, many studies have been conducted to quantify and reduce the uncertainty of the RCP scenario [31].
Therefore, most recent studies, including this study, use RCP scenarios. The climate change scenario is provided by each administrative district or grid. It provides data up to 2100, considering daily units. In this study, daily precipitation forecasts were used as data.
2.4.2. Historical Flood Data
To establish the capacity, disaster observation data provided by the Weather Data Portal were utilized [32]. The portal has been providing data on temperature, precipitation, wind, and climate statistics for all sections of the Korean Peninsula since 1973. Data can be viewed every minute. Daily precipitation data were used in this study and the analysis period ranged from 2001 to 2019.
Since then, flood-damaged districts have been identified for each year, using information provided by the Water Information Portal. The Water Information Portal provides flood damage dates and economic damage for each administrative district. However, since the Water Information Portal does not provide accurate precipitation information for the day of the flood, data from both the Weather Data Portal and the Water Information Portal were used.
2.4.3. DEM File and Road Network Data
The Seoul Metropolitan Government’s DEM file used in this study is shown in Figure 2. The DEM files were provided by the National Geographic Information service’s National Territory Information Platform. The DEM data were produced in 2014. In the case of the Seoul Metropolitan Government, there have been no major civil engineering works since large-scale facility maintenance to mitigate floods was carried out in 2012. The reason for using DEM data produced in 2014 is that most watersheds are consistent to the year 2020. In general, large areas such as the Seoul Metropolitan Government use a DEM resolution between 30 and 5 m [33]. In this study, for a more accurate hydrology analysis, the resolution size of one grid was set to 10 m.
To calculate the area of the waterways and the permeable pavement at the cross-section of the road, the process of identifying the width of each road category was necessary. To determine the width of each road, the GIS road network file which was built in 2018 and provided by the standard node-link of the Ministry of Land, Infrastructure, and Transport was used. An example of the road network data used is shown in Figure 3 [34].
3. Methodology
3.1. Work Flow
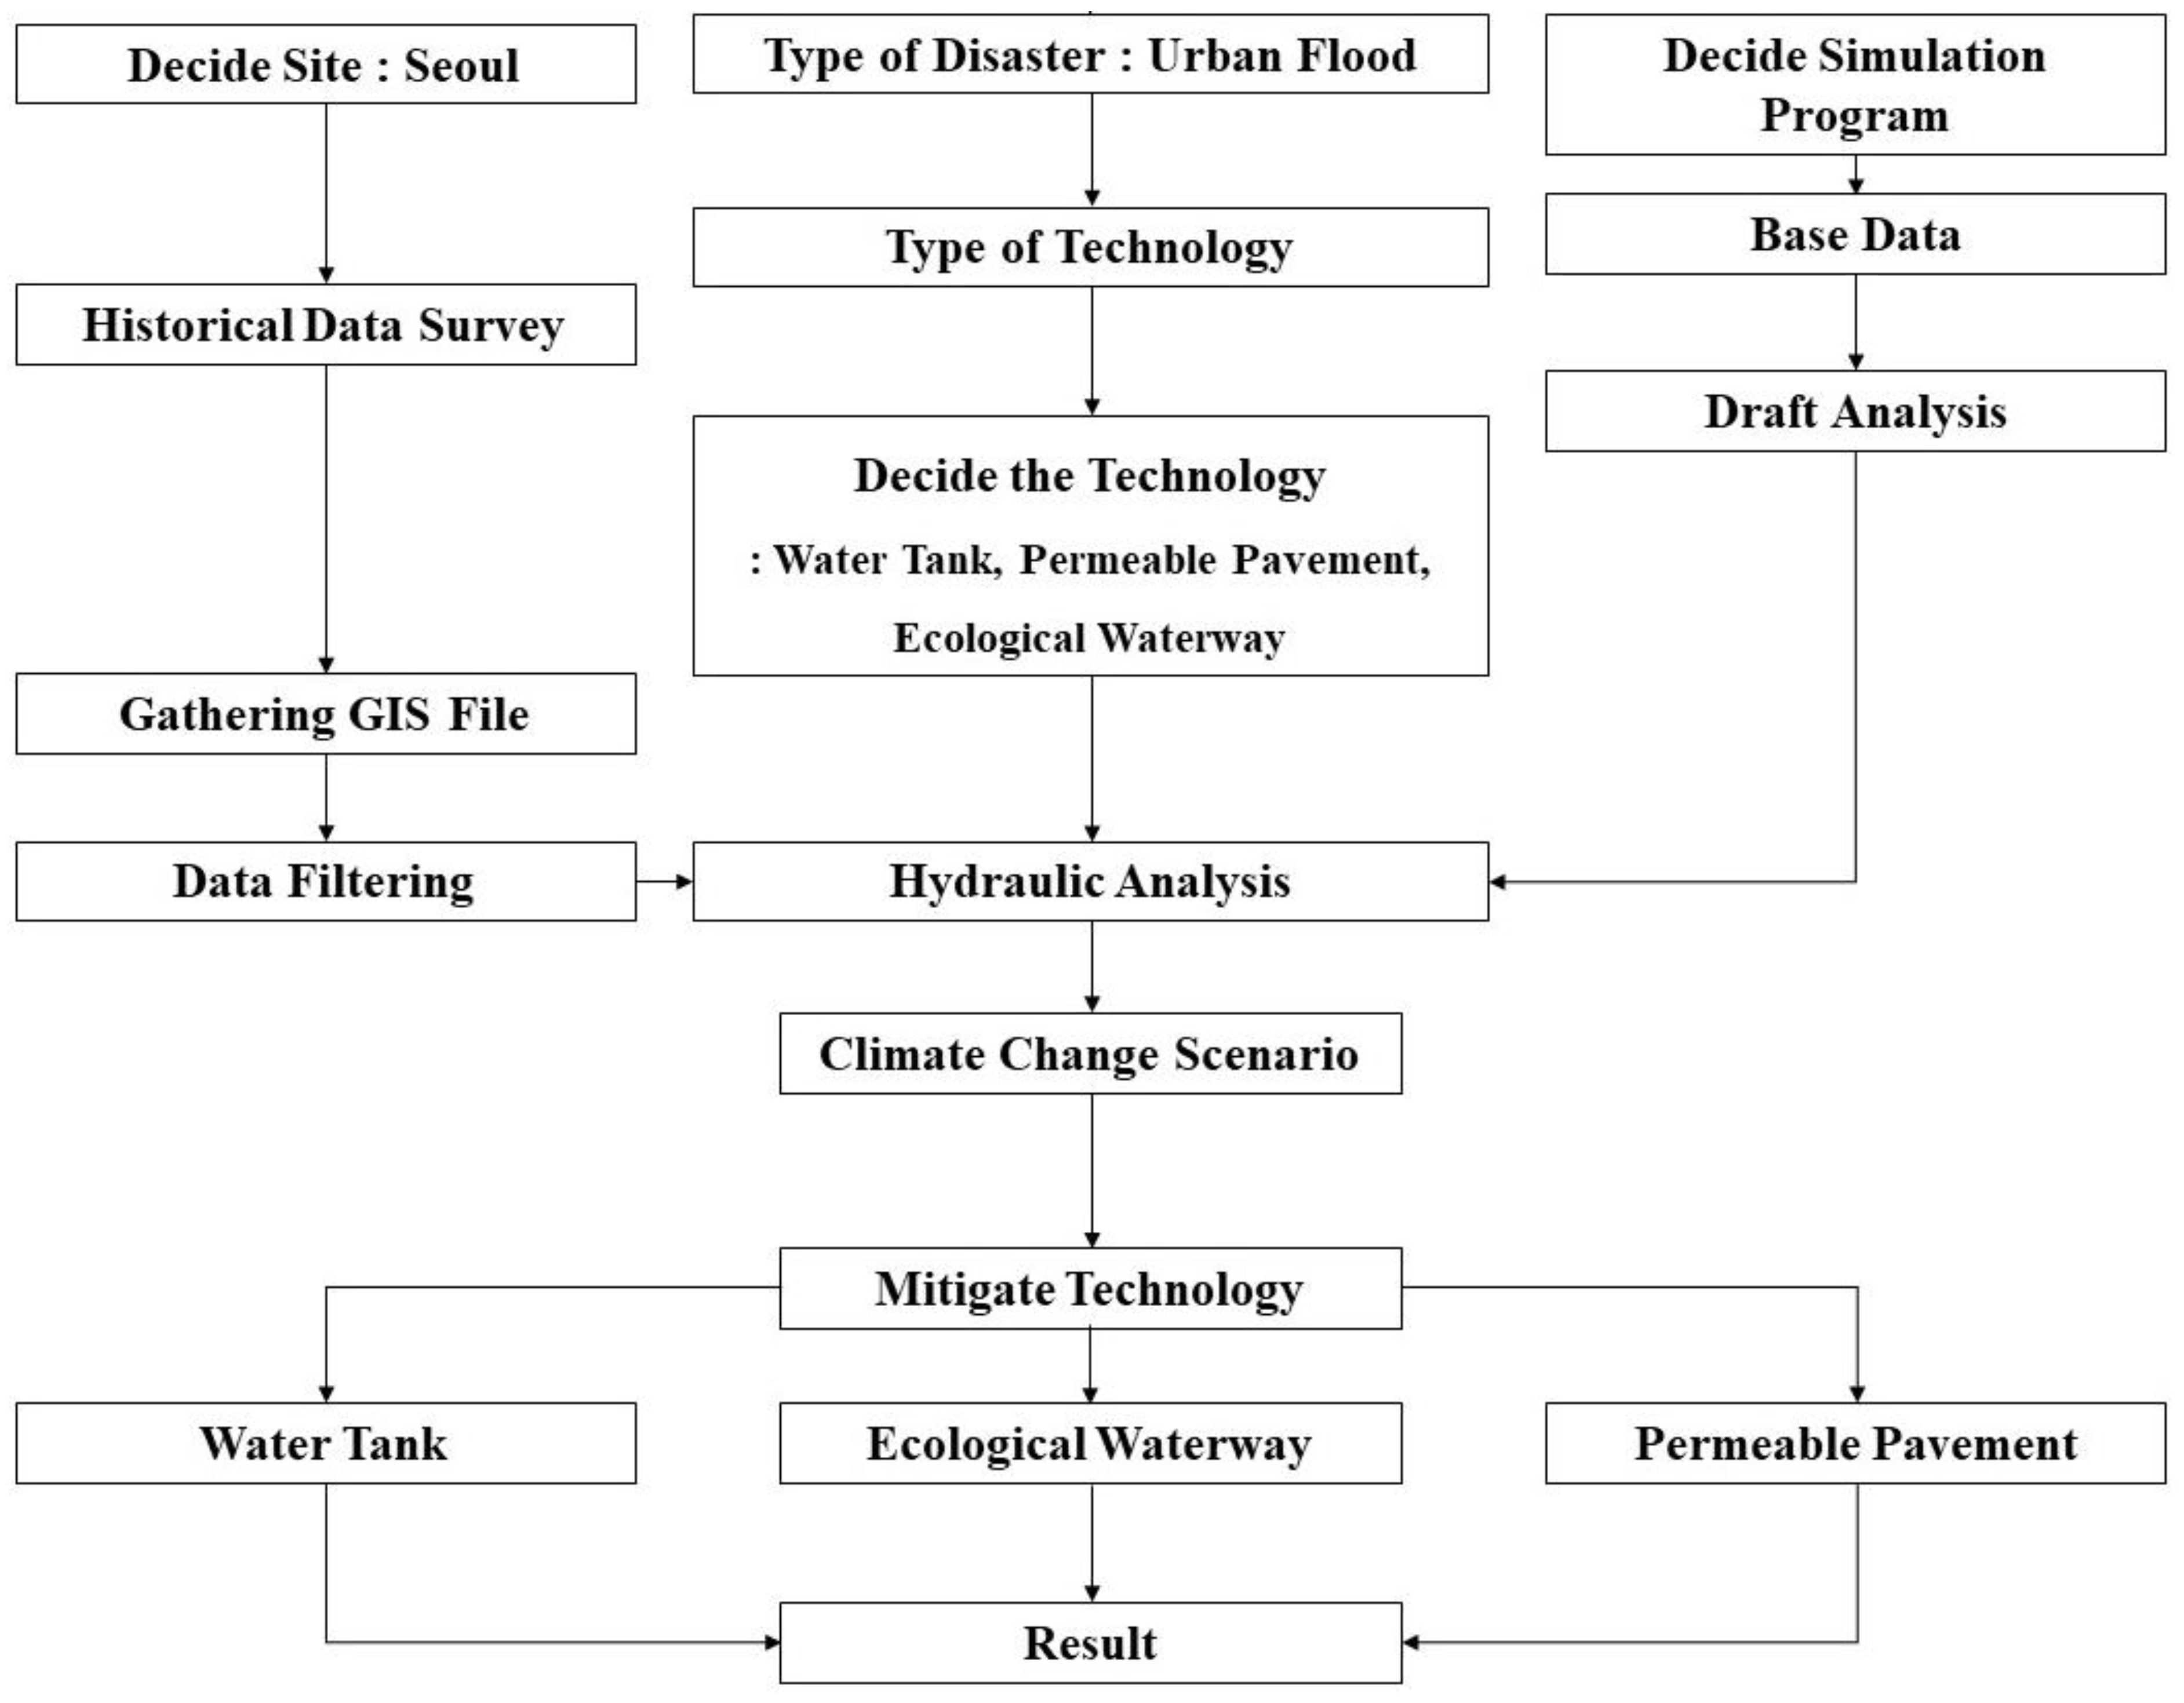
The flowchart of the current research is illustrated in Figure 4. First, a flood mitigation technology is selected, and the capacity of each mitigation technology is calculated. Second, by using historical data, the current flood threshold in the Seoul Metropolitan Government is analyzed. Third, the climate change scenario is analyzed to predict the possibility of future flooding. Finally, the amount of run-off is analyzed when each mitigation technology is installed.
3.2. Hydrologic Analysis
3.2.1. Digital Elevation Model (DEM)
To build a DEM, the 3D terrain (Tin File) is converted into an Elevation Sharp extension file, and this Tin file is replaced with the Raster file to complete the basic DEM. Later, the building’s Raster file was created, and the two files were merged. Cell size in the Raster file was based on 2.5 m to build more accurate data. If the area is large according to each distinguishing feature, the resolution of the cell size is 10 m [35].
3.2.2. Forming a Watershed Area
The ArcHydro plug-in was used for watershed export. The sequence within the program for building the watershed is demonstrated in Figure 5.
Flow Accumulation produces the rainfall flow based on the data produced in Flow Direction and specifies the size of the flow. In this study, the minimum size of the flow (Streamline) was set to 30 m. After the streamline is derived, the work to make a polygon is carried out. The catchment is the stage of obtaining the basin, and the drainage line shows how water flows and drains in a set area based on previous analysis. Analysis using the drainage line is used to classify the area of flooding and watershed [36,37]. Subsequently, the watershed, which represents how much influence the area has when water flows into one point, is shaped.
3.3. Application of Mitigation Technology and Estimation of Flood Damage
The mitigation technologies take into account all of the abovementioned water tanks, ecological waterways, and permeable pavement. The amount of run-off was calculated by dividing the mitigation method into type A to type D. Type A refers to the amount of run-off that can occur in the current facility when the RCP 4.5 and RCP 8.5 climate change scenario is applied. Type B refers to the amount of run-off that can occur when a water tank is installed, Type C refers to when the permeable pavement and water tank were installed, and Type D refers to when all mitigation technologies have been installed. It is assumed that both permeable pavement and ecological waterways will be installed on sidewalks with more than six lanes, and it is predicted that the only permeable pavement will be installed on walkways with more than four lanes and less than six lanes. The capacity formula [19,24,26] for each mitigation technology is shown in Equations (1)–(3)
where is the capacity of the water tank (m3); is the area of building in the watershed (m2).
where is the capacity of permeable pavement (m3); is the length of roads with more than four lanes and less than six lanes (m); is the length of roads with more than six lanes (m); the area, 0.296 m2, was calculated by referring to the section of the permeable pavement in the Seoul Metropolitan Government report [24] designed in 2009.
where is the capacity of the ecological waterway (m3).
GIS analyzes the space that can be installed in the watershed for each technology. The capacity of the mitigation technology per unit area shown in Section 2.1 Alternative mitigation options is multiplied to calculate the capacity of rainfall by each length of space. Finally, the amount of run-off is calculated by subtracting the capacity that can be reduced for each type from the amount of rainfall that can occur.
3.4. Calculation of Current Rainfall Capacity and Run-Off
To figure out the effect after mitigation technology is installed, the calculation of the capacity of rainfall per hour in the current state is important for the Seoul Metropolitan Government. It is common to use hydrodynamics because floods are calculated by changing precipitation per hour. This requires detailed modeling of various factors such as land use, infiltration, soil type, sewer pipes, manholes, etc. [16]. This interpretation is generally used on a small scale of the unit, and there were limitations when conducting a dynamic analysis of the entire Seoul Metropolitan Government. Moreover, local governments do not analyze a clear threshold on flooding. Therefore, each local government must analyze the threshold for flooding. It was assumed that the flood will occur between the minimum precipitation in the year when flooding occurred and the maximum precipitation in the year when flooding did not occur. Thus, using historical data from 2001 to 2019, the historical estimation method was used to calculate the capacity of rainfall in the current state as given in Equation (4):
where is the capacity of rainfall per hour for each district (mm/hr); is the minimum amount of rainfall per hour at the time of flooding (mm/hr), and is the maximum hourly rainfall in the case of no flooding (mm/hr).
During the period of collecting historical data, the Seoul Metropolitan Government aimed to become a “sustainable city” [38]. This focused on maintaining existing facilities without major civil engineering or development. Therefore, there were no significant changes in watershed or DEM in the last 20 years. However, since the study analyzed a very large site, some errors in watershed change could exist.
The rainfall capacity for each district is shown in Appendix A. The district with the highest capacity of rainfall per hour is Geumcheon-gu, which is believed to be capable of accommodating up to 82.75 mm per hour, while Yongsan-gu, with the lowest capacity for rainfall per hour, is expected to accommodate up to 38.5 mm per hour [39].
Using Appendix A, the amount of run-off for each district capacity can be predicted. Assuming that up to 100 mm/hr of rainfall has fallen in Gangnam-gu, the run-off of 55 mm/hr and the resulting damage are expected to occur within the watershed of the city. Equation (5) provides the formula for calculating the amount of run-off for each district:
where is the amount of run-off (m3), is the precipitation per hour (mm/hr), is the area of the watershed (m2), and is the duration of the rainfall (hour). This is a method of multiplying the area by the expected unit run-off per hour, and finally the run-off in volume units is calculated.
3.5. Estimation of Hourly Precipitation in Climate Change Scenarios Using the Huff Curve
The RCP scenario provided by the Climate Information Portal analyzes daily rainfall up to the year 2100. However, when planning general hydrology and flood mitigation technologies, it is necessary to convert daily precipitation (mm/day) into hourly precipitation (mm/hr) because it is calculated every hour when planning flood mitigation technologies. To calculate rainfall per hour in the climate change scenario, Huff dimensionless curves were used [40,41].
In the Huff dimensionless curve, rainfall duration is divided into four quartiles. To classify the rainfall into four time-groups, the cumulative duration of the individual rainfall and the resulting cumulative rainfall are expressed in the form of percentages as illustrated in Equations (6a) and (6b), respectively [42].
where PT(i) is the non-dimensional cumulative time of T(i) at a random time, T(i) is cumulative time from the start of rainfall to the ith time, is the total rainfall duration, i is the unit increment count, PR(i) is the non-dimensional cumulative rainwater at random time (T), R(i) is the cumulative rainfall from precipitation T(i) to random time, and is total rainfall during .
The Huff dimensionless curve is shown in Figure 7. Korea’s official agencies, including the Ministry of Environment and the Ministry of Land, Infrastructure and Transport, mainly use the rainfall type in the third quartile. This is a regression formula presented by the Ministry of Construction and Transportation of the Republic of Korea, which is optimized for the Korean Peninsula [43]. In this study, the hourly rainfall was analyzed using the rainfall form in the third quartile as shown in Equation (7):
where X is the dimensionless precipitation time (%), and Y is the dimensionless cumulative rainfall (%). In other words, the X-axis represents the total precipitation time as a percentage, and the Y-axis means the total precipitation as a percentage. For instance, if 100 mm of rainfall fell for 10 h, the value indicated by 100% of the X-axis is 10 h and the value indicated by 50% is 5 h. The value indicated by 100% of the Y-axis is 100 mm rainfall and 50% is 50 mm rainfall. This study covers the analysis of every 10 years until 2100.
4. Results and Discussion
4.1. Site Analysis
4.1.1. Watershed
Among the 25 districts, Seocho-gu had the largest watershed of 9,385,502 m2. The watershed area covers 19.9% of the total area of Seocho-gu of 47,140,000 m2. On the other hand, Guro-gu had the smallest watershed area, calculated as 265,350 m2, accounting for 1.31% of the total Guro-gu area of 20,120,000 square meters. There are two main reasons that Guro-gu has a small watershed compared to Seocho-gu and other districts.
The slope of more than 60% of the Guro-gu watershed is less than 10%. Furthermore, there are many apartments and buildings compared to other watersheds. This means that there is a wide range of living areas and it is difficult for a catchment to form when precipitation occurs. The second reason is that the Guro-gu watershed is formed on the boundary of the district. In other words, it shares the watershed of another neighboring city.
4.1.2. Building and Road Area in the Impact Area
The area occupied by buildings and roads throughout the Seoul Metropolitan Government’s watershed area is as shown in Figure 8. Within the watershed of each sphere, buildings were shaded, roads with more than six lanes were marked in red, roads with more than four lanes and less than six lanes are highlighted in green.
The district with the largest building area was Seocho-gu, which was 2,122,317 m2, covering 22.6% of the total Seocho-gu watershed area of 9,385,502 m2. This shows that Seocho-gu has the largest building area and watershed area.
In the case of the watershed, Guro-gu had the smallest area, while in the case of the building area in the watershed, Seongbuk-gu had the smallest area. The watershed of Seongbuk-gu is 26,231 m2, which is approximately 8.62% of the Seongbuk-gu watershed area of 304,238 m2.
In Seongbuk-gu, the watersheds are divided into two areas and distributed. The first area was an apartment residential complex with relatively large open spaces, while the second area of the watershed was relatively small.
In the case of Seongbuk-gu, it is deemed that additional standards for the introduction of water tanks should be applied considering regions with large areas of natural green parks and open spaces. Watershed, building area, and road length for each district are shown in Appendix B.
Using the length of the road and the building area in the watershed as suggested in Appendix B, the capacity for each district and technology is calculated. The capacity of each district and technology is shown in Table 3.
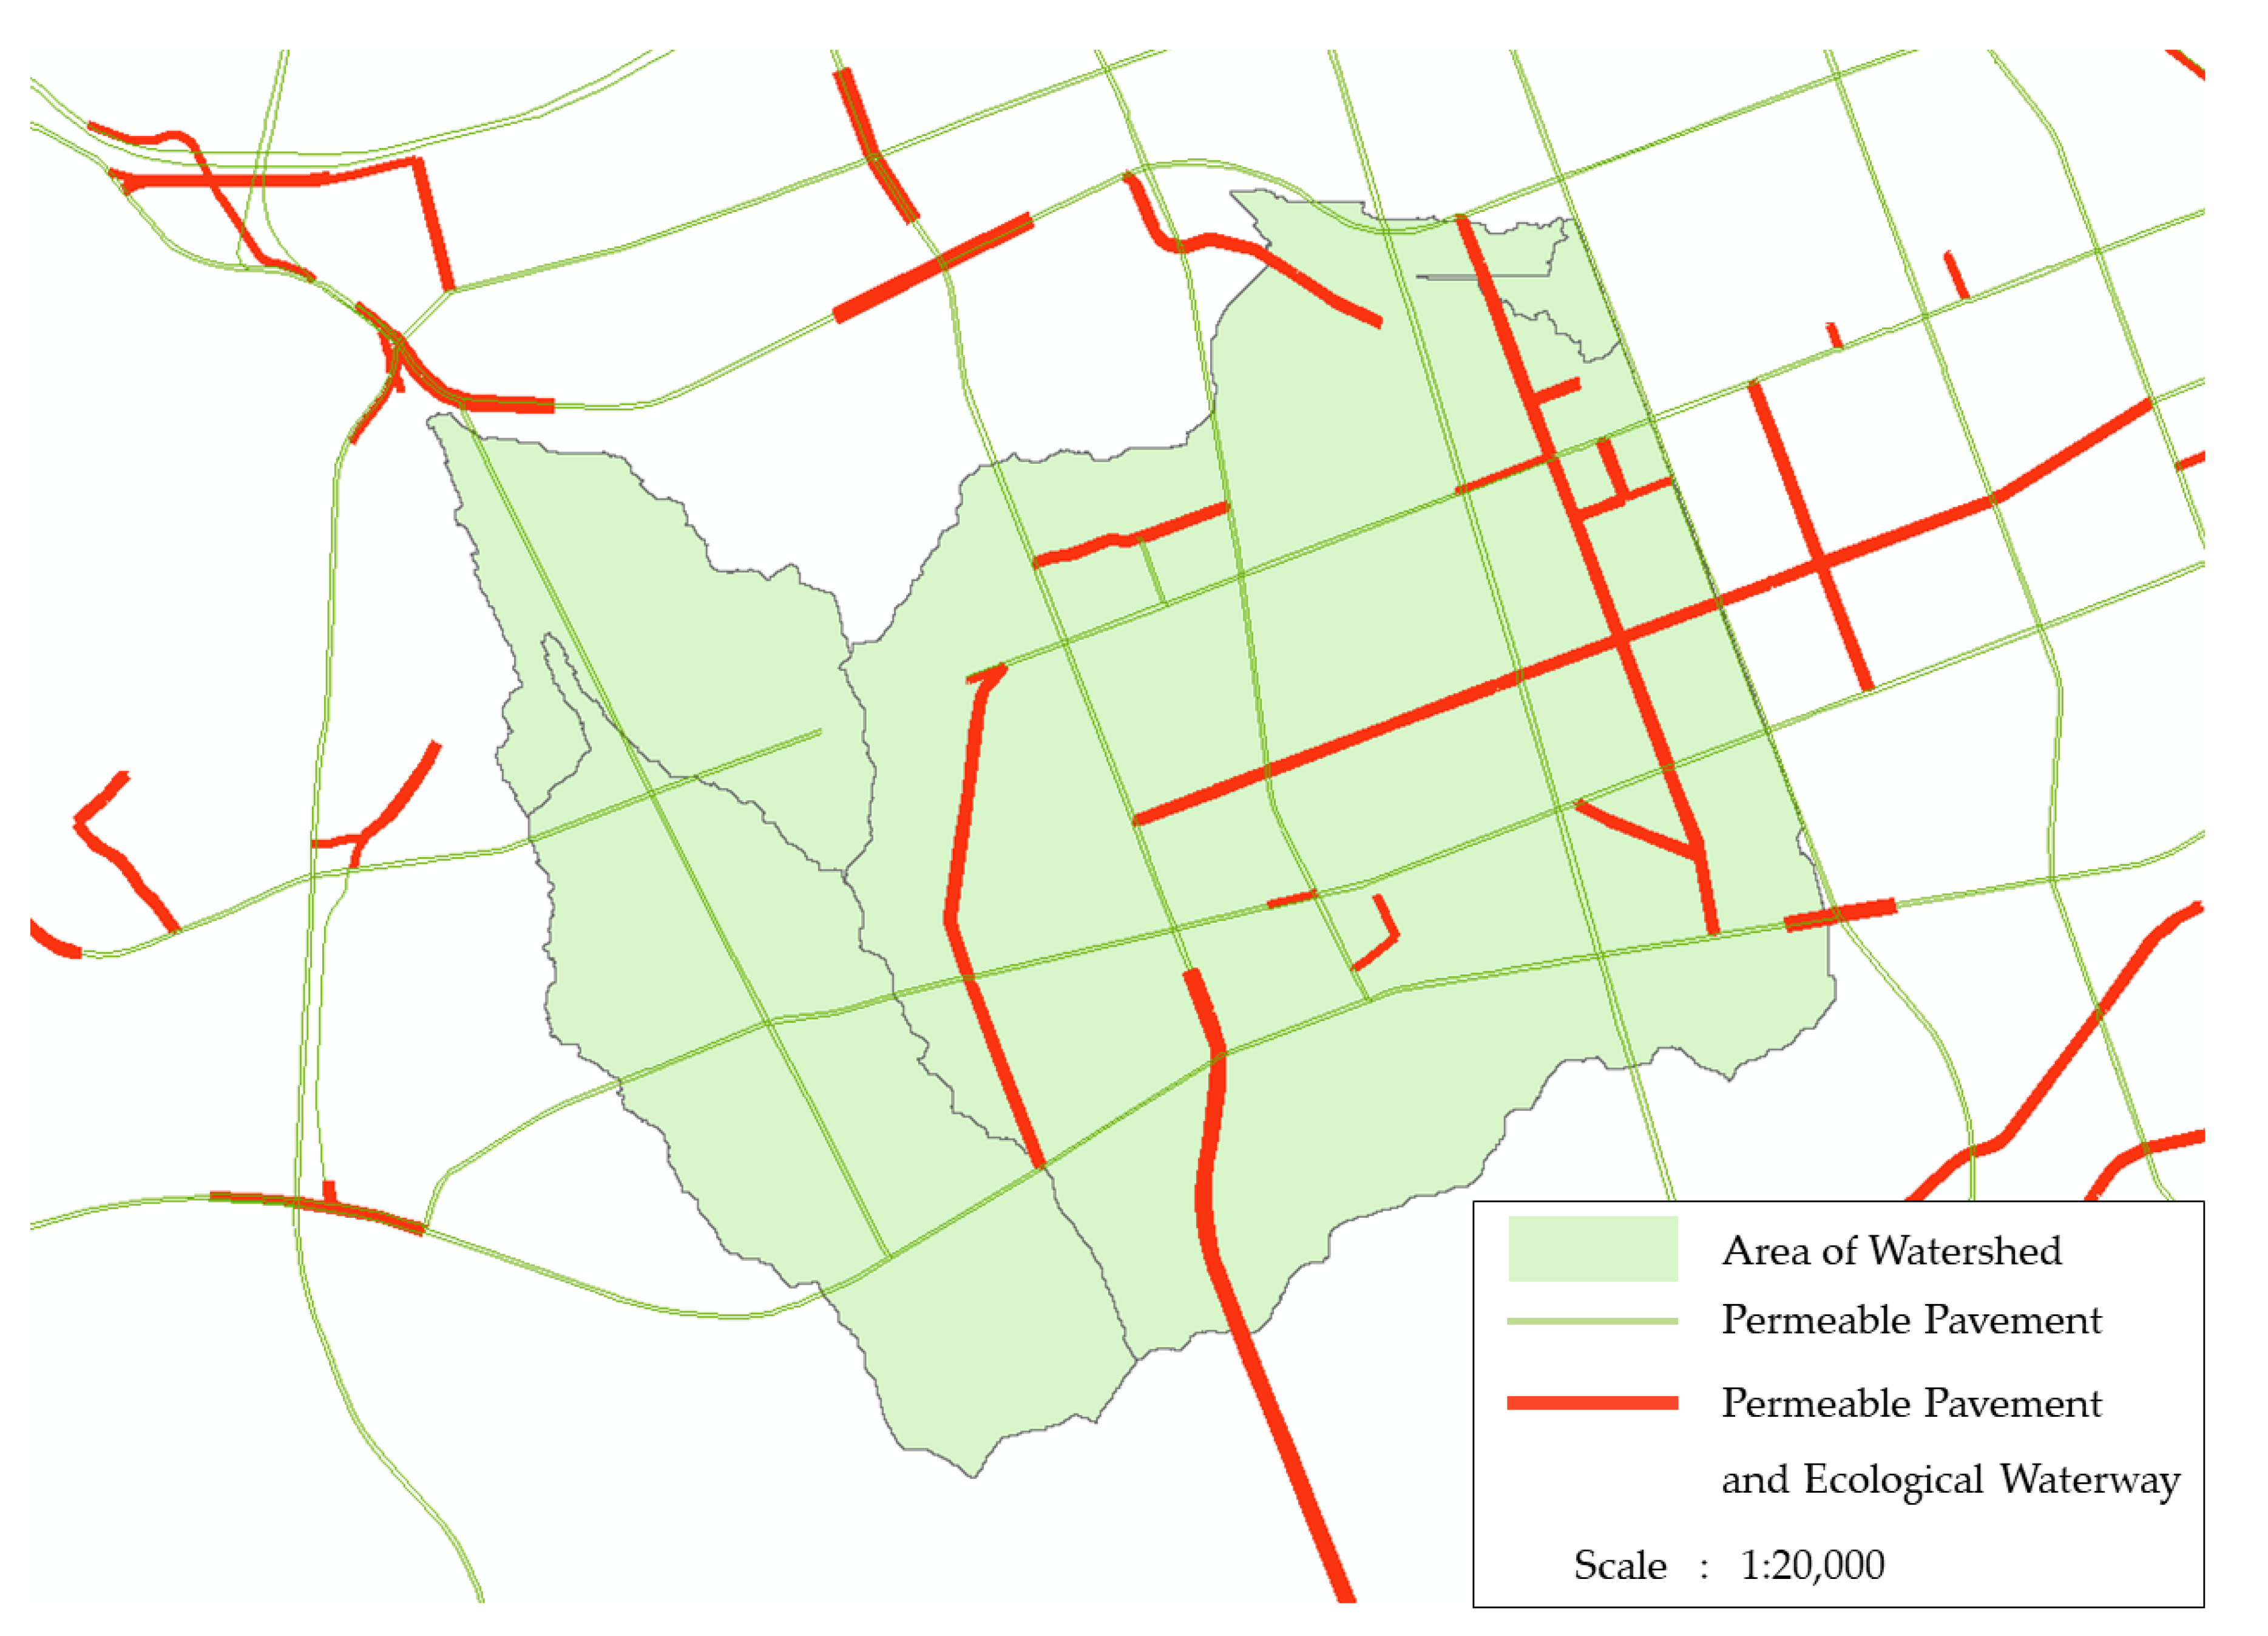
When the permeable pavement and ecological waterways which are shown in Figure 9 are applied for additional capacity, the district with the largest capacity of technology is Seocho-gu.
In the case of Seocho-gu, the total length of the road, which is more than four lanes and less than six lanes in the watershed, is estimated to be 18,606 m. In addition, a total of 4858 m was identified as six lanes or wider.
The capacity of the permeable pavement that can be installed in Seocho-gu is 13,891 m3, which is analyzed to be the most efficient of the 24 districts. In the case of ecological waterways, it is estimated that 5222 m3 of rainwater can be additionally stored. The additional capacity of the two facilities is 19,113 m3. This is an effect of 118% compared to when only water tanks are installed.
Assuming that facilities can be installed on a limited basis in consideration of economic feasibility, water tank and permeable pavement or water tank and ecological waterways may be applied, respectively. When water tank and permeable pavement are installed, the effect could be 113.1%, and when water tank and ecological waterways are installed, the effect could be 104.92%, compared to the installation of the water tank only.
On the other hand, in Seongbuk-gu, only a few areas were formed for the installation of permeable pavement and ecological waterways within the area of the watershed, as illustrated in Figure 10.
In the case of six or more lanes within the watershed, a total of 270 m could be installed. At this time, it was estimated that the volume of rainwater acceptable in a permeable pavement was 159 m3 and the volume acceptable in an ecological waterway was 290 m3.
In addition, the two facilities had an additional capacity of 450 m3, which resulted in an effect of 134.31% compared to the installation of only water tanks. It is estimated that 112% of the water tank and permeable pavement will be installed, and 122% of the water tank and ecological waterway will be used.
Seongbuk-gu is in contrast to Seocho-gu, which has the largest capacity for permeable pavement and ecological waterways. In the case of Seocho-gu, if one of the techniques of ecological waterways and the permeable pavement is installed, it will be efficient to reduce floods by focusing on the construction of permeable pavement. On the other hand, in the case of Seongbuk-gu, it is found that installing an ecological waterway is more efficient. In the same way as above, two efficient defensive techniques were organized in 24 districts, as shown in Table 4.
In the case of Jongno-gu (Figure 11), 11,682 m of roads with more than four lanes was estimated to be within the entire watershed, of which 76.9% was suitable for installing ecological waterways.
When an ecological waterway is installed in a total section of 8983 m, 9656 m3 of rainwater can be stored. This is considered to be around 39.6% more efficient than when only the permeable pavement was installed in the entire section (6915.74 m3).
4.2. The 10-Year Frequency Flood Damage Analysis for 2021–2100
Huff curves were used to predict maximum precipitation per hour using the daily maximum precipitation provided by the climate change scenario. The formula in the third quartile was used. To estimate rainfall duration, the analysis was conducted in three types: 24-h distribution, 12-h distribution, and 6-h distribution. Figure 12 shows the cumulative graph of maximum precipitation per hour on 27 July 2090, for a rainfall duration of 24 h.
It is predicted that the year 2090 will experience the highest amount of precipitation when analyzing the RCP 8.5 scenario with a frequency of 10 years. The day with the highest daily precipitation in 2090 appears differently for each district from 16 to 17 July. The district with the highest daily rainfall was Mapo-gu, which shows a scenario of 373.82 mm of rainfall during the day. The average rainfall in Seoul is expected to reach 302.27 mm.
The uppermost curve belongs to the cumulative precipitation of Mapo-gu, while the lowest one shows that of Geumcheon-gu, which has a daily precipitation of 123 mm. This means that there may be a 250 mm difference in rainfall in two different districts in Seoul during one day. In other words, it is expected that there will be strong local rainfall in the Seoul Metropolitan Government. This is quite different from the current graph.
From the analysis of the historical data, the heavy flood that occurred on 21 September 2010 was due to the shortest rainfall duration of 11 h from 12 to 23. In other words, it is unlikely that extreme precipitation will fall in six hours under the current conditions. However, the rainfall duration was set to 6 h as it is common for the analysis considering safety factors and design mitigation techniques for future disaster prevention.
RCP 8.5 and 4.5 scenarios were analyzed and, respectively, revealed a precipitation per hour for the frequency of 10 years as shown in Appendix C and Appendix D. The red-colored compartments are difficult to completely prevent with the current state of mitigation technology; thus, it is expected that urban flooding will occur. On the other hand, the green-colored compartments are believed to be able to defend themselves even in the current state.
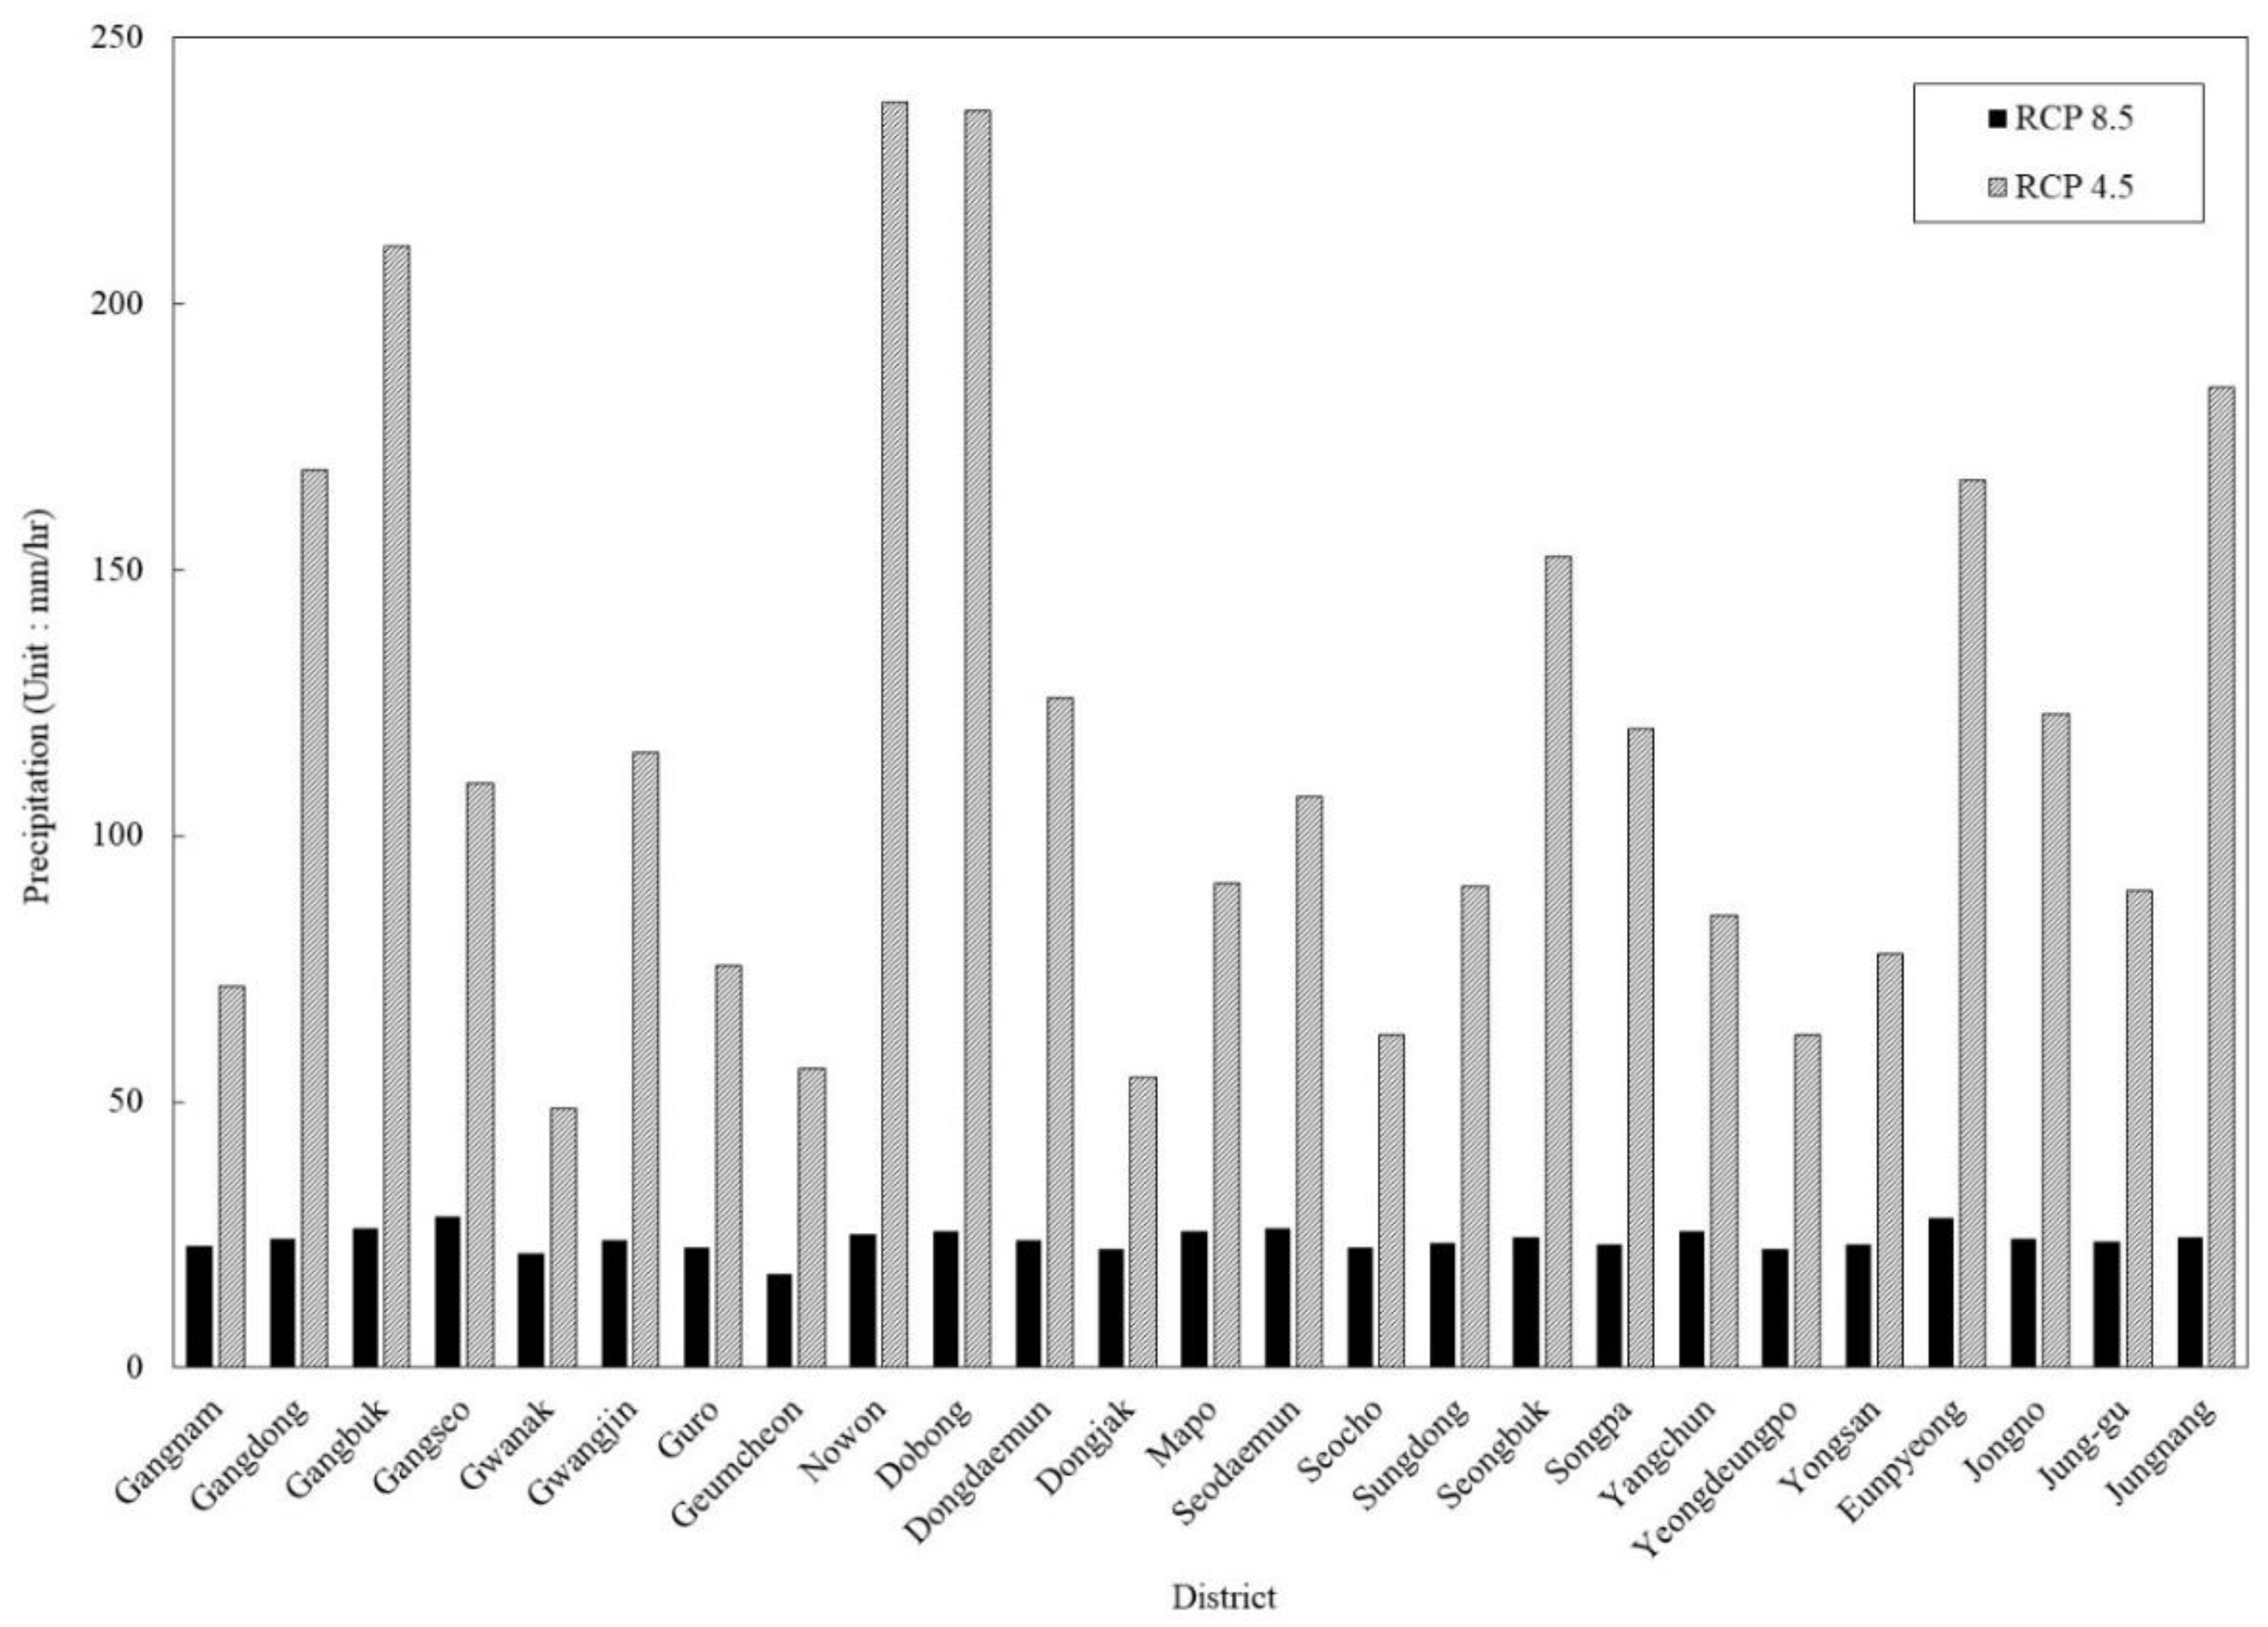
Referring to Appendix C and Appendix D, 2100 requires preparation for the disaster mitigation technology for the RCP 4.5 scenario. Figure 13 shows very different forms of RCP 4.5 and 8.5.
For RCP 4.5 scenario 2100, the maximum daily rainfall is approximately 690 mm, with maximum hourly precipitation of 238 mm. On the other hand, Gwanak-gu, which has the least precipitation, is expected to have a maximum daily rainfall of 142 mm and maximum hourly precipitation of 48 mm. In the RCP 4.5 scenario 2100, the standard deviation of precipitation was 45, showing an uneven distribution for each district.
On the other hand, the RCP 8.5 scenario of 2100 showed a very even distribution, with a standard deviation of 1.58. In the case of Nowon-gu, the hourly precipitation in the two scenarios is expected to be around 213 mm apart.
4.3. Variation of the Flooded Area after Application of Disaster Reduction Technology
In this study, the changing flooded areas were identified when the three mitigation technologies were applied to the watershed. A total of 24 districts in Seoul have been analyzed, and three districts in Gangnam-gu, Dongdaemun-gu, and Jung-gu have been considered. After applying the mitigation technology, the run-off values of the Seoul Metropolitan Government were obtained as provided in Table 5.
As shown in Table 5, according to the installation rules assumed in this study, the volume of water tanks that can be installed throughout the Seoul Metropolitan Government is 776,588 m3, the volume of permeable pavement is 89,049 m3, and the volume of the ecological waterway is 81,986 m3. When all technologies are introduced, the capacity secured by the Seoul Metropolitan Government is 947,623.68 m3, and if only two technologies are applied, the water tanks and permeable pavement will be the most efficient cases.
When all technologies are installed, the RCP 8.5 scenarios in 2050 and 2060 are expected to reduce the run-off by 100 percent in all areas of the Seoul Metropolitan Government. RCP 8.5 scenarios in 2020, 2040, 2070, 2080, 2090, and RCP 4.5 scenarios in 2030, 2080, 2090, 2100 are expected to have significant reductions. After 2050, large-scale flooding is expected to occur. The additional mitigation technology, therefore, is necessary.
For easier understanding, the run-off of 2090 was organized by the watershed of each district. Several districts, including Gwanak-gu and Guro-gu, show that the mitigation technology reduces all run-off. As seen in Table 6, the total value is the same as the value for 2090 given in Table 5.
In the case of Gangnam-gu, for the RCP 8.5 scenario, floods will occur in 2080 and 2090, with the RCP 4.5 expected to have a total of three floods in 2080, 2090, and 2100.
The watershed area of Gangnam-gu was 1,582,619 m2, and the building area of the watershed was 494,706.65 m2. The total capacity of the rainwater water tank that can be installed was 24,735.33 m3. The length of roads with four to six lanes was 3355 m, while those with six lanes or more were 3451 m. The total rainwater acceptable volume of the permeable pavement was 4029.15 and 3709.83 m3 for the ecological waterway.
RCP 8.5 estimated that there will be 50.85 mm of rainfall per hour in 2080, with approximately 9255.52 m3 of run-off occurring in the watershed, which may cause flooding. In this case, it is believed that all floods can be reduced by using one technique, namely a water tank.
On the other hand, for RCP 4.5, it is predicted that there will be rainfall of 71.78 mm per hour in 2100, with approximately 42,393 m3 of run-off occurring in the watershed. Figure 14 shows the size of the flood area throughout Gangnam-gu in 2100 for RCP 4.5. When only one technology, the water tank, is applied, only 17,658 m2 of run-off water can be generated, resulting in an effect of around 58% compared to before the technology’s installation. In addition, run-off could be further reduced by 9.6% in permeable pavement and 8.8% in ecological waterways. When all mitigation technologies are applied, 77% of flood run-off can be reduced. The area of flooding after technology is applied in Gangnam-gu is shown in Figure 15.
In the case of Dongdaemun-gu, there are two watersheds, which are located inside and at the end of the district. Dongdaemun-gu will be flooded once in 2090 with RCP 8.5, twice in 2080, and 2100 with RCP 4.5.
Dongdaemun-gu had a relatively small watershed at 915,256 m2. The building area that is formed inside the watershed is 225,245 m2, which is around 24.6%. The total volume of the water tank is 11,262 m3. The total length of roads between four and six lanes was 2101 m, while for the roads above six lanes, it was 6752 m. The permeable pavement can store a total of 5241 m3 of precipitation, and the ecological waterway can store 7258 m3.
For the RCP 8.5 scenario, there will be 119.69 mm of rainfall per hour in 2090. The total run-off volume is 53,026 m3, and when all three technologies are installed, the volume of run-off is estimated to decrease to 29,265 m3. This represents a 44.81% decrease from the time of having no technology installed.
For the RCP 4.5 scenario, it is expected to bring around 65 mm of rainfall per hour in 2080, with 3022 m3 of run-off occurring in the watershed, which will possibly cause flooding. With one water tank installed, 11,262 m3 of rainwater can be stored; thus, flooding can be prevented without installing the other two mitigation technologies.
For the RCP 4.5 scenario in 2100, it is predicted that 126.04 mm of rainfall per hour will occur, which is the highest hourly precipitation of the two scenarios. Figure 16 shows the size of the flood area throughout Dongdaemun-gu in 2100 for RCP 4.5. This is more than double the 61.75 mm/hr of acceptable precipitation per hour in Dongdaemun-gu. The volume of run-off is estimated to be 58,844 m3.
Under the above circumstances, the flood volume in Dongdaemun-gu is expected to be reduced by around 19.14% when water tank technology is installed. It is estimated that there will be an additional flood reduction effect of 8.91% for permeable pavement and 12.33% for ecological waterways, with the final run-off volume of 35,082 m3 when all three mitigation technologies are installed, accounting for 59.62% of the previous volume. The area of flooding after technology is applied in Dongdaemun-gu is shown in Figure 17.
For Jung-gu, the last district to be considered in this study, it can be seen that the area of the watershed is formed at the end of the district compared to Gangnam-gu and Dongdaemun-gu. The total area of the watershed is 1,868,929 m2 and the building area is 530,119 m2.
On average, the expected rainfall is not as high as in other districts, so flooding does not occur frequently. However, in the case of RCP 8.5 scenario 2090, heavy rain of 125 mm per hour is expected, requiring preparation.
When the facility is not installed, the volume of run-off is 109,241 m3. When the water tank is installed, the volume of run-off water is expected to decrease by 82,735 and 67,613.85 m3 when two additional mitigation technologies are installed. Although this is a decrease of around 38% of the total run-off, it cannot be a complete countermeasure against flooding, so it is deemed that additional precautions should be taken.
For the RCP 4.5 scenario 2080, a maximum of 75 mm of precipitation per hour is estimated. The watershed area is expected to have 15,880 m3 of run-off. In this case, the only water tank serves as a complete disaster prevention facility.
On the other hand, in the case of 2100, 89.61 mm of rainfall is predicted to occur per hour, so it is deemed that all three technologies should be installed. The volume of run-off water expected after the technical application is 43,192 m3, and the amount of rainfall that can be reduced by just one technique, the water tank, is 26,506 m3. The amount of run-off can be reduced by 61.37% and additionally by 18% by permeable pavement and 17% by the ecological waterway. Finally, the amount of water that can be reduced is 96%, and only 1565 m3 of water is expected to cause flooding.
It is observed that by having the mitigation technology installed, Guro-gu is believed to be able to prevent flooding in all cases. Guro-gu has a total of three floodings (years 2070, 2080, and 2090) in the RCP 8.5 scenario and a total of two floodings (years 2090 and 2100) in the RCP 4.5 scenario.
Guro-gu has a watershed area of 265,350 m2 and a building area of 66,000 m2. The watershed in Guro-gu is located at the end of the district. There were no four-lane or six-lane roads, and the total length of the boulevard having more than six lanes was 1331 m. Therefore, the volume of rainwater that can be stored in the water tank was 3300 m3 while the volume of permeable pavement was 788 m3 and the volume of the ecological waterway was 1431 m3. It can be concluded that, compared to other districts, this area is expected to have a greater effect as an ecological waterway against flooding.
In the case of the RCP 8.5 scenario 2080 and RCP 4.5 scenario 2090, it is believed that the installation of the water tank will prevent urban flooding. A reason for this was that Guro-gu had a much lower hourly precipitation of 10-year frequency compared to other districts. The RCP 4.5 scenario 2100 for Nowon-gu predicted up to 238 mm/hr, Gangbuk-gu up to 211 mm/hr, and Guro-gu down to 76 mm/hr. For the RCP 8.5 scenario, the maximum precipitation per 10-year frequency per hour is 51 mm/hr, and the maximum precipitation per 10-year frequency for the RCP 4.5 scenario is 43 mm/hr, far below the current state of precipitation acceptable to the district.
In the case of the RCP 8.5 scenario 2070, 2090, and RCP 4.5 scenario 2100, it is believed that the installation of the water tank cannot prevent flooding across the city. However, it is deemed that the combination of permeable pavement and ecological waterways will prevent domestic flooding from occurring in cities in all cases.
In the case of 2070, the installation of only a water tank is expected to reduce the overall run-off by around 60.7% of 5441 m3, and the effect of the permeable pavement by 14.5% and ecological waterway by 24.9%.
According to this analysis, the mitigating technologies used in this study can lower vulnerability within an urban area. There are two reasons. First, it is possible to increase the adaptive capacity to climate change by applying sustainable technologies such as water tanks, ecological waterways, and permeable pavement. The second is that the number of days of flooding can be reduced, so exposure to climate change could be decreased. However, this study was unable to assess changes in sensitivity, which is the third of the limitations described below. In subsequent studies, it is judged that more quantitative vulnerability reduction should be measured using vulnerability assessment indicators.
This study has identified that flooding at the local level will be more frequent and is meaningful in analyzing the quantitative effects of disaster mitigation technologies. In addition, when each local government installs flood mitigation technology in the future, quantification data should be provided to ensure optimized decision-making for each situation.
The above results can be discussed in some ways compared to other studies related to flood mitigation. In another study, SWMM analysis was conducted in the southern city of Beijing, China. A previous study revealed that a type of permeable pavement called biotention cell and an ecological waterway called vegetated swale were very effective in reducing urban flooding [44]. Nevertheless, these studies concluded that damage could occur in the case of strong storm water. Another study investigated how much inundation can be reduced by using a combination of water tank and green infrastructure in Melbourne, Australia and determined that the maximum downstream inundation area can be reduced by an average of 91% [45]. In a study on the calculation of flood reduction using green infrastructure in Italy, run-off in a total of nine regions was analyzed, and the reduction effect was unevenly distributed in most regions. This is in agreement with this study, which analyzed all 25 districts in the Seoul Metropolitan Government, and the aforementioned study found that the effect of the amount of run-off reduction is different for each district, which is the same result as the current study [46]. The above three studies differ from this study in that they did not use a climate change scenario. However, the previous studies also showed that a water tank and combination of green infrastructure could achieve the greatest reduction effect of run-off.
5. Concluding Remarks
The objective of this study was to analyze urban flood damage over the next 80 years (2020–2100) that could be caused by the climate change scenario. The study selected disaster mitigating technologies and analyzed their impact on disaster mitigation. Furthermore, the capacity and performance of the technologies that may change in the future were analyzed.
Using the climate change scenario on the Korean Peninsula, this study identified the amount of flood damage that could occur until 2100 and analyzed the effects of mitigation technologies. Based on the results, this study can draw three main conclusions. The first is that the possibility of flooding that could occur according to climate change scenarios was analyzed at a 10-year frequency. Both the RCP 8.5 scenario and RCP 4.5 scenario showed frequent flooding after the year 2070. For the RCP 8.5 scenario, it is predicted that the year 2090 has the highest amount of precipitation. However, for RCP 4.5 scenario 2100, the maximum daily rainfall is approximately 690 mm, with hourly precipitation of 238 mm.
The second is that the capacity of each technology was analyzed. According to the analysis of this study, the volume of water tanks that can be installed throughout the Seoul Metropolitan Government is 776,588 m3, the volume of permeable pavement is 89,049 m3, and the volume of the ecological waterway is 81,986 m3.
Finally, the amount of run-off that can be reduced by each mitigating technology was quantified. In the case of the RCP 8.5 scenario, it could be reduced by 70% of run-off in year 2080 and 30% in year 2090. However, with the RCP 4.5 scenario, run-off will be reduced by 85% and 22% in 2090 and 2100, respectively. In the RCP 4.5 scenario in year 2100, additional mitigating technology would be required as around 200 mm of rain is predicted.
The limitations of this study can be highlighted by dividing them into four parts, and it is suggested that in later studies the following limitations should be resolved. The first limitation is uncertainty about climate change scenarios. Since changes in carbon emissions or scenarios can significantly change precipitation values, it is believed that future studies will develop into a more significant study if a scenario with fewer errors is used.
Secondly, the timing of maintenance of mitigation technologies was not considered. Lifetime or deterioration of facilities may occur, which has been overlooked—for example, water tank fatigue or changes to the amount of sediment that builds up inside.
The third limitation is that the study was conducted at a frequency of 10 years, as both RCP 4.5 and RCP 8.5 scenarios were analyzed daily. Subsequent studies suggest that more detailed and broader analysis should be conducted yearly.
Finally, cities can be urbanized, depending on the policies of decision-makers. For example, a building may be rebuilt, and the length or size of road may vary. Since only the climate change scenario was considered in this paper, social change factors are not reflected. Since this paper is based on the current state of facilities and the environment of society, decision-makers will have to consider these limitations when setting up flood measures. It is deemed that further cost-effectiveness analysis of these technologies should be conducted when the technology is installed in the current conditions and maintained in the future. Furthermore, the cost-effectiveness of the benefits obtained when these technologies mitigate flood damage should be analyzed. Future studies should be carried out to improve the above four limitations.
Author Contributions
J.K. (Junsuk Kang) designed and coordinated the study. J.K. (Jaekyoung Kim) performed the analytical and conceptual study under the supervision of J.K. (Junsuk Kang). J.K. (Junsuk Kang) reviewed the results of this study, and all authors have written and revised the text of this paper. All authors contributed to writing this paper. All authors have read and agreed to the published version of the manuscript.
Funding
This work was supported by Korea Environment Industry & Technology Institute (KEITI) through the R&D Programs, funded by Korea Ministry of Environment (MOE) (2018001310002). This research was also supported by the National Research Foundation of Korea and the Institute for Basic Science (NRF-2018R1D1A1B07045027).
Data Availability Statement
MDPI Research Data Policies.
Acknowledgments
This work is supported by Korea Environment Industry & Technology Institute (KEITI) through the R&D Programs, funded by Korea Ministry of Environment (MOE) (2018001310002). This research is also supported by the National Research Foundation of Korea and the Institute for Basic Science (NRF-2018R1D1A1B07045027).
Conflicts of Interest
The authors declare no conflict of interest.
Appendix A

Table A1.
Hourly Rainfall Capacity of Seoul Administrative District.
| District | Date | Date | |||
|---|---|---|---|---|---|
| Gangnam | 43 | 14 July 2009 | 47.5 | 21 August 2014 | 45 |
| Gangdong | 73 | 24 August 2003 | 79 | 21 September 2010 | 76 |
| Gangbuk | 58 | 20 August 2003 | 67 | 15 August 2010 | 62.3 |
| Gangseo | 50 | 2 July 2009 | 58 | 13 August 2010 | 53.8 |
| Gwanak | 56 | 22 July 2013 | 62.5 | 6 July 2012 | 59.3 |
| Gwangjin | 60 | 15 August 2012 | 68.5 | 4 August 2002 | 64.3 |
| Guro | 60 | 26 June 2005 | 63.5 | 24 August 2003 | 61.5 |
| Geumcheon | 68 | 15 August 2012 | 98 | 21 September 2010 | 82.8 |
| Nowon | 72 | 20 August 2003 | 83.5 | 15 July 2001 | 77.5 |
| Dobong | 61 | 10 August 2010 | 72.5 | 26 July 2011 | 66.5 |
| Dongdaemun | 58 | 13 July 2012 | 65.5 | 21 September 2010 | 61.8 |
| Dongjak | 47 | 26 June 2005 | 49 | 6 July 2012 | 48 |
| Mapo | 67 | 26 June 2005 | 69 | 24 August 2003 | 68 |
| Seodaemun | 52 | 26 June 2005 | 53 | 27 July 2011 | 52.5 |
| Seocho | 49 | 21 August 2014 | 56.5 | 6 July 2012 | 52.5 |
| Sungdong | 75 | 21 September 2010 | 84.5 | 15 July 2001 | 79.8 |
| Seongbuk | 59 | 6 July 2004 | 59 | 26 July 2011 | 58.8 |
| Songpa | 72 | 24 August 2003 | 72 | 27 July 2011 | 71.8 |
| YangChun | 66 | 26 June 2005 | 71.5 | 21 September 2010 | 68.8 |
| Yeongdeungpo | 58 | 26 June 2005 | 59 | 13 August 2010 | 58.3 |
| Yongsan | 38 | 21 August 2014 | 39 | 22 July 2013 | 38.5 |
| Eunpyeong | 52 | 26 June 2005 | 51.5 | 26 June 2005 | 51.5 |
| Jongno | 51 | 12 July 2013 | 58 | 26 July 2011 | 54.3 |
| Jung-gu | 60 | 24 August 2003 | 73.5 | 21 September 2010 | 66.5 |
| Jungnang | 62 | 22 August 2014 | 64.5 | 26 July 2011 | 63 |
Appendix B
Table A2.
Area of the Watershed, Building Area in the Watershed, Road Length for Each District.
| District | Watershed (m2) | Building Area in Watershed (m2) | Road A Length (m) | Road B Length (m) |
|---|---|---|---|---|
| Gangnam | 1,582,619 | 494,707 | 3355 | 3451 |
| Gangdong | 6,281,719 | 1,445,439 | 4871 | 3837 |
| Gangbuk | 2,747,831 | 887,047 | 2528 | 5699 |
| Gangseo | 5,182,188 | 1,002,454 | 7118 | 3342 |
| Gwanak | 3,912,091 | 851,795 | 1155 | 2086 |
| Gwangjin | 2,429,075 | 657,941 | 3356 | 892 |
| Guro | 265,350 | 66,000 | - | 1331 |
| Geumcheon | 4,167,619 | 809,444 | 1343 | 3605 |
| Nowon | 3,012,074 | 416,299 | 4621 | 4849 |
| Dobong | 208,294 | 475,941 | 2362 | 1185 |
| Dongdaemun | 915,256 | 225,245 | 2101 | 6752 |
| Dongjak | 4,698,162 | 1,443,029 | 989 | - |
| Mapo | 983,377 | 324,073 | 1413 | - |
| Seodaemun | 2,178,388 | 406,042 | 1216 | 1474 |
| Seocho | 9,385,502 | 2,122,317 | 18,606 | 4858 |
| Seongbuk | 304,238 | 26,231 | - | 270 |
| Songpa | 1,037,149 | 229,247 | 455 | 3724 |
| YangChun | 3,816,062 | 1,040,309 | 5799 | 441 |
| Yeongdeungpo | 1,244,069 | 405,863 | 766 | 1500 |
| Yongsan | 4,103,467 | 698,914 | 2195 | 96 |
| Eunpyeong | 545,487 | 98,884 | 579 | 6779 |
| Jongno | 5,015,240 | 765,761 | 2699 | 8983 |
| Jung-gu | 1,868,929 | 530,119 | 6305 | 6832 |
| Jungnang | 965,675 | 108,649 | 323 | 4280 |
Road A means a road with at least four lanes and below six lanes, and Road B means at least six lanes.
Appendix C
Table A3.
RCP Scenario 8.5—Flood-Prone Year (10-Year Frequency/Precipitation (mm/hr)).
| District | Flood Threshold | 2030 | 2040 | 2050 | 2060 | 2070 | 2080 | 2090 | 2100 |
|---|---|---|---|---|---|---|---|---|---|
| Gangnam | 45 | 34.1 | 41.7 | 36.5 | 33.8 | 34.5 | 50.8 | 120.8 | 23.0 |
| Gangdong | 76 | 34.9 | 90.4 | 36.6 | 32.2 | 36.4 | 51.0 | 103.3 | 24.2 |
| Gangbuk | 62.3 | 35.9 | 42.0 | 58.2 | 30.8 | 38.4 | 69.9 | 103.2 | 26.3 |
| Gangseo | 53.8 | 37.5 | 38.2 | 35.7 | 34.0 | 83.7 | 76.3 | 106.5 | 28.5 |
| Gwanak | 59.3 | 33.6 | 34.3 | 36.3 | 35.5 | 39.6 | 58.1 | 57.9 | 21.4 |
| Gwangjin | 64.3 | 34.7 | 66.7 | 36.0 | 31.9 | 36.0 | 50.9 | 117.2 | 23.9 |
| Guro | 61.5 | 34.2 | 36.8 | 35.9 | 33.2 | 82.0 | 68.9 | 76.6 | 22.5 |
| Geumcheon | 82.8 | 33.4 | 32.2 | 36.1 | 33.4 | 52.9 | 60.5 | 42.5 | 17.6 |
| Nowon | 77.5 | 36.1 | 42.1 | 53.9 | 29.5 | 38.2 | 63.0 | 89.3 | 25.0 |
| Dobong | 66.5 | 36.3 | 43.2 | 56.8 | 32.0 | 38.2 | 69.8 | 89.5 | 25.7 |
| Dongdaemun | 61.8 | 35.1 | 47.8 | 35.5 | 31.3 | 36.9 | 56.0 | 119.7 | 24.1 |
| Dongjak | 48.0 | 33.9 | 34.3 | 36.1 | 33.5 | 38.0 | 62.1 | 81.6 | 22.4 |
| Mapo | 68.0 | 34.5 | 37.4 | 35.6 | 33.7 | 43.6 | 79.9 | 128.9 | 25.6 |
| Seodaemun | 52.5 | 34.5 | 38.0 | 35.5 | 31.7 | 38.8 | 76.5 | 111.0 | 26.1 |
| Seocho | 52.5 | 33.9 | 32.9 | 36.6 | 34.9 | 34.6 | 52.0 | 98.9 | 22.6 |
| Sungdong | 79.8 | 34.7 | 42.6 | 35.5 | 31.1 | 35.9 | 53.5 | 126.0 | 23.4 |
| Seongbuk | 58.8 | 35.3 | 40.3 | 44.3 | 30.7 | 37.8 | 63.6 | 117.4 | 24.6 |
| Songpa | 71.8 | 34.2 | 63.9 | 37.3 | 33.6 | 34.5 | 49.9 | 128.0 | 23.2 |
| Yangchun | 68.8 | 34.9 | 37.4 | 35.9 | 34.1 | 71.8 | 76.6 | 113.2 | 25.8 |
| Yeongdeungpo | 58.3 | 34.0 | 36.4 | 35.9 | 33.9 | 45.1 | 73.8 | 110.7 | 22.4 |
| Yongsan | 38.5 | 34.3 | 33.4 | 35.6 | 32.1 | 36.6 | 60.5 | 112.6 | 23.2 |
| Eunpyeong | 51.5 | 35.0 | 39.7 | 64.1 | 31.6 | 41.5 | 82.2 | 103.6 | 28.2 |
| Jongno | 54.3 | 34.8 | 38.5 | 43.0 | 31.4 | 37.8 | 68.6 | 118.7 | 24.4 |
| Jung-gu | 66.5 | 34.5 | 35.5 | 35.3 | 30.7 | 36.6 | 59.8 | 125.0 | 23.8 |
| Jungnang | 63.0 | 35.3 | 63.7 | 35.8 | 30.8 | 37.5 | 55.6 | 103.8 | 24.6 |
Note: Red box means that flooding may occur, and green box means a year that is safe from flooding.
Appendix D
Table A4.
RCP Scenario 4.5—Flood-Prone Year (10 Years Frequency/Precipitation (mm/hr)).
| District | Flood Threshold | 2030 | 2040 | 2050 | 2060 | 2070 | 2080 | 2090 | 2100 |
|---|---|---|---|---|---|---|---|---|---|
| Gangnam | 45.0 | 32.7 | 37.0 | 29.6 | 31.5 | 23.5 | 80.7 | 62.3 | 71.8 |
| Gangdong | 76.0 | 38.1 | 39.9 | 30.1 | 34.3 | 24.8 | 44.2 | 50.9 | 168.7 |
| Gangbuk | 62.3 | 89.8 | 33.7 | 40.3 | 40.9 | 21.1 | 45.6 | 46.3 | 210.9 |
| Gangseo | 53.8 | 43.2 | 33.6 | 42.9 | 53.0 | 20.9 | 45.2 | 61.8 | 110.0 |
| Gwanak | 59.3 | 31.5 | 37.2 | 32.2 | 44.7 | 20.9 | 65.4 | 67.4 | 48.9 |
| Gwangjin | 64.3 | 38.0 | 36.4 | 32.2 | 35.0 | 23.6 | 65.9 | 53.8 | 115.8 |
| Guro | 61.5 | 31.7 | 36.0 | 37.9 | 53.1 | 20.8 | 42.7 | 69.2 | 75.7 |
| Geumcheon | 82.8 | 32.2 | 37.2 | 33.6 | 54.6 | 20.5 | 40.3 | 68.5 | 56.2 |
| Nowon | 77.5 | 77.9 | 34.4 | 38.7 | 41.7 | 21.5 | 44.4 | 43.7 | 238.0 |
| Dobong | 66.5 | 96.1 | 33.5 | 40.7 | 42.1 | 20.8 | 45.7 | 43.0 | 236.4 |
| Dongdaemun | 61.8 | 49.8 | 35.4 | 35.7 | 37.6 | 22.1 | 65.1 | 51.7 | 126.0 |
| Dongjak | 48.0 | 30.9 | 36.4 | 34.1 | 35.3 | 21.4 | 68.9 | 65.3 | 54.6 |
| Mapo | 68.0 | 40.4 | 34.4 | 39.5 | 36.7 | 21.5 | 46.3 | 61.3 | 91.2 |
| Seodaemun | 52.5 | 49.5 | 34.3 | 39.3 | 37.2 | 21.6 | 53.4 | 57.7 | 107.5 |
| Seocho | 52.5 | 31.7 | 37.2 | 29.1 | 30.7 | 23.0 | 89.7 | 65.6 | 62.6 |
| Sungdong | 79.8 | 38.8 | 35.8 | 34.3 | 35.7 | 22.3 | 77.9 | 55.8 | 90.4 |
| Seongbuk | 58.8 | 67.3 | 34.5 | 38.2 | 39.2 | 21.6 | 55.8 | 50.7 | 152.4 |
| Songpa | 71.8 | 34.3 | 37.2 | 28.2 | 31.2 | 24.9 | 58.2 | 58.9 | 120.2 |
| Yangchun | 68.8 | 32.6 | 35.0 | 39.7 | 45.5 | 21.1 | 43.6 | 66.6 | 85.0 |
| Yeongdeungpo | 58.3 | 32.6 | 35.4 | 37.4 | 35.3 | 21.4 | 45.9 | 65.0 | 62.6 |
| Yongsan | 38.5 | 34.0 | 35.7 | 35.3 | 35.2 | 21.8 | 77.7 | 60.5 | 77.7 |
| Eunpyeong | 51.5 | 73.9 | 33.1 | 41.9 | 38.4 | 20.9 | 46.2 | 50.0 | 166.9 |
| Jongno | 54.3 | 61.6 | 34.3 | 38.9 | 38.3 | 21.5 | 58.3 | 52.9 | 122.9 |
| Jung-gu | 66.5 | 41.6 | 35.2 | 36.5 | 36.6 | 21.9 | 75.0 | 56.5 | 89.6 |
| Jungnang | 63.0 | 49.9 | 35.7 | 35.1 | 38.4 | 23.1 | 51.4 | 47.7 | 184.4 |
Note: Red box means that a flooding may occur, and green box means a year that is safe from flooding.
References
- NASA Goddard Institute for Space Studies; version 4; GISS Surface Temperature Analysis (GISTEMP): New York, NY, USA, 2020. Available online: https://data.giss.nasa.gov/gistemp/ (accessed on 11 September 2020).
- Lenssen, N.; Schmidt, G.; Hansen, J.; Menne, M.; Persin, A.; Ruedy, R.; Zyss, D. Improvements in the GISTEMP uncertainty model. J. Geophys. Res. Atmos. 2019, 124, 6307–6326. [Google Scholar] [CrossRef]
- K-water. Definition of Floods, Deajeon, Korea, 2010. Available online: www.water.or.kr (accessed on 10 August 2020).
- IPCC. Climate Change 2014 Synthesis Report; IPCC: Geneva, Switzerland, 2014. [Google Scholar]
- Kwon, S.H.; Kim, J.S.; Byeon, Y.H.; Bu, K.W.; Seo, J.B.; Sun, M.A.; Sung, H.M.; Shim, S.B.; Lee, J.H.; Lim, Y.J. Global Climate Change Forecast Report; National Institute of Meteorological Sciences: Jeju-do, Korea, 2020.
- Govenment, S.M. Seoul Metropolitan City Comprehensive Planning System for Flood Damage Reduction; Seoul Metropolitan Government: Seoul, Korea, 2016.
- Pielke, R.A., Jr. Flood Impacts on Society: Damaging floods as a framework for assessment. Floods 2000, 1, 133–156. [Google Scholar]
- Choi, Y.H. Preventive Design for Flooding on Local Government Based on Urban Scale Hydraulic Analysis; Seoul National University: Seoul, Korea, 2019. [Google Scholar]
- Bae, C.; Lee, D.K. Effects of low-impact development practices for flood events at the catchment scale in a highly developed urban area. Int. J. Disaster Risk Reduct. 2020, 44, 101412. [Google Scholar] [CrossRef]
- Kim, J.; Lee, S.Y.; Kang, J. Temperature Reduction Effects of Rooftop Garden Arrangements: A Case Study of Seoul National University. Sustainability 2020, 12, 6032. [Google Scholar] [CrossRef]
- Xu, D.; Ouyang, Z.; Wu, T.; Han, B. Dynamic Trends of Urban Flooding Mitigation Services in Shenzhen, China. Sustainability 2020, 12, 4799. [Google Scholar] [CrossRef]
- Jeon, H.; Kang, J. GIS Based Assessment and Design for Areas Vulnerable to Soil Disasters: Case Study of Namhyeun-dong, South Korea. Sustainability 2020, 12, 2516. [Google Scholar] [CrossRef] [Green Version]
- Swain, K.C.; Singha, C.; Nayak, L. Flood Susceptibility Mapping through the GIS-AHP Technique Using the Cloud. ISPRS Int. J. Geo Inf. 2020, 9, 720. [Google Scholar] [CrossRef]
- Grek, E.; Zhuravlev, S. Simulation of Rainfall-Induced Floods in Small Catchments (the Polomet’River, North-West Russia) Using Rain Gauge and Radar Data. Hydrology 2020, 7, 92. [Google Scholar] [CrossRef]
- Zhong, M.; Lin, K.; Tang, G.; Zhang, Q.; Hong, Y.; Chen, X. A Framework to Evaluate Community Resilience to Urban Floods: A Case Study in Three Communities. Sustainability 2020, 12, 1521. [Google Scholar] [CrossRef] [Green Version]
- Convertino, M.; Annis, A.; Nardi, F. Information-theoretic portfolio decision model for optimal flood management. Environ. Model. Softw. 2019, 119, 258–274. [Google Scholar] [CrossRef] [Green Version]
- Daksiya, V. Decision Making on Flood Mitigation Incorporating Uncertainty, Socio-Economic Factors and a Changing Future. Ph.D. Thesis, Nanyang Technological University, Singapore, 2018. [Google Scholar]
- Ryu, Y.; Kim, Y.O.; Seo, S.B.; Seo, I.W. Application of real option analysis for planning under climate change uncertainty: A case study for evaluation of flood mitigation plans in Korea. Mitig. Adapt. Strateg. Glob. Chang. 2018, 23, 803–819. [Google Scholar] [CrossRef]
- Ministry of Environment. Guidebook for Installation Management of Rainwater Facilities; Ministry of Environment: Sejong City, Korea, 2010.
- Kim, H.S. Outline and Design examples of Rainwater Facilities. J. Soc. Air Cond. Refrig. Eng. Korea 2012, 41, 24–30. [Google Scholar]
- Concrete Structure Standards; Ministry of Land, Infrastructure and Transport: Sejong City, Korea, 2012.
- Pratt, C.J.L. Permeable Pavements: Guide to Design Construction and Maintenance of Concrete Block Permeable Pavements; Interpave: Leicester, UK, 2003. [Google Scholar]
- Smith, D.R. Permeable Interlocking Concrete Pavements; Interlocking Concrete Pavement Institute: Herndon, VA, USA, 2011. [Google Scholar]
- Seoul Metropolitan Government. Sustainable Eco-Friendly (Permeable) Sidewalk Pavement Standards; Seoul Metropolitan Government: Seoul, Korea, 2009.
- Korea Construction Standards Center. Geotextile Mat Construction Standards; Korea Construction Standards Center: Seoul, Korea, 2018. [Google Scholar]
- Park, G.H.; Joh, S.J.; Sung, N.I. Design by Decentralized Stormwater Management in Asan-Tangjung Site, Korea; 2011; pp. 222–233. Available online: http://www.yooshin.co.kr/upload/18_16_0.pdf (accessed on 24 December 2020).
- Tobio, J.A.S.; Maniquiz-Redillas, M.C.; Kim, L.H. Physical design optimization of an urban runoff treatment system using Stormwater Management Model (SWMM). Water Sci. Technol. 2015, 72, 1747–1753. [Google Scholar] [CrossRef] [PubMed]
- Chen, J.; Hill, A.A.; Urbano, L.D. A GIS-based model for urban flood inundation. J. Hydrol. 2009, 373, 184–192. [Google Scholar] [CrossRef]
- Fang, Z.; Dolan, G.; Sebastian, A.; Bedient, P.B. Case study of flood mitigation and hazard management at the Texas Medical Center in the wake of tropical storm Allison in 2001. Nat. Hazards Rev. 2014, 15, 05014001. [Google Scholar] [CrossRef]
- K-water. Flood Damage by Administrative Area, 2019. Available online: https://www.water.or.kr (accessed on 15 August 2020).
- Gao, C.; Booij, M.J.; Xu, Y.P. Assessment of extreme flows and uncertainty under climate change: Disentangling the uncertainty contribution of representative concentration pathways, global climate models and internal climate variability. Hydrol. Earth Syst. Sci. 2020, 24, 3251–3269. [Google Scholar] [CrossRef]
- Correia, F.N.; Da Silva, F.N.; Ramos, I. Floodplain management in urban developing areas. Part II. GIS-based flood analysis and urban growth modelling. Water Resour. Manag. 1999, 13, 23–37. [Google Scholar] [CrossRef]
- Vaze, J.; Teng, J.; Spencer, G. Impact of DEM Accuracy and Resolution on Topographic Indices. Environ. Model. Softw. 2010, 25, 1086–1098. [Google Scholar] [CrossRef]
- Standard Node Link; Ministry of Land, Infrastructure and Transport: Sejong City, Korea, 2018.
- Weather Data Portal. Disaster Observation Data. 2020. Available online: https://data.kma.go.kr/cmmn/main.do (accessed on 17 July 2020).
- Yeo, K.H. Flood Defense Technology Trends for Climate Change; Korea Environmental Industry & Technology Institute: Seoul, Korea, 2016. [Google Scholar]
- Zhang, H.; Cheng, X.; Zhao, D.; Ma, H. IGARSS 2018–2018 IEEE International Geoscience and Remote Sensing Symposium. In Proceedings of the Analyzing the Contribution of High Resolution Water Range in Dividing Catchment Based on D8 Algorithm, Valencia, Spain, 22–27 July 2018; IEEE: Piscataway, NJ, USA, 2018. [Google Scholar]
- Seoul Metropolitan Government. Seoul Urban Planning; Seoul Metropolitan Government: Seoul, Korea, 2016.
- Korea Meteorological Administration. Monthly Report of Automatic Weather System Data; Korea Meteorological Administration: Seoul, Korea, 2001–2019.
- Han, K.Y. Flood Defense Project for the Next Generation Considering Climate Change. J. Korean Soc. Civ. Eng. 2009, 57, 10–11. [Google Scholar]
- Lee, D.G. Changes in climate and runoff on the Korean Peninsula due to climate change. Int. J. Air Cond. Refrig. 2008, 37, 8–12. [Google Scholar]
- Bonta, J.V.; Shahalam, A. Cumulative storm rainfall distributions: Comparison of Huff curves. J. Hydrol. 2003, 42, 65–74. [Google Scholar]
- The Ministry of Land, Transport and Maritime Affairs. Methods for Calculating the Amount of Design Flood; The Ministry of Land, Transport and Maritime Affairs: Seoul, Korea, 2012.
- Mei, C.; Liu, J.; Wang, H.; Yang, Z.; Ding, X.; Shao, W. Integrated assessments of green infrastructure for flood mitigation to support robust decision-making for sponge city construction in an urbanized watershed. Sci. Total Environ. 2018, 639, 1394–1407. [Google Scholar] [CrossRef] [PubMed]
- Schubert, J.E.; Burns, M.J.; Fletcher, T.D.; Sanders, B.F. A framework for the case-specific assessment of Green Infrastructure in mitigating urban flood hazards. Adv. Water Resour. 2017, 108, 55–68. [Google Scholar] [CrossRef]
- Maragno, D.; Gaglio, M.; Robbi, M.; Appiotti, F.; Fano, E.A.; Gissi, E. Fine-scale analysis of urban flooding reduction from green infrastructure: An ecosystem services approach for the management of water flows. Ecol. Model. 2018, 386, 1–10. [Google Scholar] [CrossRef]
Figure 1.
Permeable pavement sectional drawings [12].
Figure 1.
Permeable pavement sectional drawings [12].

Figure 2.
Base DEM file of Seoul Metropolitan Government.

Figure 3.
GIS files used in research: (a) Road link and node information; (b) Building information [34].
Figure 3.
GIS files used in research: (a) Road link and node information; (b) Building information [34].

Figure 4.
The flowchart of the current study.

Figure 5.
Hydrological analysis procedure.

Figure 6.
Watershed in Seoul Metropolitan Government using ArcHydro plug-in.

Figure 7.
Huff rainfall distribution graph [43].
Figure 7.
Huff rainfall distribution graph [43].

Figure 8.
Building and road area of Seoul Metropolitan Government using GIS.

Figure 9.
Seocho-gu permeable pavement and ecological water supply area.

Figure 10.
Sungbuk-gu permeable pavement and ecological water supply area.

Figure 11.
Jongno-gu—Permeable pavement and ecological water supply area.

Figure 12.
RCP 8.5—7 July 2090 precipitation distribution per rainfall duration of 24 h.

Figure 13.
Comparison of maximum precipitation in 2100 between RCP 8.5 and RCP 4.5.

Figure 14.
The size of the flood area throughout Gangnam-gu in 2100 (RCP 4.5).

Figure 15.
Gangnam-gu flood area: (a) Before installation of technology, (b) installed water tank, (c) installed water tank and permeable pavement, (d) installed water tank, permeable pavement, and ecological waterway.
Figure 15.
Gangnam-gu flood area: (a) Before installation of technology, (b) installed water tank, (c) installed water tank and permeable pavement, (d) installed water tank, permeable pavement, and ecological waterway.

Figure 16.
The size of the flood area throughout Dongdaemun-gu in 2100 (RCP 4.5).

Figure 17.
Dongdaemun-gu flood area: (a) Before installation of technology, (b) installed water tank, (c) the installed water tank and permeable pavement, (d) installed water tank, permeable pavement, and ecological waterway.
Figure 17.
Dongdaemun-gu flood area: (a) Before installation of technology, (b) installed water tank, (c) the installed water tank and permeable pavement, (d) installed water tank, permeable pavement, and ecological waterway.

Table 1.
Description of each RCP scenario.
| Type | Description | CO2 Concentration (The Year 2100) |
|---|---|---|
| RCP 2.6 | Instantaneous greenhouse gas reduction | 420 ppm |
| RCP 4.5 | Substantial achievement of greenhouse gas reduction policy | 540 ppm |
| RCP 6.0 | Fair achievement of greenhouse gas reduction policy | 670 ppm |
| RCP 8.5 | Greenhouse gas emission as current trend | 940 ppm |
Table 2.
Types of flood mitigating technology.
| Collection Facility | Treatment Facility | Storage Facility | Transmission and Drainage Facilities |
|---|---|---|---|
| Water surface Collective water pipe Gutter hanger | Precipitation pipe Initial rainwater treatment system Water filter | Water tank (Reinforced Concrete, Fiber-Reinforced Polymer, plastic, etc.) Ecological waterway Permeable pavement | Water pump Water supply pipe Measurement and control facilities |
Table 3.
The capacity of each district and technology (Unit: m3).
| Type B (Water Tank) | Permeable Pavement | Ecological Waterway | Type C (Water Tank + Permeable Pavement) | Type D (All Technology) | |
|---|---|---|---|---|---|
| Gangnam | 24,735 | 4029 | 3710 | 30,172 | 33,882 |
| Gangdong | 72,272 | 5155 | 4125 | 78,993 | 83,117 |
| Gangbuk | 44,352 | 4870 | 6126 | 51,548 | 57,674 |
| Gangseo | 50,123 | 6192 | 3593 | 57,679 | 61,271 |
| Gwanak | 42,590 | 1919 | 2242 | 45,360 | 47,602 |
| Gwangjin | 32,897 | 2515 | 959 | 35,776 | 36,735 |
| Guro | 3300 | 788 | 1431 | 4631 | 6062 |
| Geumcheon | 40,472 | 2929 | 3875 | 44,872 | 48,748 |
| Nowon | 20,815 | 5606 | 5213 | 28,400 | 33,612 |
| Dobong | 23,797 | 2100 | 1274 | 26,380 | 27,654 |
| Dongdaemun | 11,262 | 5241 | 7258 | 19,258 | 26,516 |
| Dongjak | 72,151 | 585 | 0 | 72,737 | 72,737 |
| Mapo | 16,204 | 836 | 0 | 17,040 | 17,040 |
| Seodaemun | 20,302 | 1592 | 1585 | 22,496 | 24,081 |
| Seocho | 106,116 | 13,891 | 5222 | 121,989 | 127,211 |
| Seongbuk | 1312 | 160 | 290 | 1582 | 1872 |
| Songpa | 11,462 | 2474 | 4003 | 15,456 | 19,459 |
| YangChun | 52,015 | 3694 | 474 | 55,889 | 56,364 |
| Yeongdeungpo | 20,293 | 1341 | 1613 | 22,247 | 23,859 |
| Yongsan | 34,946 | 1356 | 103 | 36,341 | 36,444 |
| Eunpyeong | 4944 | 4356 | 7287 | 12,066 | 19,353 |
| Jongno | 38,288 | 6916 | 9657 | 48,869 | 58,526 |
| Jung-gu | 26,506 | 7777 | 7344 | 37,071 | 44,415 |
| Jungnang | 5432 | 2725 | 4601 | 8157 | 12,758 |
| Total | 776,588 | 89,049 | 81,986 | 865,637 | 947,623 |
Table 4.
Efficient case when two technologies are installed in consideration of economic aspect.
| Water tank + Permeable Pavement | Gangnam-gu, Gangdong-gu, Gangseo-gu, Gwangjin-gu, Nowon-gu, Dobong-gu, Dongjak-gu, Mapo-gu, Seodaemun-gu, Seocho-gu, Yangcheon-gu, Yongsan-gu, Jung-gu |
| Water tank + Ecological Waterway | Gangbuk-gu, Gwanak-gu, Guro-gu, Geumcheon-gu, Dongdaemun-gu, Seongbuk-gu, Songpa-gu, Yeongdeungpo-gu, Eunpyeong-gu, Jongno-gu, Jungnang-gu |
Table 5.
Total run-off of Seoul Metropolitan Government until 2100 (10-year frequency (m3)).
| Scenario | Year | Type A | Type B | Type C | Type D |
|---|---|---|---|---|---|
| RCP 8.5 | 2030 | - | - | - | - |
| 2040 | 96,694 | 17,944 | 12,789 | 8664 | |
| 2050 | 6893 | 1949 | - | - | |
| 2060 | - | - | - | - | |
| 2070 | 1,721,000 | 107,178 | 100,198 | 95,252 | |
| 2080 | 516,204 | 199,751 | 179,181 | 156,957 | |
| 2090 | 2,842,776 | 2,149,250 | 2,065,133 | 1,990,695 | |
| 2100 | - | - | - | ||
| RCP 4.5 | 2030 | 190,332 | 77,802 | 66,316 | 55,683 |
| 2040 | - | - | - | - | |
| 2050 | - | - | - | - | |
| 2060 | - | - | - | - | |
| 2070 | - | - | - | - | |
| 2080 | 733,654 | 426,587 | 406,725 | 397,690 | |
| 2090 | 417,892 | 84,623 | 66,141 | 62,755 | |
| 2100 | 3,492,778 | 2,866,561 | 2,798,498 | 2,730,895 |
Type A means when no technology has been installed, Type B means when only a water tank is installed, Type C means when the permeable pavement is added to Type B, Type D means when all technologies have been installed.
Table 6.
The amount of run-off when mitigation technology is installed in 2090 (RCP 8.5/4.5, (m3)).
| Year: 2090 | RCP 8.5 | RCP 4.5 | ||||||
|---|---|---|---|---|---|---|---|---|
| Type A | Type B | Type C | Type D | Type A | Type B | Type C | Type D | |
| Gangnam | 119,926 | 95,191 | 91,162 | 87,452 | 27,385 | 2649 | - | - |
| Gangdong | 171,598 | 99,326 | 94,171 | 90,046 | - | - | - | - |
| Gangbuk | 112,554 | 68,202 | 63,331 | 57,205 | - | - | - | - |
| Gangseo | 273,115 | 222,993 | 216,800 | 213,208 | 41,668 | - | - | - |
| Gwanak | - | - | - | - | 31,762 | - | - | - |
| Gwangjin | 128,687 | 95,790 | 93,275 | 92,316 | - | - | - | - |
| Guro | 4004 | 704 | - | - | 2032 | - | - | - |
| Geumcheon | - | - | - | - | - | - | - | - |
| Nowon | 35,450 | 14,635 | 9028 | 3816 | - | - | - | - |
| Dobong | 47,956 | 24,159 | 22,059 | 20,785 | - | - | - | - |
| Dongdaemun | 53,026 | 41,764 | 36,523 | 29,265 | - | - | - | - |
| Dongjak | 157,933 | 85,782 | 85,196 | 85,196 | 81,493 | 9342 | 8757 | 8757 |
| Mapo | 59,894 | 43,690 | 42,854 | 42,854 | - | - | - | - |
| Seodaemun | 127,383 | 107,081 | 105,489 | 103,904 | 11,419 | - | - | - |
| Seocho | 435,832 | 329,716 | 315,825 | 310,603 | 123,290 | 17,174 | 3283 | - |
| Seongbuk | 17,837 | 16,525 | 16,365 | 16,075 | - | - | - | - |
| Songpa | 58,304 | 46,842 | 44,368 | 40,365 | - | - | - | - |
| YangChun | 169,604 | 117,589 | 113,895 | 113,420 | - | - | - | - |
| Yeongdeungpo | 65,301 | 45,008 | 43,666 | 42,054 | 8440 | - | - | - |
| Yongsan | 304,155 | 269,209 | 267,853 | 267,750 | 90,403 | 55,458 | 54,101 | 53,998 |
| Eunpyeong | 28,396 | 23,452 | 19,096 | 11,808 | ||||
| Jongno | 323,172 | 284,883 | 277,968 | 268,311 | ||||
| Jung-gu | 109,241 | 82,735 | 74,958 | 67,614 | - | - | - | - |
| Jungnang | 39,408 | 33,975 | 31,250 | 26,649 | - | - | - | - |
| Total | 2,842,776 | 2,149,250 | 2,065,133 | 1,990,695 | 417,892 | 84,623 | 66,141 | 62,755 |
Publisher’s Note: MDPI stays neutral with regard to jurisdictional claims in published maps and institutional affiliations. |
© 2020 by the authors. Licensee MDPI, Basel, Switzerland. This article is an open access article distributed under the terms and conditions of the Creative Commons Attribution (CC BY) license (http://creativecommons.org/licenses/by/4.0/).
Share and Cite
MDPI and ACS Style
Kim, J.; Kang, J. Analysis of Flood Damage in the Seoul Metropolitan Government Using Climate Change Scenarios and Mitigation Technologies. Sustainability 2021, 13, 105. https://0-doi-org.brum.beds.ac.uk/10.3390/su13010105
AMA Style
Kim J, Kang J. Analysis of Flood Damage in the Seoul Metropolitan Government Using Climate Change Scenarios and Mitigation Technologies. Sustainability. 2021; 13(1):105. https://0-doi-org.brum.beds.ac.uk/10.3390/su13010105
Chicago/Turabian StyleKim, Jaekyoung, and Junsuk Kang. 2021. "Analysis of Flood Damage in the Seoul Metropolitan Government Using Climate Change Scenarios and Mitigation Technologies" Sustainability 13, no. 1: 105. https://0-doi-org.brum.beds.ac.uk/10.3390/su13010105
Note that from the first issue of 2016, this journal uses article numbers instead of page numbers. See further details here.