Article

Comparative Whole Building Life Cycle Assessment of Energy Saving and Carbon Reduction Performance of Reinforced Concrete and Timber Stadiums—A Case Study in China

1
School of Architecture, Harbin Institute of Technology, Harbin 150001, China
2
Key Laboratory of Cold Region Urban and Rural Human Settlement Environment Science, Ministry of Industry and Information Technology, Harbin 150001, China
*
Authors to whom correspondence should be addressed.
Sustainability 2020, 12(4), 1566; https://0-doi-org.brum.beds.ac.uk/10.3390/su12041566
Submission received: 21 January 2020 / Revised: 14 February 2020 / Accepted: 17 February 2020 / Published: 19 February 2020
(This article belongs to the Special Issue Sustainable Building Retrofit and Energy Optimization)

Abstract

:
Many stadiums will be built in China in the next few decades due to increasing public interest in physical exercise and the incentive policies issued by the government under its National Fitness Program. This paper investigates the energy saving and carbon reduction performance of timber stadiums in China in comparison with stadiums constructed using conventional building materials, based on both life cycle energy assessment (LCEA) and life cycle carbon assessment (LCCA). The authors select five representative cities in five climate zones in China as the simulation environment, simulate energy use in the operation phase of stadiums constructed from reinforced concrete (RC) and timber, and compare the RC and timber stadiums in terms of their life cycle energy consumption and carbon emissions. The LCEA results reveal that the energy saving potential afforded by timber stadiums is 11.05%, 12.14%, 8.15%, 4.61% and 4.62% lower than those of RC buildings in “severely cold,” “cold,” “hot summer, cold winter,” “hot summer, warm winter,” and “temperate” regions, respectively. The LCCA results demonstrate that the carbon emissions of timber stadiums are 15.85%, 15.86%, 18.88%, 19.22% and 22.47% lower than those of RC buildings for the regions above, respectively. This demonstrates that in China, timber stadiums have better energy conservation and carbon reduction potential than RC stadiums, based on life cycle assessment. Thus, policy makers are advised to encourage the promotion of timber stadiums in China to achieve the goal of sustainable energy development for public buildings.

1. Introduction

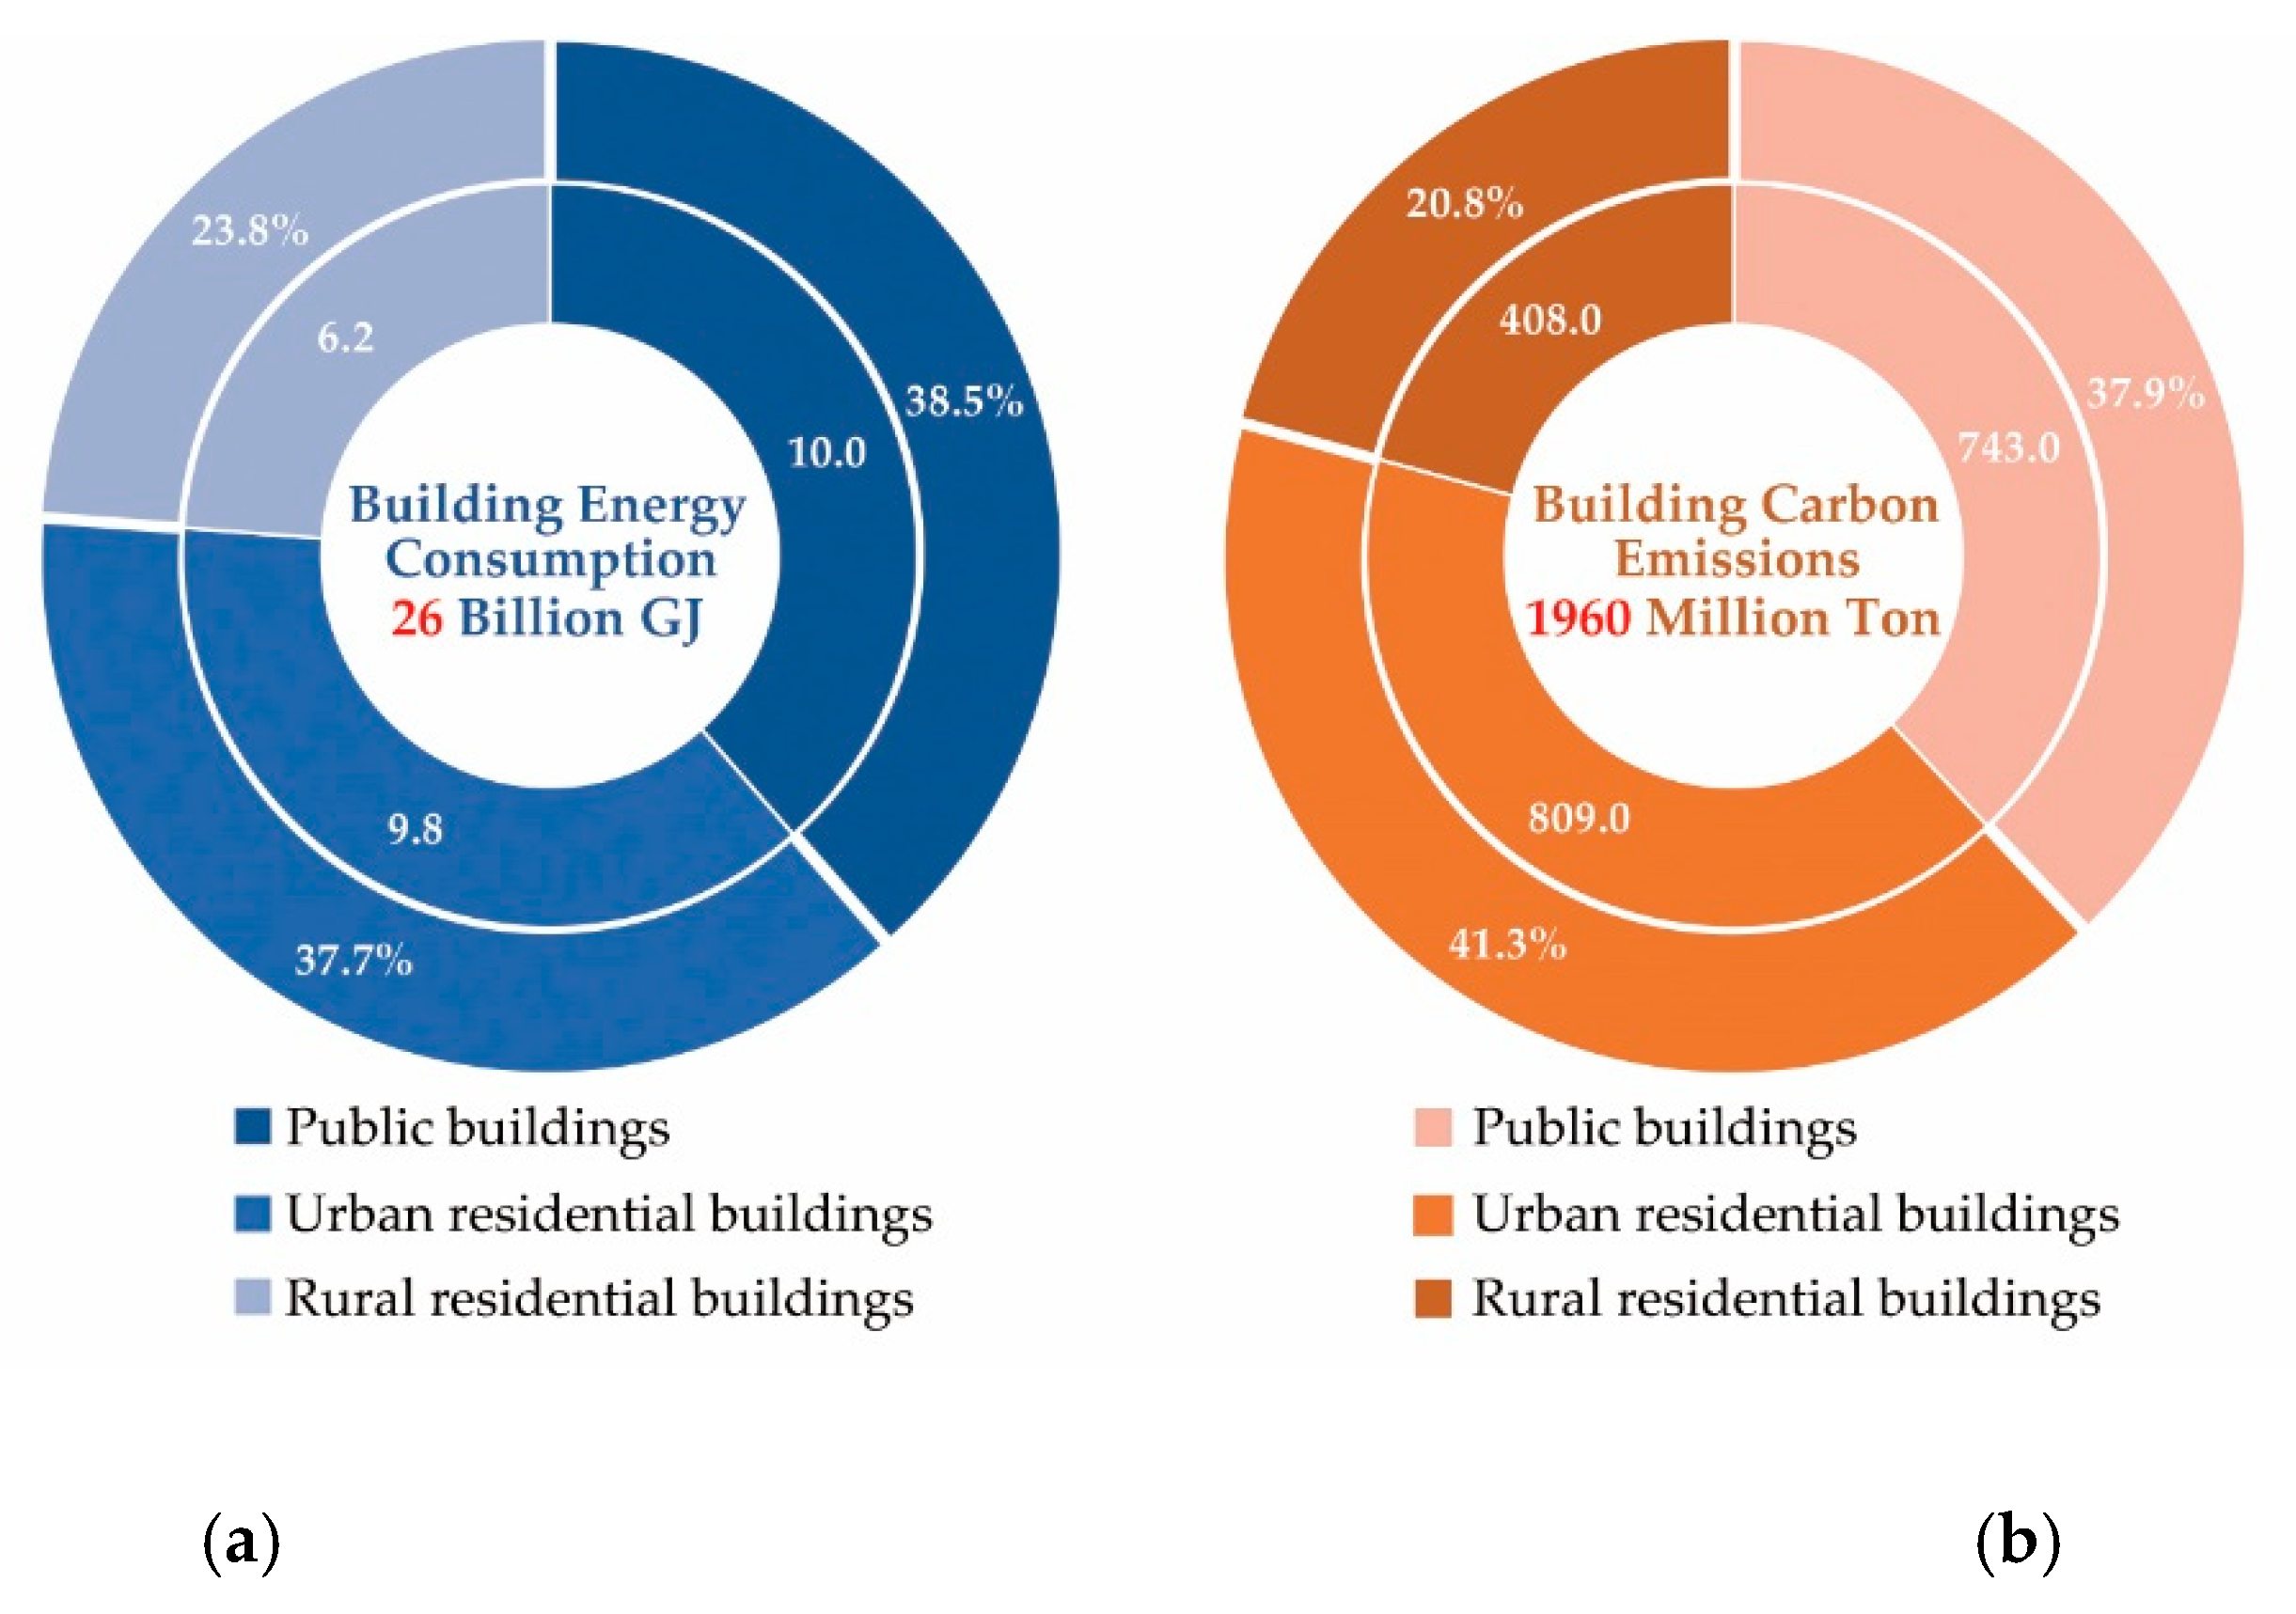
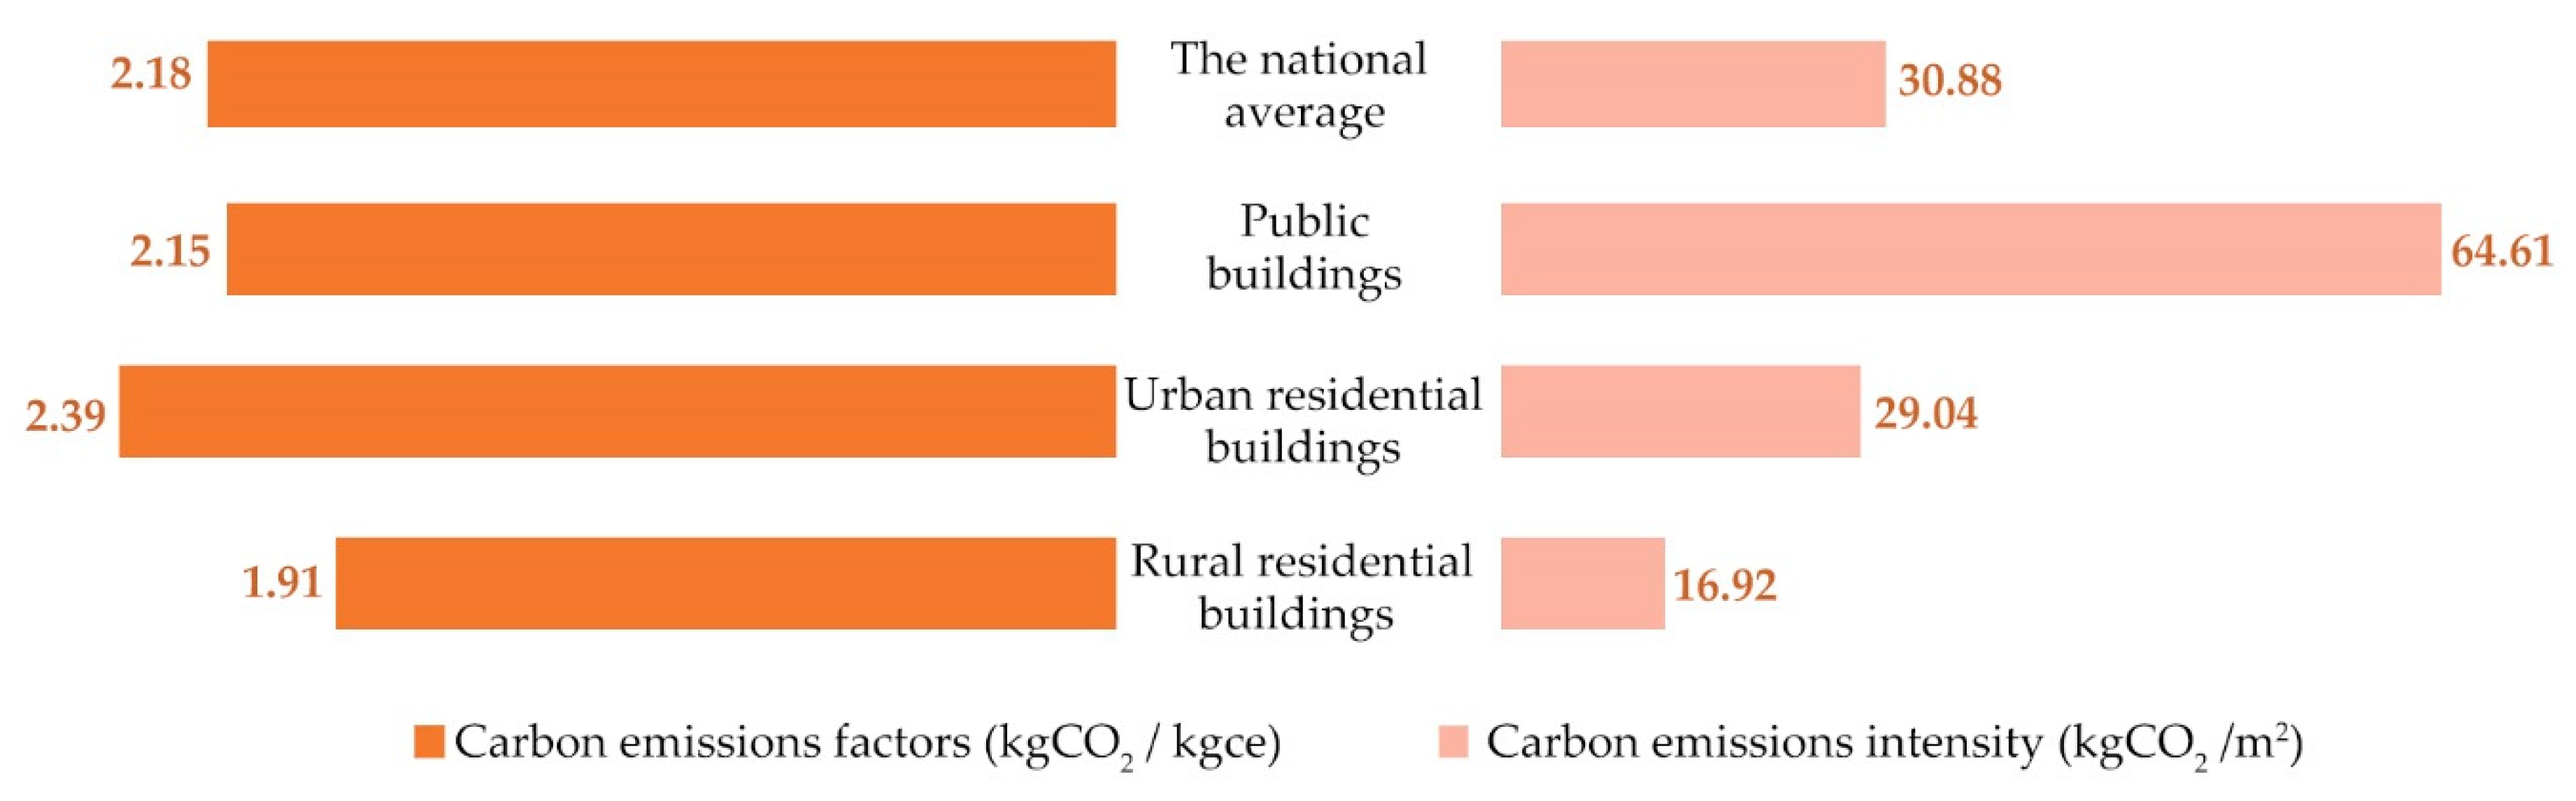
1.1. Energy Consumption and Carbon Emissions of Public Buildings

Energy is necessary for human development and economic growth [1]. The world’s population reached 7.69 billion in mid-2019 and is expected to exceed 9.8 billion by mid-2050 [2]. This massive population growth has had a huge impact on the global environment and natural resources over the last two centuries. Fossil fuels (i.e., coal, gas, and oil) have been the major energy sources for human activities since the 1760s. Burning fossil fuels for energy releases greenhouse gases (GHGs) into the atmosphere [3]. The use of fossil fuels pollutes the environment and emits large amounts of carbon dioxide (CO2) [4]. The use of fossil fuels is believed to be the main factor leading to global warming [5,6]. Global warming is widely considered to cause glacier retreat and regional climate changes, species extinction, and further uncertain risks [7,8].
Measuring the “greenhouse effect” for mitigation purposes has become a major interest internationally in the last few decades. During the last 50 years, global warming has mainly been caused by excessive GHG emissions due to human activities [9]. International Energy Outlook (2019) reported that the building sector, one of the most important areas of human activities, accounted for 20% of the world’s delivered energy consumption in 2018 [10]. This figure will rise to about 22% by 2050 [10]. The Brown to Green Report (2019) showed that carbon emissions directly from the building sector accounted for 9% of G20 energy-related CO2 emissions in 2019 and that 18% of these emissions arose from electricity use in buildings [11].
At the end of 2016, the energy consumption of buildings in China was 26 billion GJ, accounting for 20.6% of the country’s total energy consumption. In total, the building industry emitted 1.96 billion tons of CO2 in this year, accounting for 19.4% of domestic carbon emissions [12]. At the 2015 United Nations Climate Change Conference [13], the Chinese government set the goal of reducing carbon emissions per unit of GDP by 60%–65% by 2030, relative to 2005 levels. Therefore, the annual average rate of decline in carbon intensity between 2005 and 2030 was expected to range from 3.6% to 4.1% [13]. To mitigate the greenhouse effect, it is vital to reduce the energy consumption of the building industry [14]. According to the Research Report on Building Energy Consumption in China (2018), public buildings in China accounted for 38.5% of total energy consumption (Figure 1a) and about 41% of carbon emissions in 2016 (Figure 1b) [12]. The report also revealed that the national average carbon emission factor of building sector in China was 2.18 kg CO2/kgce. Specifically, the carbon emission figures of public buildings and the urban residential buildings was 2.15 kg CO2/kgce and 2.39 kg CO2/kgce. The report also highlighted that the carbon emission intensity of public buildings was 64.61 kg CO2/m2. The figures of national average and urban residential buildings were 30.88 kg CO2/m2 and 29.04 kg CO2/m2 respectively (Figure 2). The carbon emissions intensity of public buildings in China was approximately 200% higher than that of the national average in 2016 [12]. These findings demonstrate that public buildings in China contribute significantly to GHG emissions and thus offer great energy saving potential.

1.2. Development Tendency and Current Situation of Gymnasium in China

In the building industry, public and commercial (P&C) buildings can be divided into six types, namely office buildings, commercial lodging buildings, mercantile buildings, educational buildings, health care buildings, and others [15]. The “others” category covered 30% of the total P&C floor area in 2016, including gyms, transportation junctions, and cultural venues [15]. Gymnasiums are long and broad, as they are specially designed to accommodate special events and large audiences. With continuous economic improvement, people are gradually beginning to pay more attention to physical health, so more sports venues are needed. To meet the increasing demand for sports fields, for example, a series of regulations and government documents have been released to promote the development of such venues. According to the Outline of Building a Strong Sports Country, released by the State Council of China in 2019, the average area of sports facilities is expected to be 2.5 m2 per capita in China by 2035 [16]. However, it had only reached nearly 1.46 m2 per capita by 2016 [17]. To realize the goal, 71.2% more sports venues need to be built in the next 20 years in China [17]. Therefore, gymnasiums, as one of the most important types of sports facilities, have great development potential.
The Chinese government has introduced regulations to increase local residents’ access to existing sports facilities, either free of charge or at low prices [16,18]. Gymnasiums in China generally open only in sports competition seasons as competition gymnasiums. The regulations will gradually transform the current operation mode into the new one, under which gymnasiums will open for the whole year, becoming national fitness centers. National fitness centers are expected to open for at least 40 hours a week and 330 days a year [18]. The number of gymnasiums will continually grow, and their opening hours will gradually increase. However, these trends will also exacerbate the existing problem of high energy consumption by gymnasiums, increasing their contribution to GHG emissions in China. Therefore, reducing the energy consumption of gymnasiums will greatly help to mitigate the greenhouse effect.
Some researchers have studied the energy consumption of gymnasiums in their operation phase. For example, Trianti-Stourna et al found that the energy consumption of operational sport halls in Greece is approximately 100 kWh/m2 per year, and sought to achieve an optimal balance between indoor conditions and energy use [19]. Nishioka et al evaluated the indoor thermal environment and energy consumption of a large domed stadium. The results showed that the annual cooling load of the whole building was about 69.1 Mcal/m2 and the annual heating load was about 13.2 Mcal/m2 [20]. Li and Liang studied the cooperative interaction among structure, soil loads and thickness, and energy efficiency when applying the overall roof greening to a large “saddle-shaped” shell [21]. They found that using overall roof greening can save 25.1% of annual air-conditioning energy consumption in Guangzhou, China [21]. However, research on reducing the energy consumption of gymnasiums by replacing traditional materials with sustainable materials is limited.

1.3. Energy Saving and Carbon Emission Reduction Potential of Timber Buildings

Trees and their by-products have been used worldwide for thousands of years [22]. Due to the gradual exhaustion of forest resources, however, wood has been replaced by mineral materials, such as concrete. However, concrete can produce a lot of carbon dioxide during the production process and increase the burden of scarce ecological resources. Recently developed national and international policies and regulations are expected to address the carbon impact and resource scarcity associated with concrete [23].
The sustainability of timber provides a material solution to the problem [23]. With the improvement of timber planting technology, timber can now be recycled without a huge negative impact on natural resources from the planting stage to the harvesting stage. Besides, engineered timber products greatly improve the utilisation efficiency of timber through the advancement of timber industrialisation. At least 52% of the logs brought to wood product manufacturing centers are processed into lumber [24]. Of all engineered timber, the most widely used products include cross laminated timber (CLT), glued laminated timber (GLT), and plywood and oriented strand board (OSB) (Figure 3). Engineered timber products have several advantages. For example, CLT provides great advantages in terms of the speed of construction, minimal waste, and wide-span construction [25]. Furthermore, CLT has negative embodied carbon [25]. These advantages make timber a strong alternative to concrete [26]. Hence, timber has regained its market share from traditional heavyweight materials over the last decade [27].
Existing studies have shown that using timber in buildings offers more notable potential reductions in energy use and carbon emission than using concrete and other heavyweight materials. Research on the energy saving of wood-based building is discussed below. Chen compared the energy used for heating, ventilation and air conditioning in concrete and CLT office buildings and pointed out that the operating energy of CLT buildings was 10% lower than that of concrete buildings [29]. Hafner and Schäfer assessed the GHG reduction potential of residential buildings after replacing mineral materials with timber in building construction. The substitute factor (GHG reduction potential) of timber buildings for the construction of single/two-family houses ranged between 0.35 and 0.56, which means that there is a positive GHG reduction potential when using timber [30]. Tettey et al revealed that CLT buildings reduced the total life cycle primary energy use by 20%–37%, compared with the concrete alternative, when space heating came from combined heat and power [31]. Khavari et al simulated a 10-storey multiunit residential CLT building model and found that a timber building model significantly improved heating energy efficiency compared with a light-frame metal construction model [32]. The results showed that using CLT can save 2090 dollars in utility costs annually [32].
There has also been some research on the carbon emissions and environmental benefits of timber buildings. Chiniforush et al found that adopting a steel structure with steel-timber composite floors and shear wall systems resulted in a 107% reduction in embodied carbons, compared with the same building designed with a concrete structure [33]. Pierobon et al evaluated the embodied emissions and energy associated with building materials, manufacturing, and construction for midrise commercial buildings with a hybrid CLT structure [34]. They found that hybrid CLT buildings can save 8% of non-renewable energy (fossil-based) compared with concrete buildings [34]. Pajchrowski et al concluded that the environmental impact of a conventional masonry building is 2.7 times greater than that of a conventional wooden building, and the environmental impact of a passive masonry building is 1.6 times greater than that of a passive wooden building [35]. Dong et al found that the heating energy of CLT office buildings is 11.97% lower than that of RC buildings in Harbin [36]. Balasbaneh and Marsono also found that the GHG emissions associated with using timber prefabricated walls in construction were about 7% lower than those for blockwork systems [37].
Timber is increasingly used as a construction material in buildings worldwide due to the development of engineered timber. Current studies have shown that replacing concrete and other traditional heavyweight materials with timber in buildings has a great energy conservation and carbon reduction potential. With the promotion of sports venues, gymnasiums will consume more and more energy and contribute to GHG emissions enormously in the future. However, timber has not yet been widely used in gymnasiums in China, and studies of the energy saving and carbon reduction potential of timber gymnasiums are limited and unclear.

1.4. Study Objective

Based on the above, the existing research has demonstrated that timber is a kind of environmental-friendly building material capable of reducing building energy. However, limited research has addressed the energy saving and carbon reduction potential of timber gymnasiums in China. This paper evaluates the carbon reduction and energy saving effects of timber gymnasiums through life cycle assessment to determine whether timber offers a feasible new building material for sports facilities in China in terms of energy sustainability.

2. Description of Studied Buildings and Its Environment

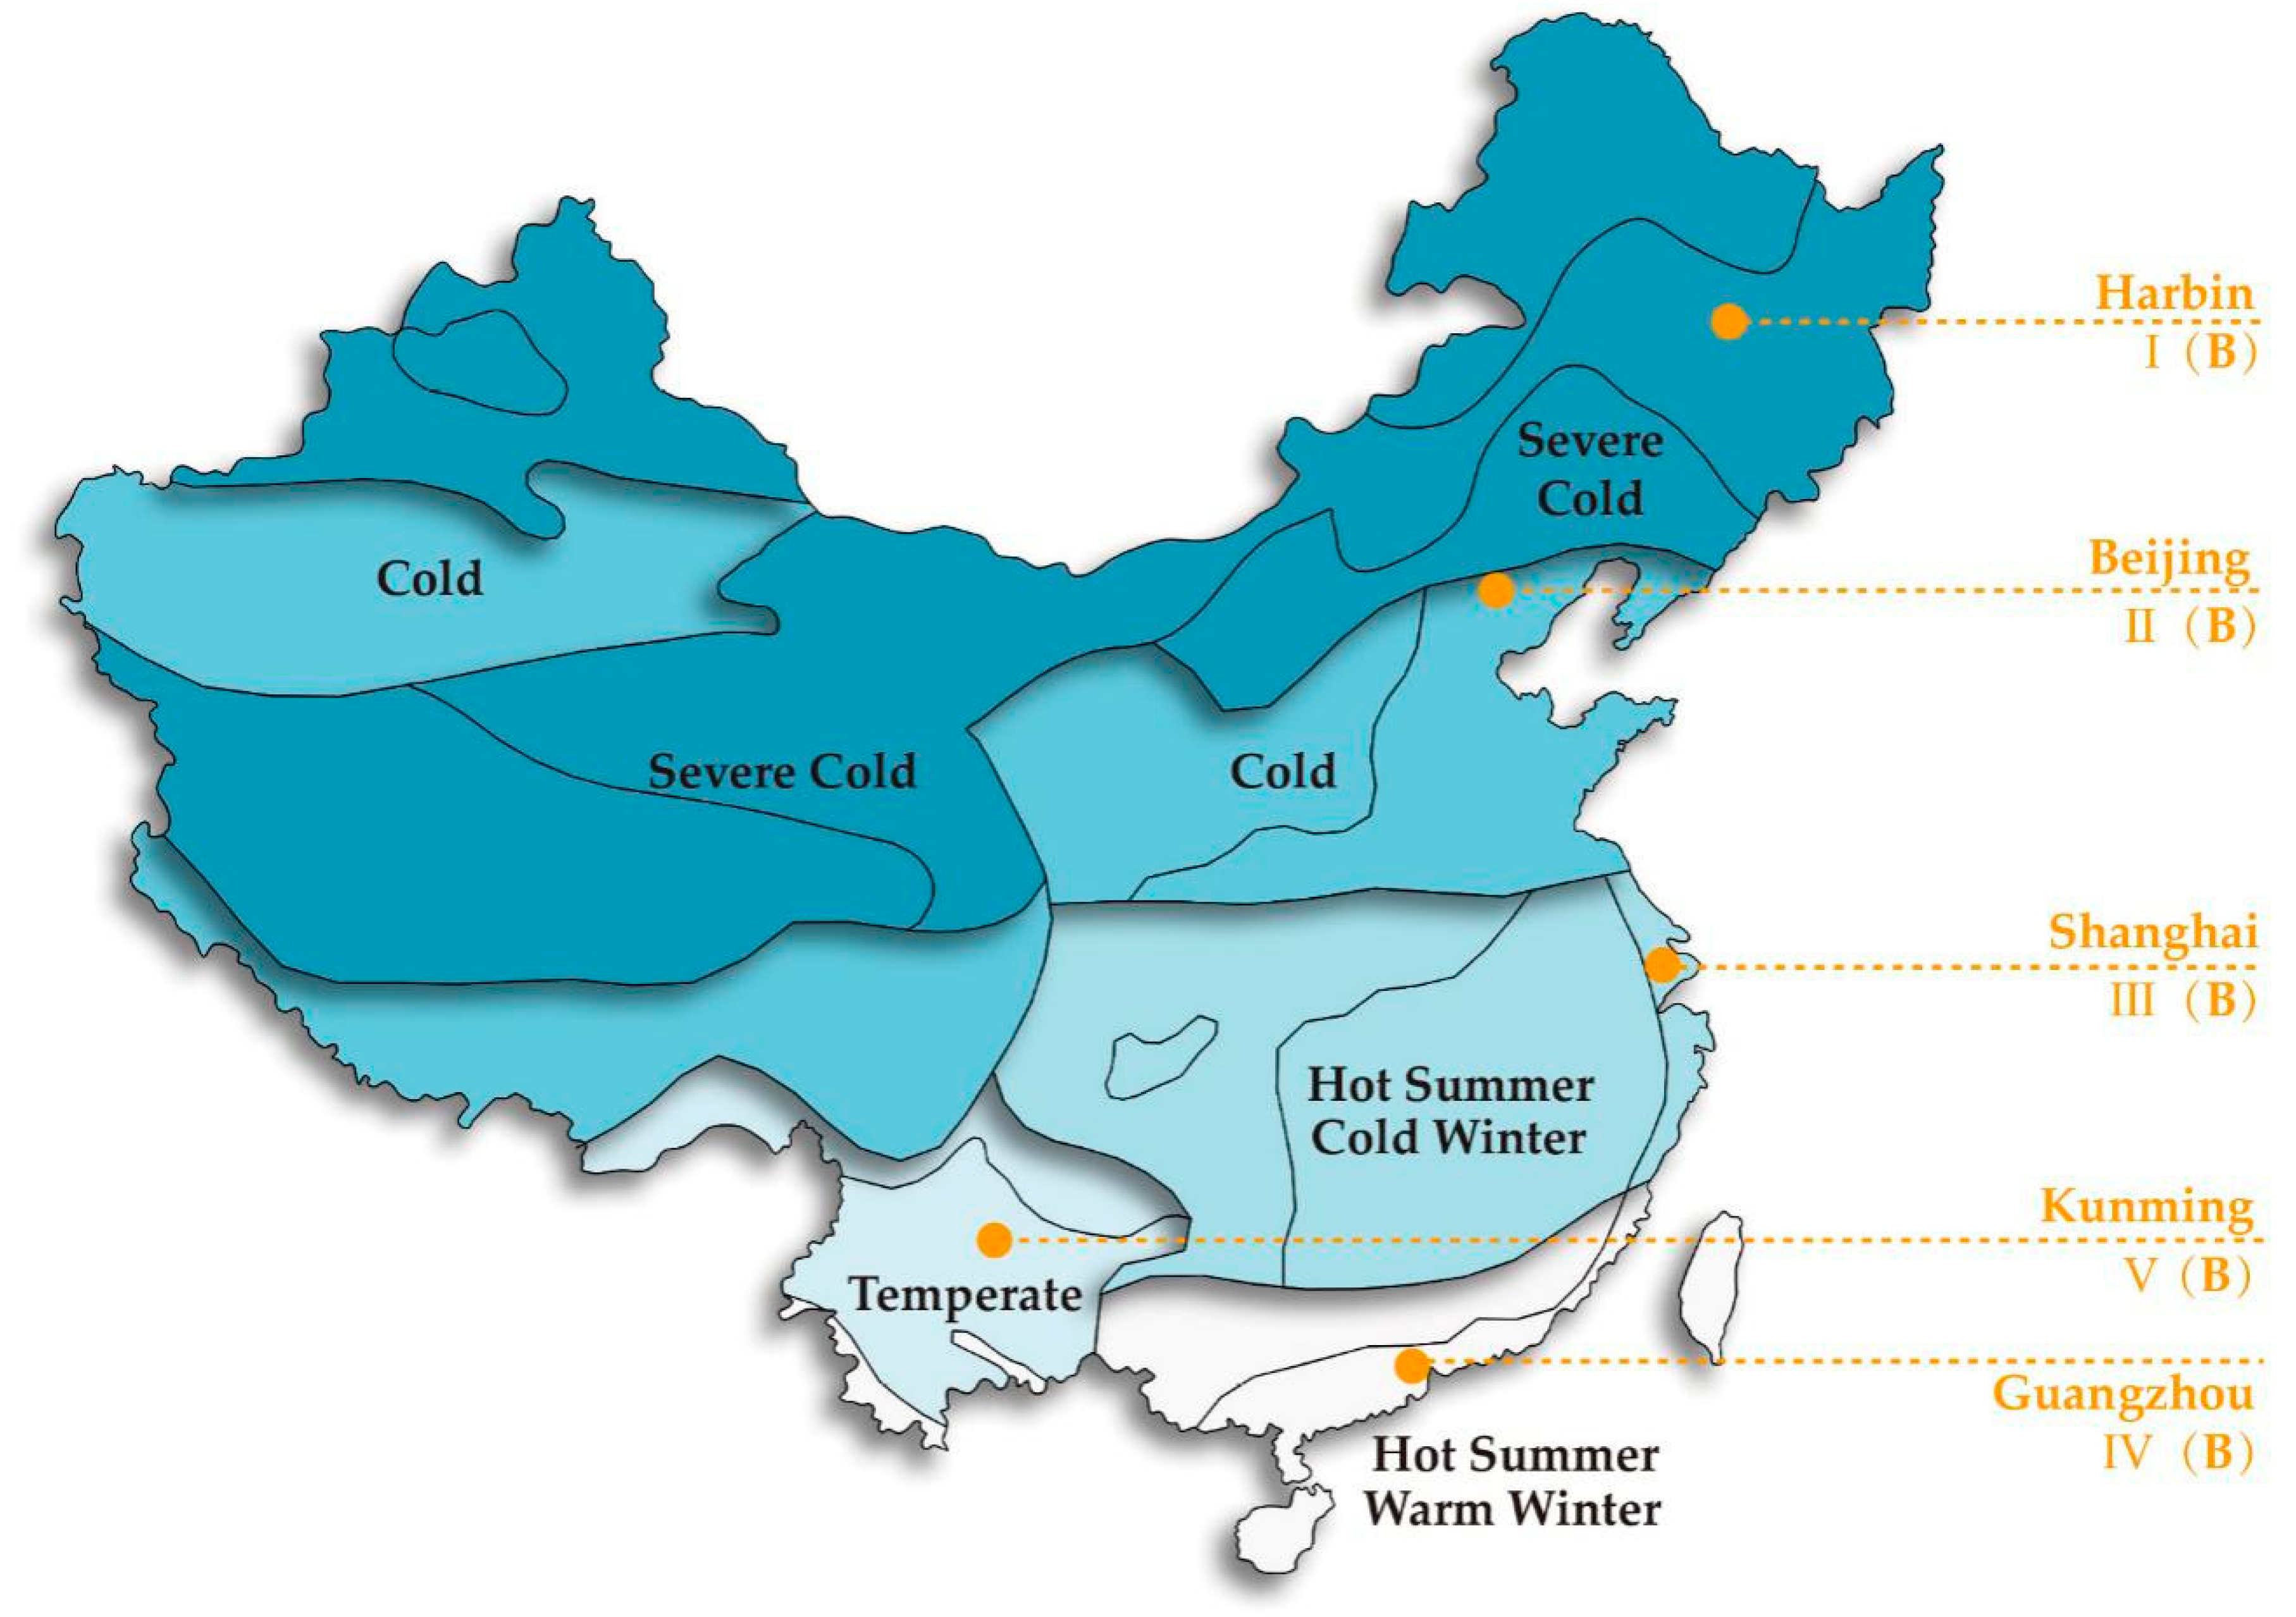
2.1. Climate Zones in China

In the Code for Design of Civil Buildings (GB 50352-2005) [38], five major climate zones are distinguished to assess the thermal-technical designs of buildings in China. These regions are “severely cold,” “cold,” “hot summer, cold winter,” “hot summer, warm winter,” and “temperate.” The climate conditions of these regions vary greatly due to China’s vast territory. Where necessary, each of the five climate zones can be further divided into A, B, C, and D, giving 20 sub-regions. In this paper, five major cities, namely Harbin, Beijing, Shanghai, Guangzhou, and Kunming, are selected to represent each climate region (Figure 4). Buildings in each region have to follow local construction regulations, which define structural criteria; the insulation properties of opaque walls, floors, and roofs; and the thermal and optical performance of windows and skylights. Thermal insulation design is one of the most important regulatory areas, and these regulations should be enforced particularly strictly in the severely cold and cold regions due to their frigid climate. The basic information on thermal design in these five cities is presented in Table 1 [38,39].

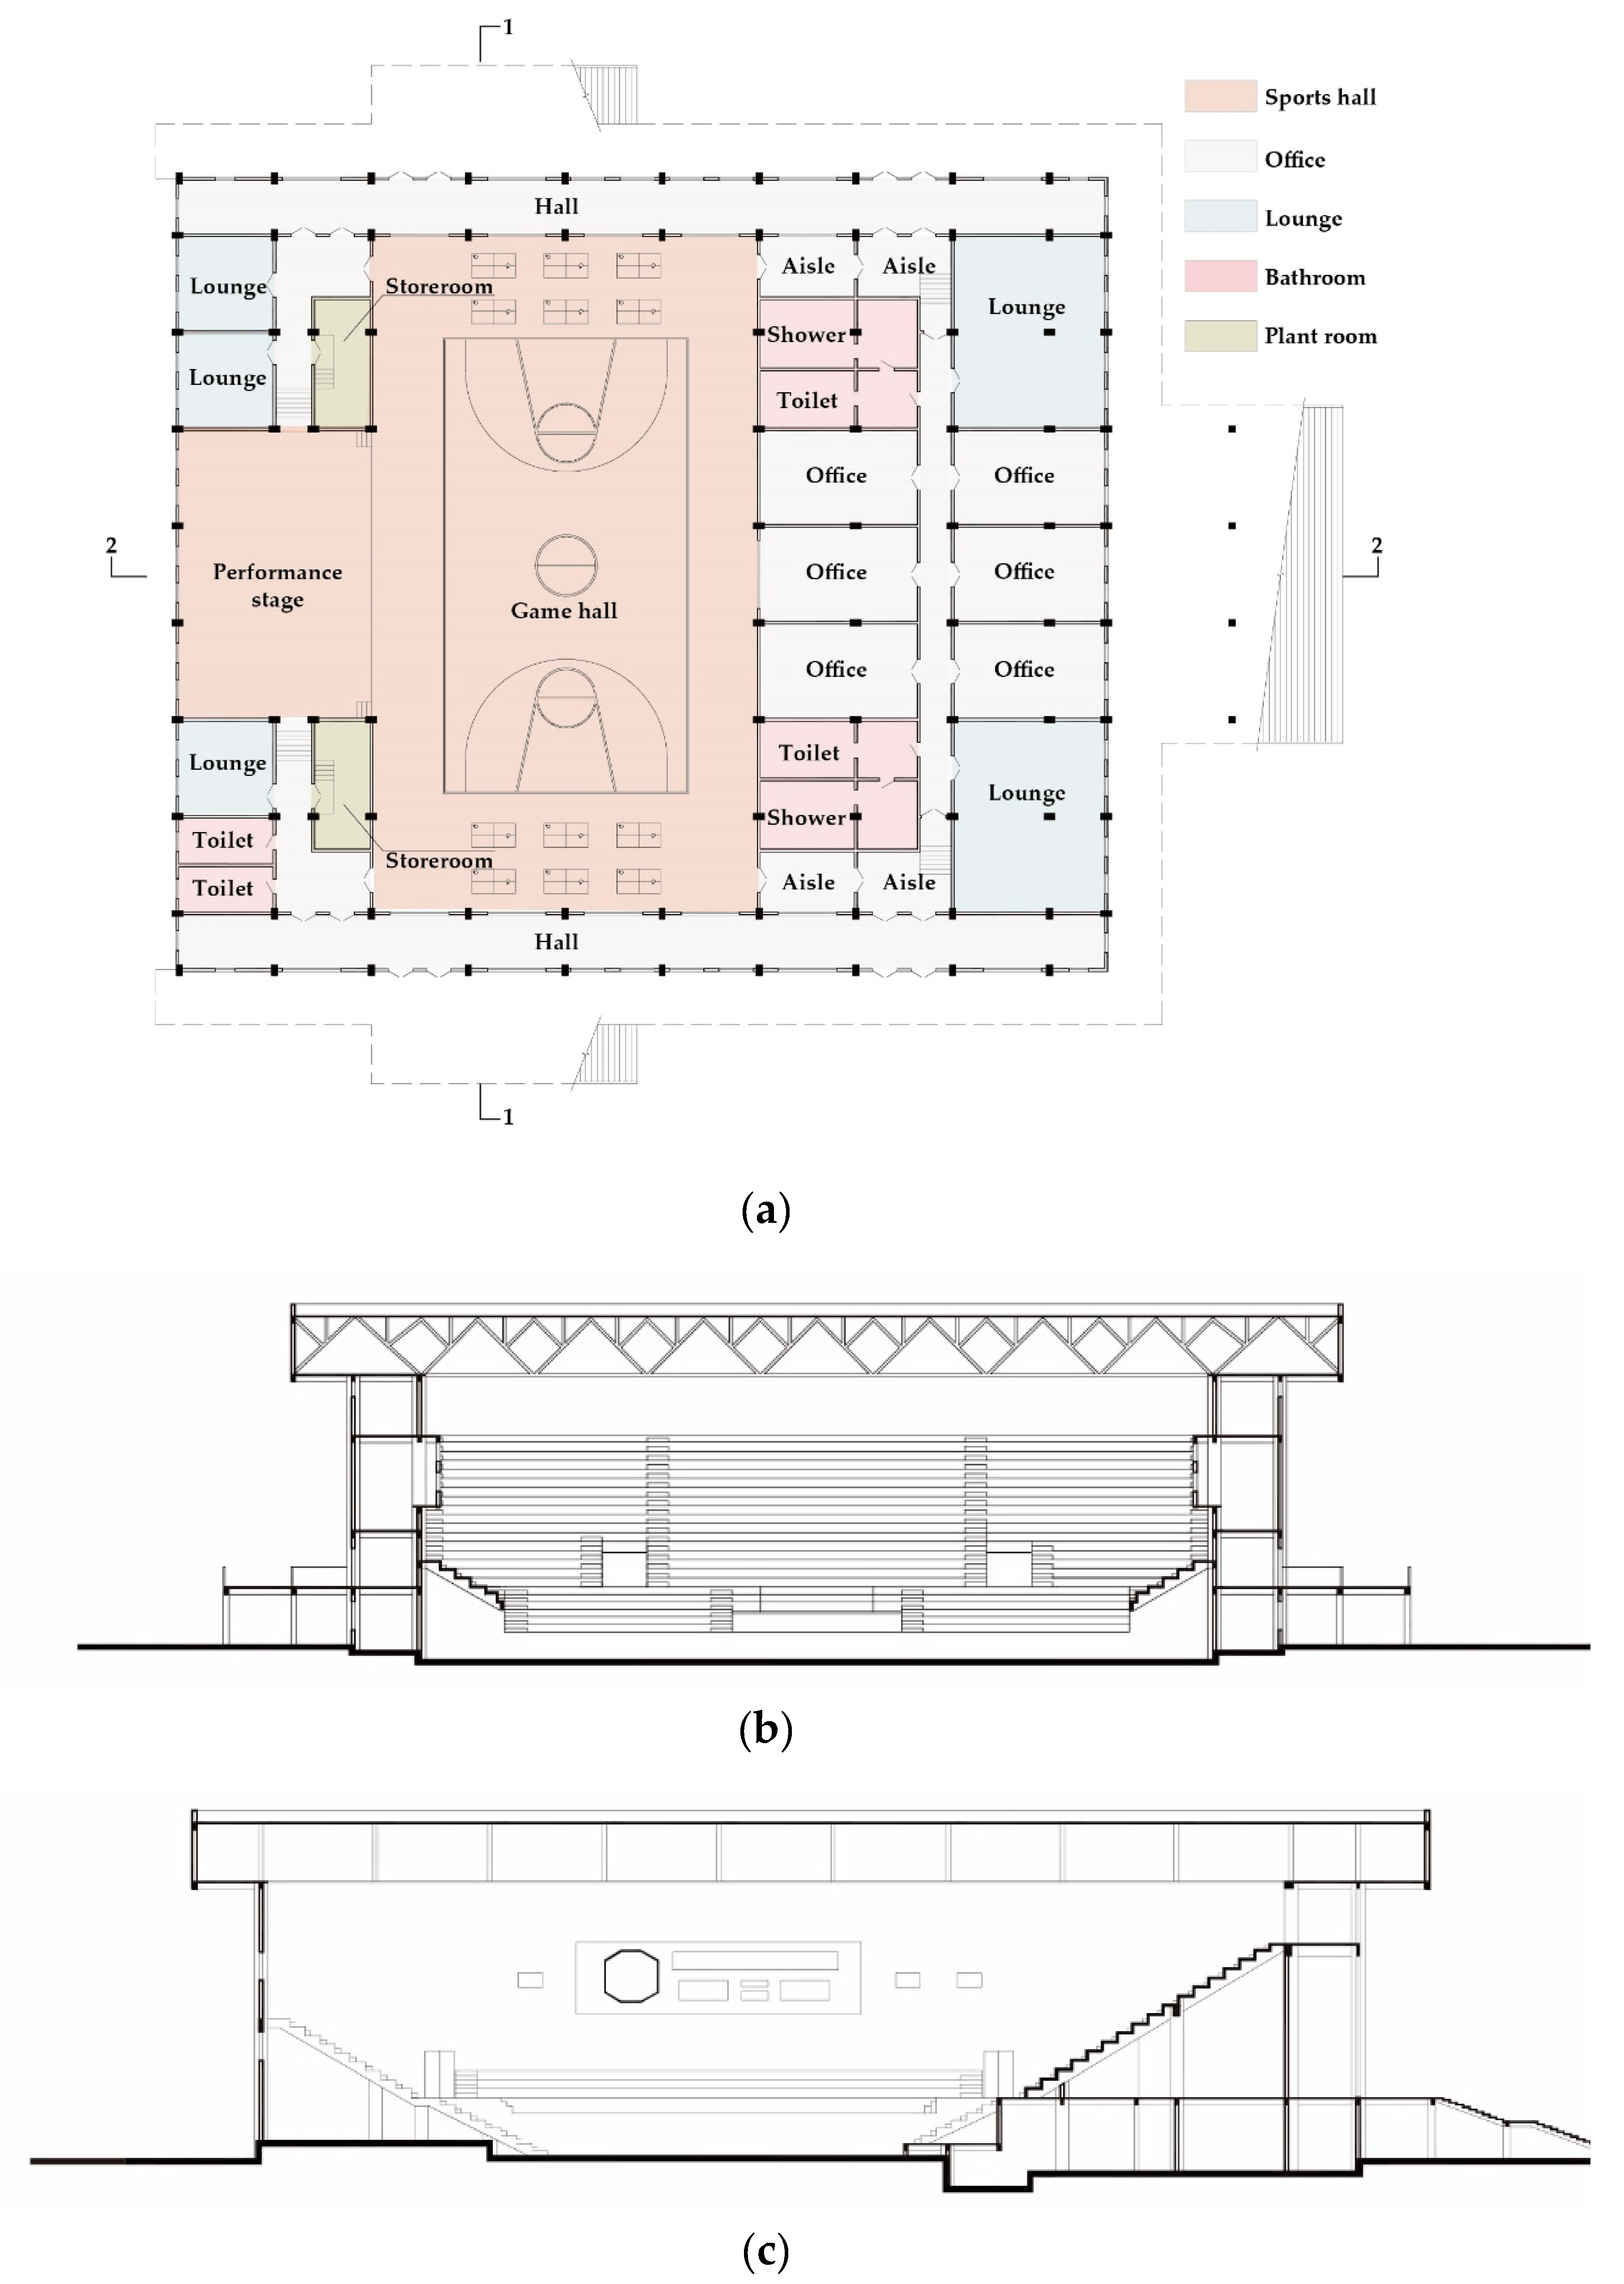
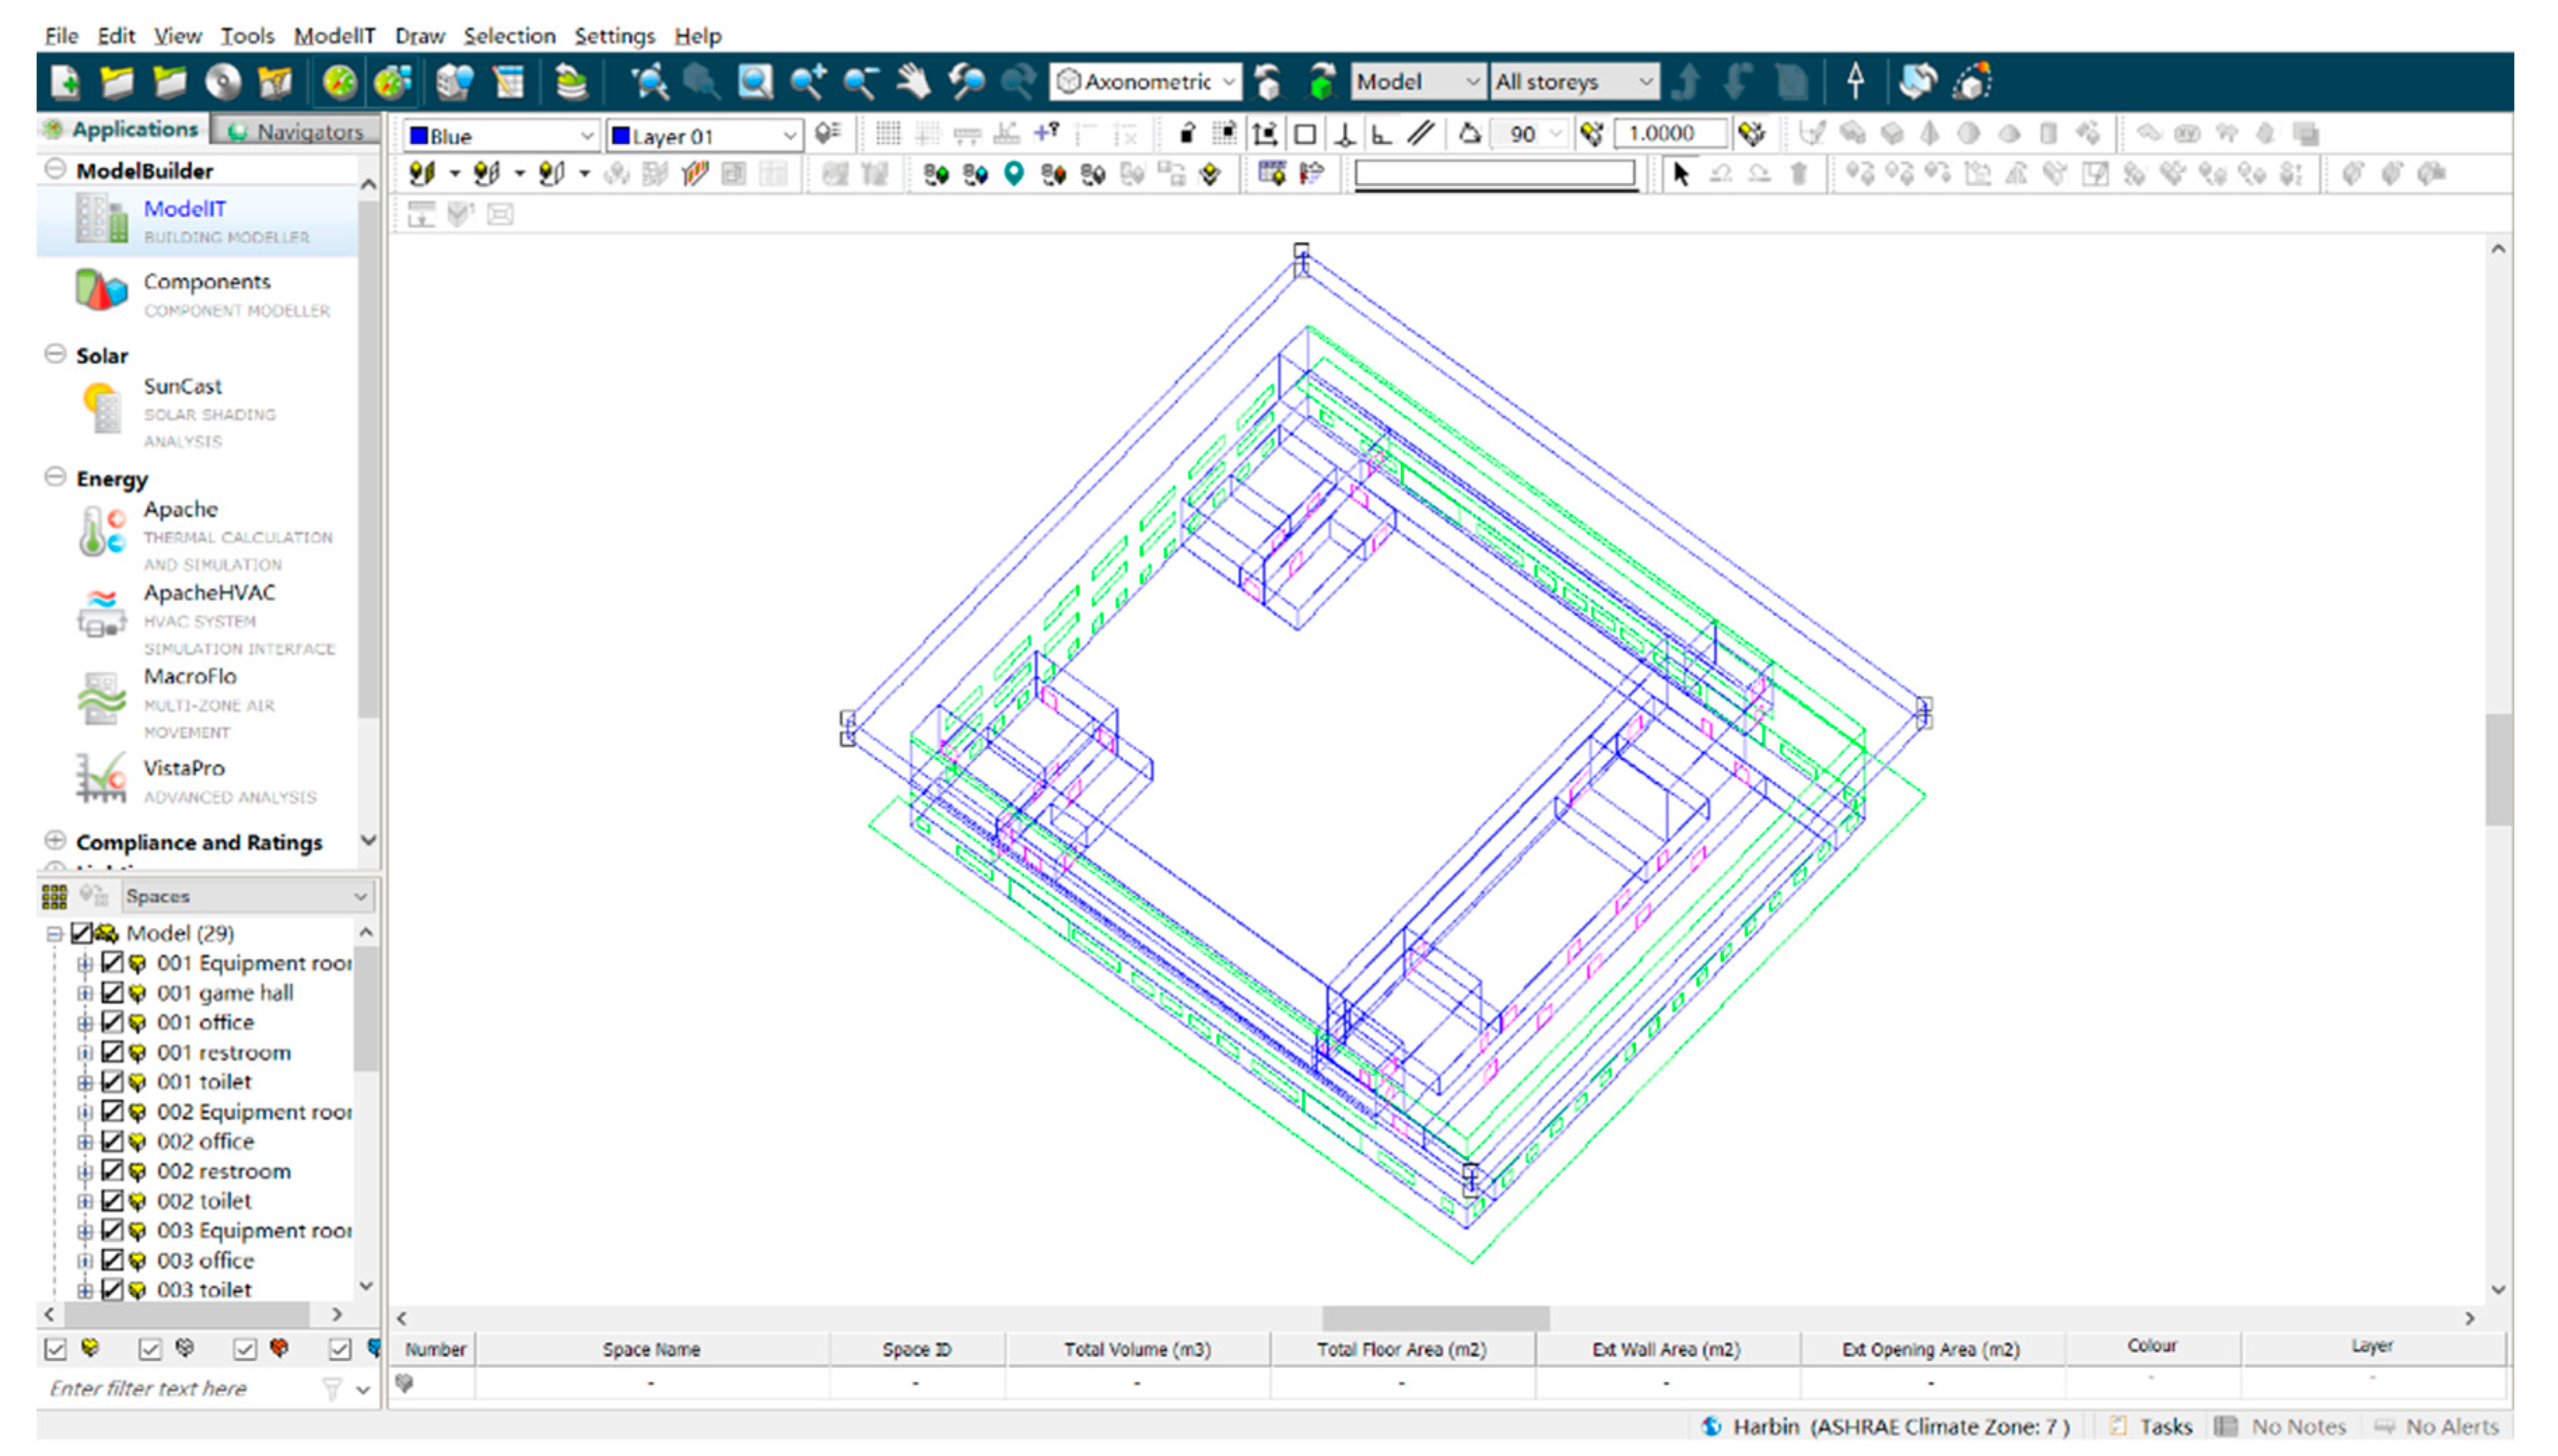
2.2. Details of Simulation Buildings

In this paper, in order to clarify the energy saving and carbon reduction potential of timber stadiums in comparison with stadiums using conventional building materials, a real stadium located in Harbin is selected as a reference building. This is a typical community-scale stadium, which can accommodate 3000 people at most in residential districts. The stadium is normally available to local residents from 09:00 to 17:00, three days a week. The stadium can be divided into five functional areas namely sports hall, office, lounge, bathroom and plant rooms. The basic architectural design information is tabulated in Table 2. Figure 5 presents the floor plan and sections of the stadium. The roof of the original stadium has a plate-like space truss and the external wall is made of reinforced concrete (RC) and steel.
The process of designing the simulation buildings is divided into two parts. The building materials and structures are designed according to the different climate zones. In the first stage, four similar buildings located in other climate regions are designed on the basis of the original stadium in Harbin. The stadium’s exterior envelope construction and building materials are the same as those of the original stadium, but the thickness of the envelope is adjusted to reflect the actual situation and meet the local building regulations in each climate region. During the second stage, five timber stadiums are designed in five climate regions, respectively, on the basis of the reference RC stadiums. The basic dimensions of the timber buildings, such as floor height, building orientation, ground area, and major functions, are the same as for the reference concrete buildings. However, the load-bearing structure and external envelope are replaced by timber. The related design parameters for the RC and timber stadiums in the five studied cities are presented in Table 3 and Table 4.

3. Method and Data

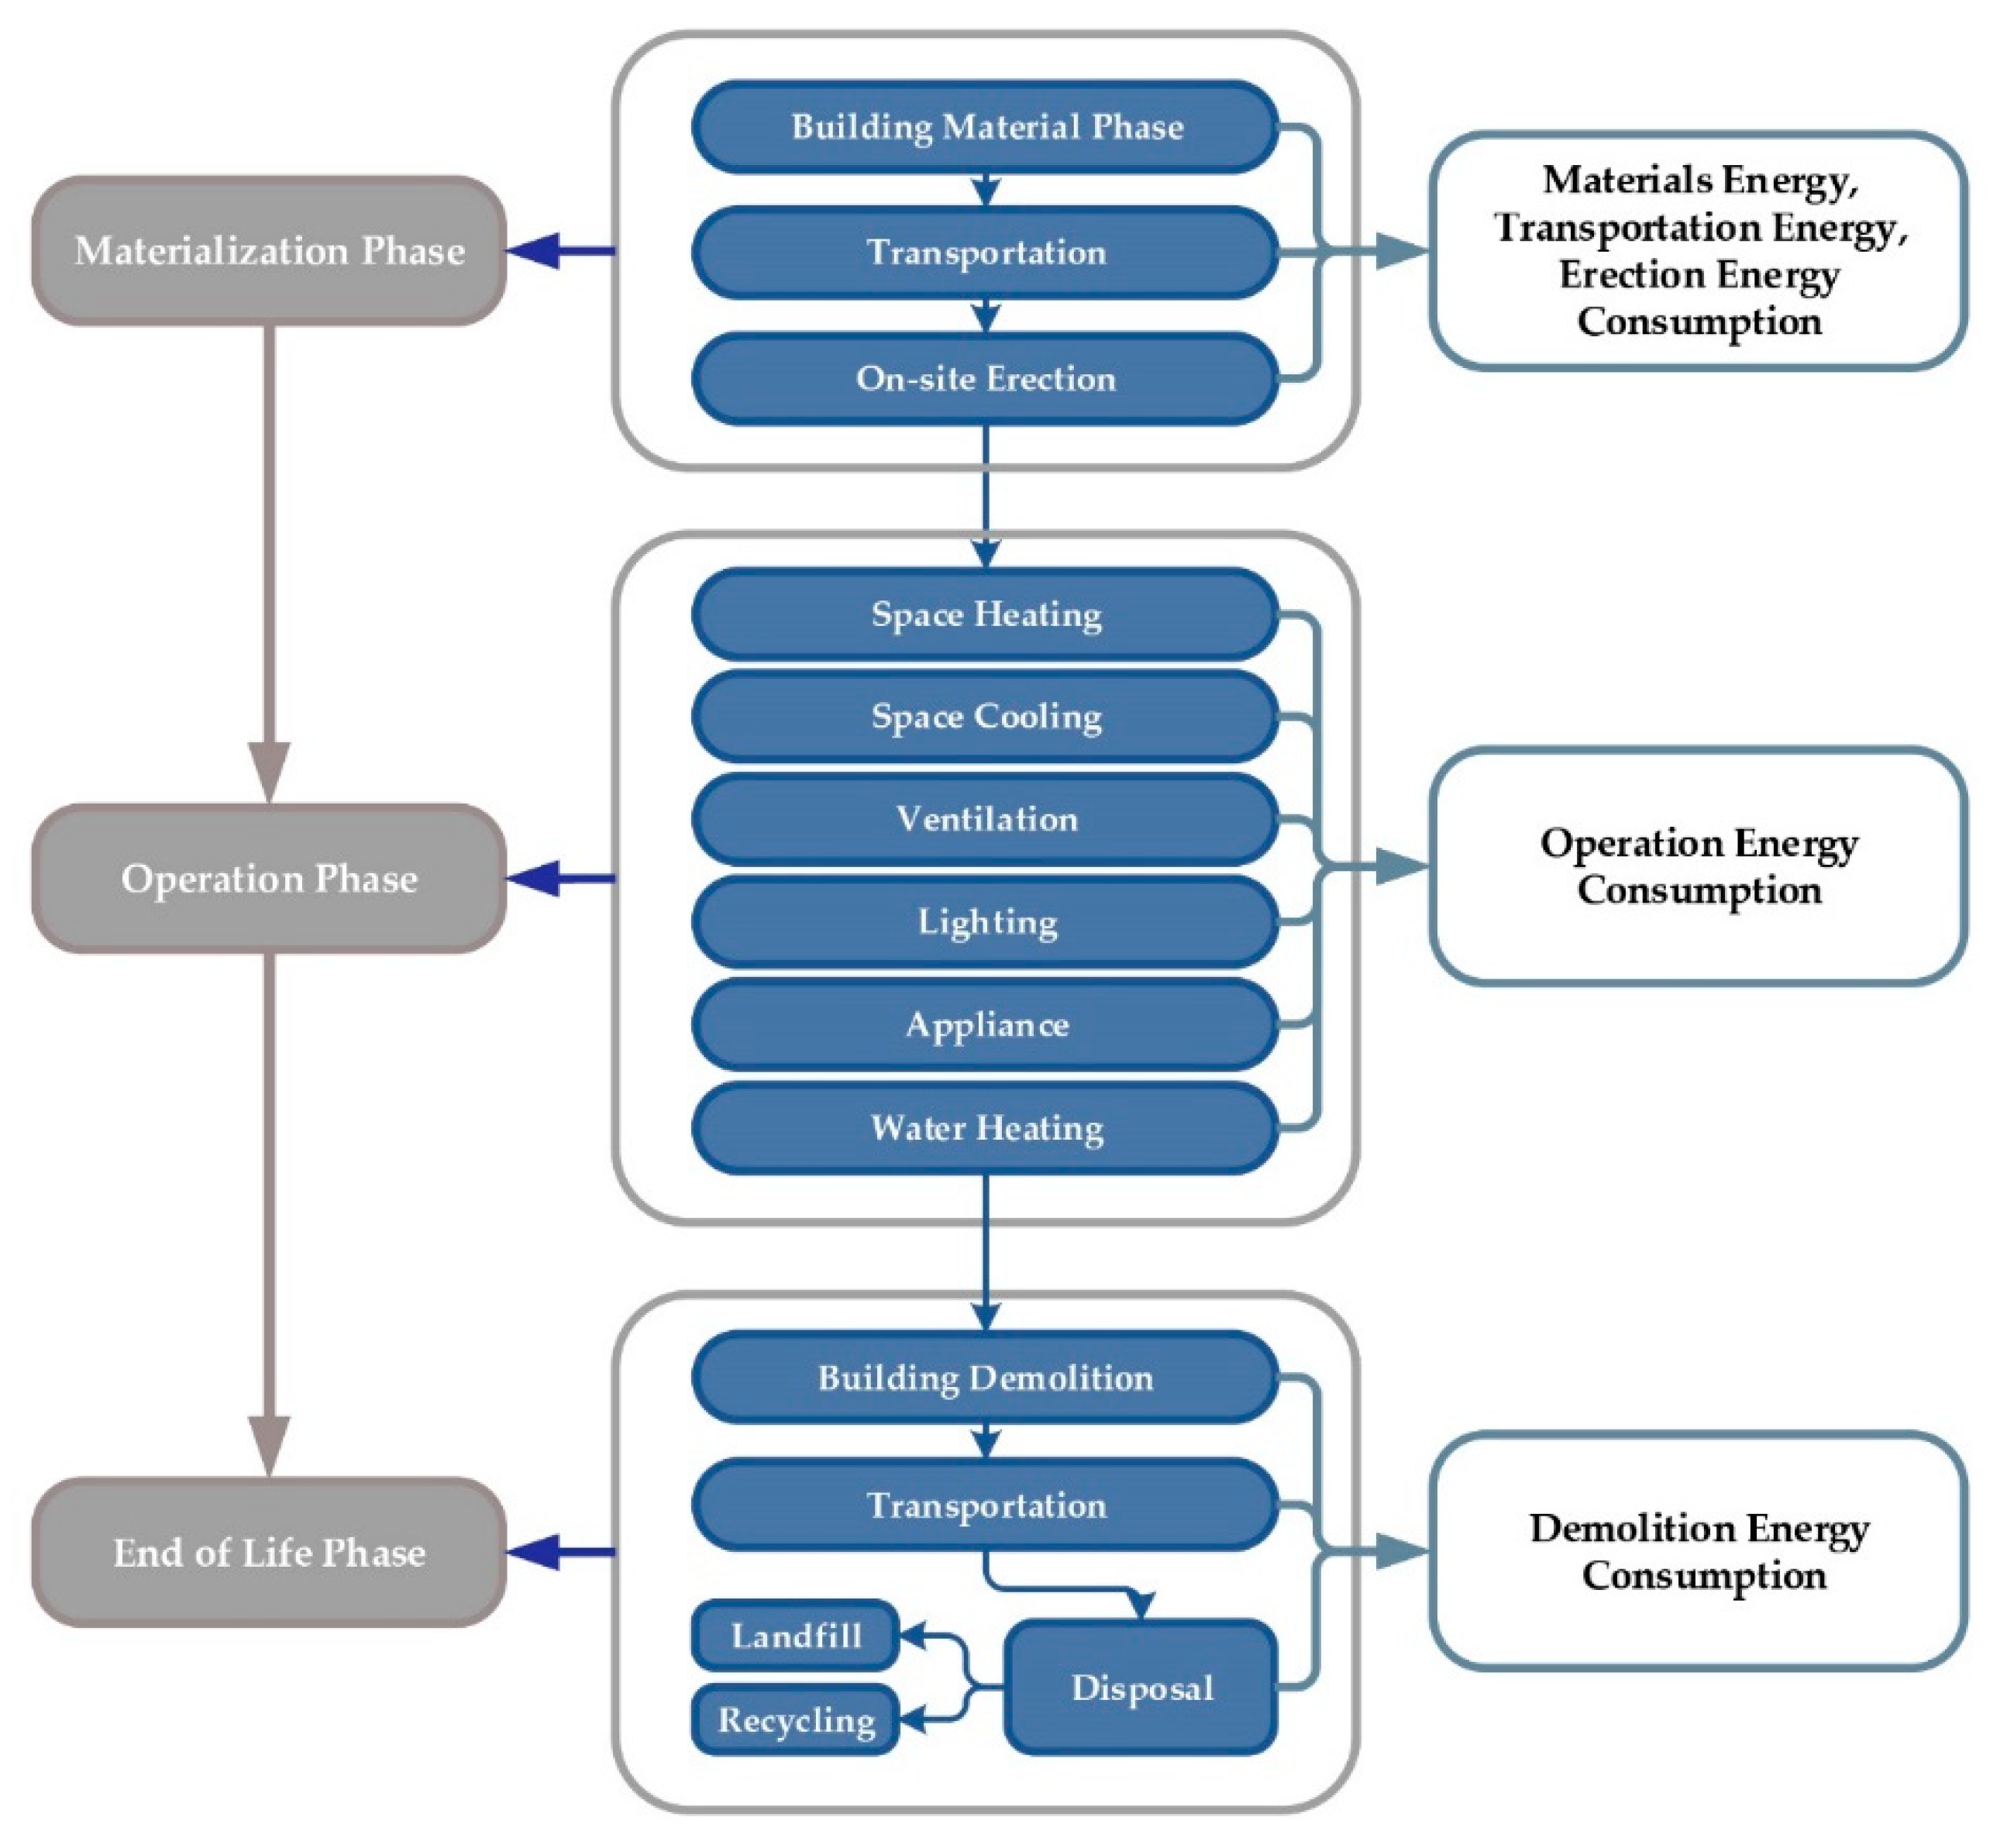
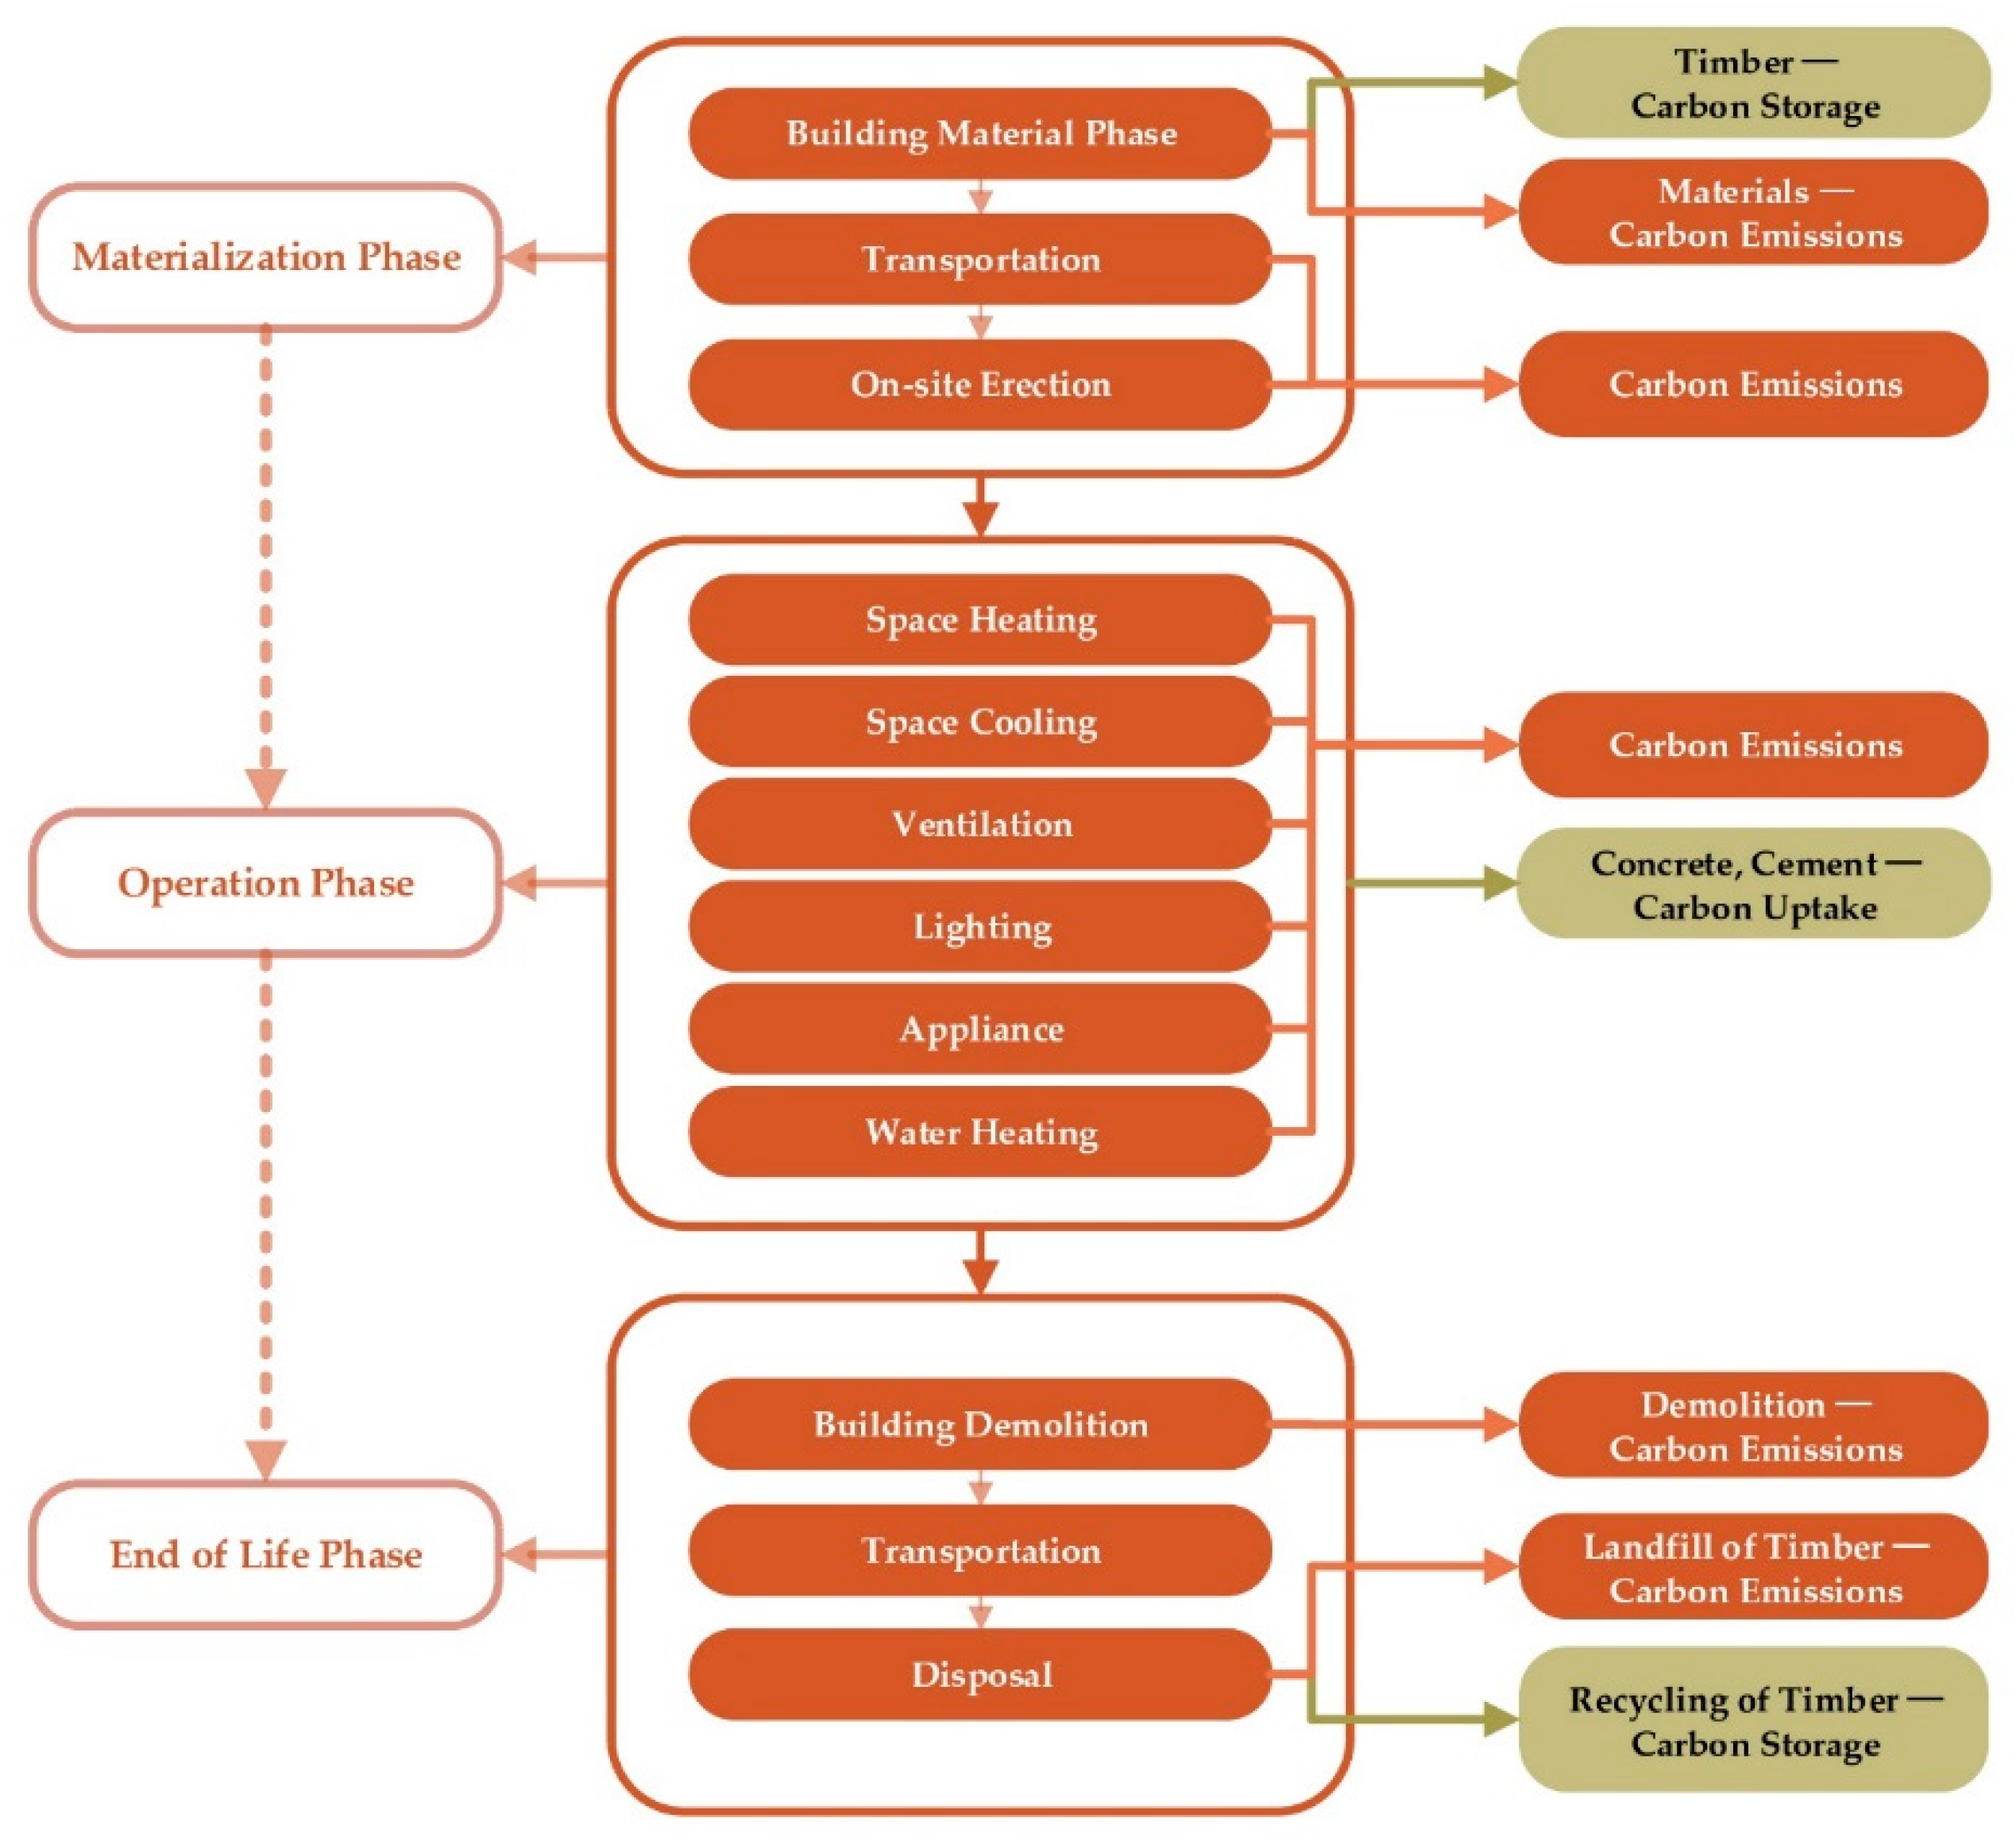
3.1. Framework of the Study

Life Cycle Energy Assessment (LCEA) and Life Cycle Carbon Assessment (LCCA)

In relation to building life cycle assessment (LCA), a building’s energy consumption and carbon emissions during its lifespan can be divided into three stages, namely materialisation, operation and end of life. In this paper, both energy consumption and carbon emissions during the building’s life cycle are taken into account. During the construction phase, energy consumption and carbon emissions can be further divided into building materials, transportation and on-site erection. During the production process, conventional materials such as RC, steel, and cement consume a large amount of energy and release carbon dioxide. In contrast, during the fabrication of wood materials, trees absorb carbon dioxide and consume a small amount of energy. The existing research has demonstrated that 1 cubic meter of wood stores approximately 140–510 kg of C (carbon), which means that it contains about 513–1870 kg of CO2 [40]. It is well accepted that building energy consumption and carbon emissions are the dominant components during the operation phase. In the context of the building lifespan, two thirds of the total building energy are consumed during this stage [41,42,43]. In this phase, the energy consumption and carbon emissions of a residential building can be further divided into six categories, namely lighting, space heating, space cooling, ventilation, appliances, and water heating. This study also considers the carbonation and durability of cement and RC. The carbonation of reinforced concrete and cement is one of the causes of corrosion, but it is also a way of sequestering CO2. The end of life phase comprises the energy consumed and carbon emitted during building demolition, transportation and material disposal. Flowcharts depicting the life cycle energy assessment (LCEA) and life cycle carbon assessment (LCCA) in this study are presented in Figure 6 and Figure 7, respectively.

3.2. Energy Consumption

3.2.1. Construction Phase

As mentioned above, the materialization stage comprises material production, transportation and on-site erection. Several assumptions are made when carrying out the LCEA and LCCA in the materialization stage.
(1)
The energy consumed and carbon emitted during the decoration of concrete buildings are ignored.
(2)
Based on existing research, the on-site erection energy consumption of RC and CLT buildings is set at 100 MJ/ m2 and 20 MJ/m2, respectively [44].
(3)
The boundaries of the materials, including concrete, sand, cement, steel, and brick, start with the extraction of raw materials, whereas the boundary for CLT starts with tree harvesting. The total volume of consumption of building materials for RC and timber stadiums is shown in Table 5. The inventory of data used to calculate the energy consumption of building material production is presented in Table 6.

3.2.2. Operation Phase

This study simulates building energy consumption during the operation stage using the commercial software package Integrated Environmental Solutions—VE (IES-VE). The software is developed by Integrated Environmental Solutions company, which is located in Glasgow, UK. In the software platform, RC and timber stadiums can be established as simulation models (Figure 8). Energy consumption from lighting, space heating, space cooling, appliances, ventilation, and water heating is simulated. Several assumptions are made during the simulation.
(1)
According to the building grade classification in China, the life spans of the two stadiums are assumed to be 50 years [50].
(2)
The indoor temperature is controlled between 10 °C and 26 °C. In the winter, the temperature of the sports hall is set at 18 °C when occupied. The temperature of the office, lounge and bathroom areas are set at 20 °C. The comfortable temperature in summer is expected to be no more than 26 °C. Cooling is implemented automatically when the temperature exceeds this range. The basic parameters of the thermal conditions are shown in Table 7 [50].
(3)
Both natural and infiltrate ventilation are simulated. The basic parameters of ventilation are shown in Table 8 [50].
(4)
Electricity is used for cooling, water heating, lighting, appliances, and ventilation, while raw coal is used for heating. This is the current practice in China and is described in detail later.

3.2.3. End of Life

During this phase, the following assumptions are made for calculation.
(1)
The energy consumption for demolition of a building is considered to be 90% of the energy consumed during the erection phase as the existing research [51]. The demolition area of RC and CLT buildings is set at 90 MJ/m2 and 18 MJ/m2, respectively.
(2)
For the concrete buildings, we assume that all of the concrete and steel materials would go into landfill after demolition. This is also the current practice in Northeast China. Due to the relatively small amount of steel used in the stadium, the ignorance of steel recycling may not have significant effect on the total carbon emissions of the building.
(3)
For the CLT buildings, a recycling rate of 60% is assumed, with 40% used for biomass energy.
(4)
The energy consumed by transportation is ignored.

3.3. Carbon Emissions and Carbon Uptake

3.3.1. Carbon Emissions

During the construction stage, electricity is the main source for the building materials manufacture. During the operation stage, as mentioned above, raw coal and electricity are the two main sources of energy for the operation of stadiums. Electricity is used for cooling, lighting, water heating and appliances, and raw coal is used for heating. During the end of life stage, the energy consumption is assumed to be mainly from the electricity. The energy consumption can be obtained from the simulation and calculation directly. In order to get the carbon emission, the results need to be converted by conversion formulas. The carbon emissions for coal and electricity can be obtained from Equations (1) and (2) [52].
E t = Q j t η j × 11 3
Et = ∑QjtCjηj
where Et is the estimated amount of carbon emissions of the t-th studied city; Qjt is the energy consumption from the coal and electricity of the t-th studied city; Cj is the appropriate calorific value of the j-th energy source; and ηj is the carbon emission factor of the j-th energy source. The values of Cj and ηj in this study are summarized in Table 9 [52,53].
The values of raw coal’s ηj are supposed to be the same nationwide, but the values of electricity’s ηj are strongly related to the energy source used for generating. In China, the national power grid is made up of six sub power grids. The CO2 emissions factors are not the same in each region due to the energy source used for generating. The energy sources of national power grid for electricity generation include coal, nuclear power, hydro, wind and others. Electricity generated from clean energy sources such as hydro and wind has low carbon emissions. While electricity from coal may emit tremendous CO2. Generally speaking, in China, the electricity is mainly generated from the coal and thermal energy accounted for 70.24% of electricity generation in 2019 [54]. As a result, the average CO2 emissions factor is much higher than that in other country. In Italy, CO2 emissions factor in 2017 is approximately 346 g/kWh, while the CO2 emissions factor is approximately 870 g/kWh in China [53,55]. The 5 studied cities by sub-regions of the national grid and the CO2 emissions factors of the sub-regions are presented in Figure 9. In northern part of China, where the coal is the dominant resource used for generating the electricity, the CO2 emissions factors is much higher than that in the other regions. The figures of CO2 emissions factors range from 0.67–1.14.

3.3.2. CO2 Uptake of Concrete and Cement during the Operation Stage

In this paper, the cement is mainly used as the opponent of the external rendering and the plaster. The CO2 uptake of concrete and cement during the operation stage can be obtained by the following steps.
(1)
Depth of carbonation. The carbonation of concrete starts at the outer surface and moves progressively inwards. The process is controlled by the diffusion of CO2 into the concrete. The depth of carbonation as a function of time can be described by Equation 3 [56,57]. The service life of the concrete is estimated to be 50 years (t):
d = k × t 0.5
where k is a rate constant, presented in Table 10; t is the carbonation time; and d is the depth of carbonation. The K values in this study are shown in Table 10 [58].
(2)
Volume of carbonated concrete. The volume of carbonated concrete can be obtained from Equation (4) [57]:
C a r b o n a t i o n   C o n c r e t e C e m e n t ( m 3 ) = ( A s l a b s × d ) + ( A w a l l s × d ) + ( A f o u n d a t i o n s × d )
where A is a rate constant, as presented in Table 11, and d is the depth of carbonation, which can be obtained from Equation (3).
(3)
Amount of CO2 absorbed per volume. The amount of CO2 absorbed per volume can be calculated using Equation (5) [57]:
Carbon   U p t a k e   ( k g   C O 2 / m 3   c o n c r e t e / c e m e n t ) = 0.75 × C × C a O × M C O 2 M C a O
where C is the mass of Portland cement clinker per m3 concrete/cement, assumed to be 1300 kg for cement and 240 kg for concrete respectively [58]; CaO is the average CaO content, which is assumed to be 65% [57,59]; and M is the molar mass of CO2 and CaO.
(4)
Amount of CO2 uptake. Finally, the total carbon uptake can be obtained by Equation (6).
Total   Carbon   Uptake   ( kg ) = Equation   4 × Equation   5

3.4. Quality of Data

In this paper, the data that used for assessment of energy consumption and carbon emissions can be summarized as three aspects. (1) The simulation parameters, such as the heating and cooling time, indoor temperature settings and ventilation rate all strictly follow the national building standards that issued by the Chinese government. The data is reliable since it is official. (2) The equations, calculation coefficients, and some parameters such as the Cj and ηj in the Equation (1) and Equation (2) are summarized from the relevant scientific research. (3) The parameters of the buildings, such as the functions, dimensions and thermal designs of the buildings are obtained directly from construction drawings. The reliability of the figures is considered as high, since it is from the original design.

4. Results and Analysis

Table 12, Table 13 and Figure 10 present the results of LCEA and operation phase for RC and timber stadiums in the five cities under study, which are located in different climate zones. The estimated energy consumption in RC stadiums is higher than that of timber buildings in all studied cities. The results demonstrate that timber is an energy efficient building material capable of saving energy and a suitable alternative to conventional building materials. The energy saving potential of timber is closely related to the climate region. The energy consumption during operation phase accounts for the majority of the total life cycle energy consumption. During operation phase, energy consumed for heating in “severely cold” and “cold” regions is much higher than that in other climate regions. Therefore, the total energy consumption of the studied buildings in “severely cold” and “cold” regions, where heating is the dominant energy-consuming activity, is significantly higher than that in other climate regions. Building energy consumption in Harbin is approximately two times greater than that in Kunming. In terms of operation stage, the energy consumption of RC buildings during the operation phase ranges from 343.44 MJ/m2 to 779.95 MJ/m2 per annum, while that of timber building ranges from 349.49 MJ/m2 to 712.24 MJ/m2 per annum. The results also echo the figures of existing references. Ma et al counted energy consumption of public buildings in North China and pointed out that the average energy consumption of office, hospital and school buildings are 678.11 MJ/m2, 711.52 MJ/m2 and 371.77 MJ/m2 per annum, respectively [60]. Jiang and Tovey revealed that commercial buildings in Beijing and Shanghai consumed 622.8 MJ/m2 and 475.2 MJ/m2 per annum [61].
Table 14, Table 15 and Figure 11 present the estimated results of LCCA and operation phase for RC and timber stadiums in the five cities under study, which are located in different climate zones. Similar to the LCEA, building CO2 emissions are higher in “severely cold” and “cold” regions than in other regions. The carbon emission values of RC stadiums during the operation stage range from 156.88 kg/m2 in Harbin to 63.20 kg/m2 in Kunming per annum. In contrast, the carbon emissions of timber stadiums during the operation stage range from 156.50 kg/m2 in Harbin to 64.60 kg/m2 in Kunming per annum. The calculation results also echo the outcomes of the existing scientific research. Jiang and Tovey revealed that a commercial building in Beijing and Shanghai emitted 178 kg CO2/m2 and 119 kg CO2/m2 per annum [61]. Jing et al evaluated 30 office buildings in Hongkong, and pointed out that the office building emitted 190 kg CO2/m2 per annum on average [62]. Garg et al calculated the carbon emissions of 197 commercial buildings in Gujarat, India. The results showed that carbon emissions of commercial buildings ranged from 96 kg CO2/m2 to 177 kg CO2/m2 per annum [63]. The carbon reduction effects of timber buildings during the operation stage are notable in comparison with those of RC stadiums in “cold,” “severely cold,” and “hot summer, cold winter” regions. However, in “hot summer, warm winter” regions and “temperate” regions, the carbon reduction effects of timber buildings during the operation stage are less notable.

5. Discussion

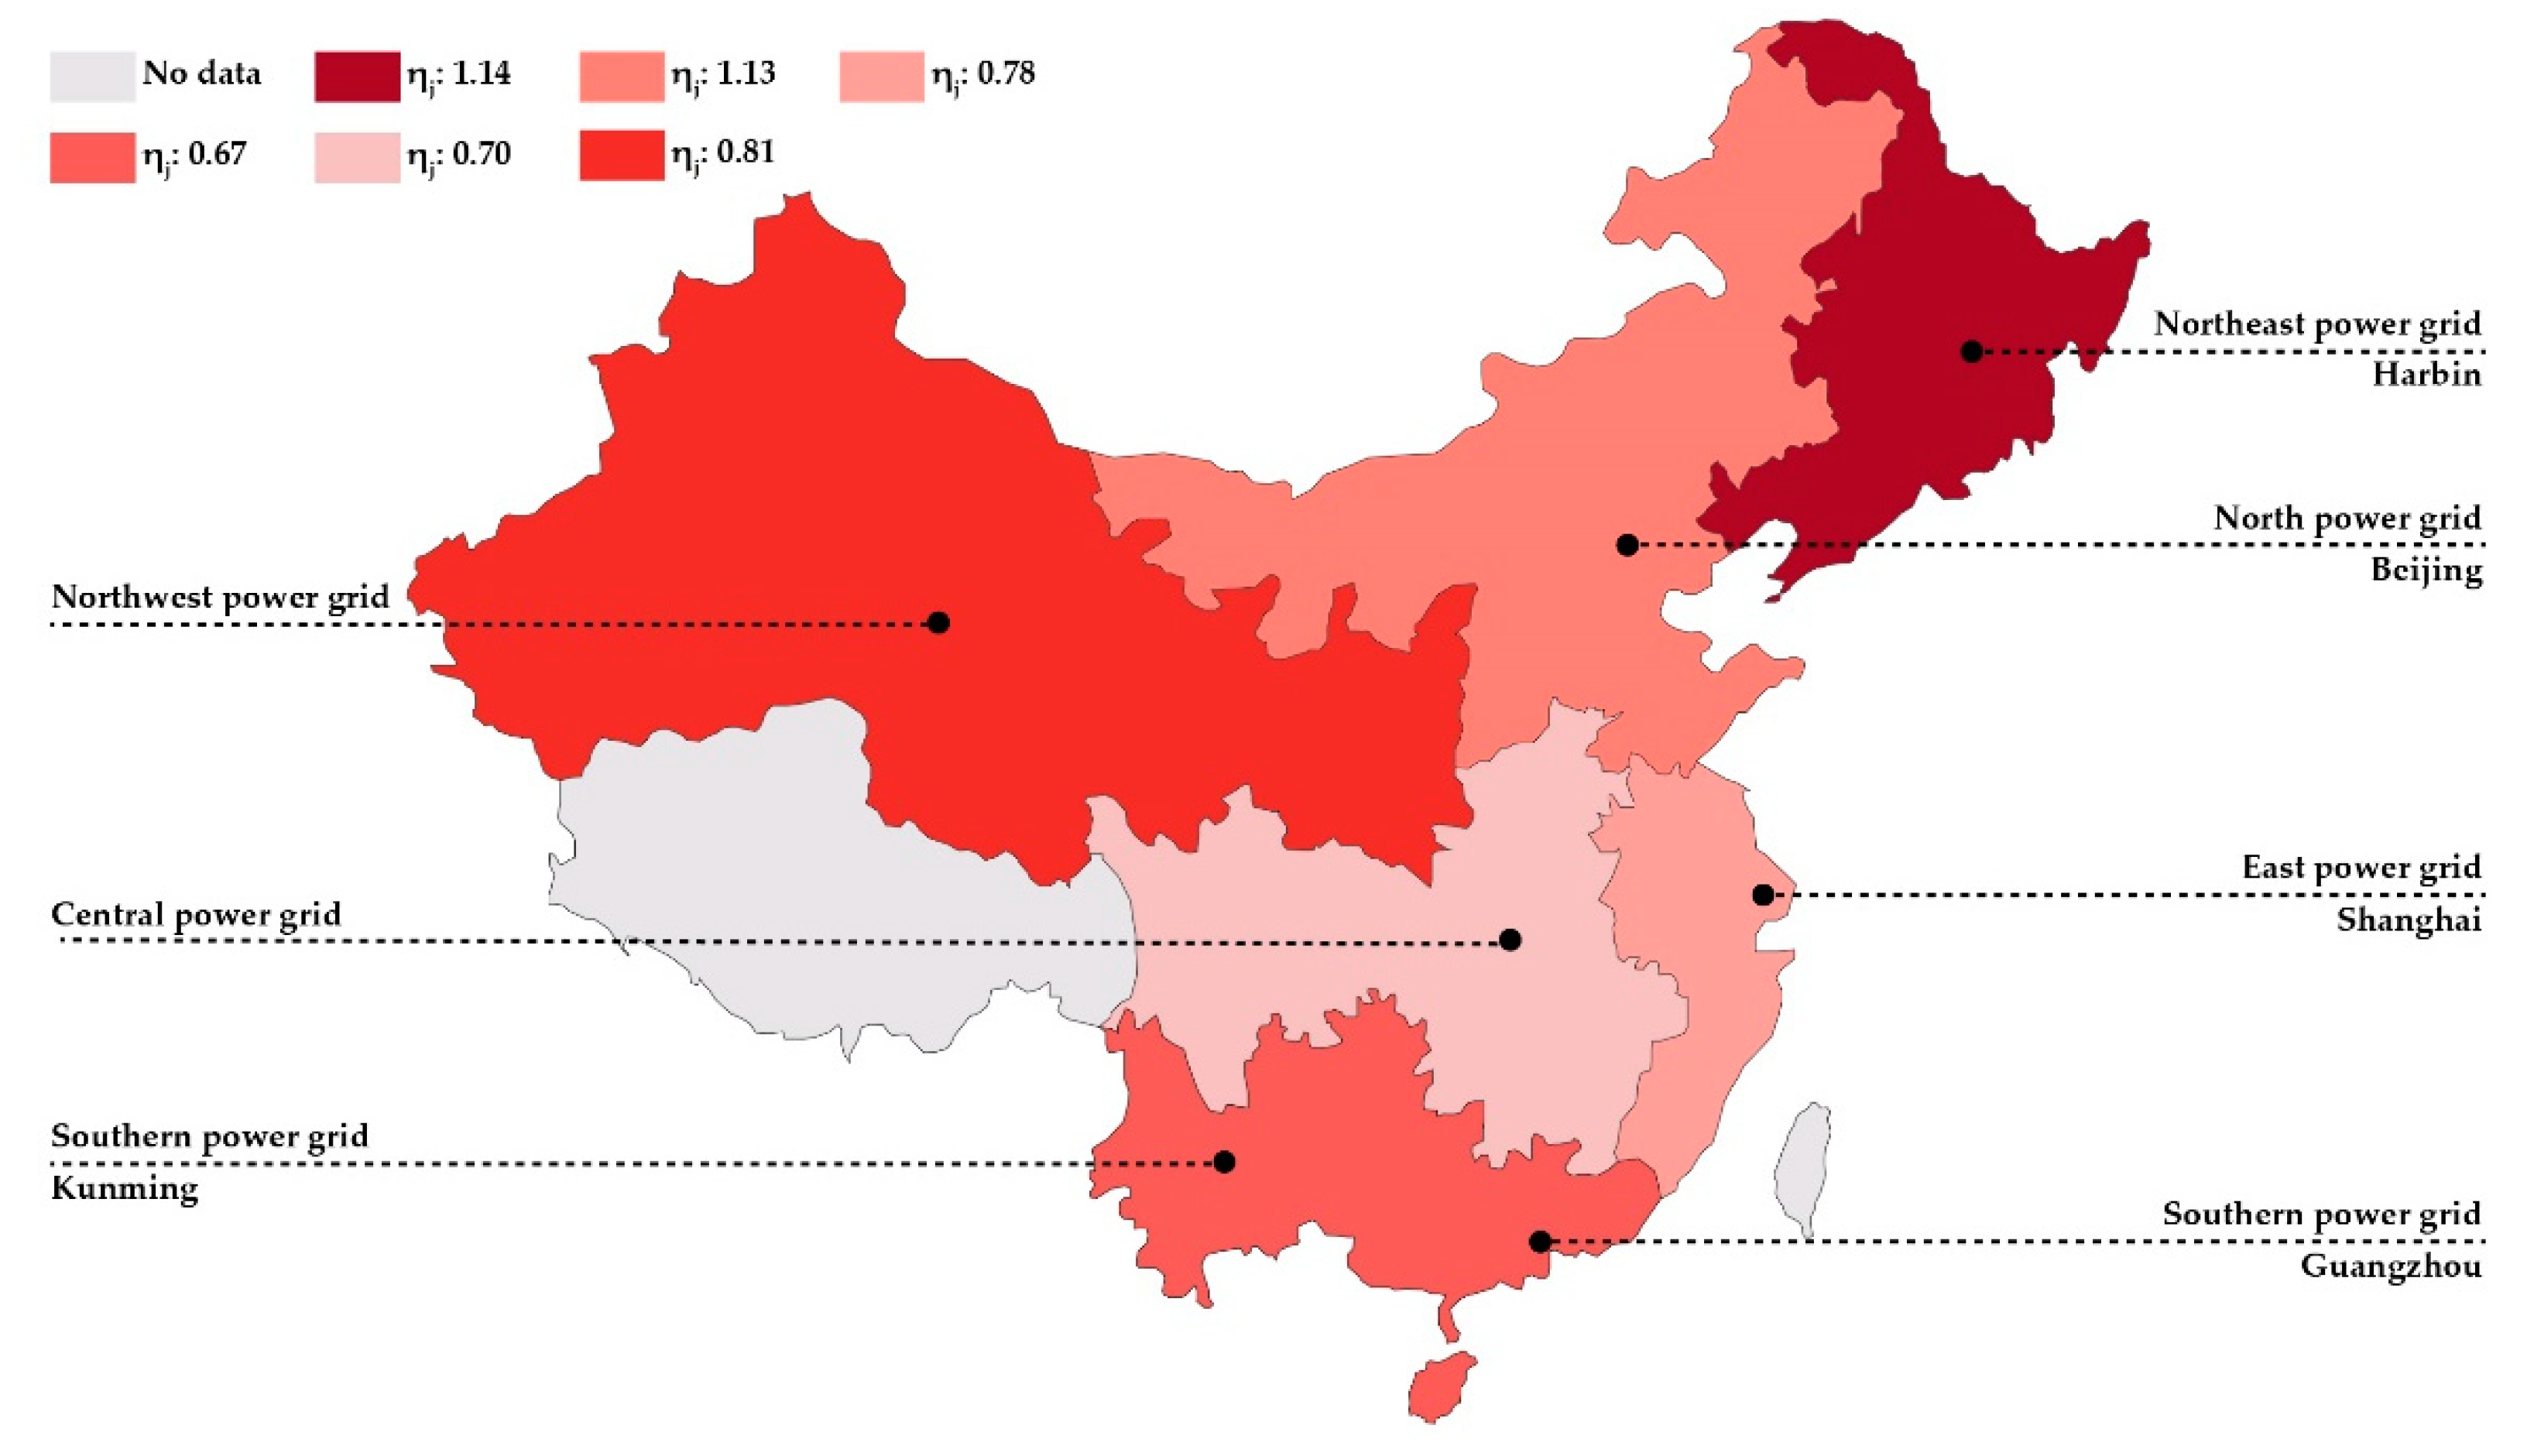
5.1. Energy Consumption and Carbon Emissions in Different Climatic Regions

The simulation results demonstrate that timber is a more sustainable building material than RC in all climate regions. As shown in Table 16, the energy saving and carbon reduction potential is greatest in “cold” regions, followed by “severely cold,” “hot summer, cold winter,” “hot summer, warm winter” and “temperate” regions. However, as a building material, timber lacks effectiveness in regions without considerable space heating in the winter. Although CLT as a sustainable material can be developed nationwide in China, it would be best to develop it in “severely cold” and “cold” regions first due to limitations on timber production. Thus, policy makers are advised to promote the construction of timber public buildings in northern China as an effective way to reduce energy consumption and carbon emissions.

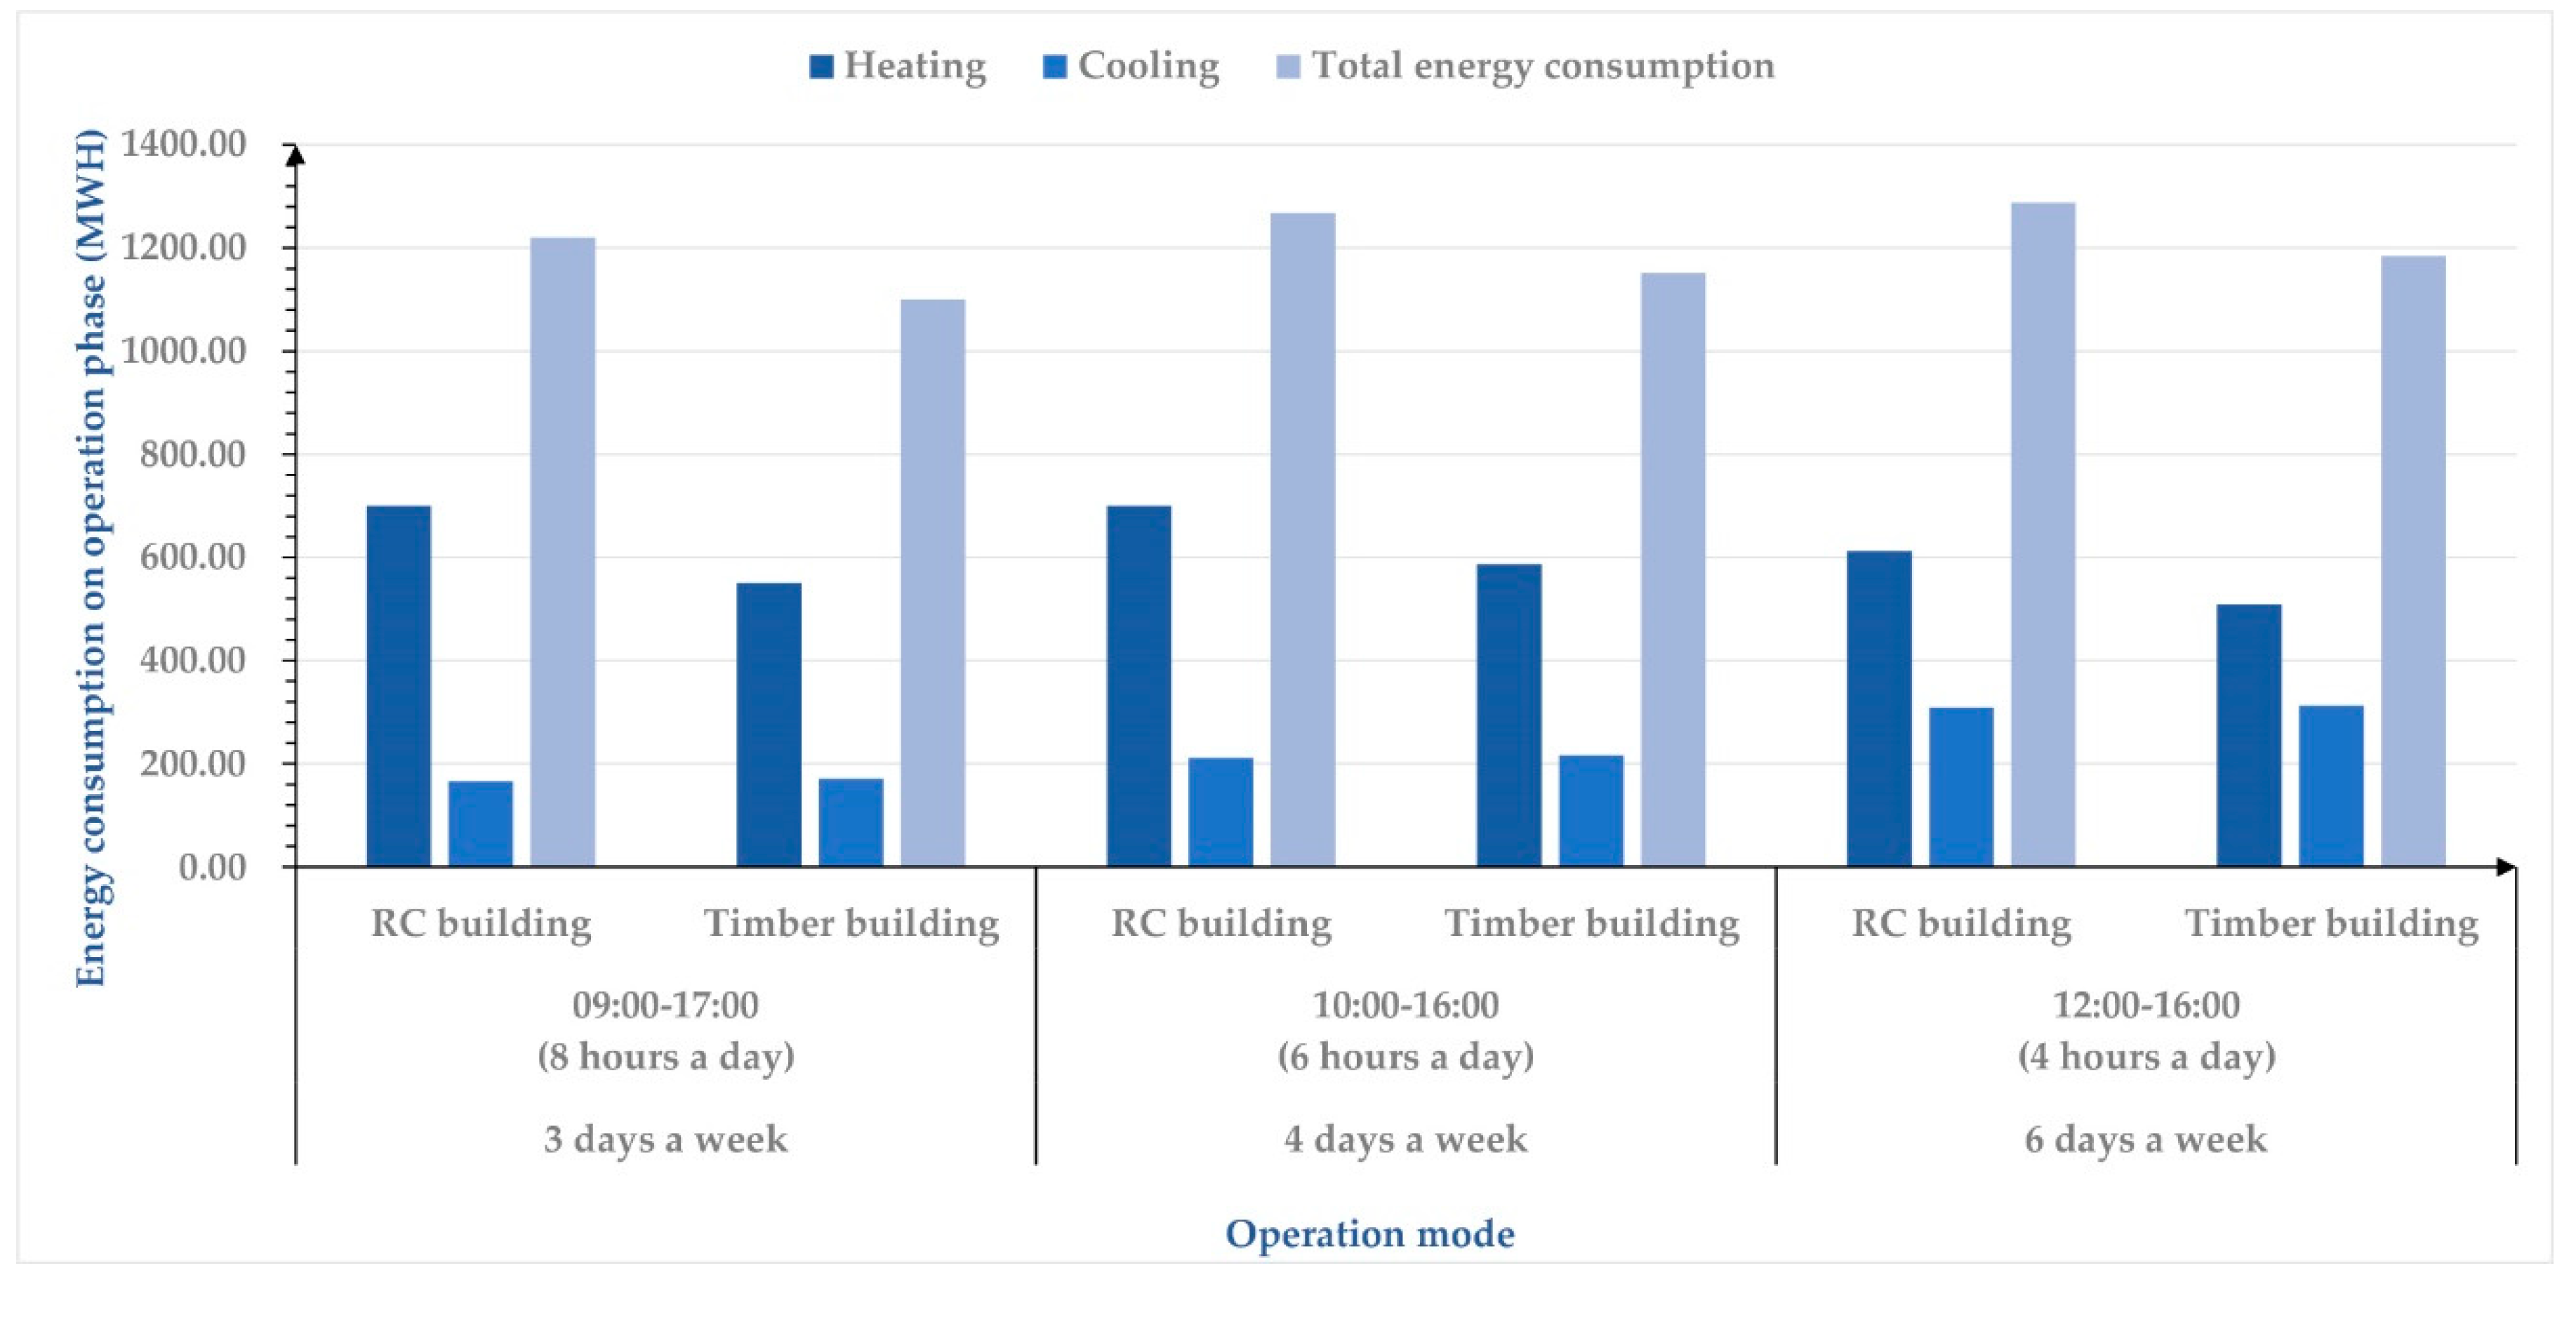
5.2. Stadium Operation Mode

The results indicate that energy consumption and carbon emissions during the operation phase are dominant throughout the building lifespan. The operation mode of public buildings has a significant influence on their energy consumption and carbon emissions. Stadiums operate for eight hours per day, three days a week. Taking the stadiums in Harbin as an example, energy consumption and carbon emissions seem to vary with the operational time (Figure 12). Although the total operation time remains the same, the current operation mode may result in energy savings of 3.90% and 5.55%, respectively, in comparison with the operational mode of four days a week and six days a week for concrete. Thus, the reasonable arrangement of operation time offers an effective way to reduce the energy of a stadium.

5.3. CO2 Uptake of Concrete and Cement

In this study, the CO2 uptake of concrete and cement is taken into consideration. The carbonation of cement and RC is one of the causes of corrosion, but it is also an effective way to sequester CO2. The calculation results indicate that one cubic meter of cement may absorb 497.95 kg of carbon dioxide during the carbonation process, and the equivalent figure for the concrete is 91.93 kg. Meanwhile, one cubic meter of timber may absorb 800 kg CO2 during its growth [40]. When the amount of cement in the concrete increases, both the carbonation depth and the amount of CO2 absorbed decrease, primarily due to the decrease in porosity. Although the total CO2 uptake from concrete and cement is much less than that of timber, due to the limited volume of carbonation, the carbonation process and ability to sequester CO2 of cement and concrete should not be neglected.

6. Conclusions

This paper compares the energy consumption and carbon emissions of reinforced concrete and timber stadiums in five climate regions of China. The main findings for timber as a sustainable material are summarized below.
(1)
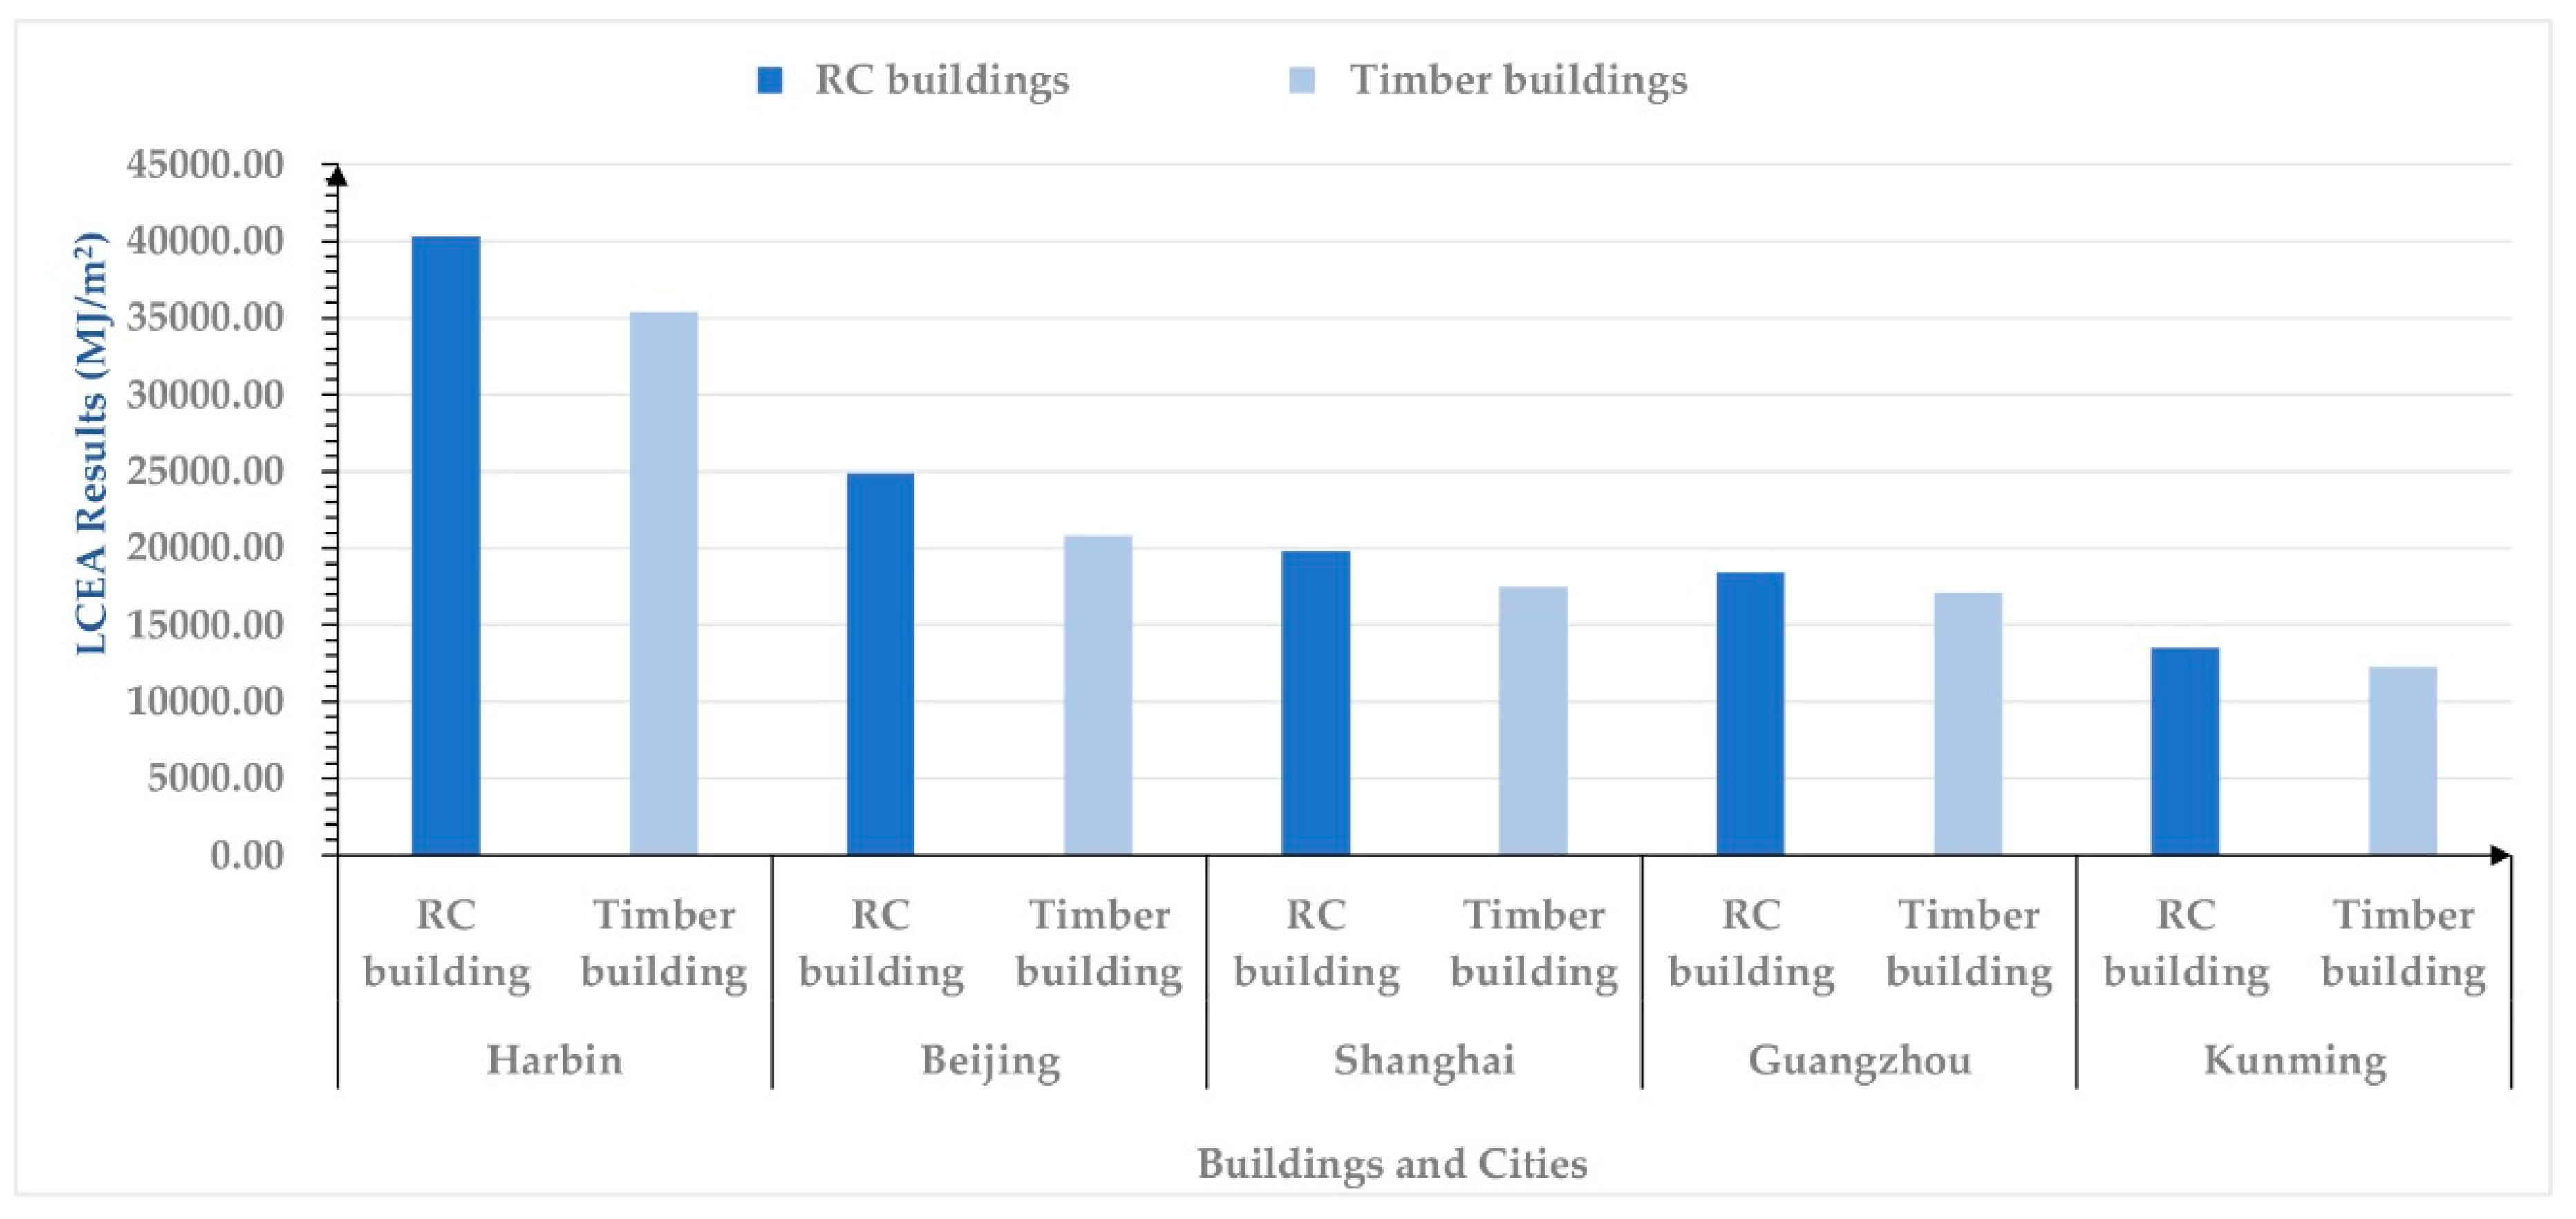
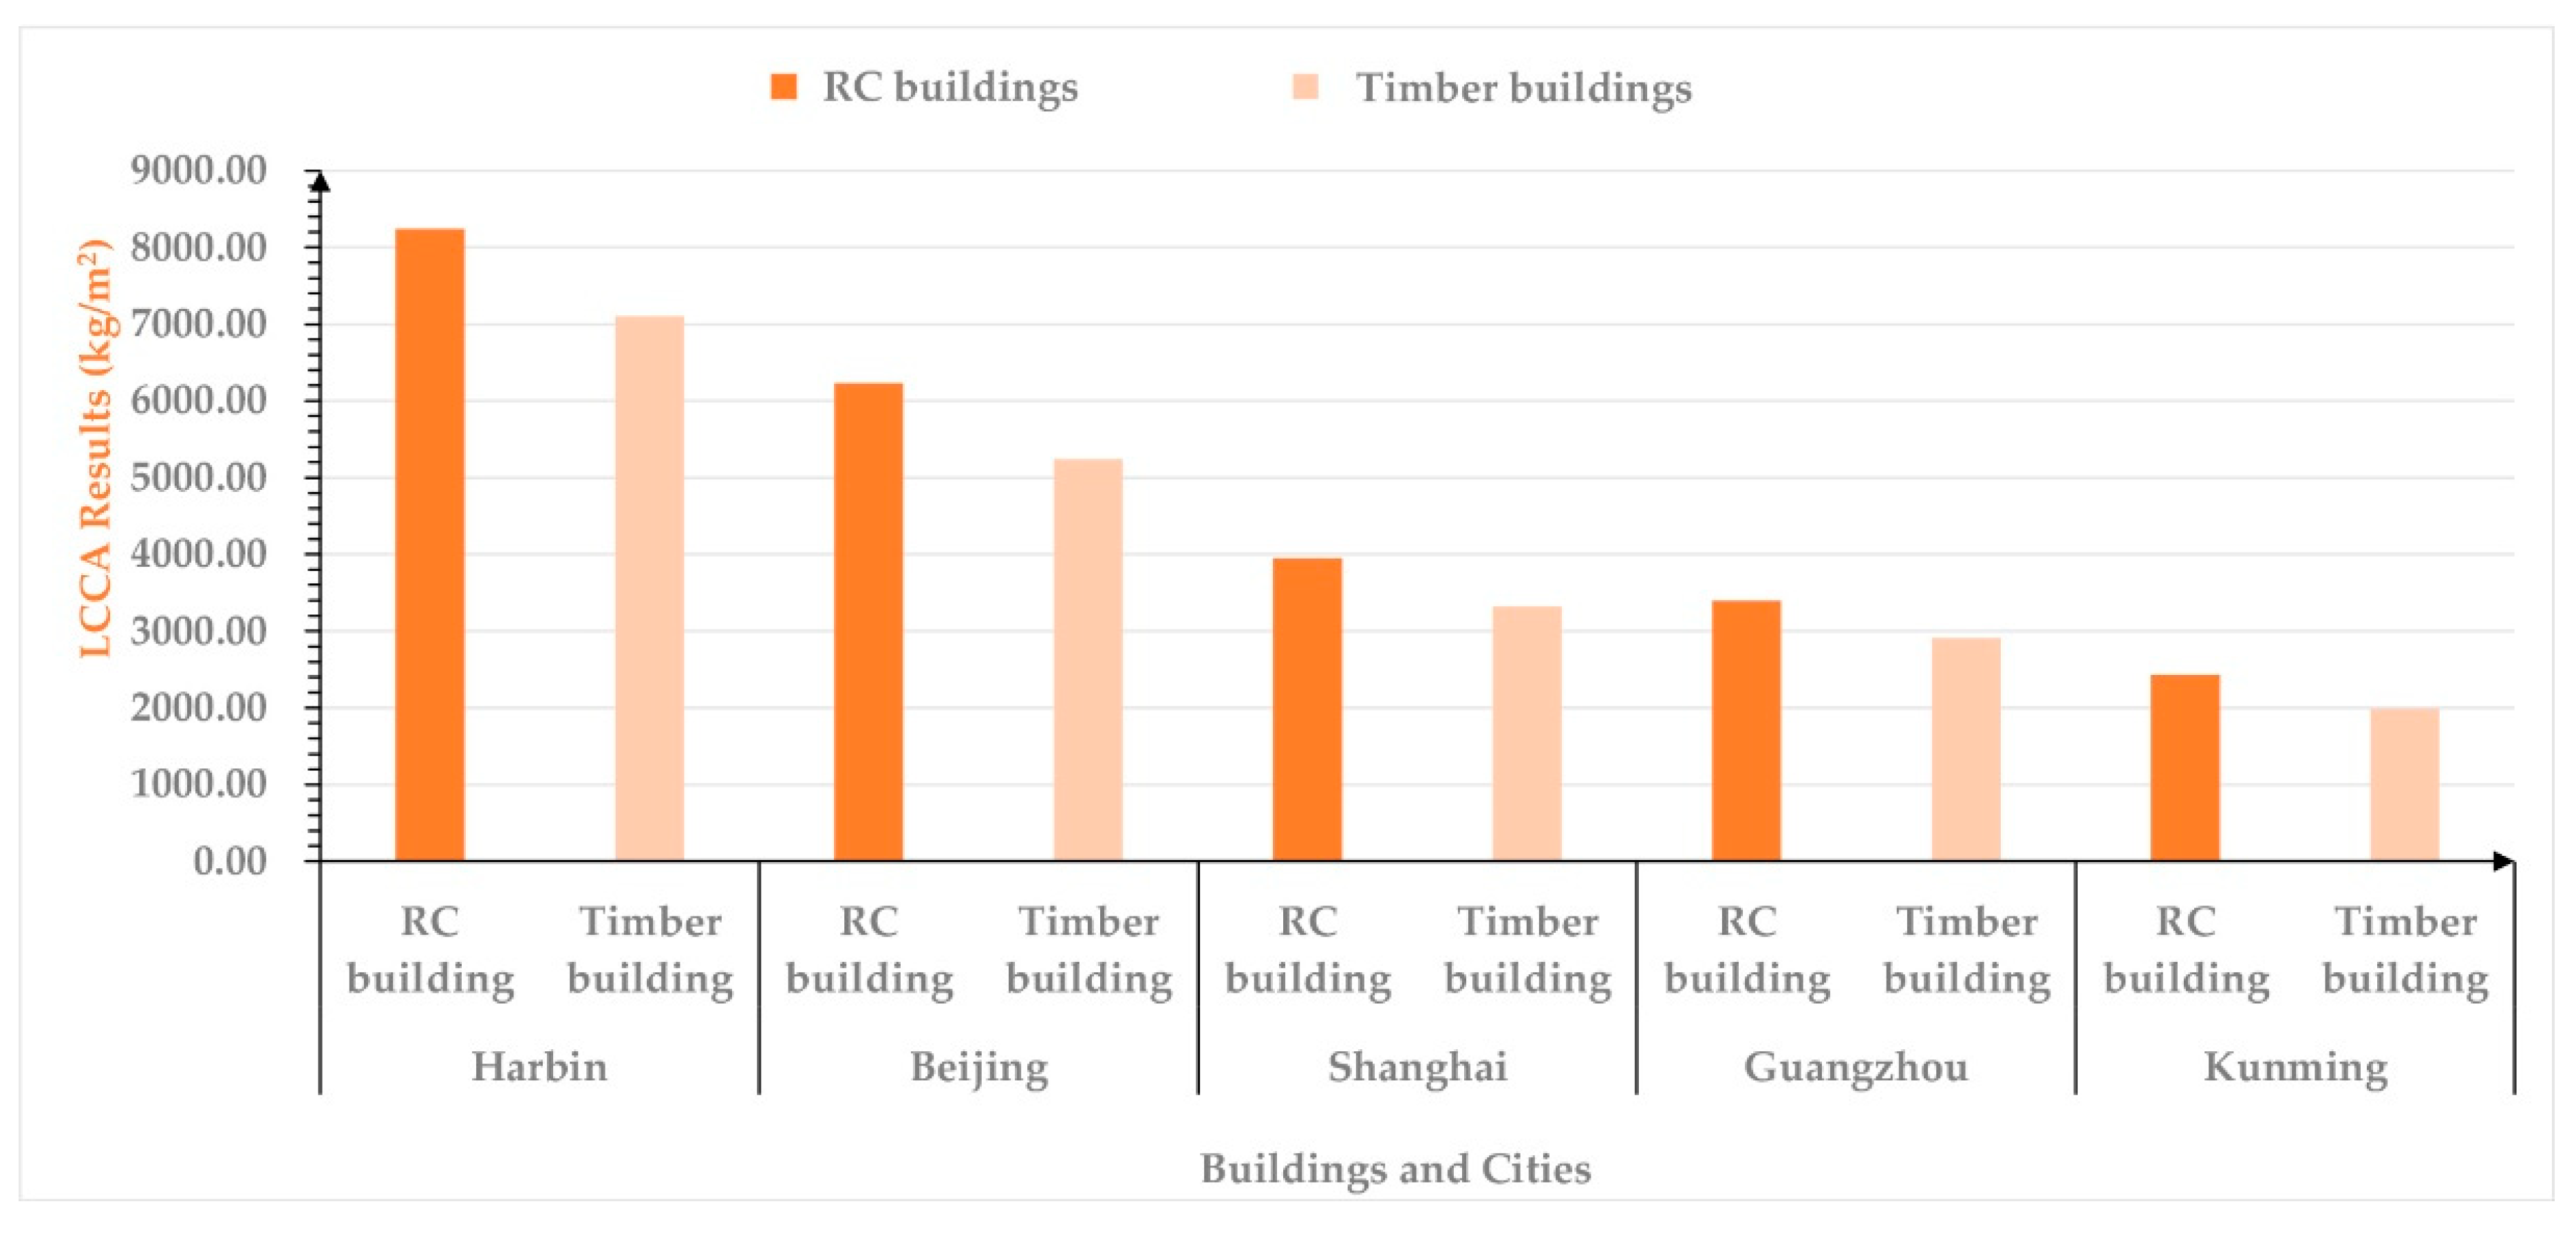
The estimated energy consumption and carbon emissions of CLT buildings are much lower than those of RC buildings in all of the studied cities, which indicates that CLT systems have greater potential than RC systems to reduce carbon emissions and energy consumption.
(2)
The energy consumption and carbon emissions of both concrete and CLT buildings are closely related to the climate zones. Buildings in “severely cold” and “cold” regions of China, in which heating is responsible for the majority of energy consumption, consume the most energy and release the most carbon, followed by “hot summer, cold winter” regions, “hot summer, warm winter” regions, and “temperate” regions. Therefore, timber is best suited to regions with considerable space heating in the winter. Although CLT as a sustainable material can be developed nationwide in China, it is better to develop it in severely cold and cold regions first due to limitations on timber production.
(3)
Different building operation modes have a great impact on energy consumption and carbon emissions. The reasonable arrangement of operation time is an effective way to reduce the energy consumed by stadiums.
(4)
Although the total carbon uptake of concrete and cement is much less than that of timber, the carbonation process and ability to sequester CO2 of cement and concrete should not be neglected.

Author Contributions

Conceptualization, H.G. and X.Y.; methodology, H.G.; software, T.Q. and R.B.; validation, T.Q. and S.Z.; formal analysis, S.Z.; investigation, T.Q. and Y.D.; resources, Y.D.; data curation, T.Q.; writing—original draft preparation, H.G. and Y.D.; writing—review and editing, H.G. and X.Y.; visualization, L.H.; supervision, H.G. and X.Y.; project administration, H.G. and X.Y.; funding acquisition, H.G. All authors have read and agreed to the published version of the manuscript.

Funding

This research is funded by National Natural Science Foundation of China, grant number 51608144; and Heilongjiang Provincial Natural Science Foundation of China, grant number LH2019E110.

Acknowledgments

We appreciated the anonymous reviewers for their thoughtful suggestions and careful work that have helped improve this paper substantially.

Conflicts of Interest

The authors declare no conflict of interest.

References

  1. Owusu, P.A.; Asumadu-Sarkodie, S. A review of renewable energy sources, sustainability issues and climate change mitigation. Cogent. Eng. 2016, 3, 1167990. [Google Scholar] [CrossRef]
  2. Bureau, P.R. 2019 World Population Data Sheet. Available online: https://www.prb.org/worldpopdata/ (accessed on 19 December 2019).
  3. Van der Werf, G.R.; Morton, D.C.; DeFries, R.S.; Olivier, J.G.; Kasibhatla, P.S.; Jackson, R.B.; Collatz, G.J.; Randerson, J.T.J.N.G. CO2 emissions from forest loss. Nat. Geosci. 2009, 2, 737–738. [Google Scholar] [CrossRef]
  4. Hanif, I. Impact of fossil fuels energy consumption, energy policies, and urban sprawl on carbon emissions in East Asia and the Pacific: A panel investigation. Energy Strateg. Rev. 2018, 21, 16–24. [Google Scholar] [CrossRef]
  5. Al-mulali, U.; Tang, C.F.; Ozturk, I. Estimating the Environment Kuznets Curve hypothesis: Evidence from Latin America and the Caribbean countries. Renew. Sustain. Energy Rev. 2015, 50, 918–924. [Google Scholar] [CrossRef]
  6. Kivyiro, P.; Arminen, H. Carbon dioxide emissions, energy consumption, economic growth, and foreign direct investment: Causality analysis for Sub-Saharan Africa. Energy 2014, 74, 595–606. [Google Scholar] [CrossRef]
  7. Hansen, J.E. Sir John Houghton: Global Warming: The Complete Briefing, 2nd edition. J. Atmos. Chem. 1998, 30, 409–412. [Google Scholar] [CrossRef]
  8. Houghton, J. Global Warming: The Complete Briefing; Cambridge University Press: Cambridge, UK, 2004; p. 454. [Google Scholar]
  9. Melillo, J.M.; Richmond, T.T.C.; Yohe, G.W. Climate Change Impacts in the United States; The Third National Climate Assessment; the U.S. Government Printing Office: Washington, DC, USA, 2014.
  10. EIA. International Energy Outlook 2019; the U.S. Energy Information Administration (EIA): Washington, DC, USA, 2019.
  11. Donat, L.; Schindler, H.; Burck, J. Brown to Green: The G20 Transition Towards a Net-Zero Emissions Economy (2019); Climate Transparency: Berlin, Germany, 2019; p. 65. [Google Scholar]
  12. China Association of Building Energy Efficiency. Proceedings of the Research Report on Building Energy Consumption in China (2018); Professional Committee on Energy Consumption Statistics: Shanghai, China, 2018. (In Chinese)
  13. Xi, J. Jinping Xi’s Speech at the Opening Ceremony of the Paris Conference on Climate Change. Available online: http://www.xinhuanet.com//world/2015-12/01/c_1117309642.htm (accessed on 6 December 2015).
  14. Hong, Y.; Xinyue, H.; Qun, R.; Tao, L.; Xinhu, L.; Guoqin, Z.; Shi, L. Effect of urban micro-climatic regulation ability on public building energy usage carbon emission. Energy Build. 2017, 154, 553–559. [Google Scholar]
  15. Jiang, Y.; Yan, D.; Guo, S.; Hu, S.; Wei, Q.; Liu, Y.; Zhang, Y.; An, J.; Zhang, Y.; Guo, S. China Building Energy Use 2018; Building Energy Research Center of Tsinghua University (BERC) of Tsinghua University: Beijing, China, 2018; p. 85. [Google Scholar]
  16. The State Council of China. Outline of Building a Strong Sports Country. Available online: http://sports.people.com.cn/n1/2019/0902/c14820-31332239.html (accessed on 15 November 2019). (In Chinese)
  17. General Administration of Sports of China. The Sixth National Sports Ground Census Data Bulletin. Available online: http://www.sport.gov.cn/n16/n1077/n1467/n3895927/n4119307/7153937.html (accessed on 15 November 2019). (In Chinese)
  18. General Administration of Quality Supervision, Inspection and Quarantine of the People’s Republic of China; Standardization Administration of China. Requirement of the Service and Management for Public Fitness Activity Center; General Administration of Quality Supervision, Inspection and Quarantine of the People’s Republic of China; Standardization Administration of China: Beijing, China, 2017; Volume GB/T 34280-2017.
  19. Trianti-Stourna, E.; Spyropoulou, K.; Theofylaktos, C.; Droutsa, K.; Balaras, C.A.; Santamouris, M.; Asimakopoulos, D.N.; Lazaropoulou, G.; Papanikolaou, N. Energy conservation strategies for sports centers: Part A. Sports halls. Energy Build. 1997, 27, 109–122. [Google Scholar] [CrossRef]
  20. Nishioka, T.; Ohtaka, K.; Hashimoto, N.; Onojima, H. Measurement and evaluation of the indoor thermal environment in a large domed stadium. Energy Build. 2000, 32, 217–223. [Google Scholar] [CrossRef]
  21. Li, J.; Liang, S. Study on adaptability of large-space “saddle-shaped” shell overall roof greening. Energy Build. 2017, 138, 748–761. [Google Scholar] [CrossRef]
  22. Ramage, M.H.; Burridge, H.; Busse-Wicher, M.; Fereday, G.; Reynolds, T.; Shah, D.U.; Wu, G.; Yu, L.; Fleming, P.; Densley-Tingley, D.; et al. The wood from the trees: The use of timber in construction. Renew. Sustain. Energy Rev. 2017, 68, 333–359. [Google Scholar] [CrossRef]
  23. Thomas, D.; Ding, G. Comparing the performance of brick and timber in residential buildings—The case of Australia. Energy Build. 2018, 159, 136–147. [Google Scholar] [CrossRef]
  24. Bowyer, J.; Bratkovich, S.; Fernholz, K. Utilization of Harvested Wood by the North American Forest Products Industry; Dovetail Partners Outlook. 2012. Available online: https://www.researchgate.net/publication/312137029 (accessed on 15 November 2019).
  25. Harris, R. 8-Cross laminated timber. In Wood Composites; Ansell, M.P., Ed.; Woodhead Publishing: Cambridge, UK, 2015; Available online: https://sciencedirect.xilesou.top/science/article/pii/B9781782424543000081 (accessed on 15 November 2019). [CrossRef]
  26. Caniato, M.; Bettarello, F.; Gasparella, A. Energy and Acoustic Performances of Timber in Buildings. In Reference Module in Materials Science and Materials Engineering; Elsevier: Oxford, UK, 2018. [Google Scholar] [CrossRef]
  27. Brandner, R.; Flatscher, G.; Ringhofer, A.; Schickhofer, G.; Thiel, A. Cross laminated timber (CLT): Overview and development. Eur. J. Wood Wood Prod. 2016, 74, 331–351. [Google Scholar] [CrossRef]
  28. Breneman, S. Cross-Laminated Timber Structural Floor and Roof Design. Structure Magazine, 14 June 2016. [Google Scholar]
  29. Chen, Y.J. Comparison of Environmental Performance of a Five-Storey Building Built with Cross-Laminated Timber and Concrete; Department of Wood Science, University of British Columbia: Vancouver, BC, Canada, 2012; p. 31. [Google Scholar]
  30. Hafner, A.; Schäfer, S. Comparative LCA study of different timber and mineral buildings and calculation method for substitution factors on building level. J. Clean. Prod. 2017, 167, 630–642. [Google Scholar] [CrossRef]
  31. Tettey, U.Y.A.; Dodoo, A.; Gustavsson, L. Effect of different frame materials on the primary energy use of a multi storey residential building in a life cycle perspective. Energy Build. 2019, 185, 259–271. [Google Scholar] [CrossRef]
  32. Khavari, A.M.; Pei, S.; Tabares-Velasco, P.C. Energy Consumption Analysis of Multistory Cross-Laminated Timber Residential Buildings: A Comparative Study. J. Archit. Eng. 2016, 22, 04016002. [Google Scholar] [CrossRef]
  33. Chiniforush, A.A.; Akbarnezhad, A.; Valipour, H.; Xiao, J. Energy implications of using steel-timber composite (STC) elements in buildings. Energy Build. 2018, 176, 203–215. [Google Scholar] [CrossRef]
  34. Pierobon, F.; Huang, M.; Simonen, K.; Ganguly, I. Environmental benefits of using hybrid CLT structure in midrise non-residential construction: An LCA based comparative case study in the U.S. Pacific Northwest. J. Build. Eng. 2019, 26, 100862. [Google Scholar] [CrossRef]
  35. Pajchrowski, G.; Noskowiak, A.; Lewandowska, A.; Strykowski, W. Wood as a building material in the light of environmental assessment of full life cycle of four buildings. Constr. Build. Mater. 2014, 52, 428–436. [Google Scholar] [CrossRef]
  36. Dong, Y.; Cui, X.; Yin, X.; Chen, Y.; Guo, H. Assessment of Energy Saving Potential by Replacing Conventional Materials by Cross Laminated Timber (CLT)—A Case Study of Office Buildings in China. Appl. Sci. 2019, 9, 858. [Google Scholar] [CrossRef] [Green Version]
  37. Balasbaneh, A.T.; Marsono, A.K.B. Strategies for reducing greenhouse gas emissions from residential sector by proposing new building structures in hot and humid climatic conditions. Build. Environ. 2017, 124, 357–368. [Google Scholar] [CrossRef]
  38. Ministry of Housing and Urban-Rural Development of the People’s Republic of China (MOHURD). Code for Design of Civil Buildings; China Architecture & Building Press: Beijing, China, 2005; Volume GB50352.
  39. Ministry of Housing and Urban-Rural Development of the People’s Republic of China (MOHURD). Design Standard for Energy Efficiency of Public Buildings; China Architecture & Building Press: Beijing, China, 2015; Volume GB50189-2015. [Google Scholar]
  40. Donlan, J.; Skog, K.; Byrne, K.A. Carbon storage in harvested wood products for Ireland 1961–2009. Biomass Bioenergy 2012, 46, 731–738. [Google Scholar] [CrossRef]
  41. Blengini, G.A.; Carlo, T.D. The changing role of life cycle phases, subsystems and materials in the LCA of low energy buildings. Energy Build. 2010, 42, 869–880. [Google Scholar] [CrossRef]
  42. Evangelista, P.P.A.; Kiperstok, A.; Torres, E.A.; Gonçalves, J.P. Environmental performance analysis of residential buildings in Brazil using life cycle assessment (LCA). Constr. Build. Mater. 2018, 169, 748–761. [Google Scholar] [CrossRef]
  43. Ramesh, T.; Prakash, R.; Shukla, K.K. Life cycle energy analysis of buildings: An overview. Energy Build. 2010, 42, 1592–1600. [Google Scholar] [CrossRef]
  44. Guo, H.; Liu, Y.; Meng, Y.; Huang, H.; Sun, C.; Shao, Y. A Comparison of the Energy Saving and Carbon Reduction Performance between Reinforced Concrete and Cross-Laminated Timber Structures in Residential Buildings in the Severe Cold Region of China. Sustainability 2017, 9, 1426. [Google Scholar] [CrossRef] [Green Version]
  45. Zhou, Z.; Song, X. The life cycle assessment of two kinds of concretes. Environ. Eng. 2009, 27, 472–475. (In Chinese) [Google Scholar]
  46. Jiang, R.; Wang, H.T.; Zhang, H.; Chen, X. Life cycle assessment of cement technologies in China and recommendations. Acta Sci. Circumstantiae 2010, 30, 2361–2368. [Google Scholar]
  47. Wang, L.S.; Zhang, L.F. Life Cycle assessment of environmental impacts for the whole steel production process. China Popul. Resour. Environ. 2012, 22, 239–244. [Google Scholar]
  48. Li, Z. Life Cycle Assessment of Rock Wool Board and EPS Board in Materials Science Forum; Trans Tech Publ.: Qingdao, China, 2014. [Google Scholar]
  49. Quintana, A.; Alba, J.; del Rey, R.; Guillén-Guillamón, I. Comparative Life Cycle Assessment of gypsum plasterboard and a new kind of bio-based epoxy composite containing different natural fibers. J. Clean. Prod. 2018, 185, 408–420. [Google Scholar] [CrossRef]
  50. Ministry of Housing and Urban-Rural Development of the People’s Republic of China (MOHURD); General Administration of Sports of China. Design Code for Sports Building; China Architecture & Building Press: Beijing, China, 2003; Volume JGJ 31-2003.
  51. Zhang, X. Carbon Emissions Measurement Methods and Comparative Studies on Green Building Structural System; Harbin Institute of Technology: Harbin, China, 2014. [Google Scholar]
  52. Dhakal, S. Urban energy use and carbon emissions from cities in China and policy implications. Energy Policy 2009, 37, 4208–4219. [Google Scholar] [CrossRef]
  53. Song, R.; Zhu, J.; Hou, P.; Tao, H. Getting Every Ton of Emissions Right: An Analysis of Emission Factors for Purchased Electricity in China; World Resources Institute: Washington, DC, USA, 2013; p. 16. [Google Scholar]
  54. Council, C.E. A list of statistics on the national power industry from January 2009 to September 2009. Available online: http://www.nea.gov.cn/2019-12/26/c_138659627.htm (accessed on 10 February 2020). (In Chinese)
  55. Noussan, M.; Roberto, R.; Nastasi, B. Performance Indicators of Electricity Generation at Country Level—The Case of Italy. Energies 2018, 11, 650. [Google Scholar] [CrossRef] [Green Version]
  56. Currie, R.J. Carbonation Depths in Structural-quality Concrete: An Assessment of Evidence from Investigations of Structures and from Other Sources; Building Research Establishment (BRE): Garston, Hertfordshire, UK, 1986; Available online: https://trid.trb.org/view/277736 (accessed on 20 December 2019).
  57. Pade, C.; Guimaraes, M. The CO2 uptake of concrete in a 100 year perspective. Cem. Concr. Res. 2007, 37, 1348–1356. [Google Scholar] [CrossRef]
  58. Lagerblad, B. Carbon Dioxide Uptake During Concrete Life Cycle: State of the Art; Swedish Cement and Concrete Research Institute Stockholm: Stockholm, Sweden, 2005. [Google Scholar]
  59. Huang, S. Modern Concrete Technology; Shaanxi Science and Technology Press: Xi’an, China, 1998. (In Chinese) [Google Scholar]
  60. Ma, H.; Du, N.; Yu, S.; Lu, W.; Zhang, Z.; Deng, N.; Li, C. Analysis of typical public building energy consumption in northern China. Energy Build. 2017, 136, 139–150. [Google Scholar] [CrossRef]
  61. Jiang, M.P.; Tovey, K. Overcoming barriers to implementation of carbon reduction strategies in large commercial buildings in China. Build. Environ. 2010, 45, 856–864. [Google Scholar] [CrossRef]
  62. Jing, R.; Wang, M.; Zhang, R.; Li, N.; Zhao, Y. A study on energy performance of 30 commercial office buildings in Hong Kong. Energy Build 2017, 144, 117–128. [Google Scholar]
  63. Garg, A.; Maheshwari, J.; Shukla, P.R.; Rawal, R. Energy appliance transformation in commercial buildings in India under alternate policy scenarios. Energy 2017, 140, 952–965. [Google Scholar] [CrossRef]
Figure 1. (a) Data on national building energy consumption in China. (b) Data on national building carbon emissions in China. Data source: Research Report on Building Energy Consumption in China (2018) [12].
Sustainability 12 01566 g001
Figure 2. Carbon emissions factors and carbon emissions intensity of building sector in China. Data source: Research Report on Building Energy Consumption in China (2018) [12].
Sustainability 12 01566 g002
Figure 3. (a) Cross laminated timber (CLT) panel construction [28]. (b). Glued laminated timber (GLT) panel construction. (c) Plywood panel. (d) Oriented strand board (OSB) panel.
Sustainability 12 01566 g003
Figure 4. Locations of the five case study cities.
Sustainability 12 01566 g004
Figure 5. (a) First floor plan of the building. (b) 1-1 Section of the building. (c) 2-2 Section of the building.
Sustainability 12 01566 g005
Figure 6. Flowchart of the life cycle energy assessment (LCEA).
Sustainability 12 01566 g006
Figure 7. Flowchart of the life cycle carbon assessment (LCCA).
Sustainability 12 01566 g007
Figure 8. Established model in the Integrated Environmental Solutions software platform.
Sustainability 12 01566 g008
Figure 9. Sub-regions of national power grid and the CO2 emissions factors (ηj).
Sustainability 12 01566 g009
Figure 10. Estimated life cycle energy assessment (LCEA) results for the reference buildings (50 years).
Sustainability 12 01566 g010
Figure 11. Estimated life cycle carbon assessment (LCCA) results for the reference buildings (50 years).
Sustainability 12 01566 g011
Figure 12. Energy consumption by operation mode in Harbin.
Sustainability 12 01566 g012
Table 1. Five case study cities by climate regions in China.
Climate RegionTemperatureSub-RegionRepresentative CityU-Value (Local Regulations)R-Value (Local Regulations)
HottestColdest
Severely Cold≤25 °C≤–10 °CI (B)HarbinRoof: ≤0.28Ground Floor: ≥1.1
Wall: ≤0.38
Window: ≤1.3
Cold18 °C~28 °C–10 °C~0 °CII (B)BeijingRoof: ≤0.45Ground Floor: ≥0.6
Wall: ≤0.5
Window: ≤1.5
Hot Summer, Cold Winter25 °C~30 °C0 °C~10 °CIII (B)ShanghaiRoof: ≤0.5
Wall: ≤0.8
Window: ≤1.8
Hot Summer, Warm Winter25 °C~29 °C−10 °CIV (B)GuangzhouRoof: ≤0.8
Wall: ≤1.5
Window: ≤2
Temperate18 °C~25 °C0 °C~13 °CV (B)KunmingRoof: ≤0.8
Wall: ≤1.5
Window: ≤2
Data Source: Code for Design of Civil Buildings (GB 50352-2005), Design Standard for Energy Efficiency of Public Buildings (GB 50189-2015).
Table 2. Stadium information.
ItemsFiguresItemsFigures
Total Floor Area (m2)5800.00Plane Size of Performance Stage (m)18.00 × 12.00
External Wall Area (m2)2401.02Plane Size of Game Hall (m)24.00 × 42.00
External Opening Area (m2)1347.78Area Index (m2/per seat)1.93
Total Volume (m³)51420.86Sports Hall Area (m2)2844.13
Total Height (m)17.60Office Area (m2)947.26
Number of Layers3.00Lounge Area (m2)1181.95
Number of Seats3000.00Bathroom Area (m2)426.46
Plane Size (m)50.20 × 58.20Plant Room Area (m2)400.20
Data Source: Original construction drawings.
Table 3. External wall and roof designs of the reinforced concrete (RC) stadiums in the five cities.
CitiesExternal Wall and External WindowRoofGround Floor
Harbin Sustainability 12 01566 i001 Sustainability 12 01566 i002 Sustainability 12 01566 i003
Beijing Sustainability 12 01566 i004 Sustainability 12 01566 i005 Sustainability 12 01566 i006
Shanghai Sustainability 12 01566 i007 Sustainability 12 01566 i008 Sustainability 12 01566 i009
Guangzhou Sustainability 12 01566 i010 Sustainability 12 01566 i011 Sustainability 12 01566 i012
Kunming Sustainability 12 01566 i013 Sustainability 12 01566 i014 Sustainability 12 01566 i015
Table 4. External wall and roof designs of the timber stadiums in the five cities.
CitiesExternal Wall and External WindowRoofGround Floor
Harbin Sustainability 12 01566 i016 Sustainability 12 01566 i017 Sustainability 12 01566 i018
Beijing Sustainability 12 01566 i019 Sustainability 12 01566 i020 Sustainability 12 01566 i021
Shanghai Sustainability 12 01566 i022 Sustainability 12 01566 i023 Sustainability 12 01566 i024
Guangzhou Sustainability 12 01566 i025 Sustainability 12 01566 i026 Sustainability 12 01566 i027
Kunming Sustainability 12 01566 i028 Sustainability 12 01566 i029 Sustainability 12 01566 i030
Table 5. Mass and volume of RC and timber buildings.
MaterialsRC BuildingsTimber Buildings
Material Volume (m3)Material Mass (Tons)Material Volume (m3)Material Mass (Tons)
Concrete3715.084380.53861.081463.84
Sand584.964787.84420.09672.14
Cement194.99253.48140.03182.04
Steel44.85349.8517.33135.20
EPS (Harbin)752.6418.82752.6418.82
EPS (Beijing)435.8910.90435.8910.90
EPS (Shanghai)328.1968.205328.1968.205
EPS (Guangzhou)96.082.4096.082.40
EPS (Kunming)96.082.4096.082.40
Plasterboard109.9276.94126.5088.55
Timber3186.431593.21
Table 6. List of materials used for construction.
MaterialEnergy Consumption for Material ProductionCarbon Emissions during Material Manufacture ProcessReferences
UnitValueUnitValue
ConcreteGJ/t0.764 Kg-CO2/m3352.200[45]
SandGJ/t0.029 [44]
CementGJ/t3.186 Kg-CO2/t860.000[44,46]
SteelGJ/t19.520 [47]
EPS Insulation BoardGJ/t94.000 [44,48]
PlasterboardGJ/m32.400 Kg-CO2/t213.862[49]
TimberGJ/m30.545 [44]
Transportation (Train)MJ/t·km0.220
Transportation (Lorry)MJ/t·km2.300
Table 7. Basic simulation parameters of thermal conditions.
RoomOccupiedHeating TimeHeating MonthHeating Set PointCooling TimeCooling MonthCooling Set Point
Sports hallTuesday, Thursday, Saturday every week
09:00–17:00
24 h15 October to 15 April (Harbin)
15 November to 15 March (Beijing, Shanghai)
No heating (Guangzhou)
15 December to 15 February (Kunming)
18 °C; (When occupied)
10 °C
When Occupied and Room Temp > 26 °C1 June to 31 August (Harbin)
16 March to 14 November (Beijing, Shanghai, Guangzhou)
16 February to 14 December (Kunming)
26 26 °C
Office20 °C26 °C
Lounge20 °C26 °C
Bathroom20 °C26 °C
Plant Room10 °C
Table 8. Basic simulation parameters of ventilation.
RoomInfiltrate Ventilation Set Point and TimeNatural Ventilation Set PointNatural Ventilation Set TimeAuxiliary
Sports Hall0.25 ach
24 h
5.56 I/s/person
(When Occupied)
Office1 achWhen occupied and Room Temp is between 18 °C and 26 °C
Lounge3 ach
Bathroom3 ach (When Occupied)
Plant Room
Table 9. Cj and ηj for coal and electricity.
Fossil Energy ItemsCjηjStudied Cities
Raw Coal20,934 kJ/kg26.80 (t-C/TJ)
Electricity3600 kJ/kWh1.14 (t-CO2 /MWh, Northeast China)Harbin
1.13 (t-CO2 /MWh, North China)Beijing
0.78 (t-CO2 /MWh, East China)Shanghai
0.67 (t-CO2 /MWh, Southern China)Guangzhou, Kunming
Table 10. K (carbonation rate constant) values.
Exposure ConditionCompressive Strength
15 Mpa (mm/(year) 0.5)23–35 Mpa (mm/(year) 0.5)
Exposed5.001.50
Indoors15.006.00
Table 11. Surface area (A) for cement and concrete.
Exposure
Condition
ConcreteCement
RC BuildingTimber BuildingRC BuildingTimber Building
AslabsIndoors15,945.45
AroofIndoors3612.00 903.00 903.00
Awalls (External Surface)Exposed2401.02 600.26 600.26
Awalls (Internal Surface)Indoors9189.59 2297.40 2297.40
Acolumns and beamsIndoors4780.02 1195.01 1195.01
Aground floorIndoors2817.50 2817.50
Table 12. Estimated LCEA results for the reference buildings (50 years).
CitiesBuildingsEnergy Consumed (MJ/m2)
ConstructionOperationEnd of LifeTotal
HarbinRC Building2388.8038,997.6490.0041,476.44
Timber Building1262.4735,611.9718.0036,892.44
BeijingRC Building2260.4630,923.5590.0033,274.01
Timber Building1134.1428,081.4218.0029,233.56
ShanghaiRC Building2216.8325,106.6090.0027,413.43
Timber Building1090.5024,071.9718.0025,180.47
GuangzhouRC Building2122.7822,388.9390.0024,601.71
Timber Building996.4522,453.5418.0023,467.99
KunmingRC Building2122.7817,171.9690.0019,384.74
Timber Building996.4517,474.4718.0018,488.92
Table 13. Energy consumed during operation phase for the reference buildings (50 years).
CitiesBuildingsEnergy Consumed During Operation Phase (MJ/m2)
HeatingCoolingLightingApplianceWater
Heating
Total
HarbinRC Building20,627.875163.773258.057585.712362.2438,997.64
Timber Building17,089.685316.283258.057585.712362.2435,611.97
BeijingRC Building10,584.657132.903258.057585.712362.2430,923.55
Timber Building7511.787363.643258.057585.712362.2428,081.42
ShanghaiRC Building4452.497448.113258.057585.712362.2425,106.60
Timber Building3332.197533.783258.057585.712362.2424,071.97
GuangzhouRC Building0.009182.923258.057585.712362.2422,388.93
Timber Building0.009247.533258.057585.712362.2422,453.54
KunmingRC Building410.063555.903258.057585.712362.2417,171.96
Timber Building253.064015.403258.057585.712362.2417,474.47
Table 14. Carbon emissions and uptake of the reference buildings (50 years).
CitiesBuildingsCarbon Emissions (kg/m2)Carbon Storage and Uptake (kg/m2)
ConstructionOperationEnd of LifeTimberConcreteCement
HarbinRC1380.381380.3828.5024.348.37
Timber7844.137844.135.70263.701.868.37
BeijingRC482.33482.3328.2524.348.37
Timber7824.817824.815.65263.701.868.37
ShanghaiRC1333.461333.4619.5024.348.37
Timber7424.277424.273.90263.701.868.37
GuangzhouRC438.54438.5416.7524.348.37
Timber7194.747194.743.35263.701.868.37
KunmingRC1104.241104.2416.7524.348.37
Timber4912.594912.593.35263.701.868.37
Table 15. Carbon emissions during operation phase for the reference buildings (50 years).
CitiesBuildingsCarbon Emissions During Operation Phase (kg/m2)
HeatingCoolingLightingApplianceWater HeatingTotal
HarbinRC Building2027.031635.191031.722402.14748.047844.13
Timber Building1679.351683.491031.722402.14748.047544.74
BeijingRC Building1040.122238.941022.672381.07741.487424.27
Timber Building738.162311.361022.672381.07741.487194.74
ShanghaiRC Building437.531613.76705.911643.57511.824912.59
Timber Building327.441632.32705.911643.57511.824821.06
GuangzhouRC Building0.001709.04606.361411.79439.644166.83
Timber Building0.001721.07606.361411.79439.644178.85
KunmingRC Building40.30661.79606.361411.79439.643159.87
Timber Building24.87747.31606.351411.79439.643229.95
Table 16. Energy saving and carbon reduction potential of timber and RC buildings.
CitiesEnergy Saving Potential Carbon Reduction Potential
LCEAOperation PhaseLCCAOperation Phase
Harbin11.05%8.68%15.85%3.82%
Beijing12.14%9.19%15.86%3.09%
Shanghai8.15%4.12%18.88%1.86%
Guangzhou4.61%–0.29%19.22%–0.29%
Kunming4.62%–1.76%22.47%–2.22%

