Retrofitting an Existing Office Building in the UAE Towards Achieving Low-Energy Building


College of Engineering, United Arab Emirates University, 15551 Al Ain, UAE
*
Author to whom correspondence should be addressed.
Sustainability 2020, 12(6), 2573; https://0-doi-org.brum.beds.ac.uk/10.3390/su12062573
Submission received: 24 February 2020
/
Revised: 17 March 2020
/
Accepted: 20 March 2020
/
Published: 24 March 2020
(This article belongs to the Special Issue Sustainable Building Retrofit and Energy Optimization)
Abstract
:Retrofitting an existing building can oftentimes be more cost-effective than building a new facility. Since buildings consume a significant amount of energy, particularly for heating and cooling, and because existing buildings comprise the largest segment of the built environment, it is important to initiate energy conservation retrofits to reduce energy consumption and the cost of heating, cooling, and lighting buildings. However, conserving energy is not the only reason for retrofitting existing buildings. The goal should be to create a high-performance building by applying an integrated, whole-building design process to the project during the planning phase that ensures that all key design objectives are met. This paper presents a real case study of the retrofitting of an existing building to achieve lower energy consumption. Indeed, most of the constructed buildings in the UAE are unsuitable for the region, which is characterized by a very harsh climate that causes massive cooling loads and energy consumption due to an appropriate selection of design parameters at the design level. In this study, a monthly computer simulation of energy consumption of an office building in Sharjah was carried out under UAE weather conditions. Several parameters, including the building orientation, heating, ventilation, and air conditioning (HVAC) system, external shading, window-to-wall ratio, and the U-values of the walls and the roof, were investigated and optimized to achieve lower energy consumption. The simulation shows that the best case is 41.7% more efficient than the real (original) case and 30.6% more than the base case. The most sensitive parameter in the retrofitting alternatives is the roof component, which affects the energy savings by 8.49%, followed by the AC system with 8.34% energy savings if well selected using the base case. Among the selected five components, a new roof structure contributed the most to the decrease in the overall energy consumption (approximately 38%). This is followed by a new HVAC system, which leads to a 37% decrease, followed by a new wall type with insulation, resulting in a 20% decrease.
1. Introduction
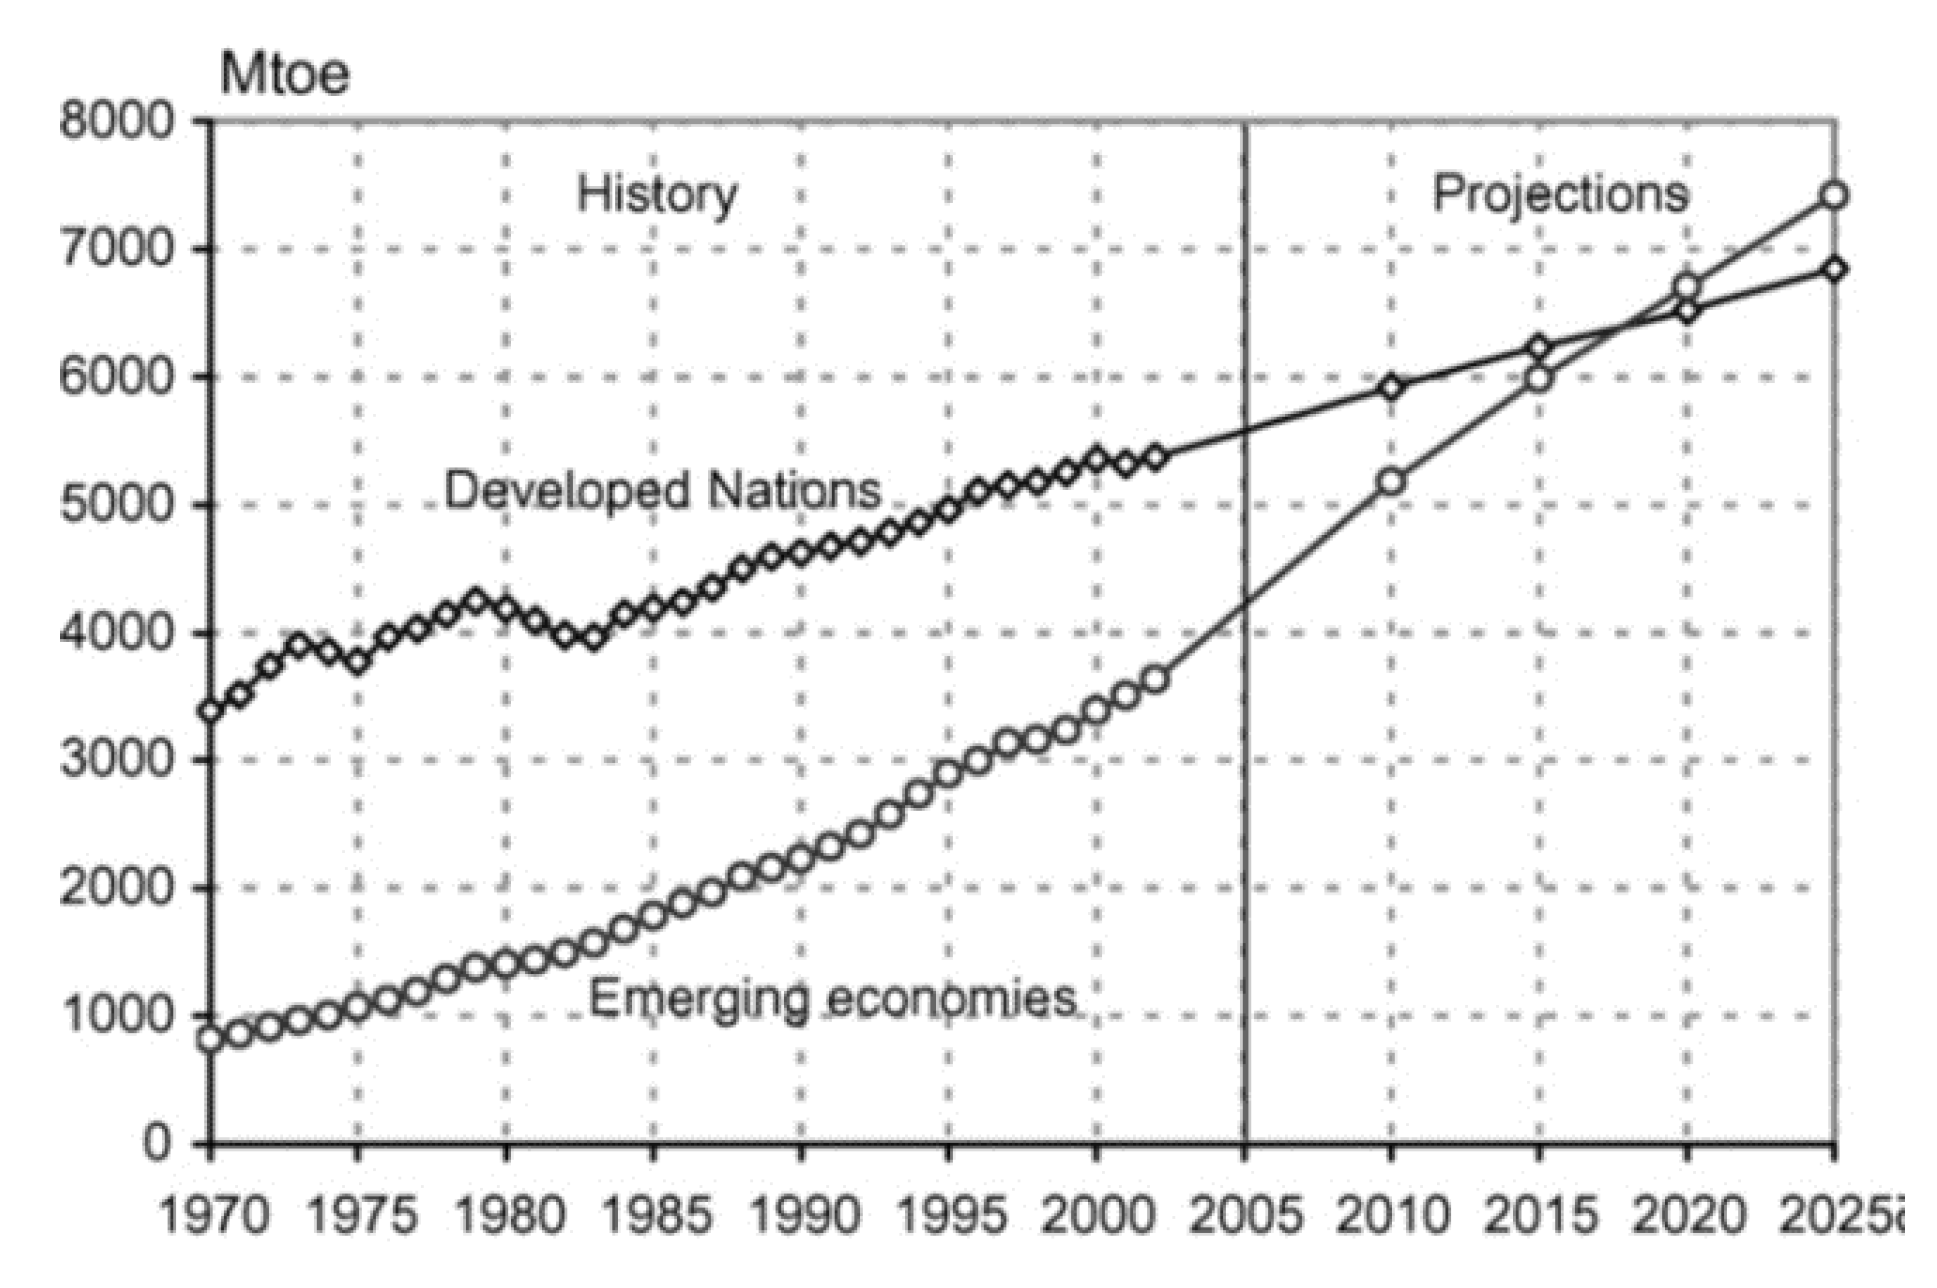
In the last decade, the consumption of primary energy has rapidly grown by almost 50% according to the US Energy Information Administration. The increase in population has led to the enhancement of building services and increases in the comfort levels; thus, people spend more time inside buildings. Moreover, economic development is a major reason for the high energy consumption. Figure 1 shows the global energy usage by territory [1].
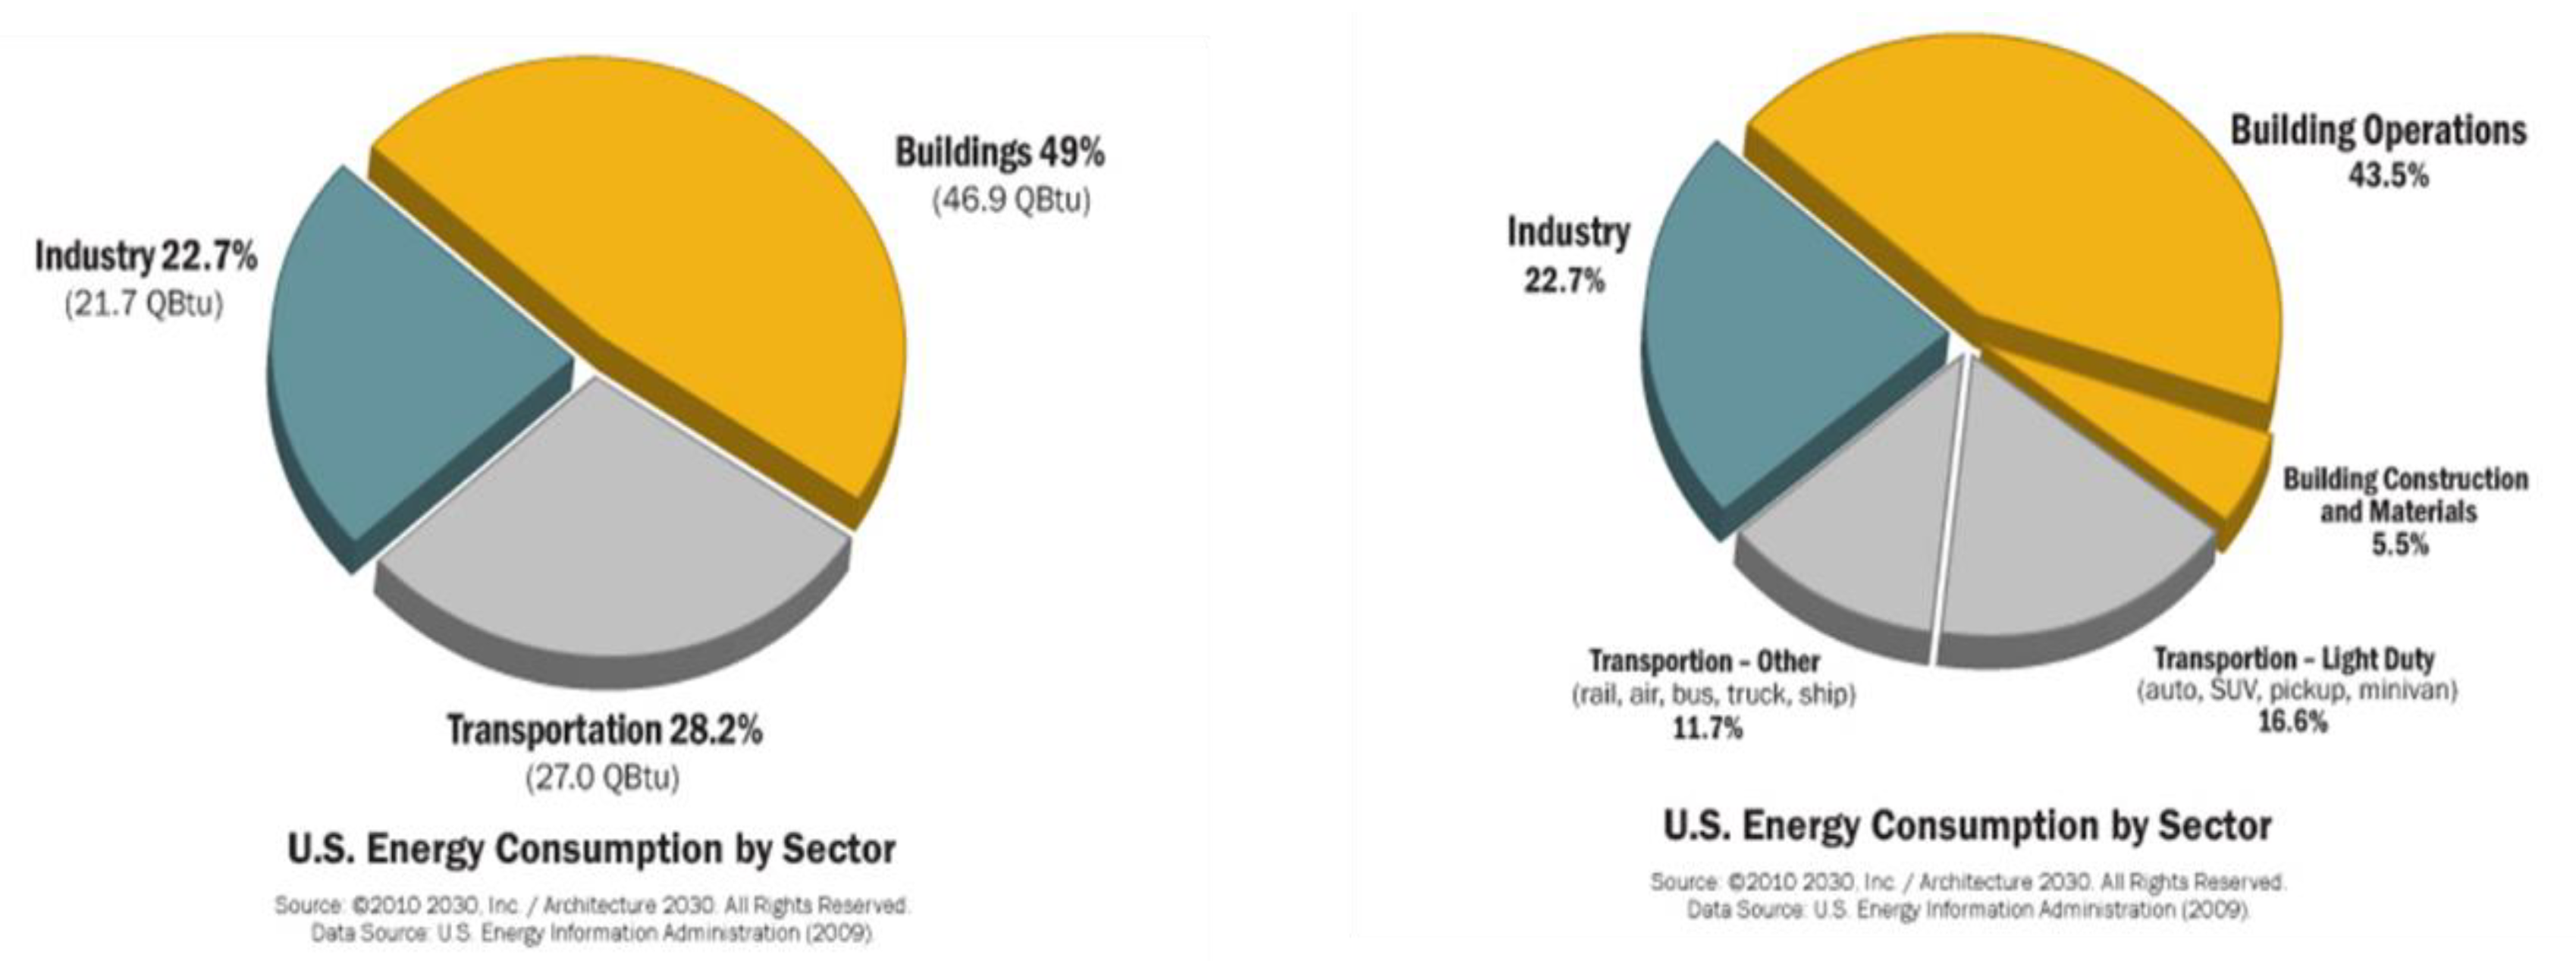
This sudden increase in the energy consumption trends has attracted attention to many aspects, such as the depletion of energy resources and multiple environmental issues (CO2 emissions, global warming, climate change, etc.) [2]. Among the various sectors, buildings are the largest consumers of energy, as shown in Figure 2, consuming up to 45% of the energy in the US [3], with a high carbon dioxide emission of 30% [4]. According to the International Energy Agency (IEA), the energy consumption will exceed 50% by 2025 [5].
In hot countries such as the United Arab Emirates (UAE), buildings account for a major share of electrical energy consumption due to air conditioning (AC) and ventilation systems used in the extremely hot climatic conditions [6]. AC systems consume the largest portion of this energy (approximately 80%) [7]. Therefore, it is essential to search for solutions to reduce the energy consumption of buildings [8]. To overcome this trend, the same building services need to be achieved using less energy. This requires the application of the concept of energy efficiency, which relates to the performances of energy-consuming systems. This concept is defined in detail in [9].
There is a major possibility of decreasing the energy consumption of both new and existing buildings [10]. That led us to the concept of retrofitting, which is the process of modifying something (such as a computer, airplane, or building) with new or improved parts or equipment, which were unavailable or considered unnecessary at the time of manufacture. Retrofitting can also mean adding a component or feature that an existing building did not have when first constructed [11]. Retrofitting is one of the main aspects that can be directed to achieve the goals of green buildings, as the ratio of the existing buildings is larger than the new constructions [12]. According to the World Green Building Council, a green building is “a building that, in its design, construction, or operation, reduces or eliminates negative impacts, and can create positive impacts, on our climate and natural environment. Green buildings preserve precious natural resources and improve our quality of life” [13].
Building Retrofitting
Retrofits for buildings correspond to different goals, such as green energy and zero-emission building retrofits. Green building retrofits improve the environmental response of a building, reduce water consumption, and increase the comfort and value of the space with regard to several factors, such as light pollution, air pollution, and noise pollution. On the other hand, energy building retrofits focus on optimizing the energy performance of a building. It is important to initiate energy conservation retrofits to reduce energy consumption to limit the cost of heating, cooling, and lighting in buildings as well as to decrease the overall fossil fuel dependency [14].
There are numerous benefits of retrofitting buildings, which can be categorized into environmental benefits, economic benefits, and social benefits. Environmental benefits include the lowering of greenhouse emissions and improving water self-sufficiency. The economic benefits of retrofitting can be one of the strongest means of convincing someone to consider retrofitting; an economic analysis showing the payback period is usually prepared as a common indicator [15,16]. Moreover, retrofitting is a more cost-effective means of increasing the asset value of an existing building than building a new facility [17]. The most complicated part of building retrofitting is the determination of optimal solutions and understanding the relationships through energy efficiency measures [18]. To reduce the energy consumption of buildings, engineering methods/approaches have been developed, which include building energy simulation software, such as eQUEST software, Energy Plus, and Ecotect. Energy software deals with a building’s parameters and the surrounding environment; for example, the operation schedules, the heating, ventilation, and air conditioning (HVAC) system, climate conditions, shading information, insulation, and new building technologies [19,20].
As the energy consumption of the building sector in the UAE reached 80% [21], the UAE had to release the Estidama code in 2009 [22]. This code underlines the importance of the right selection of systems, energy, and materials [23]. The main factors that have been suggested in most studies are glazing types (SHGC) [21], U-value [24], window-to-wall ratio (WWR), which introduces the suitable natural light as well as the heat transmission through openings [25], orientation, and AC system (HVAC) selection [26]. In the present study, the thermal performance of an office building located in the UAE has been assessed using the eQUEST software by testing all of the above-mentioned parameters. As the energy consumption in the office buildings is considered one of the highest compared to the other building types with an annual energy consumption of 100 to 1000 kWh per square meter, varying levels of consumption depend on various aspects, such as geographic location, type of building envelope (including walls, roofs etc.), HVAC system, lighting, and operational schedules. A recent paper dealing with building retrofit and sensitivity analysis in Abu Dhabi (UAE) reported that the optimal strategies for given a case study villa are a cool roof, cool wall, seasonal energy efficiency ratio (SEER), and atrium shades, which may lead to total energy savings of 25% [27]. Abdullah and Alibaba reported that an integration of photovoltaics as responsive shading devices as a retrofit strategy for an energy-efficient office building would have a huge impact on energy savings. Indeed, this retrofit method has reduced total site energy consumption by 33.2% compared to the existing building performance [28]. An analysis of energy efficiency measures and retrofitting solutions for social housing buildings in Spain as a way to mitigate energy poverty was recently published by Aranda et al. Indeed, they reported that energy simulation tools have proven to be affordable, fast, and convenient for assessing the energy-saving potential of each measure implemented in a building. However, the real savings values are usually 20–30% lower than the simulated results, mainly because simulated demand is calculated to meet standard thermal comfort conditions, which are not always met in this type of housing due to its economic limitations [29]. Another paper dealing with an early-1950s building presents a measurement campaign to investigate the building’s characteristics and its vulnerability. After that, some retrofit alternatives were simulated and compared by means of a calibrated model. Concerning opaque surfaces, the effect of an external insulating coating of expanded polystyrene was studied. The results show that a higher thermal insulation allows mitigation of the wintry heat dispersions, but, on the other hand, it involves a cooling energy demand increase, which can reach up to 45% [30].
2. Materials and Methods
The commercial sector accounts for a major share of global energy consumption. Most of this energy is used in cooling and artificial ventilation systems. For the development of energy-efficient structures, this paper provides an overview of building design criteria that can reduce the energy demand for the cooling of commercial buildings. By adopting a case study to find and analyze the most effective parameters to transform the existing building performance into that of a greener building, the approach of this methodology answers the questions of how and why [31]. These criteria are based on the adoption of suitable parameters for building orientation—envelope system, HVAC mechanisms, shading, glazing, etc.—to examine how the operational and constructional strategies led to an efficient energy structure as well as to optimize implications for future practices and policymaking.
2.1. Building Selection and Description
Ajmal Makan is a real estate development company with an office building consisting of a ground floor oriented toward the sea in Sharjah, the third largest city in the UAE. The selection of the case study was determined based on the accessibility of documents and information necessary for our study. Drawings such as plans, elevations, sections, 3D models and construction drawings for HVAC systems, and electrical distribution enabled the construction of a digital model that is highly accurate with respect to the real building. The electric bills served as a validation tool.
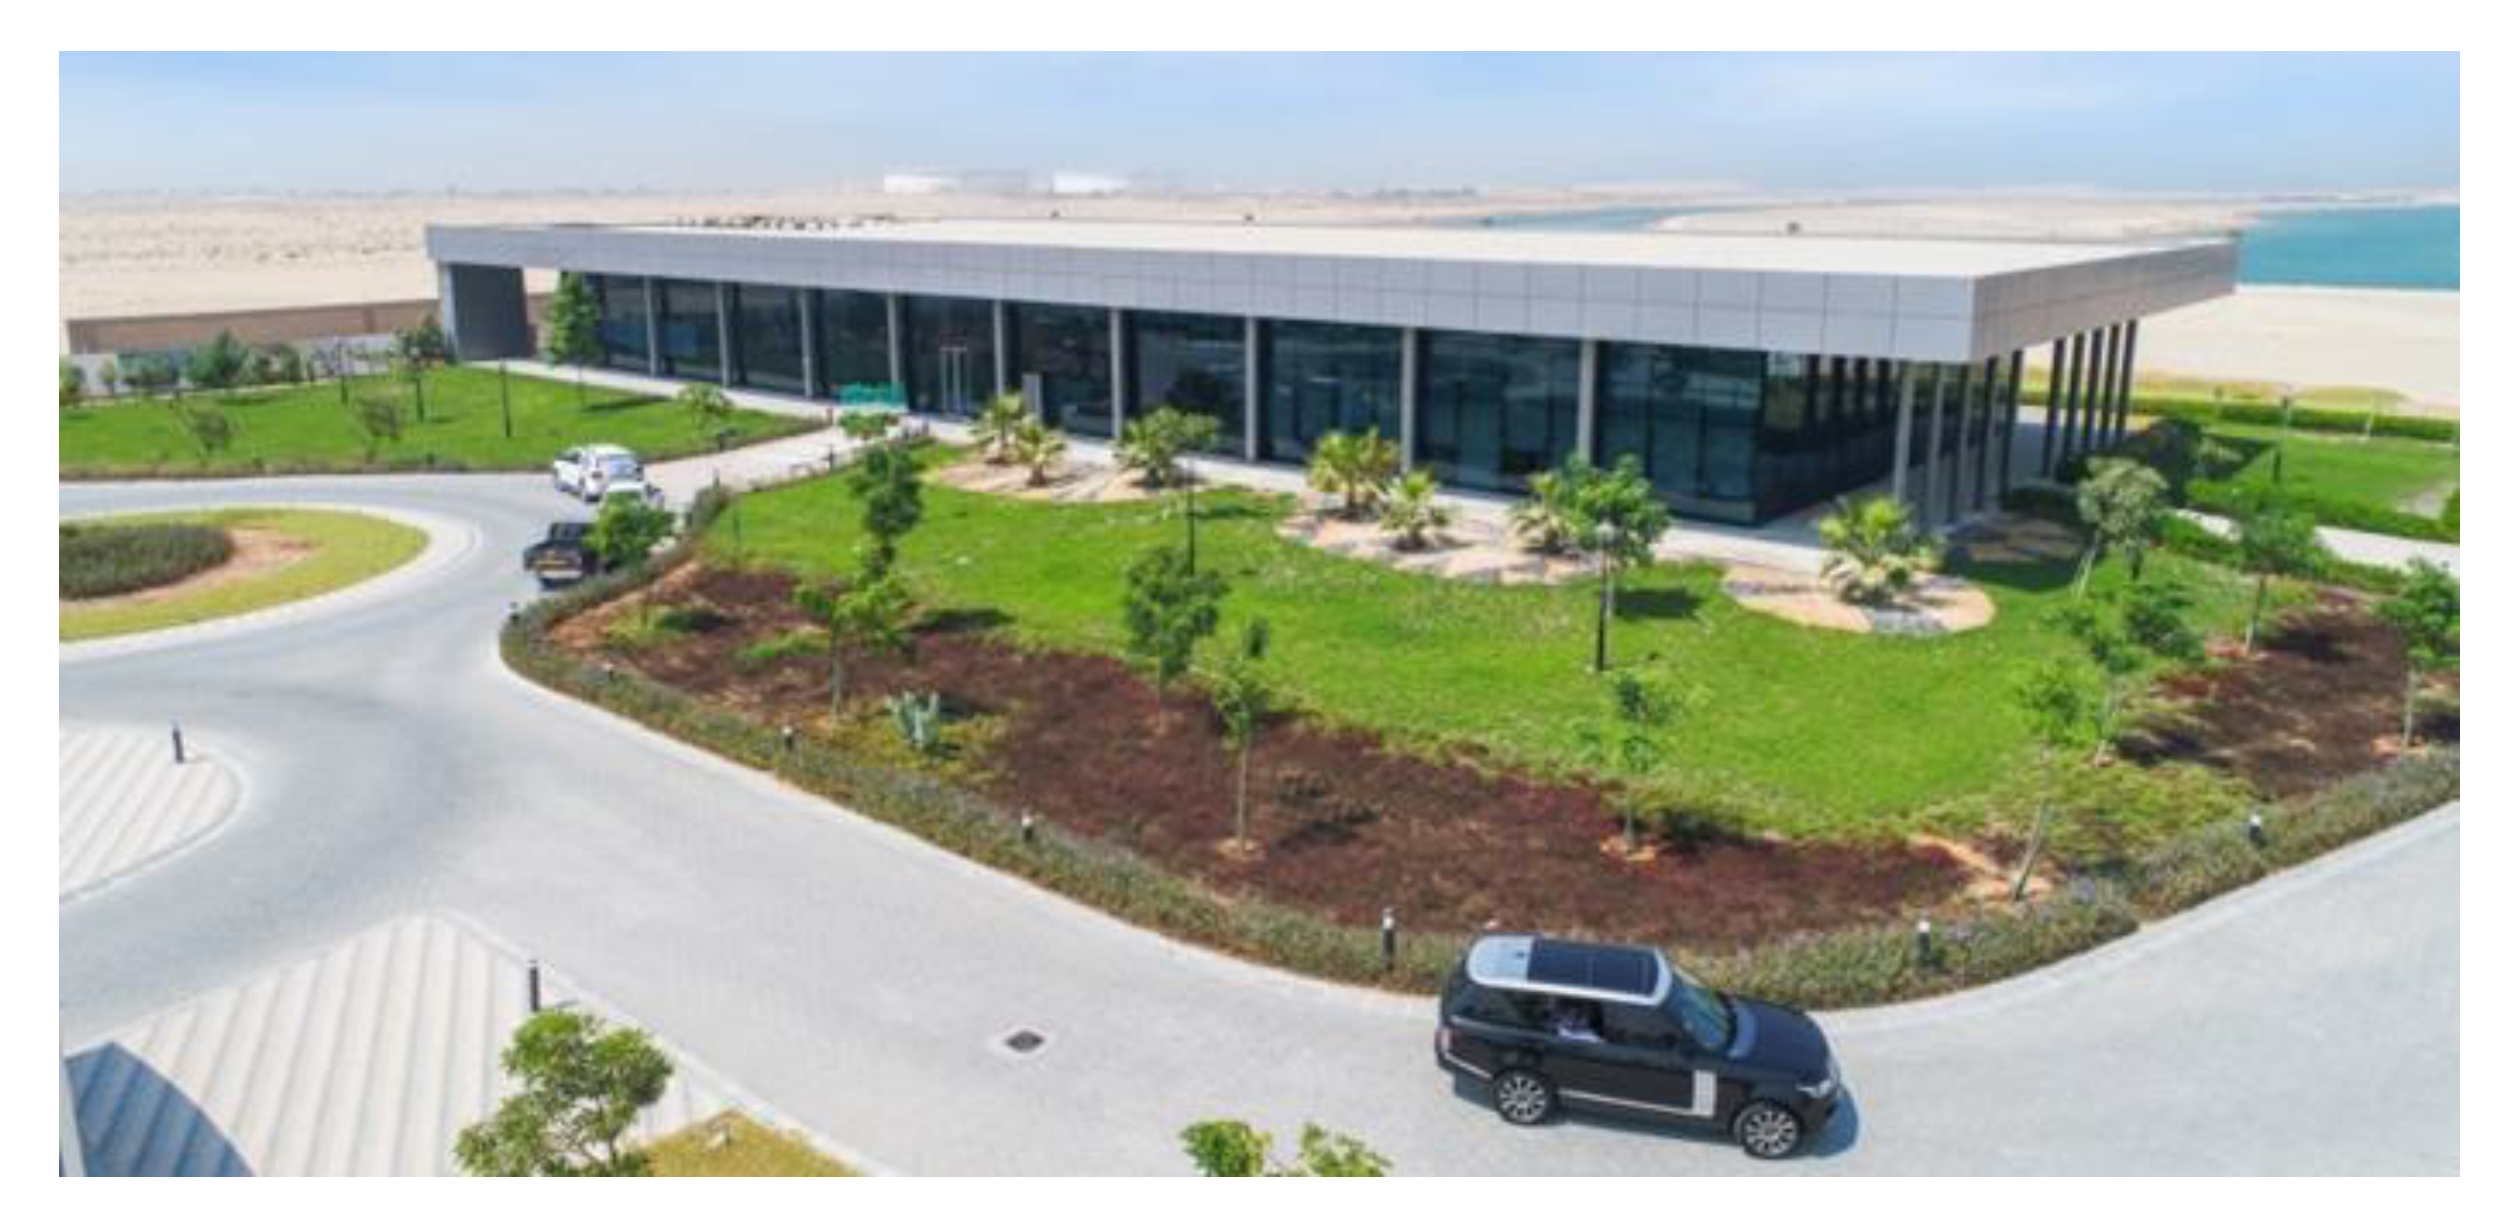
The case study concerns a 2000 m2 office building (Figure 3) with over 40 employees. The activities carried out in the building pertain to real estate sales, engineering, marketing, and finance, and the building houses an exhibition hall with display models.
The office building was constructed in 2017 and has a modern steel design with a full-height glazing surrounding three sides of the building and exaggerated overhangs ranging from 4 to 7 m. Only one wall (South-East) is made of concrete blocks; however, no proper insulation has been used. The AC system is a basic packaged DX series fan-powered a variable air volume (VAV), as shown in Table 1.
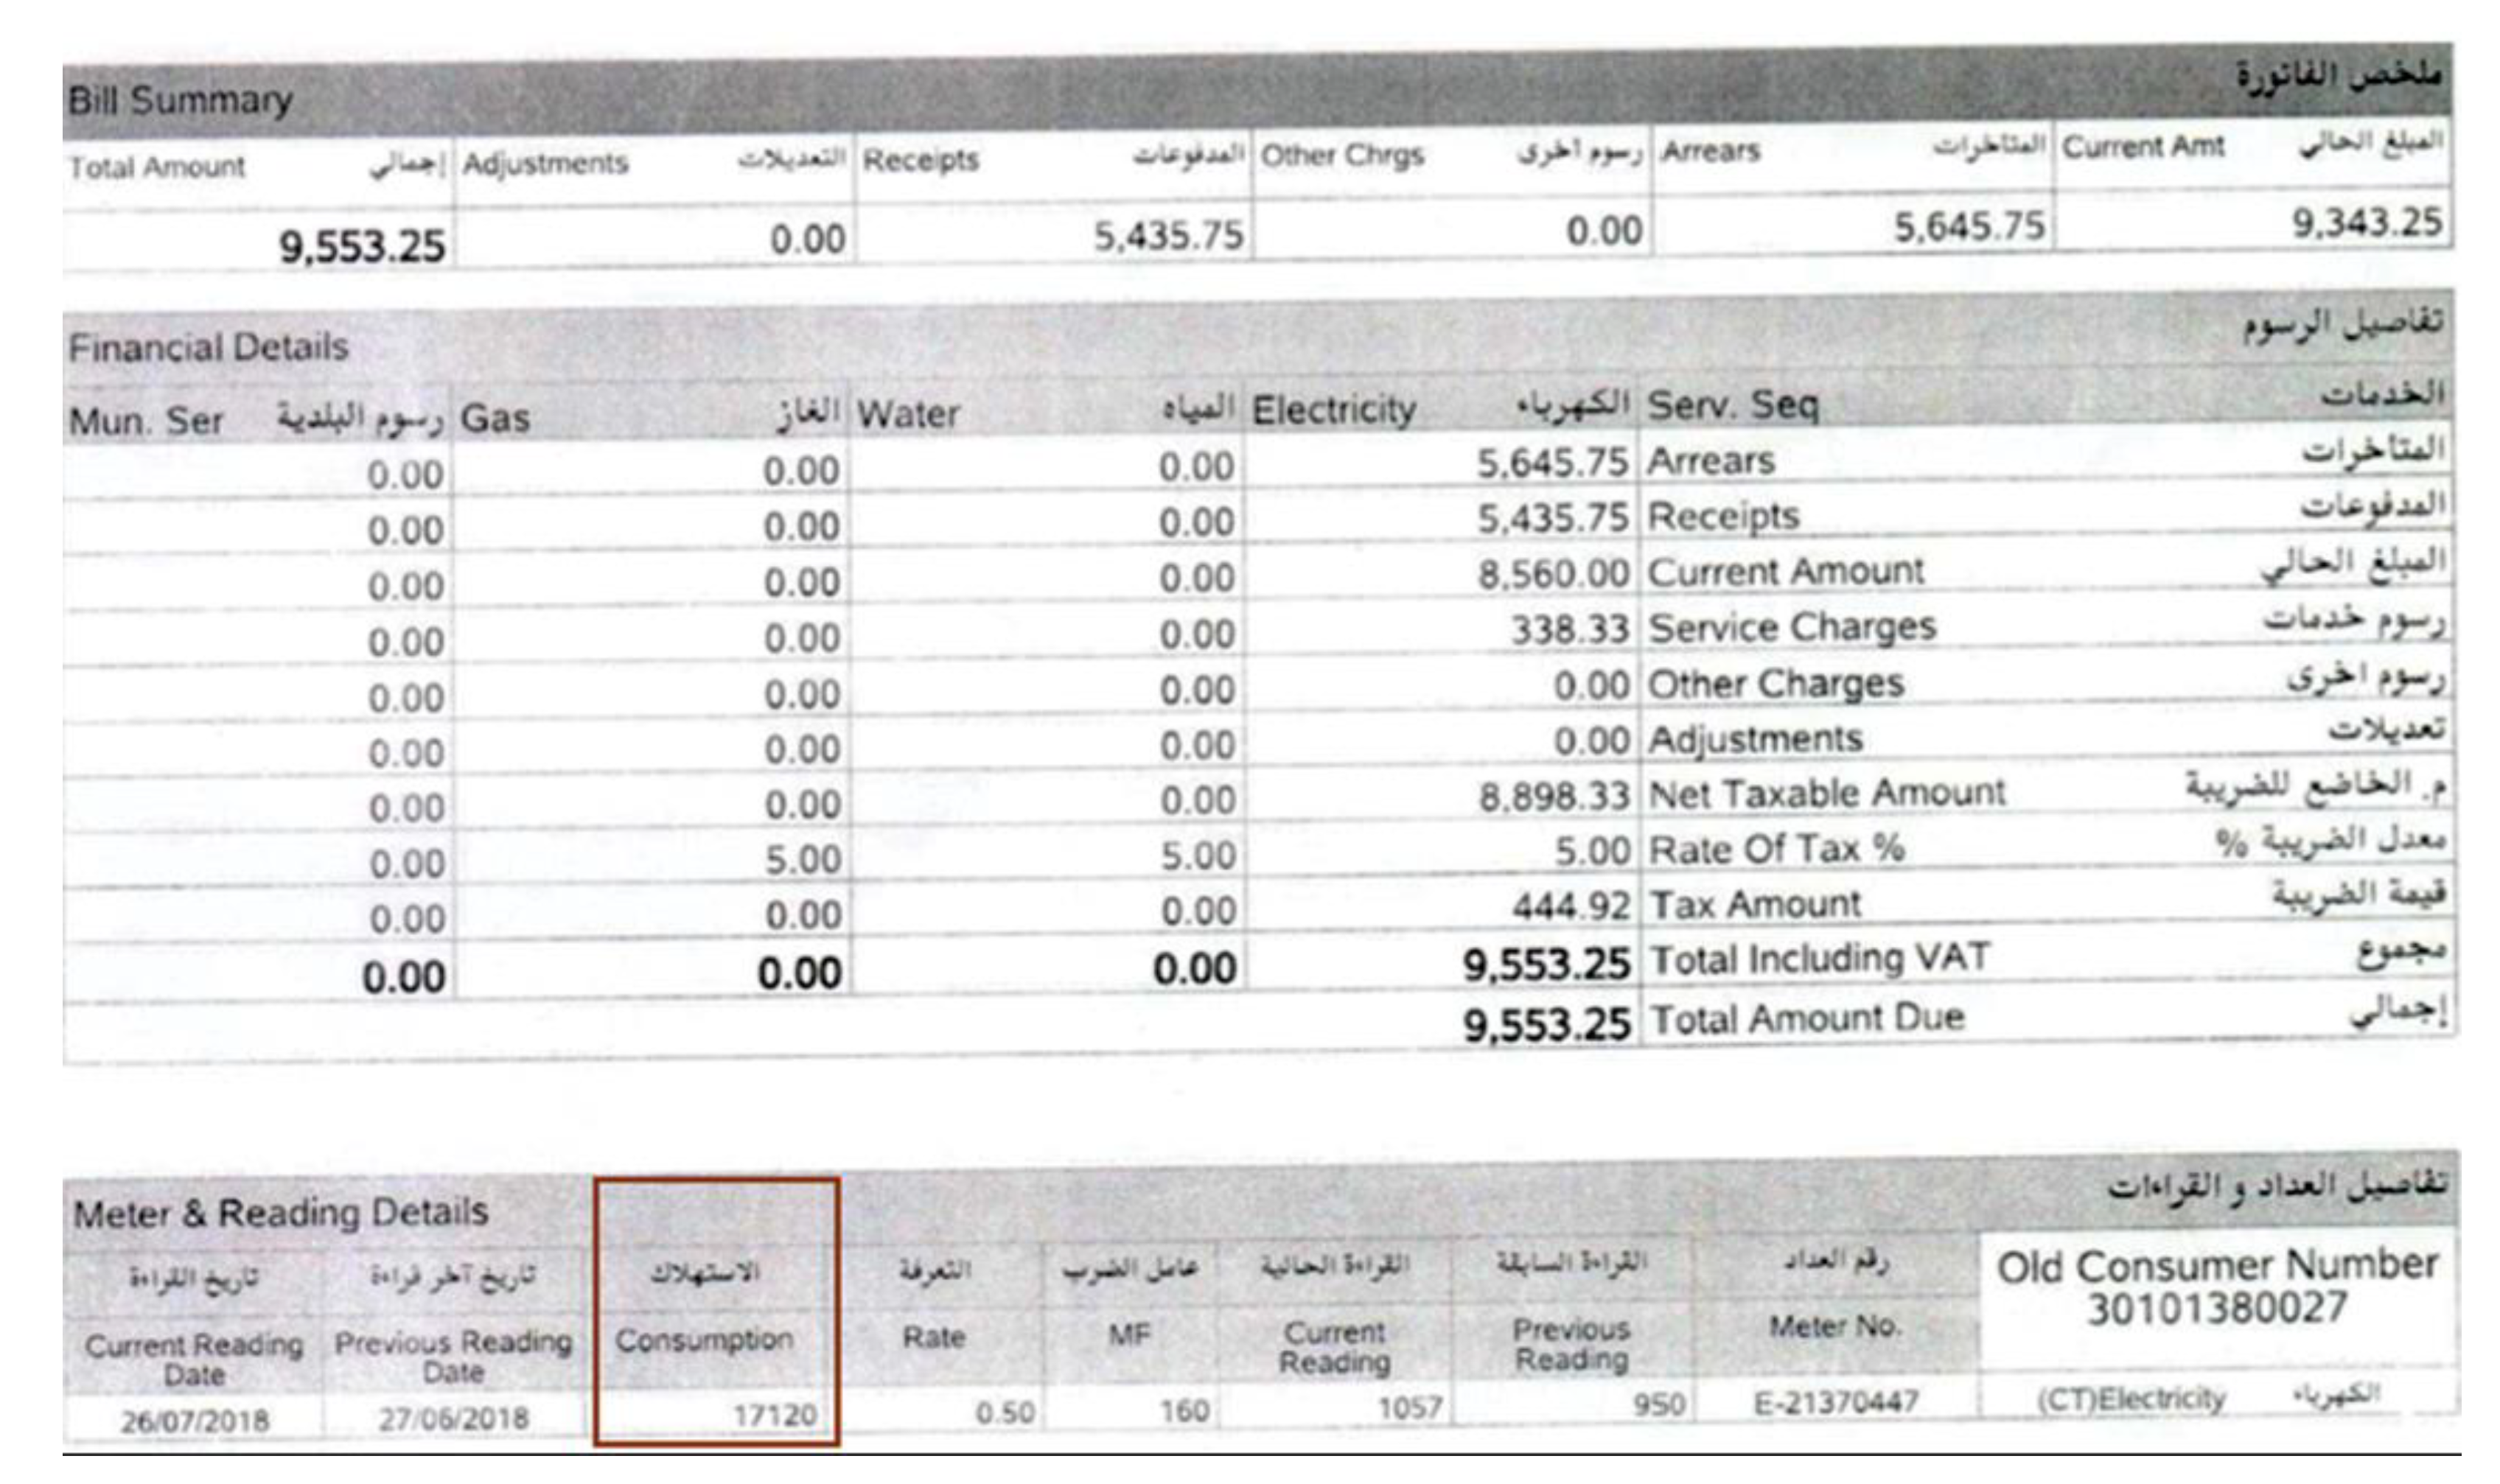
According to the electric bill shown in Figure 4, the total consumption for July was 17,120 kWh. The electric bill consumption during this month was considered for the validation of the simulation model.
2.2. Weather Data Analysis
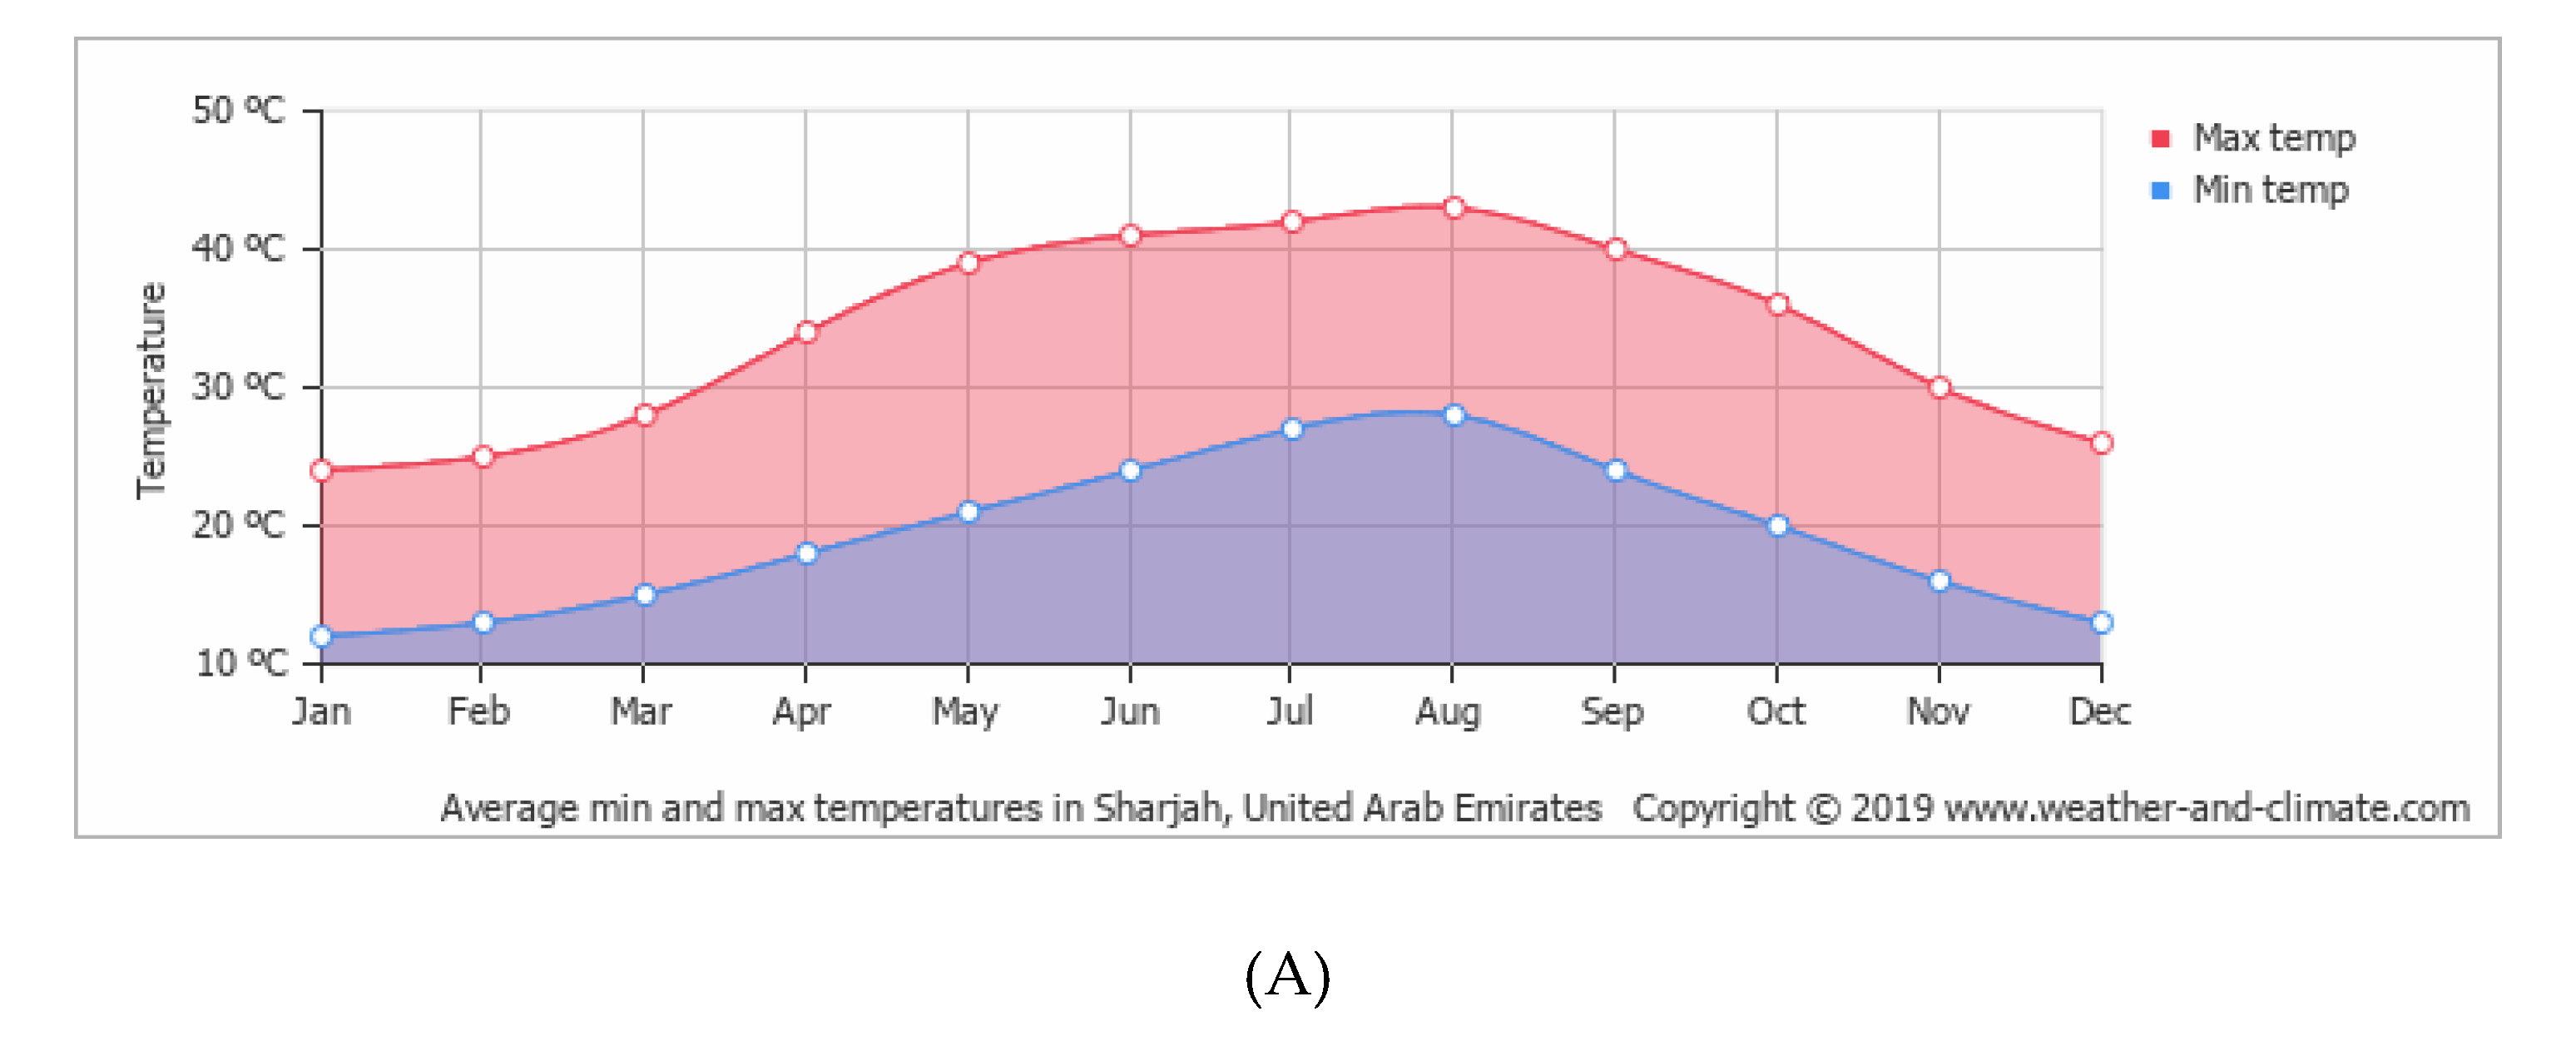
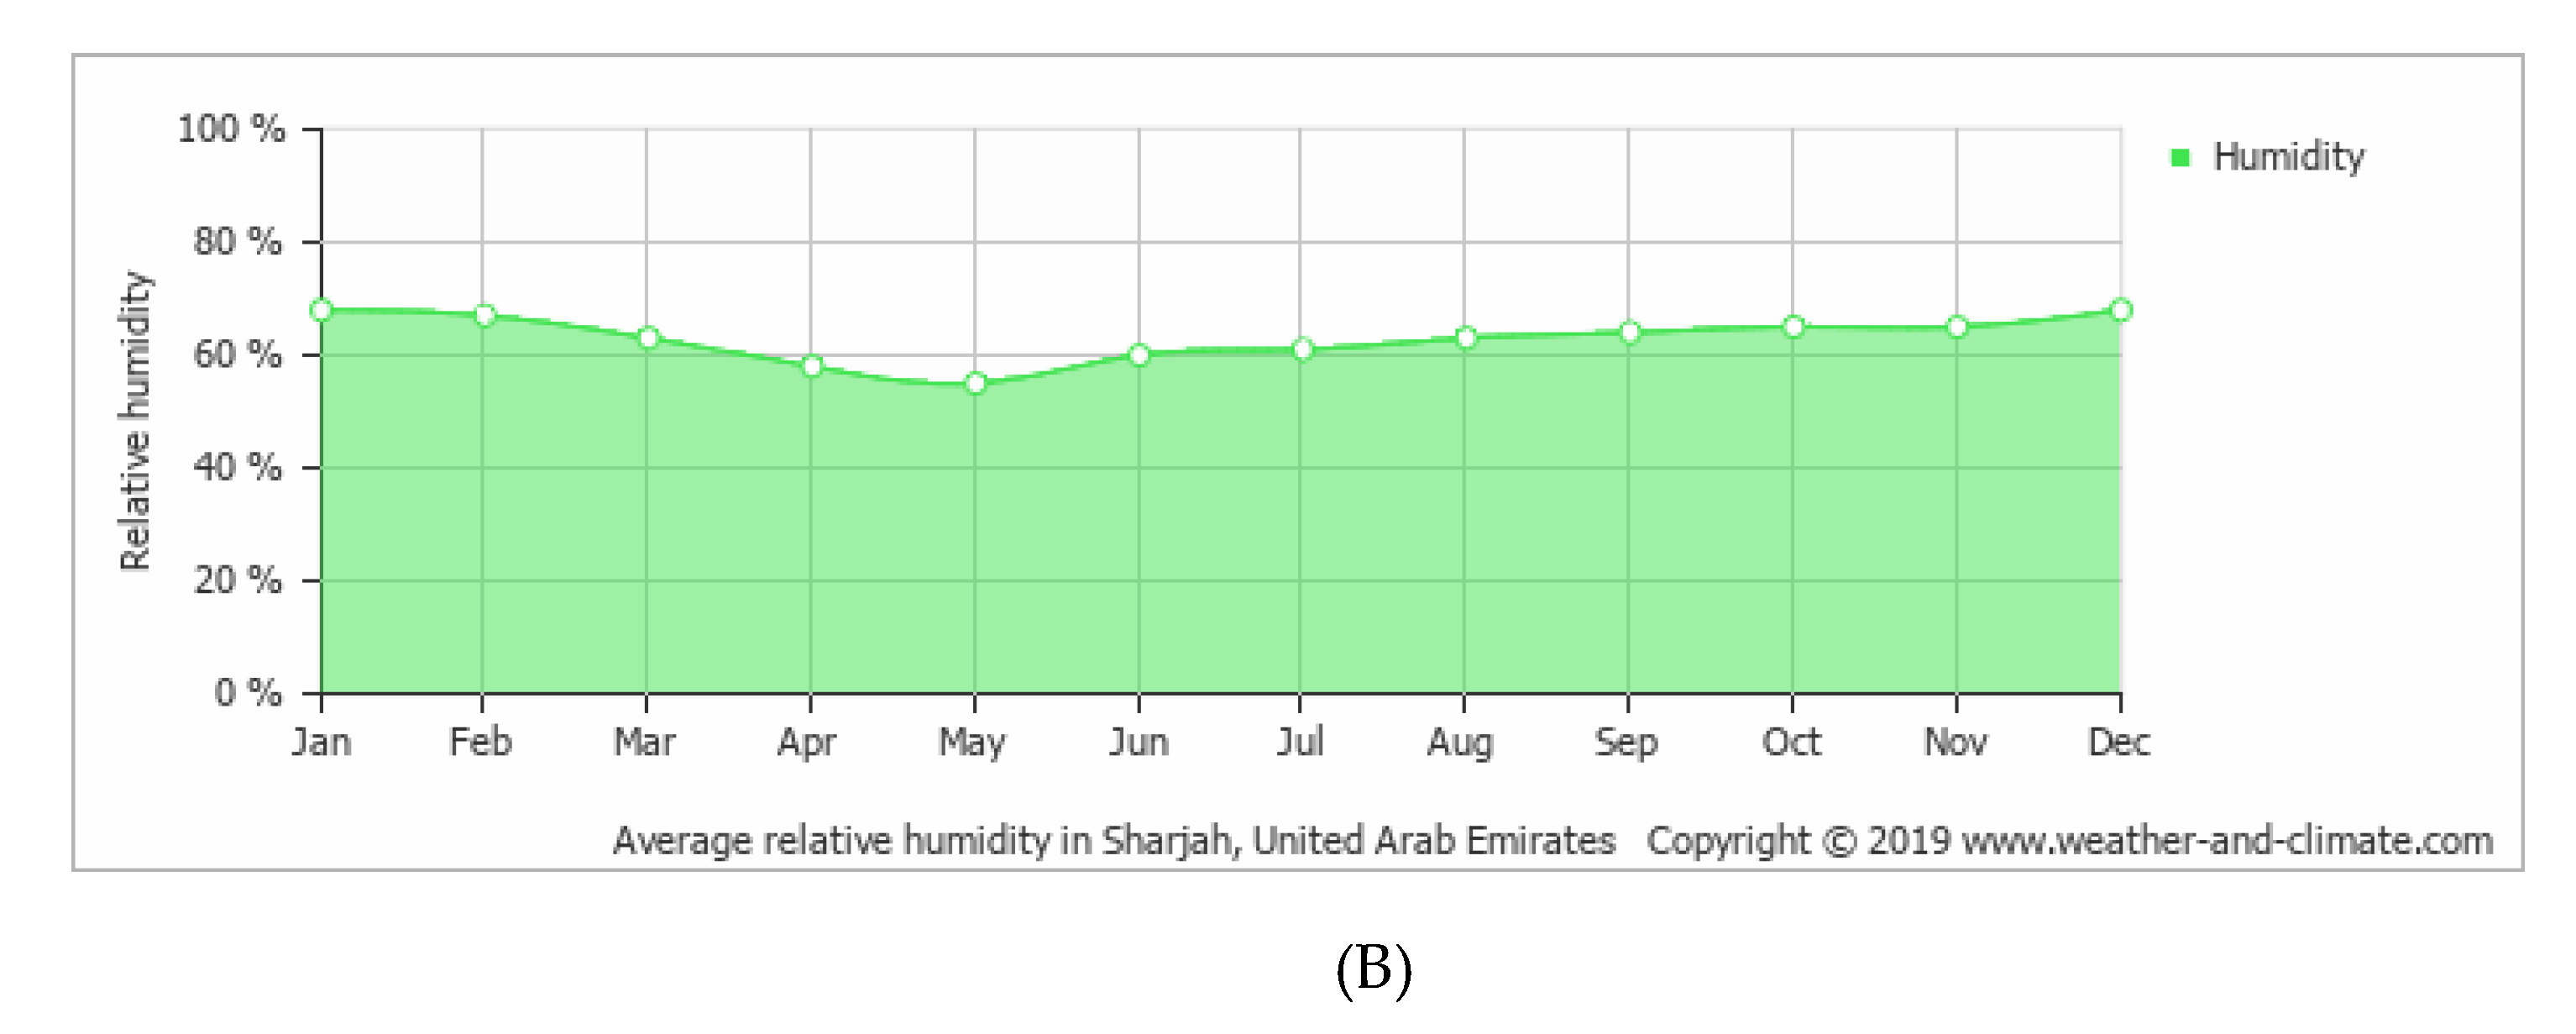
The Abu Dhabi weather data were used for this study. Using the Climate Consultant software provided us with valuable information that helped us to understand the design intent of the building and guided us toward different alternatives. The average minimum and maximum temperatures during the year are shown in Figure 5A. The average relative humidity is also shown in Figure 5B.
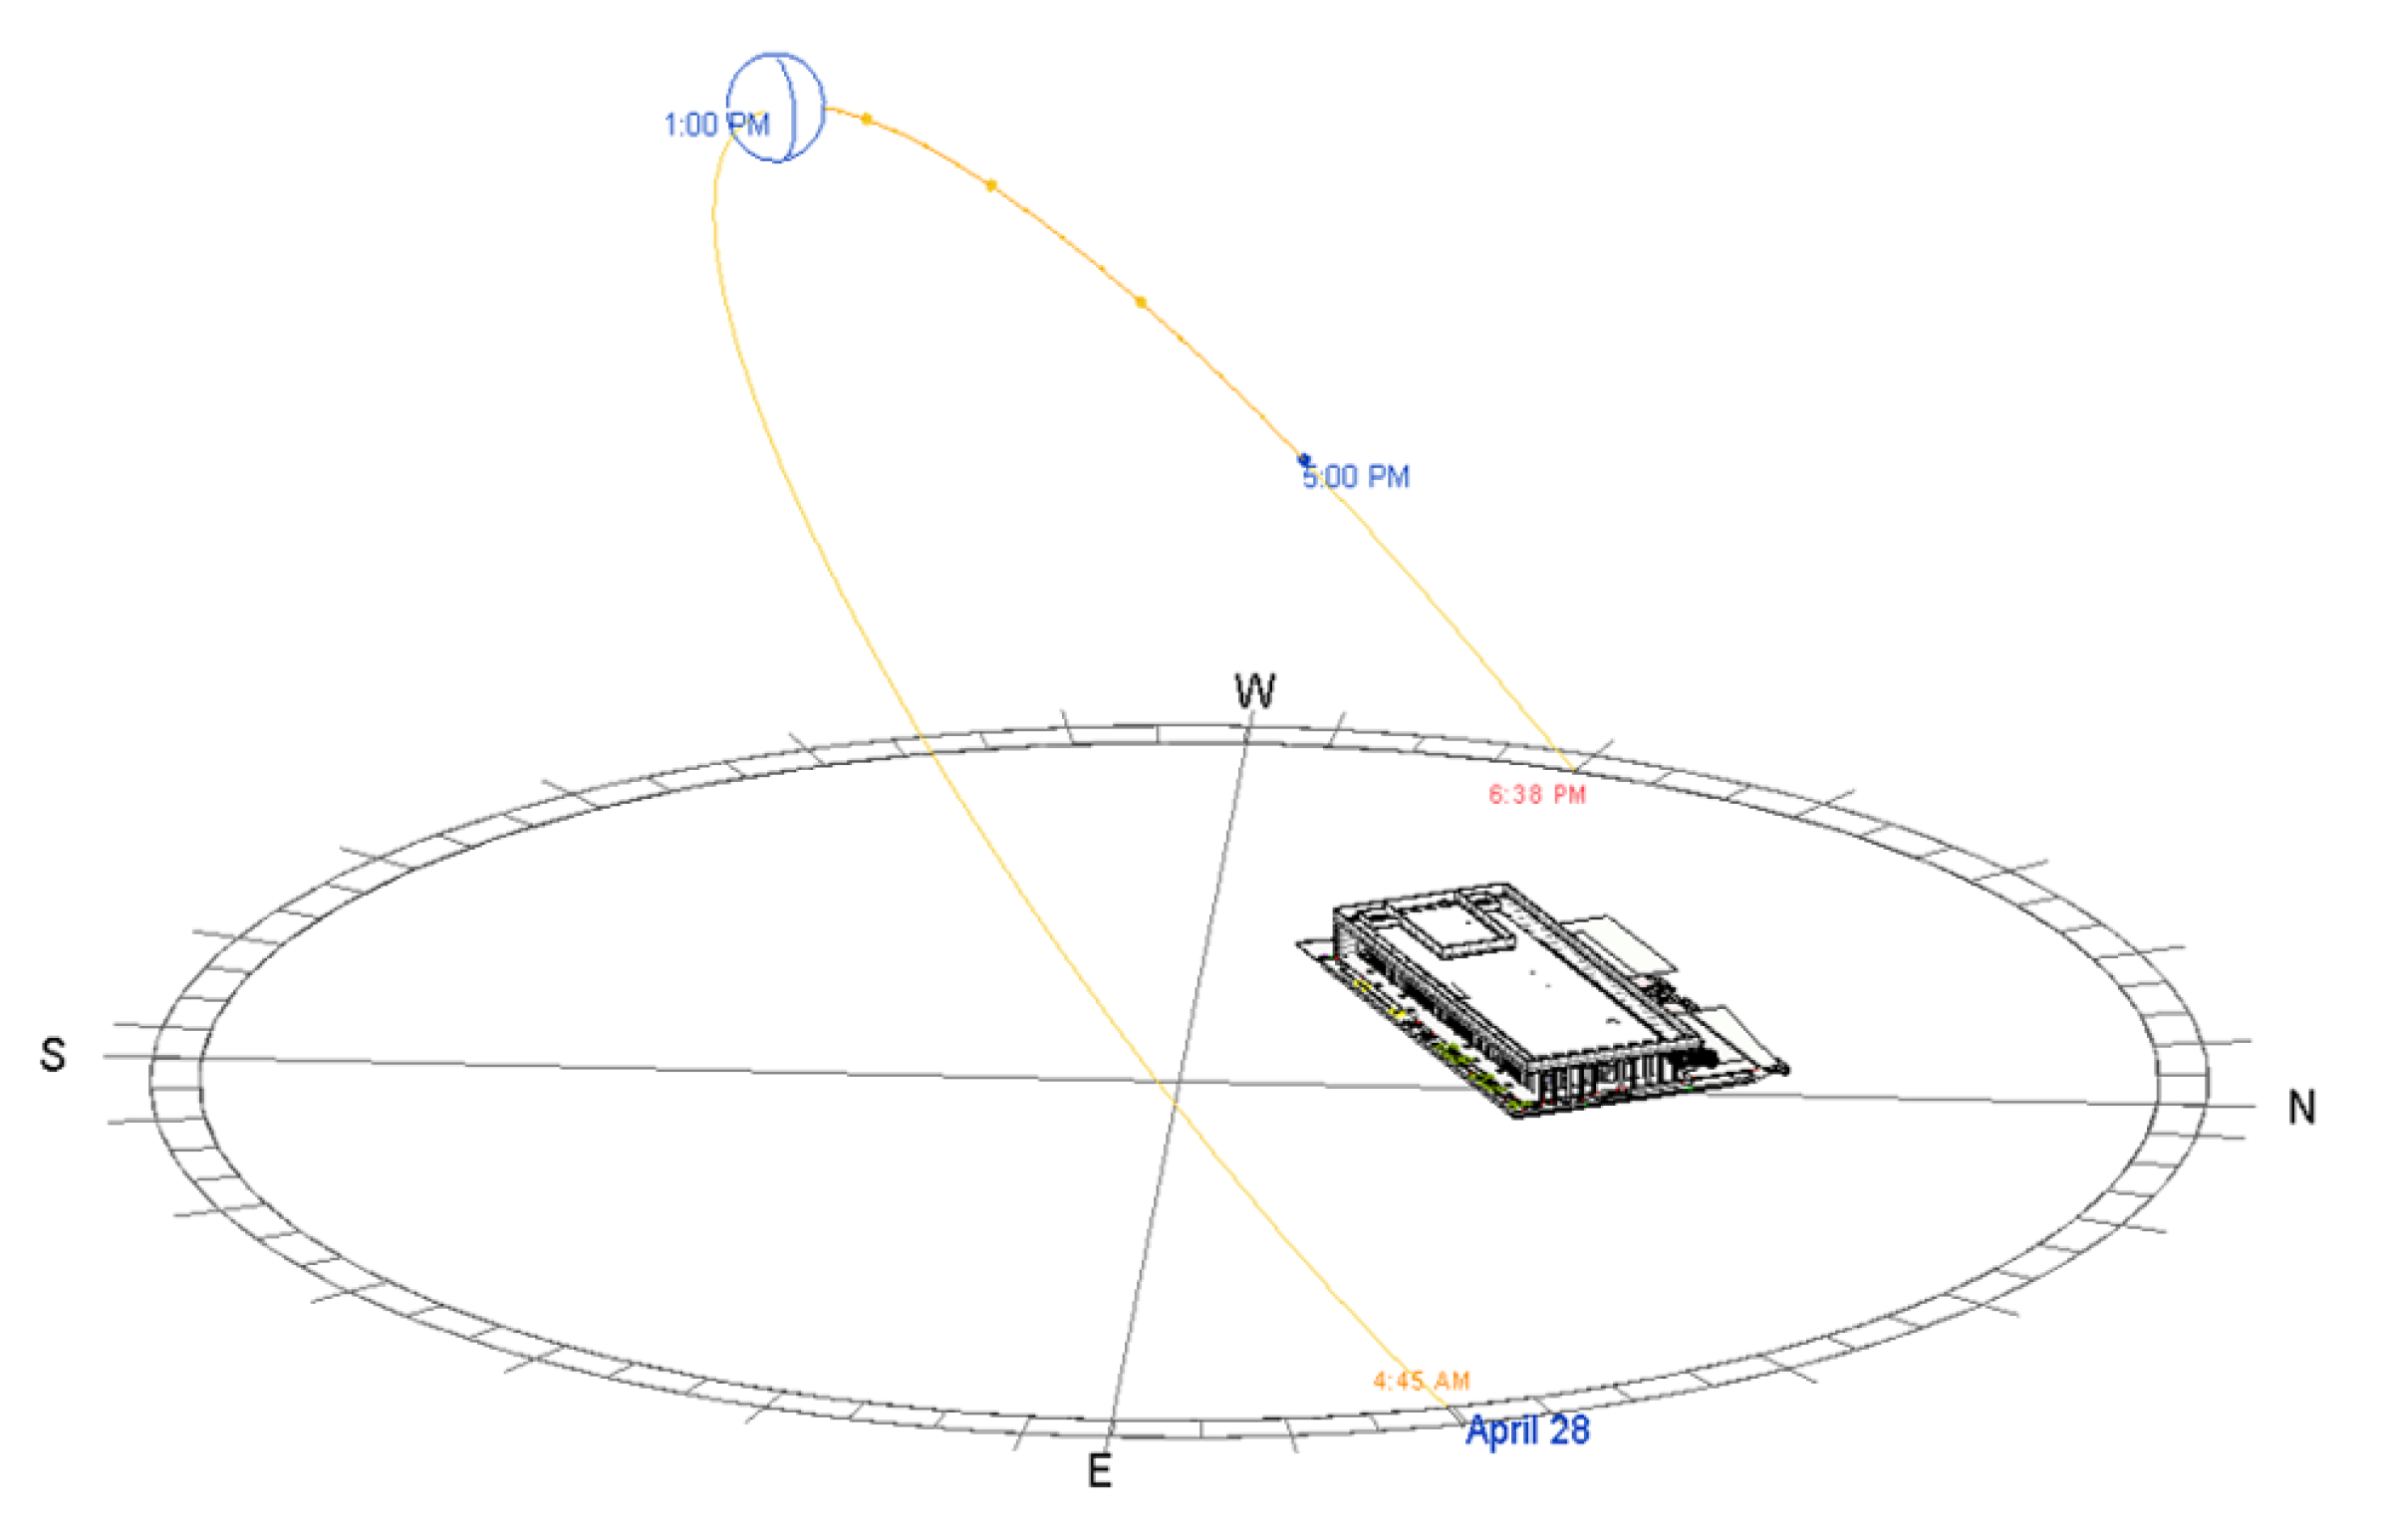
The Revit software was used to determine the sun’s path in the summer months for the selected building, presenting the orientation, sun path, wind, temperature, and comfort hours throughout the year, as shown in Figure 6. The climate is hot and humid, with an average temperature of 36 °C in summer and 19.5 °C in winter.
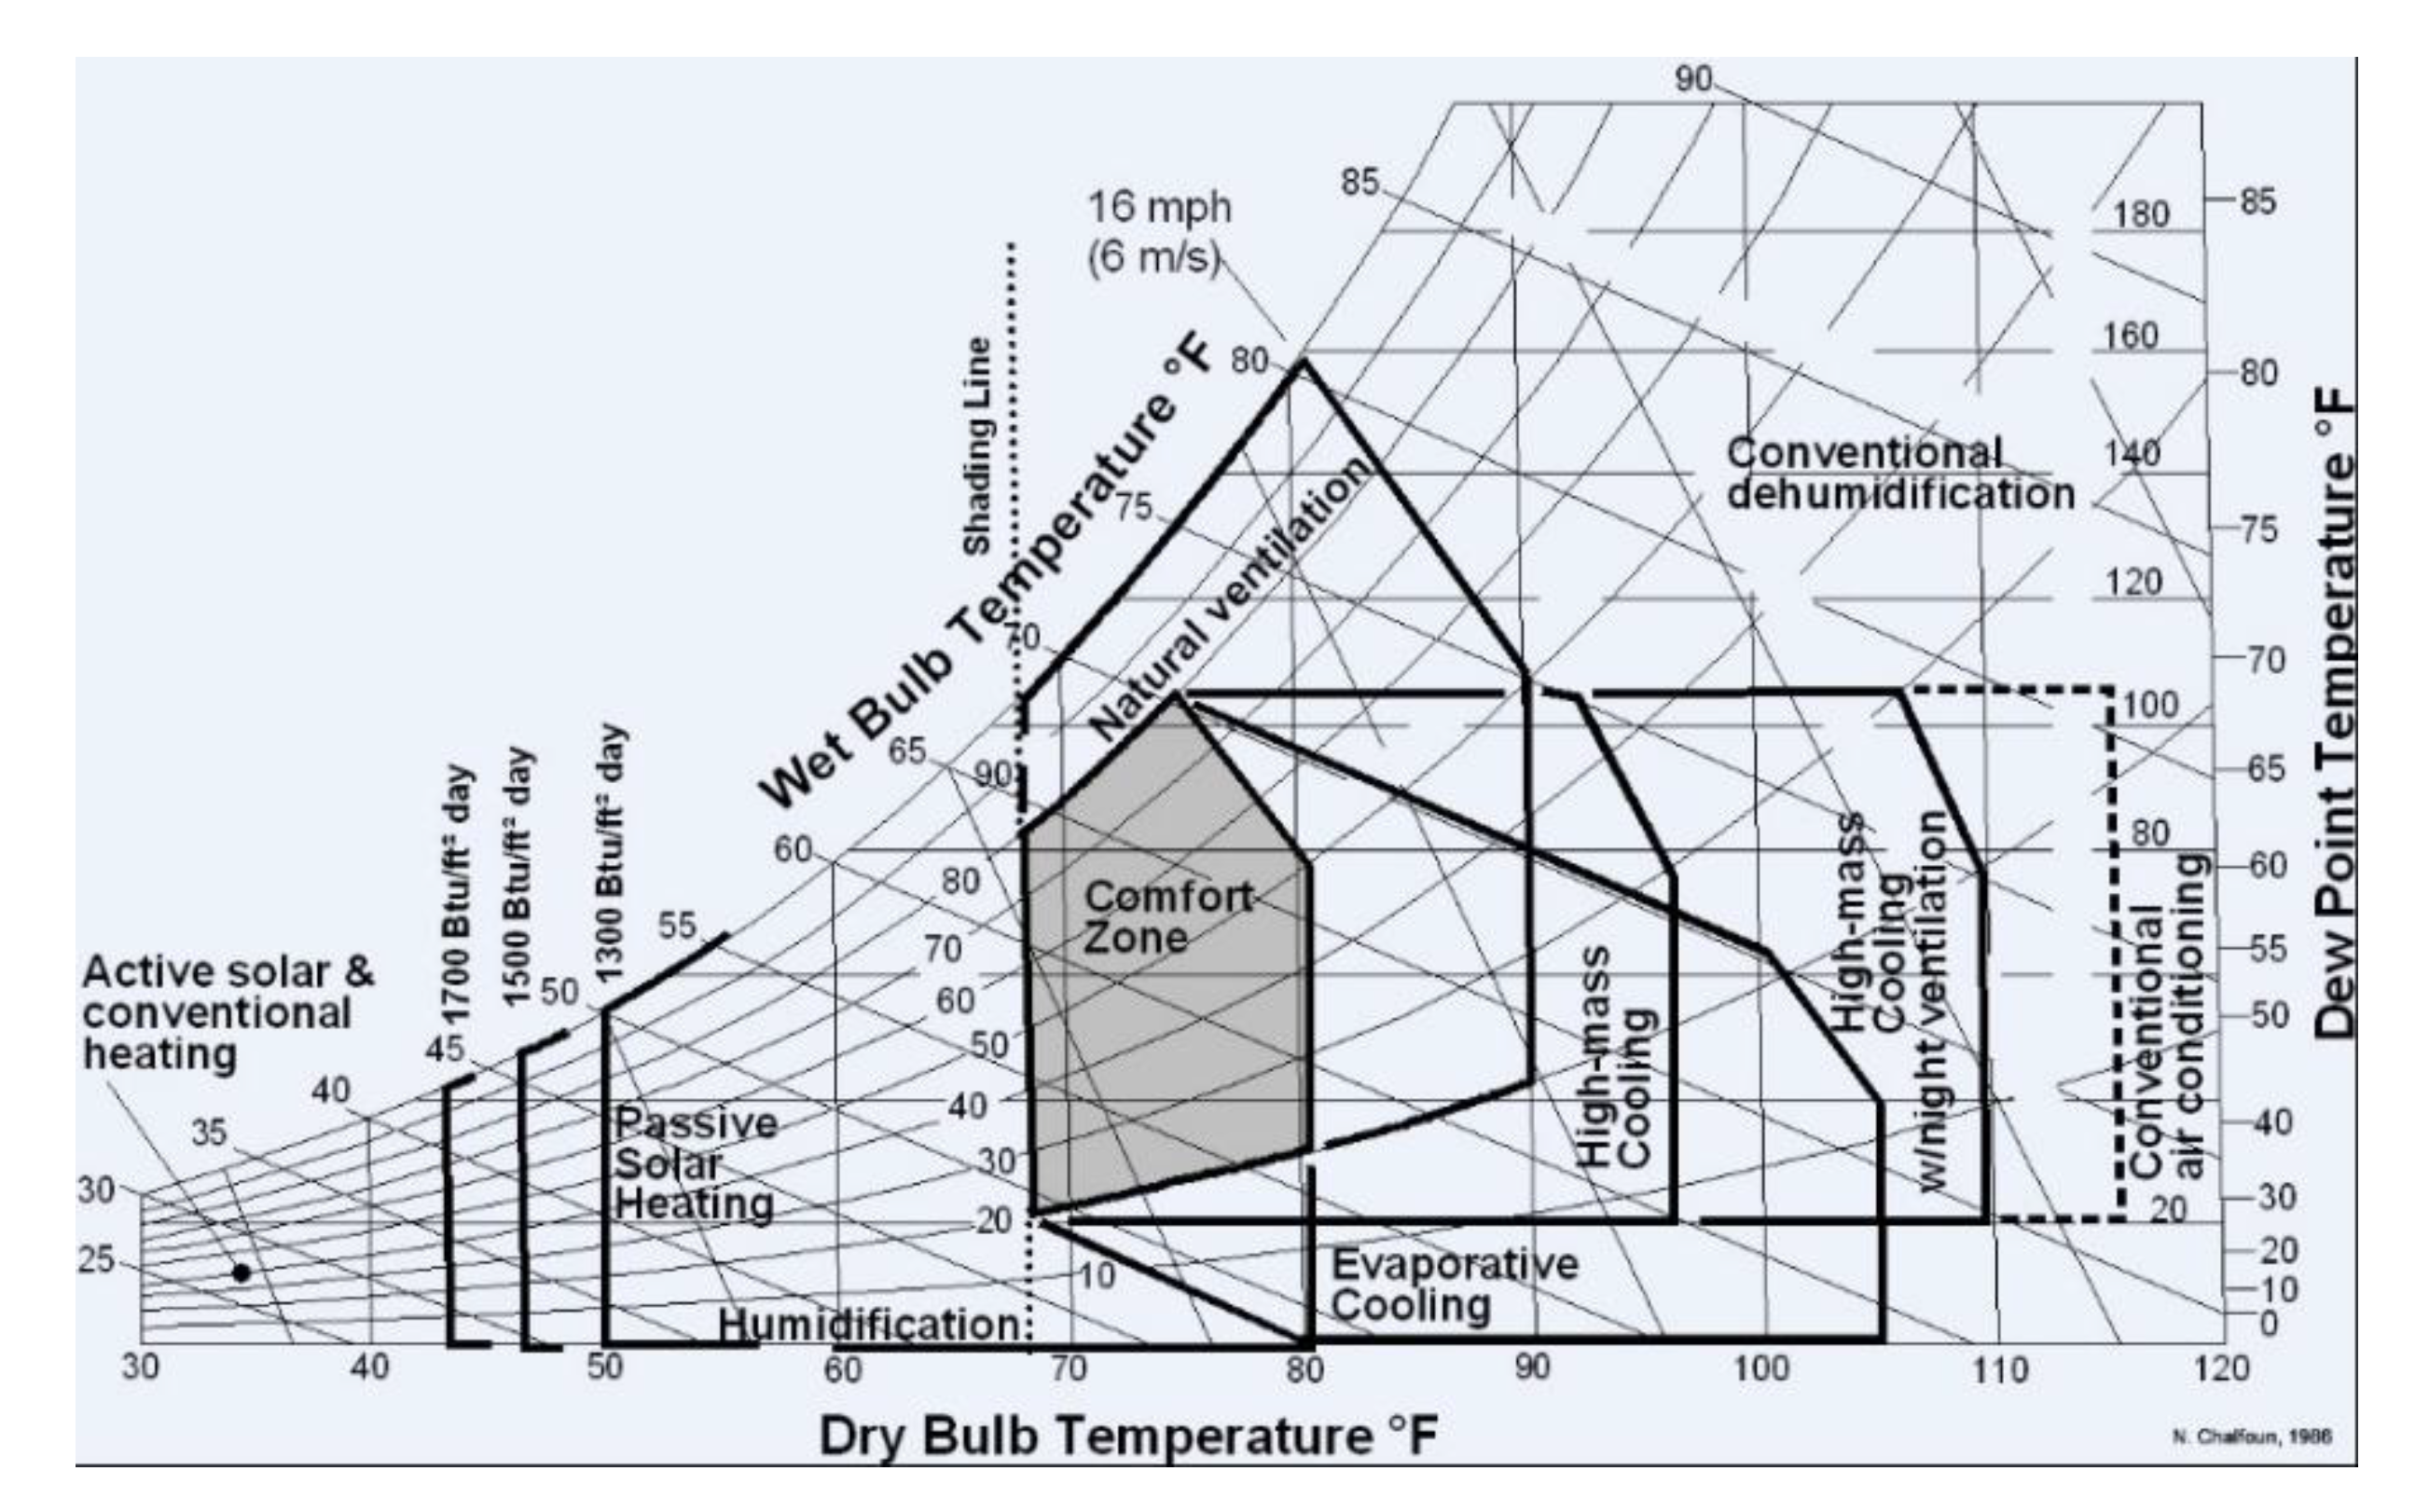
The psychrometric chart of Abu Dhabi, as shown in Figure 7, provides detailed information regarding different alternatives for achieving thermal comfort in spaces. As with all HVAC systems, a VAV system must be designed to provide indoor conditions that are within a certain comfort zone. Psychrometric charts are used to determine which parameters must be maintained in order to obtain conditions within said comfort zones. For the psychrometric chart shown below, a VAV system would need to maintain a dry bulb temperature of approximately 75–85 ºF, a wet bulb temperature of approximately 55–65 ºF, and a relative humidity of approximately 30–70%. A second parameter that VAV systems must take into account is the change in air velocity in a space. Air velocities are constantly changing and can play a huge role in properly or improperly conditioning a space. As shown in the chart below, various types of spaces have various changes in air velocity [32].
3. Energy Simulations
3.1. Real Case Simulation
First, the simulation was carried out on a real case. The data of the building, as shown in Table 1, were used, and the electric consumption was computed using eQUEST simulation software and then compared with the electric bill provided by the management office of the building. Table 2 shows the energy consumption for the selected building during all of the months for space cooling, heat rejection, ventilation fans, mechanical equipment, and area lights, then providing the total consumption during the year, which is 167,380 kWh.
Simulation Validation
Once the simulation of the real case was run, we compared the hottest month’s (July) results with the electric bill of the same month. This was a validation step to ensure that the building was modeled properly. The error ratio was 3.3%, which is considered to be reasonable. The validation ratio was calculated using the following equation.
3.2. Alternative Selection
While retrofitting an existing building, there are two main components to consider: Building envelope and HVAC system; these include window-to-wall ratio, wall and roof insulation, glazing and frame type, and overhang for the building envelope, as well as heating and cooling sources and operation schedule for the HVAC system.
Base Case Simulation (Modified Real Case)
The real case was modified because of an obvious design issue that, once altered, will drastically reduce the energy consumption. The envelope of the building is made mostly of glass, which allows the transfer of a large amount of heat. As it is located in a very hot region, the reduction of glazing in the façade naturally improves the performance of the building. The case study’s WWR, as shown in Table 3, was carefully calculated using the following equation.
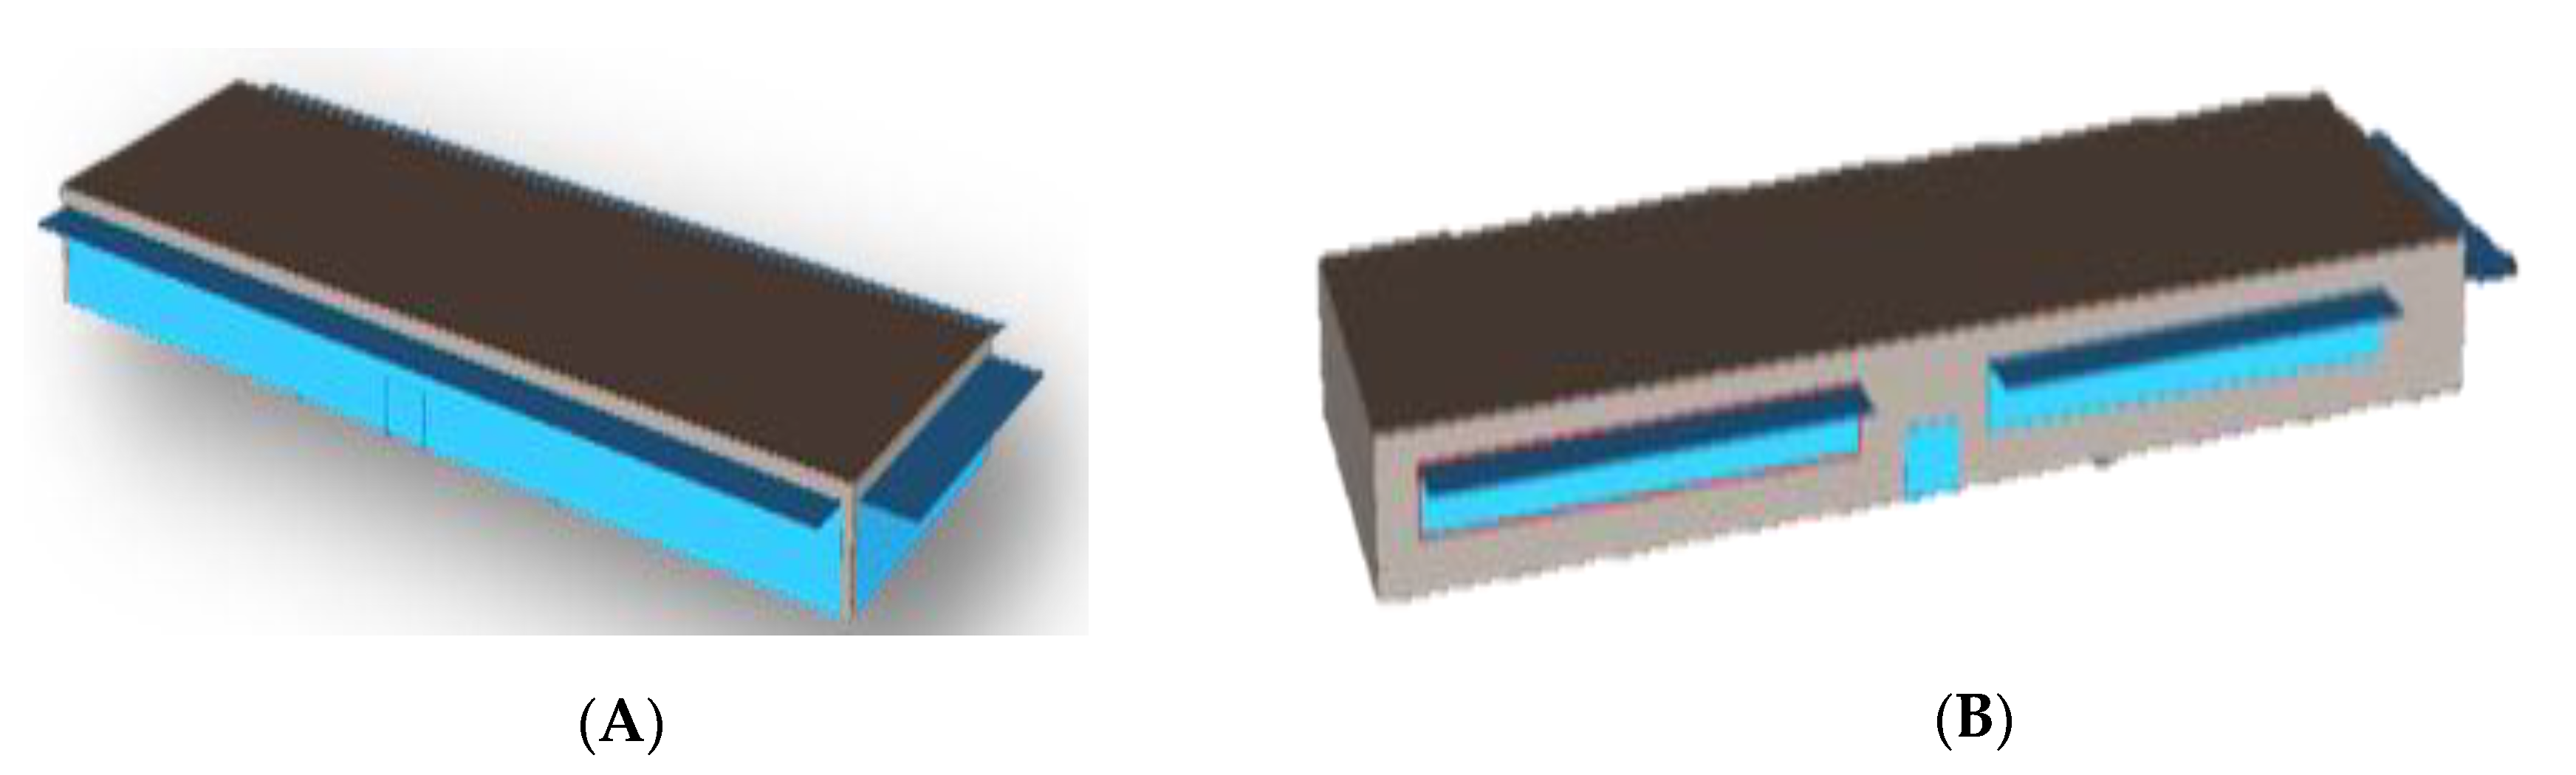
The result was much higher than the recommended value, with an average of 91% for the three elevations comprising the North, the East, and the South, and 0% for the West elevation. According to ASHRAE 90.1-2007, the ideal WWR is 24% of the wall [33]. To achieve this value, the window size was changed, as shown in Table 4, and the building took a new form, as shown in Figure 8.
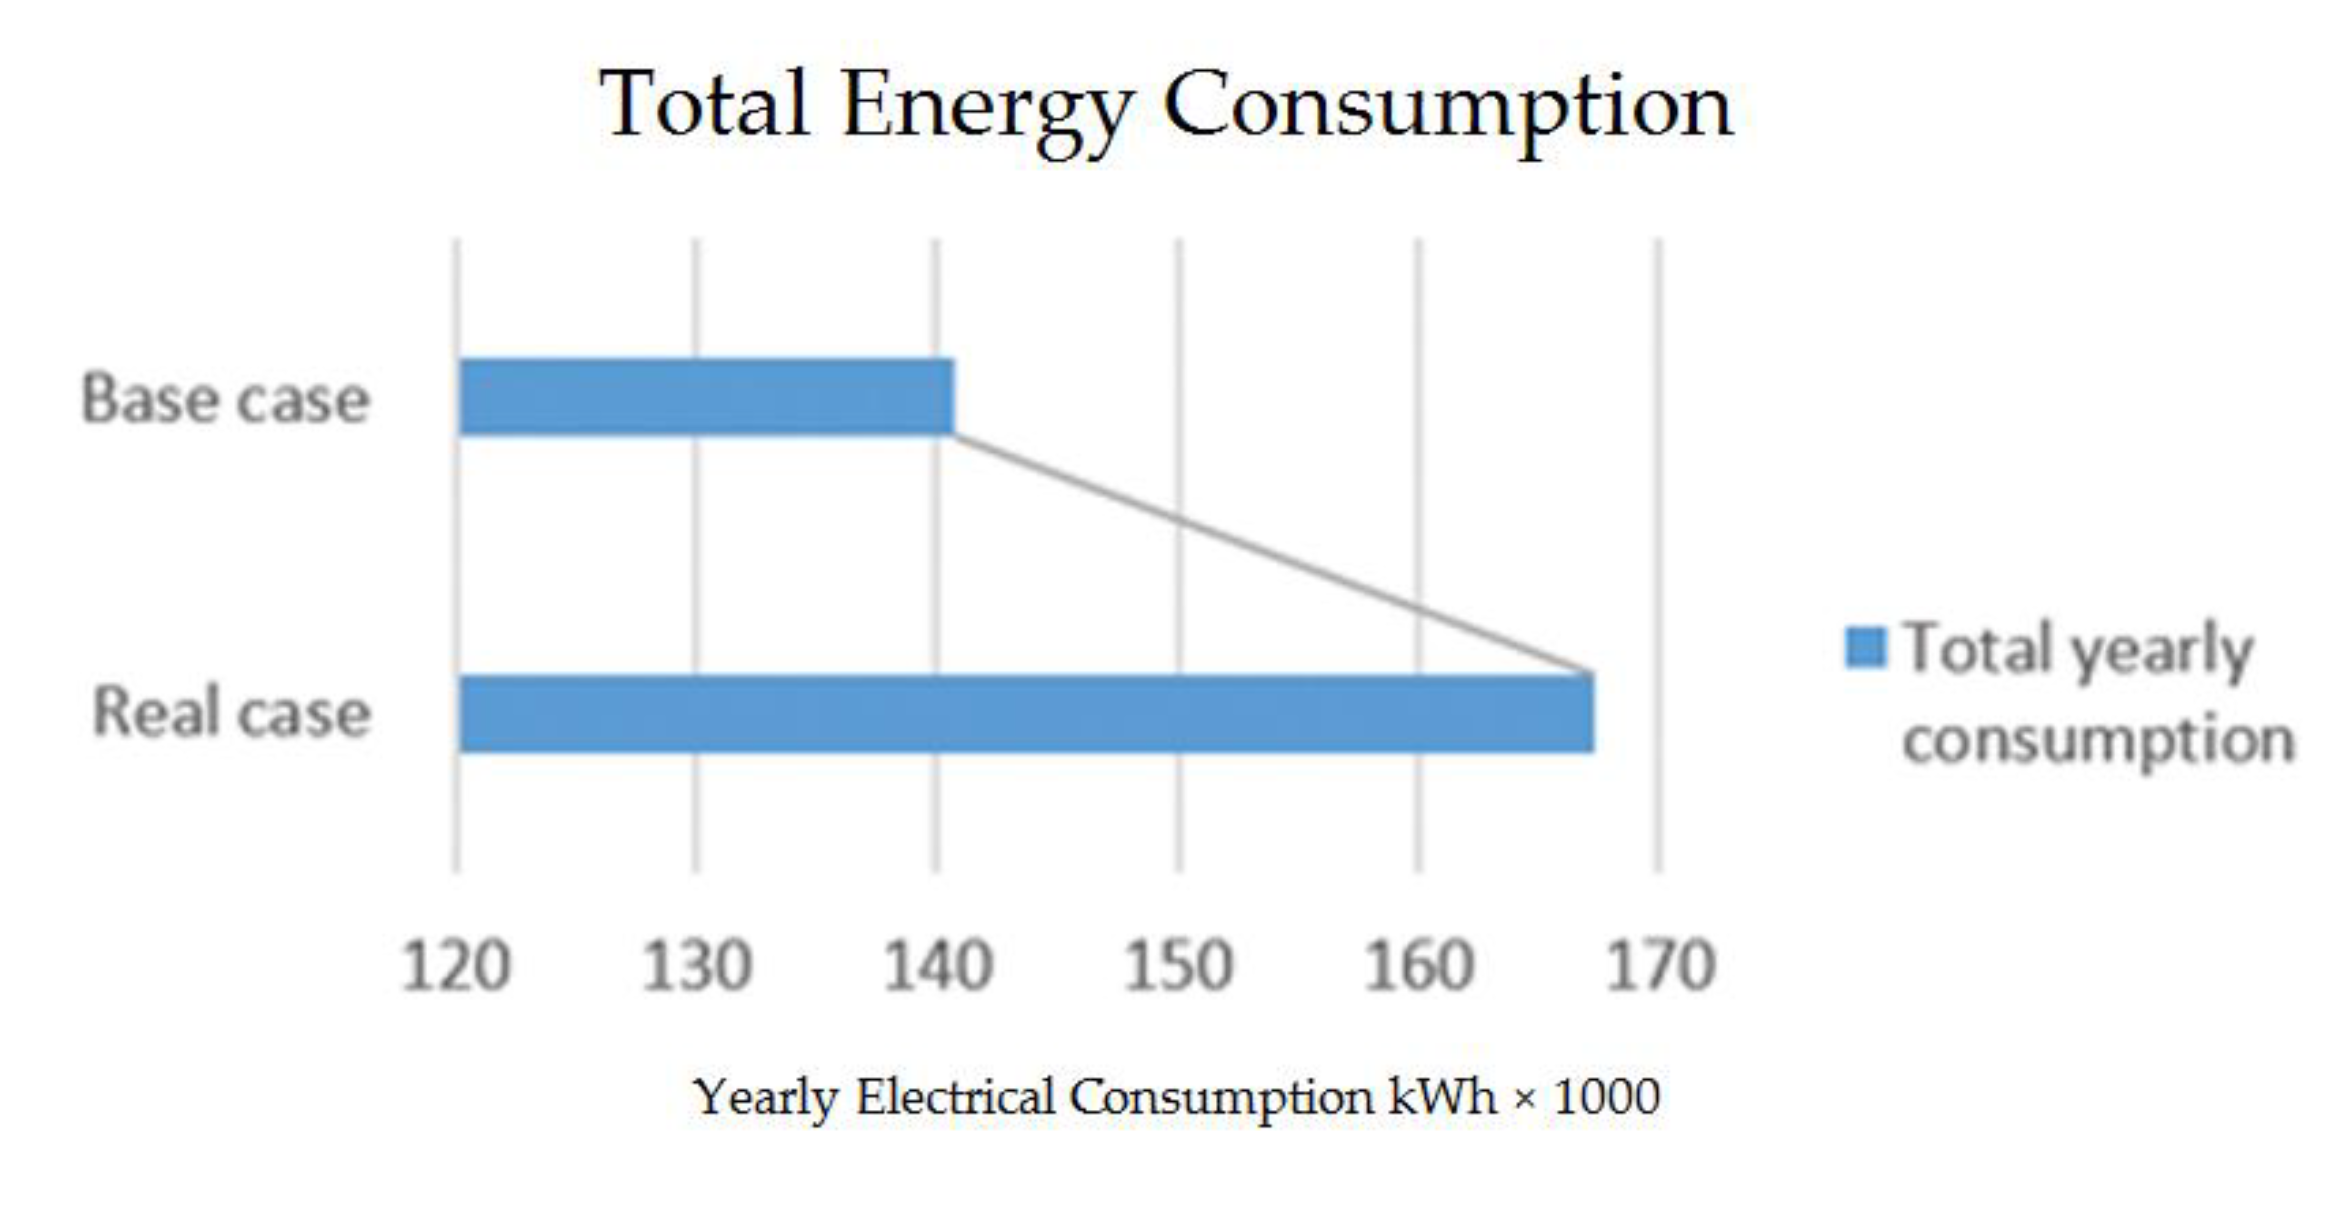
After changing the WWR of the real case, the base-case energy simulation indicated that the building would be 16% more energy efficient, as shown in Figure 9, with a 140,710 kWh consumption rate, as indicated in Table 5. The modified building was then considered as a base case for the rest of the simulation.
3.3. Retrofitting Alternatives
Six retrofitting parameters were studied and applied to the base case. Different alternatives—changing the orientation, the U-value of the roof, the U-value of the wall, the glazing, the shading, and the AC systems—were run on the eQUEST software, and the energy consumptions for each case were obtained and then compared with others.
3.3.1. Orientation
The orientation of the building on the site affects the amount of energy consumed by the building. Four different scenarios were applied, as shown in Table 6.
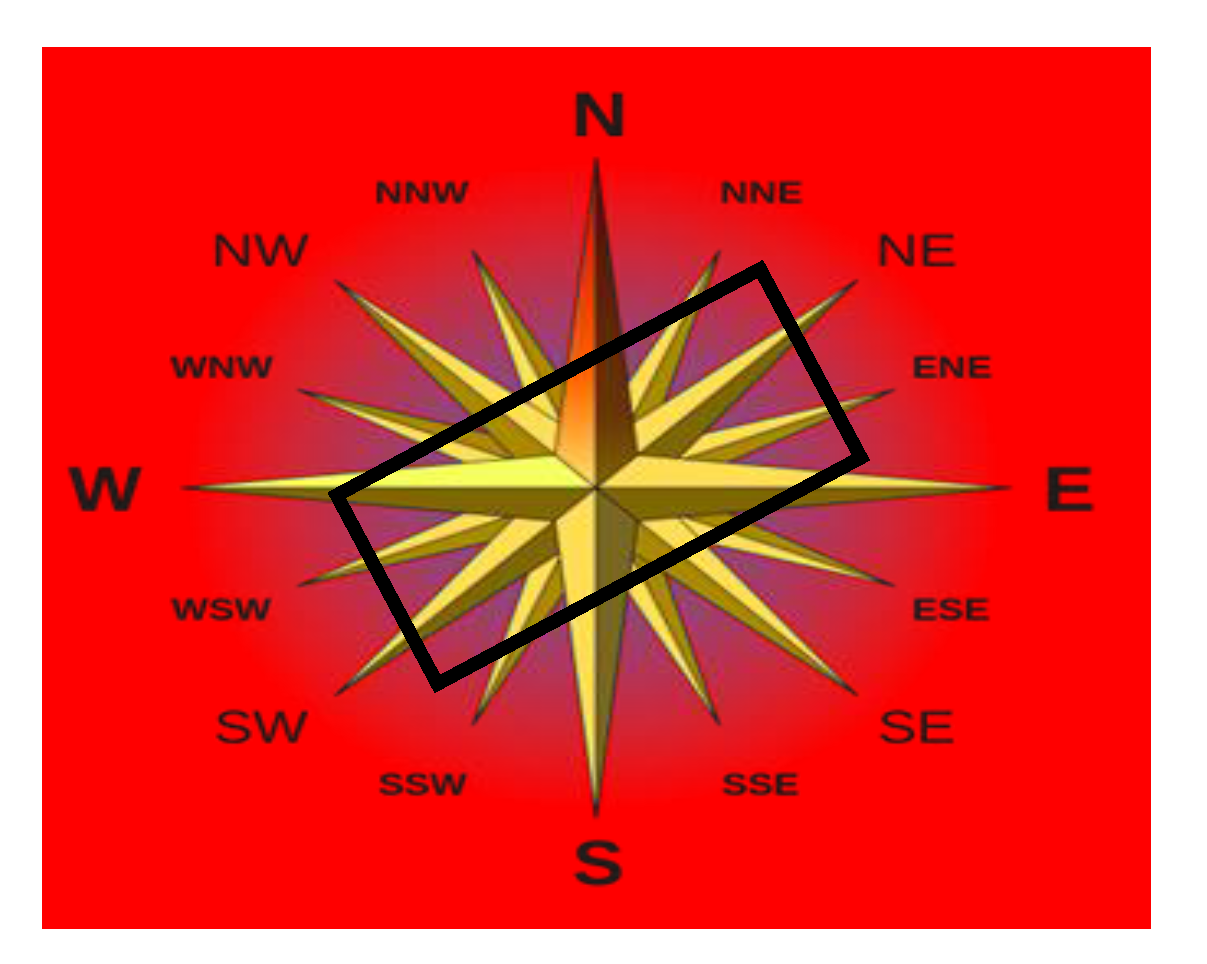
The building is oriented 22° from the north, indicated on a compass, as the initial orientation (Figure 10). Different angles were applied to the new base case. The results showed that that the current orientation is optimal.
3.3.2. Roof
The roof represents the most exposed element of the envelope of a building. The case study has a completely flat roof that is mainly composed of heavyweight (HW) concrete with half-inch expanded polystyrene with a U-Value of 1 W/m² K. The proposed alternatives include four-inch expanded polystyrene, four- and six-inch polystyrene, four-inch expanded polyurethane, and three sizes of preformed roof insulators, as shown in Table 7.
Based on the results summarized in the table above, the roof type 4 is found to be the best alternative compared with other roof types. Indeed, using this roof would lead to energy savings of 8.43% compared with the base case.
3.3.3. Walls
As previously mentioned, the WWR of the real-case building was only 9%, as the three full facades are entirely glazed. This left us with only one wall of four-inch hollow concrete blocks with no insulation material, covered with plaster board on both sides. As mentioned previously, the real case was modified, and the new wall ratio was 76%.
The 19 alternatives were tested on the base case, as shown in Table 8. First, we increased the size of the block work from the original 4 to 6, 8, and 12 inches. Then, we added different types of insulation: Polystyrene with three different thicknesses, expanded polystyrene in three sizes, polyurethane in three sizes, expanded polyurethane in three sizes, mineral wool fiber in two sizes, and cellulose in two sizes; the details are given in Table 8. The simulation showed that the best option for the walls is 0.04 ft plaster board, 0.299 ft HW Concrete block (ConcBlk), 6-inch polyurethane, 0.333 ft HW ConcBlk, and 0.042 ft plaster board, which decreased the energy consumption of the building by 4.57%.
Based on the results summarized in the table above, the wall type 13 is the best alternative compared with other wall types. Indeed, with wall type 13, 4.57% of energy is saved compared with the base case.
3.3.4. Glazing and Frame Types
The glazing system of the Ajmal Makan building is made of a double reflective clear glass with a quarter-inch air gap with a fixed aluminum frame. The WWR in these calculations is the modified 24%, with the same properties as those of the real case. All of the alternatives were tested and run by eQUEST, which showed that the best option for improving the building’s performance is a double reflective glass with a half-inch air gap. The annual energy decrease was 0.89%. All of the alternatives are listed in Table 9.
3.3.5. Shading
The building is characterized by unique cantilevered overhangs, which serve as a shading system. We ran the simulation of the building without any overhang and found out that they contribute to energy savings of 1.99%. An additional 3 m in the North-West and South-East elevations led to a minor decrease of 0.19%. Table 10 presents the orientation and depth of the overhang alternatives.
3.3.6. HVAC System
It is also important to choose the right AC equipment for the right space for efficient energy saving. The Ajmal Makan building has a DX Series Fan-Powered VAV for cooling. Different systems were tested on the base case, which showed that Packaged VAV would save 8.34% of energy due to the better and more rational control of the amount of the air flow needed to satisfy the thermal comfort requirements in the space. Indeed, the electric power needed to run the ventilation fans is much higher in case of the package DX Series Fan-Powered VAV (25,440 kWh) compared with Packaged VAV (10,560 kWh). Table 11 shows the effects of different systems on the energy consumption of this building
4. Discussion
In the previous section, different alternatives were tested to determine the optimal alternatives that would improve the building’s performance in terms of energy saving. In Table 12, a matrix of the optimum alternatives is presented, which we refer to as the best case.
Table 13 presents the energy distribution breakdown of the best case. The total annual consumption of the best case is 97,570 kWh, which is 30.6% lower than that of the base case (140,710 kWh), with energy savings of 43,130 kWh per year.
By comparing the obtained results with those of the real case, we can conclude that the best case is 41.7% more efficient than the real case without the modified WWR. The simulation results and change ratios are presented in Table 14.
5. Conclusions
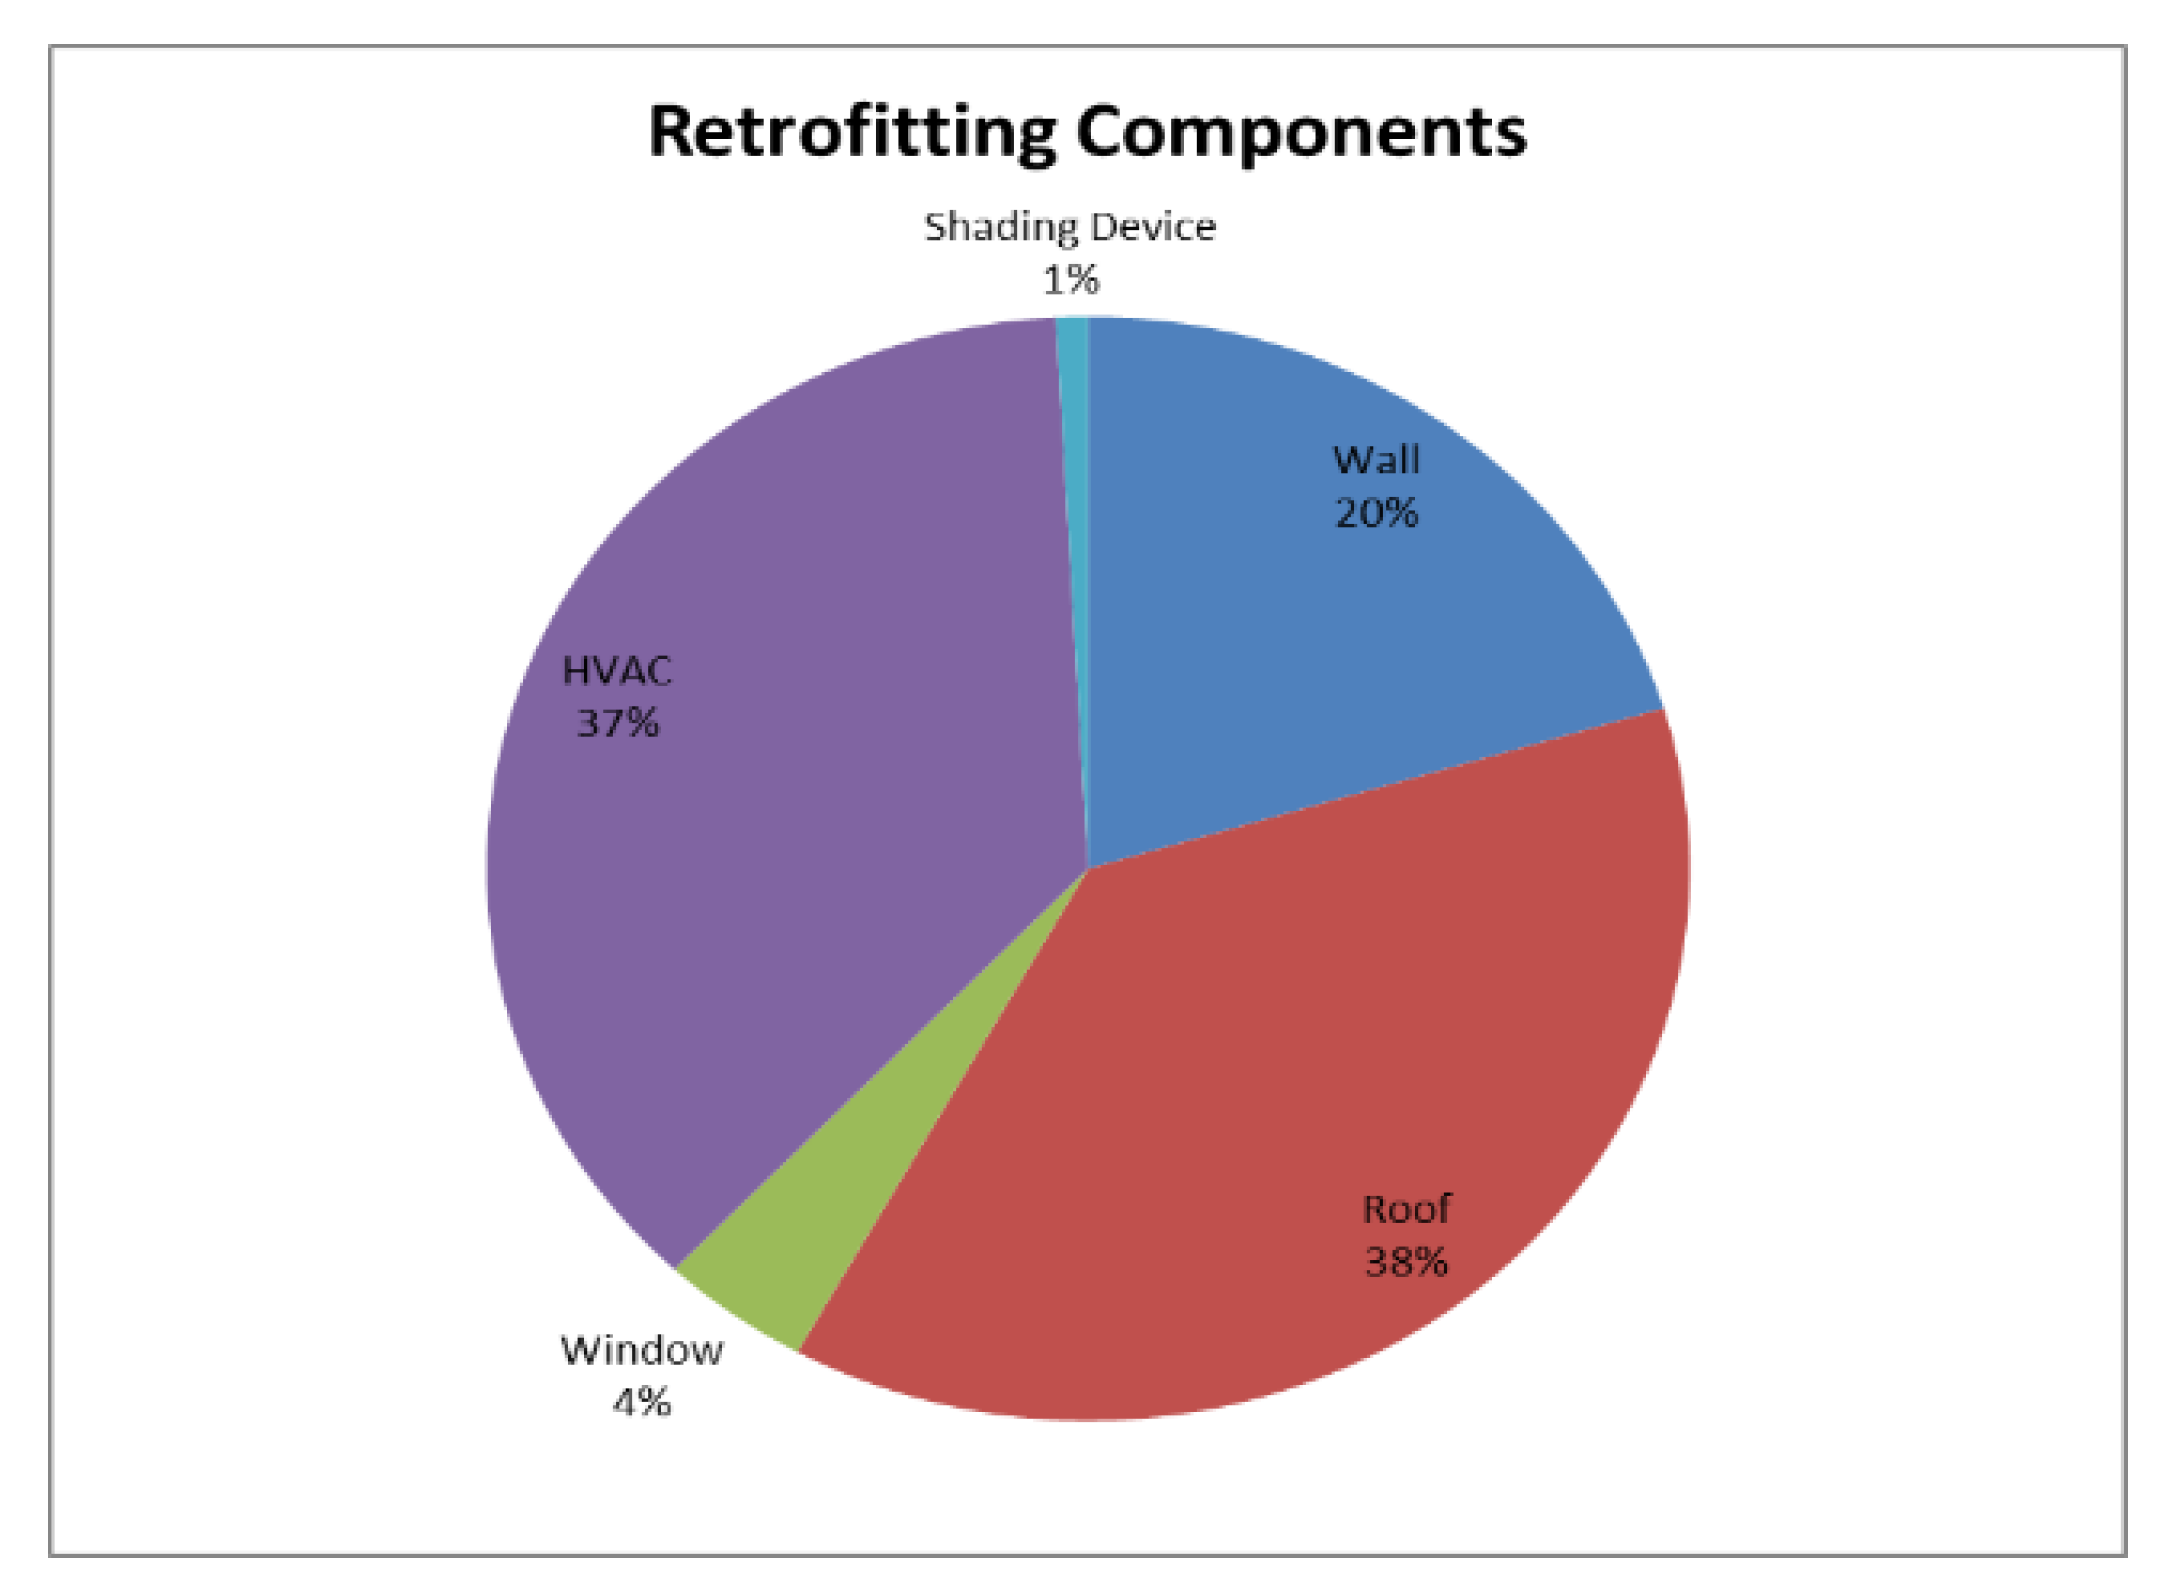
Among the five selected components, a new roof structure contributed the most to the decrease in energy consumption (approximately 38%). This is followed by a new HVAC system, which leads to a 37% decrease, followed by a new wall type with insulation, resulting in a 20% decrease. In addition, a glazing change led to a minimal decrease of 4%, while a new overhang resulted in a 1% decrease. The results are summarized in the pie chart in Figure 11. It is then strongly recommended to have the building envelope (roof and walls) well insulated and to select the most efficient AC system based on the type of the building and its occupancy.
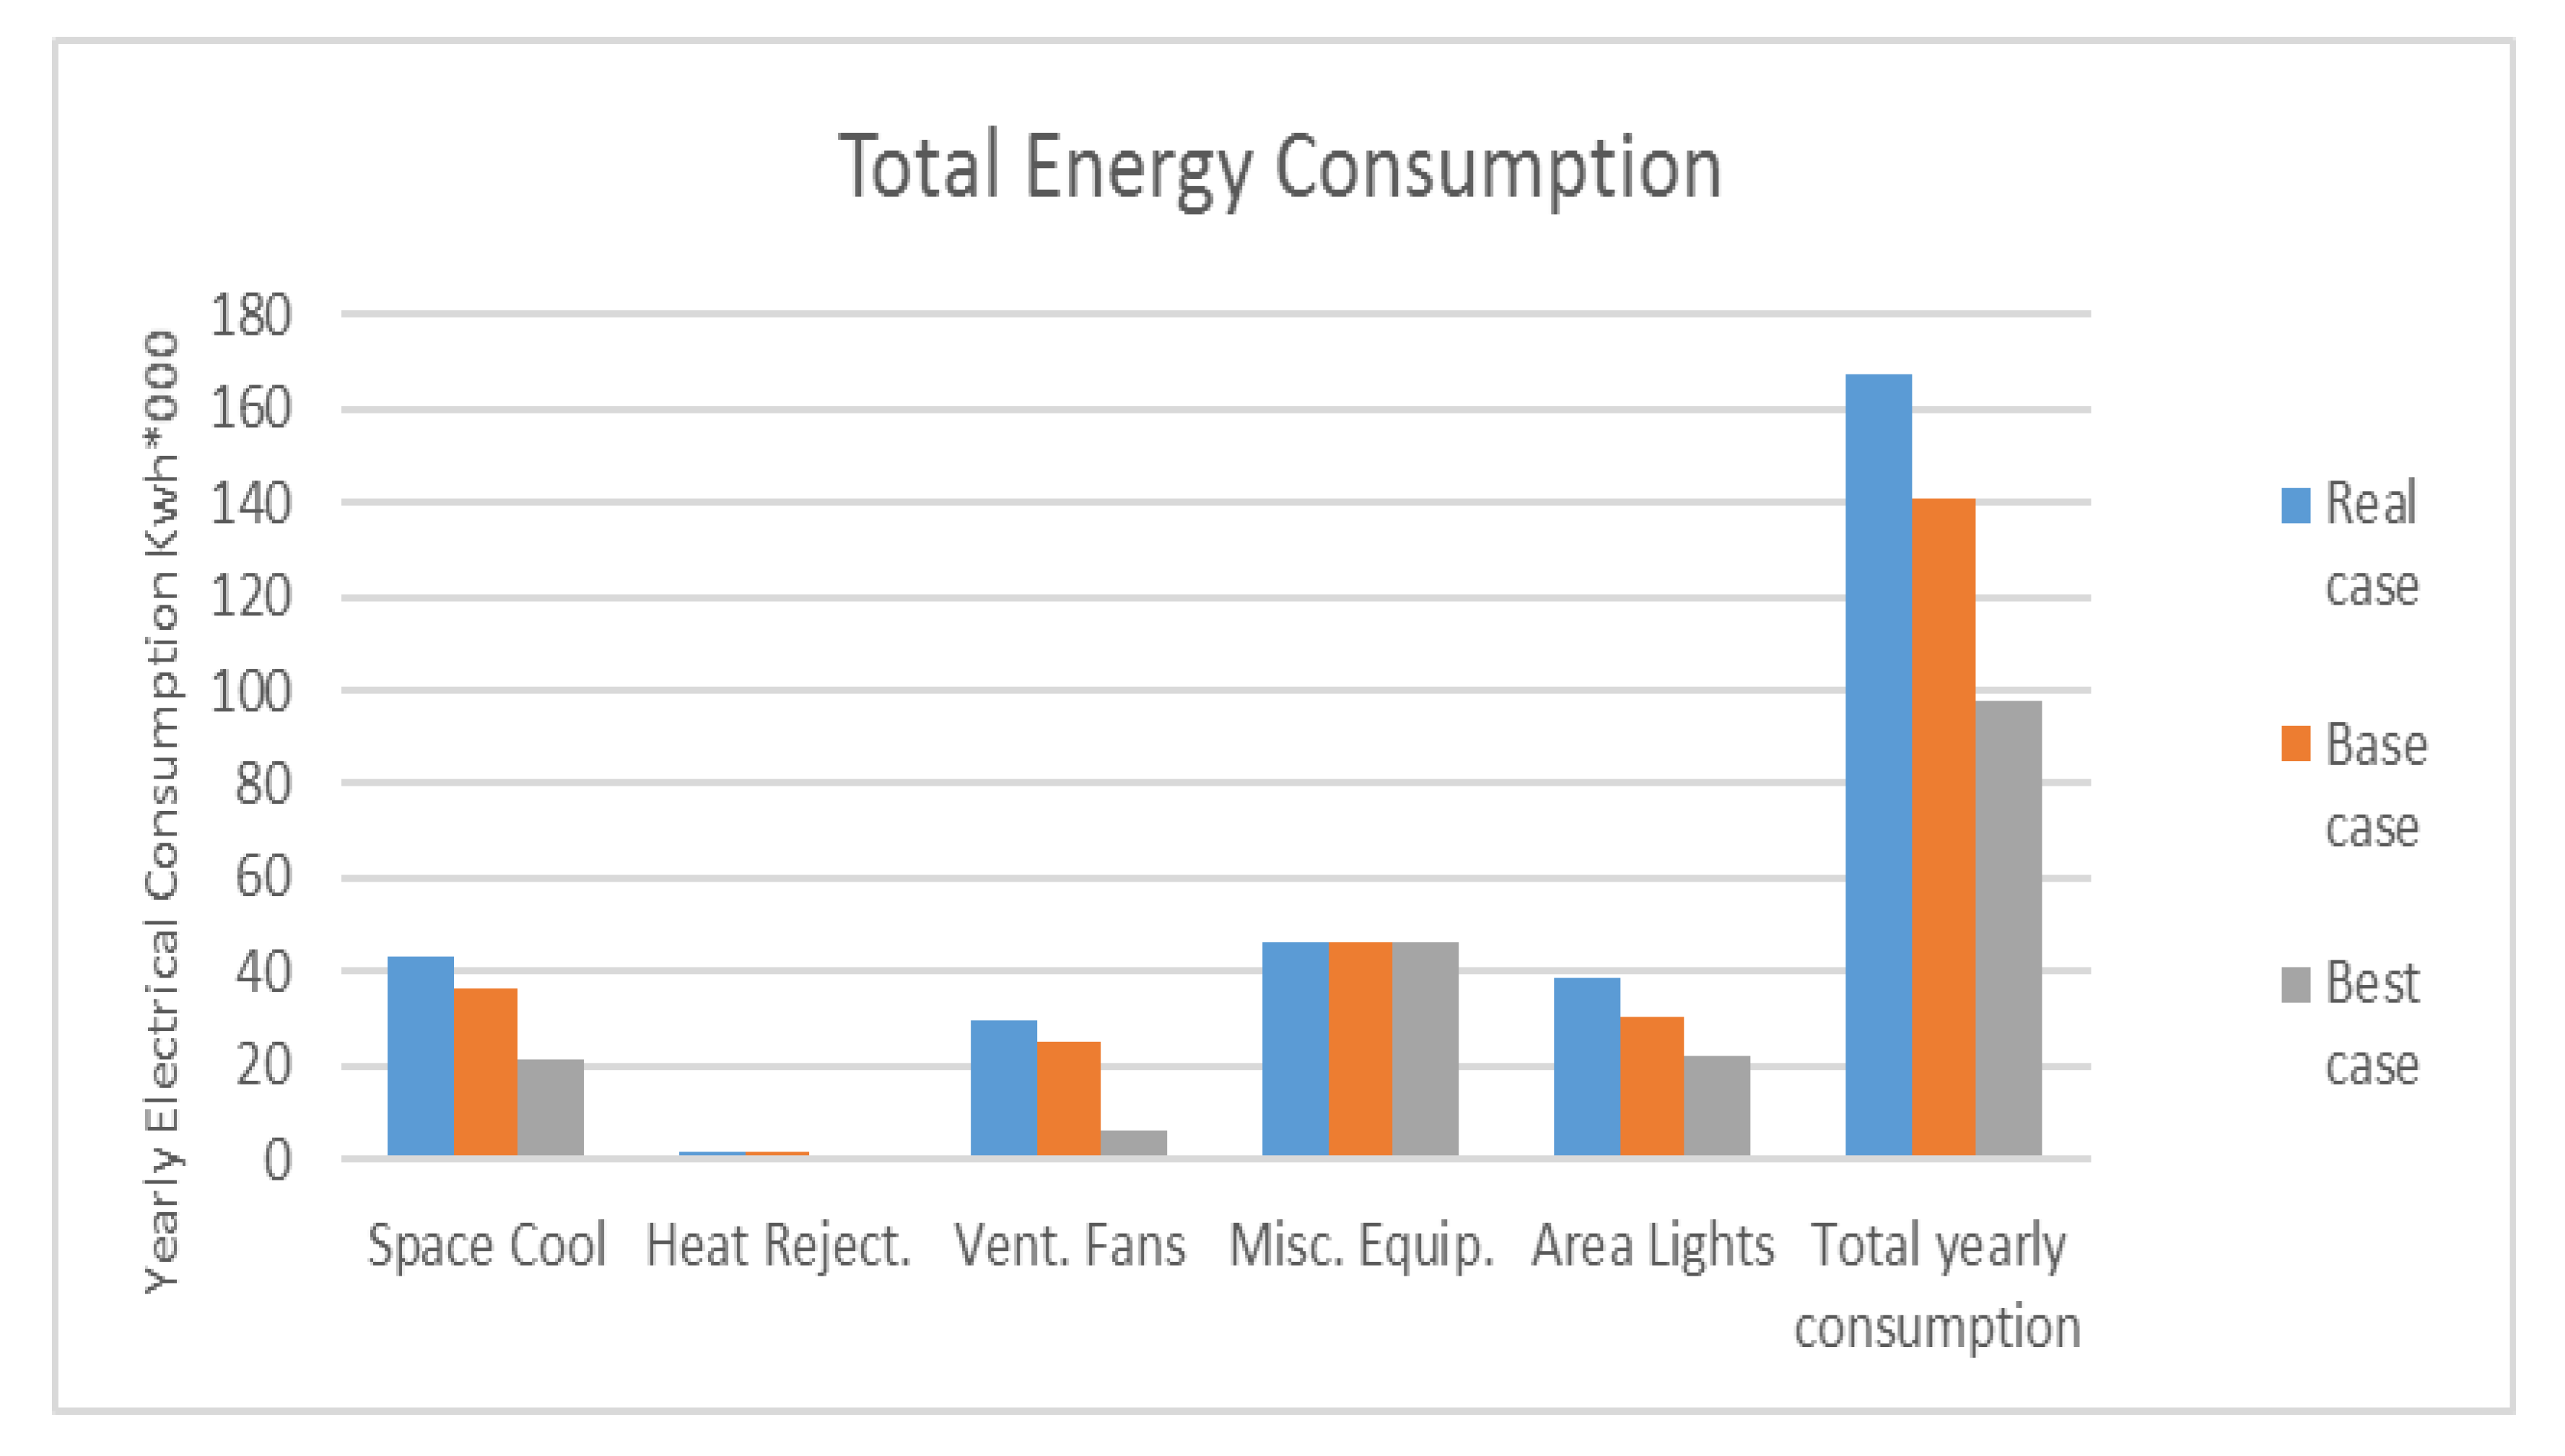
The software simulates five main categories, including space cooling, heat rejection, ventilation fans, mechanical equipment, and area lighting. Figure 12 shows the different percentages of energy consumption among the three schemes. Space cooling, ventilation fans, and area lighting have major shares in electrical consumption. The building components referred to in these categories are the building envelope and HVAC system, as mentioned earlier in the literature. Thus, in retrofitting strategies, we have to select the most sensitive parameters, which have significant impact on lowering energy consumption in buildings.
In conclusion, due to the location of the case study, the external weather (a harsh hot climate) exerts a huge pressure on the HVAC systems in buildings as well as the exposed surfaces of the buildings, such as roofs and walls. Therefore, it is important to design buildings by first studying the climate, wall and roof types, and different systems, which will contribute significantly in reducing the energy consumption. Moreover, the analysis of the cost of the implemented changes should be evaluated and included in the overall cost of saving energy; this will be considered as a future step.
Author Contributions
Conceptualization, M.K., A.F.D., and S.A.; methodology, M.K., A.F.D., and S.A.; software, A.F.D. and S.A.; validation, A.F.D. and S.A.; writing—review and editing, M.K. and A.F.D; supervision, M.K.; project administration, M.K. All authors have read and agreed to the published version of the manuscript.
Funding
This research received no external funding.
Conflicts of Interest
The authors declare no conflict of interest.
References
- Pérez-Lombard, L.; Ortiz, J.; Pout, C. A review on buildings energy consumption information. Energy Build. 2008, 40, 394–398. [Google Scholar] [CrossRef]
- EIA. Available online: https://www.eia.gov/environment/emissions/state/analysis/ (accessed on 27 February 2019).
- Yanga, L.; Yanab, H.; Joseph, C.L. Thermal comfort and building energy consumption implications—A review. Appl. Energy 2014, 115, 164–173. [Google Scholar] [CrossRef]
- Xing, Y.; Hewitt, N.; Griffiths, P. Zero carbon buildings refurbishment—A hierarchical pathway. Renew. Sustain. Energy Rev. 2011, 15, 3229–3236. [Google Scholar] [CrossRef]
- IEA. Available online: https://www.iea.org/newsroom/news/2011/april/iea-releases-first-clean-energy-progress-report.html (accessed on 6 April 2011).
- EMS. Available online: http://ems-int.com/blog/80-energy-consumed-by-buildings-in-uae/ (accessed on 24 September 2015).
- Abdelrahman, M.A.; Ahmad, A. Cost effective use of thermal insulation in hot climates. Build. Environ. 1994, 26, 189–194. [Google Scholar] [CrossRef]
- UNEP. 2016. Available online: https://edgar.jrc.ec.europa.eu/news_docs/onegigatonreport_2016.pdf (accessed on 1 November 2019).
- Patterson, M.G. What is energy efficiency? Concepts, indicators and methodological issues. Energy Policy 1996, 24, 377–390. [Google Scholar] [CrossRef]
- IEA. Available online: https://www.iea.org/publications/freepuplecation/Building2013_free.pdf (accessed on 10 October 2019).
- Paradis, R. Retrofitting Existing Buildings to Improve Sustainability and Energy Performance. In Proceedings of the 32nd International Conference on Passive and Low Energy Architecture: Cities, Buildings, People: Towards Regenerative Environments, Los Angeles, CA, USA, 11–13 July 2016. [Google Scholar]
- Koester, R.J.; Eflin, J.; Vann, J. Greening of the campus: A whole-systems approach. J. Clean. Prod. 2006, 14, 769–779. [Google Scholar] [CrossRef]
- World Green Building Council. Available online: https://www.worldgbc.org/about-us (accessed on 2 November 2019).
- Aghdaei, N.A. Energy Retrofitting of Existing Residential Buildings: Developing a Decision Process for Energy Saving and Cost Effectiveness. Ph.D. Thesis, Sustainable Buildings Research Centre, University of Wollongong, Wollongong, Australia, 2018. [Google Scholar]
- Amstalden, R.W.; Kost, M.; Nathani, C.; Imboden, D.M. Economic potential of energy-efficient retrofitting in the Swiss residential building sector: The effects of policy instruments and energy price expectations. Energy Policy 2007, 35, 1819–1829. [Google Scholar] [CrossRef]
- Huang, B.; Yang, H.; Mauerhofer, V.; Guo, R. Sustainability assessment of low carbon technologies–case study of the building sector in China. J. Clean. Prod. 2012, 32, 244–250. [Google Scholar] [CrossRef]
- Hensen, J.L.M. Building Simulation 2003—Final Report 8th International IBPSA Conference; International Building Performance Simulation Association (IBPSA): Technische Universiteit Eindhoven: Eindhoven, The Netherlands, 2004. [Google Scholar]
- Senel Solmaz, A.; Halicioglu, F.H.; Gunhan, S. An approach for making optimal decisions in building energy efficiency retrofit projects. Indoor Built Environ. 2018, 27, 348–368. [Google Scholar] [CrossRef]
- El-Gohary, C.M. A review of data-driven building energy consumption prediction studies. Renew. Sustain. Energy 2018, 81, 1192–1205. [Google Scholar]
- Esen, H.; Esen, M.; Ozsolak, O. Modelling and experimental performance analysis of solar-assisted ground source heat pump system. J. Exp. Theor. Artif. Intell. 2017, 29, 1–17. [Google Scholar]
- Abu Dhabi Planning Counsel. Public Realm Rating System: Design & Construction, Version 1.0. Available online: http://www.carboun.com/wp-content/uploads/2010/03/ThePearlsDesignSystem.pdf (accessed on 12 October 2019).
- Al Salmi, H.; Al Kadi, H.; Leao, S. Environmental Assessment Methods in Abu Dhabi. Int. J. Humanit. Soc. Sci. 2013, 7, 1573–1581. [Google Scholar]
- Ruppert, K.C.; Porter, W.A.; Cantrell, R.A.; Lee, H.-J. Energy Efficient Homes: Windows and Skylights, IFAS extension university of Florida. Available online: https://edis.ifas.ufl.edu (accessed on 25 October 2019).
- Ficco, G.; Iannetta, F.; Ianniello, E.; Romanad’Ambrosio Alfano, F.; Dell’Isola, M. U-value in situ measurement for energy diagnosis of existing buildings. Energy Build. 2015, 104, 108–121. [Google Scholar] [CrossRef]
- Geekiyanage, D.; Ramachandra, T. A model for estimating cooling energy demand at early design stage of condominiums. J. Build. Eng. 2018, 17, 43–51. [Google Scholar] [CrossRef]
- Ashrae Handbook. Available online: https://shop.iccsafe.org/media/wysiwyg/material/8950P204-toc.pdf (accessed on 25 October 2019).
- Bande, L.; Cabrera, A.G.; Kim, Y.K.; Ashura, A.; Ragusini, M.F.; Cooke, M.G. A Building Retrofit and Sensitivity Analysis in an Automatically Calibrated Model Considering the Urban Heat Island Effect in Abu Dhabi, UAE. Sustainability 2019, 11, 6905. [Google Scholar] [CrossRef] [Green Version]
- Abdullah, H.K.; Alibaba, H.Z. Retrofits for Energy Efficient Office Buildings: Integration of Optimized Photovoltaics in the Form of Responsive Shading Devices. Sustainability 2017, 9, 2096. [Google Scholar] [CrossRef] [Green Version]
- Aranda, J.; Zabalza, I.; Conserva, A.; Millán, G. Analysis of Energy Efficiency Measures and Retrofitting Solutions for Social Housing Buildings in Spain as a Way to Mitigate Energy Poverty. Sustainability 2017, 9, 1869. [Google Scholar] [CrossRef]
- Evangelisti, L.; Guattari, C.; Gori, P. Energy Retrofit Strategies for Residential Building Envelopes: An Italian Case Study of an Early-50s Building. Sustainability 2015, 7, 10445–10460. [Google Scholar] [CrossRef] [Green Version]
- Santamouris, M.; Dascalaki, E. Passive retrotting of o”ce buildings to improve their energy performance and indoor environment: The OFFICE project. Build. Environ. 2002, 37, 575–578. [Google Scholar] [CrossRef]
- Available online: https://sites.google.com/site/hvacsystemvarietyae390/vav---major-system/numeric-parameters (accessed on 12 October 2019).
- Available online: https://www.ashrae.org/File%20Library/Technical%20Resources/Standards%20and%20Guidelines/Standards%20Addenda/90_1_2007_Supplement.pdf (accessed on 13 October 2019).
Figure 1.
Global energy usage by territory [1].
Figure 1.
Global energy usage by territory [1].

Figure 2.
US energy consumption in the building sector.

Figure 3.
Aerial view of the Ajmal Makan office building in Sharjah, UAE.

Figure 4.
July electric authority bill for the Ajmal Makan office building.

Figure 5.
(A) Average min and max temperatures; (B) average relative humidity in Sharjah, UAE.


Figure 6.
Revit model at 1 pm on April 28, presenting the orientation, sun path, wind, temperature, and comfort hours throughout the year.
Figure 6.
Revit model at 1 pm on April 28, presenting the orientation, sun path, wind, temperature, and comfort hours throughout the year.

Figure 7.
Psychrometric chart of Abu Dhabi presenting the numbers of comfortable and uncomfortable hours during the year [32].
Figure 7.
Psychrometric chart of Abu Dhabi presenting the numbers of comfortable and uncomfortable hours during the year [32].

Figure 8.
3D modeling of the Ajmal Makan office building: (A) WWR real case; (B) WWR base case.

Figure 9.
Yearly energy consumption for the real case and base case modified.

Figure 10.
Building orientation, 22° from the north, indicated on a compass (Google).

Figure 11.
Best-case retrofitting components.

Figure 12.
Yearly energy consumption for the real case, base case, and best case.


Table 1.
Case study description of Ajmal Makan office building.
| Building Type | Office Building |
|---|---|
| Total area | 2000 m2 |
| Floor number | 1 floor |
| Windows | 91% of the windows in three directions and 0% in the west direction |
| Walls | exterior finish on 8” concrete blocks with no insulation; interior finish of fish plaster U-value = 2.49 W/m2 K |
| Roof construction | U-value = 1.0 W/m2 K |
| Floor construction | slab on grade, unheated, exposed, or tiled |
| Natural ventilation | None |
| Heating source | None |
| Cooling: air conditioning | packaged DX series fan powered VAV no reheat |
| Operable shading | overhangs East 7 m/South 4 m/North 4 m |
Table 2.
Real case simulation results: The energy consumption of the Ajmal Makan office building during the year (kWh × 1000) depending on space cooling, heat rejection, ventilation fans, mechanical equipment, and area lighting.
Table 2.
Real case simulation results: The energy consumption of the Ajmal Makan office building during the year (kWh × 1000) depending on space cooling, heat rejection, ventilation fans, mechanical equipment, and area lighting.
| Real Case | Jan | Feb | Mar | Apr | May | Jun | Jul | Aug | Sep | Oct | Nov | Dec | Total |
|---|---|---|---|---|---|---|---|---|---|---|---|---|---|
| Space Cool | 0.59 | 0.75 | 1.42 | 4.2 | 5.29 | 5.63 | 6.26 | 6.23 | 5.6 | 4.98 | 1.46 | 0.91 | 43.32 |
| Heat Reject | 0.06 | 0.06 | 0.08 | 0.2 | 0.2 | 0.19 | 0.2 | 0.2 | 0.19 | 0.2 | 0.08 | 0.08 | 1.76 |
| Vent. Fans | 0.72 | 0.76 | 1.23 | 3.42 | 3.61 | 3.47 | 3.61 | 3.61 | 3.47 | 3.6 | 1.17 | 0.87 | 29.55 |
| Misc. Equip | 4.52 | 4.13 | 4.63 | 4.57 | 4.63 | 4.46 | 4.63 | 4.63 | 4.46 | 4.63 | 4.24 | 4.63 | 46.7 |
| Area Lights | 3.59 | 3.3 | 3.72 | 3.02 | 3.03 | 2.91 | 3.03 | 3.03 | 2.91 | 3.03 | 3.32 | 3.72 | 38.62 |
| Total | 9.48 | 8.99 | 11.08 | 15.4 | 16.76 | 16.67 | 17.72 | 17.7 | 16.64 | 16.44 | 10.28 | 10.21 | 167.38 |
Table 3.
Base case window-to-wall ratio (WWR) calculation.
| Elevation | Glazing Area (m2) | Elevation (m2) | WWR (%) |
|---|---|---|---|
| North | 424 | 464 | 91.3 |
| East | 132.5 | 145 | 91.3 |
| South | 424 | 464 | 91.3 |
| West | 0 | 145 | 0 |
Table 4.
Modified case window to wall ratio (WWR) calculation.
| Ideal WWR is 24% by Ashrae [33] | |||
|---|---|---|---|
| Elevation | Glazing area (m2) | Elevation (m2) | WWR (%) |
| North | 111.36 | 464 | 24 |
| East | 34.8 | 145 | 24 |
| South | 111.36 | 464 | 24 |
| West | 34.8 | 145 | 24 |
Table 5.
Base-case energy consumption (kWh × 1000) (real case modified with the new WWR).
| Base Case | Jan | Feb | Mar | Apr | May | Jun | Jul | Aug | Sep | Oct | Nov | Dec | Total |
|---|---|---|---|---|---|---|---|---|---|---|---|---|---|
| Space Cool | 0.47 | 0.55 | 1.08 | 3.46 | 4.37 | 4.68 | 5.22 | 5.2 | 4.67 | 4.13 | 1.67 | 0.63 | 36.14 |
| Heat Reject. | 0.06 | 0.05 | 0.08 | 0.18 | 0.18 | 0.18 | 0.18 | 0.18 | 0.18 | 0.18 | 0.16 | 0.08 | 1.68 |
| Vent. Fans | 0.6 | 0.6 | 0.99 | 2.92 | 3.05 | 2.94 | 3.05 | 3.05 | 2.94 | 3.05 | 1.56 | 0.67 | 25.44 |
| Misc. Equip. | 3.01 | 2.74 | 3.06 | 4.57 | 4.63 | 4.46 | 4.63 | 4.63 | 4.46 | 4.63 | 2.85 | 3.06 | 46.7 |
| Area Lights | 1.99 | 1.83 | 2.06 | 3.02 | 3.03 | 2.91 | 3.03 | 3.03 | 2.91 | 3.03 | 1.85 | 2.06 | 30.75 |
| Total | 6.13 | 5.77 | 7.26 | 14.15 | 15.27 | 15.17 | 16.11 | 16.1 | 15.15 | 15.03 | 8.09 | 6.49 | 140.71 |
Table 6.
Orientation alternatives with energy consumption (kWh × 1000).
| Orientation | Total Energy Consumption kWh × 1000 |
|---|---|
| Base case NNW | 140.71 |
| East-South-East | 145.59 |
| South-South-West | 143.99 |
| West-North-West | 145.33 |
Table 7.
Roof alternatives with energy consumption (kWh × 1000).
| Roof Type | Construction | U-Value (W/m2 K) | Total Energy Consumption (kWh × 1000) | Decrease Energy (%) |
|---|---|---|---|---|
| 1 | 1 inch cement mortar, 0.164 ft, HW concrete, ½ inch expanded polystyrene, 4 inch HW ConcBlk | 1 | 140.71 | - |
| 2 | 1 inch cement mortar, 0.164 ft HW concrete, 4 inch expanded polystyrene, 4 inch HW ConcBlk | 0.27 | 130.19 | 7.47 |
| 3 | 1 inch cement mortar, 0.164 ft HW concrete, 4 inch polystyrene, 4 inch HW ConcBlk | 0.23 | 129.64 | 7.86 |
| 4 | 1 inch cement mortar, 0.164 ft HW concrete, 6 inch polystyrene, 4 inch HW ConcBlk | 0.15 | 128.84 | 8.43 |
| 5 | 1 inch cement mortar, 0.164 ft HW concrete, 4 inch expanded polyurethane, 4 inch HW ConcBlk | 0.19 | 129.24 | 8.15 |
| 6 | 1 inch cement mortar, 0.164 ft HW concrete, 1 inch preformed roof insulator, 4 inch HW ConcBlk | 0.9 | 136.53 | 2.97 |
| 7 | 1 inch cement mortar, 0.164 ft HW concrete, 2 inch preformed roof insulator, 4 inch HW ConcBlk | 0.6 | 133.89 | 4.84 |
| 8 | 1 inch cement mortar, 0.164 ft HW concrete, 3 inch preformed roof insulator, 4 inch HW ConcBlk | 0.45 | 132.38 | 5.91 |
Table 8.
Wall alternatives with energy consumption (kWh × 1000).
| Wall Type | Construction | U-Value (W/m2 K) | Total Energy Consumption (kWh × 1000) | Decrease in Energy (%) |
|---|---|---|---|---|
| 1 | Plaster board, 4 inch HW ConcBlk, no insulation, 4 inch HW ConcBlk, plaster board | 2.49 | 140.71 | - |
| 2 | Plaster board, 6 inch HW ConcBlk, no insulation, 6 inch HW ConcBlk, plaster board | 2.1 | 139.32 | 0.98 |
| 3 | Plaster board, 8 inch HW ConcBlk, no insulation, 8 inch HW ConcBlk, plaster board | 1.82 | 138.68 | 1.44 |
| 4 | Plaster board, 12 inch HW ConcBlk, no insulation, 12 inch HW ConcBlk, plaster board | 1.5 | 138.4 | 1.64 |
| 5 | 0.04 ft plaster board, 0.299 ft HW ConcBlk, polystyrene 4 inch, 0.333 ft HW ConcBlk, 0.042 plaster board | 0.245 | 134.83 | 4.17 |
| 6 | 0.04 ft plaster board, 0.299 ft HW ConcBlk, polystyrene 6 inch, 0.333 ft HW ConcBlk, 0.042 plaster board | 0.198 | 134.59 | 4.35 |
| 7 | 0.04 ft plaster board, 0.299 ft HW ConcBlk, polystyrene 6 inch, 0.333 ft HW ConcBlk, 0.042 plaster board | 0.169 | 134.46 | 4.44 |
| 8 | 0.04 ft plaster board, 0.299 ft HW ConcBlk, expanded polystyrene 1 inch, 0.333 ft HW ConcBlk, 0.042 plaster board | 0.88 | 136.99 | 2.64 |
| 9 | 0.04 ft plaster board, 0.299 ft HW ConcBlk, expanded polystyrene 2 inch, 0.333 ft HW ConcBlk, 0.042 plaster board | 0.536 | 135.82 | 3.47 |
| 10 | 0.04 ft plaster board, 0.299 ft HW ConcBlk, expanded polystyrene 4 inch, 0.333 ft HW ConcBlk, 0.042 plaster board | 0.295 | 134.9 | 4.12 |
| 11 | 0.04 ft plaster board, 0.299 ft HW ConcBlk, polyurethane 3 inch, 0.333 ft HW ConcBlk, 0.042 plaster board | 0.26 | 134.85 | 4.16 |
| 12 | 0.04 ft plaster board, 0.299 ft HW ConcBlk, polyurethane 5 inch, 0.333 ft HW ConcBlk, 0.042 plaster board | 0.164 | 134.46 | 4.44 |
| 13 | 0.04 ft plaster board, 0.299 ft HW ConcBlk, polyurethane 6 inch, 0.333 ft HW ConcBlk, 0.042 plaster board | 0.141 | 134.36 | 4.51 |
| 14 | 0.04 ft plaster board, 0.299 ft HW ConcBlk, expanded polyurethane 1 inch, 0.333 ft HW ConcBlk, 0.042 plaster board | 0.66 | 136.27 | 3.15 |
| 15 | 0.04 ft plaster board, 0.299 ft HW ConcBlk, expanded polyurethane 2 inch, 0.333 ft HW ConcBlk, 0.042 plaster board | 0.38 | 135.28 | 3.86 |
| 16 | 0.04 ft plaster board, 0.299 ft HW ConcBlk, expanded polyurethane 4 inch, 0.333 ft HW ConcBlk, 0.042 plaster board | 0.2 | 134.62 | 4.33 |
| 17 | 0.04 ft plaster board, 0.299 ft HW ConcBlk, mineral wood, fiber 3-1/2 inch, 0.333 ft HW ConcBlk, 0.042 plaster board | 0.43 | 135.47 | 3.72 |
| 18 | 0.04 ft plaster board, 0.299 ft HW ConcBlk, mineral wood, fiber 5-1/2 inch, 0.333 ft HW ConcBlk, 0.042 plaster board | 0.29 | 135.96 | 3.37 |
| 19 | 0.04 ft plaster board, 0.299 ft HW ConcBlk, cellulose 3-1/2 inch, 0.333 ft HW ConcBlk, 0.042 plaster board | 0.36 | 135.2 | 3.91 |
| 20 | 0.04 ft plaster board, 0.299 ft HW ConcBlk, cellulose 5-1/2 inch, 0.333 ft HW ConcBlk, 0.042 plaster board | 0.24 | 134.74 | 4.24 |
Table 9.
Window alternatives with energy consumption (kWh × 1000).
| Window Alternative | Construction | Total Energy Consumption (kWh × 1000) | Decrease Energy (%) |
|---|---|---|---|
| 1 | Double reflective clear ¼ inch, ¼ air gap | 140.71 | Base case |
| 2 | Single clear | 159.35 | −13.24 |
| 3 | Single reflective | 143.43 | −1.93 |
| 4 | Single low-E | 155.19 | −10.29 |
| 5 | Double clear | 151.7 | −7.81 |
| 6 | Double reflective | 139.51 | 0.85 |
| 7 | Double low-E | 152.57 | −8.42 |
| 8 | Triple clear | 150.19 | −6.73 |
| 9 | Triple clear | 147.8 | 5.04 |
Table 10.
Shading alternatives with energy consumption (kWh × 1000) (eQUEST software).
| Overhang Type | Orientation | Depth (m) | Total Energy Consumption (kWh × 1000) | Decrease Energy (%) |
|---|---|---|---|---|
| 1 | SW, NE, NW, SE | 0, 7, 4, 4 | 140.71 | Real case |
| 2 | SW, NE, NW, SE | 0, 0, 0, 0 | 143.59 | −2.05% |
| 3 | SW, NE, NW, SE | 0, 7, 7, 7 | 140.52 | 0.13% |
Table 11.
Heating, ventilation, and air conditioning (HVAC) alternatives with energy consumption (kWh × 1000) (eQUEST software).
Table 11.
Heating, ventilation, and air conditioning (HVAC) alternatives with energy consumption (kWh × 1000) (eQUEST software).
| HVAC | Cooling Source | System | Total Energy Consumption (kWh × 1000) | Decrease Energy (%) |
|---|---|---|---|---|
| 1 | DX Coils | DX series fan-powered VAV | 140.71 | Base case |
| 2 | DX Coils | Packaged VAV | 129.05 | 8.28 |
| 3 | Chilled water coils | Standard VAV | 196.22 | −39.44 |
| 4 | Chilled water coils | Series fan-powered VAV | 193.51 | −37.52 |
| 5 | Chilled water coils | Single-zone air handler | 217.37 | −54.48 |
Table 12.
Optimum alternatives with total energy consumption (best-case alternative).
| Element | Description | Total Energy Consumption (kWh × 1000) | Decrease Energy (%) |
|---|---|---|---|
| Base case | 140.71 | - | |
| Wall | 0.04 ft plaster board, 0.299 ft HW ConcBlk, polystyrene 6 inch, 0.333 ft HW ConcBlk, 0.042 plaster board | 134.36 | 4.51 |
| Roof | 1 inch cement mortar, 0.166 ft HW concrete, 6 inch polystyrene, 4 inch HW ConcBlk | 128.84 | 8.43 |
| Glazing and frame | Double reflective ½ inch air gap with fixed aluminum with break | 139.51 | 0.85 |
| HVAC | DX coils, packaged VAV | 129.05 | 8.28 |
| Shading device | Overhang, SW = 0, NE = 7, NW = 7, SE = 7 | 140.52 | 0.13 |
Table 13.
Energy distribution breakdown of the best case.
| Best Case | Jan | Feb | Mar | Apr | May | Jun | Jul | Aug | Sep | Oct | Nov | Dec | Total kWh × 1000 |
|---|---|---|---|---|---|---|---|---|---|---|---|---|---|
| Space Cool | 0.25 | 0.35 | 0.66 | 1.92 | 2.41 | 2.73 | 3.17 | 3.18 | 2.81 | 2.41 | 1.1 | 0.6 | 21.6 |
| Heat Reject. | 0.03 | 0.03 | 0.05 | 0.11 | 0.11 | 0.11 | 0.11 | 0.11 | 0.11 | 0.11 | 0.09 | 0.05 | 1.03 |
| Vent. Fans | 0.05 | 0.1 | 0.26 | 0.71 | 0.71 | 0.69 | 0.71 | 0.71 | 0.69 | 0.71 | 0.32 | 0.26 | 5.93 |
| Misc. Equip. | 3.01 | 2.74 | 3.06 | 4.57 | 4.63 | 4.46 | 4.63 | 4.63 | 4.46 | 4.63 | 2.85 | 3.06 | 46.7 |
| Area Lights | 1.45 | 1.33 | 1.49 | 2.19 | 2.2 | 2.12 | 2.2 | 2.2 | 2.12 | 2.2 | 1.35 | 1.49 | 22.32 |
| Total | 4.79 | 4.54 | 5.52 | 9.5 | 10.06 | 10.1 | 10.82 | 10.84 | 10.18 | 10.06 | 5.71 | 5.46 | 97.57 |
Table 14.
Annual energy consumption ratios of the real case, the base case, and the best case.
| Annual Energy Consumption (kWh × 1000) | Decrease Ratio (%) | |
|---|---|---|
| Real Case | 167.38 | - |
| Base Case (modified) | 140.71 | 30.60 |
| Best Case | 97.57 | 41.70 |
© 2020 by the authors. Licensee MDPI, Basel, Switzerland. This article is an open access article distributed under the terms and conditions of the Creative Commons Attribution (CC BY) license (http://creativecommons.org/licenses/by/4.0/).
Share and Cite
MDPI and ACS Style
Khoukhi, M.; Darsaleh, A.F.; Ali, S. Retrofitting an Existing Office Building in the UAE Towards Achieving Low-Energy Building. Sustainability 2020, 12, 2573. https://0-doi-org.brum.beds.ac.uk/10.3390/su12062573
AMA Style
Khoukhi M, Darsaleh AF, Ali S. Retrofitting an Existing Office Building in the UAE Towards Achieving Low-Energy Building. Sustainability. 2020; 12(6):2573. https://0-doi-org.brum.beds.ac.uk/10.3390/su12062573
Chicago/Turabian StyleKhoukhi, Maatouk, Abeer Fuad Darsaleh, and Sara Ali. 2020. "Retrofitting an Existing Office Building in the UAE Towards Achieving Low-Energy Building" Sustainability 12, no. 6: 2573. https://0-doi-org.brum.beds.ac.uk/10.3390/su12062573
Note that from the first issue of 2016, this journal uses article numbers instead of page numbers. See further details here.