Credible Sources of Information Regarding Induced Seismicity


Department of Civil, Environmental, and Architectural Engineering, University of Colorado Boulder, Boulder 80309, CO, USA
*
Author to whom correspondence should be addressed.
Sustainability 2020, 12(6), 2308; https://0-doi-org.brum.beds.ac.uk/10.3390/su12062308
Submission received: 11 February 2020
/
Revised: 10 March 2020
/
Accepted: 13 March 2020
/
Published: 16 March 2020
(This article belongs to the Special Issue Communication on Sustainability in Universities: A Bridge between Academia and Society)
Abstract
:The central United States has seen an increase in earthquakes in recent years, spurring academics to research this new hazard and communicate their findings to the public—that the earthquakes are human-induced and tied to activities associated with oil and gas development. However, individuals receive information from a variety of sources and accept or reject information based on how credible they view the information source. Within this study, we administered and analyzed a household survey to understand what sources individuals view as credible regarding induced seismicity and oil and gas development, and what factors predict this perceived source credibility. We found that academics were viewed as the most credible source, and elected officials were viewed as the least credible source. Rural respondents viewed sources, including academics, as less credible than their urban counterparts. Those who experienced more negative impacts of induced seismicity viewed all sources as less credible than did individuals who have not experienced such adverse impacts. These findings are important to consider when developing outreach and communication campaigns around sustainability issues, as the public will view certain sources, particularly academics, as more credible than the sources that traditionally create and enact policy, such as elected officials and government agencies.
1. Introduction
Over the last decade, there has been an increase in the frequency and magnitude of earthquakes in the central United States, affecting states as far west as Texas and Colorado and as far east as Ohio. Scientific researchers have neared consensus that these earthquakes are largely induced by the injection of large amounts of “produced” wastewater deep underground, a process often associated with oil and gas production via hydraulic fracturing [1]. However, other explanations have been offered—such as wind farms [2] or drought–rainfall cycles [3] causing the earthquakes—creating uncertainty in the public as to the “true” cause of the quakes and who is a credible source of information.
This work builds on research from energy and environmental sociology, risk perceptions, and science communication by examining source credibility regarding induced seismicity (human-made earthquakes) and oil and gas development. This paper presents results from a household survey of four communities—two in Oklahoma and two in Colorado—that have experienced varying degrees of induced seismicity [4]. Specifically, we examined which sources of information are viewed as credible regarding the earthquakes and oil and gas development, and what factors predict or influence credibility for different sources.
1.1. Induced Seismicity in the United States
Historically, the central United States is a region not known for its seismic activity. In recent years this has changed, as an increasing number of earthquakes have occurred in this region. While Oklahoma has experienced the greatest number of earthquakes in the past decade [4], at least eight U.S. states in the Midwest and western plains have experienced earthquakes that are thought to be linked to deep well fluid injection, a process often associated with oil and gas development [5,6,7]. While the frequency and magnitude of these earthquakes have spiked in the past decade, there is a history of similar fluid injection-induced seismicity in this region. For instance, in the early 1960s, the injection of chemical waste fluid deep underground at the U.S. Army’s Rocky Mountain Arsenal induced a series of earthquakes near Denver, Colorado [8,9].
These earthquakes behave differently than the “natural” earthquakes seen in places such as the west coast of the United States. For example, they often occur in “swarms”, sometimes dozens of low magnitude earthquakes in the span of a day or two, instead of a single large earthquake with a low number of foreshocks and aftershocks, as may be seen in the state of California [5]. These earthquakes are often of lower magnitude, often in the M 2.0–M 4.0 range, which is not notable in more seismically active regions, but they also occur closer to the earth’s surface [10]. Most importantly, these earthquakes are occurring in states where infrastructure is not built with seismic hazards in mind, and thus pose a similar hazard to infrastructure in these regions as larger earthquakes pose in regions with more robust seismic design codes [11,12]. Though these induced earthquakes are generally lower in magnitude than the natural earthquakes experienced on the west coast of the United States, they have resulted in property damage [13], reduced property values [14], and increased feelings of anxiety and uncertainty in affected members of the public [15].
In addition to posing various risks to the public, these earthquakes can be contentious, as the risk is new and the cause of the earthquakes is debated. While the Denver earthquakes in the early 1960s were caused by injecting chemical wastes underground, the induced earthquakes of the past decade were caused by the injection of produced water, a by-product of oil and gas development and one often associated with hydraulic fracturing [7].
1.2. Hydraulic Fracturing and the Impacts of Oil and Gas Development
Hydraulic fracturing, sometimes called “unconventional” oil and gas development, is a process used to extract oil and natural gas from otherwise inaccessible mineral deposits, generally tight sand and shale formations. This process uses a combination of water, sand, and chemicals to fracture open mineral deposits and allow oil and gas that would otherwise be trapped to flow back to the surface for collection [16].
Recent advances in hydraulic fracturing and other mineral extraction methods have led to a boom in domestic energy production in the United States [17,18]. This boom has resulted in numerous benefits, largely economic, as well as negative impacts, including environmental risks to water and air quality, and societal nuisances such as increased noise and traffic levels in communities with development [19,20,21,22]. With both positive and negative impacts, the American public is divided, with some supporting, and others opposing, the use of hydraulic fracturing specifically, and oil and gas development broadly [23,24], making it a politicized and contentious topic. As such, opposing parties put forth different narratives that support their view of oil and gas development and the associated risks and benefits [19,25,26,27]. As a result, the public is left with contrasting viewpoints and must evaluate these different sources of information.
1.3. Induced Seismicity in Oil and Gas Development
Many of the risks and benefits associated with oil and gas development are well known and researched [28,29]. However, while many of the community impacts of oil and gas development have been the same for decades, the rise of induced seismicity necessitates further research, both regarding the risks of induced seismicity and communication of these risks to the public. Given the contentious state of the topic and the different information being proposed by academic vs. nonacademic sources, it is also important to understand the credibility of academics and other information sources, who espouse contrasting views.
Many instances of induced seismicity in the United States are caused by the deep injection of wastewater underground. This water originates during the extraction process as “produced” water, or water that was initially trapped with the oil and gas deposits and is extracted, along with minerals. This water is produced in both hydraulic fracturing operations and conventional oil and gas development, though it is often mistakenly associated only with hydraulic fracturing [7]. In much of the United States, oil and gas companies dispose of this produced water by injecting it deep underground. There are also instances, including a small number of cases in the United States, as well as several in Canada and the Netherlands, of hydraulic fracturing itself causing earthquakes [7,30], which cause people to associate hydraulic fracturing with the earthquakes caused by wastewater injection.
Though there is broad scientific consensus that the cause of the majority of earthquakes in the central United States is wastewater injection associated with oil and gas development, competing theories have been proposed. The most prominent alternative theory is that the earthquakes are naturally occurring and not tied to oil and gas development [31,32], though other theories, such as wind energy development or extreme drought–rainfall cycles causing the earthquakes, also persist in the public discourse [2,3]. The opposing viewpoints have hampered efforts at effectively communicating the facts of this issue to the public, and subsequently enacting policy to mitigate earthquake risk, be it through regulating injection practices to reduce the likelihood of earthquakes or to change building practices and codes to reduce their impact. With this disconnect, it is important to understand why scientifically backed evidence from the academy is not being universally accepted, and how competing sources of information are being viewed by individuals. Though there is a large body of research that examines community perceptions of oil and gas development and their risks [29], there is little research that incorporates how individual perceptions and experiences influence how credibly individuals view different information sources regarding oil and gas development and, relatedly, induced seismicity. Our work addresses this need by answering the following research questions:
RQ1: How credible are different sources of information perceived as being regarding (a) oil and gas development and (b) induced seismicity?
RQ2: What factors affect the perceived credibility of information sources regarding oil and gas development and induced seismicity?
The topics of induced seismicity and oil and gas development are being explored together because of the relative novelty of seismicity associated with oil and gas in the United States. In examining these topics concurrently, we can understand if individuals view these issues, and in turn the credibility of sources, as related, or if they are viewed as distinct from each other. This work serves as a case study of understanding the credibility of academics, as well as other sources, regarding contentious, novel hazards—in this case, induced seismicity.
2. Literature Review and Development of Survey Constructs
In order to best address these research questions, we reviewed literature from multiple fields, including psychology, science communication, risk perceptions, and environmental sociology, on source credibility and factors predicting source credibility. This information was used to develop items for a community household survey.
2.1. Source Credibility
When academics communicate scientific knowledge to the public, they sometimes fall into the trap of thinking that the public simply does not have all the information that is available to the experts [33,34]. This classic line of thinking—“If only the public had more information, then they would understand the issue (and agree with me, the expert)”—is now known as the “deficit model” within the field of science communication. While this model has been frequently used to communicate science for years, it has largely been disproven, or is at least viewed as incomplete (e.g., [35]). While getting scientific findings from the academy to the public is a prerequisite for individuals to understand science, where the information originates from, who conveys that information, what the personal identity of the audience is, and how the information is framed are all important factors in understanding how the information is actually received by the audience [36,37].
Given the importance of the source of the information in communication, we focused on how individuals view different sources of information. To do this, our survey measured how credible respondents perceive academics and six other types of sources to be. Credibility is defined uniquely by different researchers, but commonalities across many definitions are that the source provides information that is viewed as accurate, valuable, and presented in a responsible manner [38,39]; more concisely, a source is credible if the information presented by them is believable or persuasive [37,38,39,40]. It is important to note that studies examining source credibility go back decades, and that different scholars present different foundational elements of source credibility or factors that measure source credibility. While the goal of this paper was not to present a systematic review of the different definitions and operationalizations of “credibility” throughout the decades, we do discuss relevant literature that informed our study in order to situate our work in the wider science communication literature.
To determine how to measure credibility, we reviewed literature from psychology, communication, and marketing. These fields have determined that the trustworthiness of the source and the source’s expertise regarding the topic at hand are common, foundational elements of credibility [41,42,43]. When risks are novel, individuals are more likely to accept risky practices when they trust the information source promoting the seemingly risky behavior. For instance, Ryu et al.’s [44] study demonstrated that individuals increased their acceptance of nuclear energy production if they trusted the government and regulators. Thus, respondents were asked to rate how trustworthy a source was in regard to information and discussions about induced seismicity and, separately, oil and gas development. Though we did not provide a definition of “trust” to our respondents, our intended meaning can be summarized by Renn and Levine’s (1991) definition that says trust is the expectation “that a message received is true and reliable and that the communicator demonstrates competence and honesty by conveying accurate, objective, and complete information,” [45]. In this regard we use “trustworthy” to mean something akin to what Siegrist et al. referred to as “social trust”, or an idea that a specific party is generally honest, reliable, and true to their word [46]. “Expertise” was used to measure a source’s perceived knowledge or mastery of the topic at hand. While Renn and Levine cite the subject matter of “competency” as a bedrock of trust [45], other scholars view expertise as a separate and distinct element of credibility [38,41,42]. Therefore, respondents were also asked how qualified these sources were to share information on both topics based on their expertise.
Finally, we also wanted to understand how legitimate respondents perceived each source to be for providing information on induced seismicity and oil and gas. Legitimacy has often been thought to be a pertinent factor in science–policy communication [47], in that legitimate institutions are able to more effectively win the support and acceptance of the public in instituting policy. In their study on environmental risk communication, Trettin and Musham (2000) determined that acceptable and understandable standards and procedures are more effective for institutions engaging in such communication [48], reinforcing these ideas around what makes communication legitimate. While perceived expertise with a topic may reflect that a source has the requisite knowledge to provide accurate information, expertise alone does not account for the fact that often sources that are close to an issue may have a vested interest, or conflict of interest, regarding the information being presented due to their ties to the subject [49]. To account for this, we adapted Suchman’s [50] definition of legitimacy, and we asked respondents to rate the degree to which it is “appropriate, desirable, or proper” for the source to share information on induced seismicity or hydraulic fracturing and oil and gas development. These ideas of trust, expertise, legitimacy, and credibility have been explored in a number of contexts, including Gustafsson’s study [51] of how trust of governmental agencies affects acceptance of climate change policies and Zhang et al.’s [43] study that found trust and source credibility affects consumer acceptance of genetically modified foods [43].
The different sources examined in this work were selected based on the context of induced seismicity, though many are present in any context focused on sustainability issues. These sources were academics, framed in our survey as “university researchers and scientists” for easier understanding by participants; elected officials; federal government bodies, such as the United States Geological Survey (USGS); state government bodies, such as state oil and gas regulators and state geological surveys; local government bodies; oil and gas companies and organizations; and environmental interest groups and organizations. These categories were determined based on archival analysis of communities facing induced seismicity, as well as field work performed by the research team [52]. The source categories were developed to be descriptive, and as mutually exclusive and collectively exhaustive as possible while maintaining a small number of categories to reduce survey fatigue.
We asked respondents these three questions—trustworthiness, qualifications, and legitimacy—for each of the seven source categories. These questions were asked twice, once for providing information on induced seismicity (i.e., “how trustworthy is X regarding the discussions surrounding the cause of the earthquakes”), and once for providing information on “hydraulic fracturing and oil and gas development”. These items were measured on a four-point, Likert-type scale.
There are many examples of how to measure credibility and the foundational elements of credibility, including in-depth studies that have aggregated ordinal, Likert-type items to develop interval or continuous measures [53,54,55]. In order to decrease the burden on survey respondents, this tested method of measurement was used in lieu of a continuous measurement scale (e.g., [38]) that would take more effort on the part of participants and likely result in a lower response rate.
2.2. Factors Affecting Source Credibility
In addition to uncovering who was viewed as credible, we sought to understand what factors predicted the credibility of different information sources. Credibility is not a fixed attribute—it can change and it varies based on the audience. Credibility is relational in this sense, in that different community members have different views on the level of credibility of the same source. For instance, a university may have a certain level of credibility with one community, and another level of credibility with another community altogether. These different levels of credibility vary based upon attributes, or factors, and their relationships to sources [37,39,41]. As a result, we sought to understand how perceived credibility of sources changes based on different factors. While there are many factors and interrelationships that lead one party to “believe” another or find them credible, including what Pornpitakpan referred to as source, message, channel, receiver, and destination variables [41], a survey limits the detail in which many of these variables can be explored. Specifically, we focused on variables associated with the receiver as they relate to the source, particularly variables that can be categorized as ones of initial disposition and issue involvement. Drawing from literature and case knowledge, these included perceptions of oil and gas development, exposure to induced seismicity, demographic variables, and the location of the respondent (i.e., urban or rural).
2.2.1. Perceptions of Oil and Gas Development
Individuals often receive and accept information that aligns with their pre-existing views, with individuals viewing information sources who share their views as more valid [56,57,58]. Given that alignment of views is important, we identified an individual’s perceptions of oil and gas and determined how these perceptions predict the credibility of different information sources.
To that end, we asked respondents to rate, on a four-point scale, how positively or negatively oil and gas development has impacted eighteen different aspects of their community, such as the availability of jobs or the number of earthquakes in the region. Sixteen of these community measures originated from literature (in particular [59]); however, two items related to induced seismicity—items asking about the amount of seismicity in the region and the cost of home insurance—were developed from case knowledge. We asked these questions for two reasons. First, it allowed for nuance in responses. For instance, despite the two primary “competing” narratives surrounding oil and gas development [19], many individuals hold views that development can bring both positive and negative impacts simultaneously [29,60]. Second, by aggregating these items into factors, we could better understand an individual’s view of the impacts of oil and gas development on their community without the issues associated with asking such questions directly.
While the individual impacts serve to measure, as a latent variable, perceptions of how development impacts the respondent’s community, we also asked respondents to rate their support for, or opposition to, hydraulic fracturing directly, as well as the extent to which they believed development had a positive or negative effect on their community overall. These approaches were used because the direct questions are more forthright and, given the contentious nature of the topic at hand, sensitive. Research has suggested that these types of questions may lead to inaccurate responses due to social desirability bias, or to people quitting the survey (e.g., [61,62]). Thus, we placed these direct questions after the more nuanced items. The responses were coded such that a higher number corresponded with greater support for and a more positive perceived effect of oil and gas development, while a lower number corresponded with greater opposition to, and a more negative perceived effect of, oil and gas development.
2.2.2. Exposure to Induced Seismicity
As individuals experience more adverse effects of a hazard, their thoughts and behaviors regarding that hazard often change [63]. This holds true for human-caused hazards, often called technological hazards, though the changes differ. While a natural hazard is often viewed as an “act of God” that cannot be prevented, only mitigated against, technological hazards are viewed differently, due to the perception that there may be a solution to stop, or substantially reduce, the hazard due to their human-made origin [64]. Unlike natural hazards, individuals generally believe that governmental authorities have the responsibility to address the causes and effects of technological hazards through regulations and other policies.
Thus, when technological hazards occur, individuals often develop decreased trust in the government and other authorities deemed responsible. In the Netherlands, for example, incidents of significant induced seismicity have resulted in declining levels of trust in government authorities, in part because of a lack of visible mitigation efforts and a lack of transparency in the response to the hazards [30]. Conversely, in the United States, research has shown that if individuals view governmental agencies as knowledgeable and responsible parties regarding induced seismicity, they hold greater levels of trust in said agencies [65].
Understanding these impacts of hazard exposure on trust, we asked individuals to report how many earthquakes they have felt in their state since 2011; how much damage, if any, they have incurred to personal property as a result of the earthquakes; and how negative of an impact, if any, the earthquakes have had on their lives.
2.2.3. Demographics
Lastly, we asked questions about educational attainment, age, and gender and captured metadata related to the respondents’ state and urbanicity (i.e., urban or rural community). Past studies on hydraulic fracturing and oil and gas development have shown significant relationships between demographic variables, including education, age, and gender, and views on development [23,66]. Age and education have also been suggested to influence trust of various institutions [53,54,67] and thus serve as potential predictors of source credibility regarding induced seismicity and oil and gas development. Respondents were asked to report their highest level of educational attainment on a seven-point scale, from “less than 9th grade” to “Advanced (Graduate) degree”, however no respondent reported an education of less than 9th grade, so this variable was analyzed as a six-point scale, with the lowest option reported being “Some high school.”
3. Methods
In order to answer the research questions, we selected four sites of interest and administered a community household survey to a random selection of households within each site.
3.1. Research Context
We selected two sites in the state of Oklahoma and two in the state of Colorado. In Oklahoma the study sites were: the town of Edmond, a suburb of Oklahoma City that has experienced notable earthquakes, including M5.0+ earthquakes, causing minor property damage; and the area surrounding the town of Fairview, a small town that has felt a significant number of similarly strong earthquakes in recent years. In Colorado we surveyed citizens of the city of Greeley, a community with an economy strongly tied to the oil and gas industry in the region and one that has experienced notable induced seismicity, namely magnitude 3.0+ earthquakes in 2014 and 2016 [4]. We also surveyed a set of four rural counties in eastern Colorado, which, despite having no notable induced seismicity, have economies that partly rely on oil and gas production, as do the other three sites. General information on these four sites is included in Table 1.
3.2. Data Collection
A third-party contractor was used to obtain a list of mailing addresses in each of the four sites. Three thousand addresses were procured for each of the four sites, and from this list a stratified random sample was produced to be contacted for the survey [68]. A pilot study was conducted to determine the best method of soliciting responses, which resulted in the final approach used here. This survey solicitation approach consisted of three mailings. The first mailing included a letter introducing the research team and outlining the goals of the survey, along with a link to take the survey online. The letter instructed the adult resident with the most recent birthday to take the survey, and a monetary incentive of two dollars was also included in this initial mailing. After two weeks, follow-up mailings were sent to households that had not yet responded, with a final follow up mailing being sent two weeks later. Each mailing contained a letter reminding residents to take the survey, along with a link to the online survey.
Responses were collected on the survey hosting platform Qualtrics and were analyzed using R statistical analysis software. Responses that included a large number of missing items were considered “break-offs” and were ignored for analysis. Responses that had a small number of missing items were kept for analysis. For this sample of “valid” responses, missing data were handled using the Amelia II package in R, an expectation maximization bootstrapping method to impute missing data [69,70]. This was not done for categorical items, such as whether the respondent came from an urban or rural community.
4. Data Analysis
In order to create a parsimonious model that explained the factors that predict source credibility, a backwards stepwise linear regression was performed for each of the dependent variables of interest, i.e., the credibility scores. Stepwise regression has been used to reduce the number of variables of interest in regression models, including in studies on sustainable development and attitudes towards energy development (e.g., [71,72,73]). In this method, all predictor variables of interest were included in models to predict each of the 14 credibility scores (two information types for each of the seven sources). Predictor variables were removed one at a time to simplify the model, where the variable selected for removal was that which would minimize the Akaike information criterion (AIC). AIC is a model comparison and selection measure that seeks to balance out model fit and parsimony, where a model with a lower AIC is preferable to a model with a higher AIC [74,75]. Once the models reached a point where removing an additional variable would result in a model with a higher (i.e., worse) AIC than the current model, the stepwise process was halted and the final model was recorded. This process resulted in 14 multivariate regression models, each predicting a credibility score for a given source (e.g., federal government bodies or academics) and topic (i.e., oil and gas or earthquakes).
Prior to performing the stepwise regression, several of the individual survey items were aggregated into larger factors or constructs. These factors were source credibility, earthquake experience, and three factors focusing on the various impacts of oil and gas development on a community.
The factor for source credibility was a composite of three survey items for each topic (oil and gas and earthquakes); the source’s: perceived expertise regarding the topic; perceived legitimacy to offer information on the topic; and perceived trustworthiness regarding sharing information on the topic. Each of these items were measured on a four-point scale. For each source, these three items were aggregated into a single credibility factor (Cronbach’s alpha > 0.66 for all), such that a higher value represents greater perceived credibility of a source. Paired t-tests were performed to determine whether the mean credibility for a given source differed by topic, or if they were consistent regardless of topic.
Earthquake experience was measured by taking the aggregate of three survey items (α = 0.74): the number of earthquakes felt by the respondent; the amount of damage incurred to a respondent’s personal property; and how negatively the respondent believes their life has been affected by the earthquakes. A greater number here represents a greater degree of earthquake experience or exposure.
For the specific impacts of oil and gas development on the community, an exploratory factor analysis was performed to combine similar items and reduce the number of variables in the analysis. The resulting grouping of the individual factors (IF) is shown in Table 2, along with the factor’s corresponding Cronbach’s alpha measure of internal consistency. Two items (the impact of development on health of community members and on the quality of roads) did not load onto any factor significantly and were dropped from analysis.
For ease of interpretation, the first impact factor (IF), IF1, consists of impacts that are often perceived of as benefits of oil and gas development, including the most frequently discussed benefit of job availability. IF2 consists of items that are often considered nuisances or disbenefits either on their own or in association with oil and gas development and other “boomtown” phenomena, including increases in crime, traffic, and noise [29]. The final factor, IF3, consists of items that are best described as environmental risks associated with petroleum development, as well as the associated drawback of higher home insurance costs that are often tied to these hazards. Each of these individual items were initially asked using a 4-point scale ranging from “very negative” (e.g., “Oil and gas development has had a very negative impact on the availability of good jobs”), to “very positive” (e.g., “Oil and gas development has had a very positive impact on the availability of good jobs”). The scores were summed to aggregate these items, where a higher score indicates that an individual believes that oil and gas development is having a more positive effect on the particular IF.
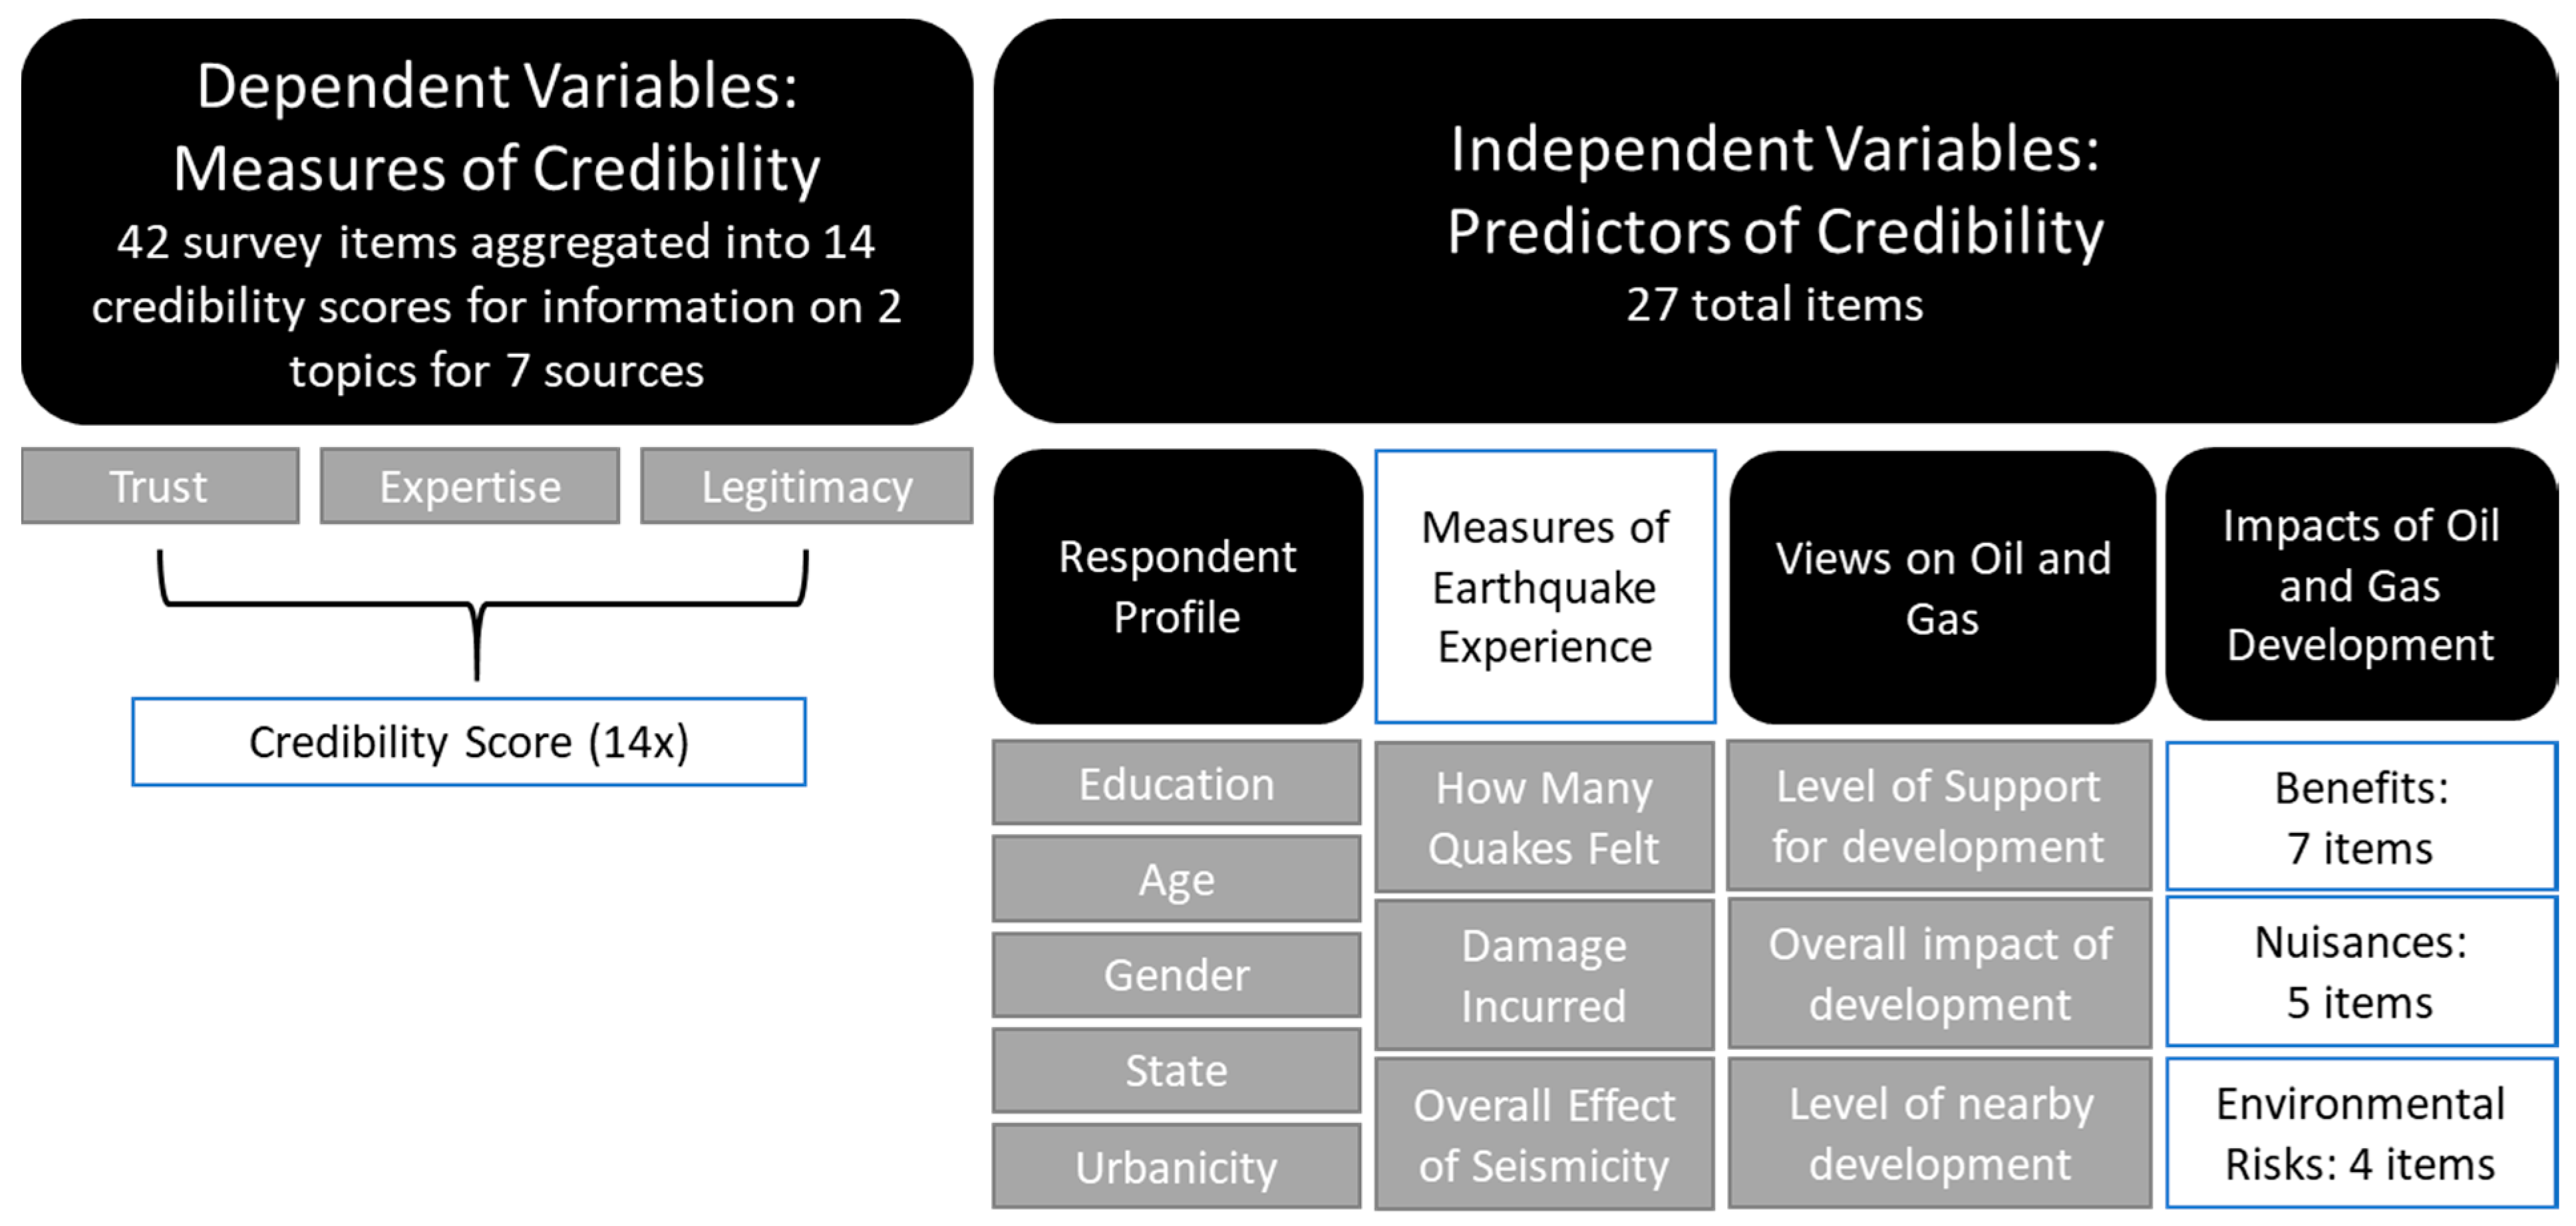
In total, 71 different pieces of survey data were considered in analysis. See Figure 1 for a summary.
5. Results
Overall, 449 valid survey responses were returned, a response rate of 11.2%. The sample was 51% female, 44% rural, with a mean age of 55.1 years. Slightly more responses came from Oklahoma communities (n = 237) than came from Colorado communities (n = 212). In total, 63% of the sample (n = 272) held a bachelor’s degree or higher, and 89% (n = 375) identified their ethnicity as “White”, which is only slightly higher than census estimates for these regions [76].
5.1. Credibility of Information Sources
Each of the credibility scores were rescaled to a range of 0–1 for ease of interpretation. Table 3 shows the mean credibility scores for each of the seven sources discussed in the survey regarding information about oil and gas and induced seismicity, the difference between the two, and the p-value for the paired t-test between each mean credibility.
5.2. Factors Predicting Source Credibility
Backwards stepwise regression was used to create models that help predict or explain the credibility scores for the different information sources. The models predicting the credibility of a source for information on oil and gas are displayed in Table 4. The models predicting source credibility for information regarding the earthquakes are shown in Table 5. In running the stepwise regression models, listwise deletion was used for responses with missing values. This resulted in a sample size of 368 for all the models developed.
For ease of interpretation, and the sake of having a consistent scale across variables, all variables have been scaled between 0 and 1 except “age”, “gender”, and “urbanicity”. Reading the scale follows the same concepts as described in the survey development section, e.g., support for hydraulic fracturing (HF) is read such that “strongly oppose” is 0 and “strongly support” is 1. From Table 4 and Table 5, an individual who selected “strongly support” hydraulic fracturing would increase the credibility score for each source by the regression coefficient value listed, as 1 would be multiplied by the coefficient. For example, an individual strongly supporting hydraulic fracturing would have decreased credibility of elected officials with regard to oil and gas by 0.06 (from Table 4, 1 (strongly support) would be multiplied by the coefficient, −0.06). Variables not scaled between 0 and 1 included age, which was measured in years (the model is centered on the sample mean of 55.1 years); gender, which was dichotomously coded as +0.5 for “female” and −0.5 for “male”; and urbanicity, where “rural” was coded as +0.5 and “urban” was coded as −0.5. For more detail on variables and coding see Table S1.
Thus, we can predict the credibility score of a source for a given respondent profile by multiplying the regression coefficient by the value of a respondent’s coded response and adding the value to the intercept. As an example, a resident of a rural community (urbanicity score = +0.5) who has no reported adverse experience of the earthquakes (earthquake experience score = 0), believes hydraulic fracturing has had a very positive effect on the community (perceived impact of HF score = 1), holds a bachelor’s degree (education score = 4/6 = 0.67), and is 62 years old (age = 62 − 55.1 = 6.9), would have a credibility score for academics regarding earthquakes (see Academics (first column) in Table 5) of:
Or, numerically:
This score suggests that an individual with these responses and demographics would have a fairly high credibility score for academics regarding the earthquakes, but perceive academics as slightly less credible than the average of the sample, which viewed academics as having a credibility score of 0.881.
6. Discussion
We first discuss the mean credibility of sources by information type before discussing factors influencing credibility scores of different sources.
6.1. Credibility of Sources by Information Type
Academics were viewed as the most credible source of information overall for information on both oil and gas development and the earthquakes (mean credibility score of 0.858 and 0.881, respectively, Table 3). The high credibility score for university sources is interesting to note, as there are often claims in discussions about science communication that individuals do not “trust” science or view scientists as reliable (e.g., [77,78]). This result suggests that the public, at least in this study, generally viewed academics as a reliable source of information with regard to oil and gas development and induced seismicity.
Other sources outside of academia were viewed as less credible (see Table 3). Average credibility scores for these sources (oil and gas-associated sources, environmental groups, and government bodies) were all at least 0.2 points less than academic sources. Oil and gas-associated sources were viewed as more credible for information regarding oil and gas development (0.572) than induced seismicity (0.508) and were the second-most credible source regarding oil and gas development issues. Every other source—elected officials, federal, state, and local government agencies, environmental actors, and academics—had a higher mean credibility for information on induced seismicity than information on oil and gas development (see Table 3). This demonstrates that the credibility of a source differs based on the topic. This could be due to individuals not associating oil and gas-affiliated sources with the earthquakes at all, or because some believe that oil and gas associated actors actively stifled the spread of information that would link their industry to the earthquakes [31], which could result in a negative view of their credibility. This has important implications in communicating sustainability focused work to the public, especially for such a complex issue as induced seismicity, where issues of hazard mitigation and energy development are intertwined. In these instances, strong communication efforts are required by academics or other parties to share findings and influence policy. Elected officials had the lowest average credibility for both sources of information (0.332 for oil and gas development and 0.380 for earthquakes).
Federal government agencies had the largest difference in credibility (0.076) regarding oil and gas development (0.509) vs. credibility regarding the earthquakes (0.585). This could be reflective of the fact that, in the two states studied, the USGS was publicly sharing information about induced seismicity, while state agencies and other actors were espousing different theories (e.g., the Colorado and Oklahoma Geological Surveys [3,79] vs, the USGS [1]), making the federal government agencies seem more credible than other sources for information on the earthquakes.
6.2. Perceptions of Oil and Gas Development and their Effect on Credibility
The more strongly an individual believes hydraulic fracturing and oil and gas development had an overall positive effect on their community, the more credibly they viewed oil and gas companies and affiliated groups (coefficients of 0.144 for oil and gas topics, Table 4, and 0.207 for earthquakes, Table 5) and federal and local government agencies regarding the earthquakes (0.115 and 0.074, respectively, Table 5) and the less credibly they viewed academics (−0.104 for oil and gas, Table 4, and −0.101 for earthquakes, Table 5) and environmental actors (−0.137 for earthquakes, Table 5). There were similar results for individuals who reported stronger support for hydraulic fracturing.
Additionally, the more individuals believed that oil and gas development improved air quality, water quality, insurance prices, and the number of earthquakes in the region (IF3), the more credibly they viewed oil and gas-associated sources and elected officials regarding the earthquakes (0.297 and 0.237, respectively, Table 5), and the less credibly they viewed state government agencies regarding the earthquakes (−0.137), and academic and environmentalist sources regarding oil and gas information (−0.105 and −0.314, Table 4). Essentially, individuals who believe oil and gas has a positive effect on these environmental risks of development, or a positive view of oil and gas development in general, view oil and gas associated sources and elected officials, who had more often claimed that the earthquakes are unrelated to oil and gas development, (e.g., [3,31,32]), as more credible.
Academics may be viewed negatively precisely because the information they have been communicating, specifically regarding induced seismicity, but also regarding topics like climate change, reflect negatively on the oil and gas industry. Therefore, it is important for academics to consider the topic at hand and the audience when trying to communicate the science of sustainability issues to the public. In instances such as ours, a third party, one perceived as more credible by individuals who like oil and gas development, may be able to better communicate issues around seismicity and energy development to audiences otherwise less open to information coming from academia.
6.3. The Effects of Earthquake Experience on Source Credibility
A higher level of “earthquake experience” was correlated with decreased credibility for nearly all sources (see Table 4; Table 5). This broadly follows the findings shown in Bakema et al.’s work [30], who found that people who were adversely affected by a hazard showed greater distrust in government officials for not taking steps to mitigate the hazard. As in Bakema et al.’s study of induced seismicity in the Netherlands, the hazard in our case study has a human origin, yet only minimal steps have been taken to prevent the earthquakes or mitigate the risks they posed, and thus people may be resentful of the lack of action. Additionally, the debate and actions surrounding the issue (see [31,32] for more) in our case study sites have not demonstrated the efficient, transparent governance and policies that lead to greater trust in institutions. Even academics experience lower credibility scores with respondents who have been adversely affected by the earthquakes. This suggests that even parties who had shared information in line with the science of the induced seismicity were viewed as less credible by those who had experienced adverse effects of the earthquakes.
A key takeaway is that all parties involved in such controversial sustainable development issues stand to see their credibility diminished if seemingly preventable hazards and negative impacts are not managed in a responsible way, including developing and enacting effective policy to address the hazards. Given the uncertainty around the issue and the relative novelty of induced seismicity as a hazard, future research may wish to study if, and how, actors can rebuild credibility and trust in the eyes of the public after it has been lost.
6.4. The Effects of Demographics on Source Credibility
All else being equal, higher education levels of respondents correlated with increased perceived credibility of academics and government agencies. Conversely, higher education levels correlated with decreased perceived credibility of oil and gas companies and affiliated interest groups (−0.120, Table 4, and −0.077, Table 5), and environmental interest groups (−0.120, Table 4, and −0.094, Table 5). This follows the findings of Brewer et al. [53] and Hudson [54], which linked higher levels of educational attainment with greater trust in established institutions, such as academia and the government. In contrast, environmental and oil and gas groups are not as prominent institutions and may not benefit from the increase in trust that comes with increased education levels.
Rural residents view state and local government agencies, environmental groups, and university academics as less credible than do residents of urban areas. Overall, these sources of information are still viewed favorably, though this urban–rural divide is still important to note for academics seeking to conduct outreach or participate in science communication activities. Not all universities are viewed equally, and in order to counteract any negative perception of universities in rural communities, universities can perform outreach in partnership with specific institutions with greater credibility. In Oklahoma, for example, some individuals have a negative perception of the University of Oklahoma because of their association with the Oklahoma Geological Survey, a state agency which is housed in the university and was the source of some controversies related to the earthquakes and the oil and gas industry [31]. Meanwhile in Colorado, the flagship research institution in the state is the University of Colorado Boulder, which is viewed more negatively by residents of the state than other state academic institutions, such as the Colorado School of Mines or Colorado State University [80]. Therefore, it may be better for parties conducting outreach and seeking public support for policies to partner with land-grant institutions, such as Oklahoma State University and Colorado State University in our case study sites, that have extension offices embedded in rural communities that are meant to serve and benefit these populations [81].
Older residents tended to view elected officials (regarding oil and gas information, 0.002), state government agencies (regarding both oil and gas (0.002) and the earthquakes (0.001)), and oil and gas companies and interest groups (regarding earthquakes (0.002)) as more credible, and academics (regarding the earthquakes (−0.001)) as less credible, though this effect was small. Finally, women view environmental groups as more credible regarding earthquakes than do men (0.125), and view federal and state government agencies as less credible than men do. They also view oil and gas affiliated groups as more credible regarding the earthquakes than do their male counterparts (0.056, Table 5).
One predictor that was included in the initial models that did not turn out to be significant in preliminary analysis was the state in which the respondent resided, Colorado or Oklahoma. The fact that this was dropped out of the stepwise regressions suggests that, for these communities, the state-level politics, institutions, and history have little bearing on how credible sources are viewed. The models showed that important factors include other demographic traits, as well as the individual’s views on oil and gas development and their experience with the earthquakes. This is important to note as induced seismicity increases in other parts of the United States.
6.5. Limitations and Future Work
While the response rate in this study was in line with similar mail-based surveys of a contentious topic such as ours [82,83], it was still lower than what may be desired in order to ensure a representative sample. That said, any such survey, particularly an academic survey, requires that the respondents be highly motivated to participate in the study, which can lead to a biased sample that is not fully representative of the general public [84]. Particularly with surveys of more contentious issues such as ours, surveys may lead to a self-selected sample of respondents who share views in line with the research team’s values, or at least their presumed values (c.f. [85]). The level of formal education held in our sample, for example, was rather high, and the overall positive perception of university researchers may be reflective of the fact that respondents themselves were willing participants in a university research project. Educational attainment is the demographic variable for which the sample is least representative of the population; thus, some caution should be used in evaluating results associated with this predictor. Additionally, to our knowledge, we are the first to publish data for our communities regarding attitudes around oil and gas or earthquake experience. Therefore, it is difficult to know if the results for these items are representative of the broader population. Additionally, though our results are broadly representative on demographics such as ethnicity, the relatively limited sample size prevents us from effectively stratifying these results into more detailed crosstabs of the population. While difficult to obtain, future work could focus on obtaining a larger overall sample, or use a weighted sampling approach to achieve a greater number of minority respondents to explore the differences in response by demographic in more nuance.
Though the narratives being espoused by each source were not discussed in depth, it is interesting to note that by the time the survey was in the field, institutions that had previously stated alternate reasons for the earthquakes, such as state governments saying the earthquakes were natural and academics saying the earthquakes are human-induced, came to the same conclusion that the earthquakes are induced. Experimental studies have found that message convergence, or different sources coming to the same conclusion or message, results in altered perceptions of source trustworthiness [86]; the convergence in our case study similarly may have affected the credibility scores of sources, which would be interesting to explore further. However, our study, a household survey, does not provide the rich qualitative data or longitudinal data to determine how changing messages and message convergence affect perceived credibility. Thus, we recommend that future work focus on longitudinal studies with rich qualitative data to better understand these phenomena in a contentious slow-onset hazard, such as induced seismicity. This would allow for comparison to other contexts, such as food safety, as discussed in Anthony et al. [86]. Future work can also seek to build upon and further align risk communication and science communication literature, as has been started by science communication scholars such as Kahan, who builds on the work of, and writes with, risk perception and communication scholars such as Slovic [87,88].
7. Conclusions
Increasingly frequent earthquakes now commonly plague parts of America that were previously aseismic. Although there is scientific consensus as to what causes the earthquakes—the disposal of produced wastewater via injection into the earth—public perceptions are not as unified, resulting in additional barriers to enacting effective policy addressing the earthquakes. In particular, different factions of the public may perceive narratives differently based on how credible they view the source promoting them, whether it be the government, private industry, or researchers. Existing literature demonstrates how an individual’s perspectives can be influenced by their demographic and past experiences, and how those perspectives are ultimately influential in both individual decision-making and collective policy making. We identified a gap in past research and a need to investigate how individuals’ perceptions and past experiences influence how they perceive academics and other information sources regarding both oil and gas development and induced seismicity.
We found that different sources of information are viewed as having different levels of credibility when it comes to sharing information on oil and gas development and induced seismicity. There are a number of factors that serve to predict how credible respondents view these different sources. In general, academic researchers and scientists are viewed as being the most credible source of information, though there are moderating factors, such as an individual’s age, the urbanicity of their community, and their views on oil and gas development. Importantly, based upon the sample population, academics are viewed as highly credible, even in the presence of moderating factors. For instance, even when evaluating the credibility of academics in the most extreme case (an individual with characteristics such that the negative coefficients had the maximum effect and the positive coefficients had zero effect) the developed model found academics still have a credibility score of 0.644 regarding earthquakes, greater than the average credibility score for any other source. In this way, the results can be used as a tool for improved strategic scientific communication between academia and society; academics should take note, using this high credibility to share relevant, scientifically sound information via public outreach projects.
Additionally, as this work studies credibility in the presence of a contentious and politicized technological hazard, it is important for any and all sources that may be viewed as an authority to take steps to mitigate and prevent hazards when possible and, at a minimum, take transparent action to keep their credibility from eroding, as happened to sources when respondents reported more adverse impacts of the earthquakes. This study investigated perceived credibility of information sources surrounding a singular contentious, changing, and uncertain topic; however, the results may resonate with future studies in an uncertain and changing world. The public will surely encounter differing narratives in other arenas, such as technological developments or climate change, and how they perceive the credibility of information sources will be increasingly relevant.
Supplementary Materials
The following are available online at https://0-www-mdpi-com.brum.beds.ac.uk/2071-1050/12/6/2308/s1, Table S1: Variables with data types and coding schema.
Author Contributions
Conceptualization, A.T. and A.J.-W.; Formal analysis, A.T.; Funding acquisition, A. J.-W.; Investigation, A.T.; Methodology A.T. and A.J.-W.; Project administration, A.J.-W.; Supervision, A.J.-W.; Validation, A.T.; Writing—original draft, A.T.; Writing—reviewing and editing, A.T. and A.J.-W.; All authors have read and agreed to the published version of the manuscript.
Funding
The material presented is based in part on work supported by the United States National Science Foundation under Grant No. 1520846. Any opinions, findings, and conclusions or recommendations expressed in this material are those of the authors and do not necessarily reflect the views of the National Science Foundation.
Conflicts of Interest
The authors declare no conflict of interest.
References
- Ellsworth, W.L. Injection-induced earthquakes. Science 2013, 341, 1225942. [Google Scholar] [CrossRef]
- Oklahoma Energy Today, Blog Suggests Windmills are Causing Earthquakes in Oklahoma—Not Injection Wells. Available online: http://www.okenergytoday.com/2016/01/blog-suggests-windmills-are-causing-earthquakes-in-oklahoma-not-injection-wells/ (accessed on 27 January 2016).
- Oklahoma Geological Survey. Southern Arcadia Lake, November 2013 Earthquake Swarm; Oklahoma Geological Survey Informational Series 16 (IS16); Oklahoma Geological Survey: Norman, OK, USA, 2013. [Google Scholar]
- USGS. USGS Earthquakes Hazard Program. Available online: https://earthquake.usgs.gov/earthquakes/ (accessed on 21 April 2019).
- Folger, P.; Tiemann, M. Human-Induced Earthquakes from Deep-Well Injection: A Brief Overview; Congressional Research Service: Washington, DC, USA, 2016; p. 36. [Google Scholar]
- Walter, J.I.; Dotray, P.J.; Frohlich, C.; Gale, J.F.W. Earthquakes in Northwest Louisiana and the Texas–Louisiana Border Possibly Induced by Energy Resource Activities within the Haynesville Shale Play. Seismol. Res. Lett. 2016, 87, 285–294. [Google Scholar] [CrossRef] [Green Version]
- Rubinstein, J.L.; Mahani, A.B. Myths and Facts on Wastewater Injection, Hydraulic Fracturing, Enhanced Oil Recovery, and Induced Seismicity. Seismol. Res. Lett. 2015, 86, 1060–1067. [Google Scholar] [CrossRef]
- Evans, D. The Denver area earthquakes and the Rocky Mountain Arsenal Disposal Well. Mt. Geol. 1966, 23–36. [Google Scholar]
- Healy, J.H.; Rubey, W.W.; Griggs, D.T.; Raleigh, C.B. The Denver Earthquakes. Science 1968, 161, 1301–1310. [Google Scholar] [CrossRef] [PubMed] [Green Version]
- Huang, Y.; Ellsworth, W.L.; Beroza, G.C. Stress drops of induced and tectonic earthquakes in the central United States are indistinguishable. Sci. Adv. 2017, 3, e1700772. [Google Scholar] [CrossRef] [Green Version]
- Petersen, M.D.; Mueller, C.S.; Moschetti, M.P.; Hoover, S.M.; Shumway, A.M.; McNamara, D.E.; Williams, R.A.; Llenos, A.L.; Ellsworth, W.L.; Michael, A.J.; et al. 2017 One-Year Seismic-Hazard Forecast for the Central and Eastern United States from Induced and Natural Earthquakes. Seismol. Res. Lett. 2017, 88, 772–783. [Google Scholar] [CrossRef]
- Petersen, M.D.; Mueller, C.S.; Moschetti, M.P.; Hoover, S.M.; Rukstales, K.S.; McNamara, D.E.; Williams, R.A.; Shumway, A.M.; Powers, P.M.; Earle, P.S.; et al. 2018 One-Year Seismic Hazard Forecast for the Central and Eastern United States from Induced and Natural Earthquakes. Seismol. Res. Lett. 2018, 89, 1049–1061. [Google Scholar] [CrossRef]
- Buhl, L. Oklahoma Earthquakes: Who Pays? Available online: http://insideenergy.org/2016/03/30/oklahoma-earthquakes-who-pays/ (accessed on 11 February 2020).
- Cheung, R.; Wetherell, D.; Whitaker, S. Induced earthquakes and housing markets: Evidence from Oklahoma. Reg. Sci. Urban Econ. 2018, 69, 153–166. [Google Scholar] [CrossRef]
- Casey, J.A.; Elser, H.; Goldman-Mellor, S.; Catalano, R. Increased motor vehicle crashes following induced earthquakes in Oklahoma, USA. Sci. Total Environ. 2019, 650, 2974–2979. [Google Scholar] [CrossRef]
- Pless, J. Natural Gas Development and Hydraulic Fracturing; National Conference of State Legislatures: Washington, DC, USA, 2012. [Google Scholar]
- U.S. Energy Information Administration. Hydraulic Fracturing Accounts for about Half of Current U.S. Crude Oil Production; Today in Energy; EIA: Washington, DC, USA, 2016.
- U.S. Energy Information Administration. The United States Is Expected to Export More Energy than It Imports by 2020; EIA: Washington, DC, USA, 2019.
- Bomberg, E. Shale We Drill? Discourse Dynamics in UK Fracking Debates. J. Environ. Policy Plan. 2015, 1–17. [Google Scholar] [CrossRef] [Green Version]
- Meng, Q. The impacts of fracking on the environment: A total environmental study paradigm. Sci. Total Environ. 2017, 580, 953–957. [Google Scholar] [CrossRef] [PubMed]
- National Institute of Environmental Health Sciences. Hydraulic Fracturing and Health; National Institute of Health: Bethesda, MD, USA, 2014; p. 2.
- Stults, J.F. Are Hydraulic Fracturing Fluids Getting Riskier? An Integrated Approach to Risk Analysis and Data Analytics Using the Fracfocus Database. Master’s Thesis, University of Colorado Boulder, Boulder, CO, USA, 2018. [Google Scholar]
- Boudet, H.; Clarke, C.; Bugden, D.; Maibach, E.; Roser-Renouf, C.; Leiserowitz, A. “Fracking” controversy and communication: Using national survey data to understand public perceptions of hydraulic fracturing. Energy Policy 2014, 65, 57–67. [Google Scholar] [CrossRef]
- Drake, B. How Americans view the Top Energy and Environmental Issues; Pew Research Center: Washington, DC, USA, 2015. [Google Scholar]
- Clarke, C.E.; Hart, P.S.; Schuldt, J.P.; Evensen, D.T.N.; Boudet, H.S.; Jacquet, J.B.; Stedman, R.C. Public opinion on energy development: The interplay of issue framing, top-of-mind associations, and political ideology. Energy Policy 2015, 81, 131–140. [Google Scholar] [CrossRef]
- Cotton, M.; Rattle, I.; Van Alstine, J. Shale gas policy in the United Kingdom: An argumentative discourse analysis. Energy Policy 2014, 73, 427–438. [Google Scholar] [CrossRef]
- Fisk, J.M.; Davis, C.; Cole, B. “Who Is at ‘Fault?’” The Media and the Stories of Induced Seismicity. Polit. Policy 2017, 45, 31–50. [Google Scholar] [CrossRef] [Green Version]
- Albrecht, S.L. Socio-Cultural Factors and Energy Resource Development in Rural Areas in the West. In Proceedings of the Annual Meetings of the Rural Sociological Society, New York, NY, USA, 28 August 1976; p. 39. [Google Scholar]
- Cortese, C.F.; Jones, B. The sociological analysis of boom towns. West. Sociol. Rev. 1977, 8, 76–90. [Google Scholar]
- Bakema, M.; Parra, C.; McCann, P. Analyzing the Social Lead-Up to a Human-Induced Disaster: The Gas Extraction-Earthquake Nexus in Groningen, The Netherlands. Sustainability 2018, 10, 3621. [Google Scholar] [CrossRef] [Green Version]
- Soraghan, M. Oklahoma Agency Linked Quakes to Oil in 2010, But Kept Mum Amid Industry Pressure. Available online: https://www.eenews.net/stories/1060014342/print (accessed on 3 December 2017).
- Soraghan, M. In Oil-Friendly Oklahoma, Gov. Fallin Moved Slowly on “Awkward” Issues of Quakes. Available online: https://www.eenews.net/stories/1060021388 (accessed on 20 April 2019).
- Bodmer, W. The Public Understanding of Science; Biotechnology and Wordl Health; World Health Organization: Geneva, Switzerland, 1997. [Google Scholar]
- Durant, J.R.; Evans, G.A.; Thomas, G.P. The public understanding of science. Nature 1989, 340, 11–14. [Google Scholar] [CrossRef]
- Sturgis, P.; Allum, N. Science in society: Re-evaluating the deficit model of public attitudes. Public Underst. Sci. 2004, 13, 55–74. [Google Scholar] [CrossRef] [Green Version]
- Kahan, D.M.; Jenkins-Smith, H.; Braman, D. Cultural cognition of scientific consensus. J. Risk Res. 2011, 14, 147–174. [Google Scholar] [CrossRef]
- Aristotle Rhetoric; CreateSpace Independent Publishing Platform: Scotts Valley, CA, USA, 2015; ISBN 1-5084-0644-8.
- Gaziano, C.; McGrath, K. Measuring the Concept of Credibility. J. Q. 1986, 63, 451–462. [Google Scholar] [CrossRef]
- Sobel, J. A Theory of Credibility. Rev. Econ. Stud. 1985, 52, 557. [Google Scholar] [CrossRef]
- Castillo, C.; Mendoza, M.; Poblete, B. Information credibility on twitter. In Proceedings of the 20th International Conference on World Wide Web—WWW ’11, Hyderabad, India, 28 March–1 April 2011; ACM Press: Hyderabad, India, 2011; p. 675. [Google Scholar]
- Pornpitakpan, C. The Persuasiveness of Source Credibility: A Critical Review of Five Decades’ Evidence. Interpers. Commun. 2004, 34, 243–281. [Google Scholar] [CrossRef]
- Whitehead, J.L., Jr. Factors of Source Credibility. Q. J. Speech 1968, 54, 59–63. [Google Scholar] [CrossRef]
- Zhang, M.; Chen, C.; Hu, W.; Chen, L.; Zhan, J. Influence of Source Credibility on Consumer Acceptance of Genetically Modified Foods in China. Sustainability 2016, 8, 899. [Google Scholar] [CrossRef] [Green Version]
- Ryu, Y.; Kim, S.; Kim, S. Does Trust Matter? Analyzing the Impact of Trust on the Perceived Risk and Acceptance of Nuclear Power Energy. Sustainability 2018, 10, 758. [Google Scholar] [CrossRef] [Green Version]
- Renn, O.; Levine, D. Credibility and trust in risk communication. In Communicating Risks to the Public; Kasperson, R.E., Stallen, P.J.M., Eds.; Springer: Dordrecht, The Netherlands, 1991; pp. 175–217. ISBN 978-94-010-7372-1. [Google Scholar]
- Siegrist, M.; Earle, T.C.; Gutscher, H. Test of a Trust and Confidence Model in the Applied Context of Electromagnetic Field (EMF) Risks. Risk Anal. 2003, 23, 705–716. [Google Scholar] [CrossRef]
- Heink, U.; Marquard, E.; Heubach, K.; Jax, K.; Kugel, C.; Neßhöver, C.; Neumann, R.K.; Paulsch, A.; Tilch, S.; Timaeus, J.; et al. Conceptualizing credibility, relevance and legitimacy for evaluating the effectiveness of science–policy interfaces: Challenges and opportunities. Sci. Public Policy 2015, 42, 676–689. [Google Scholar] [CrossRef]
- Trettin, L.; Musham, C. Is Trust a Realistic Goal of Environmental Risk Communication? Environ. Behav. 2000, 32, 410–426. [Google Scholar] [CrossRef]
- McComas, K.A.; Trumbo, C.W. Source Credibility in Environmental Health—Risk Controversies: Application of Meyer’s Credibility Index. Risk Anal. 2001, 21, 467–480. [Google Scholar] [CrossRef] [PubMed]
- Suchman, M.C. Managing Legitimacy: Strategic and Institutional Approaches. Acad. Manag. Rev. 1995, 20, 571. [Google Scholar] [CrossRef] [Green Version]
- Gustafsson Learning from the Experiences of the Intergovernmental Panel on Climate Change: Balancing Science and Policy to Enable Trustworthy Knowledge. Sustainability 2019, 11, 6533. [CrossRef] [Green Version]
- Tracy, A.G.; Javernick-Will, A.; Baummer, D. “I’m Not a Scientist” Community Knowledge-Sharing during Uncertainty: Induced Seismicity and Hydraulic Fracturing. In Proceedings of the EPOC-MW Conference; Engineering Project Organization Society, Fallen Leaf Lake, CA, USA, 5–7 June 2017. [Google Scholar]
- Brewer, P.R.; Gross, K.; Aday, S.; Willnat, L. International Trust and Public Opinion about World Affairs. Am. J. Polit. Sci. 2004, 48, 93–109. [Google Scholar] [CrossRef]
- Hudson, J. Institutional Trust and Subjective Well-Being across the EU. Kyklos 2006, 59, 43–62. [Google Scholar] [CrossRef]
- Hough, M.; Jackson, J.; Bradford, B. Legitimacy, Trust and Compliance: An Empirical Test of Procedural Justice Theory Using the European Social Survey; Tankebe, J., Liebling, A., Eds.; Legitimacy and Criminal Justice: An International Exploration; Oxford University Press: Oxford, UK, 2013. [Google Scholar]
- Kahan, D.M. Ideology, motivated reasoning, and cognitive reflection. Judgm. Decis. Mak. 2013, 8, 18. [Google Scholar]
- Kunda, Z.; Sinclair, L. Motivated Reasoning with Stereotypes: Activation, Application, and Inhibition. Psychol. Inq. 1999, 10, 12–22. [Google Scholar] [CrossRef]
- Slothuus, R.; de Vreese, C.H. Political Parties, Motivated Reasoning, and Issue Framing Effects. J. Polit. 2010, 72, 630–645. [Google Scholar] [CrossRef]
- Stedman, R.C.; Jacquet, J.B.; Filteau, M.R.; Willits, F.K.; Brasier, K.J.; McLaughlin, D.K. Marcellus Shale Gas Development and New Boomtown Research: Views of New York and Pennsylvania Residents. Environ. Pract. 2012, 14, 382–393. [Google Scholar] [CrossRef]
- Braiser, K.J.; Filteau, M.R.; McLaughlin, D.K. Residents’ Perceptions of Community and Environmental Impacts from Development of Natural Gas in the Marcellus Shale: A Comparison of Pennsylvania and New York Cases. J. Rural Soc. Sci. 2011, 26, 32–61. [Google Scholar]
- Krumpal, I. Determinants of social desirability bias in sensitive surveys: A literature review. Qual. Quant. 2013, 47, 2025–2047. [Google Scholar] [CrossRef]
- Tourangeau, R.; Yan, T. Sensitive questions in surveys. Psychol. Bull. 2007, 133, 859–883. [Google Scholar] [CrossRef] [PubMed]
- McGee, T.K.; McFarlane, B.L.; Varghese, J. An Examination of the Influence of Hazard Experience on Wildfire Risk Perceptions and Adoption of Mitigation Measures. Soc. Nat. Resour. 2009, 22, 308–323. [Google Scholar] [CrossRef]
- Kasperson, R.E.; Pijawka, K.D. Societal Response to Hazards and Major Hazard Events: Comparing Natural and Technological Hazards. Public Adm. Rev. 1985, 45, 7. [Google Scholar] [CrossRef]
- Murphy, H.; Greer, A.; Wu, H.-C. Trusting Government to Mitigate a New Hazard: The Case of Oklahoma Earthquakes: Trusting Government to Mitigate. Risk Hazards Crisis Public Policy 2018, 9, 357–380. [Google Scholar] [CrossRef]
- Evensen, D.; Stedman, R.; Brown-Steiner, B. Resilient but not sustainable? Public perceptions of shale gas development via hydraulic fracturing. Ecol. Soc. 2017, 22, 8. [Google Scholar] [CrossRef]
- Hawdon, J. Legitimacy, Trust, Social Capital, and Policing Styles: A Theoretical Statement. Police Q. 2008, 11, 182–201. [Google Scholar] [CrossRef]
- Kelley, K.; Clark, B.; Brown, V.; Sitzia, J. Good practice in the conduct and reporting of survey research. Int. J. Qual. Health Care 2003, 15, 261–266. [Google Scholar] [CrossRef] [Green Version]
- Honaker, J.; King, G.; Blackwell, M. Amelia II: A Program for Missing Data. J. Stat. Softw. 2011, 45, 1–47. [Google Scholar]
- Little, R.J.A.; Rubin, D.B. Statistical Analysis with Missing Data, 3rd ed.; Wiley Series in Probability and Statistics; John Wiley & Sons, Inc.: Hoboken, NJ, USA, 2020; ISBN 978-0-470-52679-8. [Google Scholar]
- Endrejat, P.C.; Kauffeld, S. Can’t get no satisfaction? Motivating organisational energy efficiency efforts in Germany. Energy Res. Soc. Sci. 2018, 44, 146–151. [Google Scholar] [CrossRef]
- Linzenich, A.; Arning, K.; Offermann-van Heek, J.; Ziefle, M. Uncovering attitudes towards carbon capture storage and utilization technologies in Germany: Insights into affective-cognitive evaluations of benefits and risks. Energy Res. Soc. Sci. 2019, 48, 205–218. [Google Scholar] [CrossRef]
- Thomson, H.; Snell, C. Quantifying the prevalence of fuel poverty across the European Union. Energy Policy 2013, 52, 563–572. [Google Scholar] [CrossRef]
- Akaike, H. A New Look at the Statistical Model Identification. IEEE Trans. Autom. Control 1974, 19, 716–723. [Google Scholar] [CrossRef]
- Burnham, K.P.; Anderson, D.R.; Burnham, K.P. Model Selection and Multimodel Inference: A Practical Information-Theoretic Approach, 2nd ed.; Springer: Berlin/Heidelberg, Germany, 2002; ISBN 978-0-387-95364-9. [Google Scholar]
- US Census Bureau United States Census Bureau Quick Facts. Available online: https://www.census.gov/quickfacts/fact/table/edmondcityoklahoma/PST045216 (accessed on 6 August 2019).
- Gauchat, G. Politicization of Science in the Public Sphere: A Study of Public Trust in the United States, 1974 to 2010. Am. Sociol. Rev. 2012, 77, 167–187. [Google Scholar] [CrossRef] [Green Version]
- Tsipursky, G. (Dis)trust in Science. Available online: https://blogs.scientificamerican.com/observations/dis-trust-in-science/ (accessed on 11 February 2020).
- Colorado Geological Survey. Earthquakes Triggered by Humans in Colorado—A Background Paper; Colorado Geological Survey: Golden, CO, USA, 2013. [Google Scholar]
- University of Colorado Boulder Office of the Chancellor. Advancing Our Reputation; University of Colorado Boulder: Boulder, CO, USA, 2016. [Google Scholar]
- Lyons, T.S.; Miller, S.R.; Mann, J.T. A New Role for Land Grant Universities in the Rural Innovation Ecosystem? J. Reg. Anal. Policy 2018, 48, 16. [Google Scholar]
- Grubert, E. The Eagle Ford and Bakken shale regions of the United States: A comparative case study. Extr. Ind. Soc. 2018, 5, 570–580. [Google Scholar] [CrossRef]
- Grubert, E.; Skinner, W. A town divided: Community values and attitudes towards coal seam gas development in Gloucester, Australia. Energy Res. Soc. Sci. 2017, 30, 43–52. [Google Scholar] [CrossRef]
- Krosnick, J.A. Survey research. Annu. Rev. Psychol. 1999, 50, 537–567. [Google Scholar] [CrossRef]
- Pidgeon, N.F.; Poortinga, W.; Rowe, G.; Horlick-Jones, T.; Walls, J.; O’Riordan, T. Using Surveys in Public Participation Processes for Risk Decision Making: The Case of the 2003 British GM Nation? Public Debate. Risk Anal. 2005, 25, 467–479. [Google Scholar] [CrossRef]
- Anthony, K.E.; Sellnow, T.L.; Millner, A.G. Message Convergence as a Message-centered Approach to Analyzing and Improving Risk Communication. J. Appl. Commun. Res. 2013, 41, 346–364. [Google Scholar] [CrossRef]
- Kahan, D.M.; Braman, D.; Cohen, G.L.; Gastil, J.; Slovic, P. Who fears the HPV vaccine, who doesn’t, and why? An experimental study of the mechanisms of cultural cognition. Law Hum. Behav. 2010, 34, 501–516. [Google Scholar] [CrossRef] [PubMed] [Green Version]
- Kahan, D.M.; Peters, E.; Wittlin, M.; Slovic, P.; Ouellette, L.L.; Braman, D.; Mandel, G. The polarizing impact of science literacy and numeracy on perceived climate change risks. Nat. Clim. Chang. 2012, 2, 732–735. [Google Scholar] [CrossRef] [Green Version]
Figure 1.
Summary of variables used for analysis; black boxes represent categories of data; grey boxes represent individual survey items; white boxes represent factors or latent variables made up of multiple survey items.
Figure 1.
Summary of variables used for analysis; black boxes represent categories of data; grey boxes represent individual survey items; white boxes represent factors or latent variables made up of multiple survey items.


Table 1.
Site information.
| State | Site | Urbanicity | Population (2014 Estimate) | Number of Households (2013 Estimate) |
|---|---|---|---|---|
| Oklahoma | Edmond | Urban | 88,605 | 31,233 |
| Major (Fairview), Woodward, Woods, and Alfalfa Counties | Rural | 43,614 | 16,528 | |
| Colorado | Greeley | Urban | 98,596 | 33,103 |
| Elbert, Washington, Kit Carson, and Yuma Counties | Rural | 48,347 | 17,248 |
Table 2.
Impact factor assignments.
| Impact Factor 1 (IF1): Benefits | IF2: Nuisances | IF3: Environmental Risks |
|---|---|---|
| Availability of Good Jobs | Availability of Affordable Housing | Cost of Home Insurance |
| Quality of Public Schools | Cost of Living | Drinking Water Quality |
| Property Value | Noise | Seismic Activity |
| Neighbourliness | Crime Levels | Air Quality |
| Family Stability | Traffic Volume | |
| Cultural Events | ||
| Quality of Life | ||
| α = 0.86 | α = 0.77 | α = 0.77 |
Table 3.
Mean credibility of information sources (n = 449).
| Source | Mean Credibility Regarding Oil and Gas | Mean Credibility Regarding Induced Seismicity | Δ | p-Value |
|---|---|---|---|---|
| Academics (“university researchers and scientists”) | 0.858 | 0.881 | 0.022 | 6.79 × 10⁻⁴ |
| Oil and Gas companies, organizations, and interest groups | 0.572 | 0.508 | −0.063 | 4.89 × 10⁻¹⁰ |
| Environmental interest groups and organizations | 0.545 | 0.582 | 0.037 | 1.26 × 10⁻⁵ |
| State government bodies | 0.521 | 0.579 | 0.058 | 3.70 × 10⁻¹¹ |
| Federal government bodies | 0.509 | 0.585 | 0.076 | 2.20 × 10⁻¹⁶ |
| Local government bodies | 0.448 | 0.504 | 0.056 | 9.16 × 10⁻¹¹ |
| Elected officials | 0.332 | 0.380 | 0.048 | 2.38 × 10⁻⁹ |
Table 4.
Stepwise regression models predicting credibility of sources regarding oil and gas.
| Academics | Oil and Gas Actors | Environmental Actors | State Gov. Agencies | Fed. Gov. Agencies | Local Gov. Agencies | Elected Officials | ||||||||
|---|---|---|---|---|---|---|---|---|---|---|---|---|---|---|
| Coeff. | p-Value | Coeff. | p-Value | Coeff. | p-Value | Coeff. | p-Value | Coeff. | p-Value | Coeff. | p-Value | Coeff. | p-Value | |
| (Intercept) | 0.927 | 0.000 | 0.318 | 0.000 | 0.934 | 0.000 | 0.462 | 0.000 | 0.436 | 0.000 | 0.509 | 0.000 | 0.231 | 0.000 |
| Urbanicity | −0.037 | 0.067 | −0.110 | 0.000 | −0.057 | 0.059 | −0.045 | 0.129 | −0.077 | 0.010 | ||||
| IF1: Benefits | 0.217 | 0.051 | −0.183 | 0.101 | 0.167 | 0.060 | 0.237 | 0.004 | ||||||
| IF2: Nuisances | 0.199 | 0.030 | 0.142 | 0.067 | ||||||||||
| IF3: Environmental Risks | −0.105 | 0.098 | −0.314 | 0.005 | ||||||||||
| Earthquake Experience | −0.060 | 0.113 | −0.153 | 0.004 | −0.081 | 0.158 | −0.096 | 0.077 | −0.090 | 0.098 | −0.126 | 0.019 | ||
| Local Oil and Gas production | −0.069 | 0.157 | −0.110 | 0.022 | ||||||||||
| Impact of HF | −0.104 | 0.002 | 0.144 | 0.023 | 0.089 | 0.104 | ||||||||
| Support for HF | 0.153 | 0.002 | −0.128 | 0.004 | −0.137 | 0.002 | −0.173 | 0.000 | −0.113 | 0.019 | −0.060 | 0.128 | ||
| Education | 0.074 | 0.036 | −0.120 | 0.021 | −0.120 | 0.024 | 0.191 | 0.000 | 0.197 | 0.000 | 0.099 | 0.049 | ||
| Age | 0.002 | 0.008 | 0.001 | 0.125 | 0.002 | 0.058 | ||||||||
| Gender | −0.075 | 0.008 | −0.086 | 0.002 | −0.117 | 0.000 | ||||||||
Table 5.
Stepwise Regression models predicting credibility of sources regarding earthquakes.
| Academics | Oil and Gas actors | Environmental Actors | State Gov. Agencies | Fed. Gov. Agencies | Local Gov. Agencies | Elected Officials | ||||||||
|---|---|---|---|---|---|---|---|---|---|---|---|---|---|---|
| Coeff. | p-Value | Coeff. | p-Value | Coeff. | p-Value | Coeff. | p-Value | Coeff. | p-value | Coeff. | p-Value | Coeff. | p-Value | |
| (Intercept) | 0.892 | 0.000 | 0.354 | 0.000 | 0.855 | 0.000 | 0.587 | 0.000 | 0.499 | 0.000 | 0.590 | 0.000 | 0.259 | 0.000 |
| Urbanicity | −0.045 | 0.012 | −0.132 | 0.000 | −0.061 | 0.030 | −0.060 | 0.032 | ||||||
| IF1: Benefits | −0.264 | 0.007 | 0.222 | 0.030 | 0.153 | 0.105 | ||||||||
| IF2: Nuisances | ||||||||||||||
| IF3: Environmental Risks | 0.297 | 0.002 | −0.166 | 0.107 | 0.237 | 0.006 | ||||||||
| Earthquake Experience | −0.062 | 0.059 | −0.082 | 0.150 | −0.110 | 0.035 | −0.132 | 0.009 | ||||||
| Local Oil and Gas production | −0.110 | 0.012 | −0.136 | 0.003 | ||||||||||
| Impact of HF | −0.101 | 0.000 | 0.207 | 0.000 | −0.137 | 0.011 | 0.115 | 0.031 | 0.074 | 0.149 | ||||
| Support for HF | −0.075 | 0.060 | −0.185 | 0.000 | −0.096 | 0.033 | −0.106 | 0.005 | ||||||
| Education | 0.093 | 0.003 | −0.077 | 0.146 | −0.094 | 0.066 | 0.142 | 0.003 | 0.212 | 0.000 | 0.089 | 0.061 | ||
| Age | −0.001 | 0.012 | 0.002 | 0.058 | 0.001 | 0.110 | ||||||||
| Gender | 0.056 | 0.057 | 0.125 | 0.000 | −0.067 | 0.010 | −0.110 | 0.000 | ||||||
© 2020 by the authors. Licensee MDPI, Basel, Switzerland. This article is an open access article distributed under the terms and conditions of the Creative Commons Attribution (CC BY) license (http://creativecommons.org/licenses/by/4.0/).
Share and Cite
MDPI and ACS Style
Tracy, A.; Javernick-Will, A. Credible Sources of Information Regarding Induced Seismicity. Sustainability 2020, 12, 2308. https://0-doi-org.brum.beds.ac.uk/10.3390/su12062308
AMA Style
Tracy A, Javernick-Will A. Credible Sources of Information Regarding Induced Seismicity. Sustainability. 2020; 12(6):2308. https://0-doi-org.brum.beds.ac.uk/10.3390/su12062308
Chicago/Turabian StyleTracy, Andrew, and Amy Javernick-Will. 2020. "Credible Sources of Information Regarding Induced Seismicity" Sustainability 12, no. 6: 2308. https://0-doi-org.brum.beds.ac.uk/10.3390/su12062308
Note that from the first issue of 2016, this journal uses article numbers instead of page numbers. See further details here.