Transit-Based Evacuation for Urban Rail Transit Line Emergency


1
College of Transportation, Jilin University, Changchun 130022, China
2
Jilin Provincial Communications Science Research Institute, Changchun 130012, China
*
Author to whom correspondence should be addressed.
Sustainability 2020, 12(9), 3919; https://0-doi-org.brum.beds.ac.uk/10.3390/su12093919
Submission received: 31 March 2020
/
Revised: 29 April 2020
/
Accepted: 8 May 2020
/
Published: 11 May 2020
(This article belongs to the Collection Sustainable Rail and Metro Systems)
Abstract
:Urban rail systems are the backbone of urban transit networks and are characterized by large passenger volumes, high speeds, punctuality, and low environmental impacts. However, unforeseen events such as rail transit line emergencies can lead to unexpected costs and delays. As a means of disruption management, we divide the decision support system for urban rail transit line emergency situations into two stages—transit-based evacuation and bus bridging management. This paper focuses on the transit-based evacuation under emergency scenarios on a single rail line. The model determines the vehicles and routes within traditional transit systems required to evacuate stranded passengers within a given time window. In addition, the proposed method ensures the reliability of traditional transit systems by considering the operating fleet and reserve fleet in the traditional transit systems. Therefore, the proposed optimization model is established with the objective of maximizing the total number of stranded passengers transferred within the given time window and headway constraint. Herein, we present the optimization model and solution method, and the proposed method is validated. The effectiveness of the proposed control method is evaluated in the Changchun urban transit network. By analyzing stranded passengers at stations under different numbers of vehicles and time periods, the results show that the proposed model can significantly provide routing arrangements to maximize the number of passengers evacuated from stations. The results are useful in the development of emergency evacuation plans to prevent secondary accidents and evacuate stranded passengers during a rail transit line emergency.
1. Introduction
Urban rail transit is one of the most important modes of urban commuter transport. Rail-based transit systems can operate at higher speeds than buses typically used in traditional transport systems. However, urban rail transit line emergencies cause unexpected disruptions that can lead to interrupted operations and passenger delays [1,2,3]. A variety of random events ranging from train malfunctions to bomb threats and power failures can cause unexpected service disruptions of varying degrees. Minor events may only cause short disruptions, whereas serious emergencies can lead to longer disruptions owing to lengthier repair times that may be required. On occasion, rail lines are also disabled for routine repairs or long-term maintenance. Failure to take reasonable and timely measures in emergency situations can result in longer than necessary passenger delays and additional safety risks [4]. In order to ensure the reliability of the rail transit system, it is necessary to plan for evacuation for emergency [5]. Once accidents happen, the most important task is to evacuate passengers to a safe space. As a means of emergency management, transit-based evacuation has been widely used to evacuate stranded passengers. Conventional buses are suitable for dealing with urban rail transit service interruptions since they are densely distributed, offer flexible scheduling, and have large capacities. In emergency situations, it is necessary to determine the number of vehicles and routes required and available to evacuate stranded passengers under certain capital constraints.
The literature related to emergency evacuation in urban rail systems can be generally categorized into two classes, pedestrian evacuation in rail stations and evacuation with buses at rail stations. Pedestrian evacuation in rail stations mainly pays attention to pedestrian evacuation inside buildings. Moreover, pedestrian evacuation scenarios are on trains, on platforms, on staircases or escalators, on concourses, and outside the exits. Therefore, from the perspective of evacuation inside rail stations, many studies have focused on the simulation of pedestrian evacuation flow in rail stations [6,7,8]. After evacuating passengers to the outside of rail stations, to prevent secondary accidents and the continuous accumulation of stranded passengers, authorities should mobilize and schedule vehicles to evacuate stranded passengers. Establishing alternative means of transportation for passengers is among the main actions undertaken by authorities, including diversion of travelers to other rail lines and bridging stations using buses. Therefore, from the perspective of evacuation with buses at rail stations, many studies have focused on developing decision support systems for transferring stranded passengers, typically centered on the bus bridging problem [9,10,11,12]. That is, the design of temporary bus services and routes to restore connectivity between the disrupted parts of a rail transit network in the most optimal way. An emergency is an abnormal and usually unplanned operational situation with rail stations or lines. The factors affecting emergency evacuation include occupant factors [13,14], building parameters [15,16], and environmental factors [17,18,19]. In this paper, pedestrian evacuation in rail stations is not a major concern, so we only focus on the evacuation outside rail stations while considering the urban rail transit line emergency. As for the bus bridging problem, Kepaptsoglou and Karlaftis [20] proposed a framework for planning and designing efficient bus bridging networks and offered a set of structured steps, optimization models, and algorithms for handling bus bridging problems. Instead of designing an entirely new bus network, Jin et al. [21] introduced a localized integration of bus services to achieve the desired resilience to potential disruptions. Wang et al. [22] considered dynamic passenger flows during the disruption and established a model with objectives to minimize the total waiting time, the number of stranded passengers, and dispatched vehicles. Further to this, Pender et al. [23] presented a method for assessing the satellite bus reserve locations best suited to service unplanned rail disruptions. The location was optimized relative to the travel time needed to reach the rail service being replaced, the volume of rail replacement incidents, and the scale and spatial distribution of passengers affected. Furthermore, Yin et al. [24] established a three-layer discrete choice model to analyze dynamic passenger flow at disrupted stations and designed an integrated algorithm to manage and control station disruption crises by providing additional bus-bridging services. Although numerous modeling analyses on bus bridging problems can be found in the literature, previous studies focus on passenger rerouting rather than passenger evacuation and ignore the certain time for buses to arrive at isolated stations. During this period, a large number of passengers become stranded within the urban rail transit system, resulting in secondary accidents caused by unexpected disruptions and bad influences on follow-up emergency disposals. Therefore, the top priority in emergency management is to reduce passenger delays and prevent the accumulation of more passengers by completing passenger evacuations within a given time window. Once stranded passengers are evacuated, the flow of passengers in the rail transit system gradually becomes stable again, and bus bridging emergency management can begin. Hence, the concept of decision support system is necessary to be modified, preventing secondary accidents and the continuous accumulation of stranded passengers, which represents the main objective of this work.
Despite its importance, research on transit-based evacuation for urban rail transit line emergencies are still broadly missing in the literature. Transit-based evacuation problems for natural disasters have been studied for a long time, whereas urban rail transit line emergencies are seldom of major concern. In the most closely related study, Bish [25] introduced a model specifically designed for bus-based evacuation planning, along with two mathematical programming formulations used to develop a heuristic algorithm. Kulshrestha et al. [26] proposed a robust optimization model to determine the optimal pick-up points for evacuees to assemble and to allocate available buses for transporting the assembled evacuees between pick-up locations and public shelters. Goerigk et al. [27] formulated a two-stage bicriteria robust optimization that considers both evacuation time and vulnerability of the evacuation schedule to changing circumstances. Yun et al. [28] proposed a feeder-bus dispatch planning model for the collaborative optimization of urban rail transit and feeder-bus cooperation under emergency situations. Shahparvari and Abbasi [29] proposed a stochastic modeling approach as an evacuation decision support system to determine the required vehicles, scheduling, and routes with uncertainties in the population of evacuees, the time window, and bushfire propagation. Further to this, Shahparvari et al. [30] developed a vehicle-routing problem model to enhance the efficiency and effectiveness of short-notice emergency response and rescue operations. The model was able to compute the required number of vehicles and identify the safest routes and schedules for late evacuees for various time windows and road risk factors. However, traditional transit systems consist of the operating fleet, which is defined as the number of vehicles operating on a line and the reserve fleet, which acts as a backup when operating vehicles require routine or planned maintenance [31]. Although traditional transit system fleets have been used as evacuation vehicles in many studies, previous studies only focus on operating fleets rather than reserve fleets. Additionally, in the existing studies, the reliability of traditional transit systems has not received sufficient consideration where the traditional transit system provides vehicles for evacuating passengers without a concern of the decreasing frequency of the remaining vehicles for the conventional service. In order to ensure the reliability of traditional transit systems, the number of vehicles required and available under the headway constraints of bus lines should be considered, which represents the main objective of this work.
In this paper, we design a decision support system for urban rail transit line emergency that consists of emergency scenarios analysis, transit-based evacuation, and bus bridging management. In this decision support system, we propose a new type of optimization model for assigning vehicles in the traditional transit systems to evacuation tasks under transit-based evacuation. Furthermore, the proposed method is tested under an urban rail transit line emergency in the Changchun urban transit network, and the improved genetic algorithm is applied to address the optimal solution.
The main contributions of this study can be summarized as follows:
- (1)
- The concept of a decision support system for urban rail transit line emergency is modified, adopting the traditional bus service to the train stations to improve its applicability. Moreover, a transit-based evacuation is considered to reduce passenger delays and prevent the accumulation of more passengers. Once stranded passengers are evacuated, the flow of passengers in the rail transit system will gradually become stable again, and bus bridging emergency management can begin.
- (2)
- The operating fleet and reserve fleet of the traditional transit system are integrated into the transit-based evacuation model to assign vehicles for evacuating stranded passengers within a given time window. In order to ensure the reliability of traditional transit systems, the model determines the number of vehicles and routes required and available under the headway constraints of bus lines.
The remainder of this paper is organized as follows. In Section 2, a formal description of the problem is provided, including all of the assumptions and constraints, and the optimization model is described. In Section 3, the solution method is presented. In Section 4, verification of the model by urban transit systems under urban rail transit line emergency is presented. Lastly, the results are summarized in Section 5, and areas of future research are discussed.
2. Problem Formulation
2.1. Problem Description and Assumptions
In this section, we describe the process of evacuation with buses at rail stations under an urban rail transit line emergency. When an urban rail transit line emergency occurs, an evacuation plan is selected according to the severity and duration of the disruption, the spatial extent of the disruption, and the current travel demand. The duration of the disruption affects the evacuation plan. For example, if the disruption is short, less time may be needed to restore rail transit services compared to mobilizing and scheduling vehicles to start the evacuation. In this case, the disrupted rail line is repaired quickly, and there is no need to schedule vehicles for such a minor disruption. For more serious disruptions that require more time to repair, the metro often continues to operate outside the disrupted section, but the metro stations must be bridged by vehicles. It is expected that even at the time of the disruption, regular passenger travel habits do prevail. Moreover, passengers are willing to continue their trip with the rail lines up to the point when this is feasible and then transfer to a bus line. Such behavior is certainly desirable by transit authorities at the time of the incident since bridging routes and vehicles are needed. Conventional buses are suitable for scheduling for urban rail transit service interruptions since they are densely distributed, offer flexible scheduling, and belong to the public transport system. The traditional transit system may increase passenger delays temporarily for the stranded passengers that face secondary accidents caused by unexpected disruptions at rail stations. This type of service is temporary, and its purpose is to serve for far larger capacity and demand for travel, providing the best possible service to travelers, both for adequately supporting the operations of the overall public transport system and for retaining its credibility [20]. Therefore, it is sensible for available reserve vehicles to start the evacuation at isolated stations to the temporary shelters near the isolated stations. Further, if authorities do not have an adequate number of reserve vehicles, it may take operating vehicles from bus lines nearby isolated rail transit stations.
In emergency scenarios, accidents like fire, explosion, or toxic gas release in stations always threaten human lives. The accidents occurring in rail transit stations have also led to severe life and social-economic losses. Therefore, time is always a crucial consideration, and the top priority in emergency management is to reduce passenger delays. If the accumulated passengers are not moved away from the relevant station, they will have secondary accidents caused by unexpected disruptions, and have bad influences on follow-up emergency disposals. As usual, the severity and the spatial extent of the disruptions are different among isolated stations. The current accumulated passengers are also different among the isolated stations. Therefore, available evacuation time windows for stations are determined by the spatial extent of the disruption and the current travel demand. Evacuation strategies should attempt to ensure that the maximum potential number of stranded passengers are evacuated using a finite number of available vehicles within the available clearance times. Once stranded passengers are evacuated, the flow of passengers in the rail transit system gradually becomes stable again, and the bus bridging emergency management can begin.
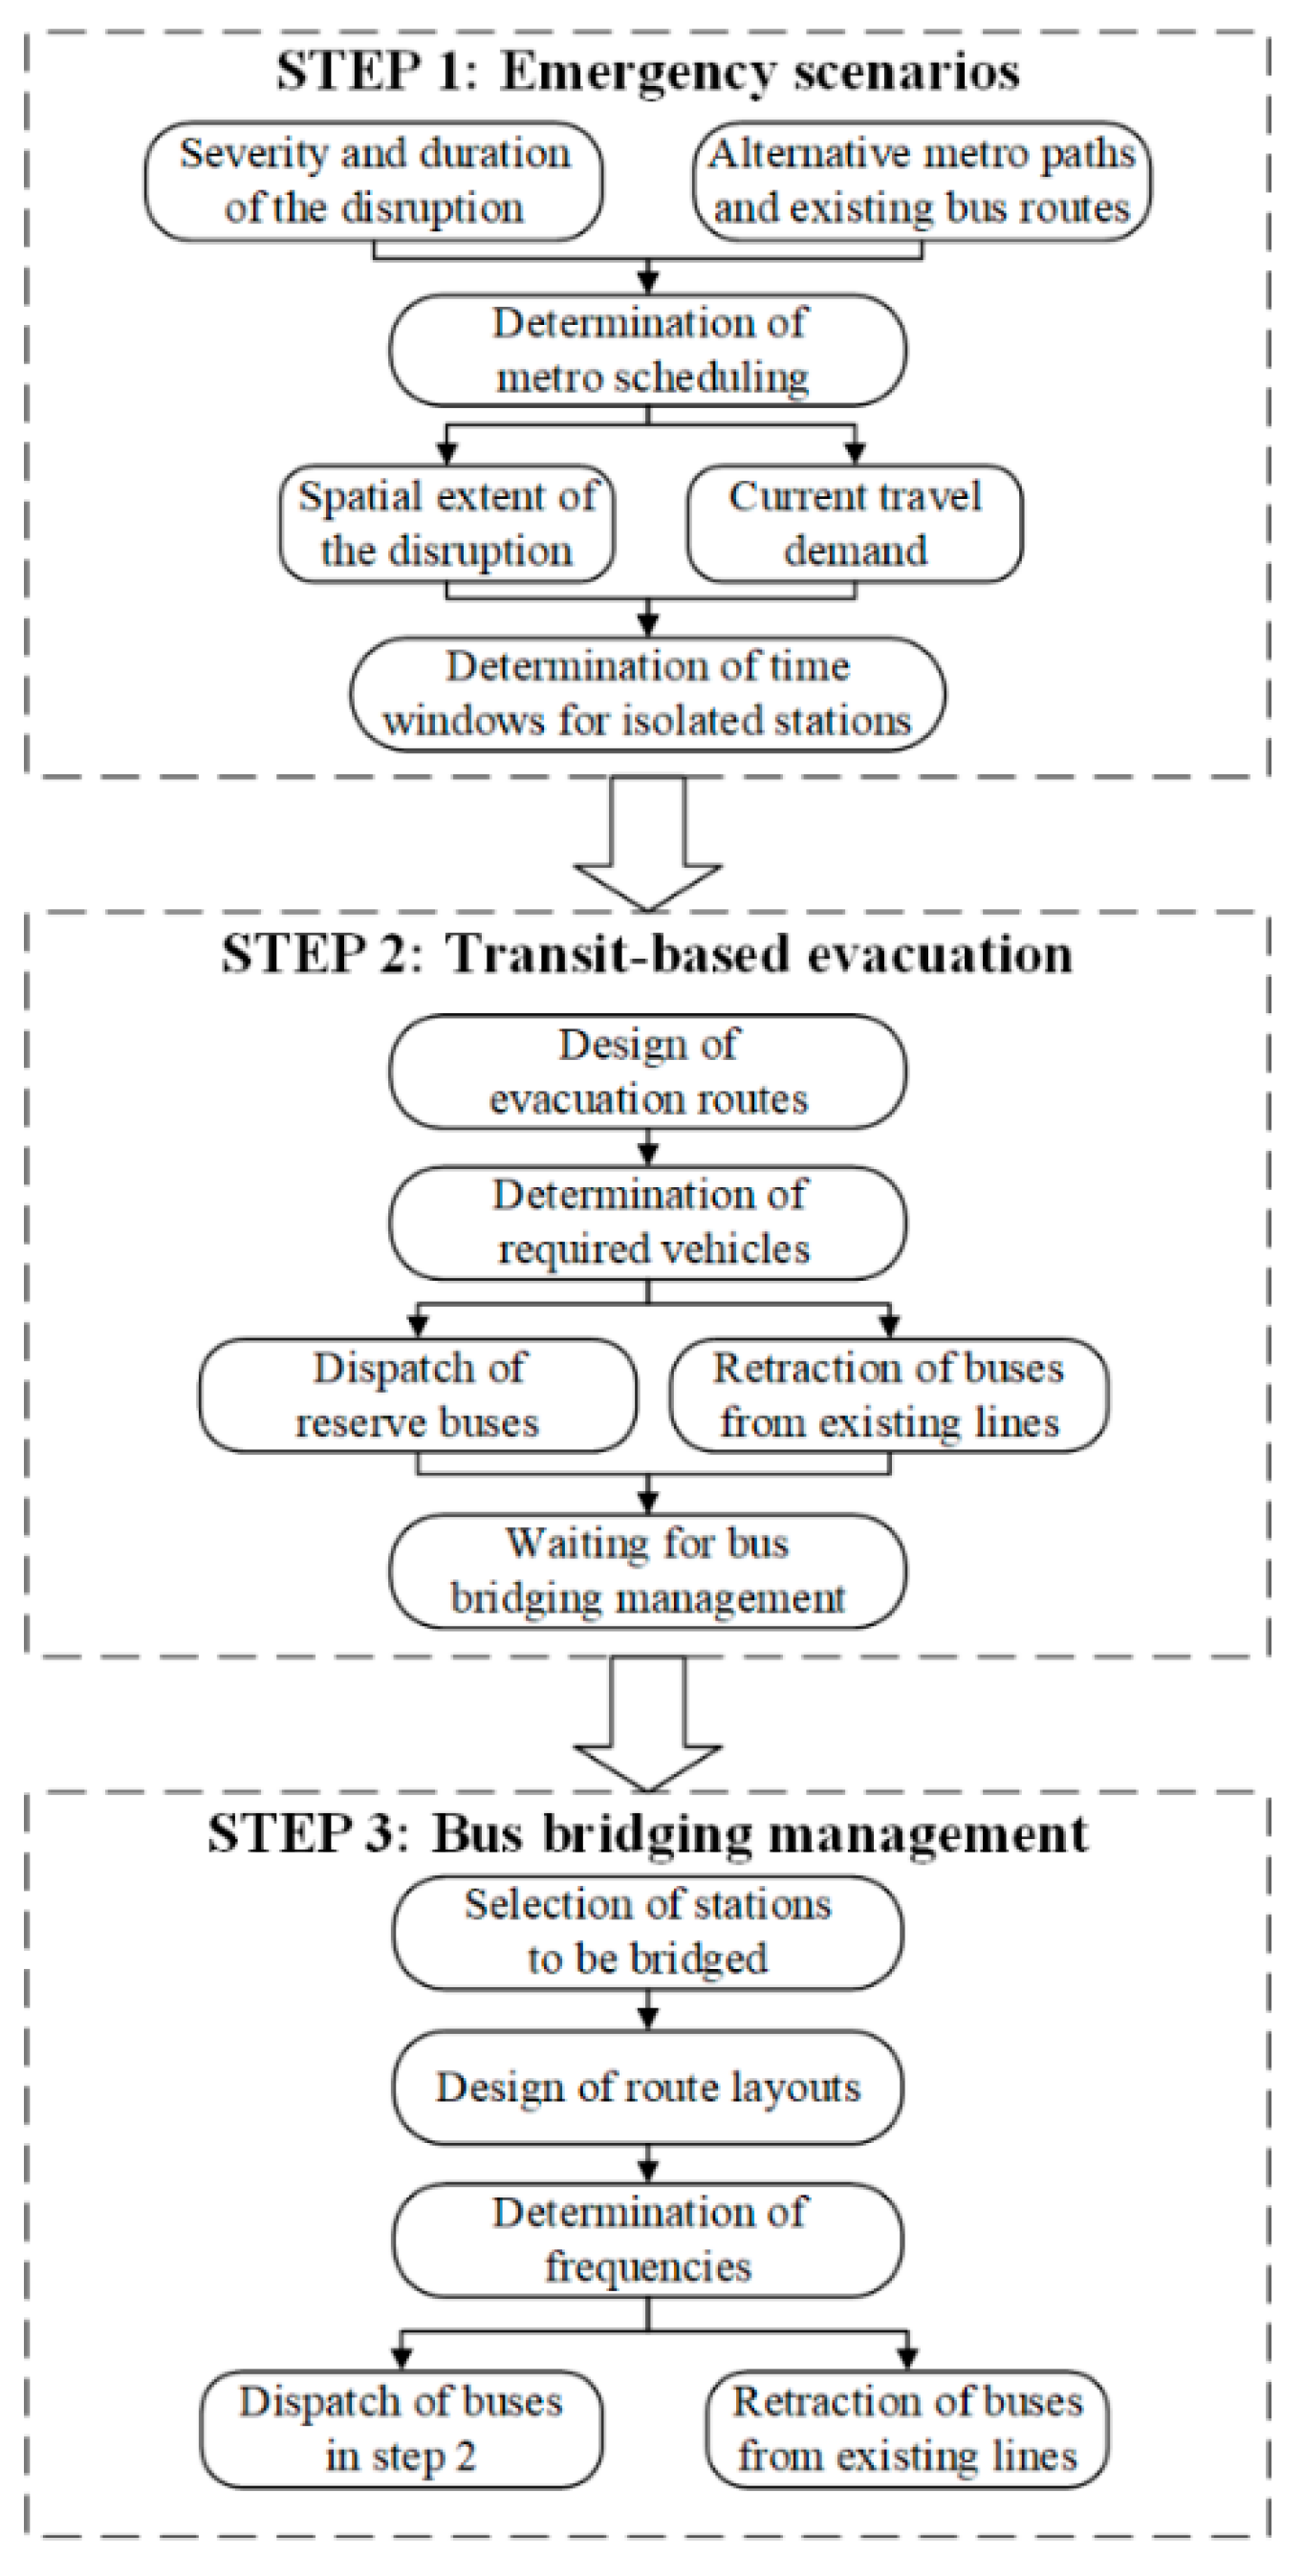
Figure 1 illustrates the proposed decision support system for urban rail transit line emergency situations. In the first stage, emergency scenarios are analyzed according to the severity and duration of the disruption. Metro scheduling are adjusted with alternative metro paths and existing bus routes. Moreover, available evacuation time windows of stations are determined by the spatial extent of the disruption, the current travel demand at isolated stations. In the second stage, to prevent secondary accidents and the continuous accumulation of stranded passengers, authorities often mobilize and schedule vehicles to evacuate stranded passengers in the urban rail transit system within a given time window. Besides, vehicles are assigned from the reserve fleet and retracted from the operating lines based on their proximity and availability. Moreover, bus bridging emergency management begins once passengers are gradually evacuated, and the number of stranded passengers is greatly alleviated. When passengers are gradually evacuated, scheduled vehicles come back to the temporary shelters waiting for the bus bridging emergency management. In the third stage, authorities often schedule vehicles to bridge stations, and the associated service frequencies are determined under bus availability and feasibility constraints. In this paper, we only focus on transit-based evacuation, and the bus bridging problem is not a major concern.
The transit-based evacuation model is based on the following assumptions:
- (i)
- The stranded passengers are evacuated by scheduled vehicles in the traditional transit system rather than staying at stations waiting for bus bridging or being transferred by other modes.
- (ii)
- Passengers in the traditional transit system arrive independently of the timetable, and bus headway is evenly distributed.
- (iii)
- Each bus line has an operating fleet and a reserve fleet, and the reserve fleet of bus lines stays in the bus terminal stations to ensure the reliability of the traditional transit system.
- (iv)
- Vehicles dispatched from bus lines can serve routes between the isolated stations and temporary shelters, and their capacity and speed are fixed values.
- (v)
- Traditional transit systems and rail transit systems are brought under a single control in the event of an emergency.
Assumption (i) is critical to our model, since the behavioral responses of passengers to disruption scenarios are so complex, other modes of transferring evacuees are not discussed. The number of transferred stranded passengers in the urban rail transit system remains constant in this paper. The discrete choice behavior model to analyze the dynamic passenger flow under disruption can be found in Wang et al. [22]. We assume passengers normally arrive independently of vehicle arrivals in the traditional transit system, and bus headway is evenly distributed, according to assumption (ii). This is because passengers in the traditional transit system are not affected by the emergency in this paper. The bus headway is evenly distributed because the bus timetable is related to the probability distribution of passengers’ arrival time. Moreover, evenly distributed bus headway can ensure the reliability of the traditional transit system. Each bus line has an operating fleet and a reserve fleet for traditional transit systems rather than for the rail transit system. Stranded passengers in a rail line emergency are more than that in the bus line emergency scenario, and it even needs to retract vehicles from operating bus lines. If the bus terminals exist on more than one bus line, backup vehicles from any of the bus lines may act as evacuation vehicles. Therefore, the assumption (iii) holds true. According to assumption (iv), the capacity and speed of all vehicles are the same because the road availability and uncertainty of travel times are not major concerns in this paper. If we consider delays due to traffic congestions and road availability in the event of an emergency, it will lead to another challenging topic in optimization. Assumption (v) is also significant since unknown bus driver preferences lead to another challenging topic in optimization. In the event of an emergency, traditional transit systems and rail transit systems are managed by the government to ensure the reliability of the systems. Finally, geographical information systems and wireless communication systems of public transit systems make it possible for timely transit-based evacuation when urban rail transit line emergencies occur [32]. The sets, parameters, and decision variables are defined in Table 1 before we present the mathematical formulation.
Our idealized model consists of both the urban rail transits and the traditional transit system. In the traditional transit system, we treat the bus route as a dynamic system and operating vehicles move at a constant average velocity around a circular route of known length [33,34]. At any point in time, bus headway E(H) is evenly distributed around the circuit and related to the frequency. Additionally, implementing station control and interstation control strategies make it possible to maintain evenly distributed bus headways [35]. Each vehicle performs a feasible sequence of service trips. Backup vehicles from the reserve fleet start at the same bus terminal and end at each service trip at temporary shelters waiting for bus bridging emergency management. If there are not enough vehicles, it retracts vehicles from the operating fleet. Moreover, vehicles operating in the transit system must first finish their trip before they can begin the evacuation.
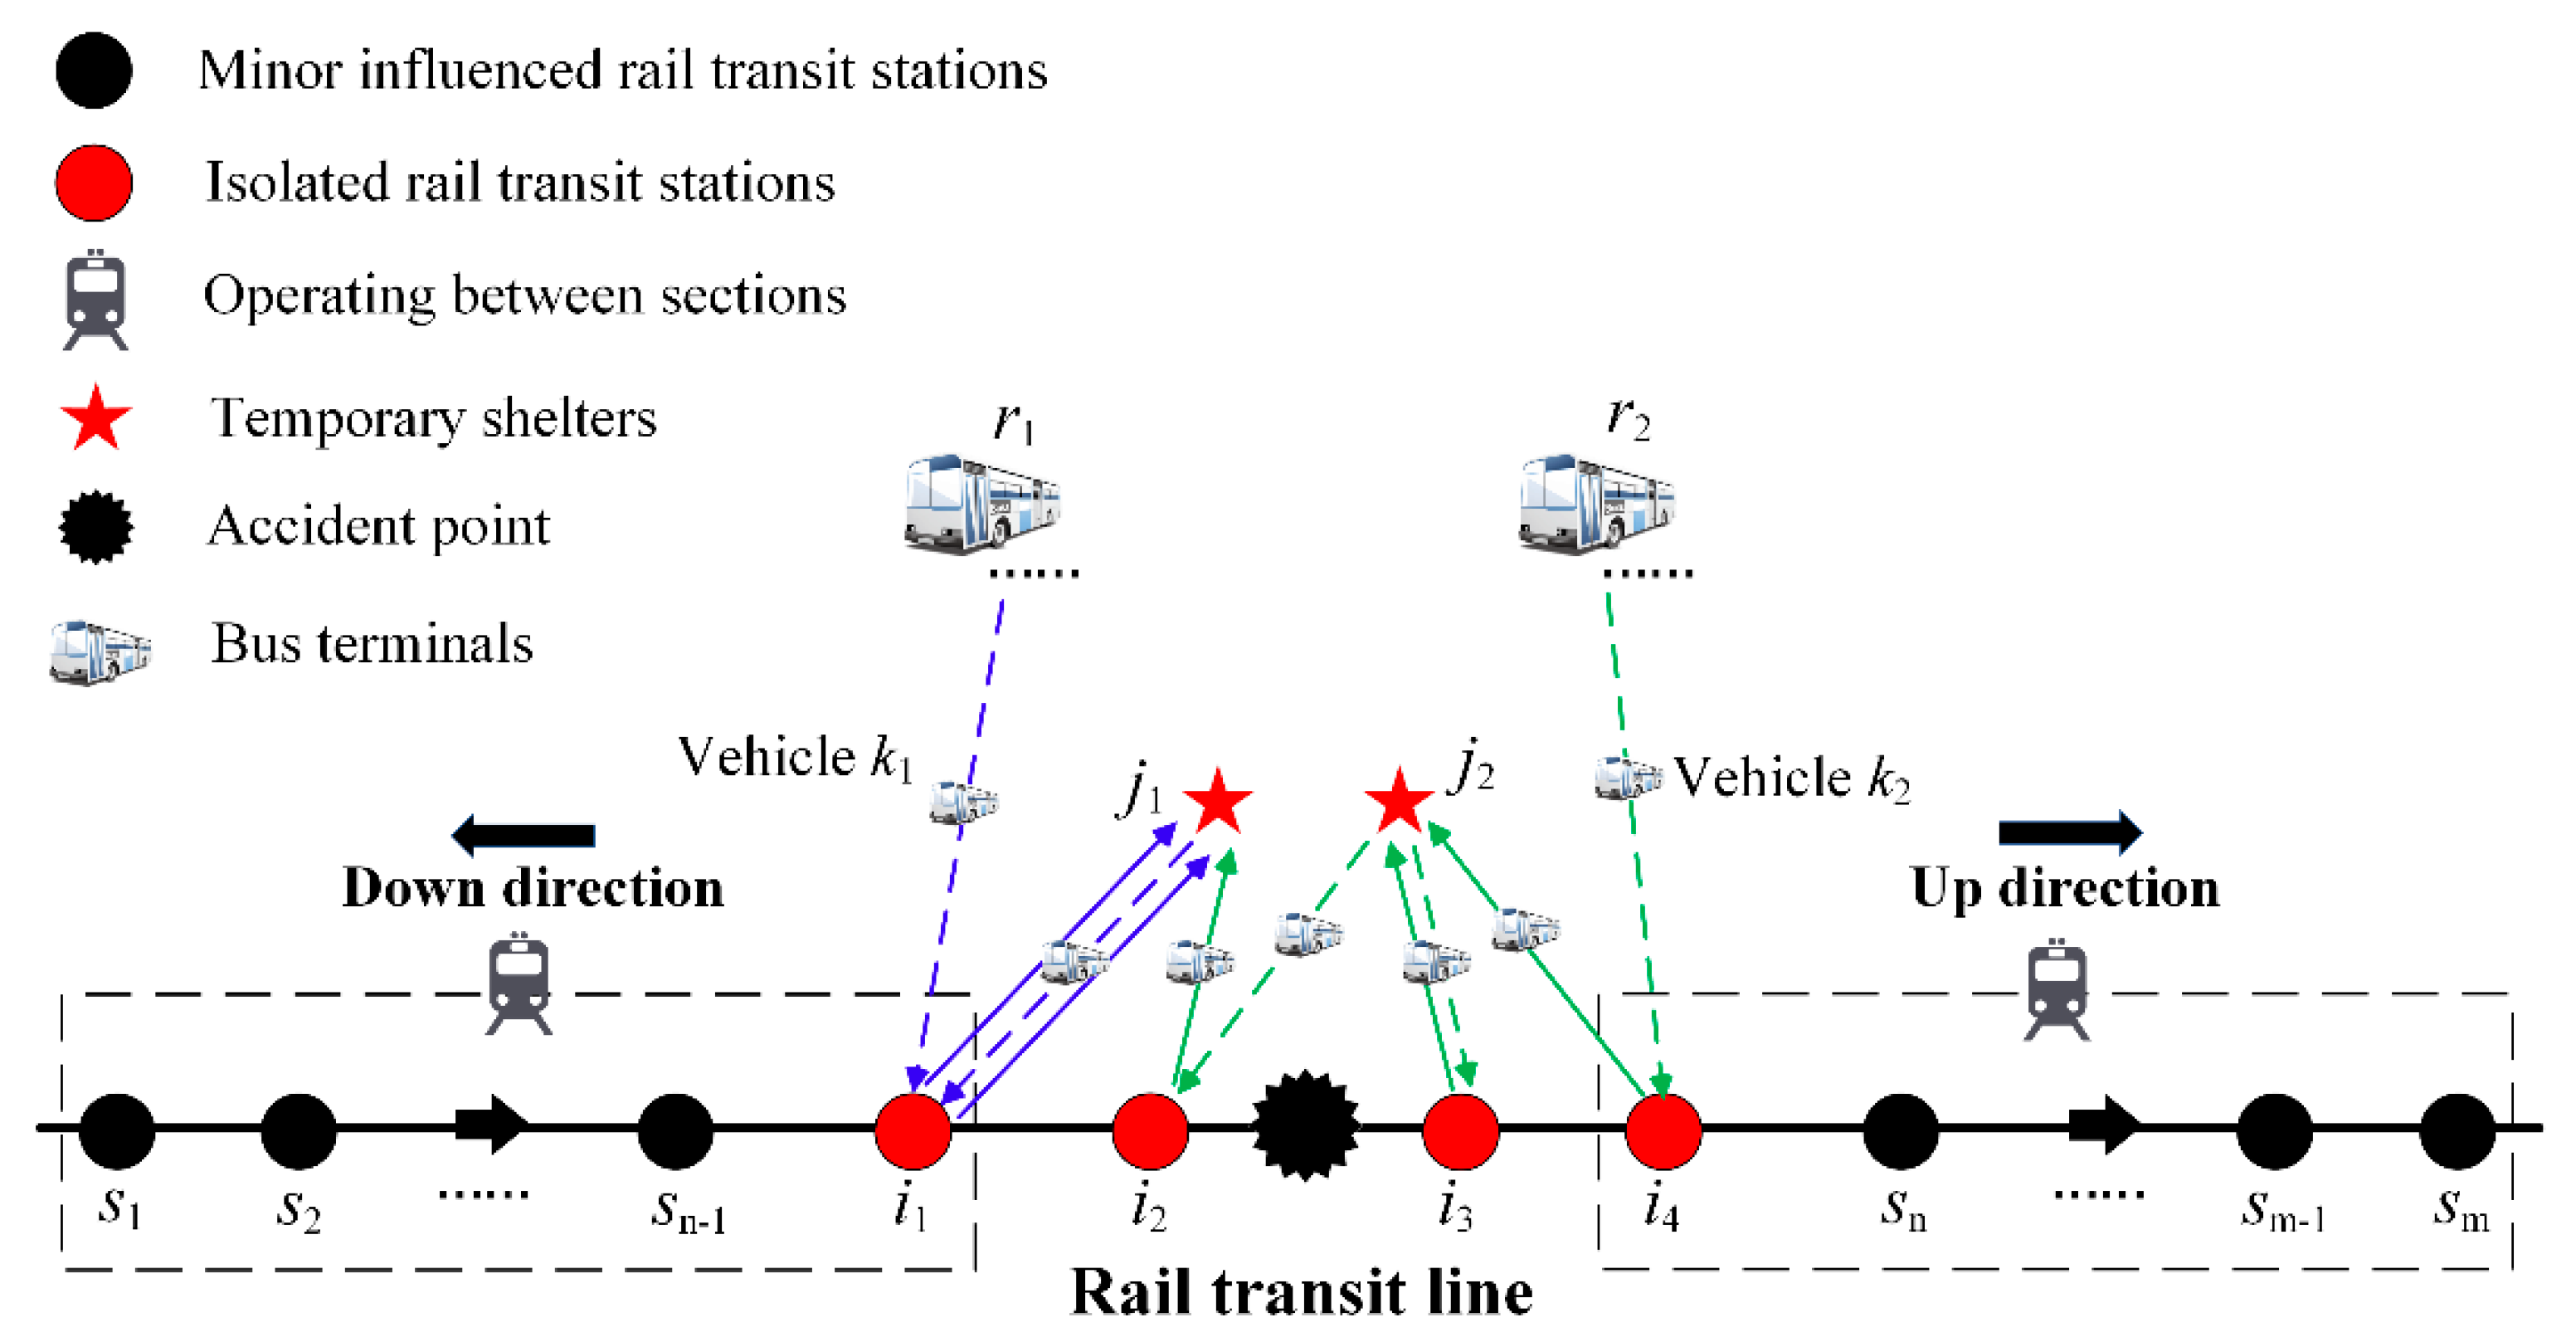
Figure 2 illustrates the topological structure of the problem. Solid lines represent passenger evacuation routes, and dotted lines represent evacuation routes without passengers. When an urban rail transit line emergency occurs, a large number of passengers may be stranded in rail transit stations near the incident point. Authorities schedule the metro to operate outside the cut-off section that has crossovers for turn-overs between rail transit station S1 and the isolated rail transit stationi1, and between the isolated rail transit station i4 and the rail transit station Sm with reentry facilities. Based on information about the urban rail transit line emergency, backup vehicles from bus line terminals are mobilized and scheduled to evacuate stranded passengers in the urban rail transit system within the given time windows. Scheduled vehicles operate until the number of stranded passengers is greatly reduced. Minimizing response time is critical to the quality of the bus service. Then vehicles are scheduled to service the remaining passengers stranded in cut-off rail transit stations.
When passengers are gradually evacuated, scheduled vehicles come back to the temporary shelters waiting for bus bridging emergency management. In Figure 1, vehicle k1 is scheduled to operate twice between the isolated rail transit station i1 and the temporary shelter j1 in order to evacuate stranded passengers to temporary shelter j1, and then return to temporary shelter j1 to await further instructions from the bus bridging emergency management. Vehicle k2 is scheduled to operate once between the affected station i4 and the temporary shelter j2 to evacuate stranded passengers to temporary shelter j2, then transfer passengers from station i3 to the temporary shelter j2 and from temporary shelter j2 to station i2, and to evacuate stranded passengers to temporary shelter j1, and then return to the temporary shelter j2 to await further bus bridging emergency management instructions.
Based on the urban rail transit line emergency information, the authorities mobilize and schedule vehicles from bus lines to evacuate stranded passengers in isolated station i to temporary shelter j within a given time window. Near isolated stations, operating vehicles on line r travel with an evenly distributed headway, and the reserve fleet of backup vehicles are located in the bus terminal. When an urban rail transit line emergency occurs, ripple effects from the disruption often spread to other stations and bus lines. Some passengers may travel to the traditional transit system to finish their trip, whereas other passengers may travel to the traditional transit system and reenter the rail transit system from there to finish their trip. Some passengers wait for bus bridging instead of turning to the traditional transit system.
The threshold of the scheduled vehicles from r bus lines is defined by the maximum headway and required to maintain the reliability of the traditional transit system. Moreover, the average headway of the bus line is related to the frequency, which is determined by the ripple effects in the bus line. After setting the frequency, the operator usually considers the turnover time and the shortest stop time at each bus terminal, and the operating fleet is adjusted to operating vehicles. In addition, the operator prepares backup vehicles as the reserve fleet, in general, . The average headway on line r depends on the number of scheduled vehicles on line r. When the number of the scheduled vehicles is , the operator does not change the frequency; therefore, headway remains basically the same based on the availability of the reserve fleet. When the number of scheduled vehicles on line r is , there are no available reserve fleet vehicles; therefore, the number of operating vehicles in the transit system decreases as operating vehicles are reallocated for the evacuation. Subsequently, the average headway of line r under is defined by (Equations (1)–(3)):
Based on the threshold of the scheduled vehicles, we divide scheduled vehicles k into r parts, and K represents the set of vehicles on bus line r, . For route 1, when the scheduled vehicle is , the operator schedules the available reserve fleet vehicles first, and then schedules vehicles in the operating fleet once they have finished their current trip. As a result, we can divide the scheduled vehicles within the transit system into two categories—the reserve fleet vehicles and the operating vehicles . When the number of the scheduled vehicles is , the available vehicles in the reserve fleet start the evacuation immediately, and the distance of vehicles from bus line r to station i is . When the number of the scheduled vehicles is , vehicles operating in the transit system must first finish their trip before they can begin the evacuation. The total distance from vehicle k to station i is , which depends on the average headway and the location of the nearest operating vehicle. The distance from the nearest operating vehicle on line r to the bus terminal is , and the distance from station i to line r is . Therefore, the passengers in the scheduled vehicle can finish their trip rather than being taken to the isolated rail transit stations. Based on the decreasing frequency of the remained buses for the conventional service, the regular passengers in the bus system may bear the consequences temporarily for the stranded passengers that will face secondary accidents caused by unexpected disruptions at rail stations. The geographic information systems and wireless communication systems of public transit systems make it possible to obtain the location of the nearest operating vehicle in a timely fashion when an urban rail transit line emergency occurs. The distance of vehicle k from the bus lines to station i is defined as (Equation (4)):
2.2. Mathematical Formulation
The models presented in Section 2.1 can be used to calculate certain objectives of the transit-based evacuation under an urban rail transit line emergency scenario. In order to reduce passenger delays and prevent the accumulation of more passengers, the evacuation process should be completed as soon as possible. However, if we minimize the total evacuation time under the premise of satisfying demand, it will need to ensure that the transportation capability of the scheduled vehicles to stations should be more than the number of stranded passengers at stations. That is to say, there will always be enough vehicles waiting for an emergency event at the end terminal, and it is not a common element in bus-operation. Therefore, the notion of the urgency of the service is defined by the time windows. Evacuation strategies should attempt to ensure the maximum potential number of transferred passengers using a finite number of vehicles within the time windows. To prevent secondary accidents and passengers from continuously accumulating, the objective is to maximize the total number of stranded passengers transferred within the given time window [36]. The objective functions can be expressed as follows (Equation (5)):
Subject to (Equations (6)–(20)):
Equations (6)–(30) are constraints of the objective function and are used to improve the solution method process. Equation (6) defines the number of the scheduled vehicles in line r; Equation (7) ensures the average headway is less than the maximum headway of bus line r to maintain reliability of the traditional transit system, which is, in turn, is dependent on the experience of the operator and the number of scheduled vehicles in bus line r; Equation (8) is the time window constraint and guarantees the total time traveled by a vehicle does not exceed the total available time window for each isolated rail transit station; Equation (9) encompasses the temporary shelter absorption capacity, in other words, the sum of the transferred stranded passengers from various stations to temporary shelter j during any time period should be less than the total capacity of the temporary shelter j plus the vehicle capacity. It is worth mentioning that the capacity of vehicles is added to the right-hand side of the constraint to avoid a leftover population of the temporary shelter when it is less than the vehicle’s capacity; Equation (10) stipulates that the number of stranded passengers at station i after the available clearance time should be less than or equal to the minimum number of stranded passengers at station i to prevent secondary accidents; Equation (11) restricts the total boarding capacity of the vehicle to the population of evacuees at each station. In other words, this constraint dictates the total number of evacuees that can be evacuated from station i to all temporary shelters at all time periods, which should be less than the entire population at station i. It is also worth noting that the capacity of vehicles is added to the right-hand side of the constraint to avoid leftover passengers when the passenger population is less than the capacity of the vehicle; Equation (12) implies that all vehicles must start from a station in each time window; Equation (13) restricts vehicles from starting their services from temporary shelters in the first time window; Equation (14) defines the endpoint of vehicles in each time window; Equation (15) indicates that at the end of the final time window, vehicles can only finish their service at the designated temporary shelter; Equation (16) guarantees the continuous flow of vehicles by starting their next service from the last finished point; Equation (17) ensures the flow of the network is maintained within each time window, i.e., for each vehicle, the quantity that arrives at a node must be equal to the quantity that departs; Equation (18) guarantees that the number of times a vehicle travels from is an integer; the remaining Equations (19) and (20) specify the domain for binary variables.
3. Solution Method
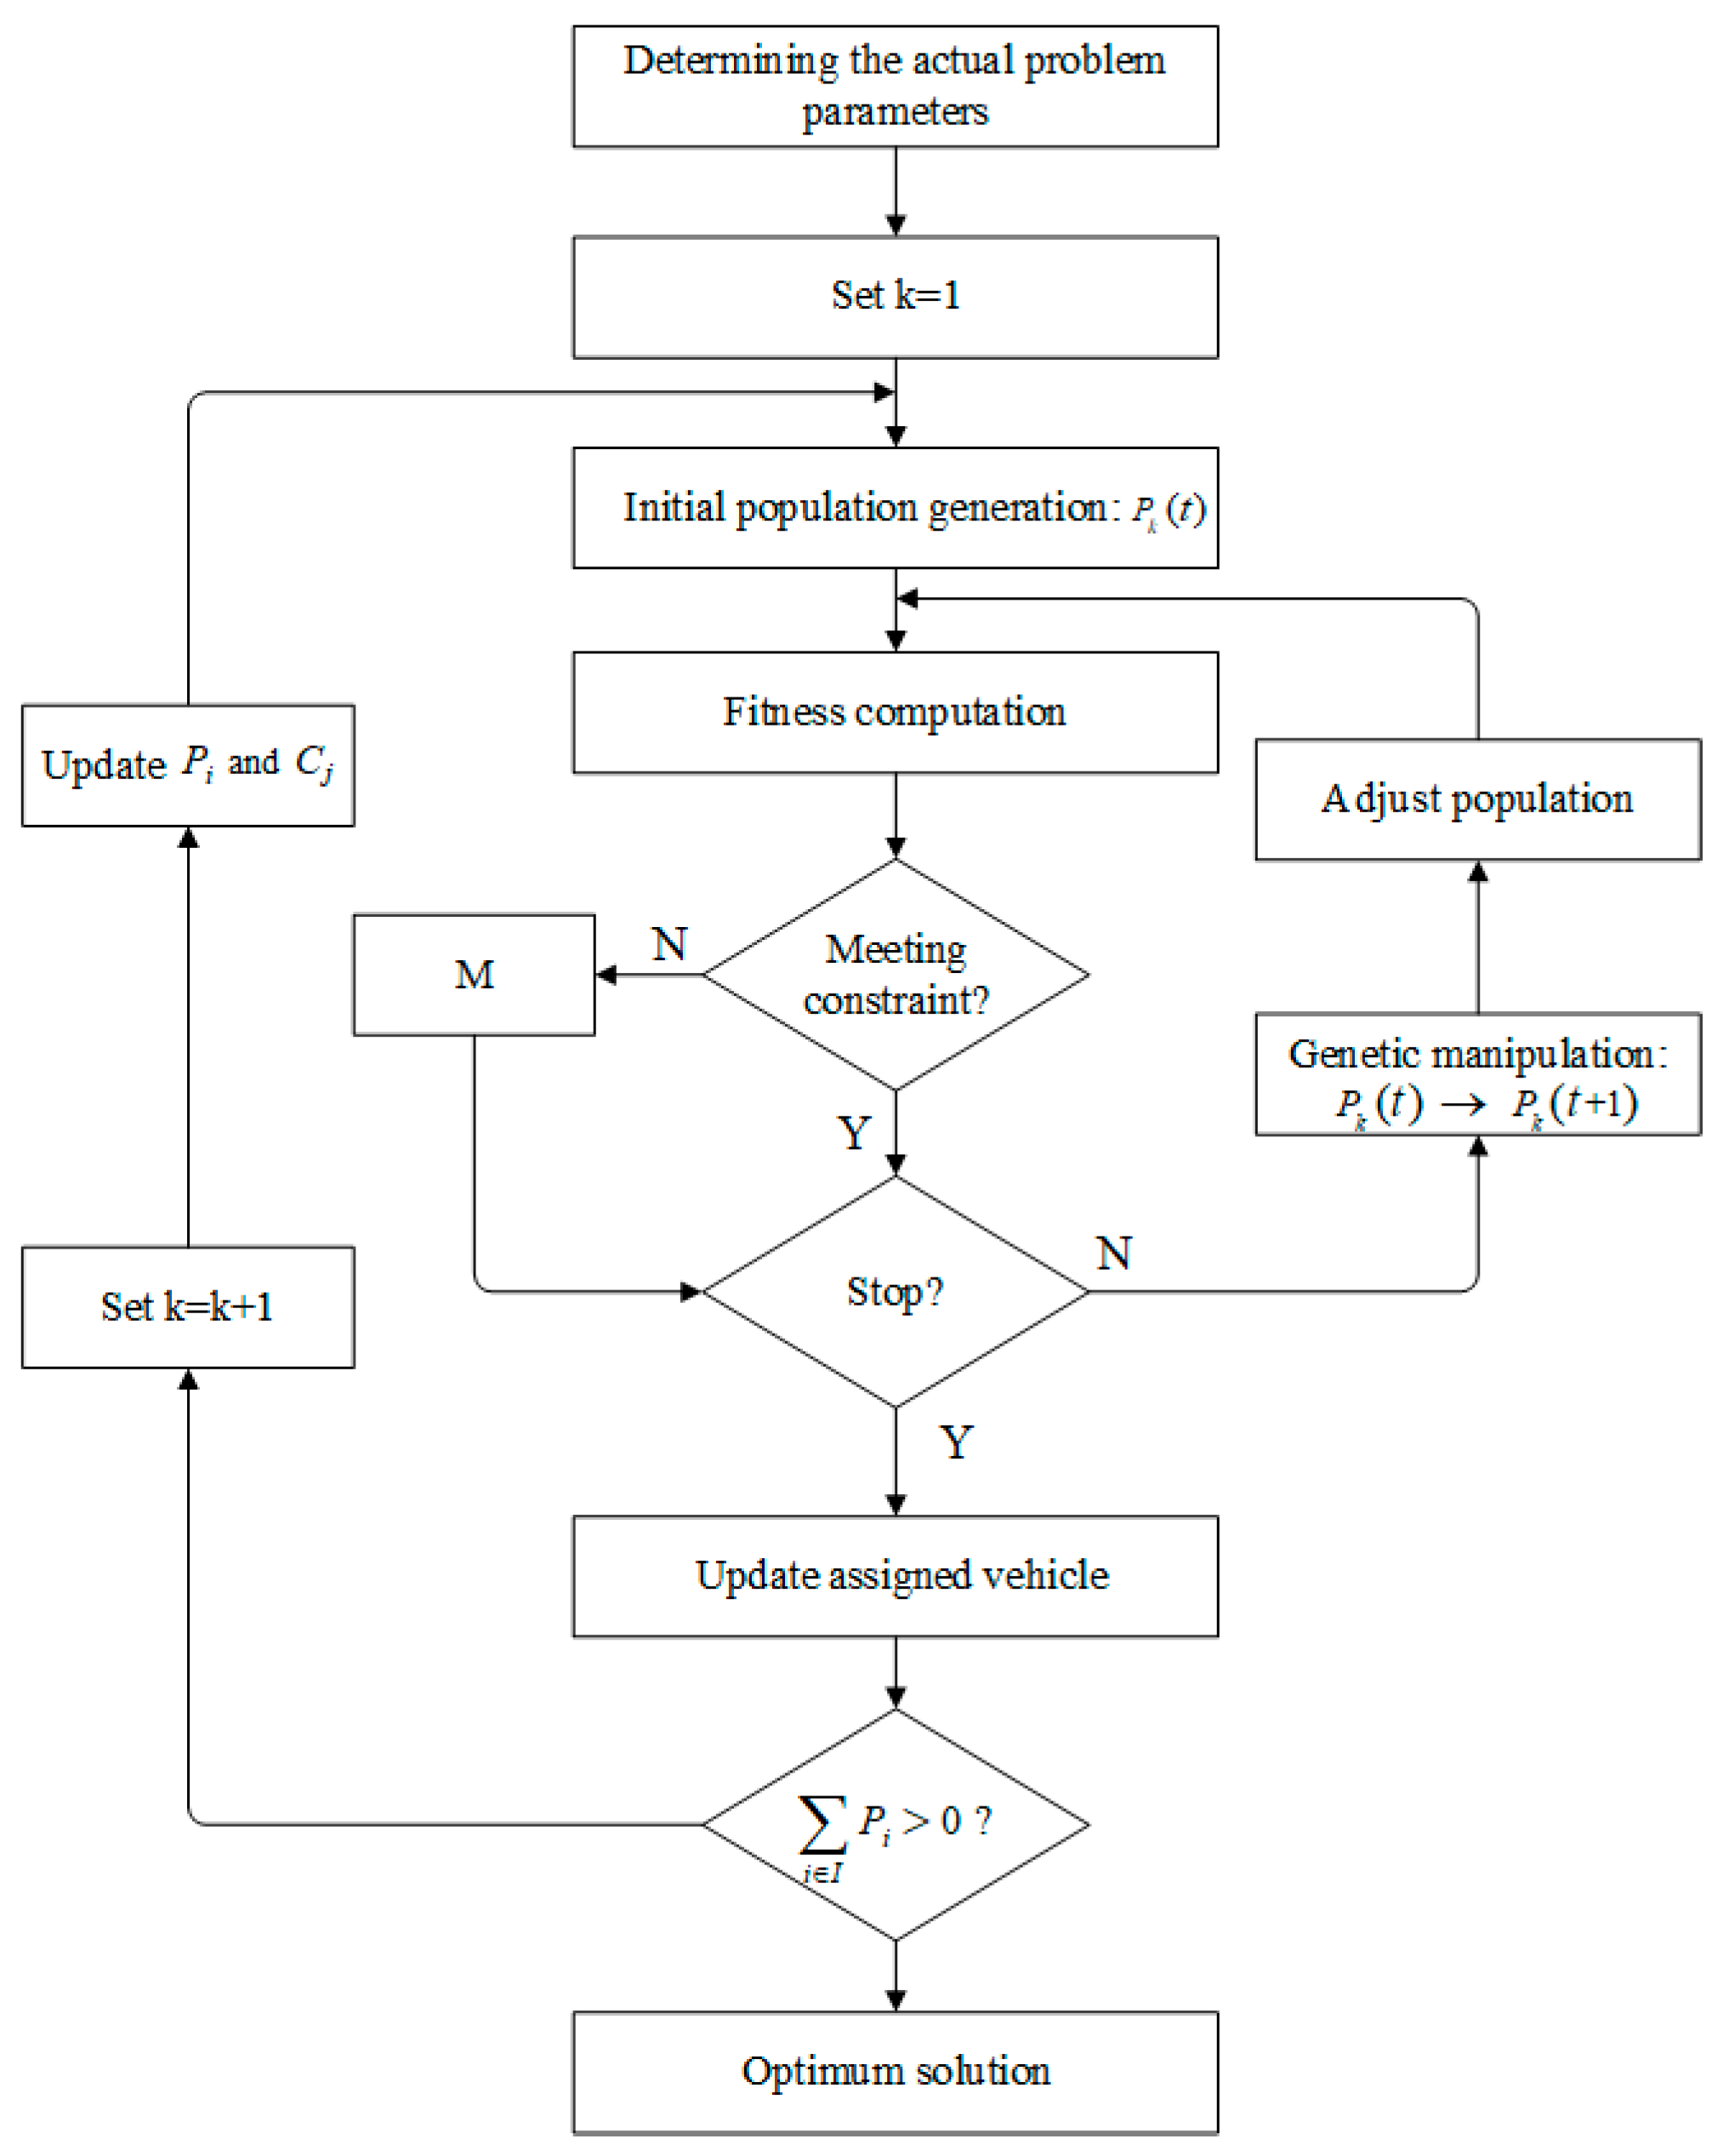
The optimization model is a multi-destination capacitated dynamic vehicle routing problem with a time window. Due to the fact that the proposed model is a complex and non-deterministic polynomial-time hard (NP-hard) problem, exact solutions of large-scale experiments are not practical in large sizes. The feasible approaches would be classified into a decomposition-based algorithm, gradient-based algorithm, and intelligent algorithm. The genetic algorithm is an evolutionary optimization algorithm that conducts a search through the space of solutions by exploiting a population of points in parallel rather than a single point [37]. To assure the applicability and generality of the proposed model to realistic size-case studies, the improved genetic algorithm is used to solve the problem and obtain the optimal solution. Figure 3 illustrates the solution algorithm for the above objective function.
As Figure 3 demonstrates, an improved genetic algorithm is implemented to generate the routing plans by assigning the required number of vehicles individually. To begin with, the algorithm assigns only one vehicle (k = 1) to be served, and the reserve fleet has the priority to be assigned, considering the reliability of the urban transit system. The population elements are completely defined by their genomes in the initial population generation logical block. The model prioritizes the isolated stations based on pre-defined time windows and traversal times, and generates the first vehicle routing plan aiming at maximizing the total number of transferred stranded passengers. The initial generated population repeatedly undergoes a series of genetic operators in the genetic manipulation logical block until new, ‘‘better” genomes are produced. Then the algorithm checks if the remained stranded passengers at each station are transferred incompletely and updates the assigned vehicle (k = 2) to be served. The reserve fleet has the priority to be assigned until there is no reserve fleet in the bus line to be assigned. If there is no reserve fleet to be assigned, the operating fleet in the bus line needs to be assigned until the average headway of the bus line is more than the maximum headway of the bus line. Then the algorithm updates the remained stranded passengers at each station and the temporary shelter absorption capacity in the model as follows (Equations (21) and (22)):
In the same way, a second vehicle (k = 2) is assigned to travel among isolated stations and temporary shelters and transfers the remaining stranded passengers as long as the time windows allow. The proposed method continues the assignment of vehicles until there is no more population left to be evacuated and amends the parameters until the optimal number of required vehicles are acquired.
In the initial population generation logical block, an evacuation plan is coded to a data structure named a chromosome. Multilevel coding is used to construct the chromosome, and the layers represent time periods and access orders. We first compare the time windows of each station based on Equation (8), and if the time windows are the same, they are transformed into a single time period. Then, we count the maximum number of trips a vehicle can make within the time period. The maximum number of trips is determined by the maximum available time windows, the shortest travel time for the routes, and the distance of the vehicles from the bus lines to the station. Finally, we randomly generate access orders for the available isolated rail transit stations and temporary shelters in each time period.
To schedule a vehicle in the first time period, the first position gene is generated as the rail transit station. Then the gene positions are numbered, with odd numbers for rail transit stations and even numbers for temporary shelters. The value range of each odd and even position number spans from one to the number of available rail transit stations or from one to the number of the temporary shelters. The number of available rail transit stations is constrained by the time windows of the isolated stations. Therefore, the available stations decrease by the time period. All the time periods in the chromosome are treated in the same way. In the decoding process, can be calculated according to the adjacent position number of the station number and the temporary shelter number in time period n. Besides, a vehicle cannot always perform the maximum number of trips within the time period. The number of trips in a time period is determined by an available time window. When the vehicle finishes at the station in the first time period, the vehicle should start at a temporary shelter in the second time period. Therefore, should be calculated by the second number of the second time period. The number of trips in the second time period is determined by the available time window as well. All the time periods in the chromosome are treated in the same way except for the last period. The number of trips in the last period should is determined by the available time window and the last number to ensure service vehicles only finish at temporary shelters and not at the station. In this way, no other array is considered for and since the constraints are satisfied by the decoding process.
In the fitness computation logical block, the remaining stranded passengers in the urban transit system are used to assess fitness, which is defined by the total number of transferred stranded passengers of vehicles. If an individual can meet all the constraints, optimal route planning should be conducted to determine the corresponding fitness value. Otherwise, the fitness value should be equal to a large number M if constraints cannot be met under the corresponding individual evacuation service. Since the objective is to determine the minimum fitness value of the remaining stranded passengers, a fitness value indicates that the particular evacuation service is inappropriate. In the genetic manipulation logical block, a mutation probability and crossover probability are preset ranging from 0 to 1. The uniform mutation method is used to switch bits in a genome in each time period according to a predefined mutation probability. For each bit within a genome, a random number ranging from 0 to 1 is produced. If the number is smaller than the predefined mutation probability, the bit is mutated to a random number with uniform distribution in a value range. The value range of each odd and even position number are from one to the number of available rail transit stations and from one to the number of the temporary shelters, which is constrained by time windows of the isolated stations. A uniform crossover method is used to exchange bits of two-parent genomes in each time period according to a predefined crossover probability. The method randomly selects bits from each parent genome to perform the crossover according to a predefined crossover probability. Moreover, the probability defines the percentage of genes for each genome to be crossed over. In addition, the better genomes are those with lower fitness function value, and the genetic algorithm is designed to do a search to minimize the fitness function. The generation will keep on evolving until the specified stopping condition has been fulfilled. In this research, the termination criterion monitors the improvement from generation to generation. The algorithm stops when the best fitness does not change during 10 successive generations and restores the best current solution from the chosen population of genomes.
4. Model Verification
4.1. Basic Data
In this section, we present a numerical example to illustrate the performance of our model and algorithm based on practical and virtual data. We assume that an unexpected event (e.g., widespread power outage) occurs in a rail transit system, and the whole rail transit line is forced to stop operating, leading to a large number of stranded passengers at stations along the line. The disruption is serious, the disabled rail line requires longer repair times, and the isolated stations have different time windows. To ensure passenger safety, a transit-based evacuation process is be implemented. In our example, there are two bus lines (r1 and r2) nearby the isolated stations, and bus lines have a public terminal from the Changchun urban transit network presented in Figure 4. Each bus line has an operating fleet and a reserve fleet, and the reserve fleet of the bus lines stay in the bus terminal stations to ensure the reliability of the traditional transit system. Along the rail transit line, there are four isolated stations (i1, i2, i3, and i4) that exist with stranded passengers to evacuate. Two temporary shelters (j1 and j2) are located near the disrupted rail transit line with the capacity to absorb stranded passengers. Minimum journeys (between isolated rail stations, temporary shelters, and bus line terminals) presented in Table 2 is practical data taken from the Changchun urban transit network. In order to compute and test the model more easily, we assume that there are two kinds of isolated urban rail transit stations based on the severity and the spatial extent of the disruptions. Each kind has the same time window, minimum evacuated passengers, and stranded passengers. The absorption capacity of temporary shelters (j1 and j2) is assumed to be 1500 and 3000, respectively. The related information from the isolated stations presented in Table 3 is hypothetical and was taken from an evacuation drill. All relevant practical information pertaining to the bus lines near to the isolated stations presented in Table 4 is practical data taken from the Changchun urban transit network.
4.2. Results
In our genetic algorithm optimization experiments, we used the following parameters: size of population: 500, number of generations: 500, probability of mutation: 0.05, probability of crossover: 0.5. In order to provide an appropriate result, a genetic algorithm optimization experiment was run five times. We applied the mathematical software, MATLAB ver. R2016a (MathWorks, MA, USA) to determine the number of vehicles and routes required and available to evacuate stranded passengers. The current knowledge in the field of planning provides evacuation planning for evacuating passengers without a concern about the decreasing frequency of the remaining vehicles for conventional service. Besides, previous studies ignore the certain time, which is different between the operating fleet and the reserve fleet for vehicles to arrive at isolated stations. It is obvious that there are more vehicles required without a concern about the decreasing frequency of the remaining vehicles for the conventional service to maximize the total number of transferred passengers. Moreover, it is obvious that there are less vehicles required without considering the certain time, which is different between the operating fleet and the reserve fleet for vehicles to arrive at isolated stations. For validating the proposed genetic algorithm, the comparison of the results of the applied solution algorithms obtained via the normal genetic algorithm (whereby the routing plans are generated by assigning the required number of vehicles simultaneously) and the optimal performance as obtained by the proposed algorithm (whereby the routing plans are generated by assigning the required number of vehicles individually) is presented in Table 5. Based on the results presented in Table 5, we found that the improved genetic algorithm evacuated more stranded passengers and required less vehicles within a given time window compared to the normal genetic algorithm. We can, therefore, conclude that the proposed method can effectively maximize the total number of transferred passengers while still ensure the reliability of the traditional transit system. To further see the performance of the proposed model, routes for evacuating stranded passengers in isolated stations within the pre-defined evacuation time window are presented in Table 6.
As shown in Table 6, there are seven vehicles in total in the optimal solution, representing two backup vehicles and two operating vehicles in the bus line r1 and one backup vehicle and two operating vehicles in the bus line r2 based on Equation (7). The maximum number of vehicle trips varies since the total time traveled by the vehicles cannot exceed the total available time window based on Equation (8). For vehicle k1, the planned service started from station i3, which had a 45 min time window to evacuate passengers. This maximized the total evacuated passengers during the first run since vehicle k1 was closest to the bus terminal. Therefore, vehicle k1 traveled between i3 and j2, the closest available temporary shelters, nine times during the first time period to transfer stranded passengers. At the end of the first period, vehicle k1 was at j2. The passengers at station i2 were successfully evacuated to j2 within the time window. At this time, vehicle k1 traveled to station i3 to begin the process of evacuating stranded passengers to the closest available temporary shelters j1. Vehicle k1 continued to be routed between the stations, evacuating passengers until all the time windows ended. Then, the vehicle returned to the bus terminal from the temporary shelter j1. Vehicles k2 to k6 were tracked in a similar way, as shown in Table 6.
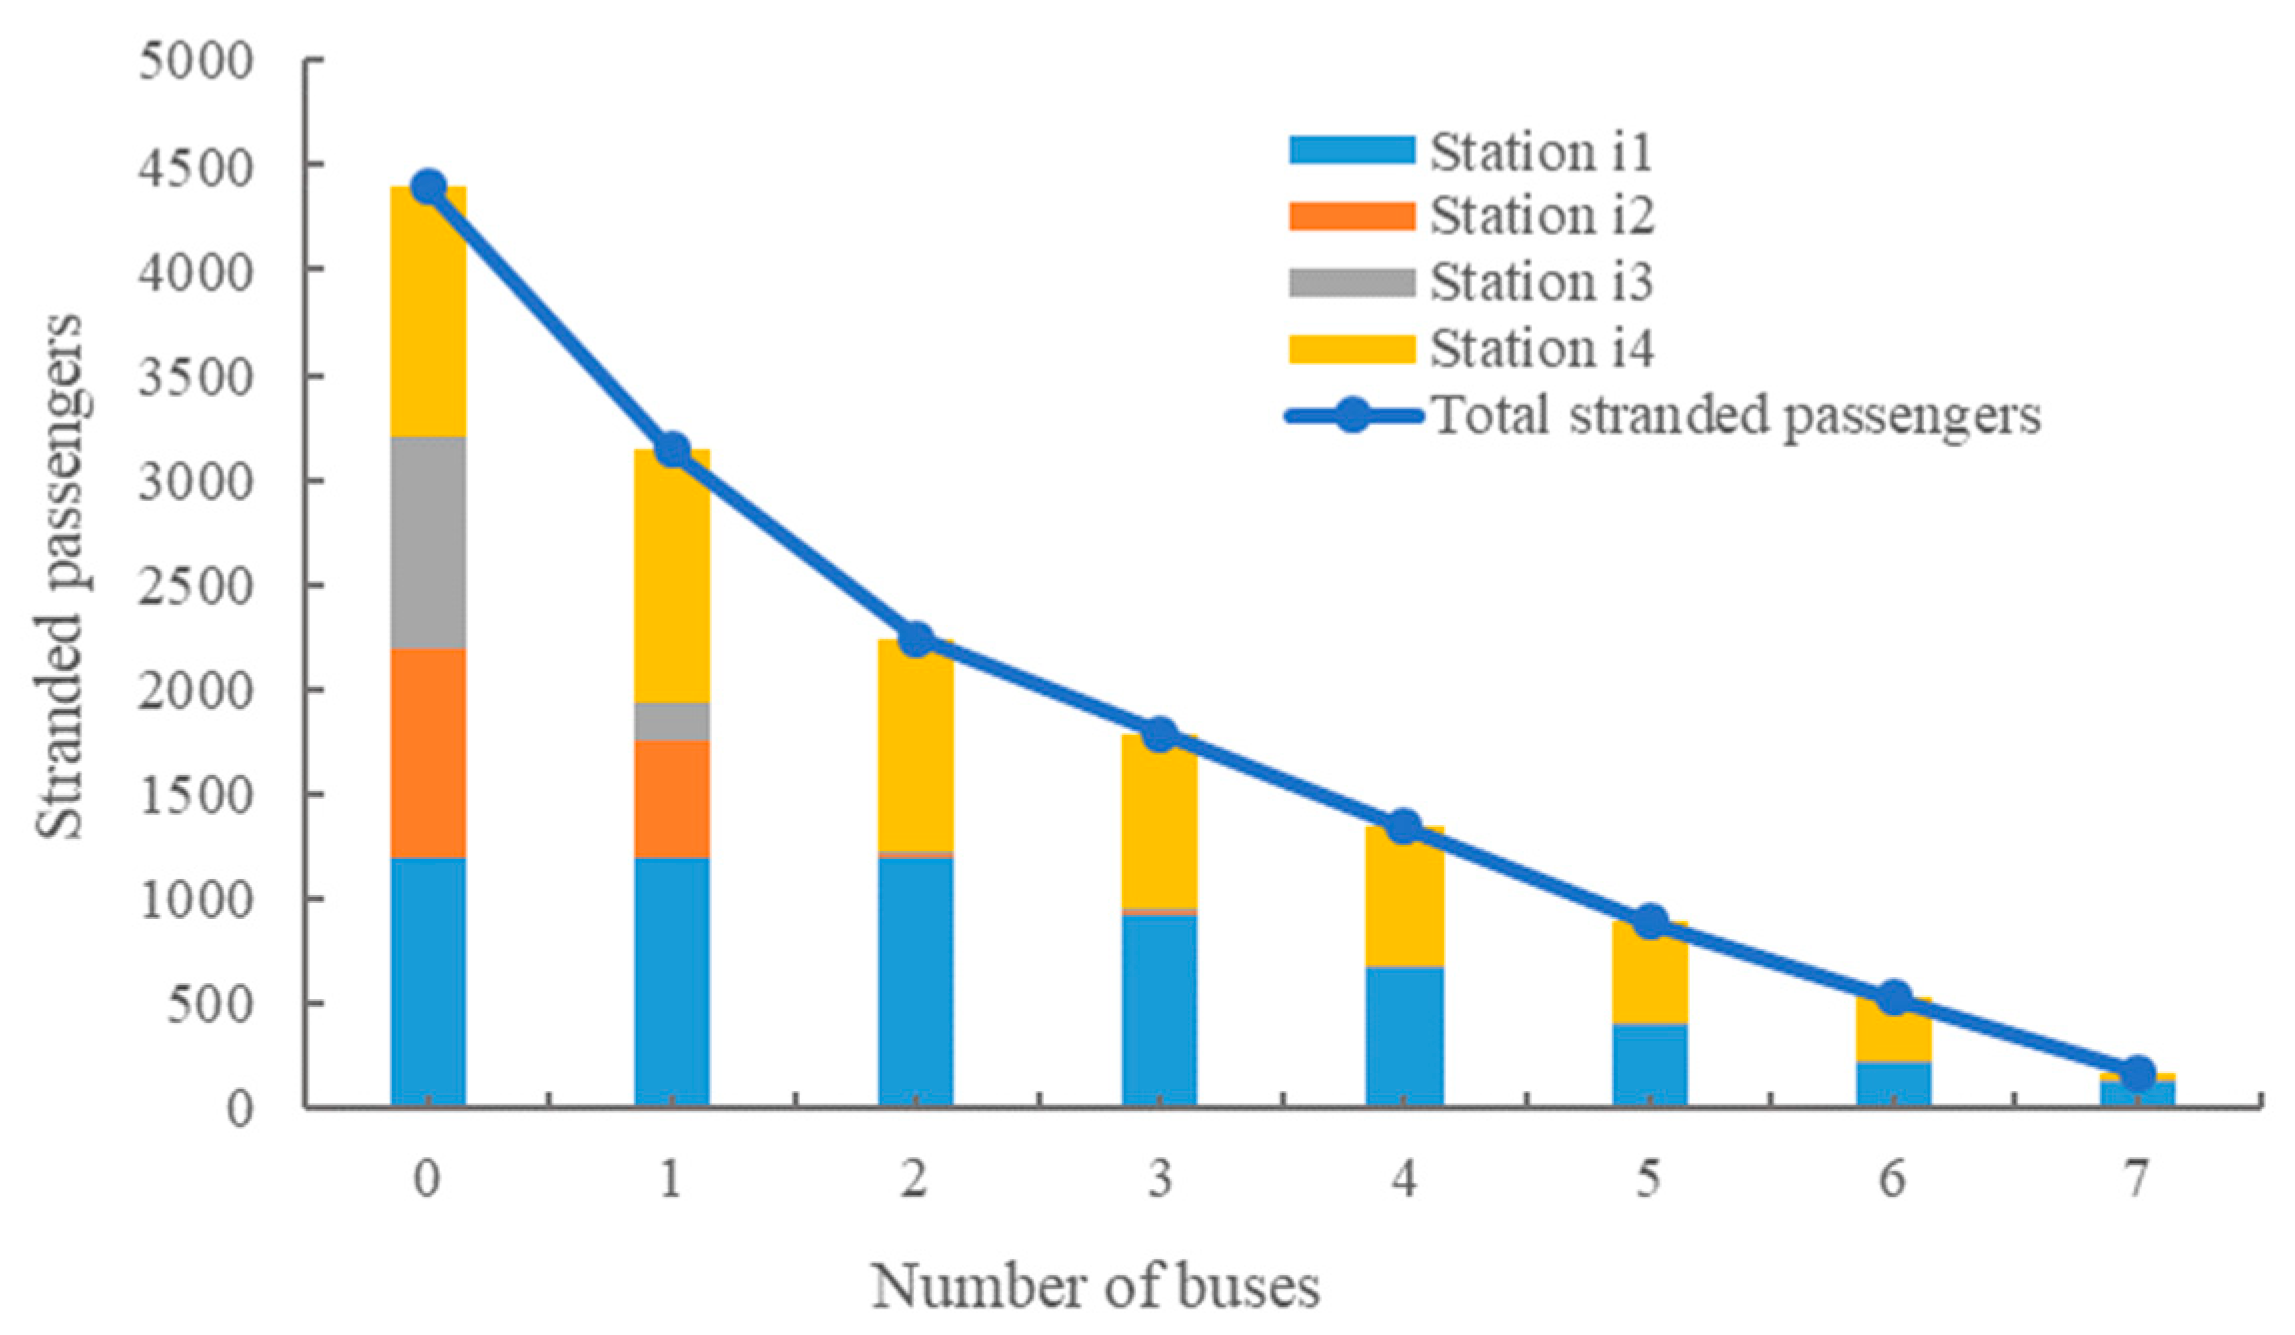
To analyze the impact on the stranded passengers at the stations, we analyzed the stranded passengers at the stations under the different number of vehicles, presented in Figure 5. There were 3140, 2240, 1790, 1340, 890, 530, and 170 total stranded passengers at stations after being evacuated by vehicles from k1 to k7, respectively. We found that the number of stranded passengers at the stations decreased by the number of vehicles. In addition, the descent speed decreased with the increase in the number of vehicles. This result was to be expected because the first three vehicles are backup vehicles and the other vehicles were operating vehicles. The distances from the operating vehicles to the stations were longer than those from the backup vehicles. What is more, we observed that the stranded passengers at stations i2 and i3 were stable after being evacuated by vehicles k1 and k2. This maximized the total number of stranded passengers transferred within the given time window. The result indicates that the model is able to provide routing arrangements to maximize the number of passengers evacuated from stations by only using seven vehicles in the given tight time windows.
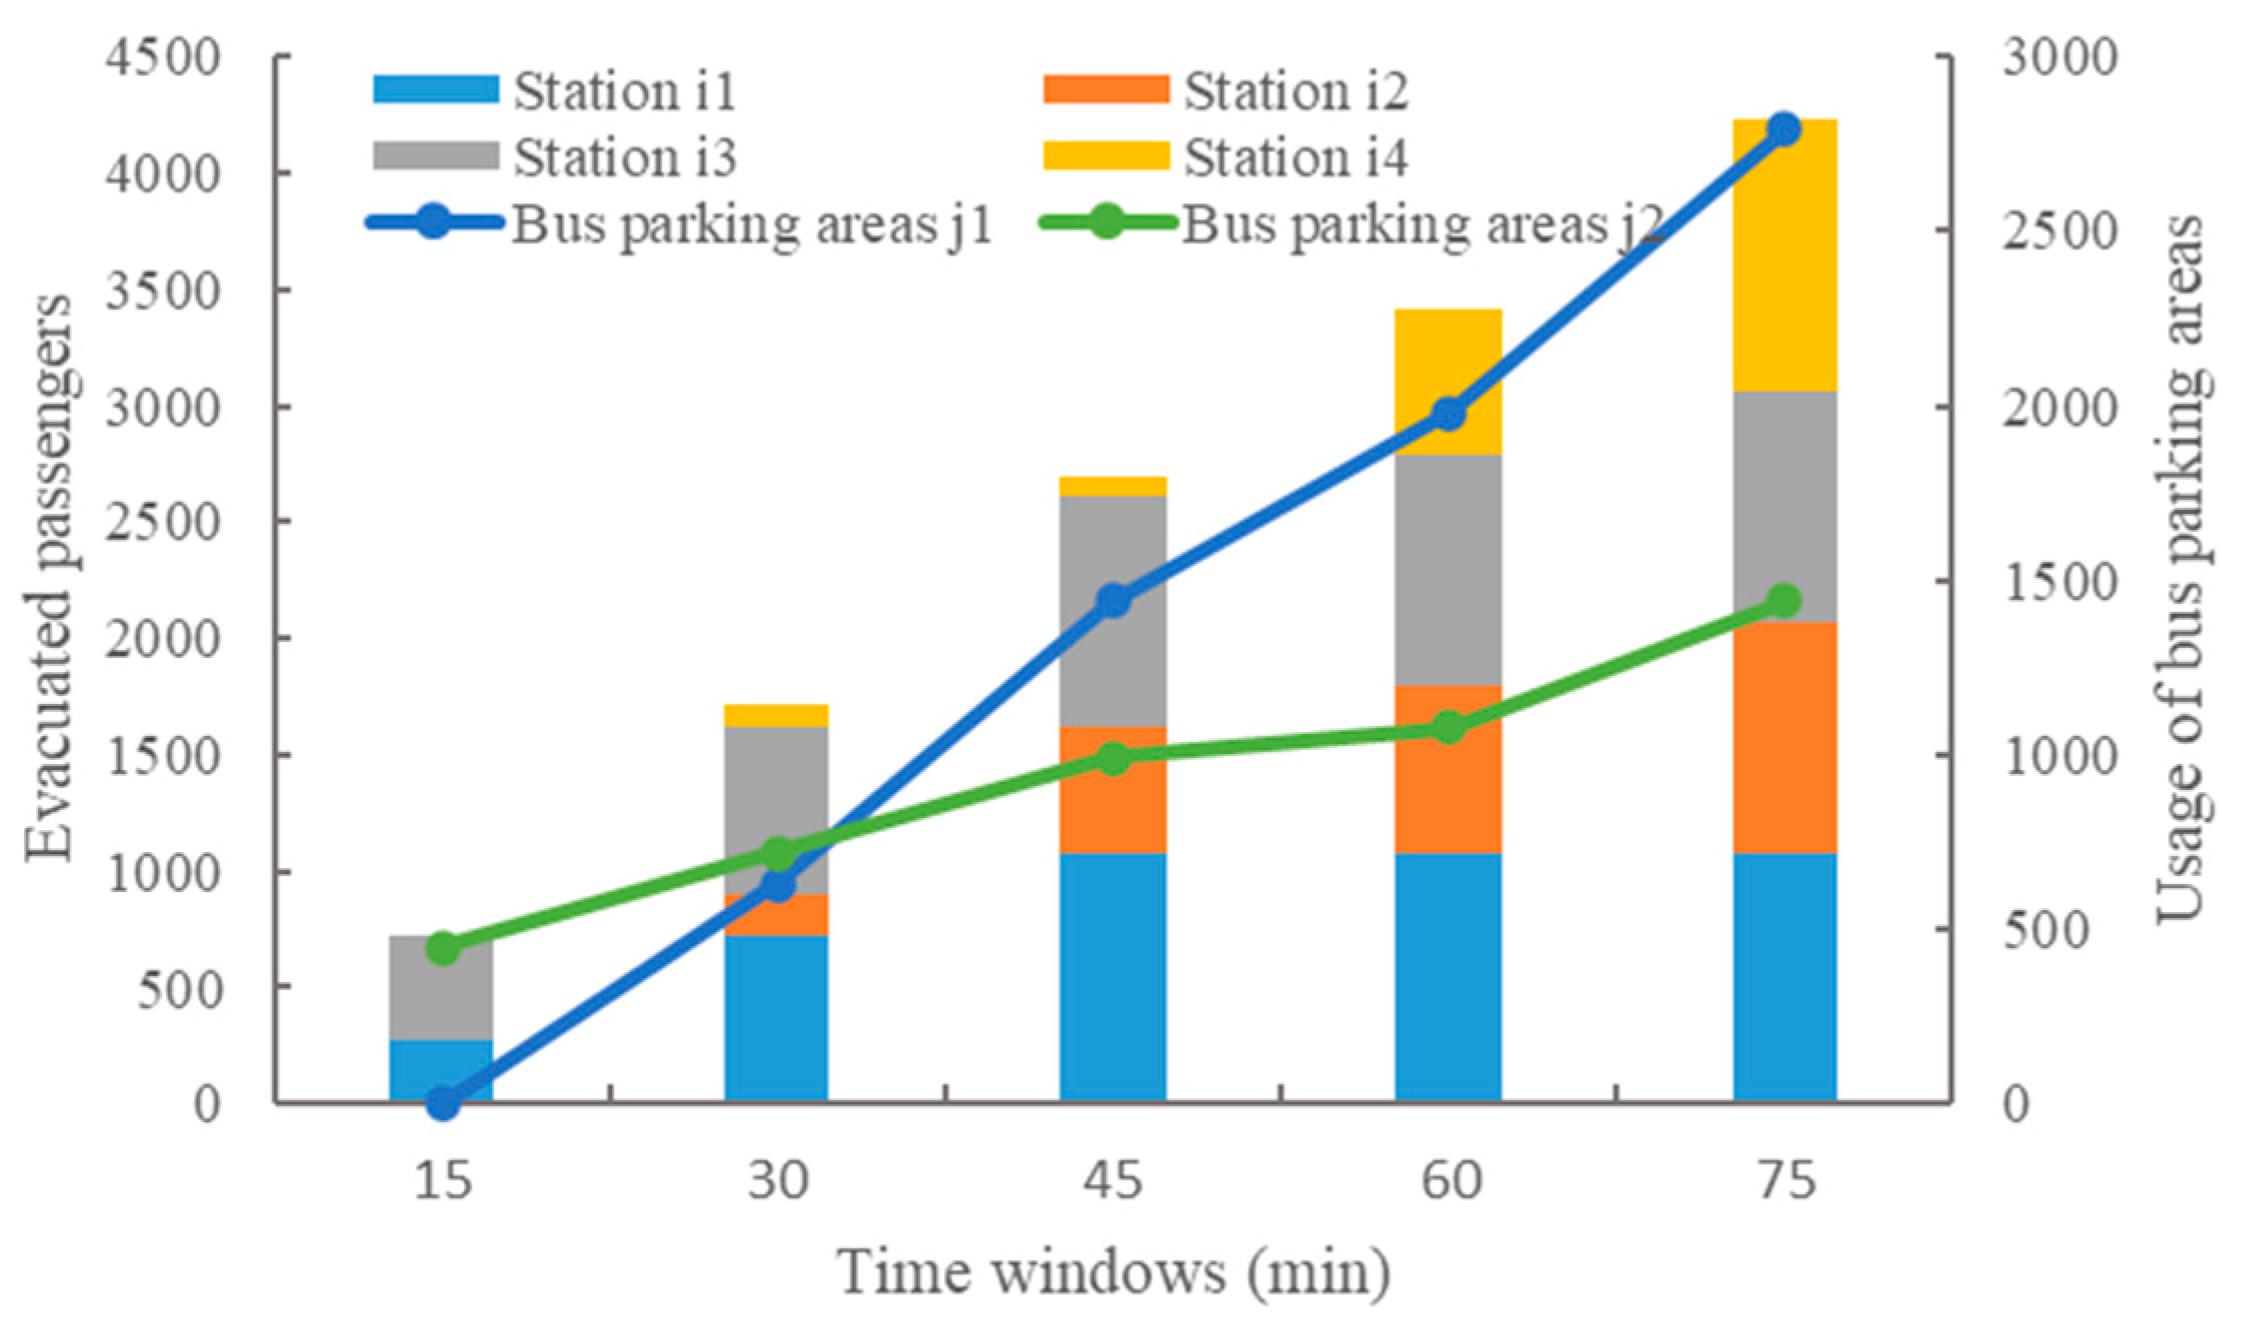
To further see the performance of the proposed model, we analyzed the evacuated passengers at the stations and the usage of temporary shelters under the urban rail transit line emergency, presented in Figure 6. Based on the time windows of the isolated rail transit stations, there were two time periods. During the first time period, there were 1080, 540, 990, and 90 passengers evacuated from stations i1, i2, i3, and i4, respectively. We found that the number of evacuated passengers at stations i1 and i3 were greater than at stations i2 and i4. However, this was expected since stations i1 and i3 had shorter time windows than stations i2 and i4. This maximized the total evacuated passengers during the first time period and guaranteed the total time traveled by a vehicle did not exceed the total available time window for each isolated rail transit station. During the second time period, there were 1080, 990, 990, and 1170 passengers evacuated from station i1, i2, i3, and i4, respectively. Most of the stranded passengers at stations i4 were evacuated at the end of the second time period. This is because the distances from station i4 to the temporary shelters were longer than these from other stations, and the stranded passengers at station i4 were evacuated by the operating vehicles. The distances from the operating vehicles to the stations were longer than those from the backup vehicles. In terms of the temporary shelters, there were 2790 and 1440 stranded passengers evacuated to the temporary shelters j1 and j2, respectively. The result indicates that the model is able to provide routing arrangements to maximize the number of passengers evacuated from stations with the constraint of temporary shelter absorption capacity.
5. Conclusions
In this paper, we presented an optimization model for determining the routes required to evacuate stranded passengers within a given time window under an urban rail transit line emergency using vehicles from traditional transit systems. The model provided the methodology for designing vehicle scheduling schemes when evacuation destinations were temporary shelters near isolated stations. Moreover, we divided the decision support system for urban rail transit line emergency situations into two stages—transit-based evacuation and bus bridging management. Then, the impact on the reliability constraint of the traditional transit systems, including the operating fleet and reserve fleet, was considered. Furthermore, the total number of transferred stranded passengers was maximized within given time windows by adding headways constraints to the traditional transit system. This also ensured the reliability of the urban transit system. A case study was conducted to verify the model in the Changchun urban transit network. By analyzing the stranded passengers at stations under different numbers of vehicles and time periods, it implied that the proposed model could significantly provide routing arrangements to maximize the number of passengers evacuated from stations within the given time window and headway constraint. More generally, the model and analysis provide insights that may help operators determine the number of vehicles and routes required and available to prevent secondary accidents and passengers from continuously accumulating. In future work, we plan to incorporate capacity constraints, demand uncertainty, and correlated disruptions into the model. In addition, we will consider both evacuation tasks and bus bridging management to improve the decision support system.
Author Contributions
B.H. proposed the idea, designed the survey, and wrote the article; Y.C. and S.Z. provided guidance, comments, and key suggestions; D.L. gave advice on the paper, and led the manuscript checking and modification. All authors have read and agreed to the published version of the manuscript.
Funding
This research was funded by the National Natural Science Foundation of China, grant number 71871103.
Acknowledgments
The authors would like to thank the editors and the anonymous referees for their valuable comments and suggestions that improve the quality of this paper.
Conflicts of Interest
The authors declare no conflict of interest.
References
- Li, C.; Huang, J.; Wang, B.; Zhou, Y.; Bai, Y.; Chen, Y. Spatial-Temporal Correlation Prediction Modeling of Origin-Destination Passenger Flow Under Urban Rail Transit Emergency Conditions. IEEE Access 2019, 7, 162353–162365. [Google Scholar] [CrossRef]
- Wang, Y.; Yan, X.; Zhou, Y.; Wang, J.; Chen, S. Study of the bus dynamic coscheduling optimization method under urban rail transit line emergency. Comput. Intell. Neurosci. 2014. [Google Scholar] [CrossRef] [PubMed] [Green Version]
- Sun, H.; Wu, J.; Wu, L.; Yan, X.; Gao, Z. Estimating the influence of common disruptions on urban rail transit networks. Transp. Res. Part A Policy Pract. 2016, 94, 62–75. [Google Scholar] [CrossRef]
- Chow, W.K.; Ng, C.M. Waiting time in emergency evacuation of crowded public transport terminals. Saf. Sci. 2008, 46, 844–857. [Google Scholar] [CrossRef]
- Shi, C.; Zhong, M.; Nong, X.; He, L.; Shi, J.; Feng, G. Modeling and safety strategy of passenger evacuation in a metro station in China. Saf. Sci. 2012, 50, 1319–1332. [Google Scholar] [CrossRef]
- Xu, H.; Tian, C.; Li, Y. Emergency Evacuation Simulation and Optimization for a Complex Rail Transit Station: A Perspective of Promoting Transportation Safety. J. Adv. Transp. 2020. [Google Scholar] [CrossRef]
- Chen, S.; Di, Y.; Liu, S.; Wang, B. Modelling and analysis on emergency evacuation from metro stations. Math. Probl. Eng. 2017. [Google Scholar] [CrossRef]
- Hong, L.; Gao, J.; Zhu, W. Simulating emergency evacuation at metro stations: An approach based on thorough psychological analysis. Transp. Lett. 2016, 8, 113–120. [Google Scholar] [CrossRef]
- Wang, Y.; Guo, J.; Currie, G.; Ceder, A.A.; Dong, W.; Pender, B. Bus bridging disruption in rail services with frustrated and impatient passengers. IEEE Trans. Intell. Transp. Syst. 2014, 15, 2014–2023. [Google Scholar] [CrossRef]
- Gu, W.; Yu, J.; Ji, Y.; Zheng, Y.; Zhang, H.M. Plan-based flexible bus bridging operation strategy. Transp. Res. Part C Emerg. Technol. 2018, 91, 209–229. [Google Scholar] [CrossRef]
- Jin, J.G.; Teo, K.M.; Odoni, A.R. Optimizing bus bridging services in response to disruptions of urban transit rail networks. Transp. Sci. 2016, 50, 790–804. [Google Scholar] [CrossRef] [Green Version]
- Yang, Y.; Ding, H.-X.; Chen, F.; Yang, H.-M. An approach for evaluating connectivity of interrupted rail networks with bus bridging services. Adv. Mech. Eng. 2018, 10. [Google Scholar] [CrossRef] [Green Version]
- Lei, W.; Li, A.; Gao, R.; Hao, X.; Deng, B. Simulation of pedestrian crowds’ evacuation in a huge transit terminal subway station. Phys. A 2012, 391, 5355–5365. [Google Scholar] [CrossRef]
- Yu, L.; Cong, Y.; Chen, K. Determination of the Peak Hour Ridership of Metro Stations in Xi’an, China Using Geographically-Weighted Regression. Sustainability 2020, 12, 2255. [Google Scholar] [CrossRef] [Green Version]
- Shi, Z.; Zhang, N.; Liu, Y.; Xu, W. Exploring spatiotemporal variation in hourly metro ridership at station level: The influence of built environment and topological structure. Sustainability 2018, 10, 4564. [Google Scholar] [CrossRef] [Green Version]
- Wang, C.; Song, Y. Fire Evacuation in Metro Stations: Modeling Research on the Effects of Two Key Parameters. Sustainability 2020, 12, 684. [Google Scholar] [CrossRef] [Green Version]
- Díaz, R.; Wang, H.; Mang, H.; Yuan, Y.; Pichler, B. Numerical Analysis of a Moderate Fire inside a Segment of a Subway Station. Appl. Sci. 2018, 8, 2116. [Google Scholar] [CrossRef] [Green Version]
- Tsukahara, M.; Koshiba, Y.; Ohtani, H. Effectiveness of downward evacuation in a large-scale subway fire using Fire Dynamics Simulator. Tunn. Undergr. Space Technol. 2011, 26, 573–581. [Google Scholar] [CrossRef]
- Wan, J.; Sui, J.; Yu, H. Research on evacuation in the subway station in China based on the Combined Social Force Model. Phys. A. 2014, 394, 33–46. [Google Scholar] [CrossRef]
- Kepaptsoglou, K.; Karlaftis, M.G. The bus bridging problem in metro operations: Conceptual framework, models and algorithms. Public Transp. 2009, 1, 275–297. [Google Scholar] [CrossRef]
- Jin, J.G.; Tang, L.C.; Sun, L.; Lee, D.-H. Enhancing metro network resilience via localized integration with bus services. Transp. Res. Part E Logist. Transp. Rev. 2014, 63, 17–30. [Google Scholar] [CrossRef]
- Wang, J.; Yuan, Z.; Yin, Y. Optimization of Bus Bridging Service under Unexpected Metro Disruptions with Dynamic Passenger Flows. J. Adv. Transp. 2019. [CrossRef]
- Pender, B.; Currie, G.; Delbosc, A.; Shiwakoti, N. Improving bus bridging responses via satellite bus reserve locations. J. Transp. Geogr. 2014, 34, 202–210. [Google Scholar] [CrossRef]
- Yin, H.; Wu, J.; Sun, H.; Qu, Y.; Yang, X.; Wang, B. Optimal bus-bridging service under a metro station disruption. J. Adv. Transp. 2018. [CrossRef] [PubMed] [Green Version]
- Bish, D.R. Planning for a bus-based evacuation. OR Spectr. 2011, 33, 629–654. [Google Scholar] [CrossRef]
- Kulshrestha, A.; Lou, Y.; Yin, Y. Pick-up locations and bus allocation for transit-based evacuation planning with demand uncertainty. J. Adv. Transp. 2014, 48, 721–733. [Google Scholar] [CrossRef]
- Goerigk, M.; Deghdak, K.; T’Kindt, V. A two-stage robustness approach to evacuation planning with buses. Transp. Res. Part B Methodol. 2015, 78, 66–82. [Google Scholar] [CrossRef] [Green Version]
- Wang, Y.; Yan, X.; Zhou, Y.; Zhang, W. A feeder-bus dispatch planning model for emergency evacuation in urban rail transit corridors. PLoS ONE 2016, 11, e0161644. [Google Scholar] [CrossRef]
- Shahparvari, S.; Abbasi, B. Robust stochastic vehicle routing and scheduling for bushfire emergency evacuation: An Australian case study. Transp. Res. Part A Policy Pract. 2017, 104, 32–49. [Google Scholar] [CrossRef]
- Shahparvari, S.; Abbasi, B.; Chhetri, P.; Abareshi, A. Fleet routing and scheduling in bushfire emergency evacuation: A regional case study of the Black Saturday bushfires in Australia. Transport. Res. Part. D Transp. Environ. 2019, 67, 703–722. [Google Scholar] [CrossRef]
- Hou, B.; Zhao, S.; Liu, H.; Li, J. Optimization Model for Reserve Fleet Sizes in Traditional Transit Systems considering the Risk of Vehicle Breakdowns. Math. Probl. Eng. 2018. [Google Scholar] [CrossRef]
- Xie, Y.; Wang, M.; Liu, X.; Mao, B.; Wang, F. Integration of Multi-Camera Video Moving Objects and GIS. ISPRS Int. J. Geo-Inf. 2019, 8, 561. [Google Scholar] [CrossRef] [Green Version]
- Zhang, H.; Zhao, S.; Liu, H.; Liang, S. Design of integrated limited-stop and short-turn services for a bus route. Math. Probl. Eng. 2016. [Google Scholar] [CrossRef]
- Liang, S.; Zhao, S.; Lu, C.; Ma, M. A self-adaptive method to equalize headways: Numerical analysis and comparison. Transp. Res. Part B Methodol. 2016, 87, 33–43. [Google Scholar] [CrossRef]
- Liang, S.; Ma, M.; He, S.; Zhang, H.; Yuan, P. Coordinated control method to self-equalize bus headways: An analytical method. Transp. B Transp. Dyn. 2019, 7, 1175–1202. [Google Scholar] [CrossRef]
- Wang, Z.; Wen, P. Optimization of A Low-Carbon Two-Echelon Heterogeneous-Fleet Vehicle Routing for Cold Chain Logistics Under Mixed Time Window. Sustainability 2020, 12, 1967. [Google Scholar] [CrossRef] [Green Version]
- Zuo, X.; Chen, C.; Tan, W.; Zhou, M. Vehicle scheduling of an urban bus line via an improved multiobjective genetic algorithm. IEEE Trans. Intell. Transp. Syst. 2014, 16, 1030–1041. [Google Scholar] [CrossRef]
Figure 1.
Decision support system for urban rail transit line emergency situations.

Figure 2.
The topological structure under the urban rail transit line emergency.

Figure 3.
Flowchart of the solution algorithm.

Figure 4.
Disrupted scenario of the metro line in the case study.

Figure 5.
Stranded passengers at stations.

Figure 6.
Evacuated passengers at the stations and the usage of temporary shelters.


Table 1.
List of notations.
| Sets | |
|---|---|
| I | Set of the isolated urban rail transit stations |
| J | Set of the temporary shelters |
| R | Set of bus lines near isolated stations |
| K | Set of vehicles dispatched from bus lines |
| Decision variables | |
| Number of times vehicle k travels from node i to node j during time window n | |
| Binary variable, one if vehicle k starts evacuation process from node i during time window n, zero otherwise | |
| Binary variable, one if vehicle k finishes the evacuation process at node i during time window n, zero otherwise | |
| Parameters | |
| Length of bus line r | |
| The shortest stop time of bus line r at a bus terminal | |
| Turnover time of bus line r | |
| Number of the scheduled vehicles on line r | |
| Total number of operating vehicles on line r under conventional condition | |
| Total number of reserve fleet vehicles on line r | |
| Total number of operating vehicles on line r under | |
| v | Average speed of vehicle |
| Distance from the nearest operating vehicle on line r to the bus terminal | |
| Distance of vehicles from bus line r to station i | |
| n | Time period , for example, n = 3 represents the time period between and |
| g | Time windows , for example, = 3 is the time from zero to |
| Available evacuation time window of the isolated urban rail transit station, for example, isolated station i is available from zero to | |
| V | The maximum capacity of the vehicle |
| The average headway of line r under an urban rail transit line emergency | |
| The maximum headway of line r | |
| The minimum stranded passengers at station i | |
| The maximum available capacity of temporary shelters j for passengers | |
| The population of stranded passengers in isolated station i | |
Table 2.
Minimum journey distance between stations and temporary shelters (km).
| Index | Station i1 | Station i2 | Station i3 | Station i4 |
|---|---|---|---|---|
| Station i1 | - | 1.4 | 2.4 | 3.9 |
| Station i2 | 1.4 | - | 1 | 2.5 |
| Station i3 | 2.4 | 1 | - | 1.5 |
| Station i4 | 3.9 | 2.5 | 1.5 | - |
| Shelter j1 | 2.4 | 1 | 2 | 3 |
| Shelter j2 | 2.7 | 1.8 | 0.8 | 2.1 |
| Bus terminal | 3 | 2.2 | 1 | 2.5 |
Table 3.
Information in relation to isolated rail transit stations.
| Index | Time Window (min) | Minimum Evacuated Passengers (person) | Stranded Passengers (person) |
|---|---|---|---|
| Station i1 | 45 | 150 | 1200 |
| Station i2 | 75 | 100 | 1000 |
| Station i3 | 45 | 100 | 1000 |
| Station i4 | 75 | 150 | 1200 |
Table 4.
Information on bus lines near the isolated stations.
| Index | Bus Line r1 | Bus Line r2 |
|---|---|---|
| (no. of vehicles) | 11 | 11 |
| (km) | 20 | 18 |
| (no. of vehicles) | 2 | 1 |
| (min) | 2 | 2 |
| (km) | 1 | 0.8 |
| V [number of passengers) | 90 | 90 |
| E(H) (min) | 5 | 5 |
| Emax(H) (min) | 7 | 7 |
| v (km/h) | 20 | 20 |
Table 5.
Comparison of the results of the applied solution algorithms.
| Parameter | Normal Genetic Algorithm | Proposed Algorithm | Value Added |
|---|---|---|---|
| Required vehicles in bus line r1 (vehicle) | 4 | 4 | 0 |
| Required vehicles in bus line r2 (vehicle) | 4 | 3 | −1 |
| Clearance time with minimum evacuated passengers (min) | 73.9 | 74.6 | −0.7 |
| Total number of transferred passengers (person) | 3960 | 4230 | 270 |
Table 6.
Routes for evacuating stranded passengers within a pre-defined evacuation time window.
| Vehicle | Access Orders from 0 min to 45 min | Access Orders from 45 min to 75 min |
|---|---|---|
| k1 | o- i3- j2- i3- j2- i3- j2- i3- j2- i3- j2- i3- j2- i3- j2- i3- j2- i3- j2 | i2- j1- i2- j1- i2- j1- i2- j1- i2- j1 |
| k2 | o- i3- j2- i3- j2- i2- j1- i2- j1- i2- j1- i2- j1- i2- j1 | i2- j2- i4- j2- i4- j2 |
| k3 | o- i1- j1- i1- j1- i1- j1 | j1- i4- j2- i4- j2 |
| k4 | l- o- i1- j1- i1- j1- i1- j1 | i4- j1- i4- j1 |
| k5 | l- o- i1- j1- i1- j1- i1- j1 | i4- j1- i4- j1 |
| k6 | l- o- i1- j1- i1- j1 | i4- j1- i4- j1 |
| k7 | l- o- i4- j1- i1- j1 | i4- j1- i4- j1 |
l stands for location in bus lines; o stands for bus terminal; i stands for isolated stations; j stands for temporary shelters.
© 2020 by the authors. Licensee MDPI, Basel, Switzerland. This article is an open access article distributed under the terms and conditions of the Creative Commons Attribution (CC BY) license (http://creativecommons.org/licenses/by/4.0/).
Share and Cite
MDPI and ACS Style
Hou, B.; Cao, Y.; Lv, D.; Zhao, S. Transit-Based Evacuation for Urban Rail Transit Line Emergency. Sustainability 2020, 12, 3919. https://0-doi-org.brum.beds.ac.uk/10.3390/su12093919
AMA Style
Hou B, Cao Y, Lv D, Zhao S. Transit-Based Evacuation for Urban Rail Transit Line Emergency. Sustainability. 2020; 12(9):3919. https://0-doi-org.brum.beds.ac.uk/10.3390/su12093919
Chicago/Turabian StyleHou, Bowen, Yang Cao, Dongye Lv, and Shuzhi Zhao. 2020. "Transit-Based Evacuation for Urban Rail Transit Line Emergency" Sustainability 12, no. 9: 3919. https://0-doi-org.brum.beds.ac.uk/10.3390/su12093919
Note that from the first issue of 2016, this journal uses article numbers instead of page numbers. See further details here.