Analysis of the Effectiveness of Air Pollution Control Policies Based on Historical Evaluation and Deep Learning Forecast: A Case Study of Chengdu-Chongqing Region in China


Abstract
:1. Introduction
- (1)
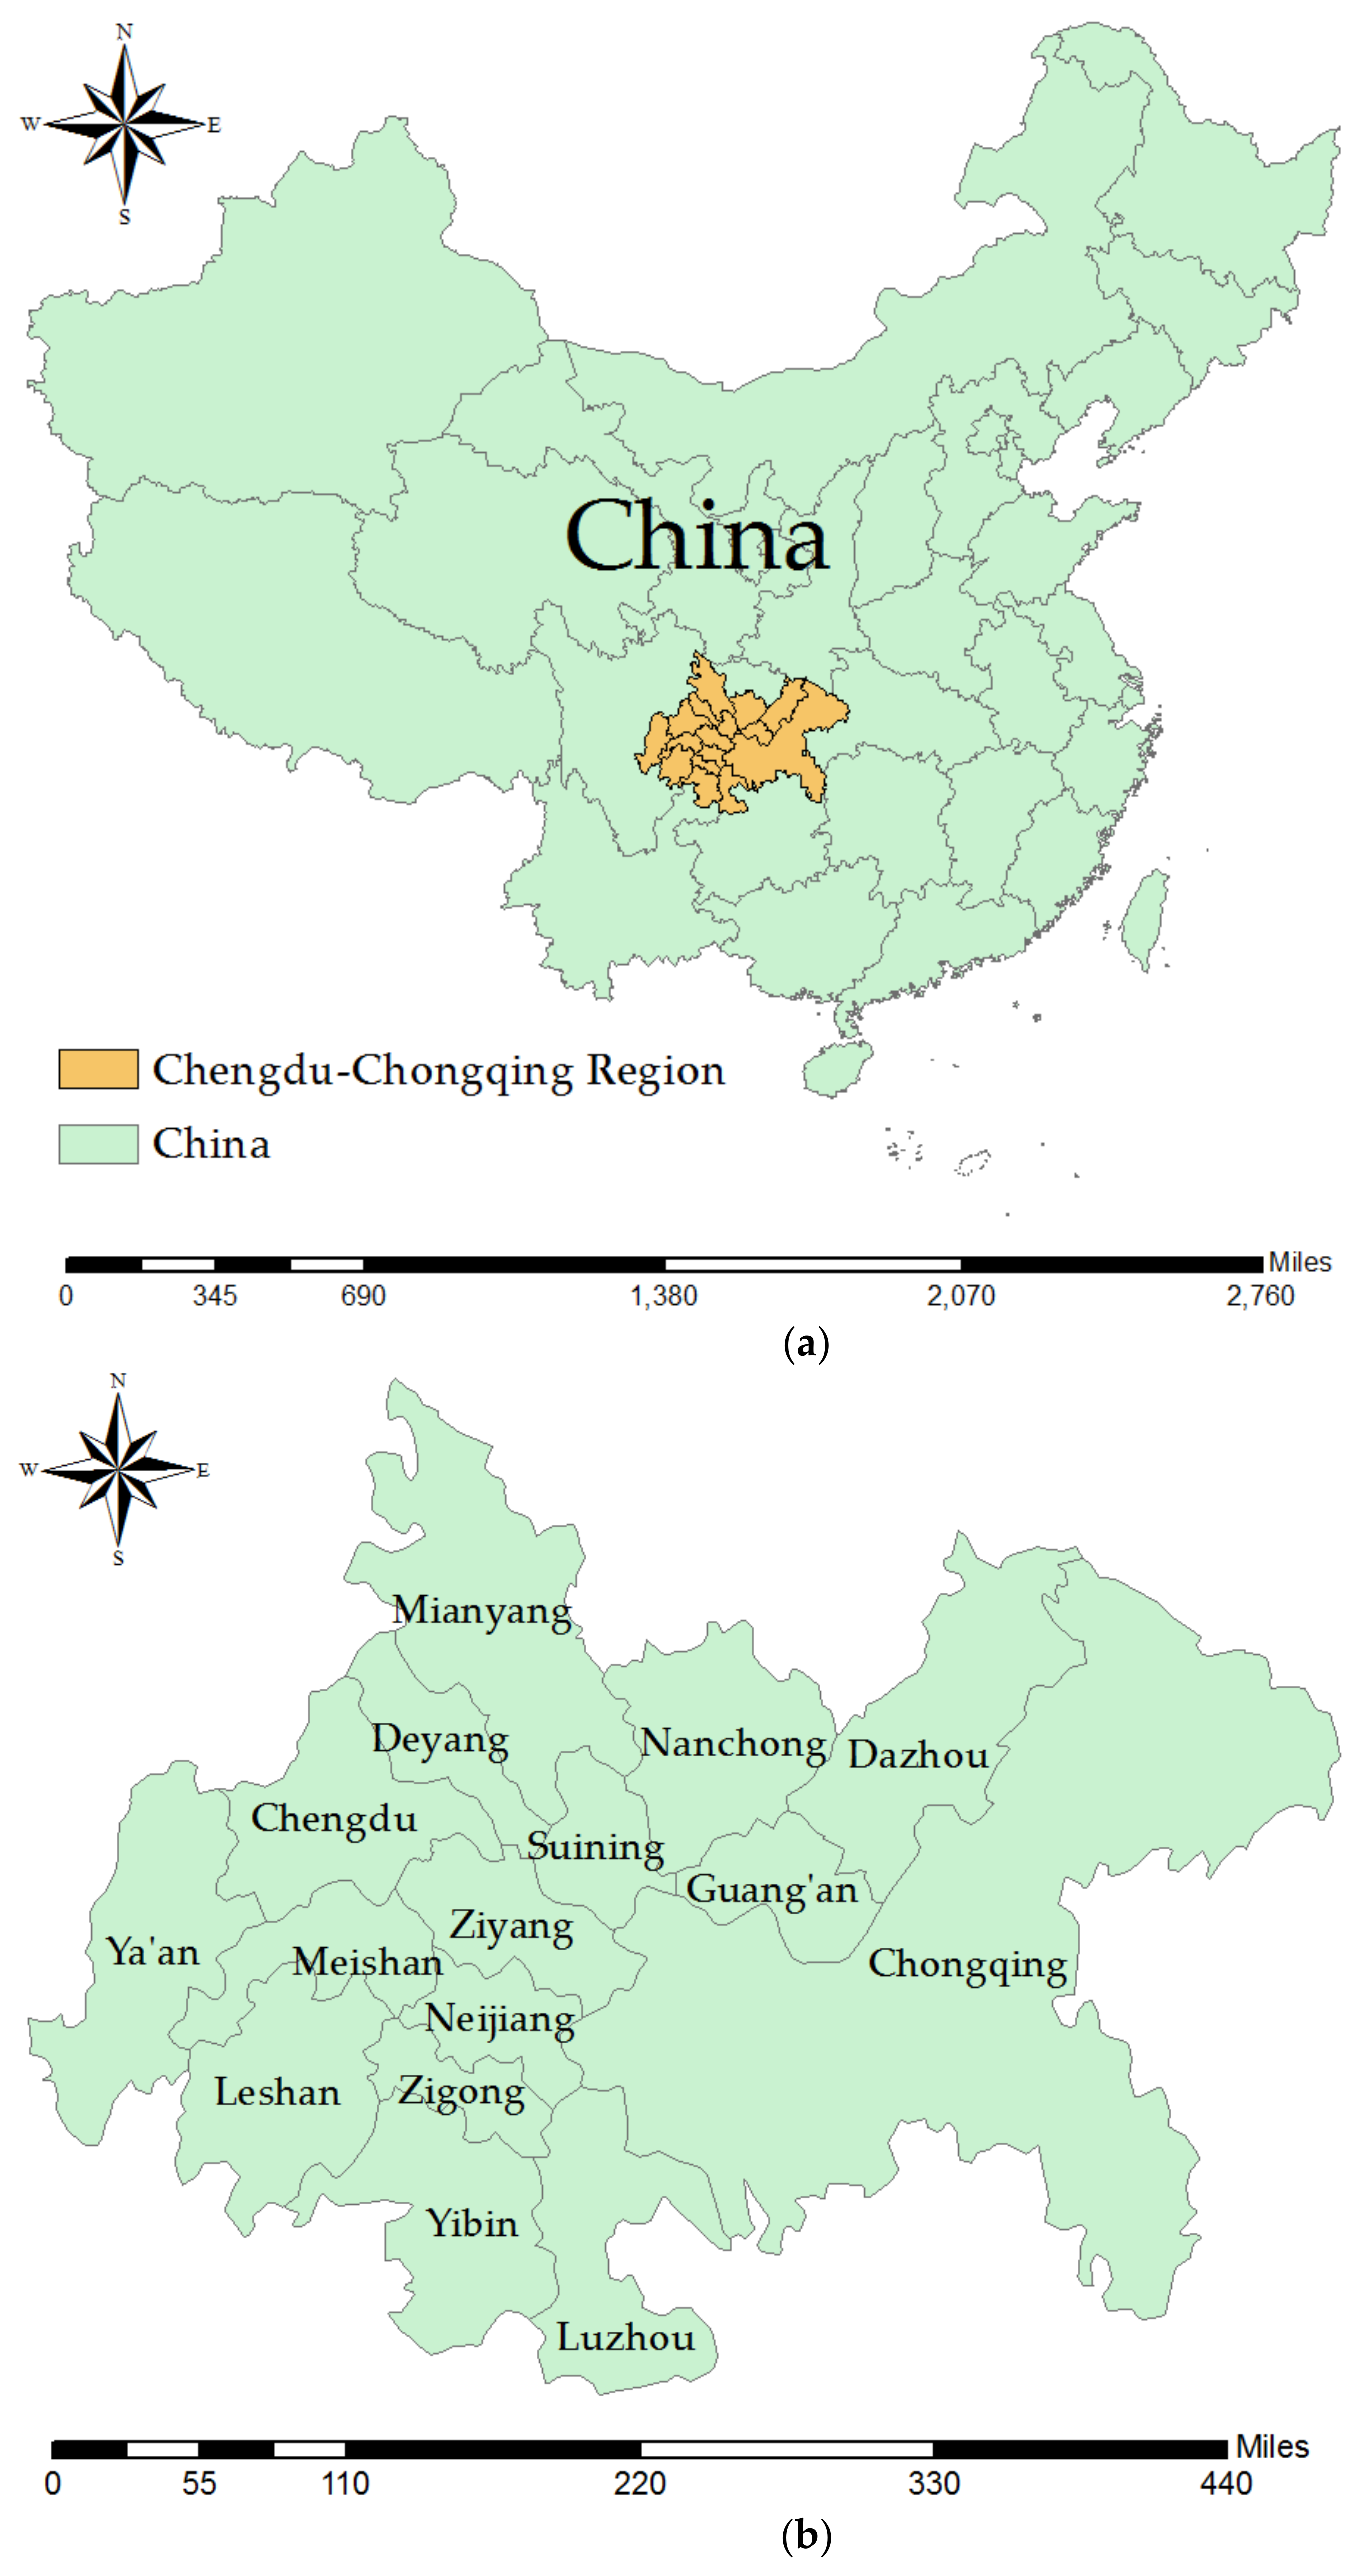
- Geographic Location.The Chengdu-Chongqing region is located in the Sichuan Basin in inland China. The landform of basin does not provide favorable natural conditions for the diffusion of air pollution compared to the coastal areas [27,28,29]. It is the general consensus in the academic community that climatic conditions are one of the most important constraints for air pollution control [30,31,32,33,34]. The precipitation in the Sichuan Basin is lower than that in the Yangtze River Delta and Pearl River Delta region in all seasons, and this region is a low-wind speed area with an average wind speed of below 1.5 m/s in all seasons, which is significantly lower than that in the Beijing-Tianjin-Hebei, Yangtze River Delta, and Pearl River Delta region [35]. Therefore, compared to the Yangtze River Delta and Pearl River Delta region, the air quality in Chengdu-Chongqing region can better reflect the actual effectiveness of air pollution control policies.
- (2)
- Economic Industries.Due to its location in central China, the economic development of the Chengdu-Chongqing region is relatively slower than that of the coastal areas [36,37,38]. Although Sichuan province has kept a GDP growth rate of over 10% from 2005 to 2013, its GDP growth has dropped significantly after 2014 [39]. Therefore, maintaining local economic growth while combating air pollution and shutting down heavily polluting enterprises is presenting more challenges to the local government. In addition, since 2010, the traditional industries in the Chengdu-Chongqing region have been experiencing weak growth and this region is looking for new pillar industries to achieve economic transformation [40,41,42].In view of this, this paper has collected the monthly average data of six major air pollutants of 16 cities in the Chengdu-Chongqing region (including 15 cities of Sichuan Province and Chongqing, the municipality directly under the central government) from January 2015 to November 2019. The paper first conducts evaluation of the air quality of various cities within the research period by using the Principal Component Analysis (PCA) and the Technique for Order Preference by Similarity to an Ideal Solution (TOPSIS) models. Based on that, the paper further utilizes the Long Short-Term Memory neural network model in deep learning to forecast the monthly air quality of each city from December 2019 to November 2020 in order to show the historical effectiveness and simulate future performance of the air pollution control policies of these cities.
- (1)
- Enrich existing literature on air pollution control by selecting the typical region of a large developing country as the research object, analyzing its air pollution control policies as well as the effectiveness in-depth, and making scientific forecast of the air quality in one year;
- (2)
- Provide a novel scientific tool for design and formulation of air pollution control policies by innovatively integrating commonly used evaluation models and deep learning forecast methods, fully utilizing historical data and applying innovative algorithms to the field of air pollution control.
2. Materials and Methods
2.1. Research Objects and Data Sources
2.2. PCA Model
- (1)
- Calculate the Correlation Coefficient Matrix :in which is the correlation coefficient between the indicator and the indicator, and . The larger is, the more similar the information conveyed by the two indicators is.
- (2)
- Calculate the eigenvalues of the Correlation Coefficient Matrix and the corresponding eigenvectors , in which as shown in Equation (3) below:The indicator vectors of the original sample are linearly combined by using the eigenvectors, thereby obtaining six new indicator vectors :in which . The six indicator vectors are also called the principal components, with being the first principal component, being the second principal component, …, and being the sixth principal component.
- (3)
- Select principal components, and calculate the information contribution rates as well as cumulative information contribution rates of these principal components. First, calculate the information contribution rate of each principal component:Then, calculate the cumulative information contribution rate of the principal components:
- (4)
- The original indicators are objectively weighted based on the eigenvector and the corresponding information contribution rate , as shown in Equation (7):in which stands for the weight of the indicator (please refer to Appendix B for the calculation of PCA and weights).
2.3. TOPSIS Model
- (1)
- Construct a normalization matrix , where is calculated as follows:
- (2)
- Calculate the normalization weight :
- (3)
- Determine the idealized optimal solution and the negative idealized solution based on the normalization weight :where is a benefit indicator set, representing the best value of the indicator; is a loss indicator set, representing the worst value of the indicator. The larger the benefit indicator, the better the evaluation result is; the larger the loss indicator, the less favorable the evaluation result is.
- (4)
- Calculate the distance from each sample to the idealized optimal solution (), and the distance from each sample to the negative idealized solution ():in which and are the distances from the sample to the optimal solution and the worst solution, respectively. is normalized weight of the evaluation indicator of the sample obtained from Equation (9). represents the proximity of the evaluation indicator to the optimal solution. The smaller is, the closer the sample is to the optimal solution, and the better the sample is.
- (5)
- Calculate the proximity to the optimal solution :where is the evaluation score of the sample, . The closer is to 1, the higher the evaluation score, and the more ideal the sample is. In practice, generally will not occur.
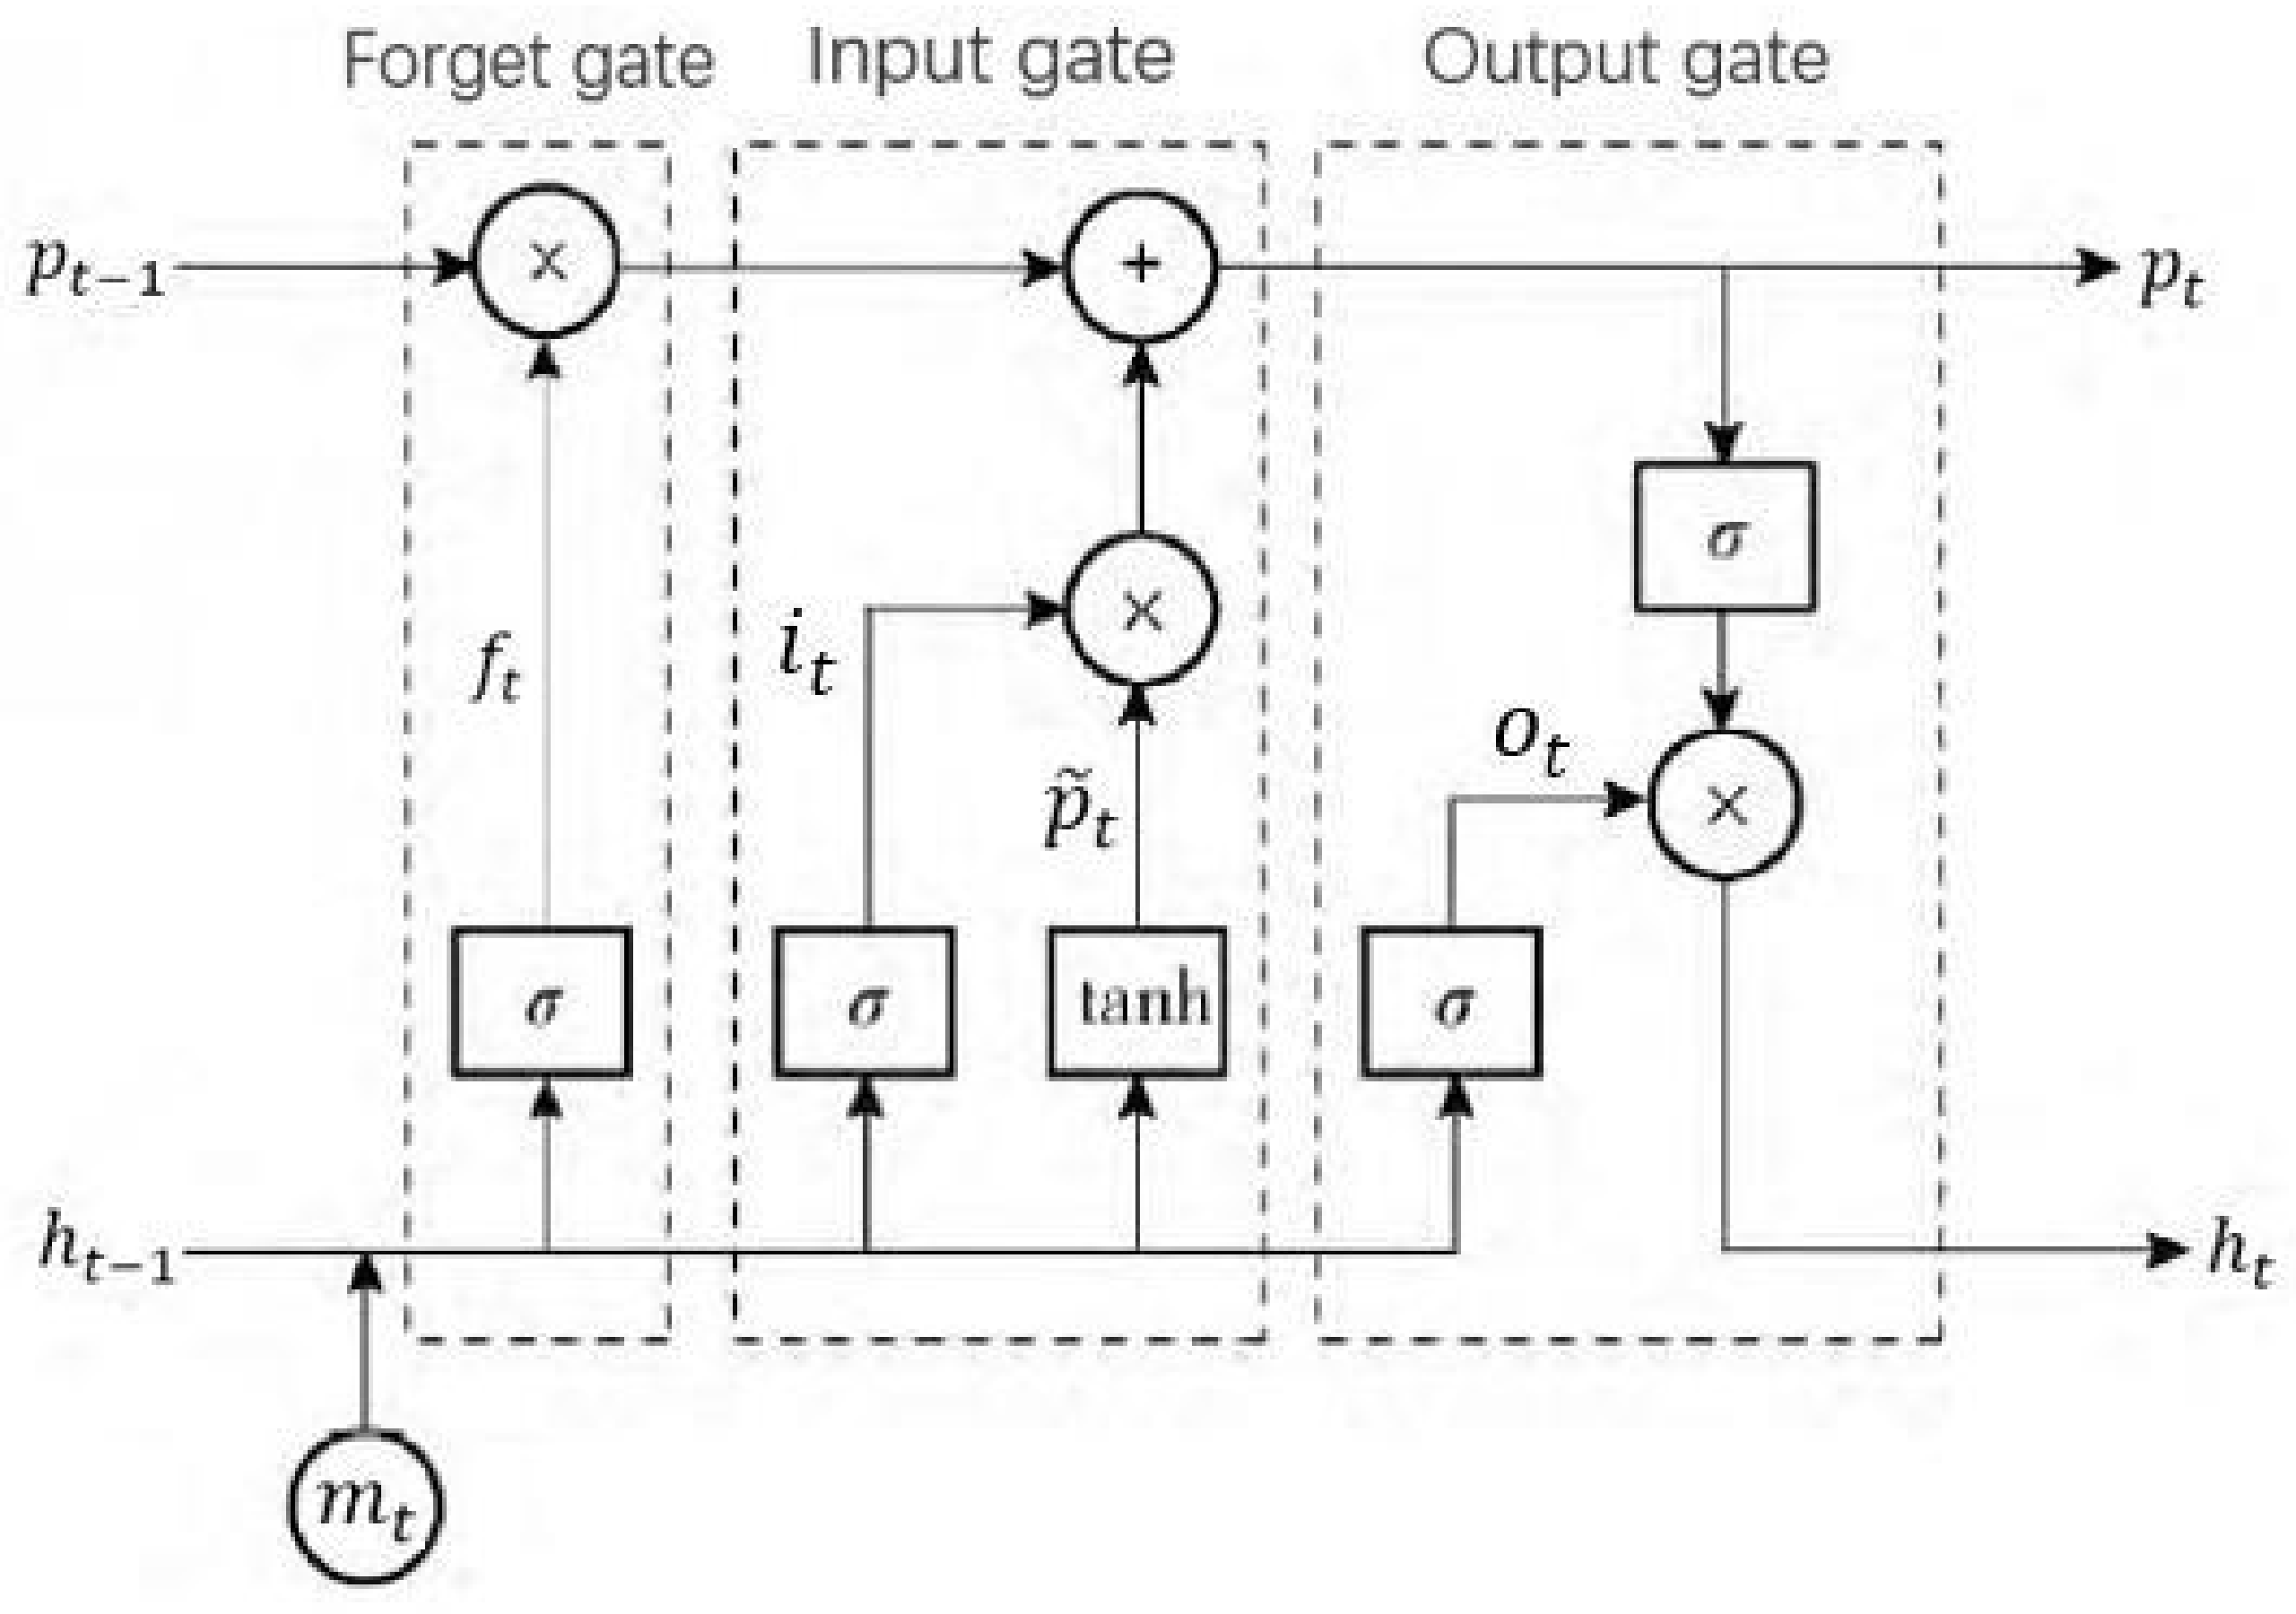
2.4. LSTM Deep Learning Forecast Model
3. Results
4. Discussion
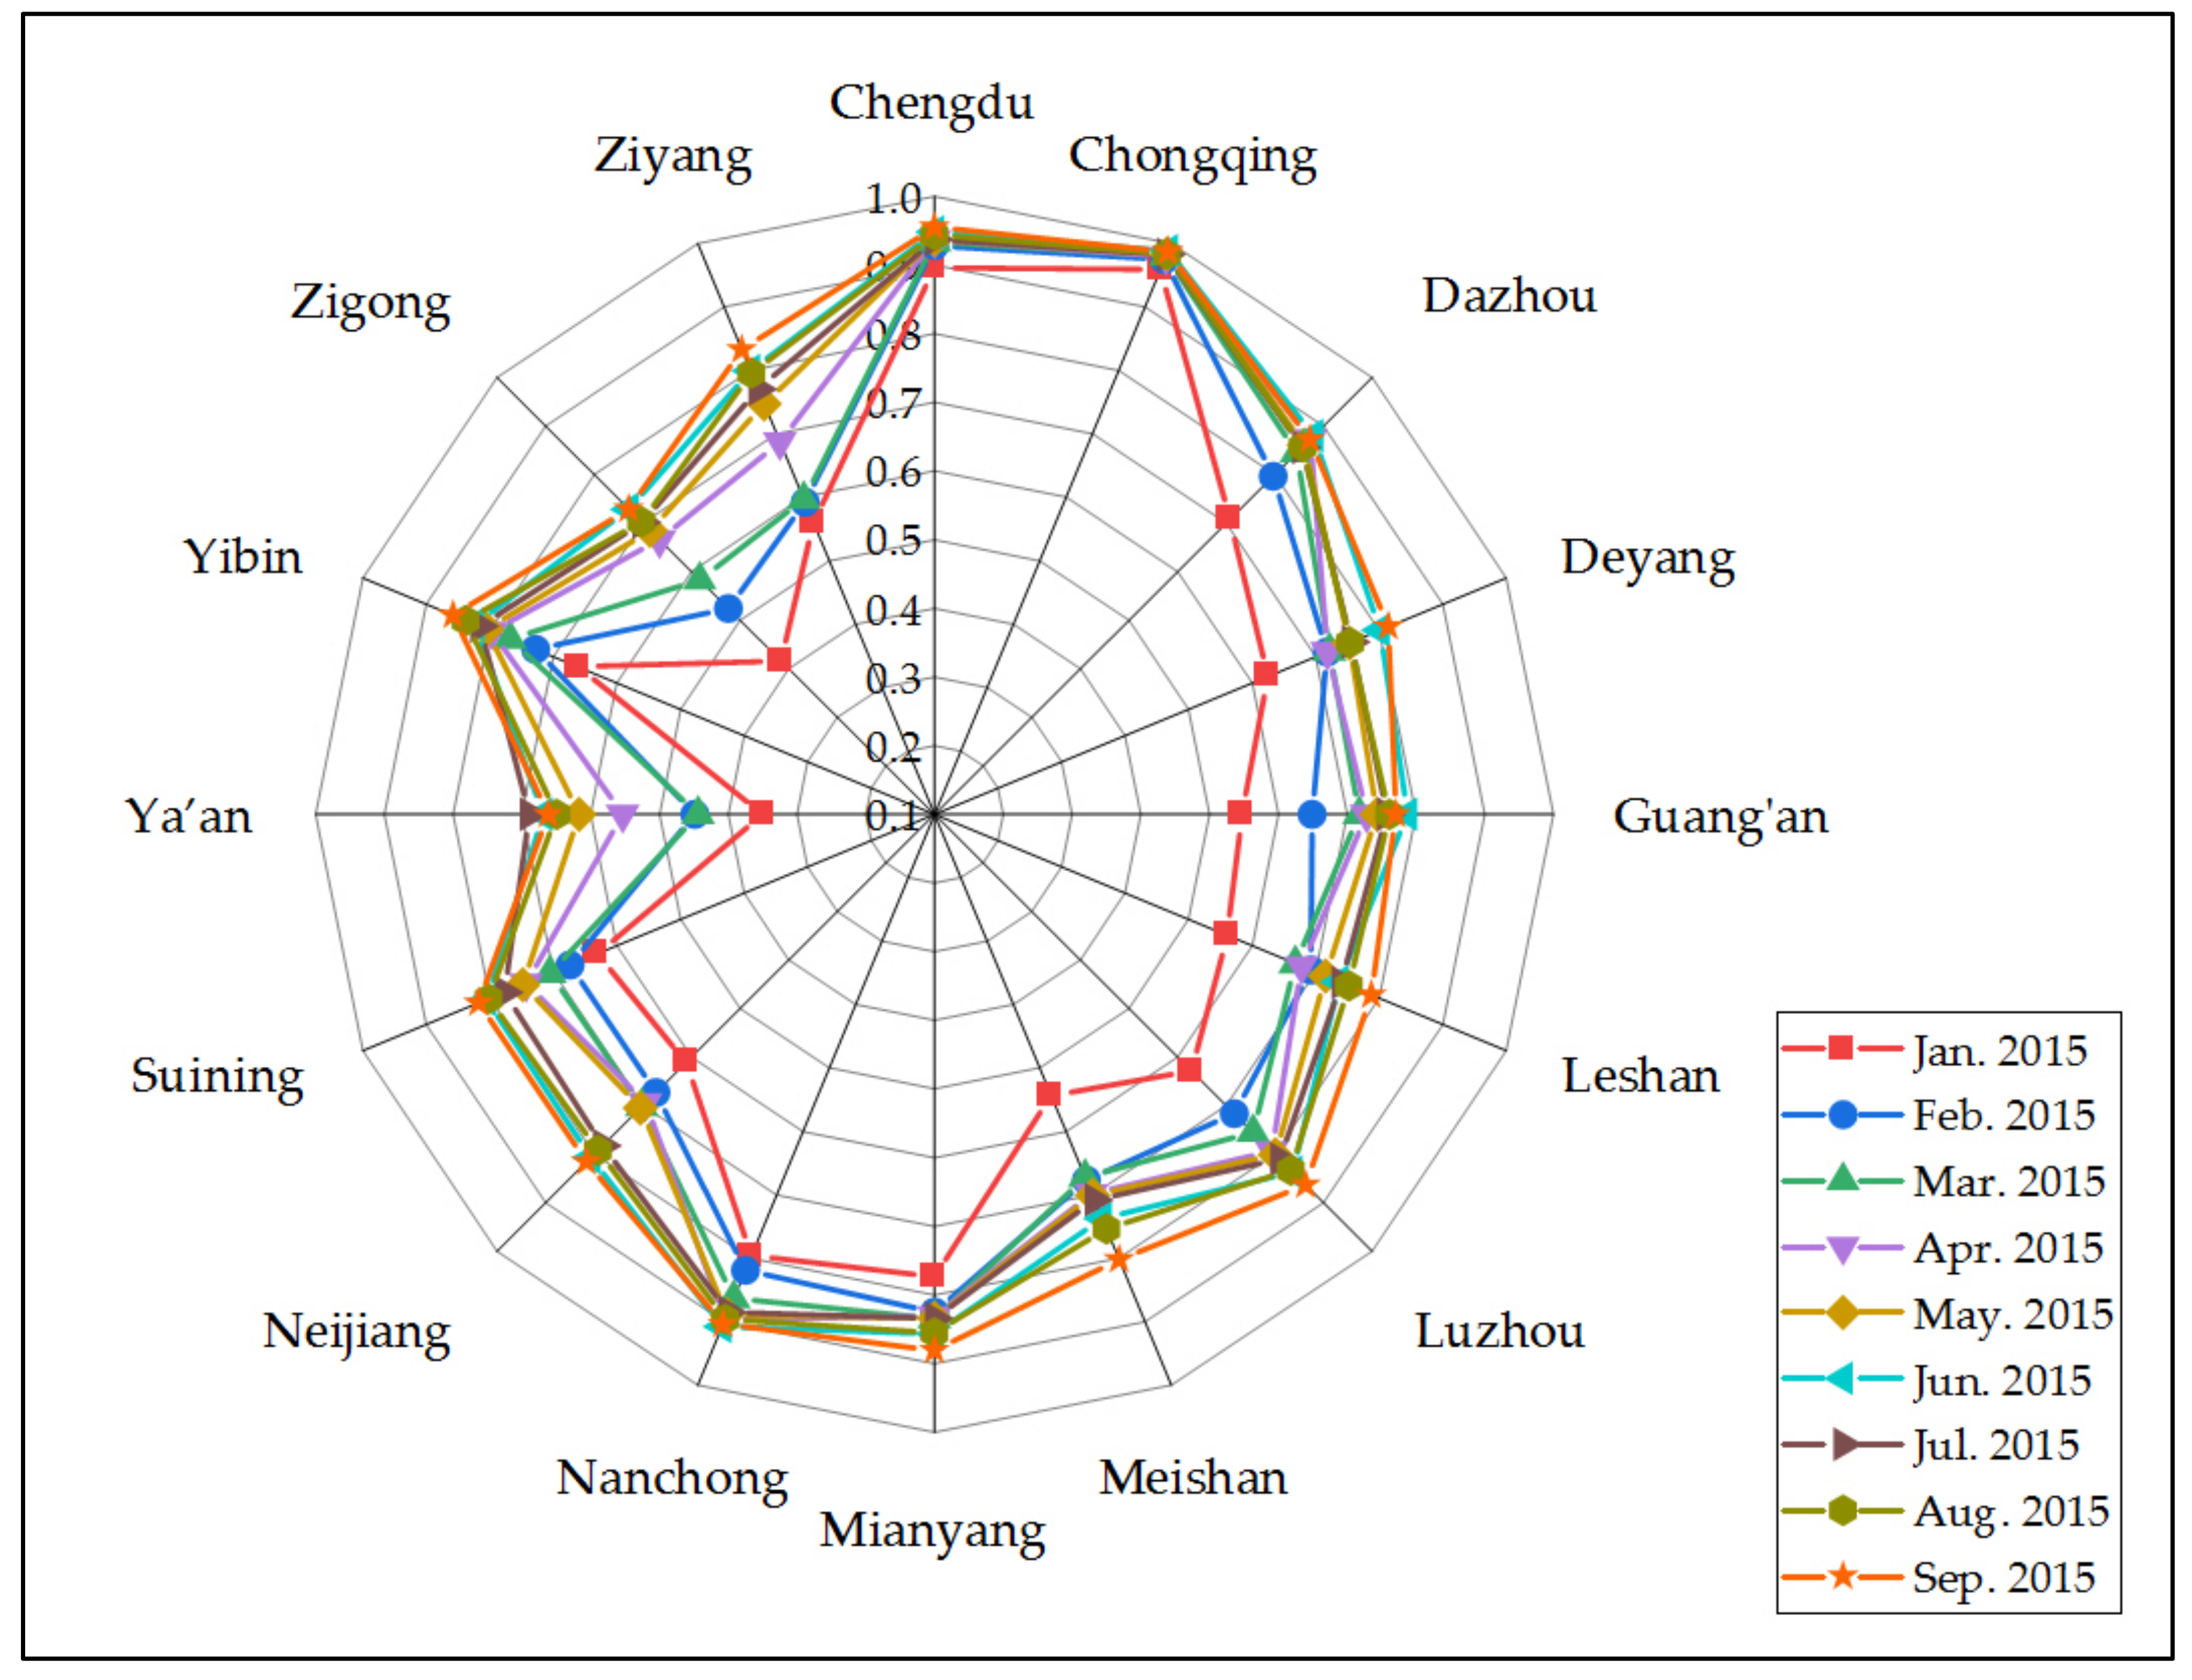
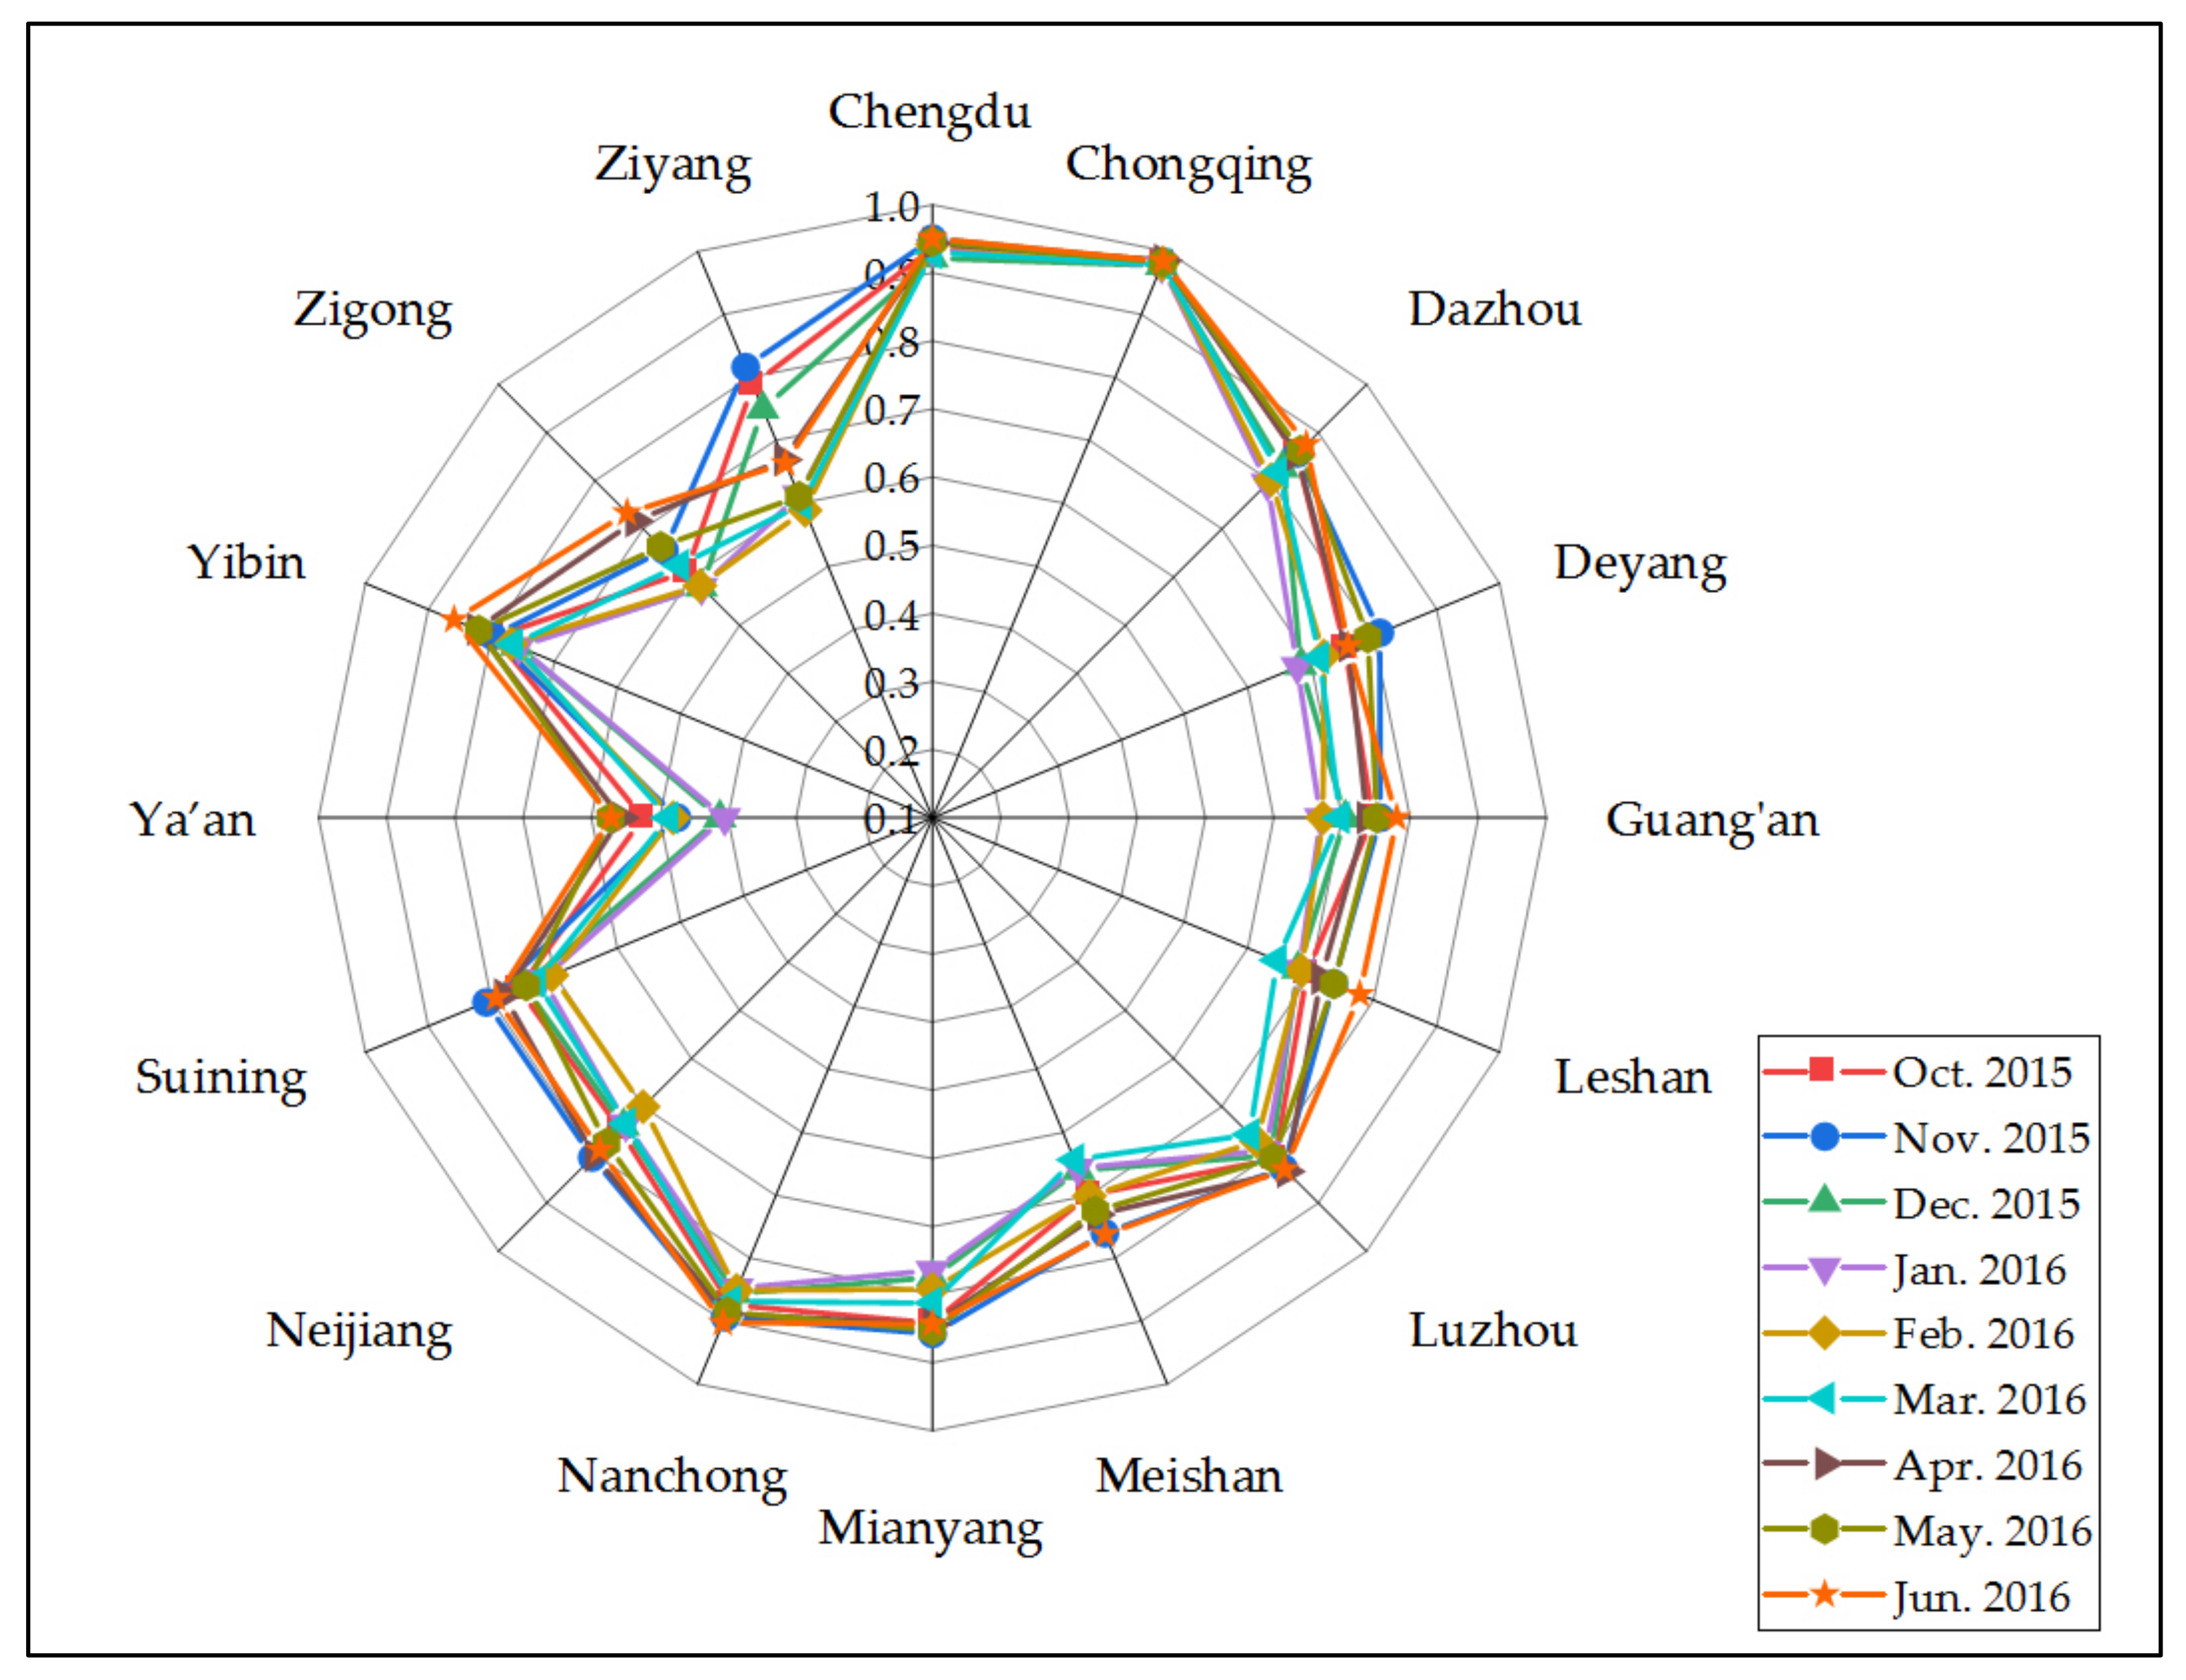
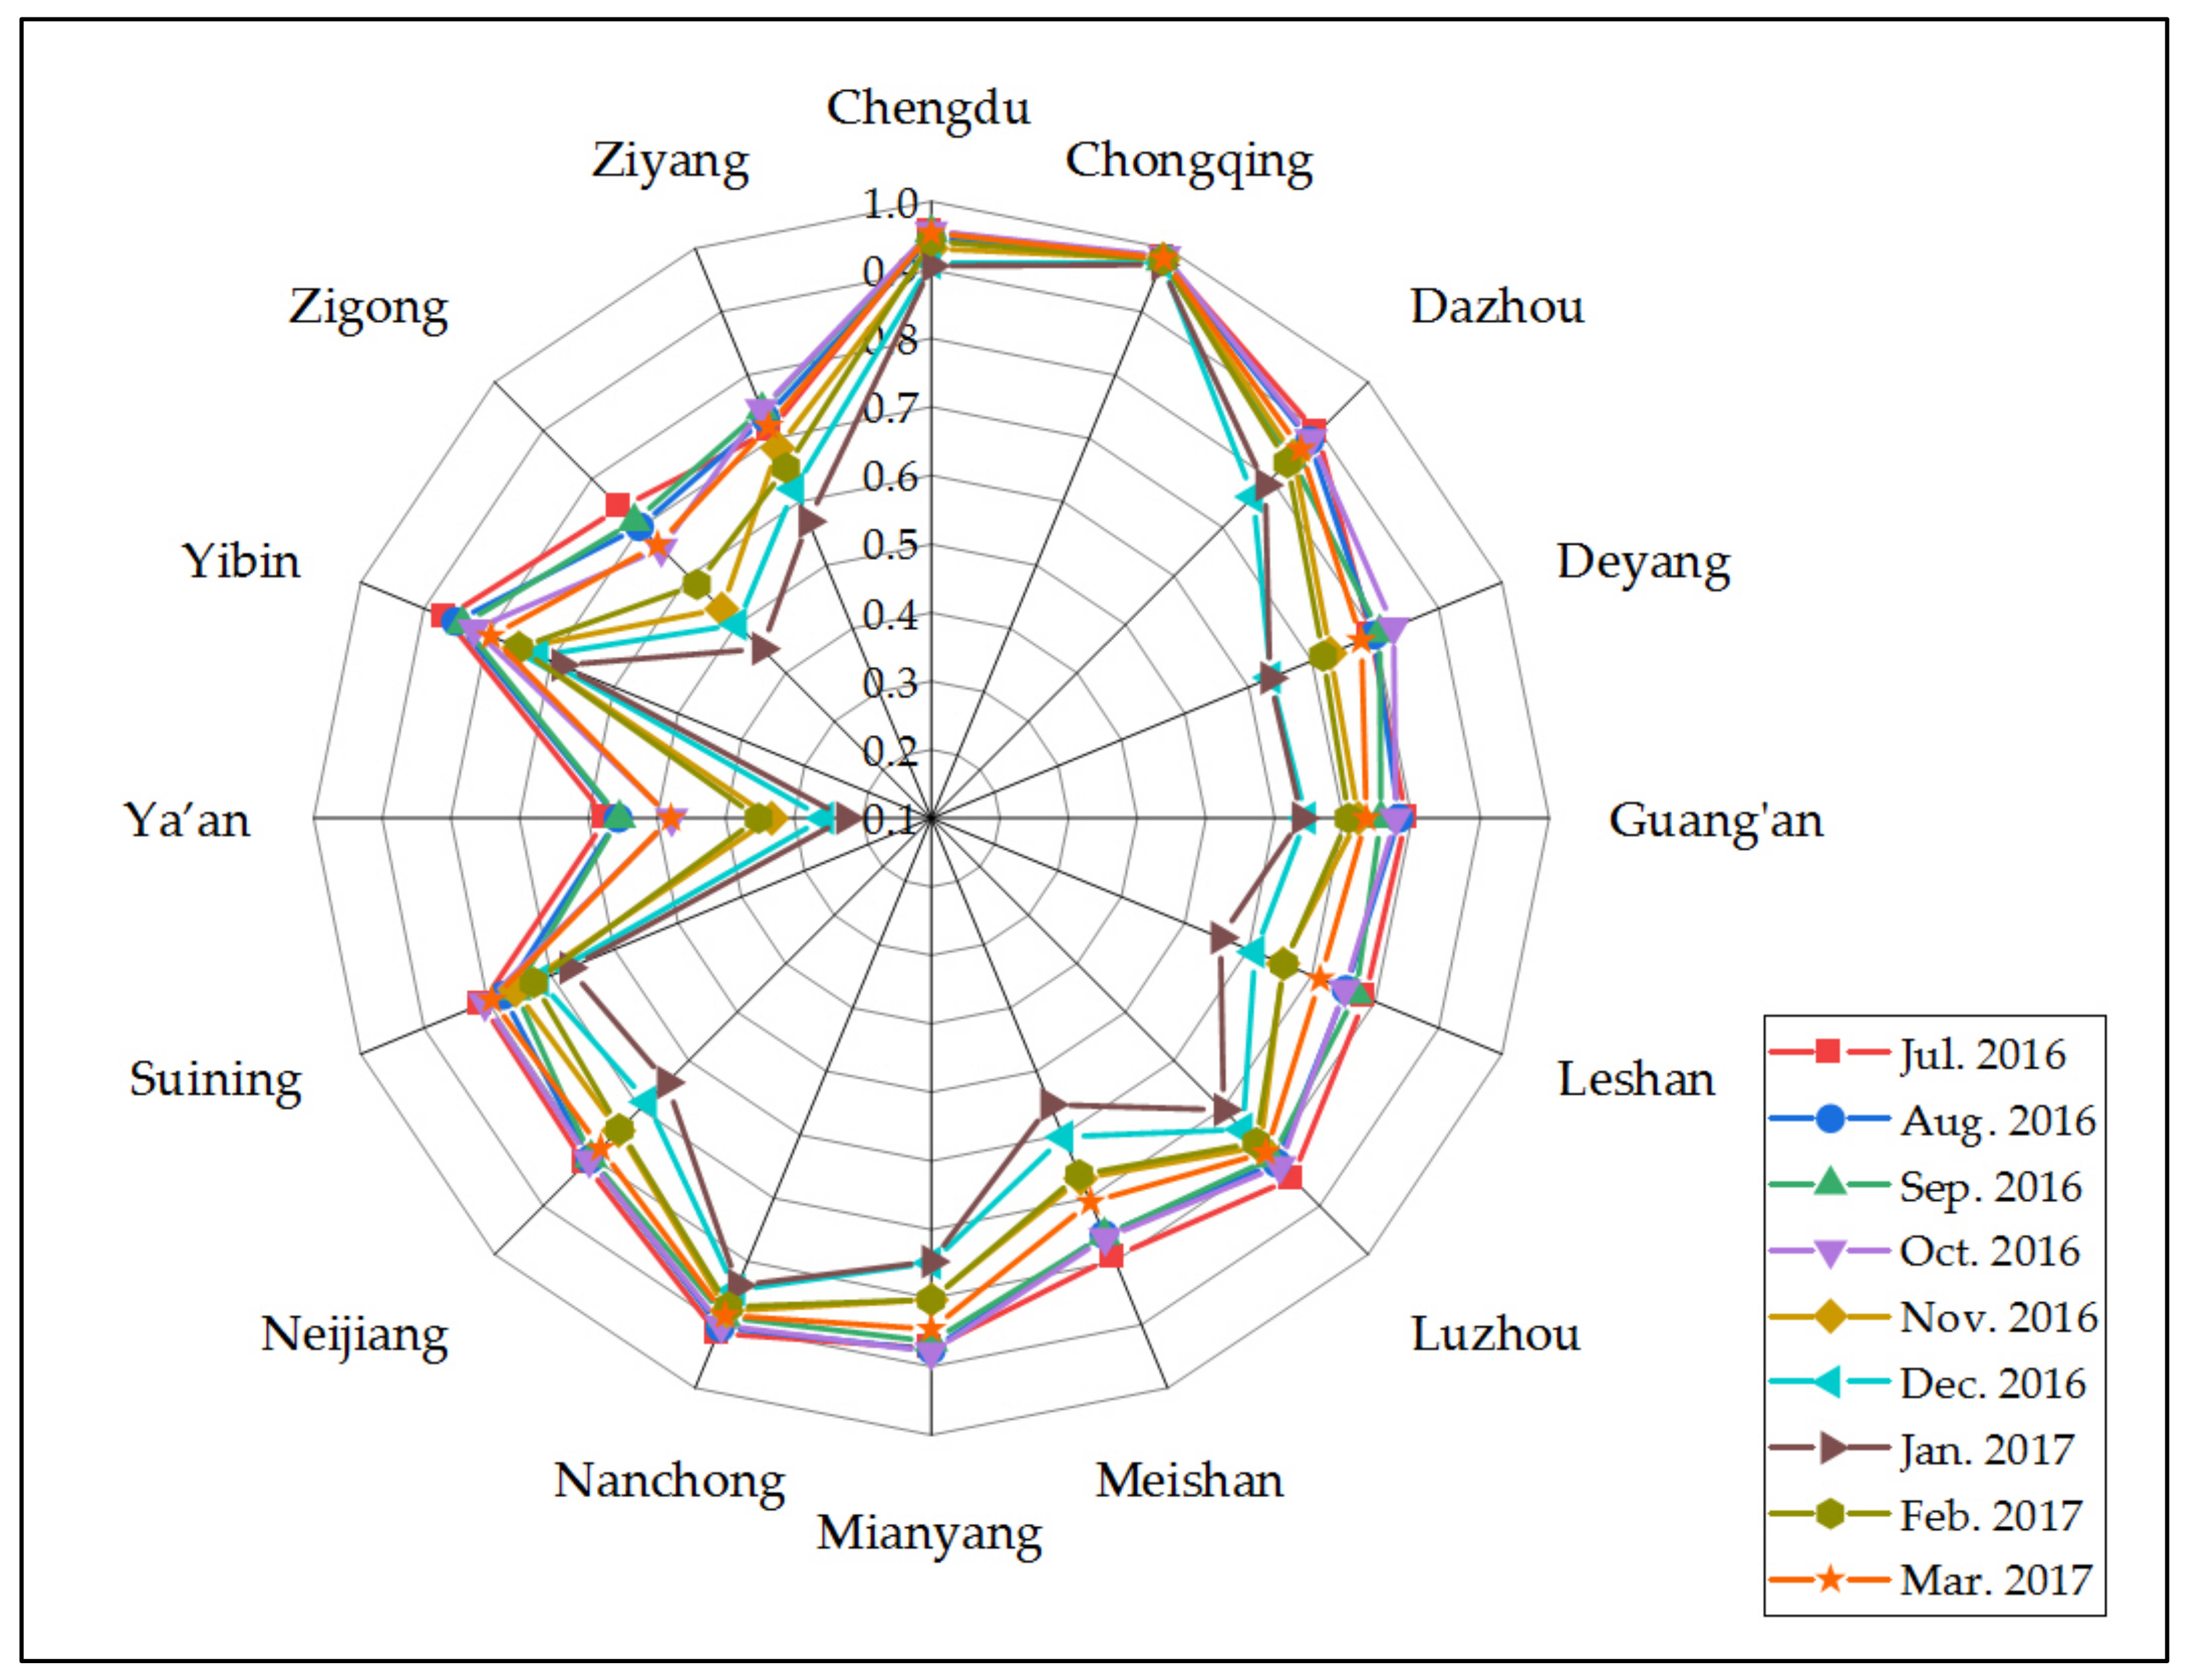
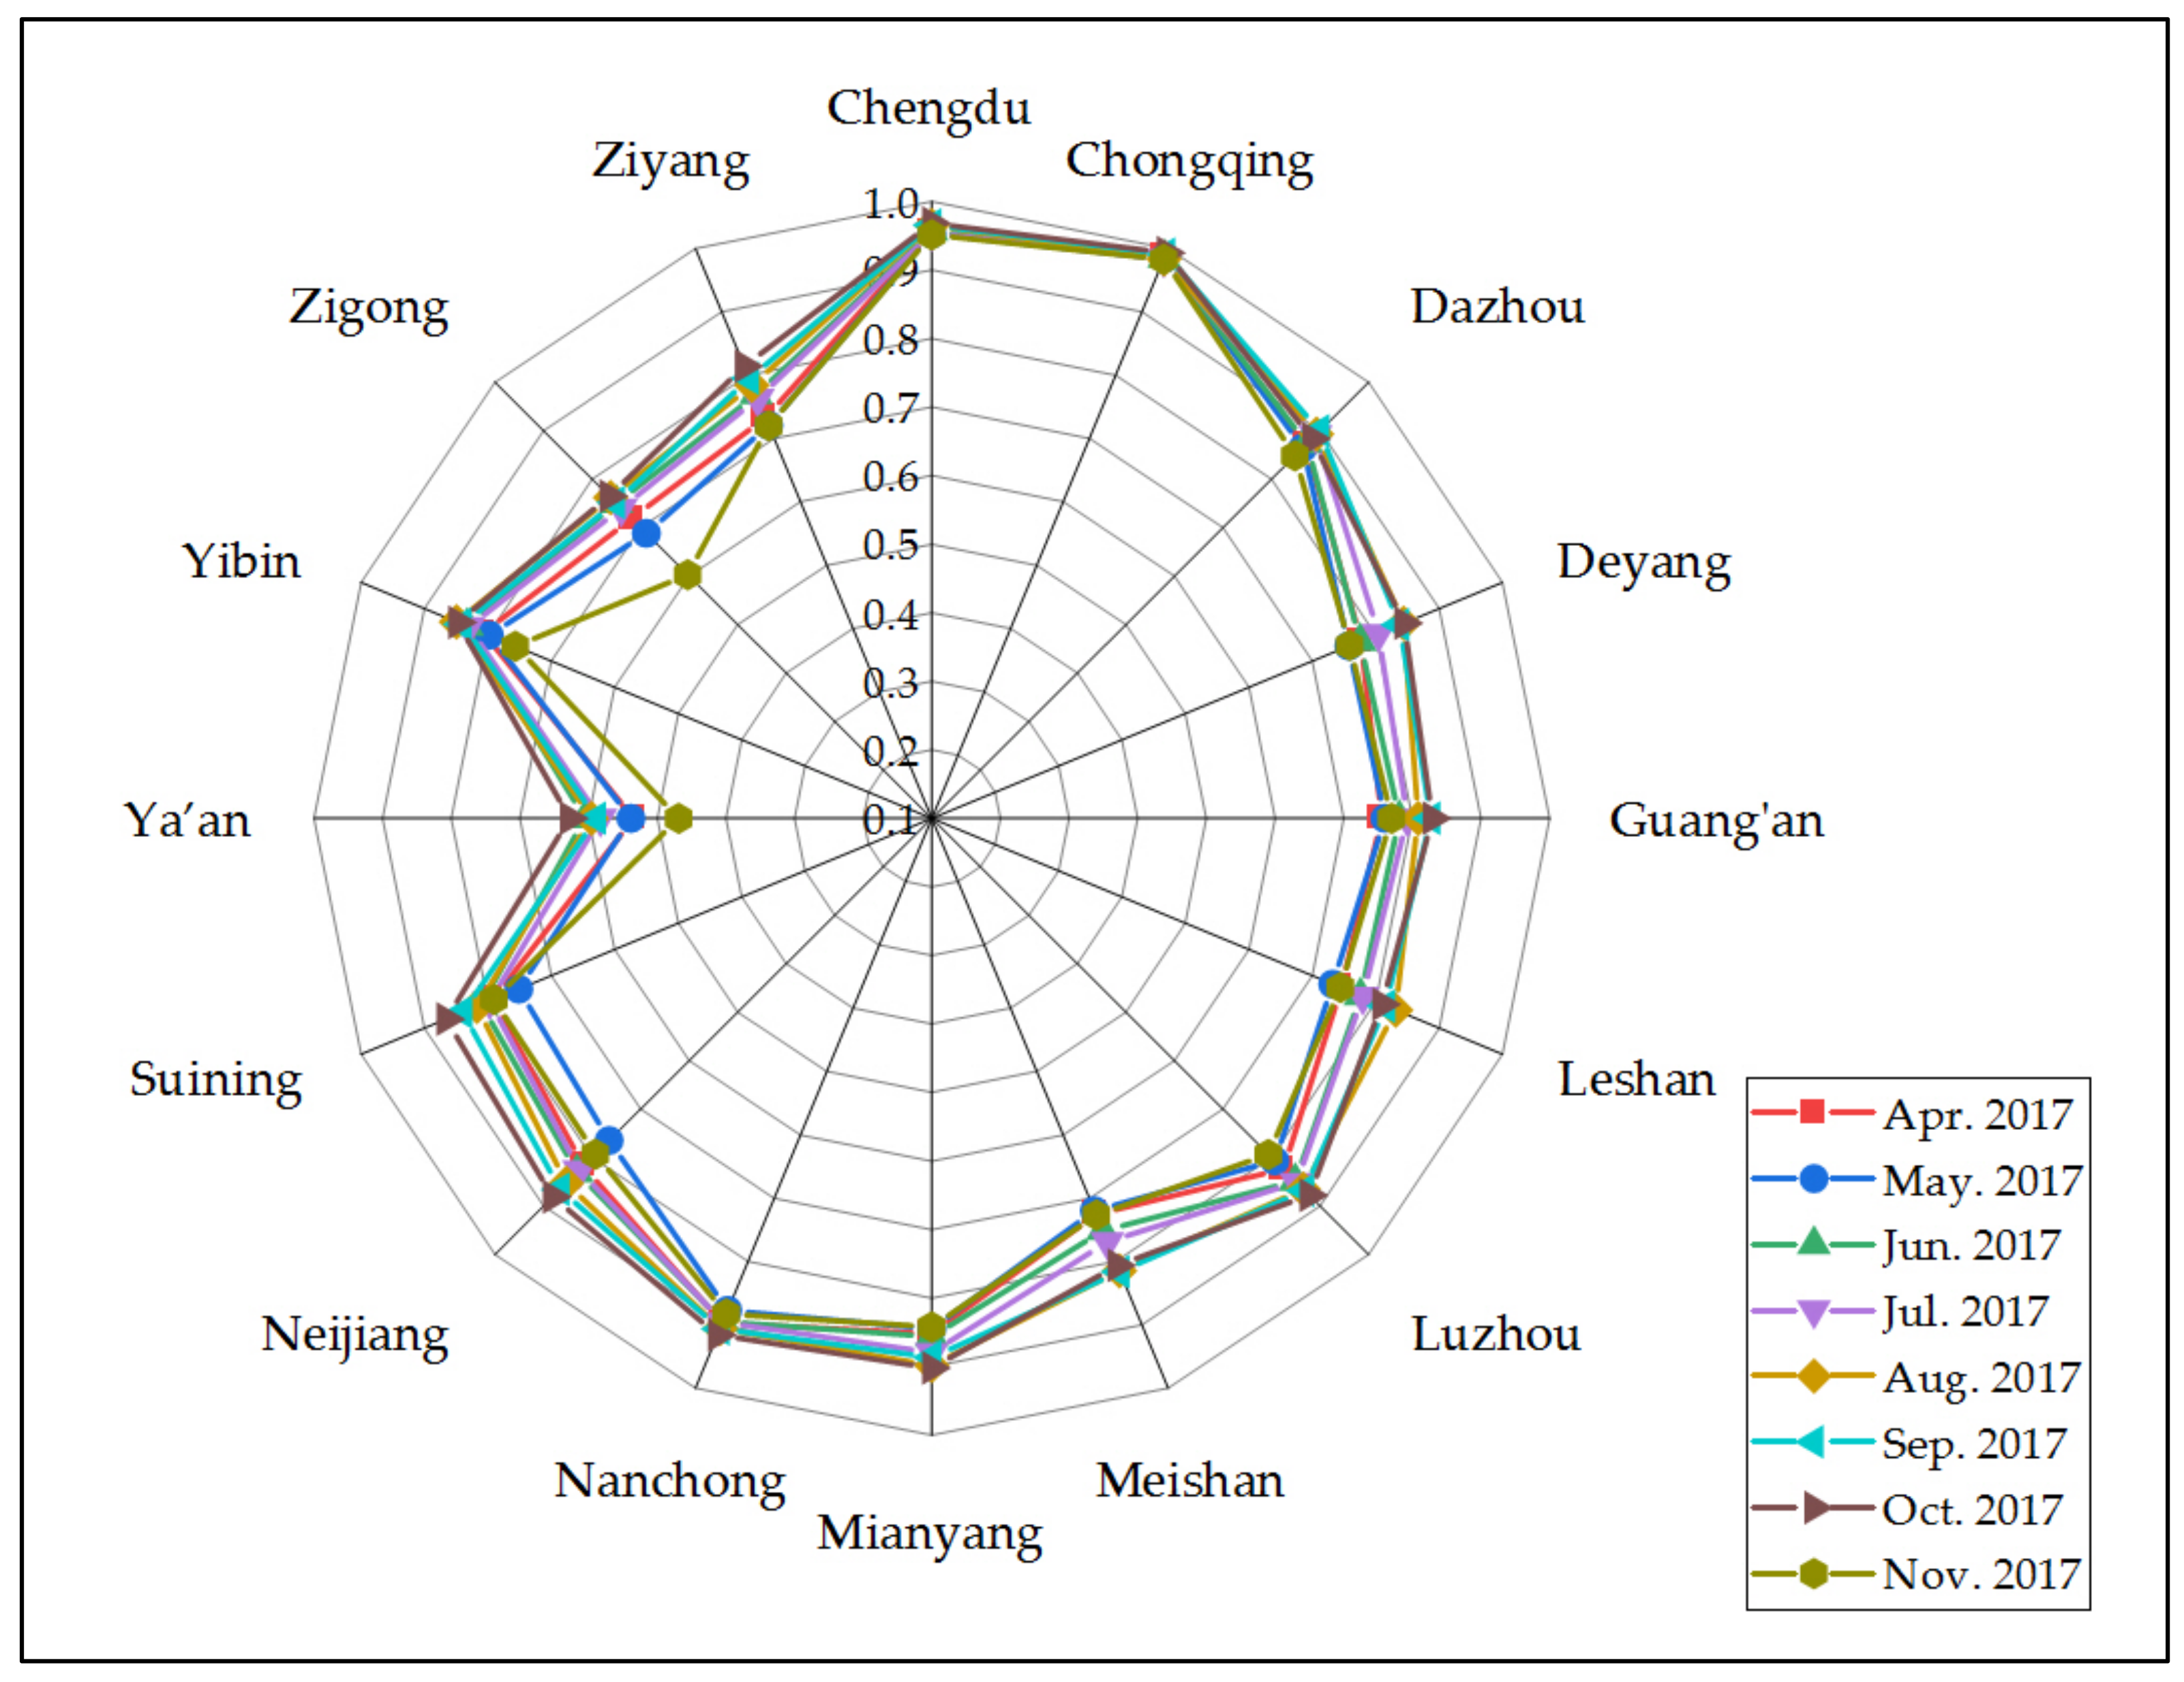
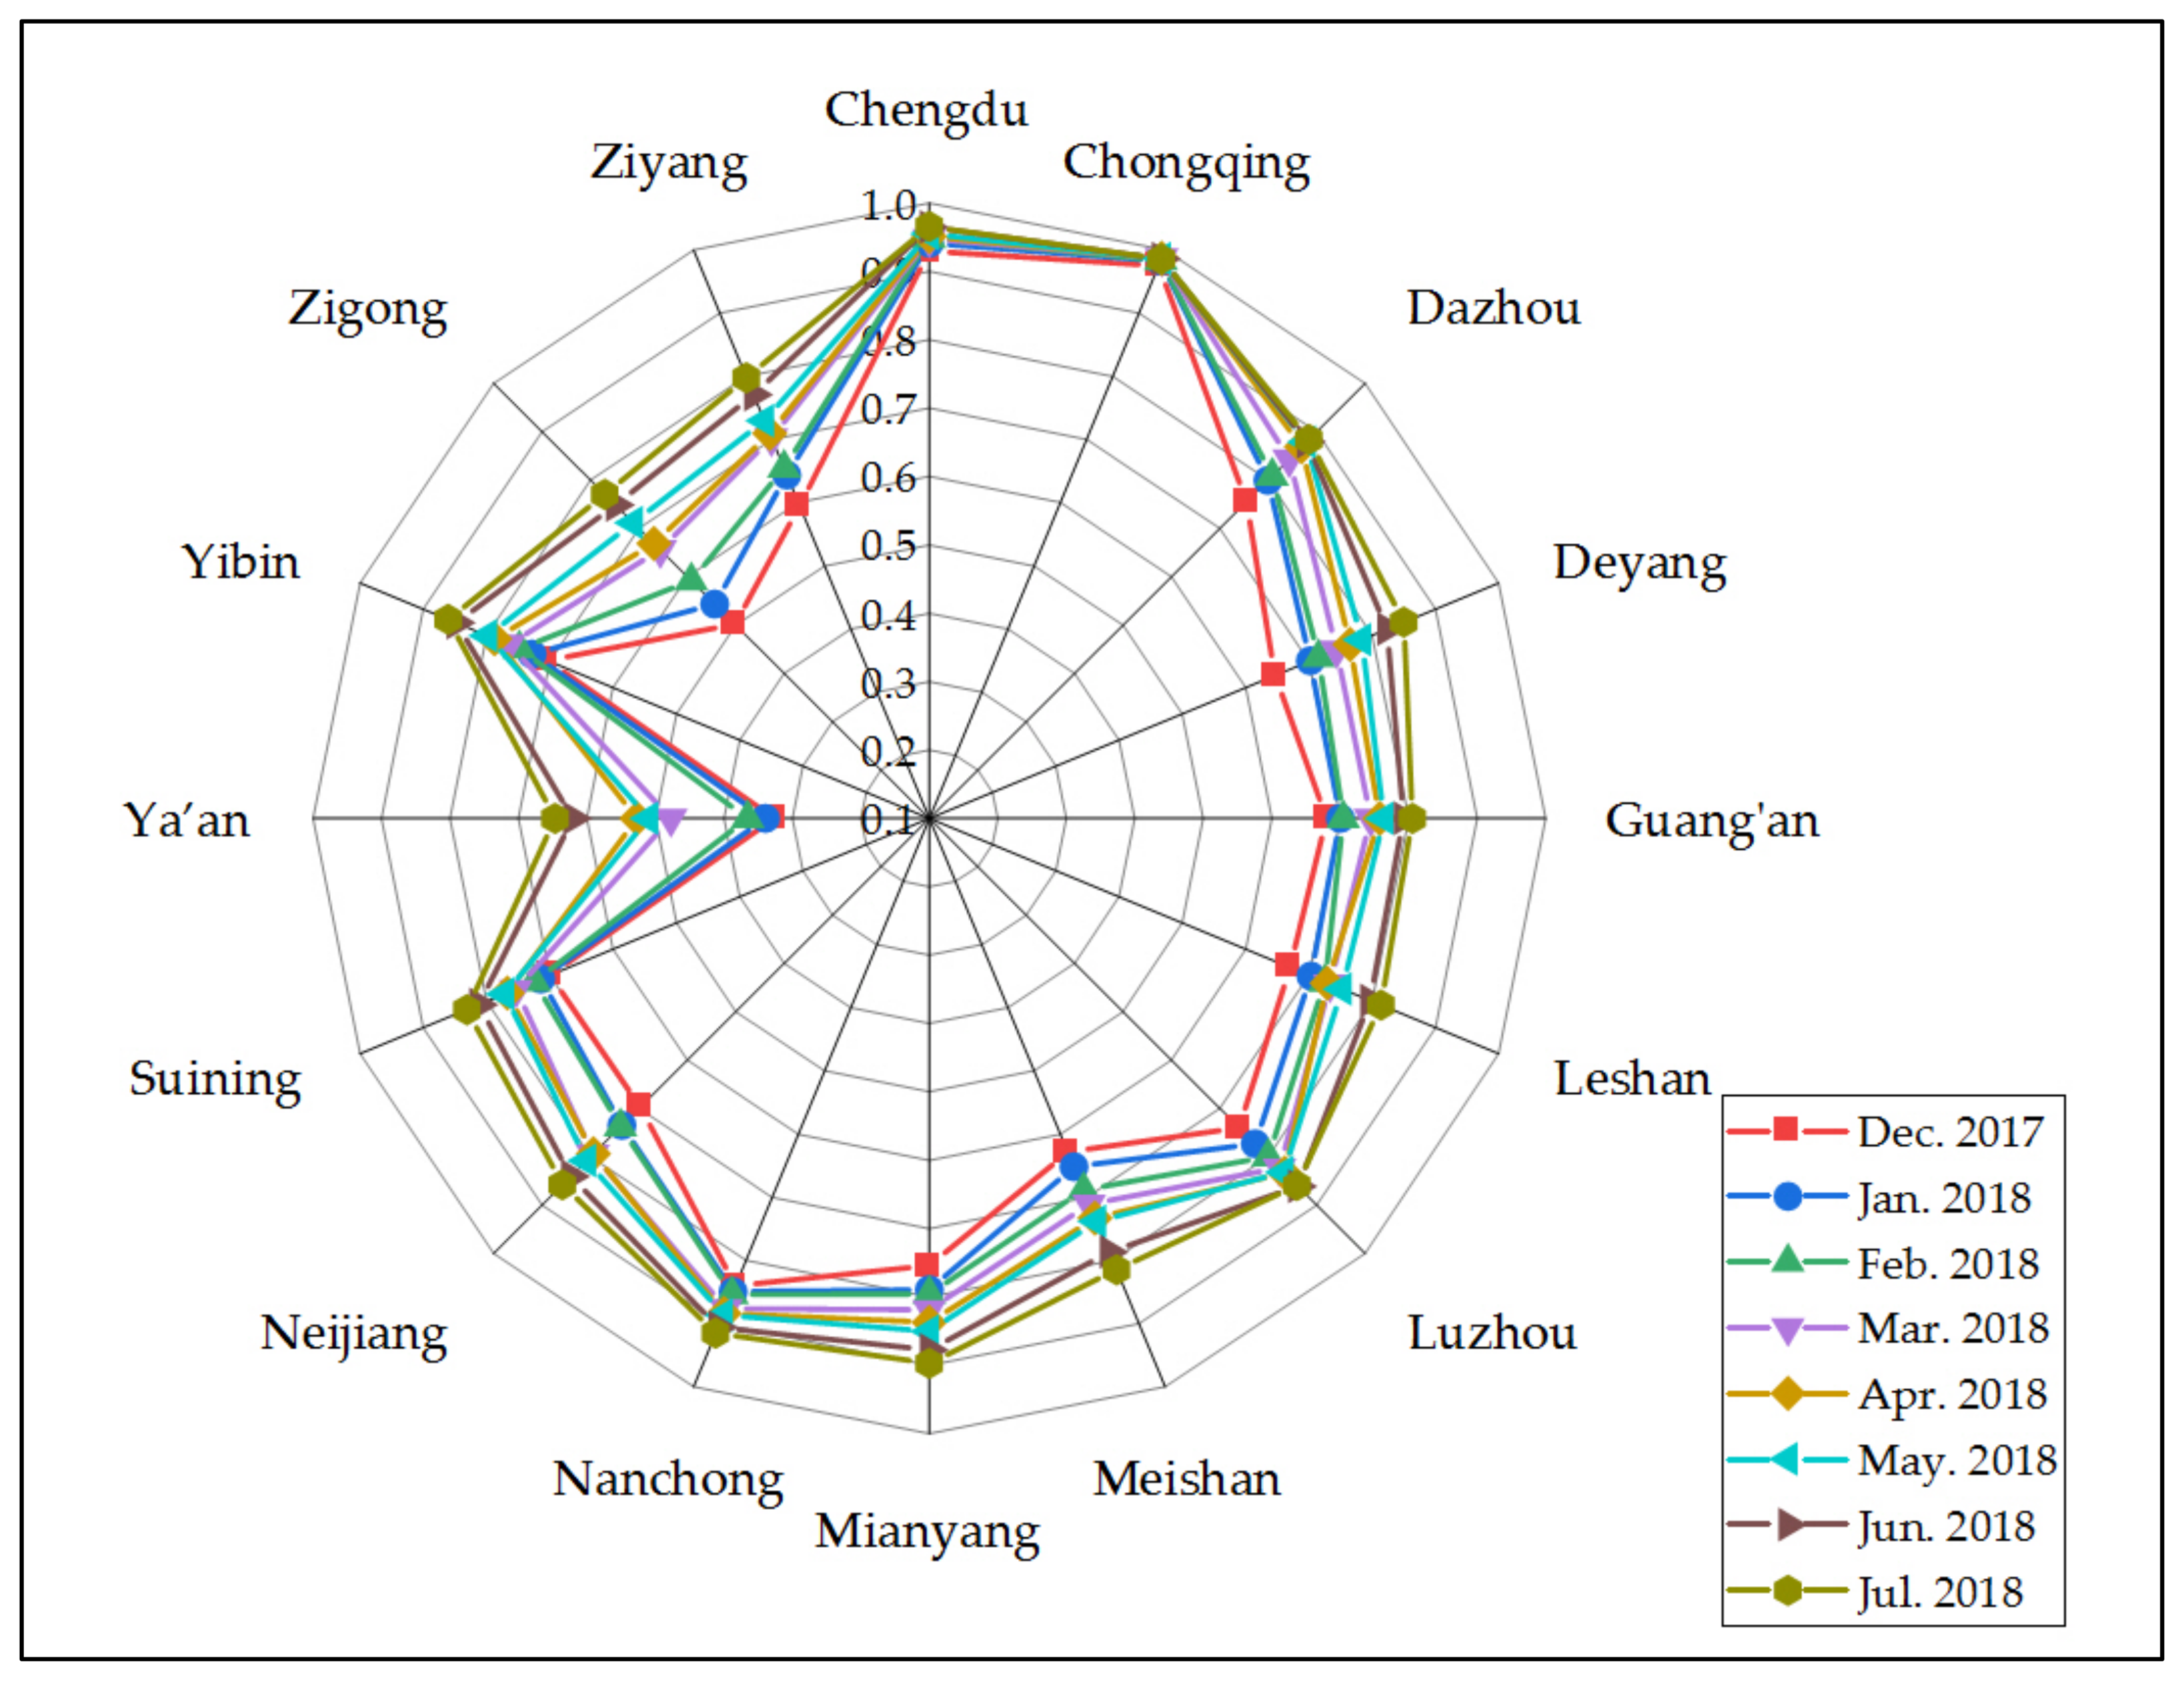
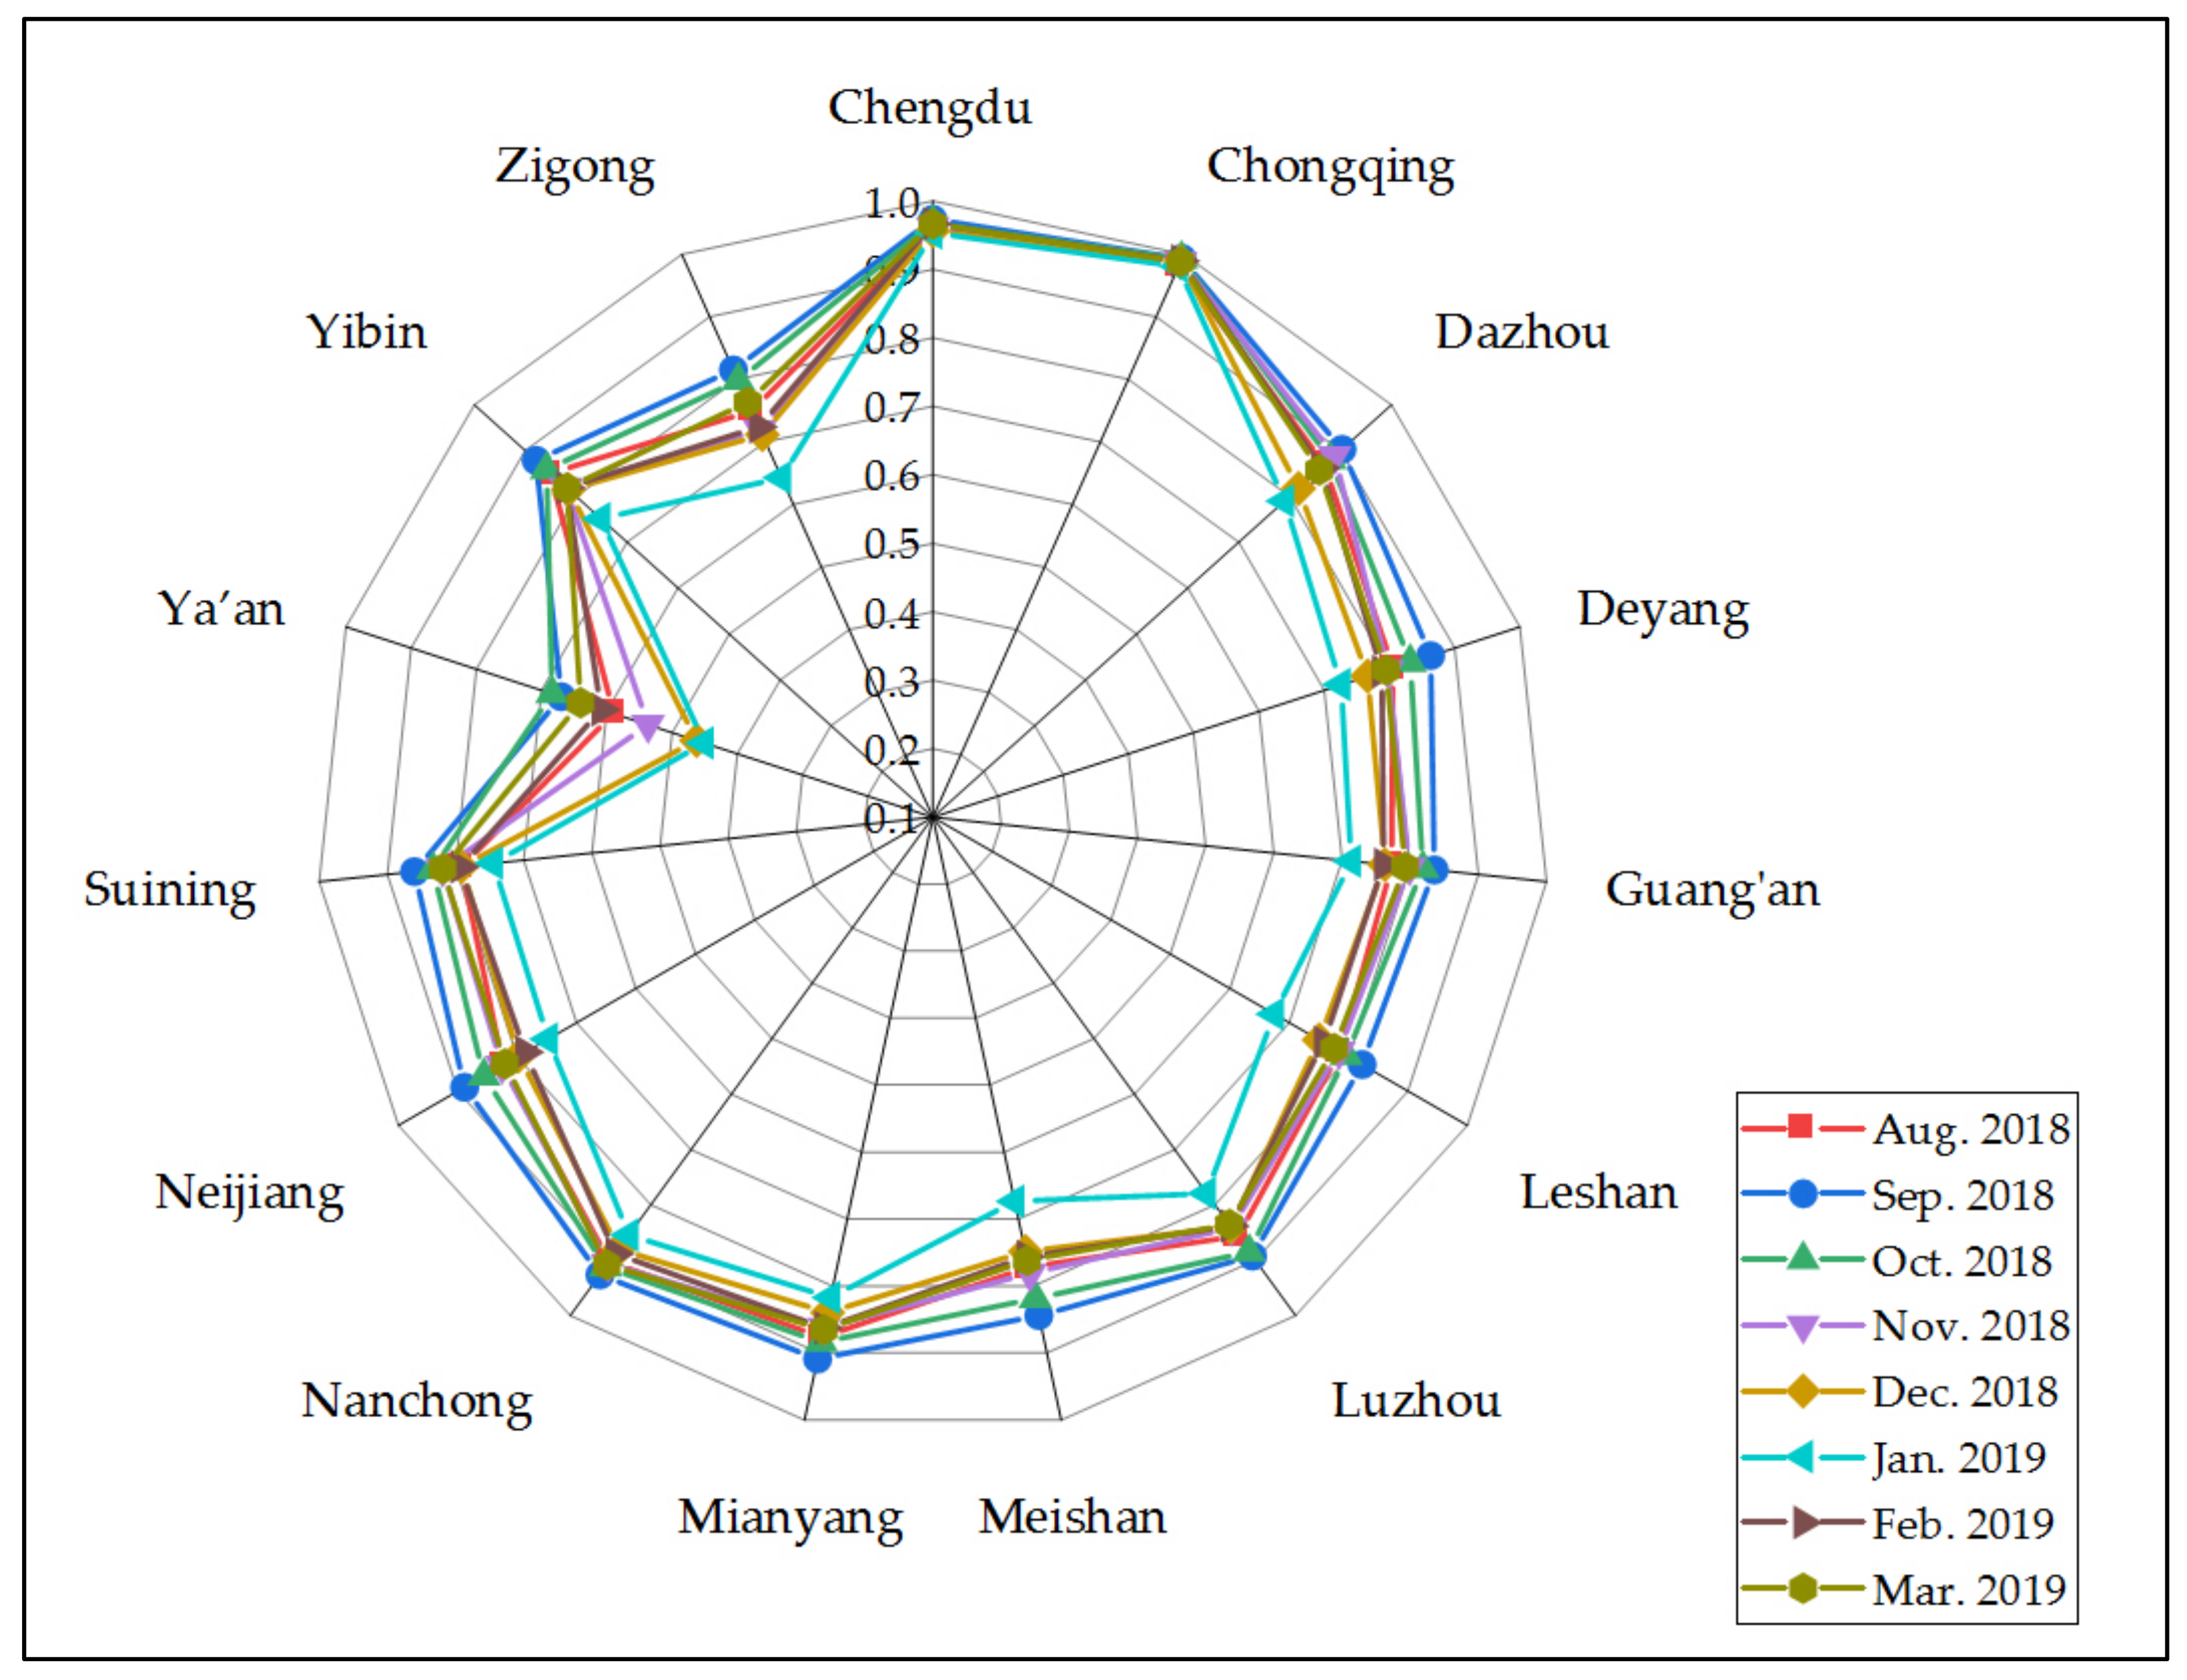
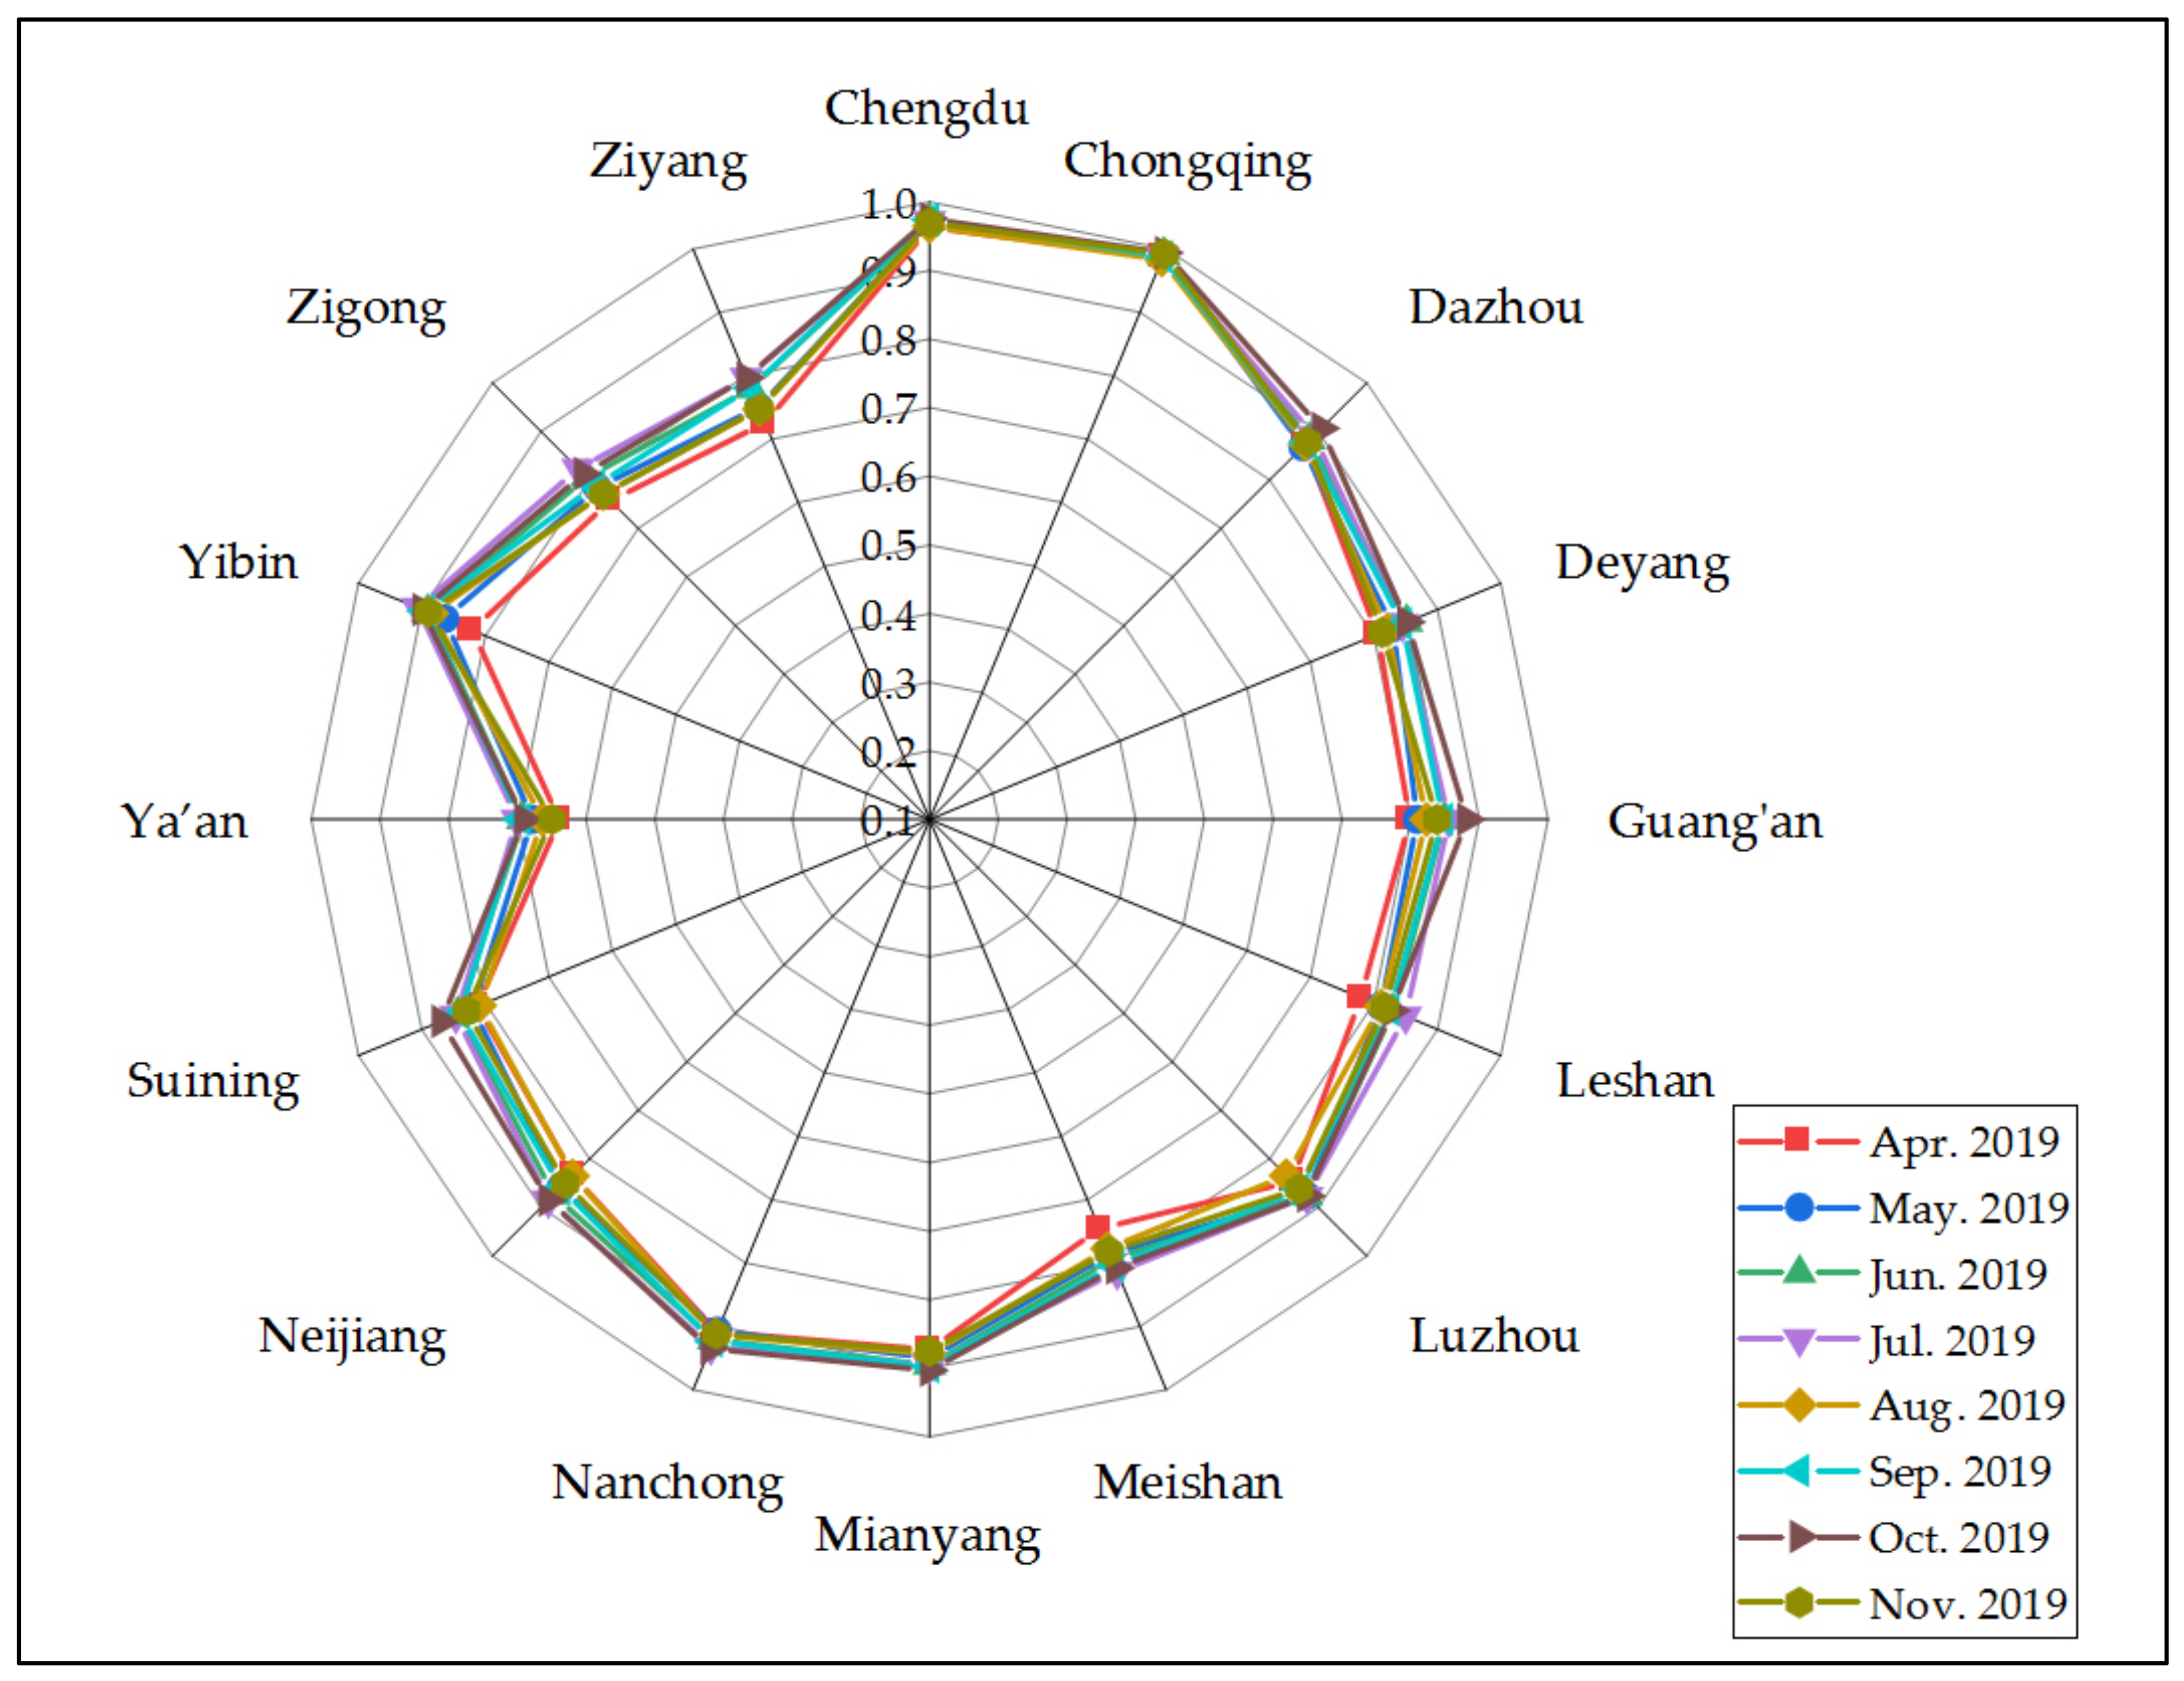
4.1. Analysis of Previous Effectiveness of Air Pollution Control
4.1.1. Conformity
4.1.2. Cyclicity
4.1.3. Improvement
4.1.4. Air Pollution Control Policies in Key Cities and Their Effectiveness
- (1)
- ChengduChengdu is the capital city of Sichuan Province, as well as the economic center and air pollution control center of the province. It can be seen from the historical data that Chengdu has achieved significant air quality improvements within the research period, with its air quality score rising from 0.8960 in January 2015 to 0.9700 in November 2019, an improvement of 8.26%. Even compared with the score of January 2019 (0.9532), there has been an improvement of 1.76%. At the same time, except for 2016, the air quality of Chengdu has been improving during the research period. In order to combat air pollution, Chengdu set up an emergency command office for heavy pollution in 2014, which is responsible for coordinating and leading air pollution control campaigns in the city as well as pollution control policy implementation. In 2015, Chengdu strictly enforced the “Measures for Public Participation in Environmental Protection” [85], and continuously improved the details through implementation, which expanded the participants in environmental protection from the government and enterprises to the general public and tried to encourage the attention and involvement of the public in air pollution control. As Chengdu is located in the Sichuan Basin with a fragile environment, it suffers more from air pollution incidents compared with other regions in China. Therefore, the local government has further developed an emergency response system in order to quickly and professionally handle air pollution incidents and minimize the negative impact of sudden pollution events. Chengdu has put great emphasis on controlling the sources of air pollution. It has stipulated restricted zones for heavy-pollution fuels [86], strictly limits the emission of motor vehicles, and prohibits vehicles that do not meet standards from driving on the road; during heavy pollution periods, the local government would enforce polluting enterprises to curtail or stop production [87]. These policies and measures have effectively reduced air pollution from the source.
- (2)
- ChongqingChongqing is another key city in the Chengdu-Chongqing region. It is also one of the four municipalities directly under the central government of China, thereby enjoying the same administrative level as Sichuan Province. Due to the geographical proximity and the resulting economic and cultural integration, Chongqing follows similar ideas in air pollution control policy design as the other cities in the Chengdu-Chongqing region. However, as a municipality directly under the central government, Chongqing is more independent and implements additional measures in pollution control policy design compared with other cities in the Chengdu-Chongqing region. Under the general leadership of the central government, Chongqing has come up with the concept of “Blue Sky Protection Campaign” for air pollution control [88,89].It is worth noting that in the model setting and calculation, this paper uses the average value of six pollutants based on the population of each city. Although the total emissions of air pollutants in Chengdu and Chongqing are not low, the population of them are also considerable—the population of Chengdu in 2019 is 16.5810 million [90] and that of Chongqing is 31.2432 million [91]. The above two cities have relatively high air quality evaluation values, indicating that their air pollution control policies have achieved improved air quality in the time since 2016 to the present.
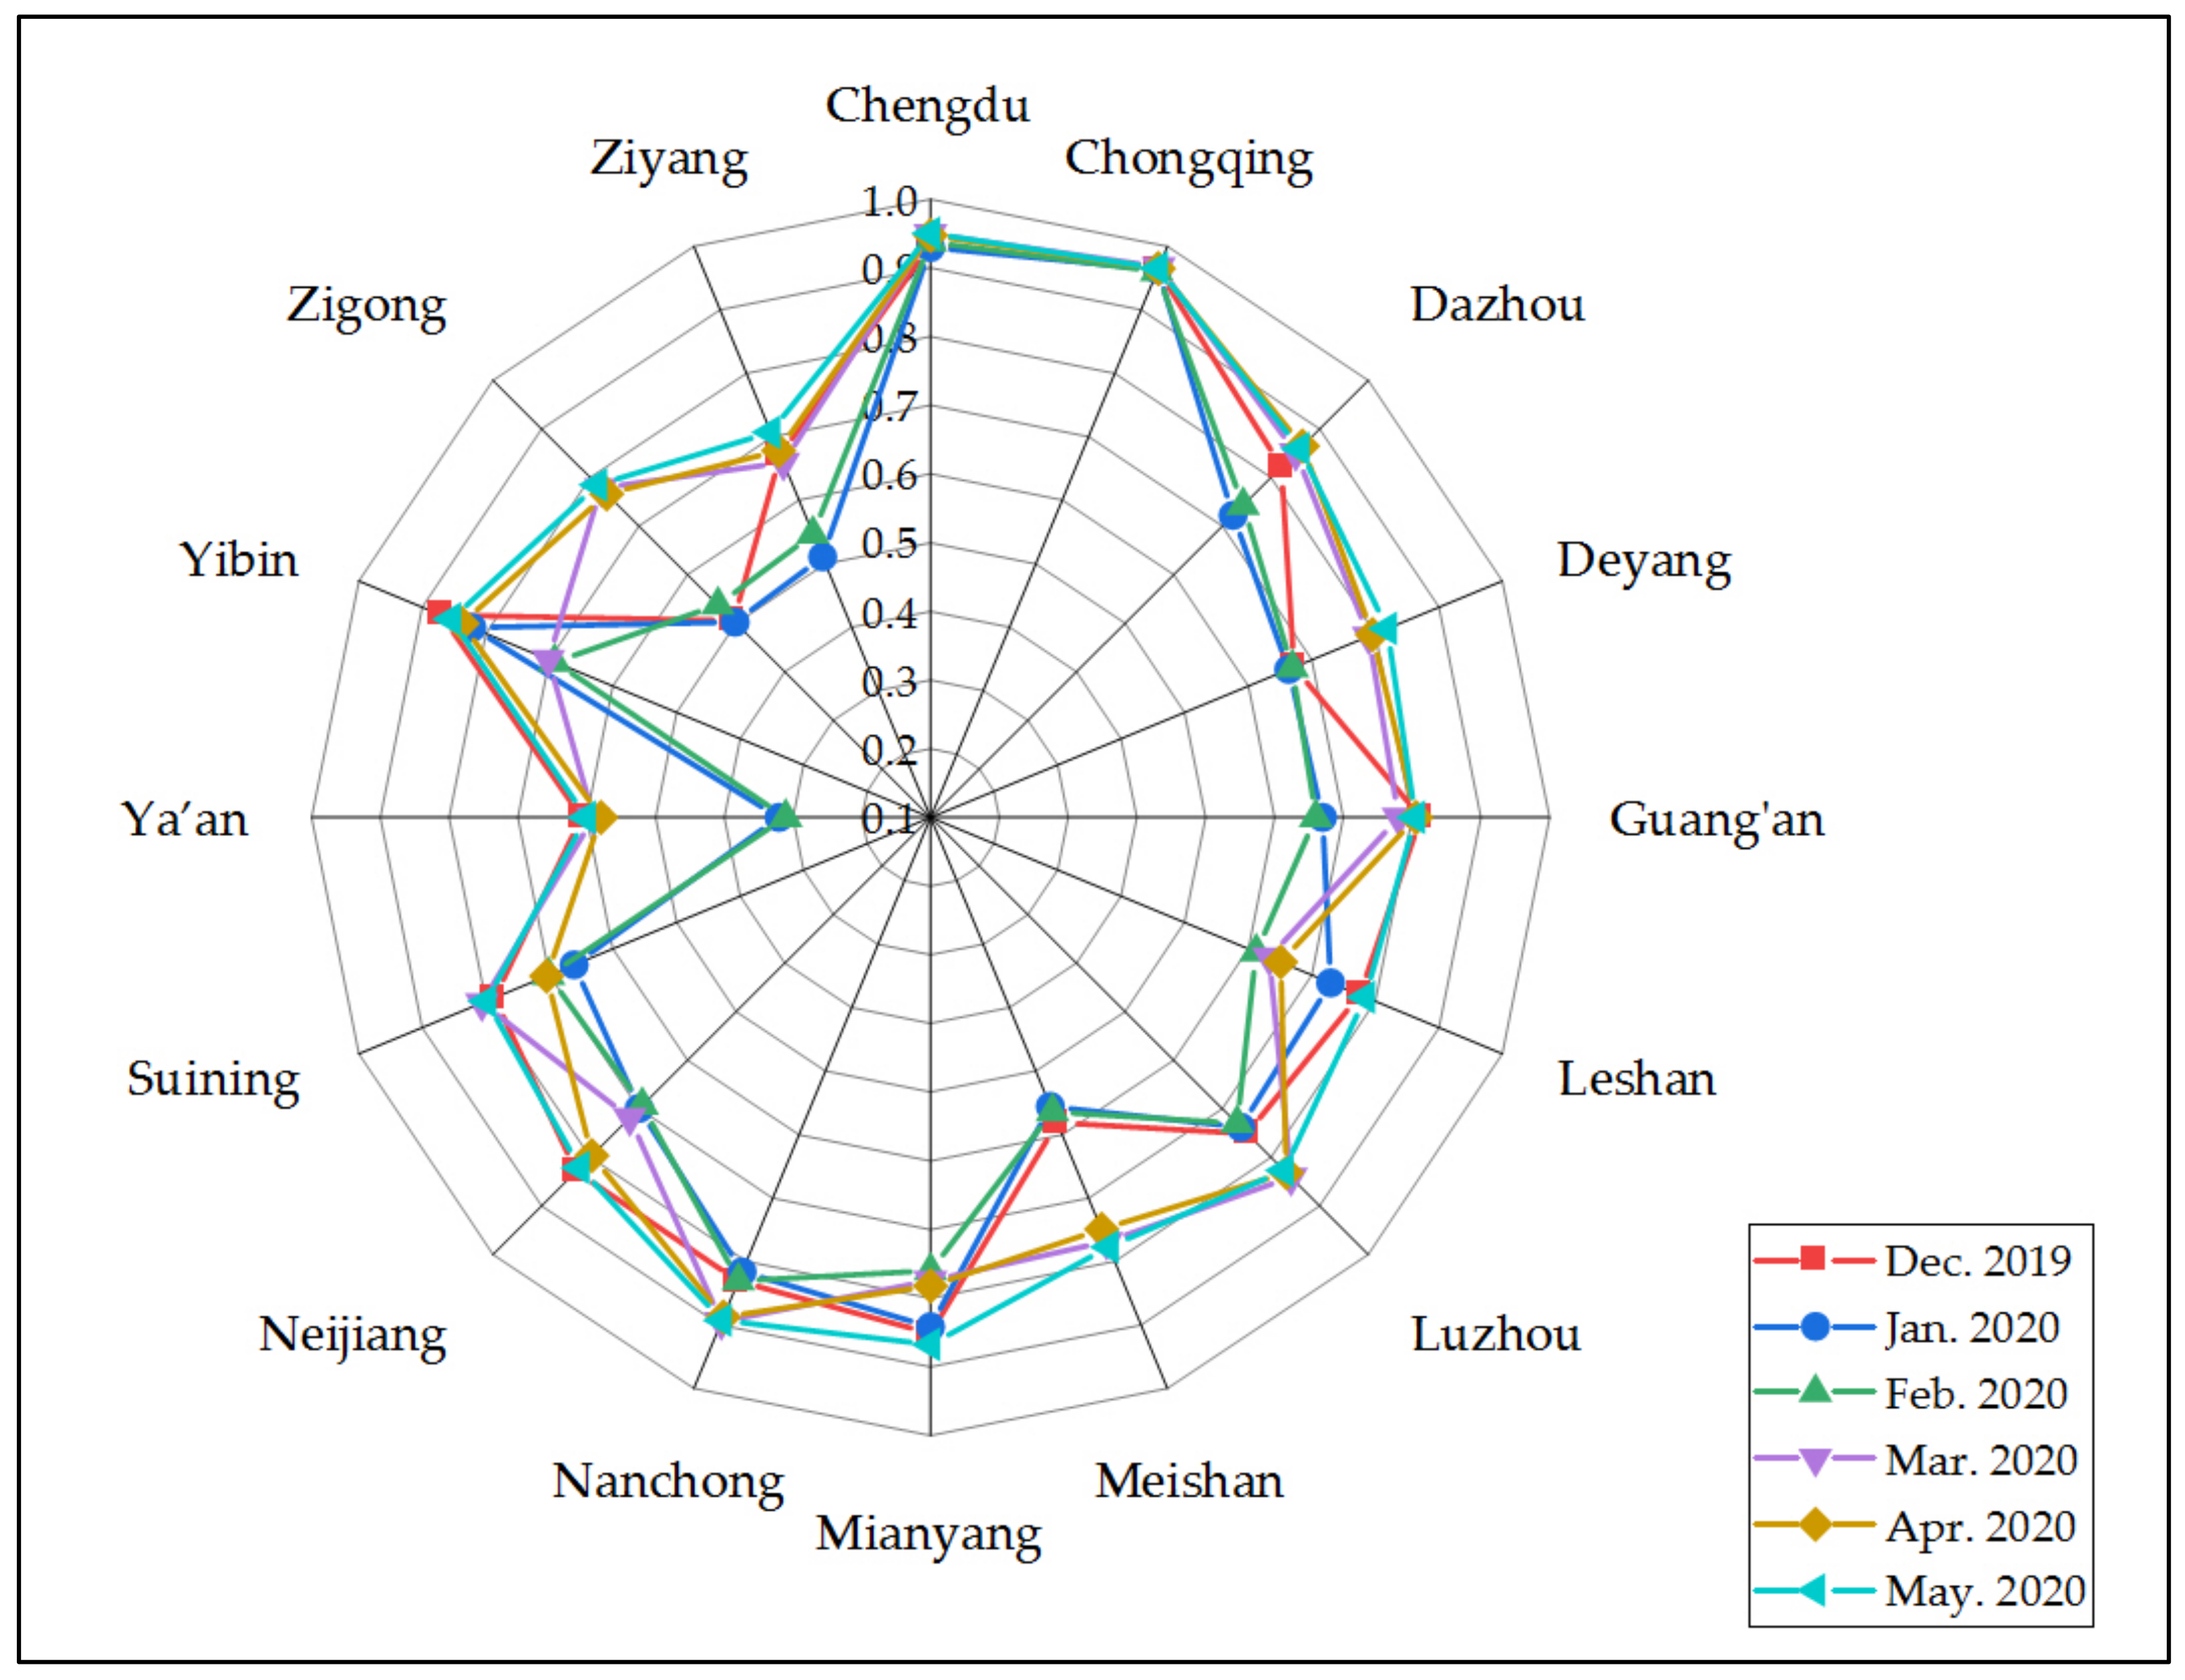
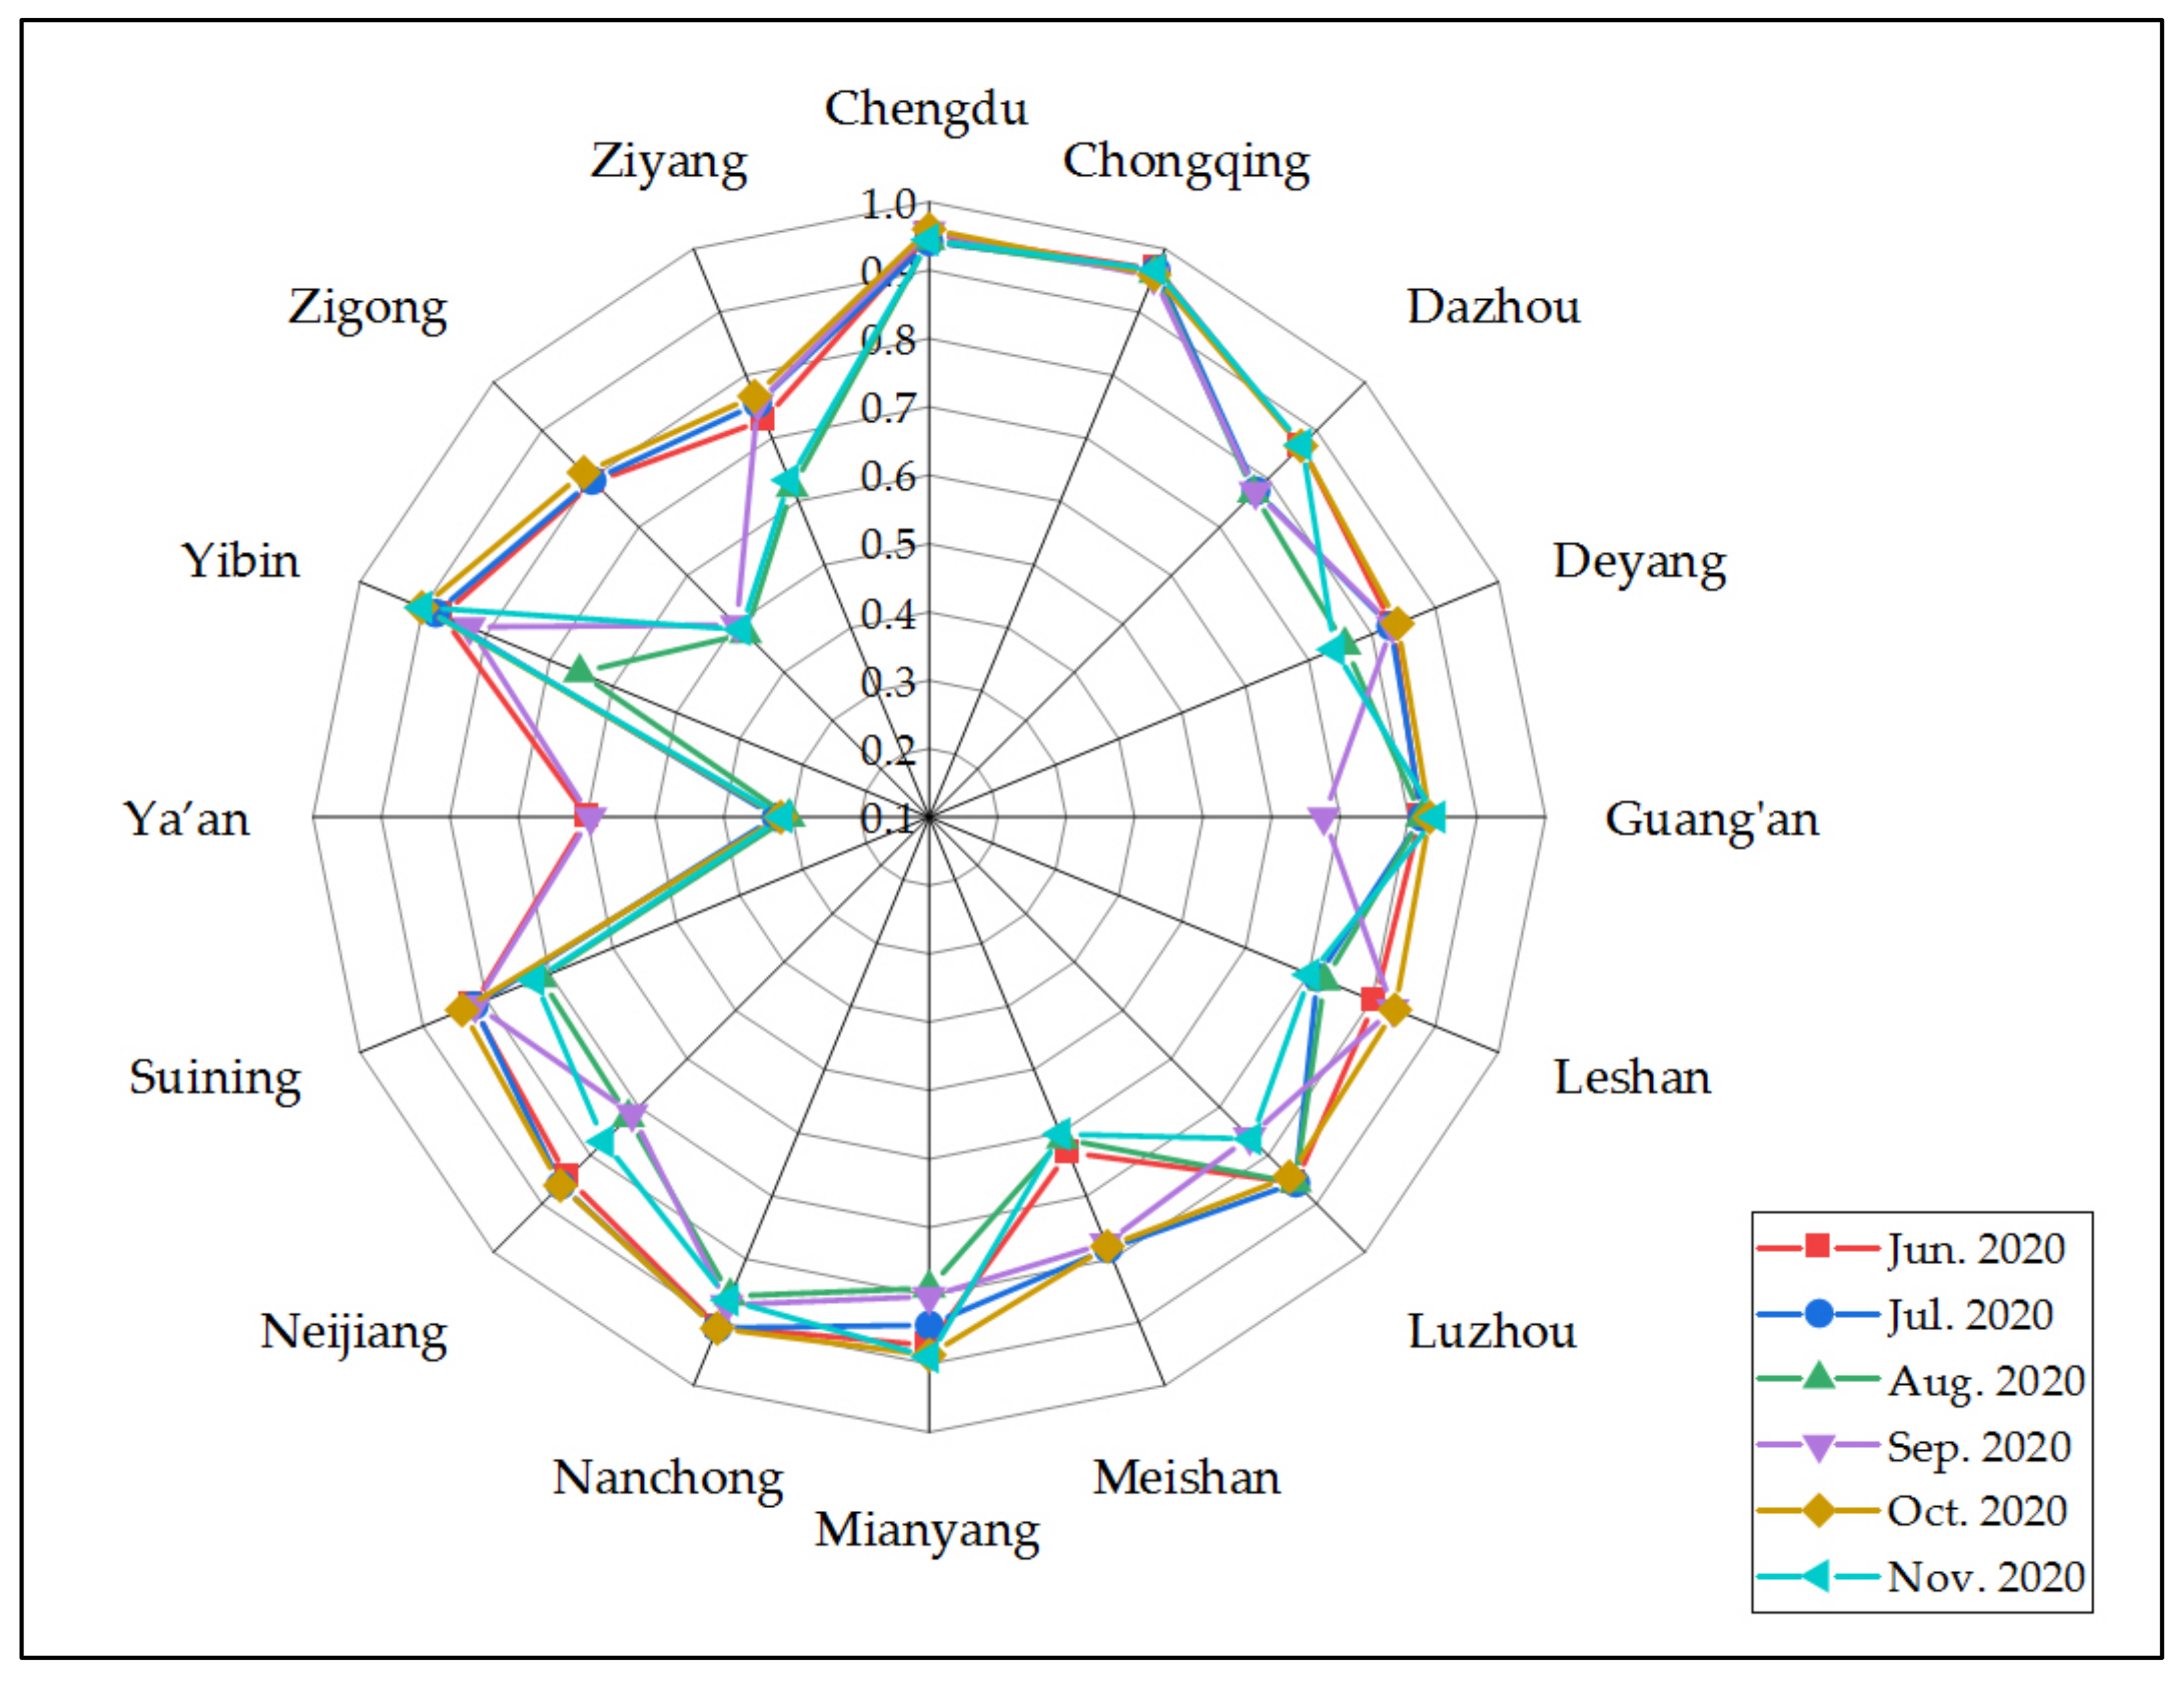
4.2. Analysis of Forecasted Effectiveness of Air Pollution Control
- (1)
- The forecasted air quality still shows an improved trend in general, but the improvement has reached the policy effectiveness ceiling under existing conditions. Using January data which shows the worst air pollution levels for comparison, the forecasted policy effectiveness in January 2020 is still improved compared with that of January 2019, but only Leshan, Mianyang and Yibin’s evaluation scores have improved, while the remaining 13 cities have declined to varying degrees. Therefore, in 2020 and beyond, how to maintain and further improve the effectiveness of air pollution control policies will be a major challenge to cities in the Chengdu-Chongqing region. It can be seen from the calculation results since 2015 that the marginal effects of air pollution control policies in the Chengdu-Chongqing region are increasingly prominent, which means the policies have reached the ceiling of producing further effects. To further improve air quality, the cities need to increase the budget, and administrative resources invested, as well as work efficiency. Therefore, this has brought further challenges to the design and implementation of air pollution control policies.
- (2)
- The gap between the forecasted results for different cities is shrinking. Sichuan Province are making and carrying out the unified planning of air pollution control policies and the regional co-management of air pollution between itself and Chongqing. The “Thirteenth Five-Year Plan for Ecological Protection and Ecological Enhancement of Sichuan Province” issued in 2017 has explicitly adopted the guiding philosophy of “Coordinated Planning and Implementation” for pollution control and emphasized putting this guiding idea into practice [92]. It can be seen from the calculation results that before 2016, there were quite large differences in the policy effectiveness of cities in the region, but the gap started to shrink after 2016 and this trend is further reflected and confirmed in the forecasted results for 2020.
5. Conclusions
- (1)
- In terms of historical evaluation, air quality is improving, with distinct characteristics, like seasonal cycles in the air quality are as expected, with winters showing more severe problems related to the additional energy needs for heating.
- (2)
- Based on a year-on-year comparison, there is a trend of improving air quality indicating the effectiveness of control policies across the cities. Among those cities, Ya’an’s lowest air quality evaluation score has improved from 0.3494 in 2015 to 0.4504 in 2019; Zigong’s lowest air quality score has also risen from 0.4160 in 2015 to 0.6429 in 2019. The rest of the cities have also shown improvements of varying degrees, indicating that the cities in this region have achieved significant results in air pollution control and treatment.
- (3)
- Basedon the forecasted results from December 2019 to November 2020, this paper has noticed that although the air quality still shows an improved trend, it appears to have reached the ceiling under existing conditions. Moreover, the gap between the forecasted policy effectiveness for different cities is shrinking, which places higher requirements on the future design and implementation of air pollution control policies in this region.
Author Contributions
Funding
Data Availability Statement
Conflicts of Interest
Appendix A. Air Quality Assessment Score and Forecasted Score of Cities in Chengdu-Chongqing Region

| Jan. 2015 | Feb. 2015 | Mar. 2015 | Apr. 2015 | May 2015 | Jun. 2015 | Jul. 2015 | Aug. 2015 | Sep. 2015 | |
|---|---|---|---|---|---|---|---|---|---|
| Chengdu | 0.8960 | 0.9284 | 0.9335 | 0.9364 | 0.9372 | 0.9479 | 0.9372 | 0.9440 | 0.9552 |
| Chongqing | 0.9586 | 0.9742 | 0.9798 | 0.9795 | 0.9836 | 0.9880 | 0.9822 | 0.9835 | 0.9872 |
| Dazhou | 0.7072 | 0.7964 | 0.8444 | 0.8730 | 0.8608 | 0.8796 | 0.8557 | 0.8568 | 0.8725 |
| Deyang | 0.6247 | 0.7178 | 0.7214 | 0.7186 | 0.7528 | 0.8012 | 0.7562 | 0.7541 | 0.8143 |
| Guang’an | 0.5471 | 0.6488 | 0.7176 | 0.7282 | 0.7435 | 0.7879 | 0.7578 | 0.7618 | 0.7710 |
| Leshan | 0.5606 | 0.6926 | 0.6678 | 0.6777 | 0.7155 | 0.7368 | 0.7403 | 0.7524 | 0.7876 |
| Luzhou | 0.6289 | 0.7166 | 0.7549 | 0.7934 | 0.8013 | 0.8373 | 0.8100 | 0.8332 | 0.8635 |
| Meishan | 0.5432 | 0.6770 | 0.6722 | 0.6977 | 0.7007 | 0.7370 | 0.7080 | 0.7532 | 0.8019 |
| Mianyang | 0.7733 | 0.8250 | 0.8340 | 0.8307 | 0.8339 | 0.8567 | 0.8344 | 0.8550 | 0.8806 |
| Nanchong | 0.7956 | 0.8186 | 0.8631 | 0.8961 | 0.8888 | 0.9073 | 0.8847 | 0.8956 | 0.9039 |
| Neijiang | 0.6109 | 0.6730 | 0.7017 | 0.6945 | 0.7046 | 0.8068 | 0.7826 | 0.7919 | 0.8158 |
| Suining | 0.6309 | 0.6734 | 0.7054 | 0.7428 | 0.7482 | 0.8052 | 0.7772 | 0.8017 | 0.8178 |
| Ya’an | 0.3494 | 0.4485 | 0.4435 | 0.5534 | 0.6168 | 0.6691 | 0.6889 | 0.6493 | 0.6616 |
| Yibin | 0.6615 | 0.7280 | 0.7679 | 0.7970 | 0.8051 | 0.8236 | 0.8155 | 0.8377 | 0.8580 |
| Zigong | 0.4160 | 0.5239 | 0.5828 | 0.6657 | 0.6844 | 0.7278 | 0.7012 | 0.7026 | 0.7286 |
| Ziyang | 0.5594 | 0.5917 | 0.5967 | 0.6873 | 0.7472 | 0.7993 | 0.7703 | 0.7954 | 0.8327 |
| Oct. 2015 | Nov. 2015 | Dec. 2015 | Jan. 2016 | Feb. 2016 | Mar. 2016 | Apr. 2016 | May 2016 | Jun. 2016 | |
|---|---|---|---|---|---|---|---|---|---|
| Chengdu | 0.9360 | 0.9503 | 0.9217 | 0.9357 | 0.9417 | 0.9297 | 0.9434 | 0.9458 | 0.9510 |
| Chongqing | 0.9823 | 0.9835 | 0.9778 | 0.9775 | 0.9797 | 0.9793 | 0.9853 | 0.9831 | 0.9845 |
| Dazhou | 0.8553 | 0.8563 | 0.8258 | 0.7944 | 0.8022 | 0.8185 | 0.8549 | 0.8628 | 0.8748 |
| Deyang | 0.7542 | 0.8099 | 0.6842 | 0.6791 | 0.7209 | 0.7144 | 0.7603 | 0.7908 | 0.7596 |
| Guang’an | 0.7453 | 0.7562 | 0.7050 | 0.6689 | 0.6722 | 0.6975 | 0.7363 | 0.7512 | 0.7804 |
| Leshan | 0.6940 | 0.7362 | 0.6799 | 0.6822 | 0.6859 | 0.6469 | 0.7162 | 0.7368 | 0.7780 |
| Luzhou | 0.8094 | 0.8275 | 0.8015 | 0.7910 | 0.7718 | 0.7580 | 0.8346 | 0.8069 | 0.8305 |
| Meishan | 0.6989 | 0.7603 | 0.6603 | 0.6566 | 0.7008 | 0.6435 | 0.7304 | 0.7248 | 0.7622 |
| Mianyang | 0.8417 | 0.8575 | 0.7750 | 0.7650 | 0.7921 | 0.8123 | 0.8438 | 0.8530 | 0.8428 |
| Nanchong | 0.8742 | 0.8935 | 0.8561 | 0.8475 | 0.8510 | 0.8691 | 0.8886 | 0.8850 | 0.9024 |
| Neijiang | 0.7474 | 0.8056 | 0.7407 | 0.7359 | 0.7000 | 0.7347 | 0.8013 | 0.7755 | 0.7895 |
| Suining | 0.7562 | 0.8078 | 0.7472 | 0.7184 | 0.7037 | 0.7286 | 0.7804 | 0.7443 | 0.7924 |
| Ya’an | 0.5244 | 0.4746 | 0.4117 | 0.4045 | 0.4801 | 0.4865 | 0.5566 | 0.5717 | 0.5709 |
| Yibin | 0.7954 | 0.7980 | 0.7596 | 0.7563 | 0.7680 | 0.7648 | 0.8237 | 0.8198 | 0.8590 |
| Zigong | 0.6104 | 0.6556 | 0.5786 | 0.5783 | 0.5820 | 0.6237 | 0.7166 | 0.6633 | 0.7329 |
| Ziyang | 0.7883 | 0.8160 | 0.7496 | 0.6122 | 0.5885 | 0.5992 | 0.6691 | 0.6110 | 0.6630 |
| Jul. 2016 | Aug. 2016 | Sep. 2016 | Oct. 2016 | Nov. 2016 | Dec. 2016 | Jan. 2017 | Feb. 2017 | Mar. 2017 | |
|---|---|---|---|---|---|---|---|---|---|
| Chengdu | 0.9563 | 0.9467 | 0.9540 | 0.9564 | 0.9311 | 0.9104 | 0.9057 | 0.9419 | 0.9542 |
| Chongqing | 0.9848 | 0.9843 | 0.9797 | 0.9882 | 0.9827 | 0.9772 | 0.9740 | 0.9815 | 0.9841 |
| Dazhou | 0.8951 | 0.8789 | 0.8422 | 0.8824 | 0.8464 | 0.7634 | 0.7872 | 0.8334 | 0.8615 |
| Deyang | 0.7942 | 0.7983 | 0.8073 | 0.8289 | 0.7291 | 0.6358 | 0.6339 | 0.7180 | 0.7782 |
| Guang’an | 0.7912 | 0.7813 | 0.7548 | 0.7765 | 0.7222 | 0.6462 | 0.6392 | 0.7081 | 0.7336 |
| Leshan | 0.7843 | 0.7540 | 0.7697 | 0.7519 | 0.6547 | 0.6102 | 0.5562 | 0.6563 | 0.7132 |
| Luzhou | 0.8430 | 0.8115 | 0.8014 | 0.8178 | 0.7787 | 0.7421 | 0.7017 | 0.7693 | 0.7892 |
| Meishan | 0.7927 | 0.7573 | 0.7589 | 0.7627 | 0.6688 | 0.6036 | 0.5521 | 0.6631 | 0.7066 |
| Mianyang | 0.8730 | 0.8759 | 0.8635 | 0.8788 | 0.8024 | 0.7491 | 0.7468 | 0.8027 | 0.8455 |
| Nanchong | 0.9135 | 0.9042 | 0.8878 | 0.9006 | 0.8778 | 0.8449 | 0.8377 | 0.8717 | 0.8851 |
| Neijiang | 0.8138 | 0.8037 | 0.8009 | 0.8050 | 0.7447 | 0.6857 | 0.6456 | 0.7416 | 0.7815 |
| Suining | 0.8087 | 0.7757 | 0.7564 | 0.8039 | 0.7558 | 0.7183 | 0.6712 | 0.7268 | 0.7930 |
| Ya’an | 0.5731 | 0.5561 | 0.5542 | 0.4785 | 0.3328 | 0.2562 | 0.2247 | 0.3515 | 0.4793 |
| Yibin | 0.8655 | 0.8506 | 0.8393 | 0.8208 | 0.7501 | 0.7188 | 0.6837 | 0.7503 | 0.7943 |
| Zigong | 0.7406 | 0.7010 | 0.7121 | 0.6561 | 0.5318 | 0.5000 | 0.4499 | 0.5829 | 0.6642 |
| Ziyang | 0.7122 | 0.7322 | 0.7443 | 0.7463 | 0.6848 | 0.6205 | 0.5684 | 0.6535 | 0.7191 |
| Apr. 2017 | May 2017 | Jun. 2017 | Jul. 2017 | Aug. 2017 | Sep. 2017 | Oct. 2017 | Nov. 2017 | |
|---|---|---|---|---|---|---|---|---|
| Chengdu | 0.9557 | 0.9527 | 0.9565 | 0.9543 | 0.9647 | 0.9656 | 0.9681 | 0.9512 |
| Chongqing | 0.9858 | 0.9838 | 0.9852 | 0.9833 | 0.9836 | 0.9907 | 0.9927 | 0.9827 |
| Dazhou | 0.8706 | 0.8647 | 0.8731 | 0.8905 | 0.8929 | 0.8993 | 0.8835 | 0.8478 |
| Deyang | 0.7763 | 0.7577 | 0.7753 | 0.8044 | 0.8443 | 0.8378 | 0.8445 | 0.7593 |
| Guang’an | 0.7552 | 0.7600 | 0.7813 | 0.7929 | 0.8082 | 0.8270 | 0.8293 | 0.7701 |
| Leshan | 0.7460 | 0.7321 | 0.7761 | 0.7795 | 0.8313 | 0.8154 | 0.8098 | 0.7441 |
| Luzhou | 0.8242 | 0.8064 | 0.8487 | 0.8516 | 0.8650 | 0.8682 | 0.8774 | 0.7936 |
| Meishan | 0.7252 | 0.7195 | 0.7512 | 0.7685 | 0.8143 | 0.8160 | 0.8061 | 0.7266 |
| Mianyang | 0.8520 | 0.8451 | 0.8560 | 0.8795 | 0.8982 | 0.8864 | 0.9018 | 0.8421 |
| Nanchong | 0.8972 | 0.8770 | 0.8950 | 0.8956 | 0.9060 | 0.9063 | 0.9158 | 0.8827 |
| Neijiang | 0.8178 | 0.7647 | 0.8310 | 0.8261 | 0.8531 | 0.8663 | 0.8812 | 0.7930 |
| Suining | 0.7923 | 0.7512 | 0.8101 | 0.7971 | 0.8171 | 0.8394 | 0.8659 | 0.7901 |
| Ya’an | 0.5345 | 0.5384 | 0.6051 | 0.5825 | 0.5960 | 0.5883 | 0.6277 | 0.4688 |
| Yibin | 0.8072 | 0.7978 | 0.8322 | 0.8306 | 0.8491 | 0.8403 | 0.8470 | 0.7567 |
| Zigong | 0.7188 | 0.6882 | 0.7494 | 0.7399 | 0.7618 | 0.7515 | 0.7650 | 0.6024 |
| Ziyang | 0.7326 | 0.7205 | 0.7692 | 0.7630 | 0.7840 | 0.7948 | 0.8140 | 0.7199 |
| Dec. 2017 | Jan. 2018 | Feb. 2018 | Mar. 2018 | Apr. 2018 | May 2018 | Jun. 2018 | Jul. 2018 | |
|---|---|---|---|---|---|---|---|---|
| Chengdu | 0.9297 | 0.9417 | 0.9485 | 0.9474 | 0.9514 | 0.9553 | 0.9647 | 0.9660 |
| Chongqing | 0.9749 | 0.9825 | 0.9836 | 0.9872 | 0.9864 | 0.9860 | 0.9858 | 0.9856 |
| Dazhou | 0.7552 | 0.7991 | 0.8082 | 0.8431 | 0.8685 | 0.8783 | 0.8792 | 0.8839 |
| Deyang | 0.6462 | 0.7023 | 0.7153 | 0.7436 | 0.7649 | 0.7834 | 0.8237 | 0.8498 |
| Guang’an | 0.6804 | 0.7000 | 0.7046 | 0.7446 | 0.7578 | 0.7642 | 0.7922 | 0.8053 |
| Leshan | 0.6699 | 0.7032 | 0.7252 | 0.7331 | 0.7289 | 0.7520 | 0.7967 | 0.8138 |
| Luzhou | 0.7399 | 0.7729 | 0.7998 | 0.8230 | 0.8334 | 0.8321 | 0.8612 | 0.8589 |
| Meishan | 0.6282 | 0.6512 | 0.6883 | 0.7103 | 0.7325 | 0.7378 | 0.7867 | 0.8144 |
| Mianyang | 0.7544 | 0.7895 | 0.7957 | 0.8185 | 0.8371 | 0.8503 | 0.8777 | 0.8969 |
| Nanchong | 0.8398 | 0.8496 | 0.8535 | 0.8760 | 0.8835 | 0.8864 | 0.9056 | 0.9148 |
| Neijiang | 0.6968 | 0.7352 | 0.7376 | 0.7948 | 0.7937 | 0.8081 | 0.8403 | 0.8580 |
| Suining | 0.6994 | 0.7141 | 0.7245 | 0.7534 | 0.7672 | 0.7711 | 0.8120 | 0.8310 |
| Ya’an | 0.3262 | 0.3394 | 0.3651 | 0.4775 | 0.5273 | 0.5102 | 0.6209 | 0.6464 |
| Yibin | 0.7041 | 0.7282 | 0.7482 | 0.7645 | 0.7869 | 0.7981 | 0.8477 | 0.8602 |
| Zigong | 0.5014 | 0.5436 | 0.5917 | 0.6556 | 0.6687 | 0.7116 | 0.7479 | 0.7701 |
| Ziyang | 0.5950 | 0.6435 | 0.6544 | 0.7021 | 0.7094 | 0.7295 | 0.7705 | 0.7976 |
| Aug. 2018 | Sep. 2018 | Oct. 2018 | Nov. 2018 | Dec. 2018 | Jan. 2019 | Feb. 2019 | Mar. 2019 | |
|---|---|---|---|---|---|---|---|---|
| Chengdu | 0.9585 | 0.9731 | 0.9680 | 0.9623 | 0.9566 | 0.9532 | 0.9665 | 0.9663 |
| Chongqing | 0.9816 | 0.9933 | 0.9923 | 0.9888 | 0.9881 | 0.9804 | 0.9891 | 0.9880 |
| Dazhou | 0.8688 | 0.9028 | 0.8803 | 0.8886 | 0.8176 | 0.7901 | 0.8624 | 0.8581 |
| Deyang | 0.8054 | 0.8635 | 0.8321 | 0.7976 | 0.7670 | 0.7261 | 0.7886 | 0.7950 |
| Guang’an | 0.7729 | 0.8351 | 0.8186 | 0.7993 | 0.7630 | 0.7140 | 0.7613 | 0.7927 |
| Leshan | 0.7856 | 0.8229 | 0.7963 | 0.7838 | 0.7506 | 0.6753 | 0.7580 | 0.7762 |
| Luzhou | 0.8564 | 0.8926 | 0.8850 | 0.8411 | 0.8394 | 0.7789 | 0.8382 | 0.8354 |
| Meishan | 0.7718 | 0.8440 | 0.8188 | 0.7816 | 0.7484 | 0.6737 | 0.7563 | 0.7618 |
| Mianyang | 0.8765 | 0.9088 | 0.8839 | 0.8615 | 0.8395 | 0.8171 | 0.8627 | 0.8649 |
| Nanchong | 0.9025 | 0.9262 | 0.9122 | 0.9062 | 0.8796 | 0.8543 | 0.8882 | 0.9084 |
| Neijiang | 0.8246 | 0.8888 | 0.8562 | 0.8256 | 0.7975 | 0.7481 | 0.7867 | 0.8207 |
| Suining | 0.7914 | 0.8605 | 0.8335 | 0.8194 | 0.7913 | 0.7447 | 0.7934 | 0.8185 |
| Ya’an | 0.5895 | 0.6702 | 0.6840 | 0.5369 | 0.4623 | 0.4504 | 0.6084 | 0.6405 |
| Yibin | 0.8508 | 0.8786 | 0.8585 | 0.8202 | 0.8150 | 0.7516 | 0.8194 | 0.8186 |
| Zigong | 0.7493 | 0.8153 | 0.7981 | 0.7192 | 0.7117 | 0.6429 | 0.7240 | 0.7635 |
| Ziyang | 0.7287 | 0.8309 | 0.7939 | 0.7370 | 0.6798 | 0.5794 | 0.6746 | 0.7184 |
| Apr. 2019 | May 2019 | Jun. 2019 | Jul. 2019 | Aug. 2019 | Sep. 2019 | Oct. 2019 | Nov. 2019 | |
|---|---|---|---|---|---|---|---|---|
| Chengdu | 0.9631 | 0.9684 | 0.9720 | 0.9729 | 0.9646 | 0.9741 | 0.9758 | 0.9700 |
| Chongqing | 0.9877 | 0.9896 | 0.9902 | 0.9873 | 0.9828 | 0.9877 | 0.9938 | 0.9922 |
| Dazhou | 0.8719 | 0.8684 | 0.8820 | 0.8909 | 0.8737 | 0.8772 | 0.9057 | 0.8779 |
| Deyang | 0.8057 | 0.8296 | 0.8517 | 0.8453 | 0.8216 | 0.8447 | 0.8519 | 0.8128 |
| Guang’an | 0.7991 | 0.8097 | 0.8495 | 0.8555 | 0.8231 | 0.8481 | 0.8818 | 0.8387 |
| Leshan | 0.7791 | 0.8110 | 0.8300 | 0.8497 | 0.8113 | 0.8249 | 0.8281 | 0.8170 |
| Luzhou | 0.8458 | 0.8759 | 0.8757 | 0.8771 | 0.8345 | 0.8626 | 0.8766 | 0.8611 |
| Meishan | 0.7460 | 0.7857 | 0.7938 | 0.8136 | 0.7770 | 0.8033 | 0.8078 | 0.7815 |
| Mianyang | 0.8729 | 0.8848 | 0.8953 | 0.8957 | 0.8798 | 0.8975 | 0.9028 | 0.8754 |
| Nanchong | 0.9087 | 0.9069 | 0.9210 | 0.9322 | 0.9128 | 0.9234 | 0.9350 | 0.9118 |
| Neijiang | 0.8338 | 0.8590 | 0.8734 | 0.8843 | 0.8351 | 0.8589 | 0.8847 | 0.8500 |
| Suining | 0.8125 | 0.8198 | 0.8428 | 0.8461 | 0.8086 | 0.8393 | 0.8693 | 0.8293 |
| Ya’an | 0.6385 | 0.6782 | 0.6921 | 0.7002 | 0.6631 | 0.6946 | 0.6905 | 0.6495 |
| Yibin | 0.8209 | 0.8638 | 0.8904 | 0.9065 | 0.8842 | 0.8945 | 0.8993 | 0.8897 |
| Zigong | 0.7569 | 0.7838 | 0.8056 | 0.8236 | 0.7717 | 0.7880 | 0.8122 | 0.7710 |
| Ziyang | 0.7251 | 0.7502 | 0.7796 | 0.7969 | 0.7476 | 0.7806 | 0.7967 | 0.7473 |
| Dec. 2019 | Jan. 2020 | Feb. 2020 | Mar. 2020 | Apr. 2020 | May 2020 | |
|---|---|---|---|---|---|---|
| Chengdu | 0.9331 | 0.9297 | 0.9375 | 0.9499 | 0.9475 | 0.9504 |
| Chongqing | 0.9634 | 0.9631 | 0.9602 | 0.9673 | 0.9647 | 0.9652 |
| Dazhou | 0.8214 | 0.7220 | 0.7424 | 0.8510 | 0.8648 | 0.8591 |
| Deyang | 0.6722 | 0.6637 | 0.6692 | 0.7897 | 0.7957 | 0.8188 |
| Guang’an | 0.8128 | 0.6698 | 0.6602 | 0.7805 | 0.8059 | 0.8048 |
| Leshan | 0.7753 | 0.7298 | 0.6126 | 0.6331 | 0.6507 | 0.7842 |
| Luzhou | 0.7512 | 0.7378 | 0.7303 | 0.8414 | 0.8317 | 0.8268 |
| Meishan | 0.5815 | 0.5552 | 0.5641 | 0.7688 | 0.7493 | 0.7773 |
| Mianyang | 0.8512 | 0.8416 | 0.7599 | 0.7743 | 0.7819 | 0.8673 |
| Nanchong | 0.8310 | 0.8160 | 0.8305 | 0.8949 | 0.8875 | 0.8927 |
| Neijiang | 0.8287 | 0.6989 | 0.6929 | 0.7186 | 0.7962 | 0.8213 |
| Suining | 0.7866 | 0.6607 | 0.7013 | 0.8063 | 0.7044 | 0.7988 |
| Ya’an | 0.6074 | 0.3202 | 0.3106 | 0.5900 | 0.5792 | 0.6006 |
| Yibin | 0.8699 | 0.8218 | 0.6914 | 0.7016 | 0.8374 | 0.8542 |
| Zigong | 0.5055 | 0.5020 | 0.5368 | 0.7781 | 0.7661 | 0.7848 |
| Ziyang | 0.6702 | 0.5105 | 0.5466 | 0.6593 | 0.6777 | 0.7071 |
| Jun. 2020 | Jul. 2020 | Aug. 2020 | Sep. 2020 | Oct. 2020 | Nov. 2020 | |
|---|---|---|---|---|---|---|
| Chengdu | 0.9527 | 0.9416 | 0.9433 | 0.9572 | 0.9600 | 0.9442 |
| Chongqing | 0.9678 | 0.9659 | 0.9609 | 0.9557 | 0.9592 | 0.9664 |
| Dazhou | 0.8684 | 0.7753 | 0.7704 | 0.7737 | 0.8680 | 0.8702 |
| Deyang | 0.8325 | 0.8294 | 0.7569 | 0.8320 | 0.8404 | 0.7412 |
| Guang’an | 0.8177 | 0.8197 | 0.8195 | 0.6765 | 0.8309 | 0.8400 |
| Leshan | 0.8050 | 0.7133 | 0.7249 | 0.8328 | 0.8361 | 0.7020 |
| Luzhou | 0.8566 | 0.8573 | 0.8565 | 0.7616 | 0.8439 | 0.7660 |
| Meishan | 0.6310 | 0.7835 | 0.6098 | 0.7746 | 0.7798 | 0.6019 |
| Mianyang | 0.8726 | 0.8432 | 0.7888 | 0.8016 | 0.8869 | 0.8900 |
| Nanchong | 0.9069 | 0.9088 | 0.8588 | 0.8719 | 0.9096 | 0.8646 |
| Neijiang | 0.8467 | 0.8610 | 0.7209 | 0.7135 | 0.8616 | 0.7716 |
| Suining | 0.8215 | 0.8195 | 0.7144 | 0.8176 | 0.8381 | 0.7230 |
| Ya’an | 0.5988 | 0.3236 | 0.3049 | 0.5943 | 0.3169 | 0.3134 |
| Yibin | 0.8707 | 0.8800 | 0.6527 | 0.8265 | 0.9019 | 0.9008 |
| Zigong | 0.7929 | 0.7963 | 0.4792 | 0.4980 | 0.8126 | 0.4881 |
| Ziyang | 0.7289 | 0.7547 | 0.6220 | 0.7549 | 0.7665 | 0.6335 |
Appendix B. The Calculation of PCA (Principal Component Analysis) and Weights
| Principal Component | Eigenvalue | Variance Contribution Percentage (%) | Cumulative Variance Contribution Percentage (%) |
|---|---|---|---|
| 4.3887 | 73.1442 | 73.1442 | |
| 0.9255 | 15.4256 | 88.5698 | |
| 0.3281 | 5.4679 | 94.0377 | |
| 0.1906 | 3.1771 | 97.2148 | |
| 0.1431 | 2.3843 | 99.5991 | |
| 0.0241 | 0.4009 | 100.0000 |
| PM2.5 | 0.9527 | 0.9416 | 0.9433 | 0.9572 | 0.9600 | 0.9442 |
| PM10 | 0.9678 | 0.9659 | 0.9609 | 0.9557 | 0.9592 | 0.9664 |
| SO2 | 0.5988 | 0.3236 | 0.3049 | 0.5943 | 0.3169 | 0.3134 |
| NO2 | 0.8707 | 0.8800 | 0.6527 | 0.8265 | 0.9019 | 0.9008 |
| O3 | 0.7929 | 0.7963 | 0.4792 | 0.4980 | 0.8126 | 0.4881 |
| CO | 0.7289 | 0.7547 | 0.6220 | 0.7549 | 0.7665 | 0.6335 |
| PM2.5 | PM10 | SO2 | NO2 | O3 | CO | |
|---|---|---|---|---|---|---|
| Weight | 0.1797 | 0.1785 | 0.1634 | 0.1628 | 0.1565 | 0.1591 |
Appendix C. The MATLAB Algorithm for the PCA-TOPSIS Model
| Algorithm A1 PCA-TOPSIS. | |
| 1: | function [T]=PCA_TOPSIS(b) |
| 2: | x=zscore(b); |
| 3: | [coeff,score,latent,tsquare]=pca(x); |
| 4: | y=(100*latent/sum(latent))’; |
| 5: | y_s=y(1); |
| 6: | n=1; |
| 7: | if y_s<85 |
| 8: | n=n+1; |
| 9: | y_s=y(n)+y_s; |
| 10: | end |
| 11: | coeff_abs=abs(coeff(:,1:n)); |
| 12: | for i=1:n |
| 13: | if i==1 |
| 14: | weight=y(1)*coeff_abs(:,1); |
| 15: | else |
| 16: | weight=weight+y(i)*coeff_abs(:,i); |
| 17: | end |
| 18: | end |
| 19: | weight=weight/sum(weight); |
| 20: | [m,n]=size(b); |
| 21: | for i=1:n |
| 22: | s=0; |
| 23: | for j=1:m |
| 24: | s=s+b(j,i)^2; |
| 25: | if j==m |
| 26: | s=sqrt(s); |
| 27: | end |
| 28: | end |
| 29: | b(:,i)= b(:,i)/s; |
| 30: | b(:,i)=b(:,i)*weight(i); |
| 31: | end |
| 32: | v1=max(b); |
| 33: | v2=min(b); |
| 34: | T=zeros(m,1); |
| 35: | for i=1:m |
| 36: | C1=b(i,:)-v1; |
| 37: | S1=norm(C1); |
| 38: | C2=b(i,:)-v2; |
| 39: | S2=norm(C2); |
| 40: | T(i)=S1/(S1+S2); |
| 41: | end |
Appendix D. The MATLAB Algorithm for the LSTM Model
| Algorithm A2 LSTM | |
| 1: | function [dataPred]=LSTM(data,population,P_t,lL,fCL,ME,GT,ILR,LRDP,LRDF) |
| 2: | mu = mean(data); |
| 3: | sig = std(data); |
| 4: | dataStandardized = (data-mu)/sig; |
| 5: | populationStandardized = (population-mean(population))/std(population); |
| 6: | XTrain = zeros(2,length(dataStandardized)-1); |
| 7: | XTrain(1,:) = dataStandardized(1:end-1); |
| 8: | XTrain(2,:) = populationStandardized(2: length(dataStandardized)) |
| 9: | YTrain = dataStandardized(2:end); |
| 10: | layers = [... |
| 11: | sequenceInputLayer(2) |
| 12: | lstmLayer(lL) |
| 13: | fullyConnectedLayer(fCL) |
| 14: | regressionLayer]; |
| 15: | options = trainingOptions(‘adam’, ... |
| 16: | ‘MaxEpochs’,ME, ... |
| 17: | ‘GradientThreshold’,GT, ... |
| 18: | ‘InitialLearnRate’,ILR, ... |
| 19: | ‘LearnRateSchedule’,’piecewise’, ... |
| 20: | ‘LearnRateDropPeriod’,LRDP, ... |
| 21: | ‘LearnRateDropFactor’,LRDF, ... |
| 22: | ‘Verbose’,0, ... |
| 23: | ‘Plots’,’training-progress’); |
| 24: | net = trainNetwork(XTrain,YTrain,layers,options); |
| 25: | net = predictAndUpdateState(net,XTrain); |
| 26: | [net,dataPred]=predictAndUpdateState(net,[YTrain(end);populationStandardized(length(dataStandardized)+1)]); |
| 27: | numTimeStepsPred = P_t; |
| 28: | for i = 2:numTimeStepsPred |
| 29: | [net,dataPred(:,i)]=predictAndUpdateState(net,[dataPred(:,i-1); |
| 30: | populationStandardized(length(dataStandardized)+i)]); |
| 31: | end |
| 32: | dataPred = sig*dataPred + mu; |
Appendix E. The Mean Absolute Percentage Error (MAPE) of LSTM Forecast Model
| City | Mean Absolute Percentage Error (MAPE) |
|---|---|
| Chengdu | 0.1099 |
| Chongqing | 0.1443 |
| Dazhou | 0.1570 |
| Deyang | 0.1634 |
| Guang’an | 0.1670 |
| Leshan | 0.1670 |
| Luzhou | 0.1639 |
| Meishan | 0.1110 |
| Mianyang | 0.1068 |
| Nanchong | 0.1675 |
| Neijiang | 0.1383 |
| Suining | 0.1195 |
| Ya’an | 0.1340 |
| Yibin | 0.1679 |
| Zigong | 0.1089 |
| Ziyang | 0.1560 |
References
- Yang, W.; Yang, Y. Research on Air Pollution Control in China: From the Perspective of Quadrilateral Evolutionary Games. Sustainability 2020, 12, 1756. [Google Scholar] [CrossRef] [Green Version]
- Li, L.; Yang, W. Total Factor Efficiency Study on China’s Industrial Coal Input and Wastewater Control with Dual Target Variables. Sustainability 2018, 10, 2121. [Google Scholar] [CrossRef] [Green Version]
- Yang, W.; Li, L. Energy Efficiency, Ownership Structure, and Sustainable Development: Evidence from China. Sustainability 2017, 9, 912. [Google Scholar] [CrossRef] [Green Version]
- Peng, Y.; Cui, J.; Cao, Y.; Du, Y.; Chan, A.; Yang, F.; Yang, H. Impact of Manufacturing Transfer on SO2 Emissions in Jiangsu Province, China. Atmosphere 2016, 7, 69. [Google Scholar] [CrossRef] [Green Version]
- Gao, H.; Yang, W.; Yang, Y.; Yuan, G. Analysis of the Air Quality and the Effect of Governance Policies in China’s Pearl River Delta, 2015–2018. Atmosphere 2019, 10, 412. [Google Scholar] [CrossRef] [Green Version]
- Huang, Z.; Yu, Q.; Liu, Y.; Ma, W.; Chen, L. Optimal Design of Air Quality Monitoring Network for Pollution Detection and Source Identification in Industrial Parks. Atmosphere 2019, 10, 318. [Google Scholar] [CrossRef] [Green Version]
- Yang, W.; Yuan, G.; Han, J. Is China’s air pollution control policy effective? Evidence from Yangtze River Delta cities. J. Clean. Prod. 2019, 220, 110–133. [Google Scholar] [CrossRef]
- Yuan, G.; Yang, W. Evaluating China’s Air Pollution Control Policy with Extended AQI Indicator System: Example of the Beijing-Tianjin-Hebei Region. Sustainability 2019, 11, 939. [Google Scholar] [CrossRef] [Green Version]
- Yang, Y.; Yang, W. Does Whistleblowing Work for Air Pollution Control in China? A Study Based on Three-party Evolutionary Game Model under Incomplete Information. Sustainability 2019, 11, 324. [Google Scholar] [CrossRef] [Green Version]
- Zhao, A.; Li, Z.; Zhang, Y.; Zhang, Y.; Li, D. Merging MODIS and Ground-Based Fine Mode Fraction of Aerosols Based on the Geostatistical Data Fusion Method. Atmosphere 2017, 8, 117. [Google Scholar] [CrossRef] [Green Version]
- Zhang, D.; Pan, S.L.; Yu, J.; Liu, W. Orchestrating big data analytics capability for sustainability: A study of air pollution management in China. Inf. Manag. 2019, 103231. [Google Scholar] [CrossRef]
- Yuan, G.; Yang, W. Study on optimization of economic dispatching of electric power system based on Hybrid Intelligent Algorithms (PSO and AFSA). Energy 2019, 183, 926–935. [Google Scholar] [CrossRef]
- Li, Y.; Yang, W.; Shen, X.; Yuan, G.; Wang, J. Water Environment Management and Performance Evaluation in Central China: A Research Based on Comprehensive Evaluation System. Water 2019, 11, 2472. [Google Scholar] [CrossRef] [Green Version]
- Feng, Y.; Ning, M.; Lei, Y.; Sun, Y.; Liu, W.; Wang, J. Defending blue sky in China: Effectiveness of the “Air Pollution Prevention and Control Action Plan” on air quality improvements from 2013 to 2017. J. Environ. Manage. 2019, 252, 109603. [Google Scholar] [CrossRef] [PubMed]
- Central Committee of the Communist Party of China. Constitution of the Communist Party of China; China Legal System Publishing House: Beijing, China, 2018. [Google Scholar]
- The National People’s Congress of the People’s Republic of China. Constitution of the People’s Republic of China. Available online: http://www.gov.cn/guoqing/2018-03/22/content_5276318.htm (accessed on 25 April 2020).
- Yan, L.; Duarte, F.; Wang, D.; Zheng, S.; Ratti, C. Exploring the effect of air pollution on social activity in China using geotagged social media check-in data. Cities 2019, 91, 116–125. [Google Scholar] [CrossRef]
- Dong, R.; Fisman, R.; Wang, Y.; Xu, N. Air pollution, affect, and forecasting bias: Evidence from Chinese financial analysts. J. Financ. Econ. 2019. [Google Scholar] [CrossRef]
- Dewan, N.; Wang, Y.; Zhang, Y.; Zhang, Y.; He, L.; Huang, X.; Majestic, B.J. Effect of Pollution Controls on Atmospheric PM2.5 Composition during Universiade in Shenzhen, China. Atmosphere 2016, 7, 57. [Google Scholar] [CrossRef] [Green Version]
- Yang, W.; Li, L. Efficiency Evaluation and Policy Analysis of Industrial Wastewater Control in China. Energies 2017, 10, 1201. [Google Scholar] [CrossRef]
- Li, N.; Zhang, X.; Shi, M.; Hewings, G.J.D. Does China’s air pollution abatement policy matter? An assessment of the Beijing-Tianjin-Hebei region based on a multi-regional CGE model. Energy Policy 2019, 127, 213–227. [Google Scholar] [CrossRef]
- Xiao, C.; Chang, M.; Guo, P.; Gu, M.; Li, Y. Analysis of air quality characteristics of Beijing–Tianjin–Hebei and its surrounding air pollution transport channel cities in China. J. Environ. Sci. 2020, 87, 213–227. [Google Scholar] [CrossRef]
- Yun, G.; He, Y.; Jiang, Y.; Dou, P.; Dai, S. PM2.5 Spatiotemporal Evolution and Drivers in the Yangtze River Delta between 2005 and 2015. Atmosphere 2019, 10, 55. [Google Scholar] [CrossRef] [Green Version]
- Bao, M.; Cao, F.; Chang, Y.; Zhang, Y.-L.; Gao, Y.; Liu, X.; Zhang, Y.; Zhang, W.; Tang, T.; Xu, Z.; et al. Characteristics and origins of air pollutants and carbonaceous aerosols during wintertime haze episodes at a rural site in the Yangtze River Delta, China. Atmos. Pollut. Res. 2017, 8, 900–911. [Google Scholar] [CrossRef]
- Wu, Z.; Zhang, Y.; Zhang, L.; Huang, M.; Zhong, L.; Chen, D.; Wang, X. Trends of outdoor air pollution and the impact on premature mortality in the Pearl River Delta region of southern China during 2006–2015. Sci. Total Environ. 2019, 690, 248–260. [Google Scholar] [CrossRef] [PubMed]
- Xie, J.; Liao, Z.; Fang, X.; Xu, X.; Wang, Y.; Zhang, Y.; Liu, J.; Fan, S.; Wang, B. The characteristics of hourly wind field and its impacts on air quality in the Pearl River Delta region during 2013–2017. Atmos. Res. 2019, 227, 112–124. [Google Scholar] [CrossRef]
- Zhou, Y.; Luo, B.; Li, J.; Hao, Y.; Yang, W.; Shi, F.; Chen, Y.; Simayi, M.; Xie, S. Characteristics of six criteria air pollutants before, during, and after a severe air pollution episode caused by biomass burning in the southern Sichuan Basin, China. Atmos. Environ. 2019, 215, 116840. [Google Scholar] [CrossRef]
- Mavrakou, T.; Philippopoulos, K.; Deligiorgi, D. The impact of sea breeze under different synoptic patterns on air pollution within Athens basin. Sci. Total Environ. 2012, 433, 31–43. [Google Scholar] [CrossRef]
- Yang, W.; Li, L. Efficiency evaluation of industrial waste gas control in China: A study based on data envelopment analysis (DEA) model. J. Clean. Prod. 2018, 179, 1–11. [Google Scholar] [CrossRef]
- Zhang, C.Y.; Zhang, A. Climate and air pollution alter incidence of tuberculosis in Beijing, China. Ann. Epidemiol. 2019, 37, 71–76. [Google Scholar] [CrossRef]
- Wang, N.; Mengersen, K.; Tong, S.; Kimlin, M.; Zhou, M.; Wang, L.; Yin, P.; Xu, Z.; Cheng, J.; Zhang, Y.; et al. Short-term association between ambient air pollution and lung cancer mortality. Environ. Res. 2019, 179, 108748. [Google Scholar] [CrossRef]
- Salthammer, T.; Uhde, E.; Schripp, T.; Schieweck, A.; Morawska, L.; Mazaheri, M.; Clifford, S.; He, C.; Buonanno, G.; Querol, X.; et al. Children’s well-being at schools: Impact of climatic conditions and air pollution. Environ. Int. 2016, 94, 196–210. [Google Scholar] [CrossRef] [Green Version]
- Hirel, C.; Berton, L.; Preda, C.; Richard, O.; Lambert, Y.; Pico, F. Air pollution and humidity as triggering factors for stroke. Results of a 12-year analysis in the West Paris area. Rev. Neurol. 2019, 175, 614–618. [Google Scholar] [CrossRef] [PubMed]
- Shen, X.; Yang, W.; Sun, S. Analysis of the Impact of China’s Hierarchical Medical System and Online Appointment Diagnosis System on the Sustainable Development of Public Health: A Case Study of Shanghai. Sustainability 2019, 11, 6564. [Google Scholar] [CrossRef] [Green Version]
- Ning, G. Meteorological Causes of Air Pollution in the Northwest Urban Agglomeration of Sichuan Basin in Winter and Their Numerical Simulation; Lanzhou University: Lanzhou, China, 2018. [Google Scholar]
- National Bureau of Statistics of China. China Statistical Yearbook, 2000–2018; China Statistic Press: Beijing, China, 2019. [Google Scholar]
- Qin, B. City profile: Chengdu. Cities 2015, 43, 18–27. [Google Scholar] [CrossRef]
- Bao, H.X.H.; Li, L.; Lizieri, C. City profile: Chongqing (1997–2017). Cities 2019, 94, 161–171. [Google Scholar] [CrossRef]
- Statistics Bureau of Sichuan Province. Sichuan Statistical Yearbook, 2005–2018; China Statistic Press: Beijing, China, 2019. [Google Scholar]
- Wu, Z.; Zhao, C.; Chen, M. Research on Scientific & Technological Achievements Transformation of Sichuan Provincial State-Owned Enterprises of China. Am. J. Ind. Bus. Manag. 2016, 6, 815. [Google Scholar]
- Wang, Q.; Zhan, L. Assessing the sustainability of the shale gas industry by combining DPSIRM model and RAGA-PP techniques: An empirical analysis of Sichuan and Chongqing, China. Energy 2019, 176, 353–364. [Google Scholar] [CrossRef]
- Yang, W.X.; Li, L.G. Analysis of total factor efficiency of water resource and energy in China: A study based on DEA-SBM model. Sustainability 2017, 9, 1316. [Google Scholar] [CrossRef] [Green Version]
- Chalabi, Z.; Milojevic, A.; Doherty, R.M.; Stevenson, D.S.; MacKenzie, I.A.; Milner, J.; Vieno, M.; Williams, M.; Wilkinson, P. Applying air pollution modelling within a multi-criteria decision analysis framework to evaluate UK air quality policies. Atmos. Environ. 2017, 167, 466–475. [Google Scholar] [CrossRef]
- Wang, Q.; Dai, H.; Wang, H. A Smart MCDM Framework to Evaluate the Impact of Air Pollution on City Sustainability: A Case Study from China. Sustainability 2017, 9, 911. [Google Scholar] [CrossRef] [Green Version]
- Caravaggio, N.; Caravella, S.; Ishizaka, A.; Resce, G. Beyond CO2: A multi-criteria analysis of air pollution in Europe. J. Clean. Prod. 2019, 219, 576–586. [Google Scholar] [CrossRef] [Green Version]
- Chen, K.; Yien, J.; Chiang, C.; Tsai, P.; Tsai, F. Identifying Key Sources of City Air Quality: A Hybrid MCDM Model and Improvement Strategies. Appl. Sci. 2019, 9, 1414. [Google Scholar] [CrossRef] [Green Version]
- Chauvy, R.; Lepore, R.; Fortemps, P.; Weireld, G.D.E. Comparison of multi-criteria decision-analysis methods for selecting carbon dioxide utilization products. Sustain. Prod. Consum. 2020, 24, 194–210. [Google Scholar] [CrossRef]
- Alimissis, A.; Philippopoulos, K.; Tzanis, C.G.; Deligiorgi, D. Spatial estimation of urban air pollution with the use of artificial neural network models. Atmos. Environ. 2018, 191, 205–213. [Google Scholar] [CrossRef]
- Zhao, J.; Deng, F.; Cai, Y.; Chen, J. Long short-term memory—Fully connected (LSTM-FC) neural network for PM2.5 concentration prediction. Chemosphere 2019, 220, 486–492. [Google Scholar] [CrossRef] [PubMed]
- Zhou, Y.; Chang, F.; Chang, L.; Kao, I.; Wang, Y. Explore a deep learning multi-output neural network for regional multi-step-ahead air quality forecasts. J. Clean. Prod. 2019, 209, 134–145. [Google Scholar] [CrossRef]
- Maleki, H.; Sorooshian, A.; Goudarzi, G.; Baboli, Z.; Tahmasebi Birgani, Y.; Rahmati, M. Air pollution prediction by using an artificial neural network model. Clean Technol. Environ. Policy 2019, 21, 1341–1352. [Google Scholar] [CrossRef]
- Fong, I.H.; Li, T.; Fong, S.; Wong, R.K.; Tallón Ballesteros, A.J. Predicting concentration levels of air pollutants by transfer learning and recurrent neural network. Knowl. Based Syst. 2020, 192, 105622. [Google Scholar] [CrossRef]
- Ministry of Environmental Protection of the People’s Republic of China. Ambient Air Quality Standards: GB3095-2012; China Environmental Science Press: Beijing, China, 2012. [Google Scholar]
- Ministry of Environmental Protection of the People’s Republic of China. Technical Regulation on Ambient Air Quality Index (on Trial): HJ 633-2012; China Environmental Science Press: Beijing, China, 2012. [Google Scholar]
- China National Environmental Monitoring Center. Real-time Data on Urban Air Quality in China. Available online: http://www.cnemc.cn/sssj/ (accessed on 25 April 2020).
- Data Center of China’s Ministry of Environmental Protection. National Urban Air Quality Daily, 2015–2019. Available online: http://datacenter.mee.gov.cn/websjzx/dataproduct/resourceproduct/queryDataToReport.vm?id=3&url=/websjzx/report!list.vm?xmlname=1512478367400&ftype=zyml (accessed on 25 April 2020).
- Ecological Environment Department of Sichuan Province. Daily Air Quality Report. Available online: http://sthjt.sc.gov.cn/ (accessed on 25 April 2020).
- Ecological Environment Monitoring Center of Chongqing. Real-time Release of Air Quality in Chongqing. Available online: http://113.204.96.36:3362/template/home.html (accessed on 25 April 2020).
- Tao, A.X.; Chang, B.R.; Li, C.C.; Wang, D.R.; Liu, E.R. Density-sensitive Robust Fuzzy Kernel Principal Component Analysis technique. Neurocomputing 2019, 329, 210–226. [Google Scholar] [CrossRef]
- Berradi, Z.; Lazaar, M. Integration of Principal Component Analysis and Recurrent Neural Network to Forecast the Stock Price of Casablanca Stock Exchange. Procedia Comput. Sci. 2019, 148, 55–61. [Google Scholar] [CrossRef]
- Yang, Y.; Yang, W.; Chen, H.; Li, Y. China’s energy whistleblowing and energy supervision policy: An evolutionary game perspective. Energy 2020, 213, 118774. [Google Scholar] [CrossRef]
- Gajjar, S.; Kulahci, M.; Palazoglu, A. Real-time fault detection and diagnosis using sparse principal component analysis. J. Process Control 2018, 67, 112–128. [Google Scholar] [CrossRef]
- Li, N.; Guo, S.; Wang, Y. Weighted preliminary-summation-based principal component analysis for non-Gaussian processes. Control Eng. Pract. 2019, 87, 122–132. [Google Scholar] [CrossRef]
- Hajek, P.; Froelich, W. Integrating TOPSIS with interval-valued intuitionistic fuzzy cognitive maps for effective group decision making. Inf. Sci. 2019, 485, 394–412. [Google Scholar] [CrossRef]
- Zhang, K.; Zhan, J.; Yao, Y. TOPSIS method based on a fuzzy covering approximation space: An application to biological nano-materials selection. Inf. Sci. 2019, 502, 297–329. [Google Scholar] [CrossRef]
- Sun, G.; Guan, X.; Yi, X.; Zhou, Z. An innovative TOPSIS approach based on hesitant fuzzy correlation coefficient and its applications. Appl. Soft Comput. 2018, 68, 249–267. [Google Scholar] [CrossRef]
- Reddy, B.K.; Delen, D. Predicting hospital readmission for lupus patients: An RNN-LSTM-based deep-learning methodology. Comput. Biol. Med. 2018, 101, 199–209. [Google Scholar] [CrossRef]
- Liu, H.; Liu, J.; Yang, W.; Chen, J.; Zhu, M. Analysis and Prediction of Land Use in Beijing-Tianjin-Hebei Region: A Study Based on the Improved Convolutional Neural Network Model. Sustainability 2020, 12, 3002. [Google Scholar] [CrossRef] [Green Version]
- Peng, Y.; Kondo, N.; Fujiura, T.; Suzuki, T.; Wulandari; Yoshioka, H.; Itoyama, E. Classification of multiple cattle behavior patterns using a recurrent neural network with long short-term memory and inertial measurement units. Comput. Electron. Agric. 2019, 157, 247–253. [Google Scholar] [CrossRef]
- Liu, Y.; Zhang, X.; Huang, F.; Tang, X.; Li, Z. Visual question answering via Attention-based syntactic structure tree-LSTM. Appl. Soft Comput. 2019, 82, 105584. [Google Scholar] [CrossRef]
- Ertam, F. An effective gender recognition approach using voice data via deeper LSTM networks. Appl. Acoust. 2019, 156, 351–358. [Google Scholar] [CrossRef]
- Xie, X.; Liu, G.; Cai, Q.; Wei, P.; Qu, H. Multi-source sequential knowledge regression by using transfer RNN units. Neural Netw. 2019, 119, 151–161. [Google Scholar] [CrossRef] [PubMed]
- Li, P.; Abdel-Aty, M.; Yuan, J. Real-time crash risk prediction on arterials based on LSTM-CNN. Accid. Anal. Prev. 2020, 135, 105371. [Google Scholar] [CrossRef] [PubMed]
- Sichuan Provincial Government. Notice on Printing and Distributing the Implementation Rules of “Sichuan Province Air Pollution Control Plan 2015”. Available online: http://www.sc.gov.cn/10462/10883/11066/2015/4/22/10333390.shtml (accessed on 25 April 2020).
- Sichuan Provincial Government. Notice on Printing and Distributing the Implementation Rules of “Sichuan Province Air Pollution Control Plan 2016”. Available online: http://www.sc.gov.cn/zcwj/xxgk/NewT.aspx?i=20160401095908-612769-00-000 (accessed on 25 April 2020).
- Sichuan Provincial Government. Notice on Printing and Distributing the Implementation Rules of “Sichuan Province Air Pollution Control Plan 2017”. Available online: http://www.sc.gov.cn/zcwj/xxgk/NewT.aspx?i=20170527091543-450025-00-000 (accessed on 25 April 2020).
- Sichuan Provincial Government. Measures in Sichuan Province for Implementing the “Air Pollution Control Law of People’s Republic of China”. Available online: http://www.sc.gov.cn/10462/10771/10795/12400/2018/3/6/10446249.shtml (accessed on 25 April 2020).
- The Fifth Session of the Eighth National People’s Congress of the People’s Republic of China. Decision of the Fifth Session of the Eighth National People’s Congress on Approving the Establishment of Chongqing Municipality. Available online: http://www.npc.gov.cn/wxzl/wxzl/2001-02/06/content_4679.htm (accessed on 25 April 2020).
- Standing Committee of Sichuan Provincial People’s Congress. Implementation Measures of Sichuan Province “The Air Pollution Prevention and Control Law of the People’s Republic of China”. Available online: http://www.npc.gov.cn/zgrdw/npc/zfjc/zfjcelys/2014-10/21/content_1881785.htm (accessed on 15 July 2020).
- The People’s Government of Sichuan Province. Implementation Measures of Sichuan Province “The Air Pollution Prevention and Control Law of the People’s Republic of China” (Revision). Available online: http://www.sc.gov.cn/10462/10771/10795/12400/2018/6/27/10454411.shtml (accessed on 15 July 2020).
- Standing Committee of Chongqing Municipal People’s Congress. Air Pollution Prevention and Control Regulations of Chongqing. Available online: http://www.ccpc.cq.cn/home/index/more/id/212734.html (accessed on 15 July 2020).
- The People’s Government of Sichuan Province. Implementation Opinions on Comprehensively Strengthening Ecological Environment Protection and Resolutely Fighting the Tough Battle of Pollution Prevention and Control. Available online: http://www.sc.gov.cn/10462/10464/10797/2018/11/26/10463649.shtml (accessed on 15 July 2020).
- Ministry of Ecology and Environment of the People’s Republic of China. Notice on Issuing the “Key Points of National Air Pollution Prevention and Control Work in 2019”. Available online: http://www.mee.gov.cn/xxgk2018/xxgk/xxgk05/201903/t20190306_694550.html (accessed on 15 July 2020).
- Chen, Y.; Xie, S.; Luo, B.; Zhai, C. Characteristics and origins of carbonaceous aerosol in the Sichuan Basin, China. Atmos. Environ. 2014, 94, 215–223. [Google Scholar] [CrossRef]
- Chengdu Ecological Environment Bureau. Measures for Public Participation in Environmental Protection. Available online: http://gk.chengdu.gov.cn/govInfoPub/detail.action?id=75826&tn=6 (accessed on 25 April 2020).
- Chengdu Ecological Environment Bureau. Notice on Delimitation of Restricted Zones for Heavy-pollution Fuels. Available online: http://gk.chengdu.gov.cn/govInfoPub/detail.action?id=71854&tn=6 (accessed on 25 April 2020).
- The Leading Group on Air Pollution Control of Chengdu. 2019 Air Pollution Prevention Work Plan of Chengdu. Available online: http://gk.chengdu.gov.cn/govInfoPub/detail.action?id=2491726&tn=2 (accessed on 25 April 2020).
- Chongqing Municipal People’s Government. Jiulongpo District of Chongqing Fights for the “Blue Sky Protection Campaign”. Available online: http://www.cq.gov.cn/zwxx/zwdt/202001/t20200114_4648106.html (accessed on 25 April 2020).
- Chongqing Municipal People’s Government. Chongqing Releases Three-Year Action Plan to Win the “Blue Sky Protection Campaign”. Available online: http://www.cq.gov.cn/zqfz/sthj/202001/t20200114_4634659.html (accessed on 25 April 2020).
- Chengdu Statistics Bureau. 2019 Statistical Bulletin of Chengdu’s National Economic and Social Development. Available online: http://www.cdstats.chengdu.gov.cn/htm/detail_180953.html (accessed on 25 April 2020).
- Chongqing Statistics Bureau. Chongqing Municipal Economic and Social Development Statistical Bulletin. 2019. Available online: http://www.cq.gov.cn/zqfz/gmjj/tjgb/202004/t20200402_6963113.html (accessed on 25 April 2020).
- The People’s Government of Sichuan Province. Thirteenth Five-Year Plan for Ecological Protection and Ecological Enhancement of Sichuan Province. Available online: http://www.sc.gov.cn/zcwj/xxgk/NewT.aspx?i=20170421084123-670731-00-000 (accessed on 25 April 2020).
- Baek, Y.; Kim, H.Y. ModAugNet: A new forecasting framework for stock market index value with an overfitting prevention LSTM module and a prediction LSTM module. Expert Syst. Appl. 2018, 113, 457–480. [Google Scholar] [CrossRef]
- Muzaffar, S.; Afshari, A. Short-term load forecasts using LSTM networks. Energy Procedia 2019, 158, 2922–2927. [Google Scholar] [CrossRef]


| Variable | Definition |
|---|---|
| Monthly Average Value of PM2.5 for Sample (per million population) | |
| Monthly Average Value of PM10 for Sample (per million population) | |
| Monthly Average Value of SO2 for Sample (per million population) | |
| Monthly Average Value of NO2 for Sample (per million population) | |
| Monthly Average Value of O3 for Sample (per million population) | |
| Monthly Average Value of CO for Sample (per million population) |
Publisher’s Note: MDPI stays neutral with regard to jurisdictional claims in published maps and institutional affiliations. |
© 2020 by the authors. Licensee MDPI, Basel, Switzerland. This article is an open access article distributed under the terms and conditions of the Creative Commons Attribution (CC BY) license (http://creativecommons.org/licenses/by/4.0/).
Share and Cite
Gao, H.; Yang, W.; Wang, J.; Zheng, X. Analysis of the Effectiveness of Air Pollution Control Policies Based on Historical Evaluation and Deep Learning Forecast: A Case Study of Chengdu-Chongqing Region in China. Sustainability 2021, 13, 206. https://0-doi-org.brum.beds.ac.uk/10.3390/su13010206
Gao H, Yang W, Wang J, Zheng X. Analysis of the Effectiveness of Air Pollution Control Policies Based on Historical Evaluation and Deep Learning Forecast: A Case Study of Chengdu-Chongqing Region in China. Sustainability. 2021; 13(1):206. https://0-doi-org.brum.beds.ac.uk/10.3390/su13010206
Chicago/Turabian StyleGao, Hao, Weixin Yang, Jiawei Wang, and Xiaoyun Zheng. 2021. "Analysis of the Effectiveness of Air Pollution Control Policies Based on Historical Evaluation and Deep Learning Forecast: A Case Study of Chengdu-Chongqing Region in China" Sustainability 13, no. 1: 206. https://0-doi-org.brum.beds.ac.uk/10.3390/su13010206