Article

Impacts of NO2 Impurities on the Indigenous Microbial Community Structure and Diversity in CO2-Saline-Sandstone Interaction System

1
Key Laboratory of Groundwater Resources and Environment, Ministry of Education, Jilin University, Changchun 130021, China
2
Key Laboratory of Songliao Aquatic Environment, Ministry of Education, Jilin Jianzhu University, Changchun 130118, China
3
Jilin Provincial Key Laboratory of Water Resources and Environment, Jilin University, Changchun 130026, China
4
Tianjin Municipal Engineering Design & Research Institute, Tianjin 300392, China
5
School of Chemistry and Materials Engineering, Huizhou University, Huizhou 516007, China
6
Changchun Monitoring Station of National Urban Water Supply Quality Monitoring Network, Changchun 130000, China
*
Author to whom correspondence should be addressed.
Sustainability 2021, 13(11), 5916; https://0-doi-org.brum.beds.ac.uk/10.3390/su13115916
Submission received: 19 April 2021 / Revised: 20 May 2021 / Accepted: 21 May 2021 / Published: 24 May 2021

Abstract

:
Laboratory experiments (150 days) were performed to analyze the influence of NO2 impurities on indigenous microbial communities and diversity with 16S rRNA sequence at real GCS site (Geological CO2 Sequestration, ordos, China) conditions (pressure: 15 MPa, temperature: 55 °C). The possible impact of metabolic activity on the GCS process was investigated through the BLASTn search. Compared with the pure CO2, results demonstrate that the biomass and biodiversity were lower, due to the lower pH, within 60 days after the co-injection of 0.1% NO2. Subsequently, the pH was quickly buffered through the corrosion of feldspar and clay, and the impact of NO2 had almost no obvious effect on the microbial structure except the abundance of phylum and genus after 90 days. In addition, acid-producing bacteria appeared after 60 days, such as Bacillus, Acinetobacter, and Lactococcus, etc., lower the pH in the solution and accelerate the dissolution of minerals. The Fe (III)-reducing microbes Citrobacter freundii reduce the Fe (III) released from minerals to Fe (II) and induce siderite (FeCO3) biomineralization through biogeochemical processes. Therefore, the co-injection of trace NO2 will not significantly affect the growth of microorganisms on long timescale.

1. Introduction

The burning of fossil fuels has substantially increased the levels of CO2 in the atmosphere from 228 ppm in the preindustrial age to the current level of 415.88 ppm, leading to significant climate changes across the globe [1]. Carbon capture and storage (CCS) technology is regarded as an effective way to reduce CO2 emission. It is mainly to capture and seal CO2 in natural or artificial “containers” to reduce emissions to the atmosphere, such as geological storage, biological storage, marine storage, mineral storage, and so on [2,3]. The International Energy Agency (IEA) pointed out that, with the promotion and construction of CCS projects, the contribution rate to global carbon emission reduction will increase from 3.0% in 2020 to 19.0% in 2050. Among all kinds of CCS projects, geological CO2 storage (GCS) in a deep saline aquifer is regarded as the most potential technology due to its large storage capacity, high safety, and long storage time [4]. Multiple studies have been conducted with a principle focus on the interactions between mineral-CO2-saline [5,6,7,8].
However, CO2 often contains a certain amount of impurity gases due to different sources, capture, and purification technologies (see as Table 1) [9]. Among the variable impurities, N2, CH4, Ar, and CO are non-condensable impurity gases. These impurities below the supercritical point of CO2 can reduce the density of CO2 fluid and the viscosity of fluid, increase the buoyancy of CO2 plume, and accelerate the rising speed of fluid in the reservoir, which is not conducive to the capture of residual gas and the injectability of CO2 [10]. Apart from that, the main active acid gases, such as SO2, H2S, NOx, can affect the pH and redox conditions of the storage environment. Acid gas can promote mineral dissolution and change porosity, thus affecting the CO2 injection ability, and lower pH requires longer acid-base neutralization time to achieve CO2 mineralization and capture [10,11]. Hedayati, et al. [12] found that CO injection of 1.5% SO2 promoted mineral dissolution and formed secondary minerals of sulfate and pyrite under the experimental conditions of 14.5 MPa and 60 °C. Aminu, et al. [11] found that the permeability increased by 5.5% after pure CO2 injection, decreased by 5.5% after CO2-H2S injection, decreased by 6.25% after CO2-SO2 injection, and decreased by 41.6% after CO2-NO2 injection. Therefore, it is of great significance to study the influence of various impurities on the geological storage of carbon dioxide.
On the other hand, in deep saline aquifers, the numerous populations and various metabolic activities make microbes have the potential ability of changing geochemical processes. Studies have revealed the cause and effect relationship between particular bacteria and minerals. δ-Proteobacteria azotobacter accelerates the dissolution of olivine and pyrite [14], and Acinetobacter soli can extract 71.93% of K+ from K-feldspars and decrease the pH level from 7.4 to 0.32 during its fermentation [15]. Shewanella fridgidimarina causes more than a 95% decrease in core permeability in the rock pore space under high pressure conditions (8.9 MPa), with influence of dissolved or supercritical state CO2 resulting from microbials activities [16]. The microbially mediated reduction caused by the Shewanella piezotolerans strain WP3 at 20 MPa triggers a release of iron (Fe) from Fe-containing minerals (smectites) [17]. Moreover, Li, et al. [18] found that indigenous microbial communities accelerated the corrosion of K-feldspar, albite and clay minerals, and induced the carbonates mineralization when pure CO2 was injected, which showed benefits of CO2 mineral trapping.
At present, there are a lot of researches on CO2 or impure gases-saline-sandstone interaction, while the influence of impurity gas on biogeochemistry is rarely reported [19]. In our group’s previous study, published by Zhang, et al. [19], co-injection of SO2 impurities resulted in a decrease in biomass, and shifts in microbial communities, within 90 days and inhibited the carbonates capture. No secondary carbonate (e.g., calcite, siderite) was observed in the experiments. As another common impurity gas in CO2, NO2 impurities could change the pH, redox condition, and water chemistry, which may significantly impact the indigenous microbial community structure and diversity. Conversely, it may have a positive or a negative effect on the mineral corrosion and trapping. However, our knowledge about the cause and effect relationship between NO2 impurities and microorganisms-CO2-saline-sandstone is limited. To address the above issues, it’s important to investigate the impact of NO2 impurity injection on the structure and diversity of indigenous microbial community firstly.
In this study, laboratory experiments (150 days), focusing on the impact of NO2 impurities on the indigenous microorganisms, were conducted. The objectives of this study are: (1) to verify the response of microbial communities to co-injection of NO2; (2) to investigate the possible impact of indigenous microorganisms on the NO2-CO2-saline-sandstone interaction process with 16S rRNA technology. The results of this study can provide foundation for the further investigation of microbial feedback on the GCS process with NO2 impurities injection, enriching the theoretical basis on biogeochemical behavior of impure CO2 aquifer storage.

2. Materials and Methods

2.1. Experimental Materials

2.1.1. Water and Microbial Sample Collection

The water samples were collected from a field observation well which is located at a CO2 injection site reservoir in Erdos, China (~1600 m water depth). Before collection, 2 h evacuation was performed to eliminate the original microbial contamination of the observation well. After that, the collecting bottle with water sample was cleaned for 3 times, then insert the sampling pipe into the bottom of the bottle and inject the water sample slowly. After 100 mL overflow is generated, pull out the sampling pipe, close the bottle cap, seal the bottle mouth with sealing film, and then wrap the bottle cap with adhesive tape. The collected samples were sent to the laboratory for determination of water chemical components, and the test results are shown in Table 2.
Due to the less quantity of microorganisms in the underground environment, the simple collection of field water samples is not conducive to the later test. This time, the microbial sample was concentrated as the method of Li, et al. and Zhang, et al. [18,19]. First, put a total of 10 L extracted water sample into a 5 L sterilized buffer container in batches, and then use a vacuum filtration to filter the water sample by nylon net membranes (0.22 µm). During the whole process of filtration, the color change of the filter membrane and the flow velocity of water in the bottle were observed. When the flow velocity of water decreased significantly, it was proved that a large number of microorganisms in the water sample had been enriched on the filter membrane. At this time, the filter membrane was quickly moved into a 40 mL Agilent bottle, filled with CO2 gas and sealed with a gland, and then continue to use a new filter membrane for filtration until all the 10 L extracted water samples are filtered. Finally, 3 Agilent bottles with 3 filter membranes were put into a portable low-temperature storage box (4 °C) for subsequent microbial information testing and microbial scale-up culture.

2.1.2. Microbial Scale-Up Culture

Although the indigenous microbes had been enriched on the filter membranes, the quantity was still relatively limited, which would not be conducive to experimental observations of their mediating effect if used directly. Therefore, the indigenous microorganisms were expanded and cultivated in the lab prior to experimentation. The indigenous microbes were cultured by inoculating the membranes in the mineral salt medium with 1.0 mL of vitamin stock solution and 1.0 mL of trace element stock solution in 500 mL serum bottles [20]. An anaerobic incubator was used and kept at 55 °C for the desired growth rate (YQX-II, YUEJIN, Shanghai, China). The microbe culture solution was centrifuged and extracted for the next batch reactor experiment. Saline was prepared artificially, according to the chemical analysis data of the reservoir saline, (Table 2) and then used in the stainless steel reactor experiments.

2.1.3. Sandstone Samples

Samples were collected at ~1600 m under a surface level of the Erdos reservoir. Quantitative X-ray diffraction (XRD) and X-ray fluorescence (XRF) analysis determined the samples to be sandstone: 49% quartz; 3% dolomite; 16% chlorite-smectite mixed layer minerals; 5% illite; 23% feldspar, and 4% others. The first group of samples was cut into 10 mm × 10 mm × 1 mm slices, while the second group was crushed evenly for later use in the microbial-mediated CO2-NO2-saline-sandstone reaction experiments.

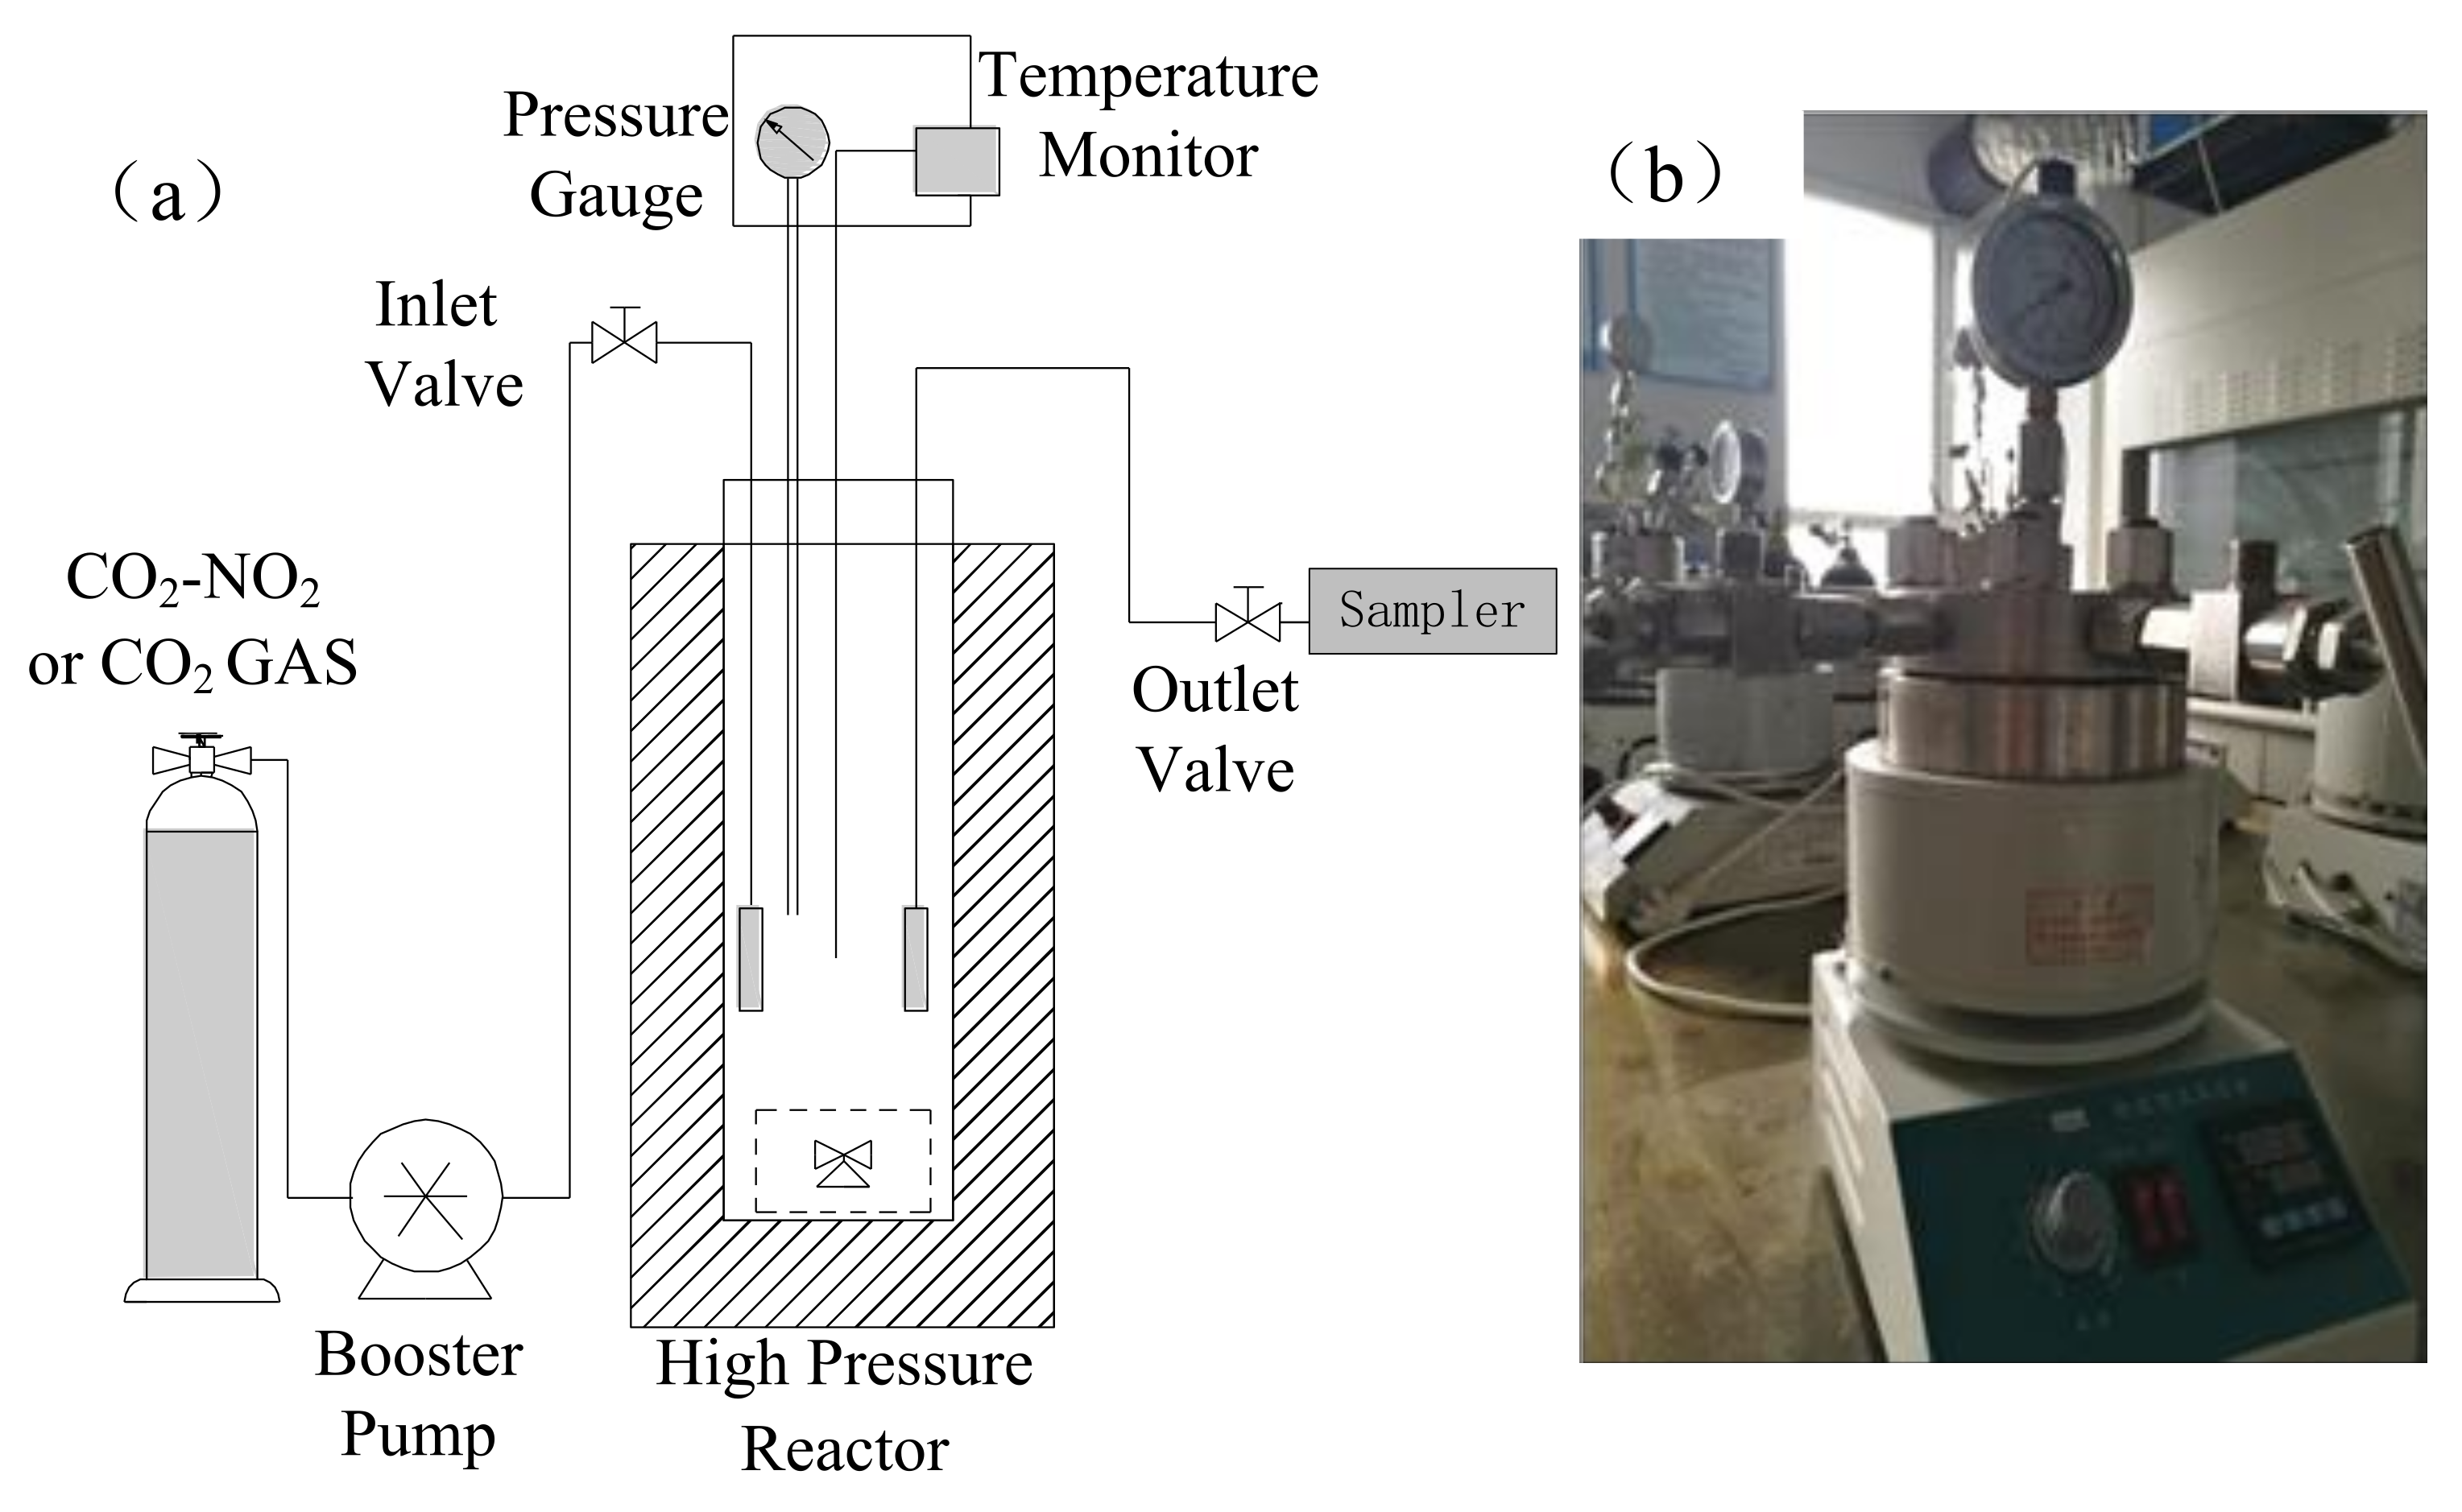
2.2. Experimental Set-Up and Approach

The experimental set-up is fully described as Figure 1. Liquid CO2 (99.99% purity) and the mixture of CO2–NO2 (0.1 voL% NO2), provided by Jvyang Gases Company in China, was injected into 316-grade stainless steel reactors (200 mL volume, design maximum working pressure is 35 MPa, the maximum working temperature is 350 °C) via a booster pump. A sampling pipe (10 mL volume) tailored for the experiment was used to collect water and microbial samples. As the pressure in the reactor is much higher than the atmospheric pressure, the pressure in the reactor can pump the water sample into the connected 10 mL sampler when the outlet valve was opened. During the 150-days experiment, control factors, including temperature and pressure, were monitored by a thermometer and a pressure gauge.
Three groups of experiments were set up: a. microbe-CO2-NO2-saline-sandstone; b. microbe-CO2-saline-sandstone; c. CO2-NO2-saline-sandstone. All experiments were performed in duplicates. Sandstone samples (17 g) were added to the batch reactor, followed by addition of 170 mL of saline solution (as the control) or saline solution containing the enriched indigenous microorganisms, which was obtained by centrifugation in 170 mL culture medium. The conditions of 15 ± 0.5 MPa and 55 °C were maintained for 150 days, with no stirring to simulate the real-life conditions of geologic CO2 sequestration in the reactor. CO2 gases or the mixture of CO2-NO2 were purged into the reactors and remained sealed during the experiment. Following a certain reaction time, 5 mL water sample was taken out by sampler for microbial analyses and the pH of another 5 mL sample was immediately measured by pH meter after sampling at atmospheric pressure. Besides, pH may change dramatically at the beginning of the experiment, so we also set up pH tests at the time interval of 5 days, 15 days, 45 days, and 75 days.

2.3. Microbial Analyses

2.3.1. DNA Extraction

Total community genomic DNA extraction was performed using an E.Z.N.A. Soil DNA Kit (Omega, Norwalk, CT, USA), following the manufacturer’s instructions. The DNA concentration was measured using a Qubit 2.0 (Life, Carlsbad, CA, USA) to ensure adequate amounts of high-quality genomic DNA.

2.3.2. 16S rRNA Gene Amplification and qPCR (Quantitative PCR)

The bacterial 16S rRNA gene of V3–V4 hypervariable region is the target of this study. The polymerase chain reaction (PCR) and qPCR were conducted immediately after DNA extraction. The 16S rRNA V3–V4 amplicon was amplified using KAPA HiFi Hot Start Ready Mix (2×) (TaKaRa Bio Inc., Shiga, Japan). Two universal bacterial 16S rRNA gene amplicon PCR primers: 341F (CCTACGGGNGGCWGCAG) and 805R (GACTACHVGGGTATCTAATCC) were applied in this study. The reaction was set up with 2 µL of microbial DNA (10 ng/µL), 1 µL of amplicon PCR forward primer (10 µM), 1 µL of amplicon PCR reverse primer (10 µM) and 2× 15 µL of KAPA HiFi Hot Start Ready Mix (30 µL total). The PCR progress performed in the sealed plate and in a thermal instrument (Applied Biosystems 9700, Foster City, CA, USA) using the following program: 1 cycle of denaturing at 95 °C for 3 min, five cycles of denaturing at 95 °C for 30 s, annealing at 45 °C for 30 s and elongation at 72 °C for 30 s, then 20 cycles of denaturing at 95 °C for 30 s, annealing at 55 °C for 30 s, elongation at 72 °C for 30 s and a final extension at 72 °C for 5 min. Afterwards the PCR products were checked using electrophoresis in 1% (w/v) agarose gel in tris-boric acid and ethylenediaminetetraacetic acid (TBE) buffer stained with ethidium bromide and visualized under UV light.

2.3.3. 16S Gene Library Construction, Quantification and Sequence Processing

We used AMPure XP beads to purify the free primers and primer dimer species in the amplicon product. Samples were delivered to Sangon BioTech (Shanghai, China) for library construction, quantification, and sequence processing. The data analysis was as in Zhang, et al. [20].

2.3.4. Statistical Analyses

After sequencing, the two short Illumina readings were assembled by PEAR (v 0.9.6) software, according to the overlap, and fastq files were processed to generate individual fasta and qual files, which were then analyzed by standard methods. S quences containing ambiguous bases and any that were longer than 480 base pairs (bp) were dislodged; those with a maximum homopolymer length of 6 bp were allowed [21]. Sequences shorter than 240 bp were removed from analysis [22]. All identical sequences were merged into one. Sequences were then aligned according to a customized reference database. The completeness of the index and the adaptor was checked and all of the index and adaptor sequence was removed. Noise was removed using the precluster tool and chimeras were detected with Chimera UCHIME software; all of the software was in the Mothur package. Sequences with 97% similarity were grouped into operational taxonomic units (OTU’s) on the genus level using Mothur and NCBI Blast [23]. In order to further understand the possible biological functions of indigenous microorganisms, sequences were compared with the database through the BLASTn function in Genbank ((Basic Local Alignment Search Tool for nucleotides, https://blast.ncbi.nlm.nih.gov/Blast.cgi, accessed on 13 February 2017). The Shannon and Simpson index were calculated according to OUT’s as the description by Ju, et al. [24]. The greater the Shannon index, and richer the biodiversity was, smaller the Simpson index, and richer the diversity was. The PCA 3D map was performed in R software (http://www.r-project.org, accessed on 8 January 2017), the UniFrac sample distance heat map was performed using Mothur v.1.30.1 software and pheatmap packages v1.0.7.

3. Results and Discussion

3.1. Microbial Scale-Up Culture

The annotation classification results at the phylum level of the microbiological samples from the actual site are shown in Figure 2. It can be seen that, before expansion, Nitrospirae (50.04%), Firmicutes (35.15%), and Proteobacteria (10.23%) were the dominant bacterial phyla, and after expansion, Nitrospirae (71.05%), Firmicutes (24.66%), and Proteobacteria (4.20%) were the dominant bacterial phyla. This shows that the dominant bacterial phyla before and after the expansion did not change significantly, but their abundances changed.
Table 3 shows the changes in microbial abundance at the genus level as determined using 16S rRNA gene sequencing before and after expansion. The analysis found that Thermodesulfovibrio and Thermoanaerobacter dominated the colonies before and after the expansion culture, but the culture contained various other genera. Comparing before and after the culture expansion, the types of dominant bacteria did not change greatly, but the abundances of the different genera did change, mainly due to differences between the culture environment and the natural environment. In addition, the qPCR analysis showed that the expression of 16S rRNA genes before and after the expansion culture were 2.67 × 10⁵ ± 0.73 × 10⁵ copies/mL and 8.89 × 10⁷ ± 0.80 × 10⁷ copies/mL, respectively. This showed that, while the community structure was not significantly altered by the expansion of cultivation, the total biomass increased by two orders of magnitude. Therefore, the expansion culture of indigenous microorganisms was an effective method for preparing bacterial samples for reactor simulation experiments.

3.2. Effect of NO2 Co—Injection on Biomass

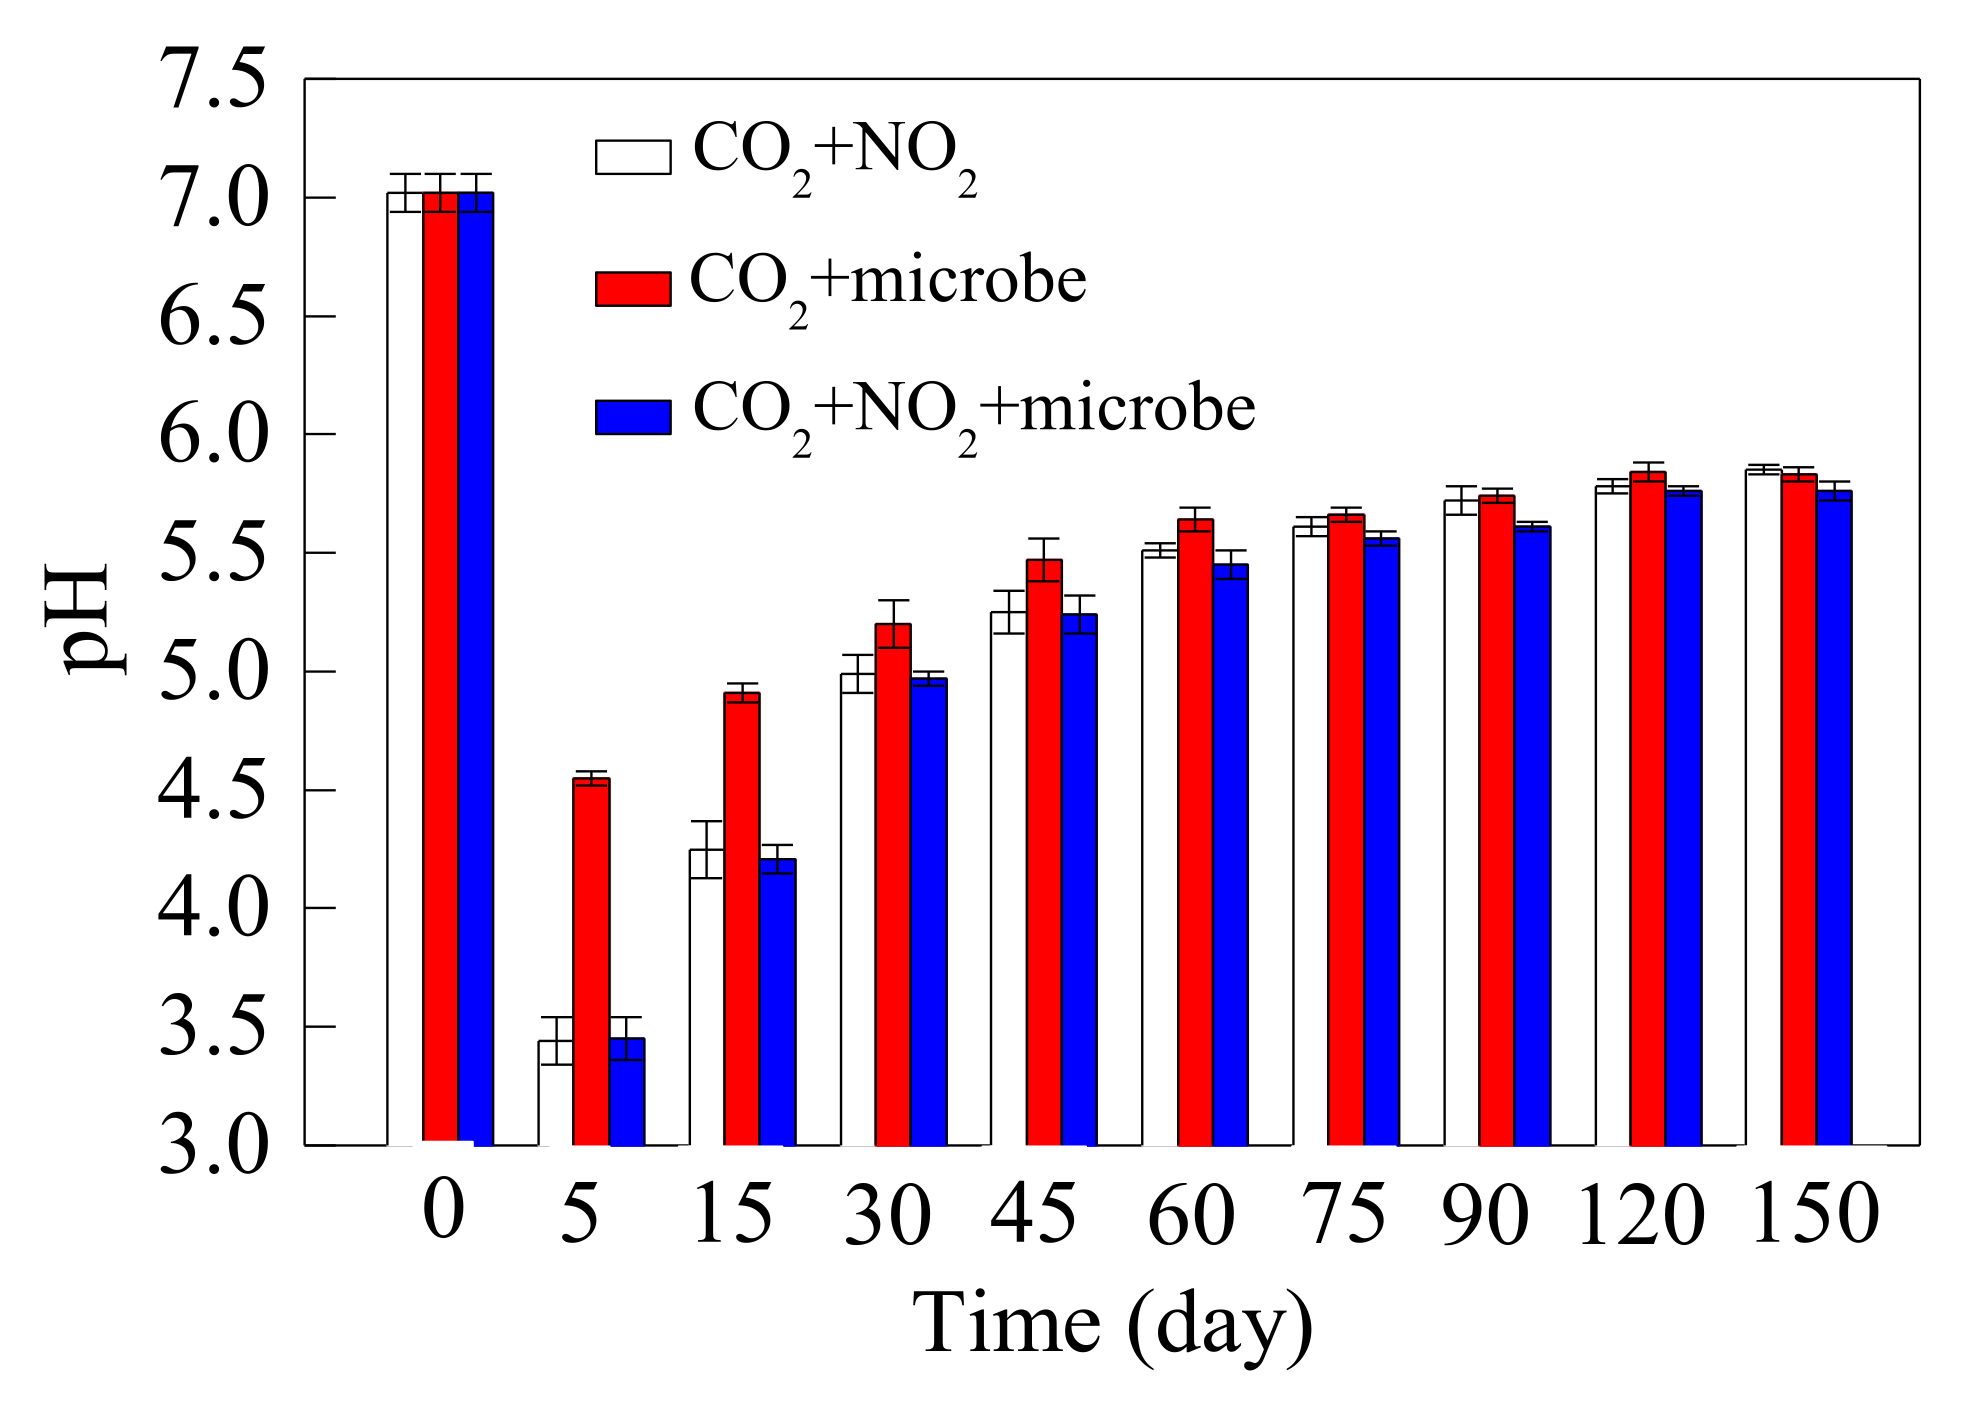
3.2.1. The Change of pH

In the process of geological CO2 storage, pH change is an important factor affecting microorganisms, so this experiment monitored how the pH of the solution changed, the results are shown in Figure 3.
During the whole experiment, pH in all three experimental groups was the lowest (around 3.5) in the initial stage of injection, but increased with mineral dissolution. At days 5, 30, 120, and 150, the pH of the CO2-NO2-microbe group was 3.45, 4.97, 5.76, and 5.76; the pH of the CO2-NO2 group was 3.44, 4.99, 5.78, and 5.85; and the pH of the CO2-microbe group was 4.55, 5.20, 5.84, and 5.83. Therefore, scCO2 was shown to be partially soluble in water and able to hydrolyze to produce H+, which lowered the pH of the solutions. Similarly, the production of HNO3 from NO2 can also reduce the pH. However, the consumption of H+ by dissolved minerals can gradually neutralize the H+.
A comparison of pH among the experimental groups found that the pH values of the CO2-NO2-microbe (4.21) and CO2-NO2 groups (4.25) were significantly lower than the pH of the CO2-microbe group (4.91) during the first 15 days. However, by day 30, the pH differences among the CO2-NO2-microbe (4.97), CO2-NO2 (4.99), and CO2-microbe (5.22) groups were much smaller than at 15 days, and the difference continued to gradually decrease after 45 days. The main reason was that the low pH conditions after NO2 injection accelerated the dissolution of feldspar and clay minerals, which accelerated the neutralization of H+. In addition, the pH of the CO2-NO2-microbe group continued to be lower than that of the CO2-NO2 group from the 15th day, and the pH of the CO2-microbe group (5.83) remained slightly lower than that of the CO2-NO2 group (5.85) even after 150 days, indicating that microbial mediation reduced the environmental pH. Li, et al. [18] also found that Pseudomonas mendocina, Acinetobacter soli, and other acid-producing bacteria mediated the pH of solutions while studying how the biogeochemistry of CO2 storage in the saline aquifer is mediated by indigenous microorganisms.

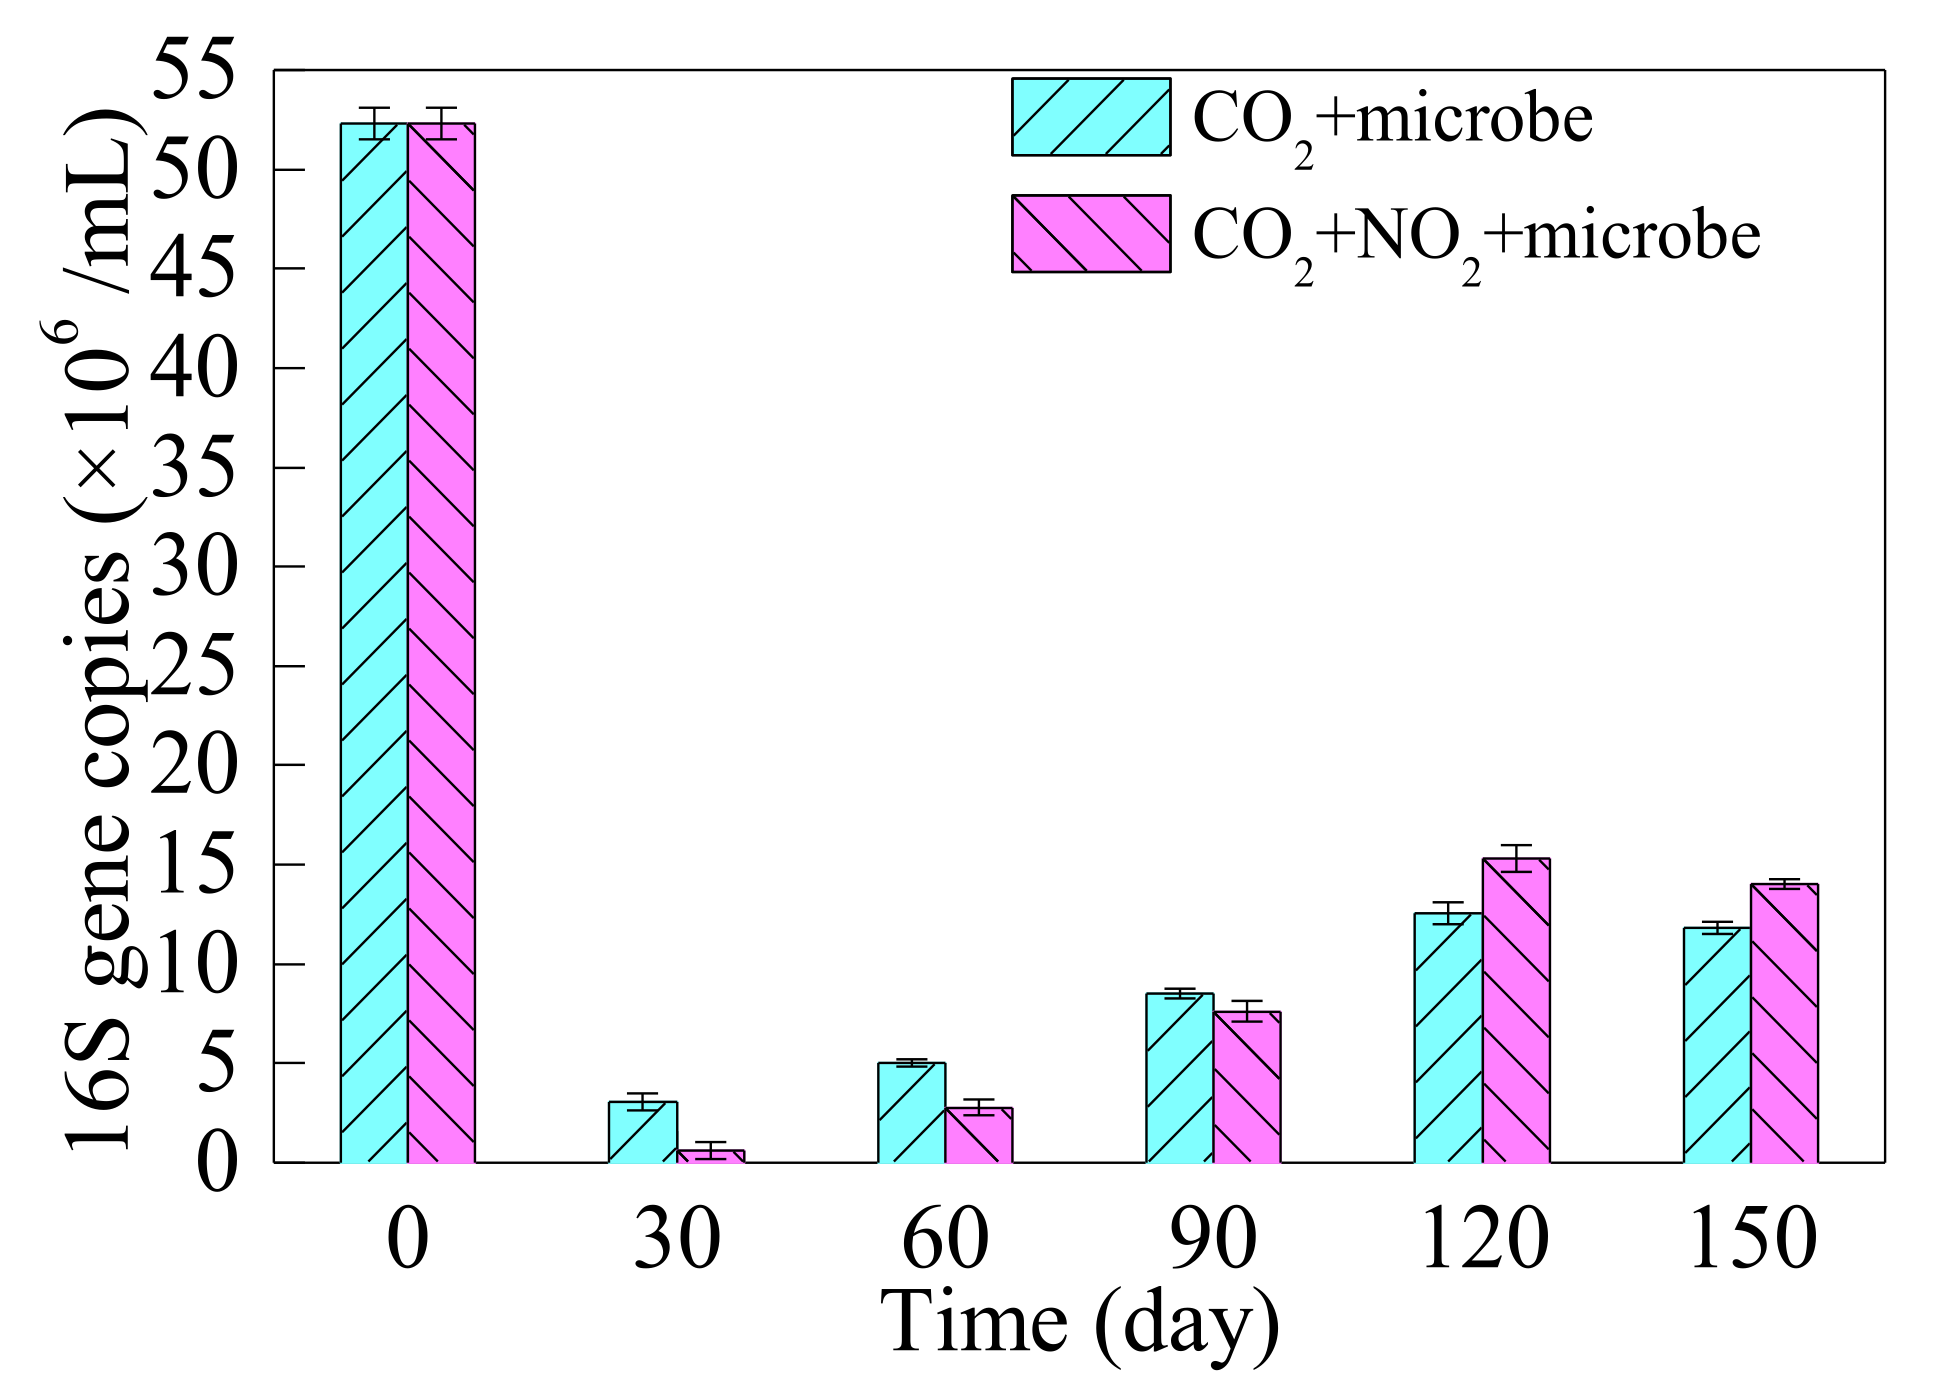
3.2.2. Biomass Change

Increased gene content indicates that the total biomass has increased. The 16S rRNA gene content was assessed using qPCR technology to evaluate the changes in biomass. As shown in Figure 4, the 16S rRNA gene content of the CO2-microbe group decreased from the initial concentration of 5.23 × 10⁷ ± 0.80×10⁷ copies/mL to 3.04 × 10⁶ ± 0.43 × 10⁶ copies/mL during the first 30 days, but then gradually increased to 1.26 × 10⁷ ± 0.56 × 10⁷ copies/mL from day 30 to day 120. At 150 days, it had dropped slightly to 1.18 × 10⁷ ± 0.26 × 10⁷ copies/mL. In the CO2-NO2-microbe group a sharp drop to 0.61 × 10⁶ ± 0.42 × 10⁶ copies/mL was observed at 30 days, but it gradually increased to 1.53 × 10⁷ ± 0.67 × 10⁷ copies/mL by day 120, eventually decreasing slightly to 1.40 × 10⁷ ± 0.26 × 10⁷ copies/mL at day 150.
In the process of geological CO2 storage, the pH value has large effects on microorganisms. Indeed, after CO2-NO2 or pure CO2 was injected, sharp decreases in biomass were observed after 30 days due to the sudden decrease in pH. With NO2 co-injection (i.e., CO2-NO2), because the pH was lower, the biomass was significantly less than the CO2-microbe group after 30 days. With the neutralization of pH by mineral dissolution, the biomass of both groups increased from day 30 to day 120. However, the microbial growth rate (i.e., increase in biomass) of the CO2-NO2-microbe group was greater than that of the CO2-microbe group at this stage, and after 120 days, the biomass in the CO2-NO2-microbe group was greater. This was because the rapid erosion of minerals by NO2 injection reduced the differences in pH between the groups after 90 days. Furthermore, the NO3 that was formed and the increased dissolved Fe3+, due to NO2 injection, were able to act as terminal electron acceptors in biological metabolic activities and promote the growth of microorganisms. Due to their roles in biological metabolism, NO3 and Fe3+ both usually play important roles in biogeochemistry. Li, et al. [18] found that Fe3+ released from clay minerals after CO2 injection promoted the growth of iron-reducing bacteria. Li, et al. [20] found that nitrate and sulfate both promoted the growth of microorganisms in abandoned oil and gas reservoirs. In addition, because a carbon source (sodium acetate) was added during the preparation of the saline, the biomass of the two experimental groups decreased slightly upon exhaustion of the nutrients between 120 and 150 days.

3.3. Effects of NO2 Co—Injection on Community Structure

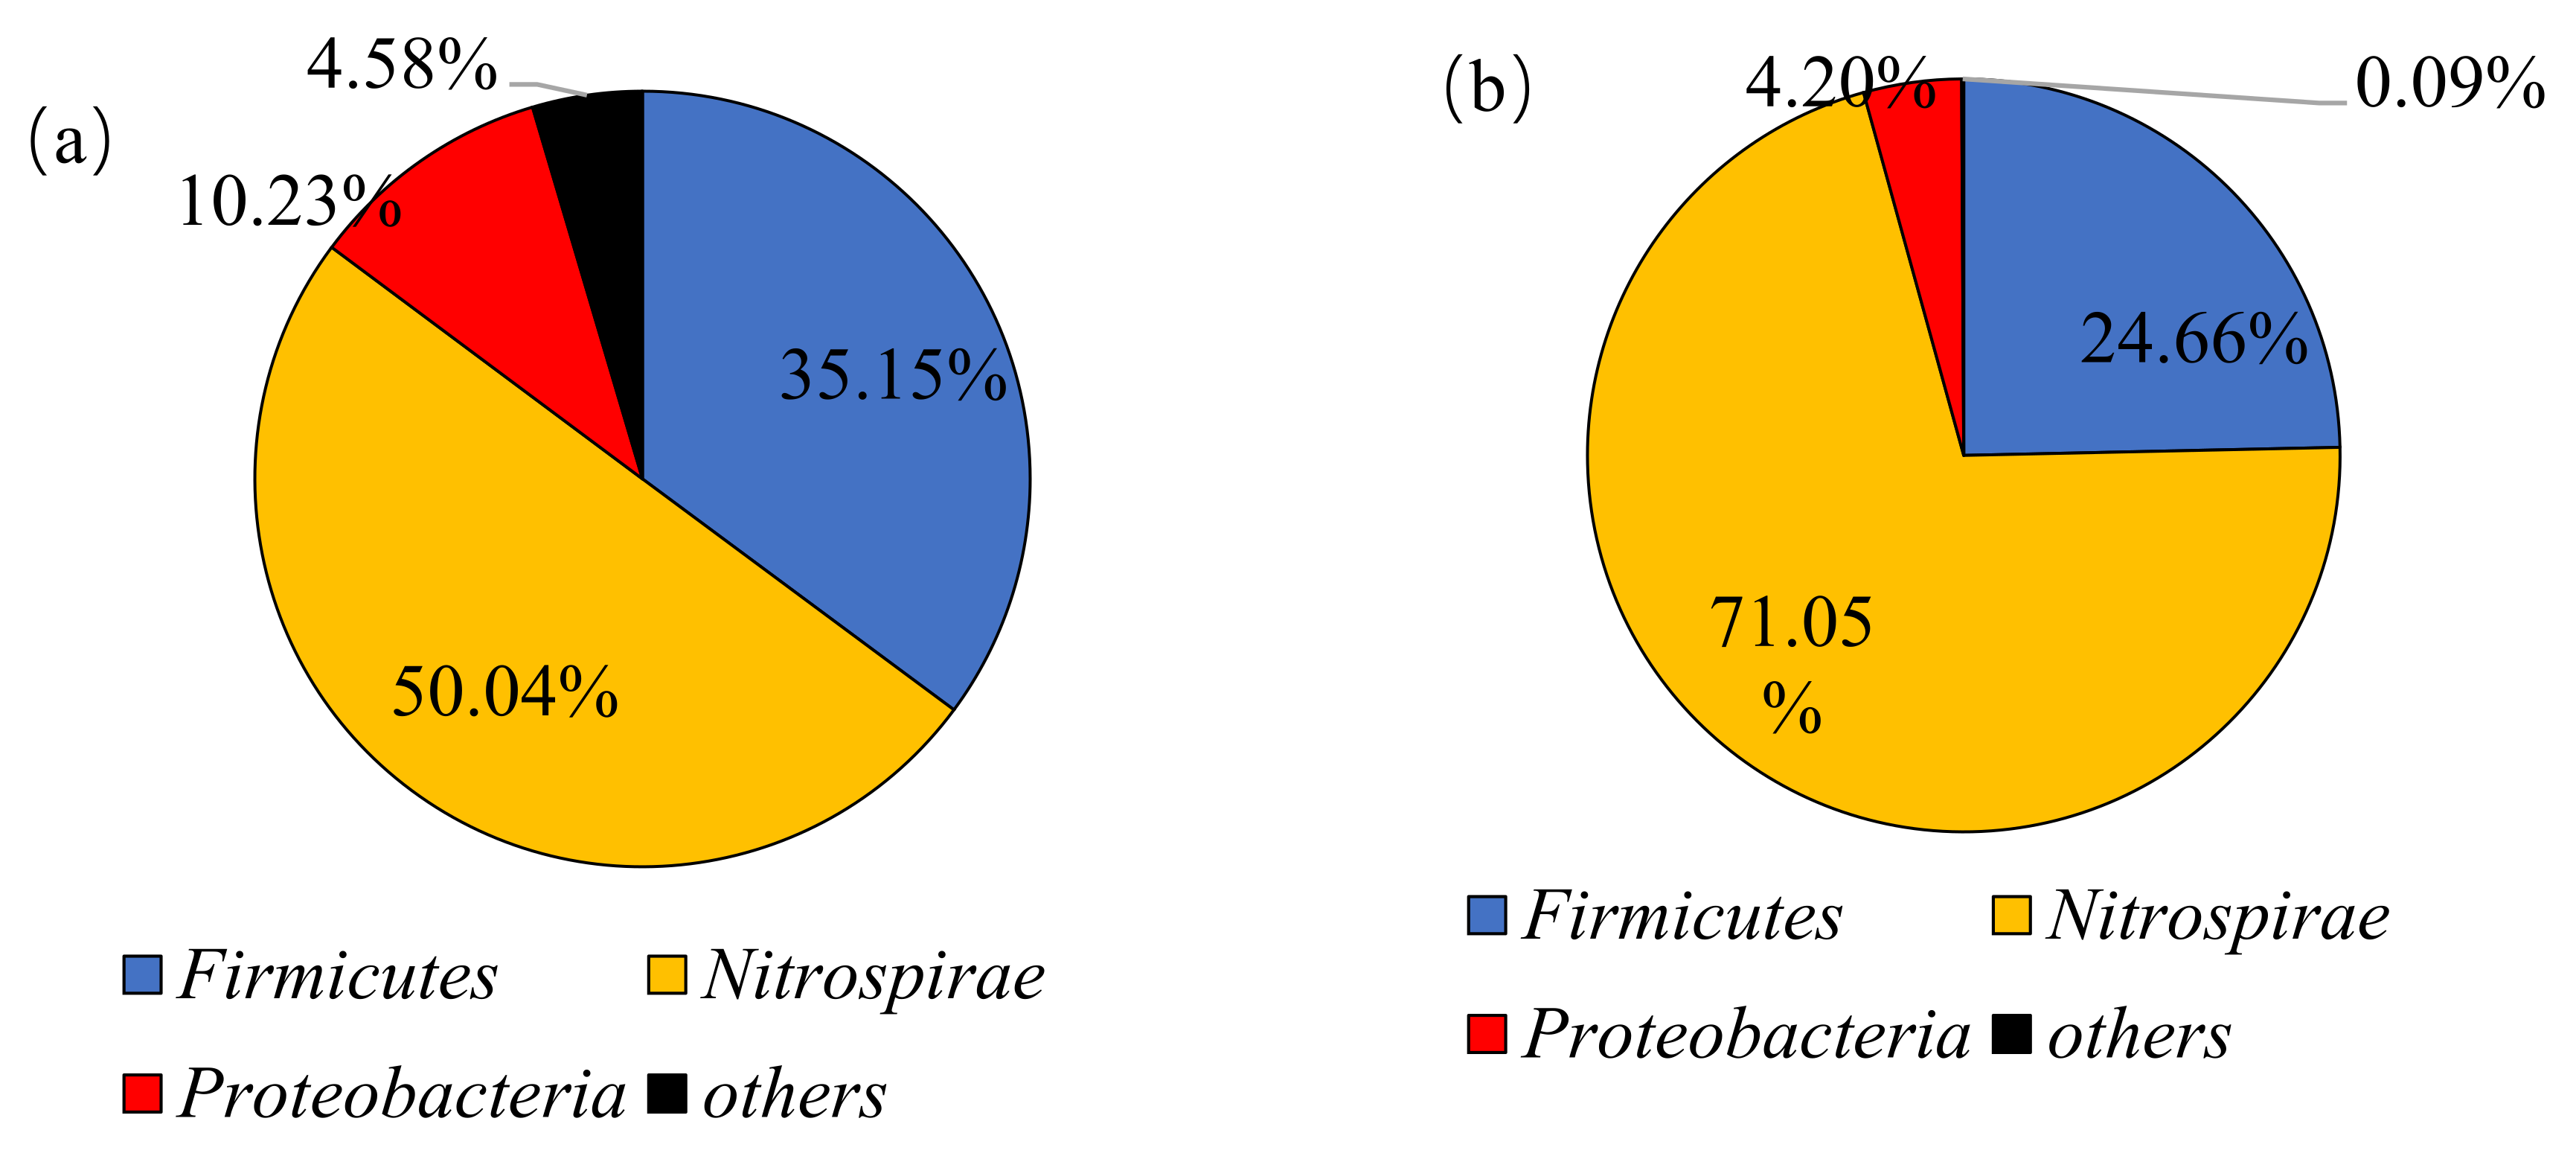
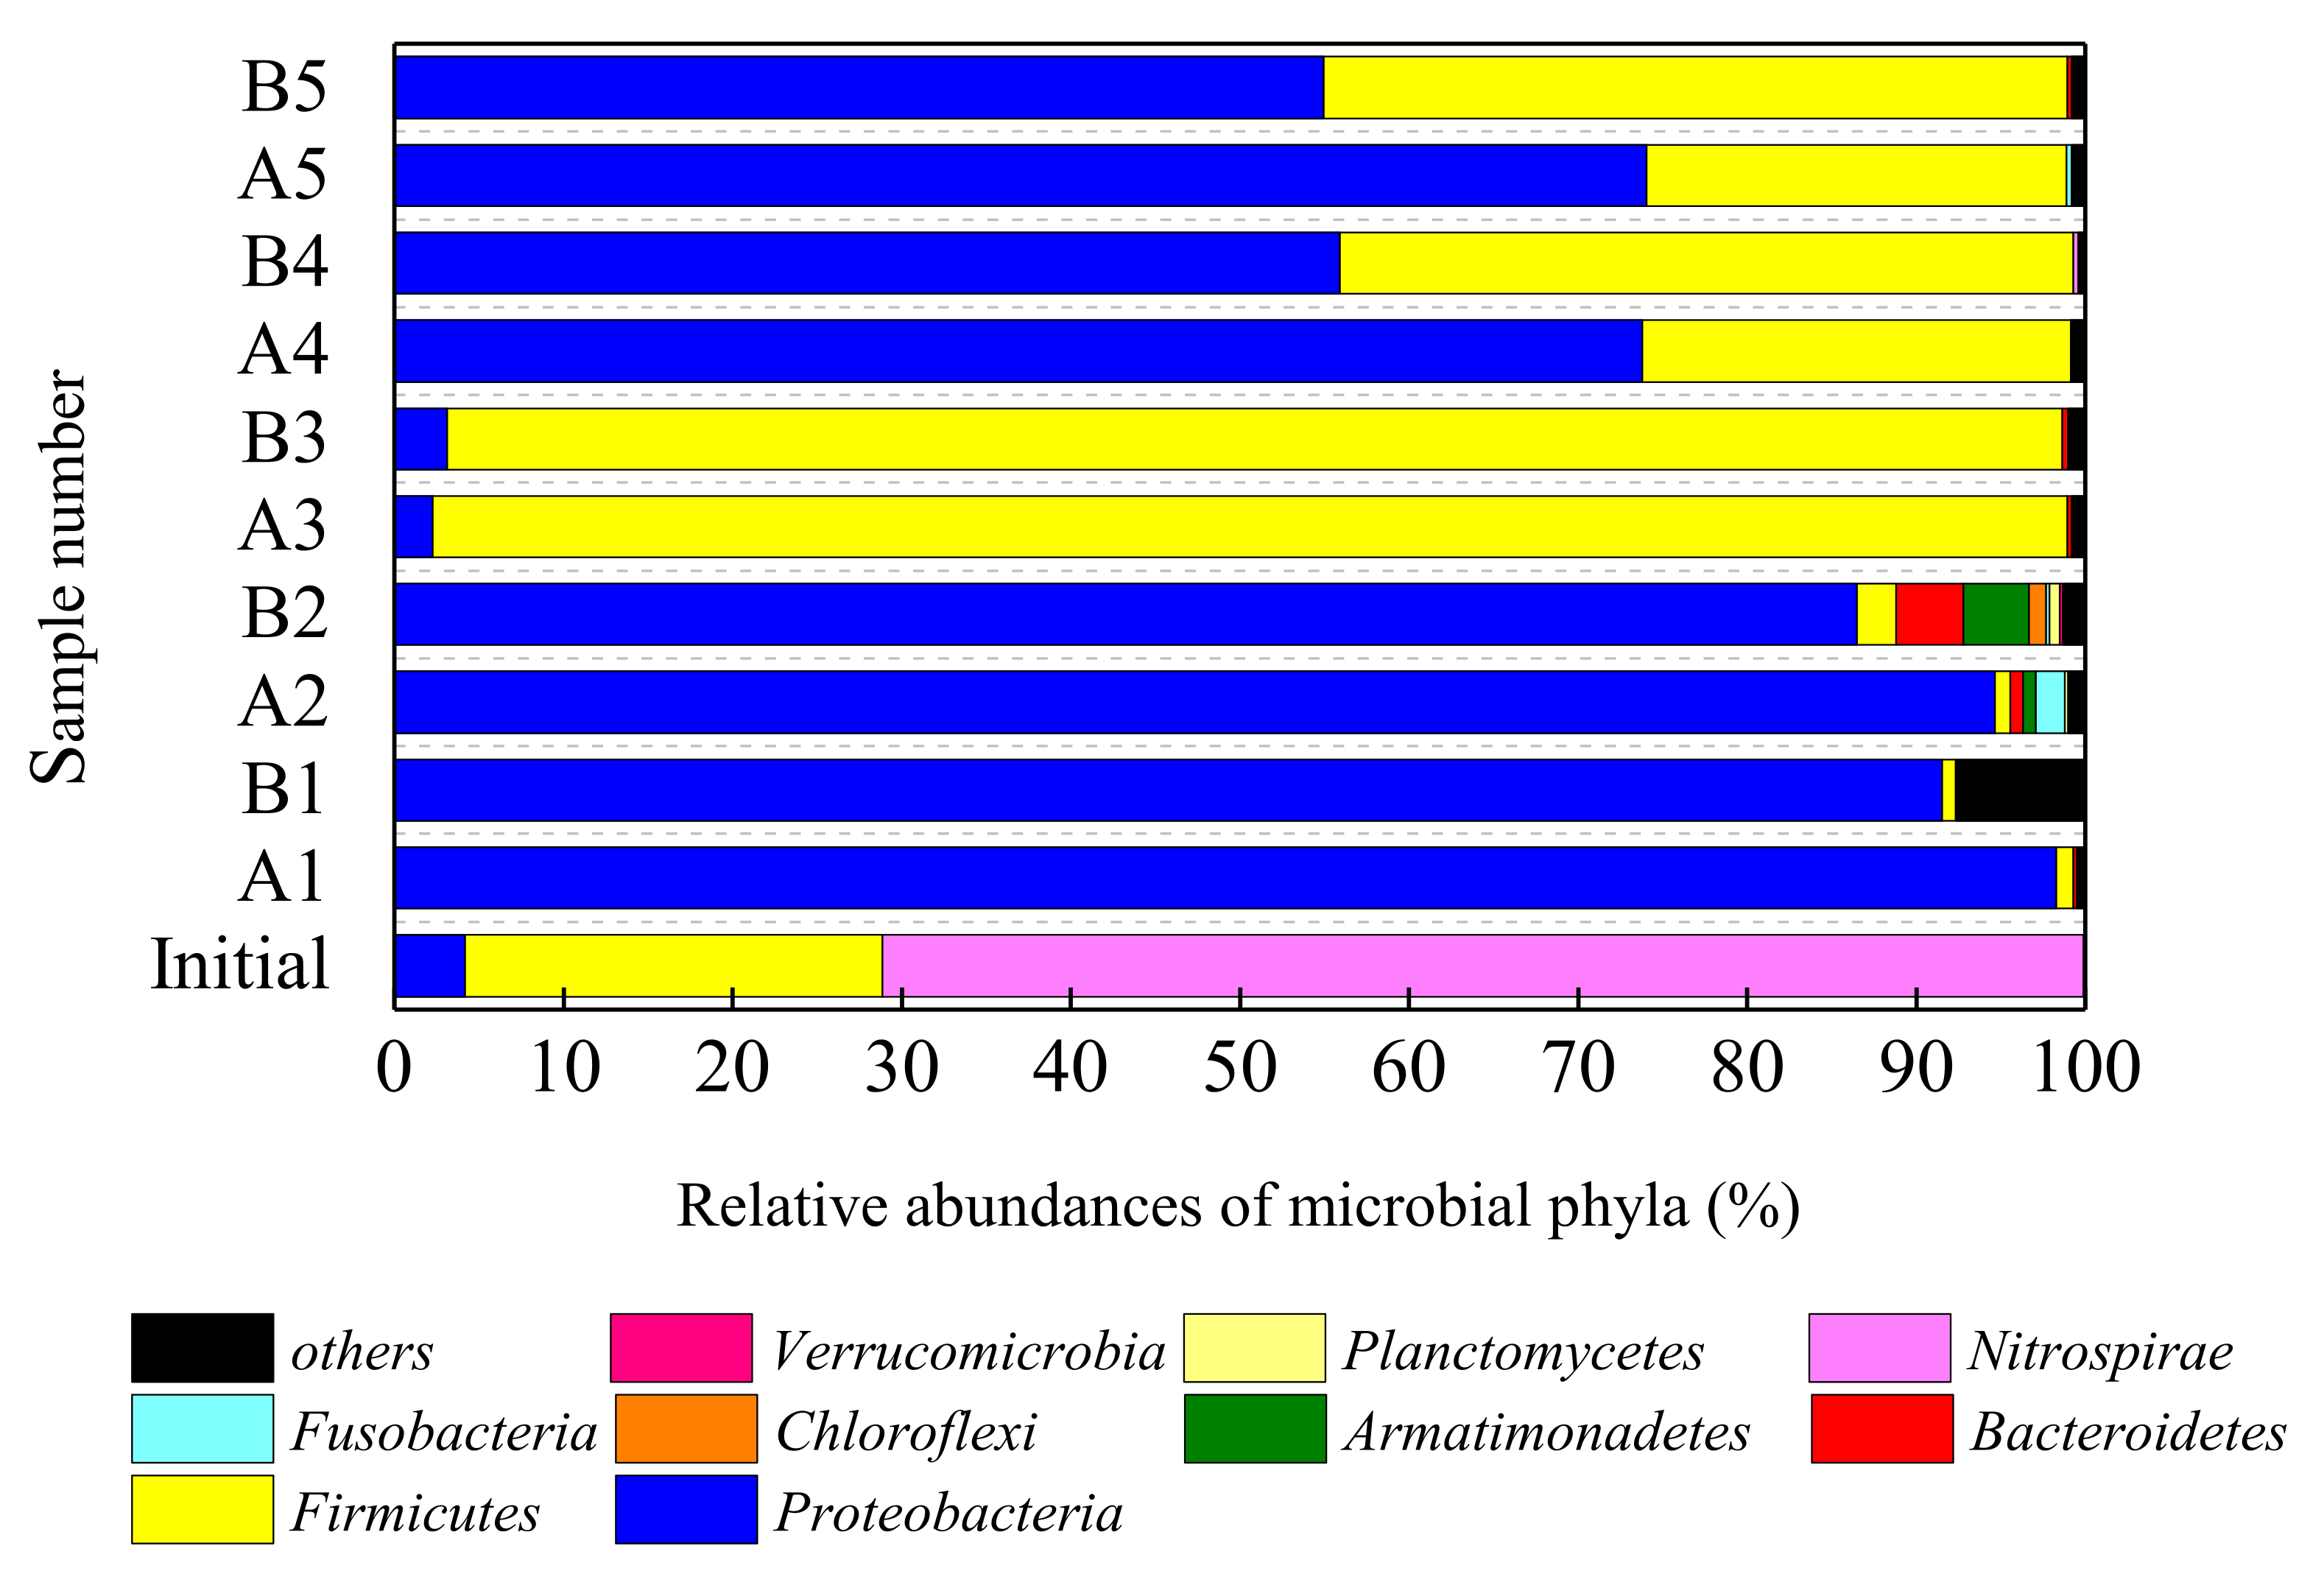
3.3.1. Changes of Phylum Classification Level

The annotation classification results at the phylum level are shown in Figure 5. In the initial sample, Nitrospirae (71.05%), Firmicutes (24.66%), and Proteobacteria (4.20%) were the dominant phyla. After CO2-NO2 and CO2 injection, changes in pH and pressure altered the composition of the microbial phyla. Proteobacteria was the dominant phyla in both groups at days 30 and 60. As the pH was neutralized over time by mineral dissolution, the types and abundances of the dominant bacterial groups also changed. Firmicutes in both groups had an absolute advantage after 90 days, but at days 120 and 150, both Proteobacteria and Firmicutes were the dominant phyla, although Proteobacteria were more abundant than Firmicutes. According to previous studies, the acid tolerance of Nitrospirae is lower than that of Proteobacteria and Firmicutes, which may explain why Nitrospirae basically disappeared after CO2 injection. Proteobacteria and Firmicutes were also dominant in the study on the effect of SO2 conducted by Zhang, et al. [19], who also observed that the competition between Proteobacteria and Firmicutes was fierce within the 90-day experimental period.
As shown in Figure 5, the comparison between groups found that the microbial compositions at the phylum level during the same period were not significantly different. In order to better distinguish different periods, the whole process was divided into three stages, namely, the early stage (30 and 60 days), the middle stage (90 days), and the later stage (120 and 150 days) of the experiment.
In the early stage (30–60 days), diversity at the phylum levels, within the pure CO2 injection group, was slightly higher. Specifically, the abundances of Firmicutes, Bacteroidetes, Armatimonadetes, and Chloroflexi in the CO2-microbe group were slightly higher after 60 days. In the middle stage (90 days), there were no significant differences among the abundances of the dominant bacteria in the two groups, and Firmicutes had an absolute advantage in both groups. In the later stage (120–150 days), the dominant bacterial phyla in both groups were Proteobacteria and Firmicutes, but the abundance of Proteobacteria was higher in the CO2-NO2-microbe group, while Firmicutes was slightly more abundant in the CO2-microbe group. With the NO2 injection, the rapid mineral dissolution rapidly narrowed the pH gap originally produced by CO2 injection, and within 30 days, the difference was no longer significant. Furthermore, the CO2-NO2 and pure CO2 injection groups had different concentrations of NO3, Fe3+, and other mineral ions after 30 days. However, the changes of pH, NO3, Fe3+ concentration, etc., after co-injection with 0.1% NO2 were not sufficient to produce differences in the dominant bacterial phyla in the communities after 30 days, but these changes did appear to have an impact on abundance.

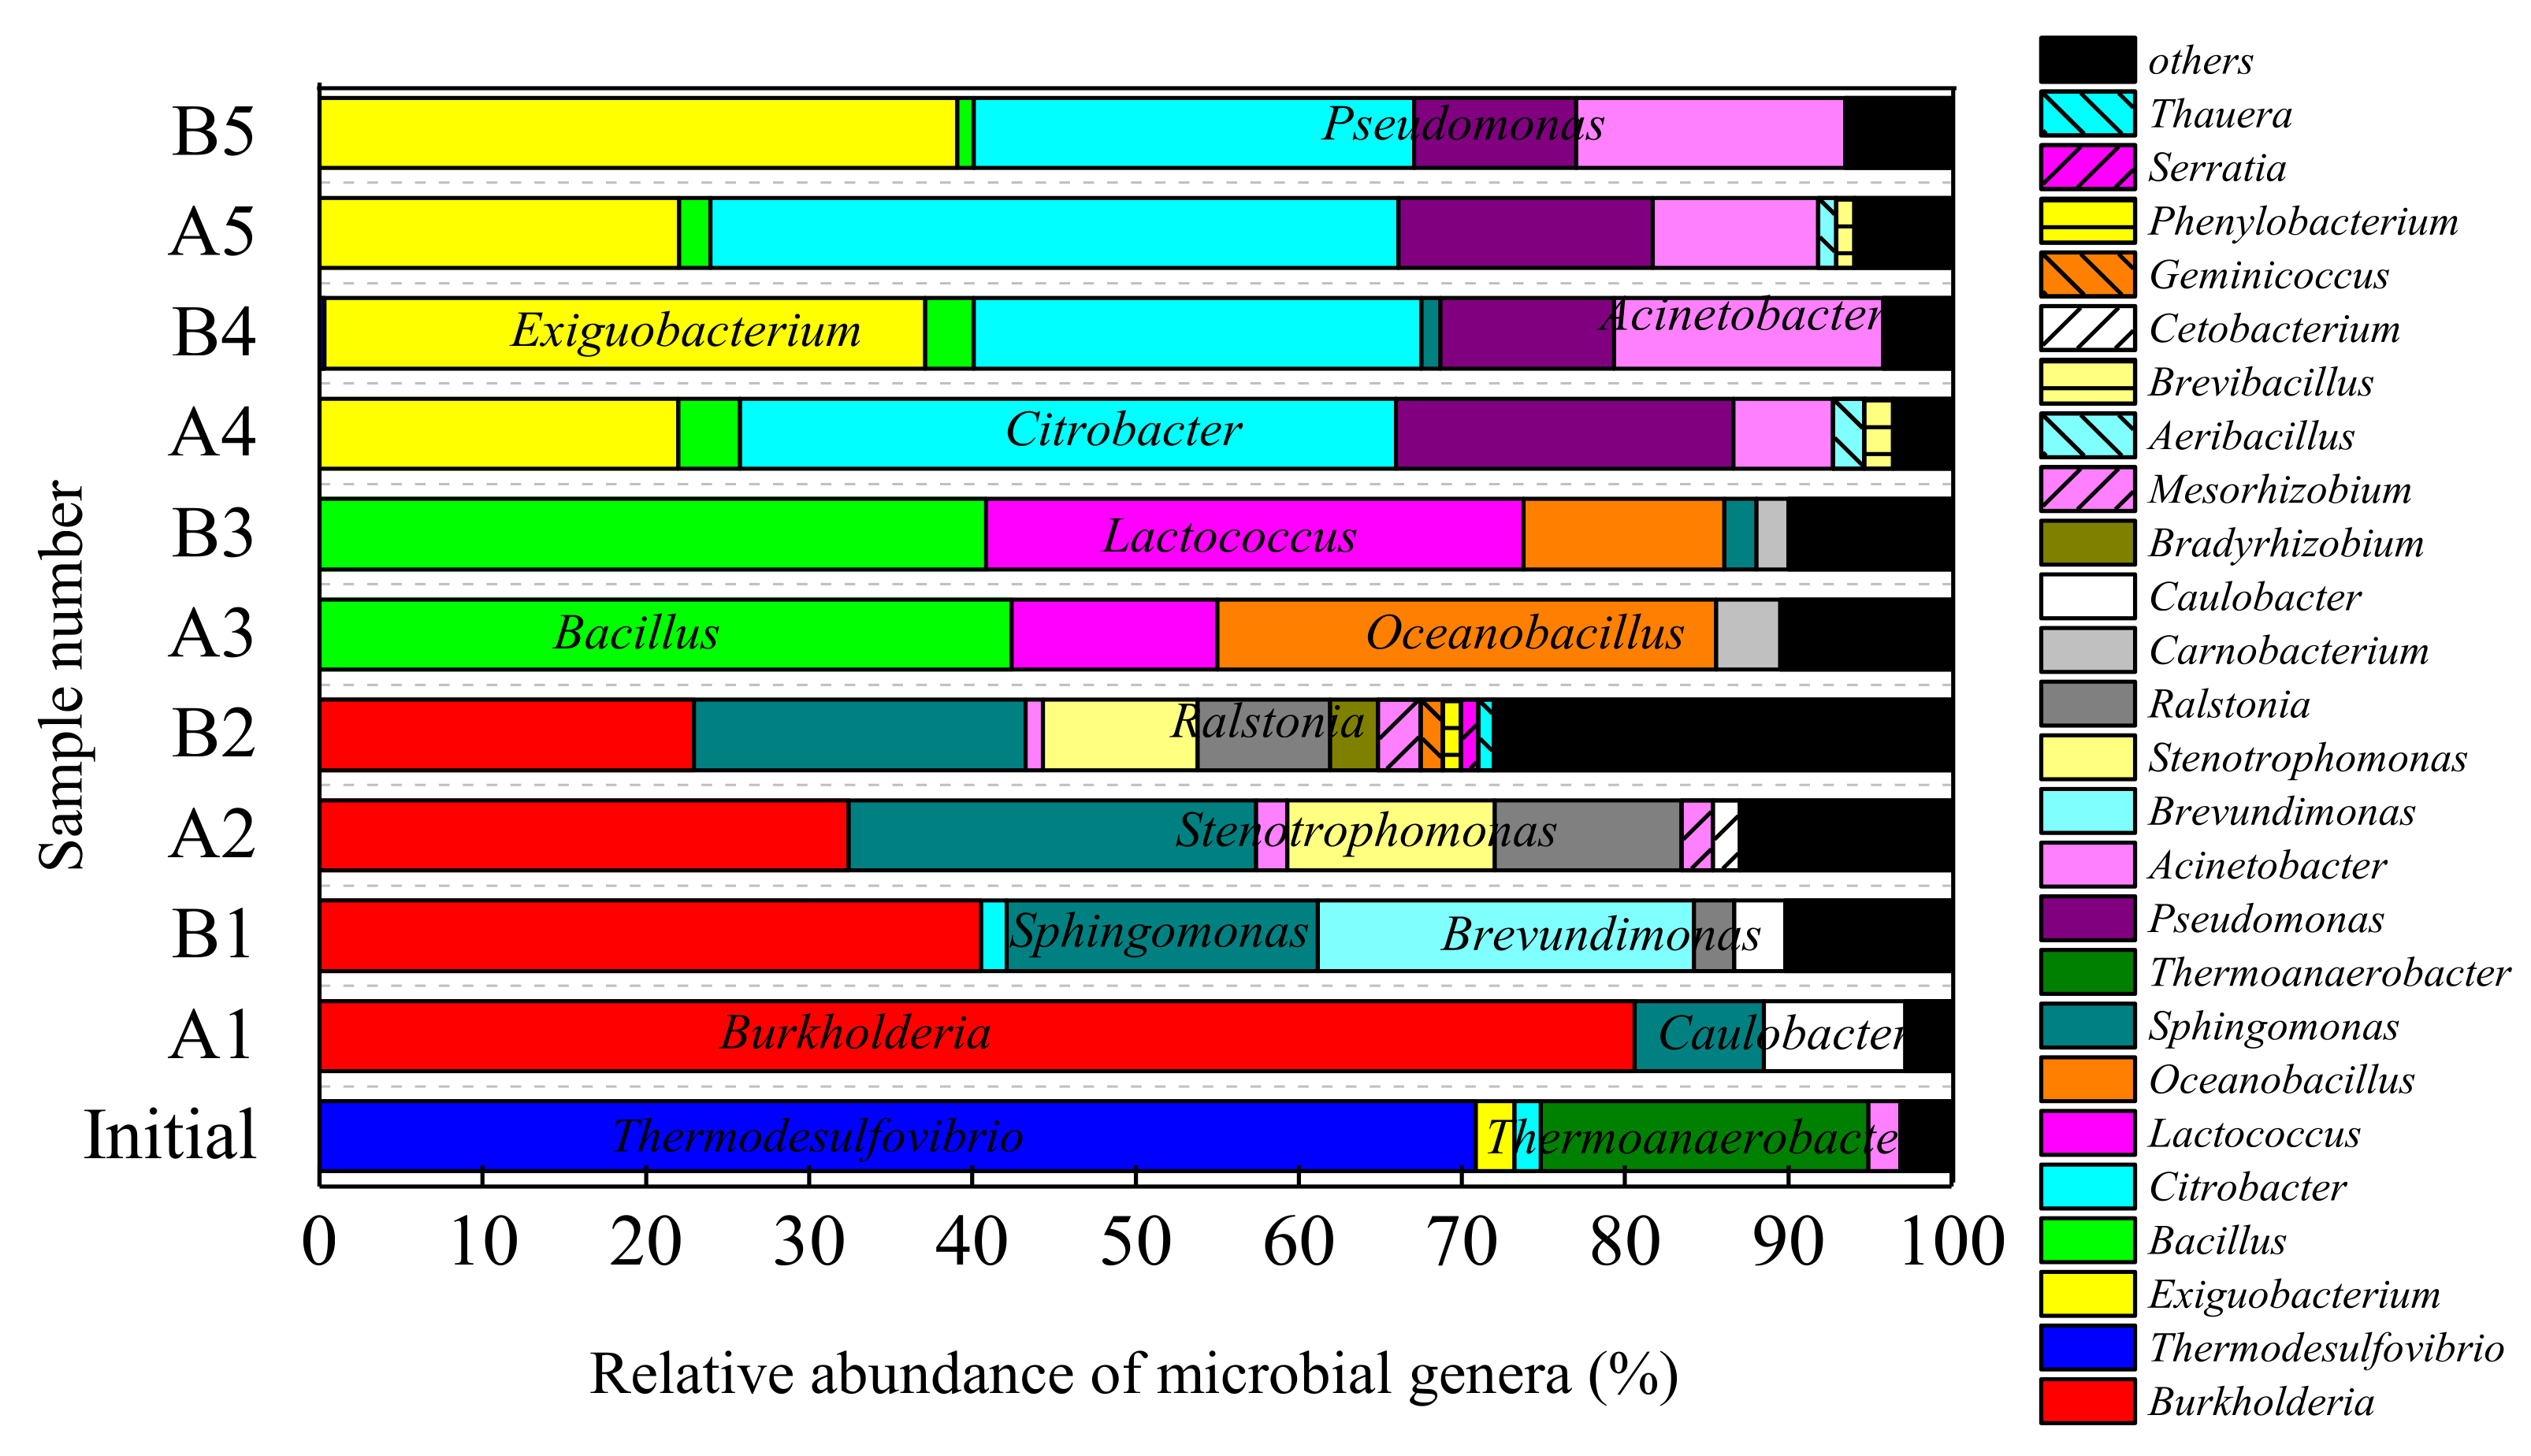
3.3.2. Microbial Community Changes at the Genus Level

In order to clarify the response of the microbial community more clearly, the bacteria were analyzed at the genus level (Figure 6). The results clearly illustrated how the microbial genera shifted in the different reactor systems due to the continuous reaction of saline-sandstone-CO2 and the continuously changing environmental conditions. The community structures of both experimental groups continued to evolve throughout the 150 day experiment. Although pH is an important factor affecting microorganisms in geological CO2 storage, and nitric acid can be formed by the 0.1% NO2 injection, rapid mineral dissolution within the experimental groups neutralized the protons, reducing the difference in pH between the two groups within 30 days. In addition, although the NO3 concentration was higher with 0.1% NO2 injection, the lower pH promoted higher Fe3+ plasma dissolution and higher salt concentrations, reducing the pH while increasing the salinity and the concentration of biological metabolites (Fe3+, NO3, etc.). These changes were not sufficient to affect the dominant bacteria genera after 30 days, but there were differences in their abundances between the CO2-NO2-microbe and CO2-microbe groups during the same period.
In the initial community, Thermodesulfovibrio and Thermoanaerobacter were the dominant genera, accounting for 70.84% and 20.04% of the total abundance, respectively. According to previous reports, Thermosysulfovibrio and Thermoanaerobacter are tolerant of pH environments around 7.0, but are not resistant to acidic environments. Since the pH of the solutions dropped below 6 upon injection of CO2-NO2 and pure CO2, the abundances of these two, initially dominant, genera dropped rapidly early in the experiment.
Through the BLASTn function in Genbank, the OTU sequences were compared with the database, and the characteristics of the dominant bacteria in the early stages were determined. The results are presented in Table 4. In the early stage of CO2-NO2 or pure CO2 injection (i.e., at 30 and 60 days), there was little difference among the dominant bacterial groups in the two communities, but there were differences in their abundances.
In the early stages, the communities of the two groups were dominated by bacteria adapted to extreme acidic and saline environments. These dominant bacteria were Burkholderia, Brevundimonas, Sphingomonas, Caulobacter, and Stenotrophomonas, all from the Proteobacteria phylum. The primary difference between the groups was a higher abundance of Burkholderia in the CO2-NO2-microbe group at 30 and 60 days, especially at 30 days, when Burkholderia accounted for 80.60% of the CO2-NO2-microbe group. The OTU0 sequence was shown to belong to the genus Burkholderia, which has a 98% similarity with Burkholderia spp. It has been reported that this group of bacteria can continue growing in acidic environments, tolerating pH environments of 3.05–4.67, and that they produce acid-eroding minerals [25]. Because the pH in the early stage of NO2-CO2 injection group was lower than that in the pure CO2 injection group, the abundance of Burkholderia in the CO2-NO2-microbe was higher at 30 and 60 days.
In the middle stage (90 days), the differences in the types and abundance of dominant bacteria between the CO2-NO2 and pure CO2 injection groups were no longer significant. The OTU sequences were compared with the database using the BLASTn function in Genebank, and the characteristics of the dominant bacteria at 90 days were determined, as shown in Table 5.
Half way through the experiment, the microbial communities of the two groups were composed mainly of acid-producing and salt-tolerant bacteria, and the dominant bacteria were Bacillus, Oceanobacillus, and Lactococcus from the Firmicutes phylum. The OTU7 sequence was determined to belong to the Bacillus genus and has a 99% similarity with Bacillus cereus. Wang [32] found that many species of the Bacillus genus, including Bacillus cereus, have weathering effects on potassium feldspar and are salt-tolerant. Sofos [36] observed that the growth of Bacillus cereus was completely inhibited when the pH was less than 4.5. At 90 days, the pH of the CO2-NO2-microbe group was 5.61, and the pH of the CO2-microbe group was 5.74, both of which were suitable for the growth of Bacillus cereus. The OTU23 sequence belongs to the genus Lactococcus and has a 99% similarity with Lactococcus sp. Yanmis [35] showed that Lactococcus spp. had the ability to dissolve CaCO3. OTU15 was shown to belong to the genus Oceanobacillus, which is mostly found in the ocean and has high salt tolerance and pressure resistance [33,34]. The higher proportion of Oceanobacillus in the CO2-NO2-microbe group at 90 days was likely related to the higher salt concentrations in this group.
In the later period of the experiment (120 and 150 days), the community structures were relatively stable, and there was little difference among the dominant bacterial species in the 120-day and 150-day samples from the same experimental groups. In addition, there were no significant differences between the dominant bacteria of the two experimental groups during the same period, but there were differences in their abundances. The abundances and characteristics of the dominant bacteria during 120–150 days are shown in Table 6.
In the later stages of the experiment, the dominant bacterial genera of the two groups were mainly the iron-reducing bacteria Citrobacter of the Proteobacteria phylum, denitrifying bacteria of the genus Pseudomonas, acid producing bacteria of the Firmicutes phylum, and the mineral dissolving bacteria Exiguobacterium, Acinetobacter, and Bacillus. OTU14 was shown to belong to the genus Citrobacter and has a similarity of 99% with Citrobacter freundii. According to previous studies, most species of Citrobacter are typical facultative anaerobes, which can use Fe(III) and H2 as electron acceptors, with small molecular organic acids acting as electron donors via enzymatic pathways to reduce Fe(III) [37,38] and then induce siderite biomineralization through metabolic processes. OTU17 belongs to the genus Exiguobacterium and has a 99% similarity with the strain Exiguobacterium sp. It has been reported that bacteria of the genus Exiguobacterium can use the humus in minerals for fermentation, which produces lactic acid [39]. OTU12 was identified as belonging to the genus Acinetobacter and is 97% similar to Acinetobacter soli. Bhattacharya [15] found that Acinetobacter soli can use carbon sources, such as glucose, to ferment to produce acids, and they observed a reduction in the pH of the solution from 7.4 to 0.32, resulting in the dissolution of 71.93% of the K+ in potassium feldspar. OTU19 belongs to the genus Pseudomonas and has a 99% similarity with Pseudomonas aeruginosa. Chen [36] showed that the bacteria Pseudomonas aeruginosa maintains a high denitrification ability in pH environments as low as 4.50. The strain also maintains a strong denitrification ability with C/N ratios of 3.0, temperatures 45 °C, and NO3 concentrations of 160 mg/L. Their reduction rate can be as high as 92.74%. At 120 days and 150 days, the abundances of Citrobacter and Pseudomonas in the CO2-NO2-microbe group were higher than the CO2 alone group, indicating the higher TFe (Total Iron) and nitrate concentrations, created by the NO2 injection, facilitated Citrobacter iron reducing and Pseudomonas denitrifying activities and promoted their abundance.

3.4. Effects of NO2 Co—Injection on Biodiversity

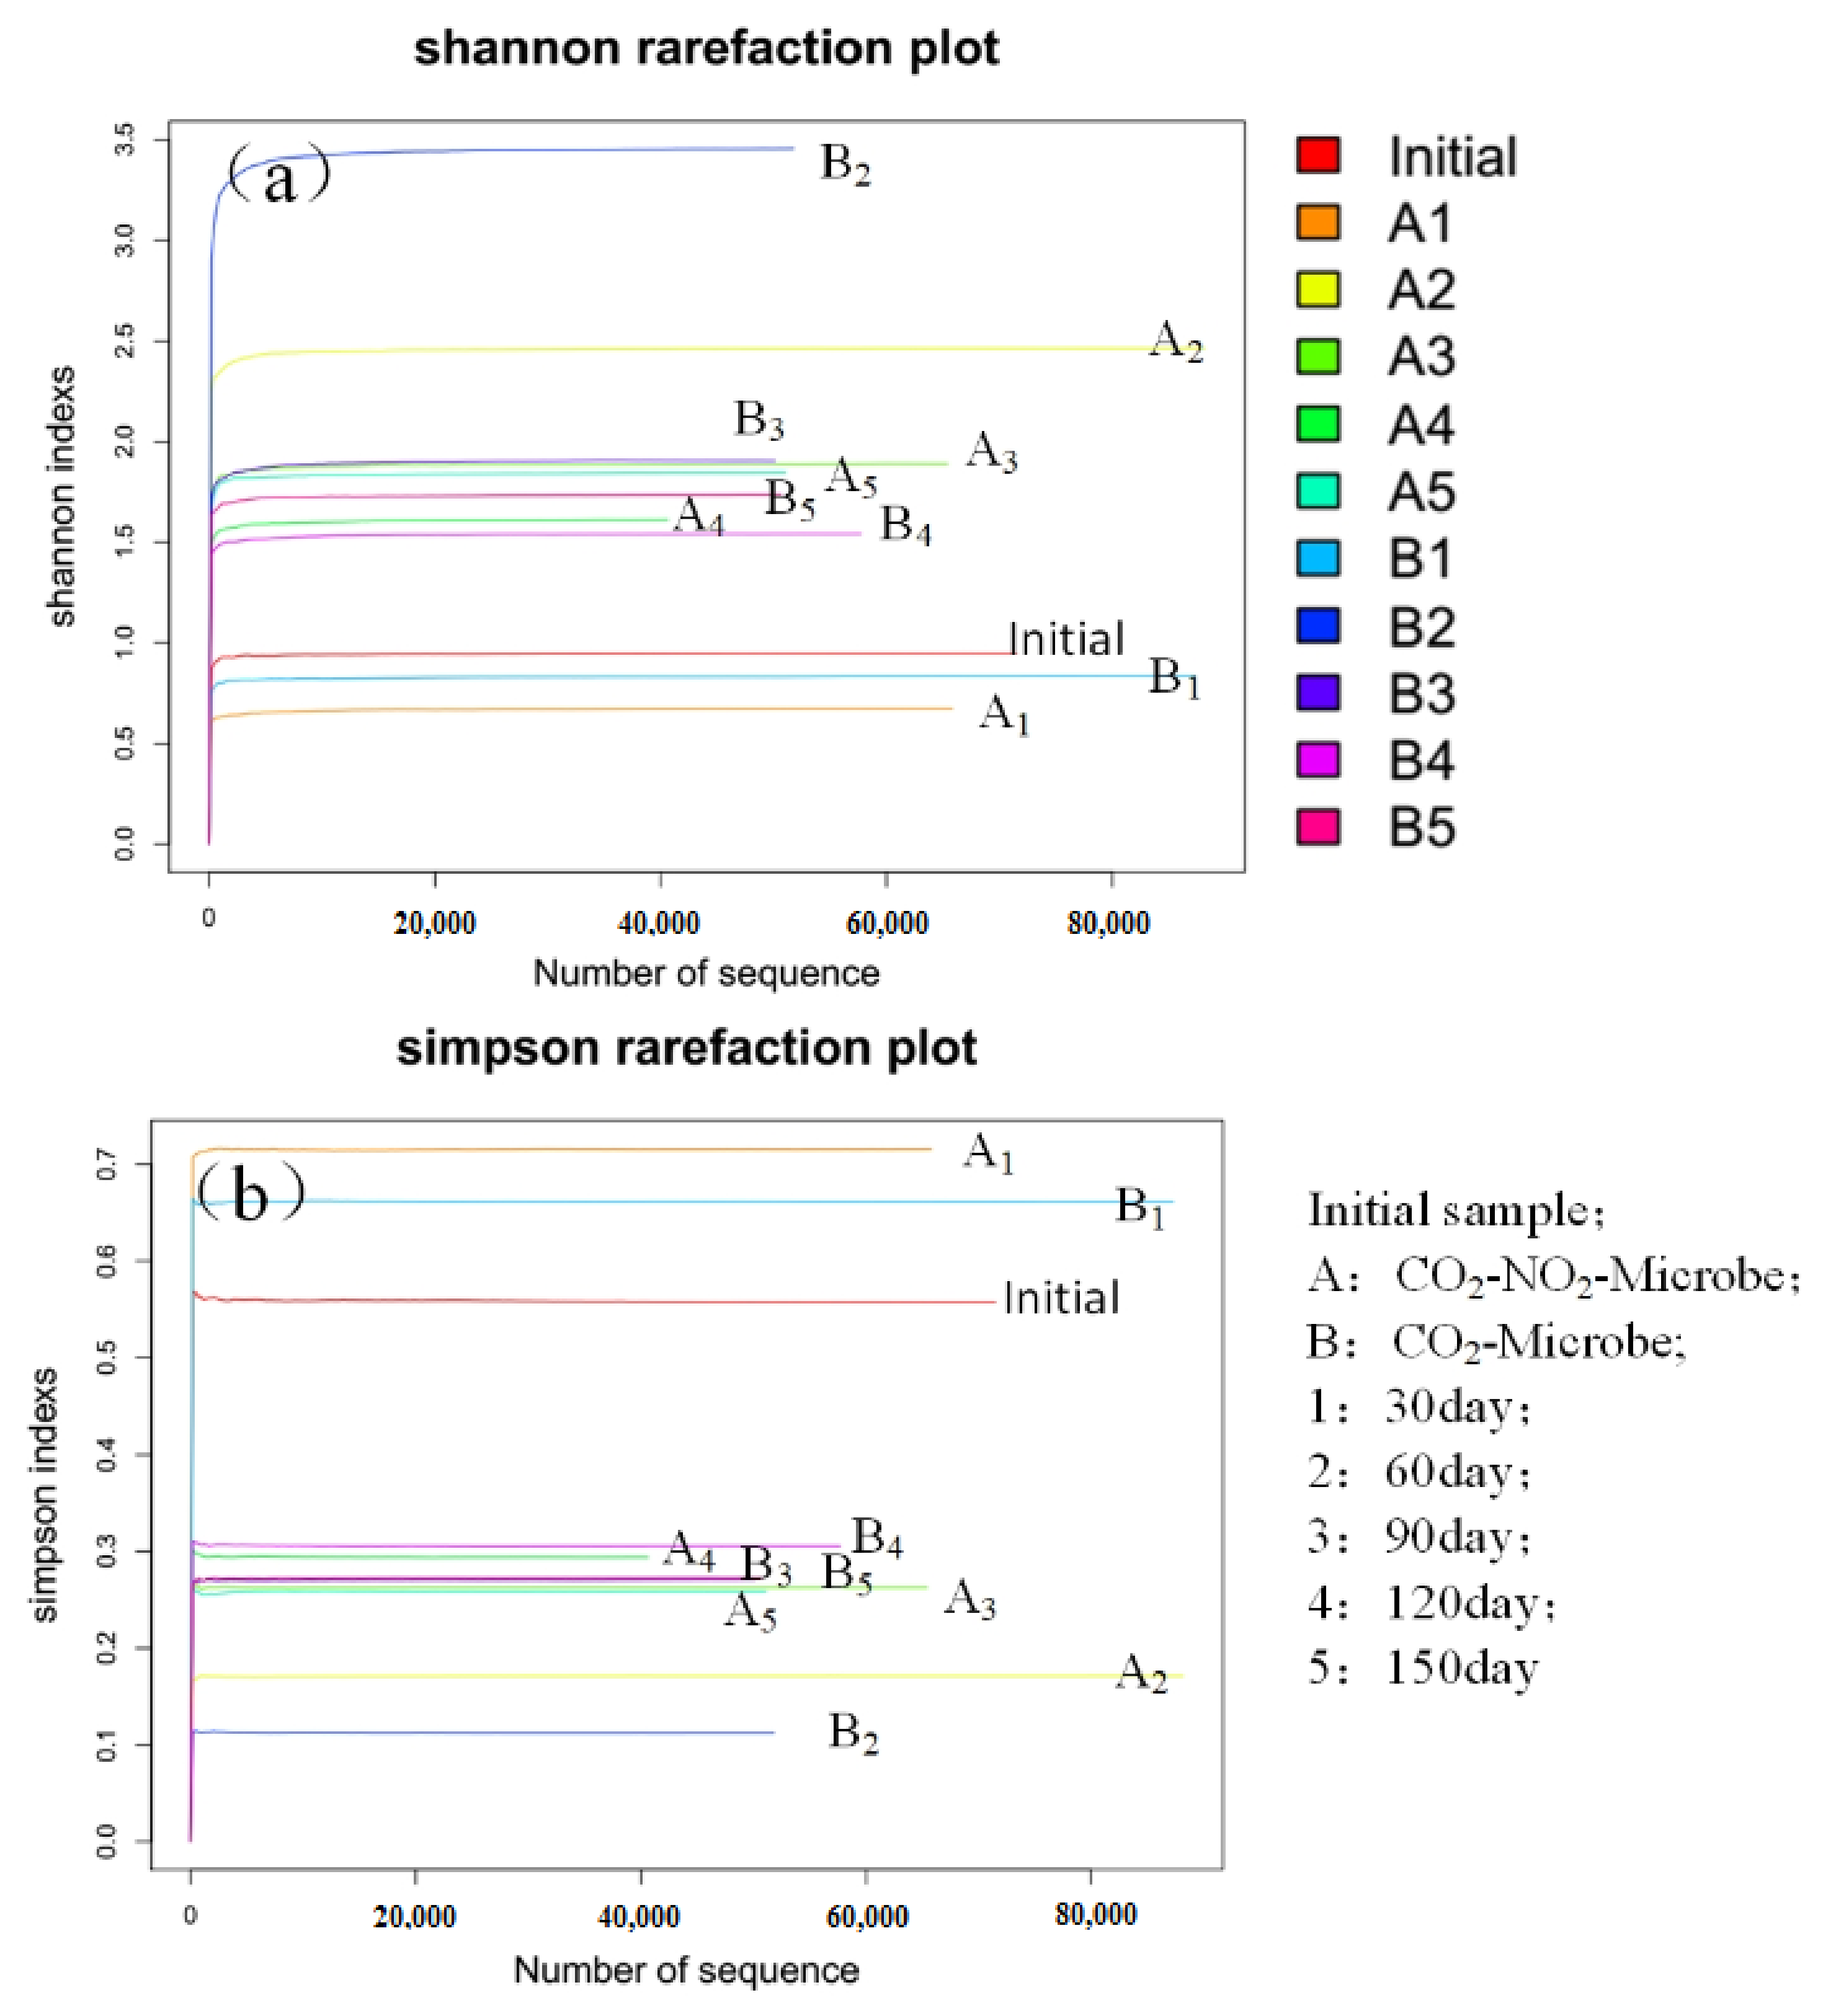
3.4.1. Alpha Diversity Analysis

Figure 7 shows the differences in the Shannon and Simpson indexes among groups at different time periods. The diversity of the microbial community in the CO2-NO2-microbe group during the first 90 days was less than that of the CO2-microbe group, and the diversity in the CO2-NO2-microbe group was greater than that of the CO2-microbe group at 120 and 150 days. Because the difference in pH between the two groups in the early stage was slightly larger, the lower pH early in the CO2-NO2-microbe group may have reduced the biodiversity in the first 90 days compared to the CO2-microbe group. With the rapid mineral dissolution, the pH was neutralized, and the pH gap between the two groups was reduced over time, meaning that the impact of pH on community diversity gradually became weaker. However, the injection of NO2 enriched the available nitrogen and increased the amount of dissolved TFe, nitrate, and iron ions, all of which can be used as nutrients for microorganisms. This benefited the physiological and metabolic activities of microorganisms, resulting in increased diversity within the microbial community.

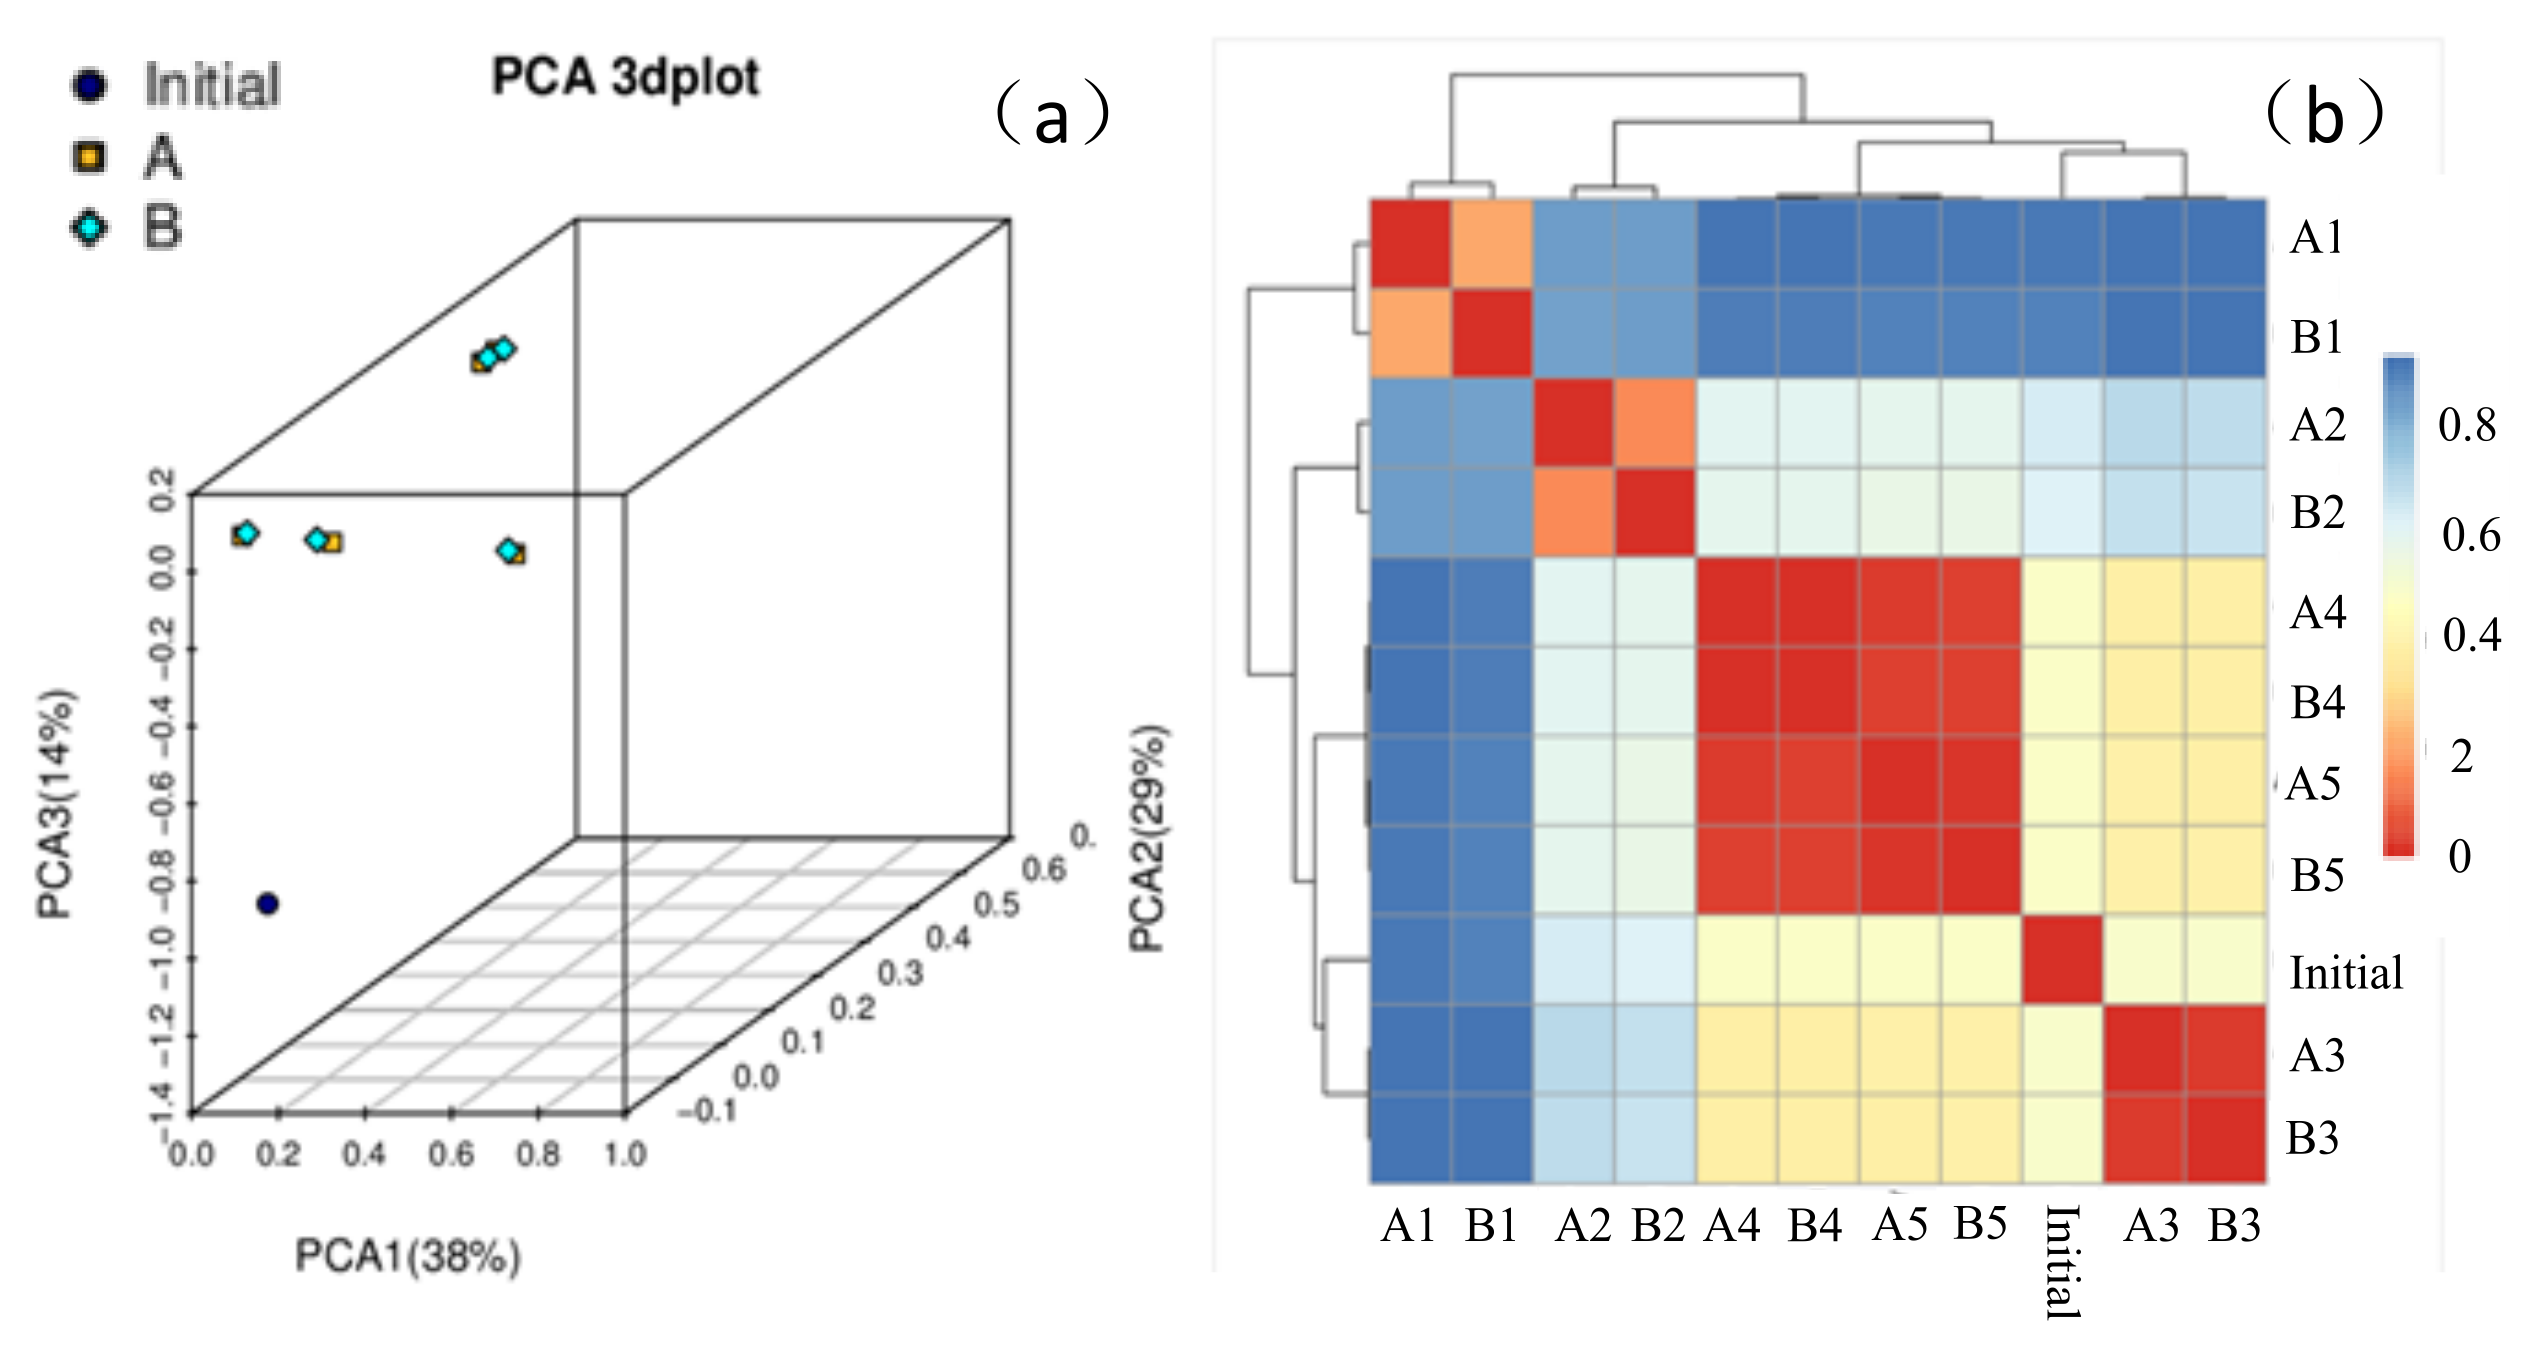
3.4.2. Multidimensional Analysis and Beta Diversity Analysis

By creating graphs based on a multi-dimensional PCA, the relationships between samples can be visualized by their proximities, with closer samples being more similar to each other. Furthermore, using UniFrac’s heatmap, samples were analyzed for Beta diversity, with colors representing distances between samples, where red indicates that the distance between the samples is closer, and blue indicates the opposite.
The PCA 3D map and the UniFrac sample distance heat map (Figure 8) showed that there were differences and similarities among samples in the same group at different periods. The pH, carbon availability (sodium acetate, added when configuring the solution), and terminal electron acceptor (such as Fe3+ or NO3) concentrations changed continuously over the 150 days experiment, but the similarities between the community structures were highest at 90 and 120 days, after which the community evolved even slower. Domination early by Burkholderia (tolerant pH 3.05 ~ 4.67), mid-term by Bacillus (completely inhibited at pH < 4.5) and Oceanobacillus (salt-tolerant, pressure-tolerant), and later by Citrobacter (iron reduction) and Pseudomonas (acid-resistant denitrifying bacteria) marked the differences between the different periods. These differences were matched by changes in pH, salt concentration, and metabolites in the system. In addition, the UniFrac sample distance heat map showed that the sudden change in pH, after the CO2-NO2 and pure CO2 injections, resulted in significant differences in the early community structure (at 30 days). The pH gradually increased with mineral dissolution from day 30 to day 90, and the community shifted back towards the initial composition. Acid-tolerant and salt-tolerant bacteria were dominant, indicating that the early and mid-term pH had the strongest impact on community evolution. Later, from days 90 to 150, the community shifted slightly away from the initial community composition, despite pH changing only slowly at this stage. Iron reducing, denitrifying, and acid-producing bacteria were the dominant bacteria at various stages. Nutrient availability (e.g., carbon, Fe3+, and NO3) had a significant effect on the evolution of the community later in the experimental period.

4. Conclusions

In this study, a series of experiments about microbe-NO2-CO2-saline-sandstone interaction, at real GCS site conditions, were conducted to verify the response of microbial communities to NO2 impurities. With the 16S rRNA sequence and qPCR analysis, a lower pH was achieved resulting in lower biomass and biodiversity than the pure CO2 injection group within 90 days after 0.1% NO2 impurities was co-injected. With the rapid mineral dissolution, the pH gap between the NO2 impurities and pure CO2 groups was reduced over time, which means the impact of NO2 impurities on biomass and biodiversity gradually became weaker. During the whole experiment, co-injection of 0.1% NO2 did not affect the dominant phyla or genera except the abundances in the microbial communities after 30 days. Compared with the database, using the BLASTn function in Genebank, it was found that acid producing bacteria such as Exiguobacterium sp., Acinetobacter soli, and Lactococcus spp. could reduce the pH of mineral surfaces and accelerate the dissolution of silicate minerals. The Fe (III)-reducing microbes, Citrobacter freundii, reduced the Fe (III) released from clays to Fe (II) and induce siderite (FeCO3) biomineralization through biogeochemical processes. Therefore, the co-injection of trace NO2 will not significantly affect the growth of microorganisms and may even benefit the CO2 mineral trapping process on a long timescale. The results demonstrated the co-injection of trace NO2 in GCS technology is feasible, which is also conducive to reduce the cost of CO2 purification and denitrification caused by NOx.

Author Contributions

Conceptualization, C.L. and Y.L.; methodology, C.L. and Y.L.; validation, Y.Z. and Y.L.; investigation, C.L., Q.M. and Y.S.; data curation, C.L. and Y.L.; writing—original draft preparation, C.L.; writing—review and editing, Y.L.; visualization, Y.S.; supervision, Y.Z.; project administration, C.L.; funding acquisition, C.L. and Y.L. All authors have read and agreed to the published version of the manuscript.

Funding

This research was funded by the Open Project Program of Key Laboratory of Groundwater Resources and Environment (Jilin University, Ministry of Education) and the Fund of the Education Department of Jilin Province (JJKH20200268KJ) and (JJKH20200290KJ).

Institutional Review Board Statement

Not applicable.

Informed Consent Statement

Not applicable.

Data Availability Statement

Data is contained within the article.

Conflicts of Interest

The authors declare no conflict of interest.

References

  1. NOAA. 2021. Available online: https://www.esrl.noaa.gov/gmd/ccgg/trends/global.html (accessed on 11 May 2021).
  2. Haszeldine, R.S. Carbon Capture and Storage: How Green Can Black Be? Science 2009, 325, 1647–1652. [Google Scholar] [CrossRef] [PubMed]
  3. Bae, J.; Chung, Y.; Lee, J.; Seo, H. Knowledge spillover efficiency of carbon capture, utilization, and storage technology: A comparison among countries. J. Clean. Prod. 2020, 246, 119003. [Google Scholar] [CrossRef]
  4. Sokama-Neuyam, Y.A.; Adu-Boahene, F.; Boakye, P.; Aggrey, W.N.; Ursin, J.R. Theoretical modeling of the effect of temperature on CO2 injectivity in deep saline formations. Greenh. Gases Sci. Technol. 2020, 10, 4–14. [Google Scholar] [CrossRef]
  5. Trémosa, J.; Castillo, C.; Vong, C.Q.; Kervévan, C.; Lassin, A.; Audigane, P. Long-term assessment of geochemical reactivity of CO2 storage in highly saline aquifers: Application to Ketzin, In Salah and Snøhvit storage sites. Int. J. Greenh. Gas Control 2014, 20, 2–26. [Google Scholar] [CrossRef] [Green Version]
  6. Rendel, P.M.; Wolff-Boenish, D.; Gavrielli, I.; Ganor, J. Planned Experimental Studies into the Nucleation and Precipitation Kinetics of Sulfate-bearing Minerals under Conditions Relevant to CO2 Geological Storage. Energy Procedia 2013, 37, 5494–5500. [Google Scholar] [CrossRef] [Green Version]
  7. Fischer, S.; Liebscher, A.; De Lucia, M.; Hecht, L.; Ketzin Team. Reactivity of sandstone and siltstone samples from the Ketzin pilot CO2 storage site-Laboratory experiments and reactive geochemical modeling. Env. Earth Sci. 2013, 70, 3687–3708. [Google Scholar] [CrossRef]
  8. De Silva, G.; Ranjith, P.; Perera, M. Geochemical aspects of CO2 sequestration in deep saline aquifers: A review. Fuel 2015, 155, 128–143. [Google Scholar] [CrossRef]
  9. Li, D.; Jiang, X. Numerical investigation of convective mixing in impure CO2 geological storage into deep saline aquifers. Int. J. Greenh. Gas Control 2020, 96, 103015. [Google Scholar] [CrossRef]
  10. Talman, S. Subsurface geochemical fate and effects of impurities contained in a CO2 stream injected into a deep saline aquifer: What is known. Int. J. Greenh. Gas Control 2015, 40, 267–291. [Google Scholar] [CrossRef]
  11. Aminu, M.; Ali, N.S.; Vasilije, M. CO2-brine-rock interactions: The effect of impurities on grain size distribution and reservoir permeability. Int. J. Greenh. Gas Control 2018, 78, 168–176. [Google Scholar] [CrossRef]
  12. Hedayati, M.; Wigston, A.; Wolf, J.L.; Rebscher, D.; Niemi, A. Impacts of SO2 gas impurity within a CO2 stream on reservoir rock of a CCS pilot site: Experimental and modelling approach. Int. J. Greenh. Gas Control 2018, 70, 32–44. [Google Scholar] [CrossRef]
  13. Nicot, J.-P.; Solano, S.; Lu, J.; Mickler, P.; Romanak, K.; Yang, C.; Zhang, X. Potential Subsurface Impacts of CO2 Stream Impurities on Geologic Carbon Storage. Energy Procedia 2013, 37, 4552–4559. [Google Scholar] [CrossRef] [Green Version]
  14. Uroz, S.; Calvaruso, C.; Turpault, M.-P.; Frey-Klett, P. Mineral weathering by bacteria: Ecology, actors and mechanisms. Trends Microbiol. 2009, 17, 378–387. [Google Scholar] [CrossRef]
  15. Bhattacharya, S.; Bachani, P.; Jain, D.; Patidar, S.K.; Mishra, S. Extraction of potassium from K-feldspar through potassium solubilization in the halophilic Acinetobacter soli (MTCC 5918) isolated from the experimental salt farm. Int. J. Miner. Process. 2016, 152, 53–57. [Google Scholar] [CrossRef]
  16. Mitchell, A.C.; Dideriksen, K.; Spangler, L.H.; Cunningham, A.B.; Gerlach, R. Microbially Enhanced Carbon Capture and Storage by Mineral-Trapping and Solubility-Trapping. Env. Sci. Technol. 2010, 44, 5270–5276. [Google Scholar] [CrossRef] [Green Version]
  17. Liu, L.; Lee, D.-J.; Wang, A.; Ren, N.; Su, A.; Lai, J.-Y. Isolation of Fe(III)-reducing bacterium, Citrobacter sp. LAR-1, for startup of microbial fuel cell. Int. J. Hydrog. Energy 2016, 41, 4498–4503. [Google Scholar] [CrossRef]
  18. Li, C.; Zhong, S.; Zhang, F.; Wang, Z.; Jiang, F.; Wan, Y. Response of microbial communities to supercritical CO2 and biogeochemical influences on microbially mediated CO2-saline-sandstone interactions. Chem. Geol. 2017, 473, 1–9. [Google Scholar] [CrossRef]
  19. Zhang, F.; Song, Y.; Li, C.; Zhang, S.; Lyu, C.; Fan, K. The Impact of Indigenous Microorganisms on the Mineral Corrosion and Mineral Trapping in the SO2 Co-injected CO2-Saline-Sandstone Interaction. Geomicrobiol. J. 2019, 36, 110–122. [Google Scholar] [CrossRef]
  20. Li, W.; Wang, L.-Y.; Duan, R.-Y.; Liu, J.-F.; Gu, J.-D.; Mu, B.-Z. Microbial community characteristics of petroleum reservoir production water amended with n-alkanes and incubated under nitrate-, sulfate-reducing and methanogenic conditions. Int. Biodeterior. Biodegrad. 2012, 69, 87–96. [Google Scholar] [CrossRef]
  21. Sanz, J.L.; Köchling, T. Molecular biology techniques used in wastewater treatment: An overview. Process. Biochem. 2007, 42, 119–133. [Google Scholar] [CrossRef]
  22. Tantikachornkiat, M.; Sakakibara, S.; Neuner, M.; Durall, D.M. The use of propidium monoazide in conjunction with qPCR and Illumina sequencing to identify and quantify live yeasts and bacteria. Int. J. Food Microbiol. 2016, 234, 53–59. [Google Scholar] [CrossRef] [PubMed]
  23. Schloss, P.D.; Westcott, S.L.; Ryabin, T.; Hall, J.R.; Hartmann, M.; Hollister, E.B.; Lesniewski, R.A.; Oakley, B.B.; Parks, D.H.; Robinson, C.J.; et al. Introducing mothur: Open-Source, Platform-Independent, Community-Supported Software for Describing and Comparing Microbial Communities. Appl. Environ. Microbiol. 2009, 75, 7537–7541. [Google Scholar] [CrossRef] [PubMed] [Green Version]
  24. Ju, C.; Xu, J.; Wu, X.; Dong, F.; Liu, X.; Tian, C.; Zheng, Y. Effects of hexaconazole application on soil microbes community and nitrogen transformations in paddy soils. Sci. Total Environ. 2017, 609, 655–663. [Google Scholar] [CrossRef] [PubMed]
  25. Wang, Q.; Cheng, C.; He, L.; Huang, Z.; Sheng, X. Characterization of Depth-Related Changes in Bacterial Communities Involved in Mineral Weathering Along a Mineral-Rich Soil Profile. Geomicrobiol. J. 2014, 31, 431–444. [Google Scholar] [CrossRef]
  26. Li, X.; Zhao, L.; Adam, M. Biodegradation of marine crude oil pollution using a salt-tolerant bacterial consortium isolated from Bohai Bay, China. Mar. Pollut. Bull. 2016, 105, 43–50. [Google Scholar] [CrossRef] [PubMed]
  27. Ma, J.; Wang, S.; Xue, L.; Liu, D.; Zhu, X.; Ma, J.; Huang, C.; Yu, H.; Jiang, S. Research of the Impact of Elevated CO2 on Soil Microbial Diversity. Energy Procedia 2017, 114, 3070–3076. [Google Scholar] [CrossRef]
  28. Lepinay, C.; Mihajlovski, A.; Seyer, D.; Touron, S.; Bousta, F.; Di Martino, P. Biofilm communities survey at the areas of salt crystallization on the walls of a decorated shelter listed at UNESCO World cultural Heritage. Int. Biodeterior. Biodegrad. 2017, 122, 116–127. [Google Scholar] [CrossRef]
  29. Hirsch, P. Microbial life at extremely low nutrient levels. Adv. Space Res. 1986, 6, 287–298. [Google Scholar] [CrossRef]
  30. Rusznyák, A.; Akob, D.; Nietzsche, S.; Eusterhues, K.; Totsche, K.U.; Neu, T.R.; Frosch, T.; Popp, J.; Keiner, R.; Geletneky, J.; et al. Calcite Biomineralization by Bacterial Isolates from the Recently Discovered Pristine Karstic Herrenberg Cave. Appl. Environ. Microbiol. 2011, 78, 1157–1167. [Google Scholar] [CrossRef] [Green Version]
  31. Gao, P.; Sun, X.; Xiao, E.; Xu, Z.; Li, B.; Sun, W. Characterization of iron-metabolizing communities in soils contaminated by acid mine drainage from an abandoned coal mine in Southwest China. Environ. Sci. Pollut. Res. 2019, 26, 9585–9598. [Google Scholar] [CrossRef]
  32. Wang, Q.; Xie, Q.; He, L.; Sheng, X. The abundance and mineral-weathering effectiveness of Bacillus strains in the altered rocks and the soil. J. Basic Microbiol. 2018, 58, 770–781. [Google Scholar] [CrossRef]
  33. Jadhav, V.V.; Yadav, A.; Shouche, Y.S.; Aphale, S.; Moghe, A.; Pillai, S.; Arora, A.; Bhadekar, R.K. Studies on biosurfactant from Oceanobacillus sp. BRI 10 isolated from Antarctic sea water. Desalination 2013, 318, 64–71. [Google Scholar] [CrossRef]
  34. Radhakrishnan, R.; Baek, K.H. Physiological and biochemical perspectives of non-salt tolerant plants during bacterial interaction against soil salinity. Plant Physiol. Biochem. 2017, 116, 116–126. [Google Scholar] [CrossRef]
  35. Yanmis, D.; Orhan, F.; Gulluce, M.; Sahin, F. Biotechnological magnesite enrichment using a carbonate dissolving microorganism, Lactococcus sp. Int. J. Miner. Process. 2015, 144, 21–25. [Google Scholar] [CrossRef]
  36. Sofos, J.; Pierson, M.; Blocher, J.; Busta, F. Mode of action of sorbic acid on bacterial cells and spores. Int. J. Food Microbiol. 1986, 3, 1–17. [Google Scholar] [CrossRef]
  37. Ko, M.-S.; Cho, K.; Jeong, D.; Lee, S. Identification of the microbes mediating Fe reduction in a deep saline aquifer and their influence during managed aquifer recharge. Sci. Total Environ. 2016, 545–546, 486–492. [Google Scholar] [CrossRef]
  38. Govorukha, V.M.; Tashyrev, O.B. The regularities of iron compounds transformation by Citrobacter freundii MI-31.1/1. Mikrobiolohichnyi Zhurnal 2016, 78, 33–43. [Google Scholar] [CrossRef] [Green Version]
  39. Sen, S.K.; Jana, A.; Bandyopadhyay, P.; Das Mohapatra, P.K.; Raut, S. Thermostable amylase production from hot spring isolate Exiguobacterium sp: A promising agent for natural detergents. Sustain. Chem. Pharm. 2016, 3, 59–68. [Google Scholar] [CrossRef]
  40. Zhuzheng, C. Isolation and Identification of a Strain of Acid Tolerant Denitrifying Bacteria and Its Denitrification Characteristics; East China University of Technology: Nanchang, China, 2017. [Google Scholar]
Figure 1. Schematic diagram of experimental device (a) and high-pressure reactor (b).
Sustainability 13 05916 g001
Figure 2. The abundance of phyla before (a) and after (b) cultivation.
Sustainability 13 05916 g002
Figure 3. The changes of pH within 150 days.
Sustainability 13 05916 g003
Figure 4. The 16S rRNA gene copies over 150 days.
Sustainability 13 05916 g004
Figure 5. Relative abundances of dominant microbial phyla. Phyla with <0.2% abundance were included in ‘Others’ Initial: initial sample; A: CO2-NO2-microbe group; B: CO2-microbe group. 1: 30 day; 2: 60 day; 3: 90 day; 4: 120 day; 5: 150 day.
Sustainability 13 05916 g005
Figure 6. Relative abundances of microbial genera. Phyla with < 1% abundance were included in ‘Others’ Initial: initial sample; A: CO2-NO2-microbe group; B: CO2-microbe group. 1: 30 day; 2: 60 day; 3: 90 day; 4: 120 day; 5: 150 day.
Sustainability 13 05916 g006
Figure 7. Changes of Shannon index (a); Simpson index (b).
Sustainability 13 05916 g007
Figure 8. OTU-based PCA 3D map (a) and weighted UniFrac heatmap (b).
Sustainability 13 05916 g008
Table 1. The content of CO2 and impurity gas may mix in CO2 [10,13].
ComponentsCO2N2O2H2CH4
Mole fraction (%)Minimum750.020.040.060.7
Maximum9910544
ComponentsArSO2H2S + COSNOxCO
Mole fraction (%)Minimum0.005<0.00010.010.00020.0001
Maximum3.51.51.50.30.2
Table 2. The main composition of the reservoir saline in experiment.
Propertiesρ (mg/L)Propertiesρ (mg/L)
Ca2+1067.33SO42−46.28
Mg2+4.47NO372.67
K+76.42Cl5339.34
Na+2356HCO3520.26
Total Iron27.47TOC78
pH7.02
Table 3. The abundance of major genera and the quantity of 16S rRNA genes before and after cultivation.
PropertiesBefore CultivationAbundance (%)After CultivationAbundance (%)
The abundance of major generaThermodesulfovibrio49.36Thermodesulfovibrio70.84
Thermoanaerobacter22.12Thermoanaerobacter20.04
Bacillus3.84Exiguobacterium2.37
Moorella3.55Acinetobacter1.96
Pseudomonas3.15Citrobacter1.64
Exiguobacterium2.51Clostridium III0.58
Streptococcus2.23Pseudomonas0.57
Citrobacter2.05Desulfitobacterium0.40
Brevibacillus2.05Brevibacillus0.33
Acinetobacter1.63Moorella0.26
Clostridium III1.56Bacillus0.04
Enterococcus1.02Enterococcus0.02
Others4.93Others0.95
16S rRNA
gene copies
2.67 × 10⁵ ± 0.73 × 10⁵ copies/mL8.89 × 107 ± 0.80 × 10⁷ copies/mL
Table 4. Abundance and characteristics of the dominant bacterial genera at 30 and 60 days.
Time (Days)Phylum—GeneraAbundance %Identity (Similarity %): Characteristics in Refs.
CO2-NO2CO2
30-dayProteobacteria-Burkholderia80.6040.53B. spp. (98%): acid-tolerant, dissolution [25]
Proteobacteria-Brevundimonas<1.023.01B sp. (97%): acid and salt-tolerant [26]
Proteobacteria-sphingomonas7.9119.06S.alaskensis (99%): acid and salt-tolerant [27,28]
Proteobacteria-Caulobacter8.693.10C. spp. (97%): salt-tolerant [29]
60-dayProteobacteria-Burkholderia32.4122.97B. spp. (98%): acid-tolerant, dissolution [25]
Proteobacteria-phingomonas24.9620.32S.alaskensis (99%): acid and salt-tolerant [27,28]
Proteobacteria-Stenotrophomonas12.719.48S. maltophilia (98%): acid-tolerant [30,31]
Table 5. Abundances and characteristics of dominant genera after 90 days.
TimePhylum—GeneraAbundance %Identity (Similarity %): Characteristics in Refs.
CO2-NO2CO2
90-dayFirmicutes-Bacillus42.4040.85B. cereus (99%): Resistant to acid, dissolution [32]
Firmicutes-Oceanobacillus30.5512.30O. sp. (97%): Resistant to severe stress and acid [33,34]
Firmicutes-Lactococcus12.6432.95L. sp. (99%): acid-producing [35]
Table 6. Abundances and characteristics of the dominant genera from day 120 to day 150.
TimePhylum—GeneraAbundances %Identity (Similarity %): Characteristics in Refs.
CO2-NO2CO2
120-dayProteobacteria-Citrobacter40.1727.43C. freundii (99%): Fe(III) reduction [37,38]
Firmicutes-Exiguobacterium21.9736.78E. sp. (99%): Dissolution [39]
Proteobacteria-Pseudomonas20.6610.64P. aeruginosa (99%): Denitrification [40]
Firmicutes-Acinetobacter6.1316.49A. soli (97%): Dissolution [15]
Firmicutes-Bacillus3.823.00B. cereus (98%): Dissolution [32]
150-dayProteobacteria-Citrobacter42.1626.97C. freundii (99%): Fe(III) reduction [37,38]
Firmicutes-Exiguobacterium22.0439.08E. sp. (99%): Dissolution [39]
Proteobacteria-Pseudomonas15.549.92P. aeruginosa (99%): Denitrification [40]
Firmicutes-Acinetobacter10.1516.50A.soli (97%): Dissolution [15]
Publisher’s Note: MDPI stays neutral with regard to jurisdictional claims in published maps and institutional affiliations.

