Article

Optimized High-Performance Liquid Chromatography Method for Determining Nine Cytokinins, Indole-3-acetic Acid and Abscisic Acid

1
Guangxi Key Laboratory of Functional Phytochemicals Research and Utilization, Guangxi Institute of Botany, Guangxi Zhuang Autonomous Region and Chinese Academy of Sciences, Guilin 541006, China
2
National Key Laboratory of Crop Genetic Improvement, MOA Key Laboratory of Crop Ecophysiology and Farming System in the Middle Reaches of the Yangtze River, Huazhong Agricultural University, Wuhan 430070, China
3
College of Tropical Crops, Hainan University, Haikou 570228, China
4
Department of Agronomy, University of Haripur, Haripur 22620, Pakistan
*
Authors to whom correspondence should be addressed.
These authors equally contributed to this work.
Sustainability 2021, 13(13), 6998; https://0-doi-org.brum.beds.ac.uk/10.3390/su13136998
Submission received: 6 May 2021 / Revised: 14 June 2021 / Accepted: 19 June 2021 / Published: 22 June 2021

Abstract

:
Liquid-liquid extraction and solid phase extraction followed by high-performance liquid chromatography (HPLC) connected with ultraviolet (UV) detection were used for the determination of phytohormones. The parameters influencing the performance of the HPLC-UV method, including composition of the mobile phase for gradient elution, column temperature, flow rate, and detection wavelength, were optimized. This method can simultaneously determine 11 phytohormones, including nine cytokinins, indole-3-acetic acid, and abscisic acid. The limit of detection of this method is 0.22 to 1.1 µg L−1, and the coefficient factors of linear regression are >0.998. The recoveries of the target phytohormones ranged between 62.1~109.4%, and the relative standard deviations were <10%. This method is suitable for determining phytohormones, especially cytokinins, in young panicles, roots, and xylem sap of rice plants.

1. Introduction

Cytokinins (CTKs) are adenine derivatives carrying either an isoprene-derived or an aromatic side chain at the N6 terminus [1]. Accordingly, CTKs are divided into two families: isoprenoid CTKs and aromatic CTKs. Isoprenoid CTKs can be subdivided into four groups: (i) nucleotides, the precursors of ribosides including trans-zeatin riboside 5′-monophosphate (tZMP), dihydrozeatin riboside 5′-monophosphate (diZMP) and isopentenyladenine riboside 5′- monophosphate (iPMP); (ii) ribosides, the major translocation forms including trans-zeatin riboside (tZR), dihydrozeatin riboside (diZR), and N6-(Δ2-isopentenyl) adenosine riboside (iPA); (iii) free CTK-bases, the major active forms including trans-zeatin (tZ), dihydrozeatin (diZ), and N6-(Δ2-isopentenyl) adenine (iP); and (iv) glucosides, the inactive, stable storage forms, such as trans-zeatin 9-glucoside (tZ9G) and isopentenyladenine 9-glucoside (iP9G) (Figure S1). Aromatic CTKs, which are quite enigmatic and thus far have been confirmed in only a few species, contribute little to the total CTK pool [2].
Acting as ‘master regulators’ of multiple physiological processes [3], CTKs regulate plant development, physiological processes such as stomatal conductance, leaf senescence, and protective response to biotic and abiotic stresses by interacting with other phytohormones. While there is extensive crosstalk between CTK and indole-3-acetic acid (IAA), abscisic acid (ABA) and so on, it is recognized that CTKs are the most active substance in hormonal crosstalk networks [4]. Thus, it is important to quantify multiple phytohormones simultaneously to clarify the mechanism underlying the regulatory role of phytohormones in crop development and plant tolerance to environmental stresses. Phytohormones are found in trace quantities in plants and may be disrupted by interference from substances in extracts. Methods with high selectivity are required for enriching these phytohormones and methods with high sensitivity are required for quantifying them. The methods enzyme-linked immunosorbent assay (ELISA) [5], gas chromatography (GC) [6], high-performance liquid chromatography (HPLC) [7], and high-performance liquid chromatography-tandem mass spectrometry (HPLC-MS) [8], have been developed for quantifying phytohormones.
HPLC has previously been used for CTK quantitative analysis due to its fast and high efficiency separation [9,10]. Currently, HPLC-UV is still adopted for the determination of phytohormones due to its higher reliability compared with ELISA and GC, as well as its lower cost compared with HPLC-MS [11,12,13]. However, there are few new/improved methods using HPLC-UV to determine multiple phytohormones, with a particular emphasis on CTKs since the 2010s [9] due to the popularization of the sophisticated and yet high-cost HPLC-MS [14,15]. Previously, Lu et al.’s [9] method detected only six CTKs in rice samples using HPLC-UV, whereas the method by Chou et al. [10], which is somewhat complex and not validated in rice plants, determined eight CTKs based on HPLC and GC-MS spectra in Phalaenopsis leaves. The objective of the current study was to develop an improved method for simultaneously determining multiple phytohormones emphasizing CTKs using HPLC-UV.

2. Materials and Methods

2.1. Instruments and Reagents

The following instruments were used in this study: HPLC-UV system coupled to an ultraviolet-spectrum detector (Agilent 1200 LC, Agilent, Santa Clara, CA, USA); chromatographic separation: WondaCract ODS-2 C18 column (4.6 mm × 250 mm, 5 µm; Shimadzu, Kyoto, Japan); freeze-dryer (ALPHA 1-4 LD PLUS, Marin Christ, Osterode am Harz, Germany); reverse-phase C18 cartridge (Sep-Pak C18, Waters Associates, Inc., Milford, MA, USA); and Agela 0.22-µm nylon syringe filters (Fisher Scientific, Pittsburgh, PA, USA).
The following reagents were used in this study: standards of tZ9G, tZ, diZ, tZR, diZR, iPMP, iP, iPA, and iP9G were produced from Olchemi (OlChemIm Ltd., Olomouc, Czech Republic); standards of ABA and IAA were from Sigma (St. Louis, MO, USA); methanol, n-butanol, ethyl acetate, acetic acid, formic acid, and all of the chromatographic-grade solvents were obtained from Tedia (Fairfield, OH, USA).

2.2. Plant Materials and Samples

We used the same plant materials and samples as the ones reported in our previous study [13,16]. Rice varieties (Oryza sativa L., Nagina22 and Huanghuazhan) were pot-grown under natural conditions. At the formation stage of pollen mother cells, at which point the panicle length was approximately 1.5~2.0 cm, young panicles of the main tillers were collected from rice plants grown in three pots. The young panicles were immediately snap-frozen in liquid nitrogen and stored at −80 °C until analysis.
Next, xylem sap from the same rice plants was collected. Each plant was cut at an internode approximately 8 cm above the soil level at 19:00. To avoid contamination, we manually cleared dead leaf sheathes in stubbles and removed the first droplet of exudation during the first 30 s, before collection of xylem sap. Polyethylene bags (140 mm × 100 mm) containing cotton wool (6.0~7.0 g) were attached to the top of each of the decapitated stems and fixed with rubber bands. The cotton wool with exudates was collected at 07:00 the next day. The difference in weight of the cotton wool was the weight of the root exudates collected over 12 h. The density of the solution was 1.0 g mL−1.
Finally, roots were preliminarily washed with tap water and rinsed thoroughly with deionized water, and fresh white roots were collected. The collected roots and exudates were stored at −80 °C and used for phytohormone determination. The use of all plants in the present study complied with international, national, and/or institutional guidelines.

2.3. Extraction and Purification

2.3.1. Sample Preparation

The simplified procedures of sample preparation have been reported in our previous studies [13,16]. In detail, frozen samples of roots and panicles were cut into pieces and mixed thoroughly. Next, 1.0 g of tissue was ground using 8 mL of modified Bieleki’s solvent (methanol: double-distilled H2O: formic acid, 15:4:1) [17] in ice bath under dim light conditions. Homogenates were transferred to 10-mL centrifuge tubes, incubated at 4 °C for 12 h, and centrifuged at 12,000× g at 4 °C for 20 min. The supernatants were then collected and the pellets were subjected to phytohormone extraction twice using the method described above (e.g., 8 mL of extraction buffer followed by centrifugation). All of the collected supernatants were pooled and condensed to 2 mL using a freeze-dryer, and 2 mL of petroleum ether was then added to extract pigments and phenolics. This extraction was repeated thrice. After removing the upper organic phases (petroleum ether) containing phenolics and pigments, the lower aqueous phase was freeze-dried, and 3 mL of sodium acetate (1 mol L−1, pH 8.0) was used to resuspend the samples as crude extracts for phytohormone determination.
To extract phytohormones from root exudates, 10 mL of xylem sap was collected in a centrifuge tube by extruding the cotton wool in which the xylem sap was collected. The collected xylem sap was centrifuged at 12,000 g at 4 °C for 20 min, and 8 mL of the supernatant was then collected and freeze-dried. Next, the sample was resuspended using 3 mL of sodium acetate (1 mol L−1, pH 8.0). These solutions were designated as crude extracts for the determination of phytohormones.
For further phytohormone extraction, the crude extract (3 mL) was extracted with 1-butanol (3 mL) thrice, and the upper organic phases (1-butanol) containing the CTKs were then collected and pooled together for CTK measurement. The lower aqueous phase was adjusted to pH 3.0, and extracted with ethyl acetate (3 mL) thrice. The upper organic phases (ethyl acetate) were collected and pooled as the mixture of IAA and ABA.
All collected upper organic phases were pooled and freeze-dried for simultaneous determination of multiple phytohormones. The obtained residues by freeze-drying were dissolved in 5 mL of methyl alcohol and purified by a C18-SepPak cartridge. The purified samples were freeze-dried and dissolved with 0.8 mL of methyl alcohol. This reconstituted eluate was filtered through a 0.22-µm nylon filter before sample injection. The injection volume was 20 µL.

2.3.2. Optimization of HPLC-UV Conditions

Standards of phytohormones were subjected to HPLC-UV. A multistep linear gradient elution of 45 min was performed. The solutions used for elution included methanol, double-distilled H2O, and 4.5% acetic acid solution. The protocol used for gradient elution was tested. The flow rate, column temperature, and detection wavelength for HPLC analysis were optimized by performing the elution method at flow rates of 1.5 mL min−1, 1.6 mL min−1, and 1.7 mL min−1, with column temperatures of 35 °C, 40 °C, 45 °C, and 50 °C, and UV detection wavelengths of 254 nm and 269 nm [18].

2.3.3. Method Validation

The method was validated by determining a series of parameters, such as linearity, precision, limits of detection, recovery, and chromatographic parameters (theoretical plates, tailing factor, capacity factor, and resolution). The calibration standards were mixed in a phytohormone standard solution containing tZ9G, tZ, diZ, tZR, diZR, iPMP, iP, iPA, iP9G, IAA, and ABA. The calibration standards were prepared at concentrations of 5.7, 8.5, 11.4, 45.6, 91.1, and 182.3 ng mL−1 for each hormone standard in the mixed standard solution of 11 compounds. Standard calibration curves were determined three times, after which a standard curve was calculated for each compound. The intra-day precision and inter-day precision were demonstrated by assaying four replicate injections of the phytohormone standards on the same day at different times and on different days, respectively. The relative standard deviations (RSD %), which were calculated according to the retention time and peak areas of the four replicate injections, were used to express the precision of the method. The limits of detection were estimated by the baseline noise method at the signal-to-noise ratio of 3. The chromatographic parameters viz., theoretical plates, tailing factor, capacity factor, and resolution, were observed/calculated according to Bose [19]. To evaluate the recovery of phytohormone extraction, another one-gram sample of panicle tissue was ground with 150 ng of each internal standard mentioned above. The recovery was calculated by comparing the results of a plant tissue sample with internal standard referred to the other sample without phytohormone standards.

3. Results and Discussions

3.1. Mobile Phase Elution Optimization

In our preliminary experiment, it was observed that tZ9G, tZ, and diZ were hard to separate; tZR, diZR, and iPMP were eluted at the same time; and iPA and ABA had the same peak time (Figure S2) when the elution method was adopted according to Chou et al. [10], whose 35-min mobile phase was a linear gradient starting from 0% methanol and ending with 35% methanol during 0~20 min, followed by an isocratic elution at 35% methanol for an additional 15 min at a flow rate of 1.6 mL min−1 throughout the elution phase (Table S1).
In the present research, we first modified the mobile phase based on Chou et al. [10] to improve the separation of phytohormones. The elution process in our improved method was performed for 45 min. Specifically, methanol and ddH2O were used as the mobile phase for elution from 0~24 min, while methanol and acetic acid (4.5%) were used as the mobile phase for elution from 25~34 min, and ddH2O was used as the stationary phase for elution from 35~45 min (Table 1). From 0~17 min, when the linear gradient started at 0% methanol and ended with 35% methanol, as used in Chou et al.’s [10] research, the peaks of tZ9G and tZ showed the phenomenon of trailing (Figure S2). When the linear gradient began with 0% methanol and ended with 30% methanol, the peaks of tZ9G, tZ, and diZ were separated completely (Figure 1). When the linear gradient starting from 0% methanol and ending with 25% methanol was applied, we observed overlapping peaks in tZ9G and tZ. We thus used a linear gradient starting from 0% methanol and ending with 30% methanol during the 0~17 min period to ensure there were no overlap or tailing evolution curves. Additionally, the appearance time of the peak of the first target phytohormone tZ9G was 14.8 min, thus avoiding the interference of some high polarity impurities that are eluted from 0~10 min (Figure 1).
Isocratic elution has the advantage of maintaining a stable column pressure. An isocratic elution at 35% methanol for an additional 15 min was performed to separate the peaks from other CTKs in Chou et al.’s [10] study. However, when isocratic elution at 35% methanol (Table S2) was adopted, the peaks of tZR, diZR, and iPMP showed the same retention time, the peaks of IAA and iP9G could not be separated, and iPA and ABA had overlapping peaks (Figure S3). Thus, an isocratic elution at 40% methanol (Table S3), which was used in another study [9], was used to separate various CTKs in rice samples (Figure S4). In this study, we improved the elution from 20 min to 45 min based on the previous studies of Chou et al. [10] and Lu et al. [9]. In our preliminary experiment, isocratic elution at 40% methanol (Table S3) could separate the peaks of tZR, diZR, iPMP, IAA, and iP9G but was not able to separate the peaks of iPA and ABA (Figure S4).
Because the reduced pH of the mobile phase (Table S4) could advance the retention time of phytohormones (Figure S5), methanol and acetic acid were thus used as mobile phases for elution from 25~34 min to improve the separation of iPA and ABA. To determine the optimal acetic acid concentration for elution, we tested 0.6%, 2.0%, 3.0%, and 4.5% acetic acid (Tables S3–S7) and found that concentrations with less than 4.5% acetic acid did not completely separate iPA and ABA (Figures S6 and S7), while 4.5% acetic acid used as mobile phase obtained good separation of iPA and ABA (Figure S8). Considering the reduced stability of the column and the need for extension of the equilibrium time due to high acetic acid concentrations, the performance of concentration of acetic acid that higher than 4.5% were not tested. Methanol and 4.5% acetic acid were used as the mobile phases with 25~34 min of elution. Thus, isocratic elution with 35% methanol was performed over 25~34 min. Finally, 100% ddH2O was used to wash the channel and restore the initial state.

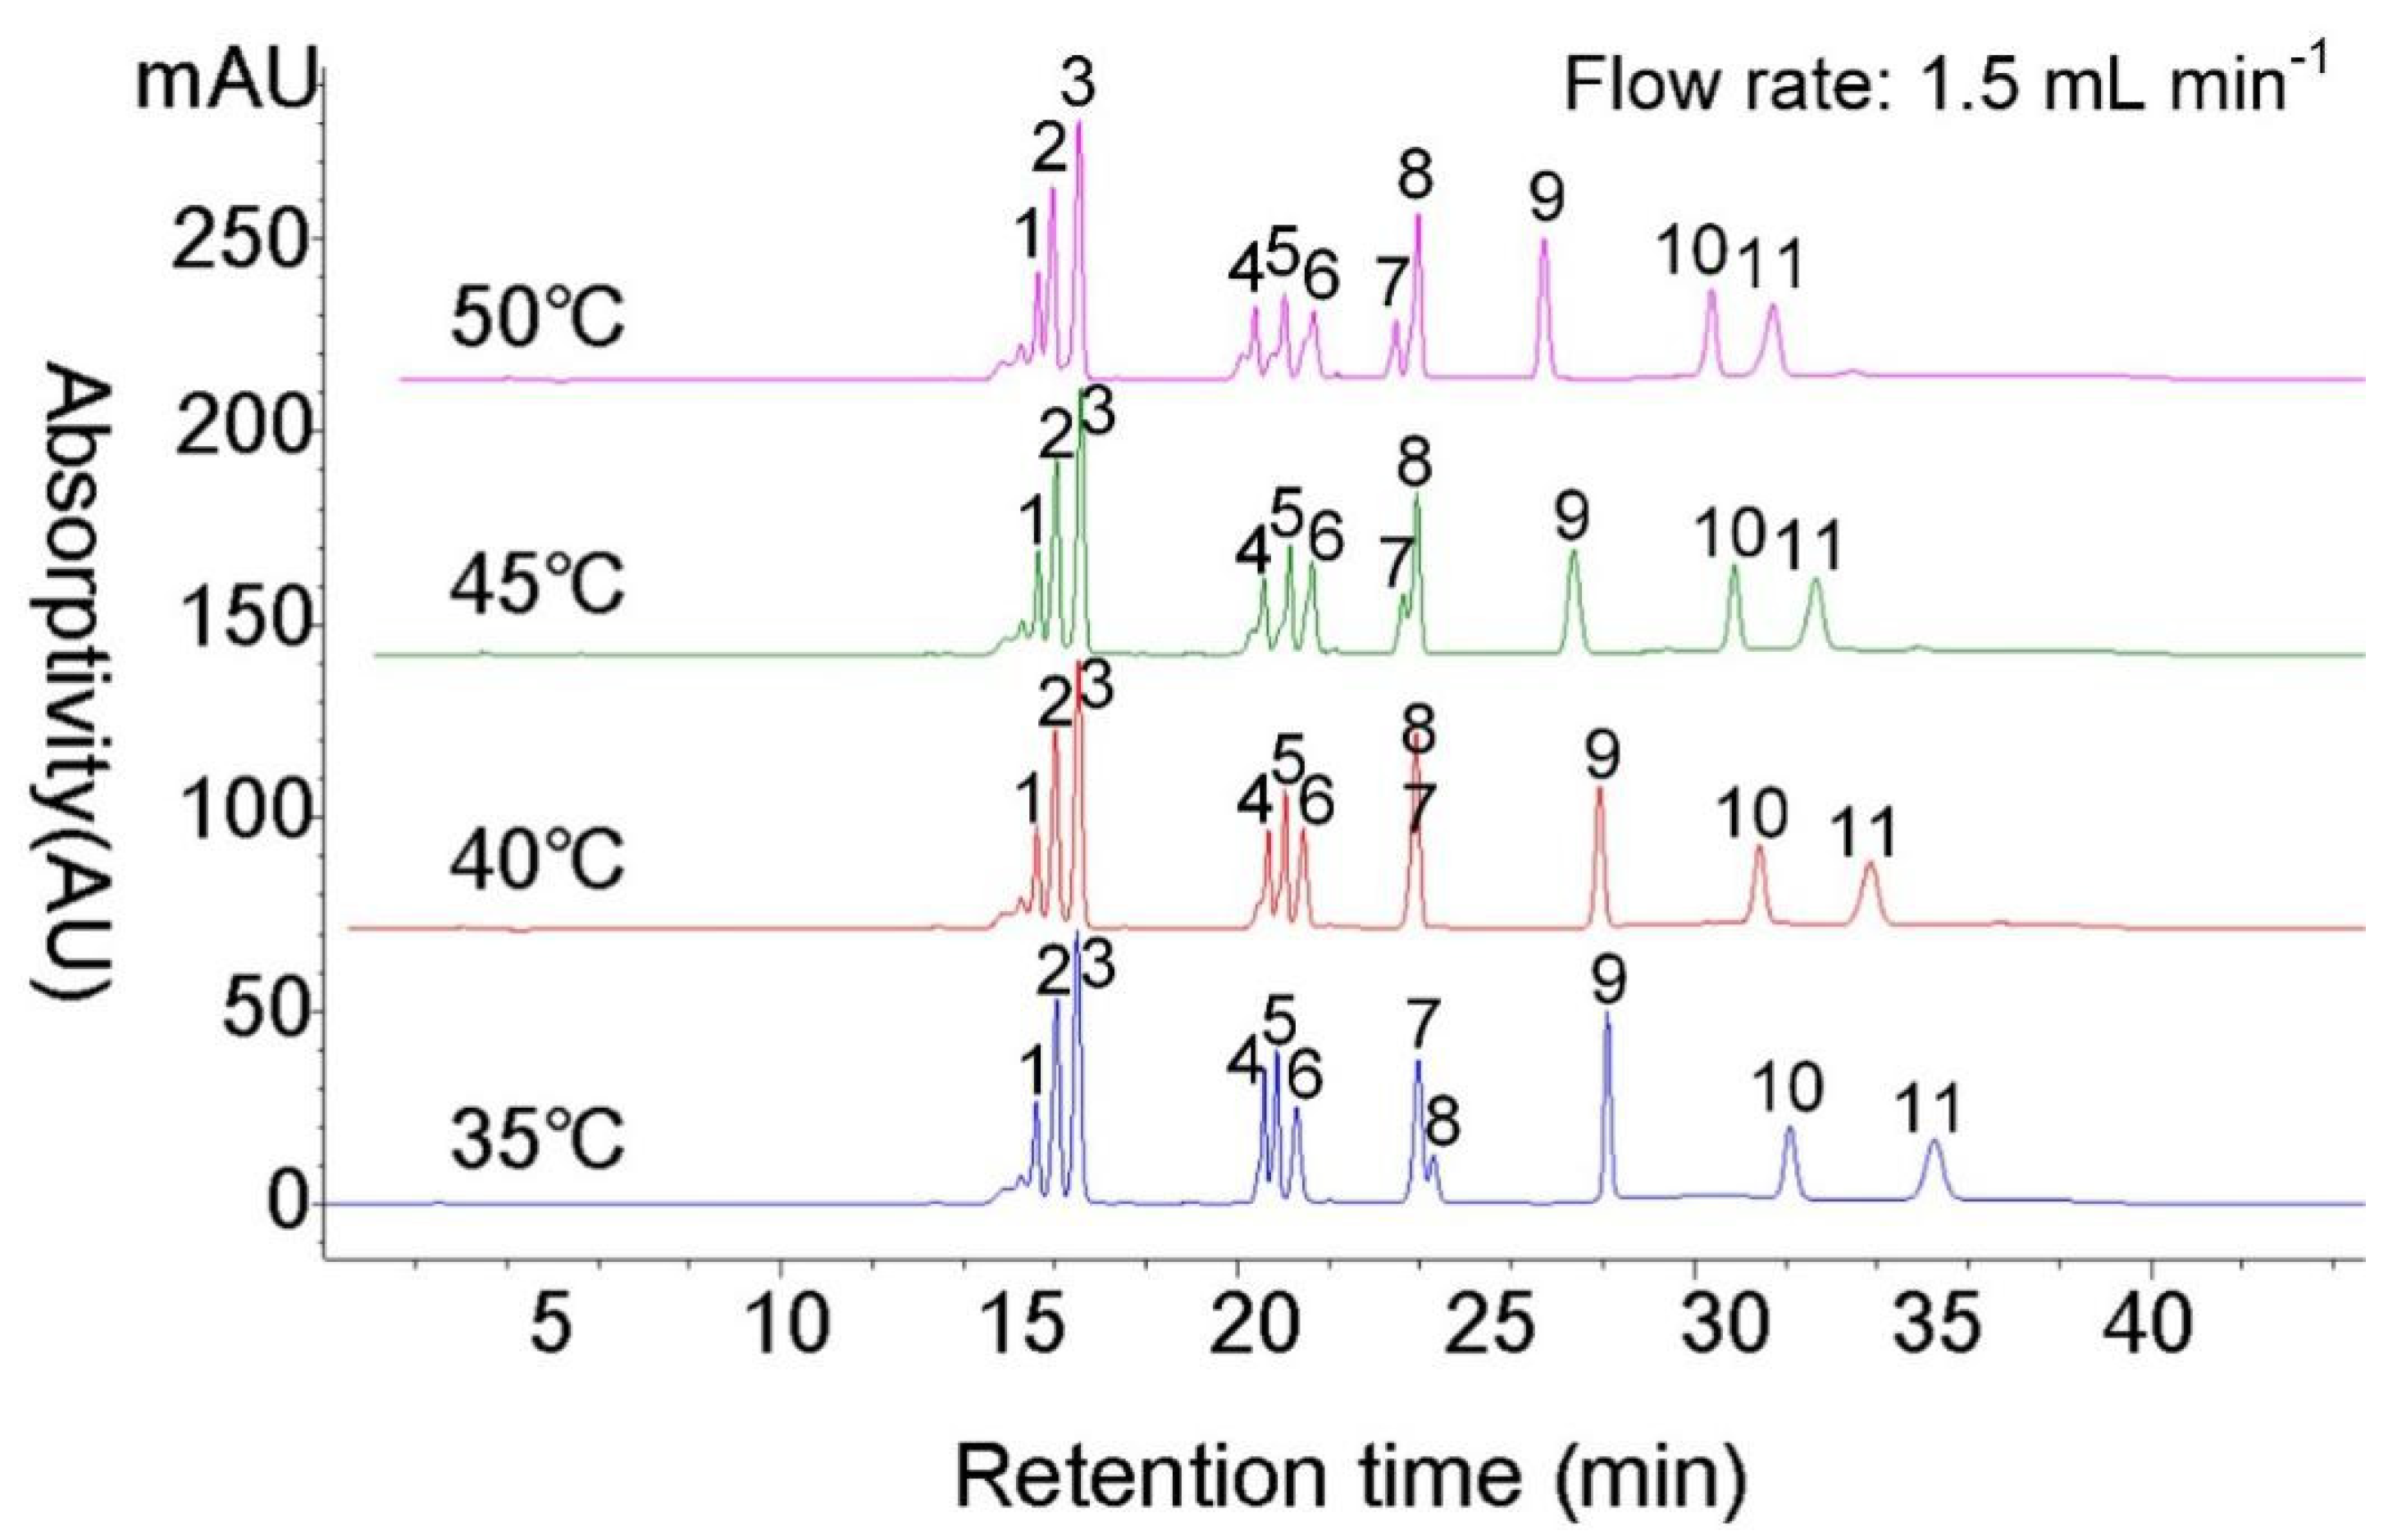
3.2. Optimizing the Column Temperature

Column temperature, which affects the peak appearance of CTKs, was not considered in Chou et al.’s [10] study. The optimal column temperature can improve the accuracy of the results of determination by improving the peak appearance. In the present study, we evaluated the performance of peak appearance at four column temperatures (35 °C, 40 °C, 45 °C, and 50 °C). At a flow rate of 1.5 mL min−1, peaks of IAA and iP9G showed overlapping tailing under column temperatures of 35 °C and 45 °C and could not be separated under a column temperature of 40 °C, and peaks of all of the target phytohormones were clearly separated under a column temperature of 50 °C (Figure 1). At a flow rate of 1.6 mL min−1, peaks of IAA and iP9G showed overlapping tailing under column temperatures of 35 °C and 40 °C, and all of the target phytohormones were clearly separated under column temperatures of 45 °C and 50 °C (Figure 2). Higher column temperatures had adverse effects on the efficiency of chromatographic separation and the life of chromatographic columns, but lower column temperatures induced high column pressure (Figure S9). Thus, a column temperature of 45 °C resulted in the best chromatogram under our optimized mobile phase elution.

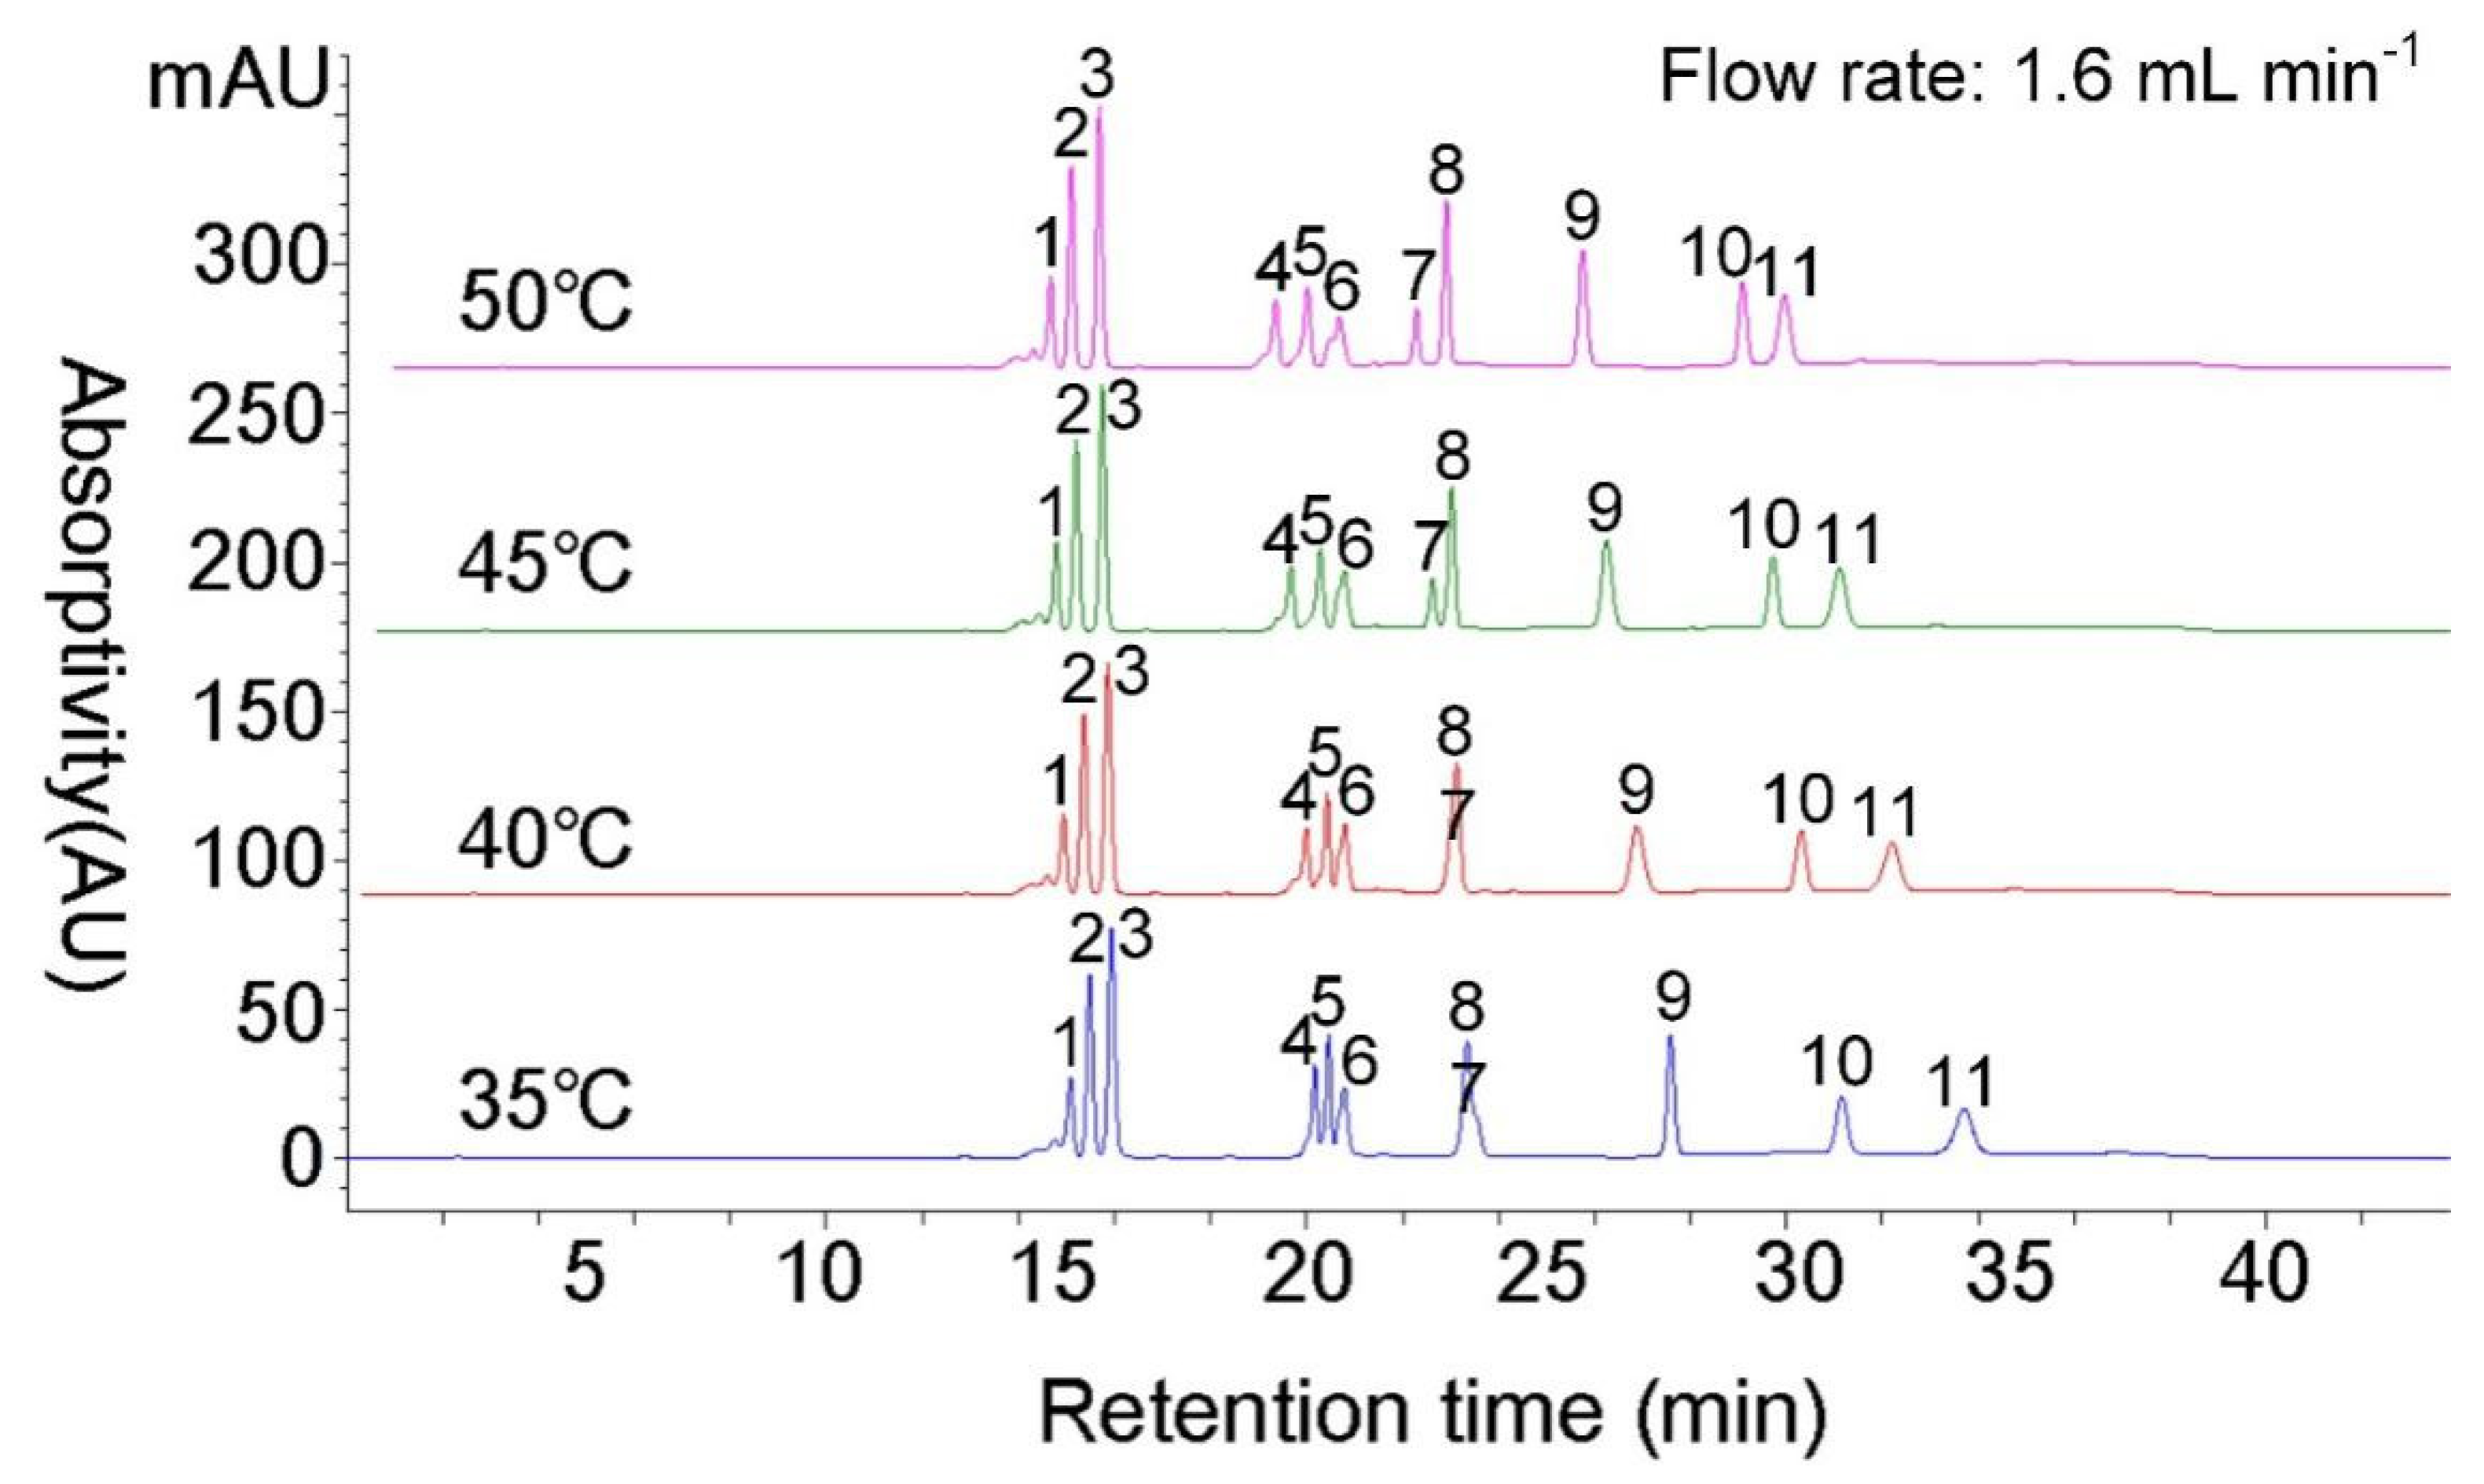
3.3. Flow Rate Optimization

To optimize the flow rate, chromatograms at three flow rates: 1.5 mL min−1, 1.6 mL min−1, and 1.7 mL min−1, were evaluated under a column temperature of 45 °C. The retention time of iPA and ABA was advanced as the flow rate increased. Peaks of IAA and iP9G showed overlapping tailing at a flow rate of 1.5 mL min−1. Peaks of the target phytohormones were clearly separated at flow rates of 1.6 mL min−1 and 1.7 mL min−1 (Figure 3). However, a higher flow rate induced increased column pressure. A flow rate of 1.6 mL min−1 was finally used in our method.

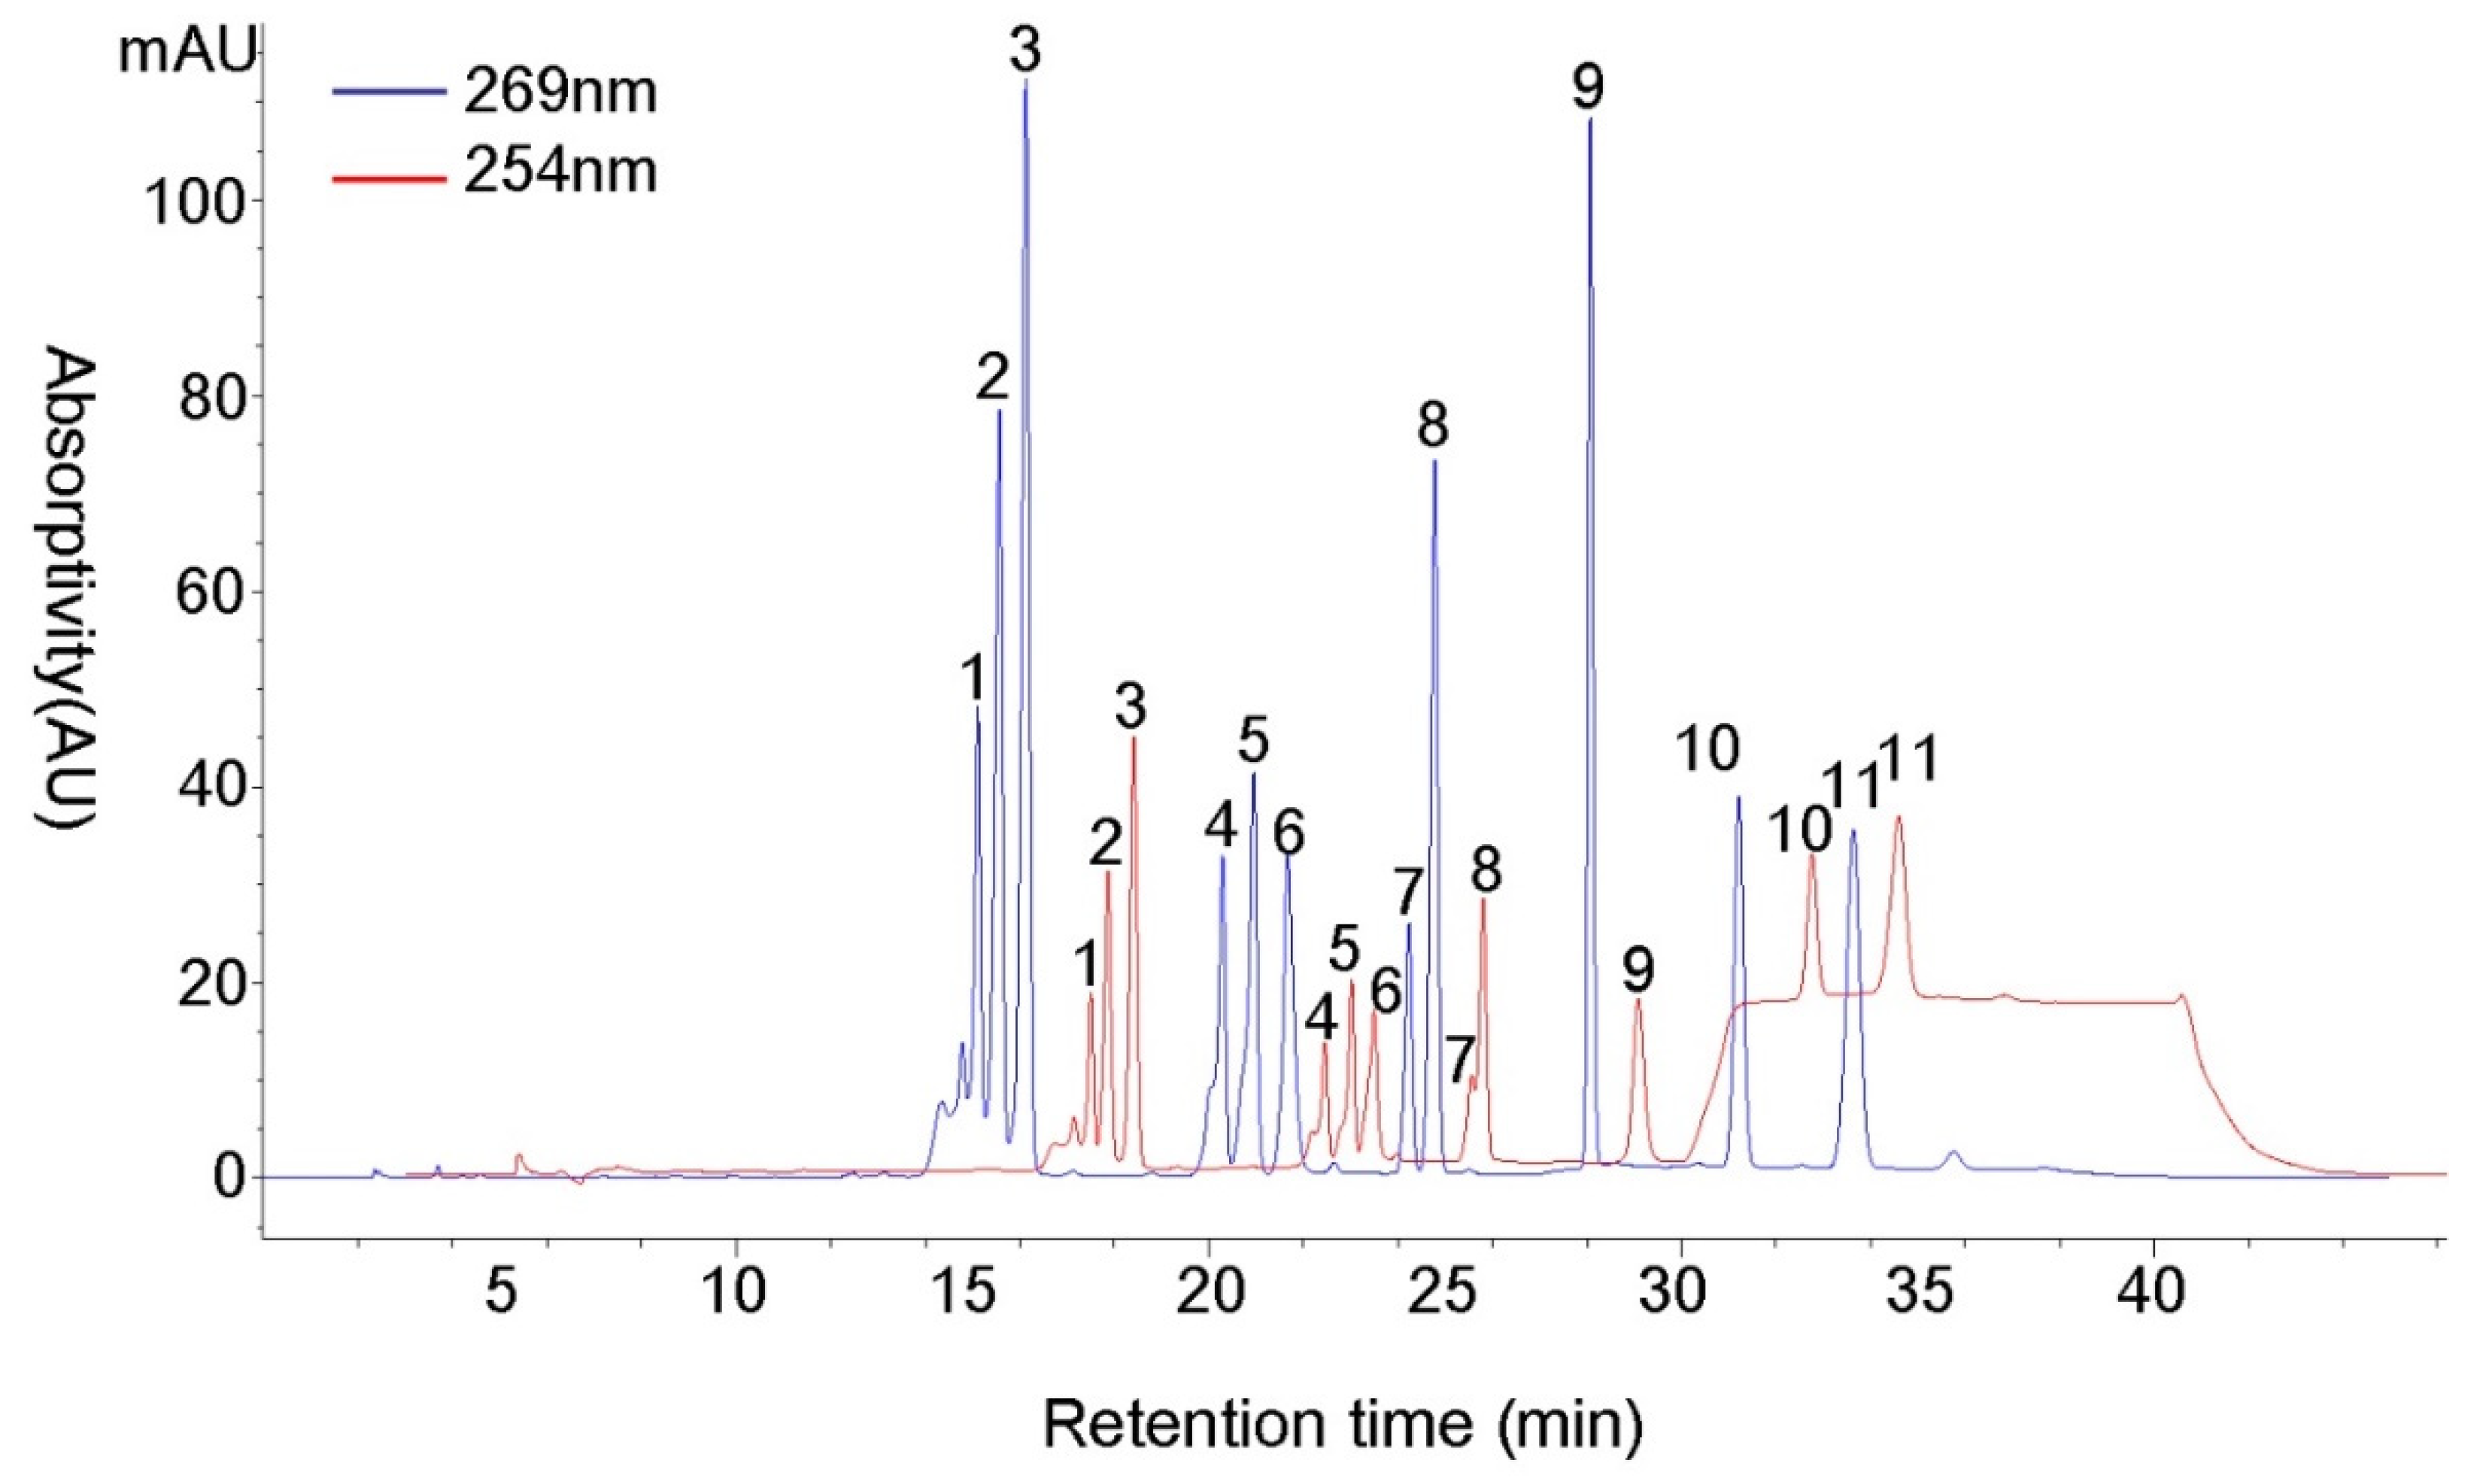
3.4. UV Conditions Optimization

CTKs are adenine derivatives at the N6 terminus, and the purine ring has strong absorbability at a UV light range of 250~280 nm [20]. In most previous studies, CTKs were quantified by detecting UV absorption at 254 nm [21] or 269 nm [9]. We evaluated the performance of chromatograms under UV light at 254 nm and 269 nm. Under our optimized mobile elution, a column temperature of 45 °C and a flow rate of 1.6 mL min−1, phytohormones had a stronger absorbability (Figure 4) and lower limit of detection (Figure S10) at 269 nm than at 254 nm. A UV wavelength of 269 nm was finally adopted for our methods.

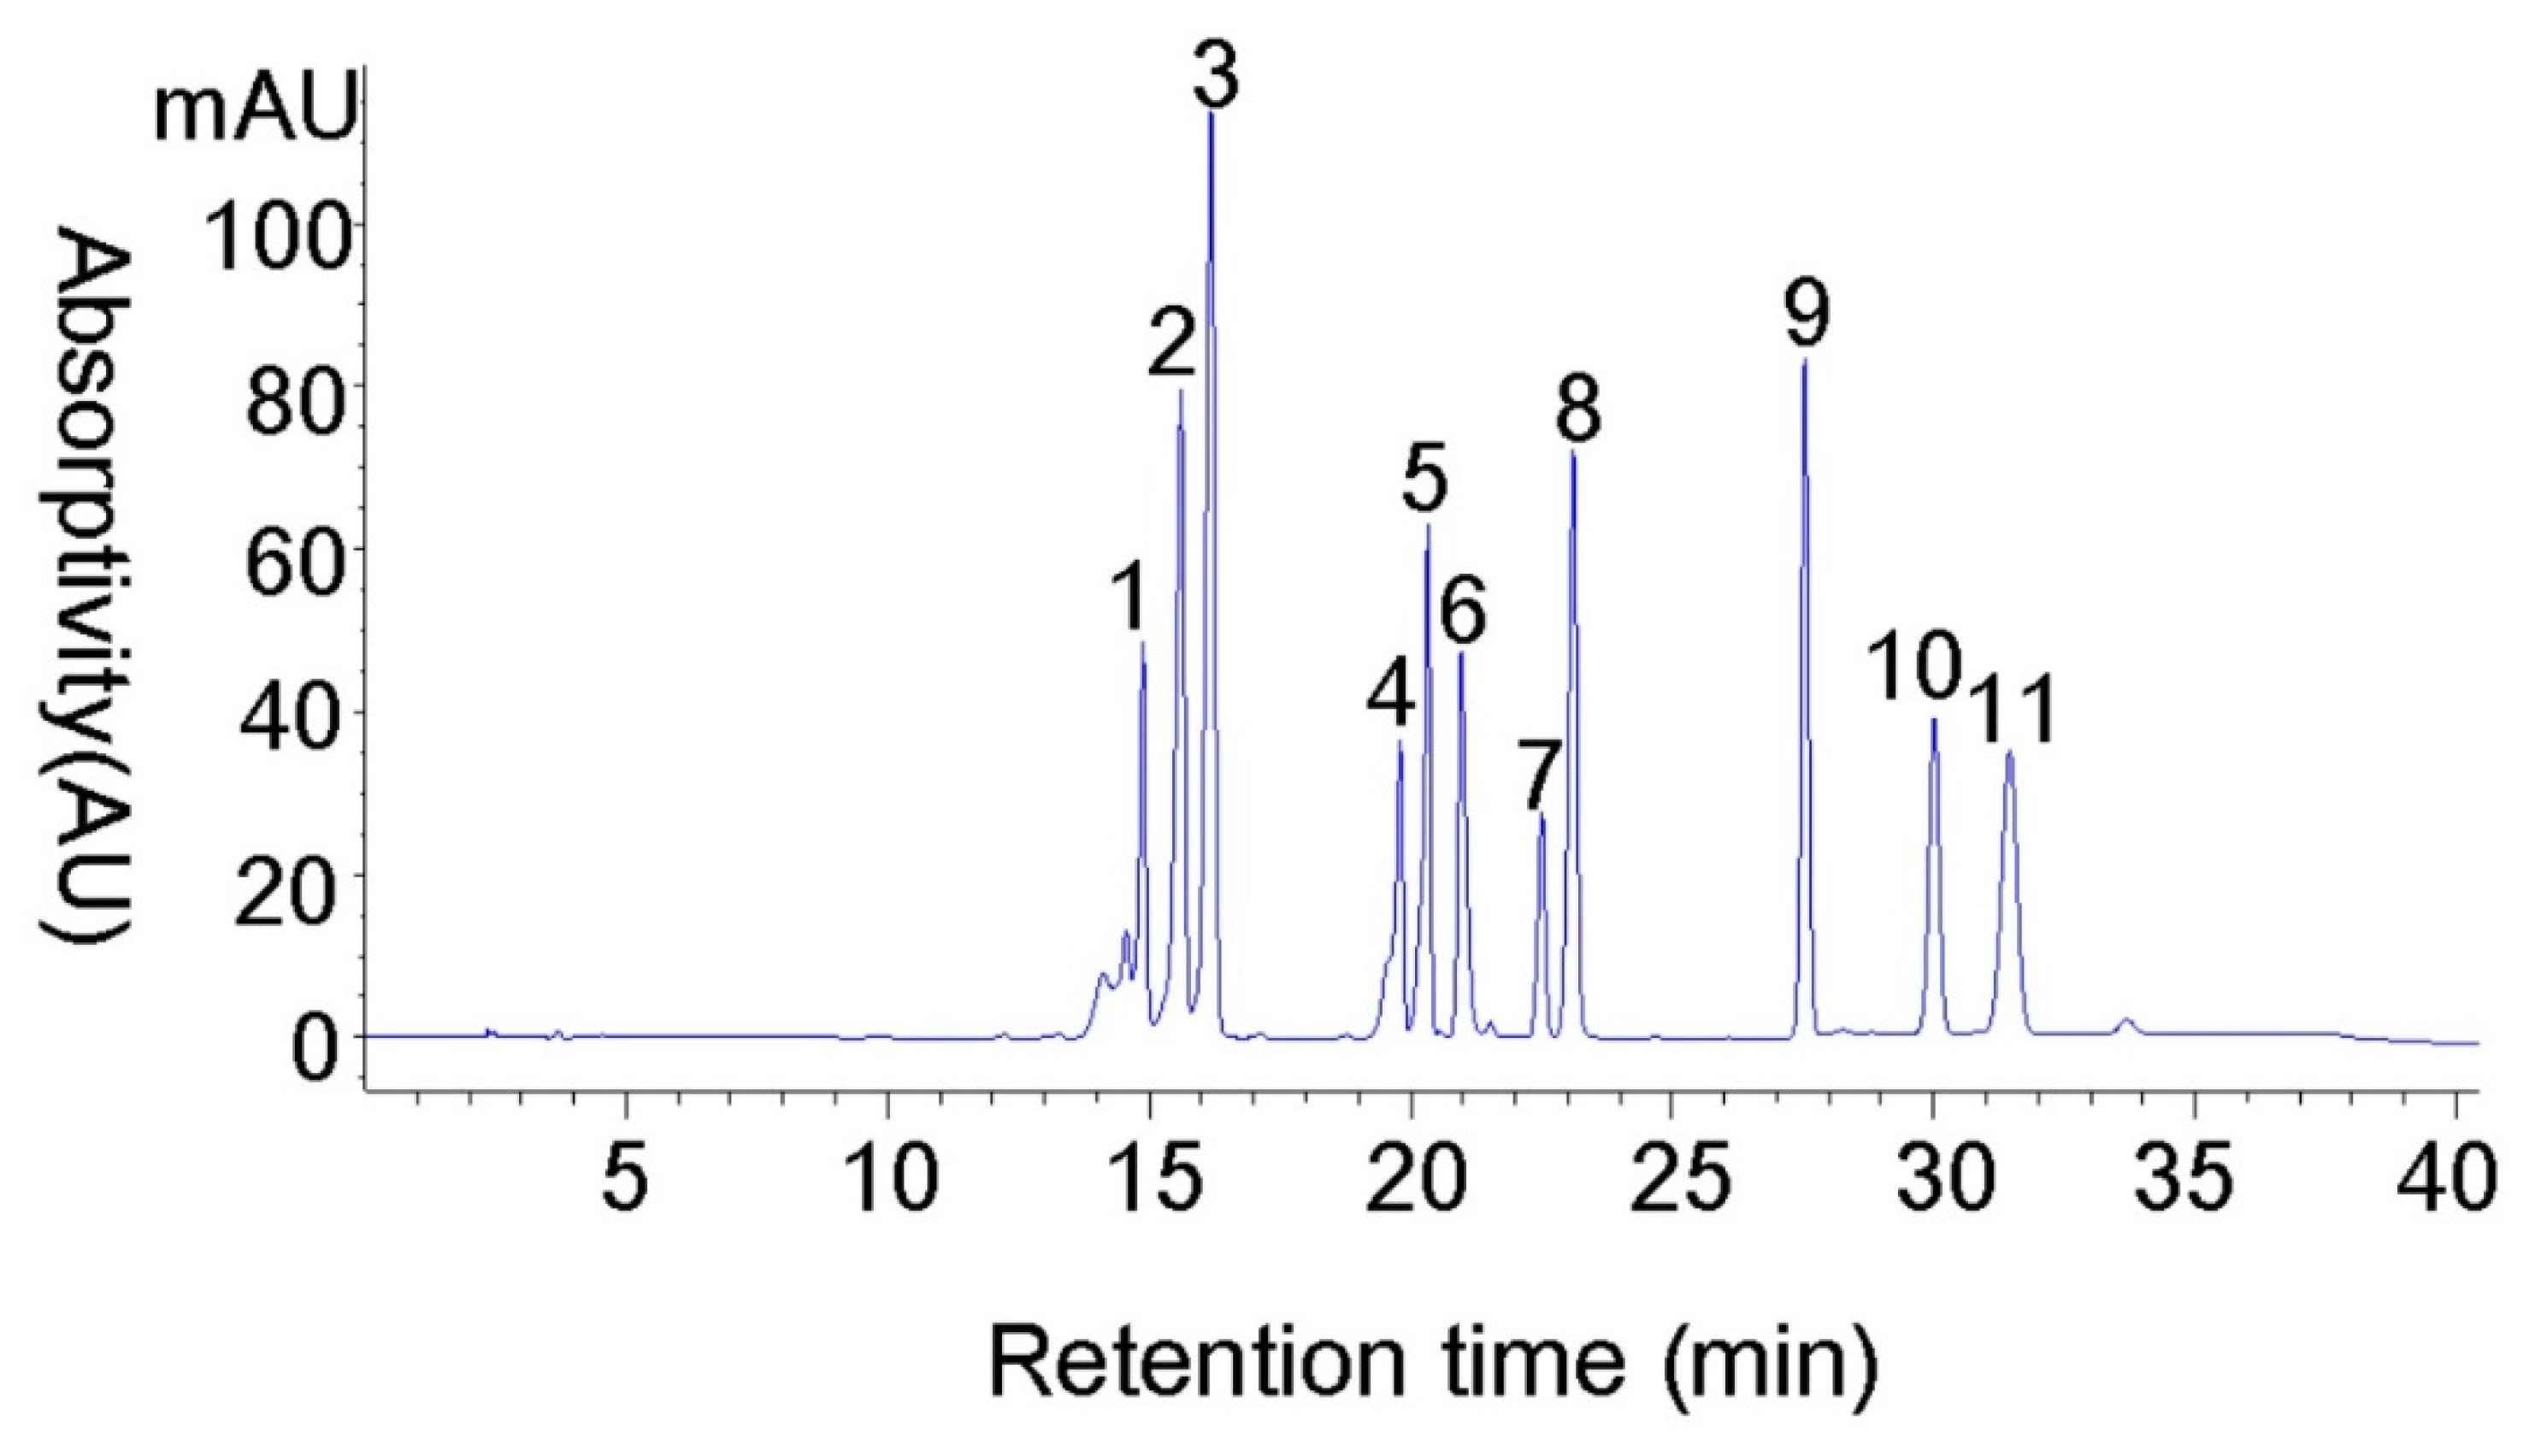
3.5. Method Validation

Chromatograms of single and mixed standards of phytohormones (Figure 5) were obtained under established optimal conditions (the extraction and purification method in Figure S11; elution method in Table 1; column temperature of 45 °C, flow rate of 1.6 mL min−1, UV detection at 269 nm) as discussed above. The retention time of a certain phytohormone of the eleven mixed standards was identified according to the chromatogram of single standards. Solutions of mixed standards of phytohormones were used to create calibration curves. The linearity, limit of detection, and recovery of the phytohormone standards are shown in Table 2. The limited detection of the eleven target phytohormones ranging from 0.22 to 1.1 µg L−1 for all the analytes demonstrated that this method was sensitive. Calibration was carried out by three independent injections. The recoveries of the target phytohormones were in the range of 62.1~109.4%. The precision was acceptable, with most RSDs <3% except for individual peak area of intra-day (Table 3). The system suitability parameters are presented in Table S8, where the selectivity, column efficiency, resolutions, and tailing factor were well within the acceptance criteria (resolutions > 2.0 general; tailing factor ≤ 2.0; column efficiency > 2000 plate count) [19], which suggested a good efficiency of the column.
Structural parameters such as Log P and pKa values, which are constant for a given compound [22], can be referred to for choosing the proper mobile phase elution and chromatographic column during the course of chemical analysis using HPLC. We regret not determining the structural parameters, but the elution method and chromatographic column adopted in the present study should be practicable, as supported by the fact that (i) the adopted chromatographic column (C18 column; 4.6 mm × 250 mm, 5 µm) was the products of Shimadzu designed and widely used for phytohormone determination [9,23,24,25], and (ii) we established an elution method adopting isocratic elution and gradient elution using three solutions (methanol, double-distilled H2O, and 4.5% acetic acid solution) which were commonly used in the previous HPLC method [7,9,10,23,24,25,26,27], have the ability of separating 11 target phytohormones efficiently (Figure 5).

3.6. Sample Analysis

The young panicles, roots, and xylem sap of rice plants were pretreated and analyzed under the optimal HPLC conditions. Figure S12 shows the chromatogram of xylem sap of rice plants. The phytohormones in the samples were identified by comparing the retention times of peaks with those of the standards (Figure 5). Table 4 shows the concentrations of target phytohormones in young panicles, roots, and xylem sap of the two rice varieties, Nagina22 and Huanghuazhan, in which the concentrations of IAA and ABA had been reported in our previous study [13]. More sample analysis using the optimized method can be found in our previous studies [13,16] and others [28].
There were varying phytohormone levels among different rice varieties and different tissues. In rice plants, root tissues had a higher concentration of glucoside CTKs and tZ-type CTKs (tZ and tZR), but a lower concentration of iP-type CTKs (iP and iPA) than young panicles (Table 4). In higher plants, tZ-type CTKs act as an acropetal messenger, and iP-type CTKs act as basipetal messengers [29]. Dihydrogen CTKs were not detected in young panicles, roots, and xylem sap of rice plants, and conjugates CTKs (tZ9G and iP9G) were not detected in xylem sap. Similarly, nucleotide CTKs and riboside CTKs were detected in the xylem sap, but dihydrogen and conjugate CTKs were below the detectable levels in xylem sap in maize [30]. Dihydrozeatin CTKs were determined to be the dominant species of CTKs in dry seeds and were involved in germination and seedling establishment in maize, oats, and lucerne [2]. Nevertheless, the results indicated that the improved method was suitable for the determination of phytohormones in young panicles, roots, and xylem sap in rice plants.

4. Conclusions

An optimized method adopting liquid-liquid extraction and solid phase extraction followed by HPLC connected with UV detection for determination of 11 phytohormones was validated. The parameters influencing the performance of HPLC-UV, including the composition of the mobile phase for gradient elution, column temperature, flow rate, and UV absorption wavelength, were optimized. The limit of detection of this method was 0.22 to 1.1 µg L−1, and the coefficient factors of linear regression were > 0.99, with a recovery rate of 62.1~109.4%. The precision was good, with most RSDs < 10%. This method met the criteria of key chromatographic parameters. In rice plants, CTKs (tZ, tZR, iPMP, iP, and iPA), IAA, and ABA were determined in young panicles, roots, and xylem sap, and tZ9G and iP9G were determined in young panicles and roots but not in xylem sap. In conclusion, this study provided a reliable method to determine phytohormones, especially CTKs, in rice plants.

Supplementary Materials

The following are available online at https://0-www-mdpi-com.brum.beds.ac.uk/article/10.3390/su13136998/s1, Figure S1: Structures, abbreviations and formula of phytohormone investigated. Figure S2: Chromatograms obtained under elution conditions of HPLC in Table S1. Figure S3: Chromatograms obtained under elution conditions of HPLC in Table S2. Figure S4: Chromatograms obtained under elution conditions of HPLC in Table S3. Figure S5: Chromatograms obtained under elution conditions of HPLC in Table S4. Figure S6: Chromatograms obtained under elution conditions of HPLC in Table S5. Figure S7: Chromatograms obtained under elution conditions of HPLC in Table S6. Figure S8: Chromatograms obtained under elution conditions of HPLC in Table S7. Figure S9: The column pressures under different column temperatures (35, 40, 45 and 50 °C) at solvent flow rate of 1.6 mL min−1. Figure S10: The limit of detection under two wavelengths (254 and 269 nm) at column temperature of 45 °C. Figure S11: The extraction and purification protocol for phytohormone determination. Figure S12: The HPLC chromatograms and separation of various components of samples under the optimized conditions. Table S1: Elution conditions of HPLC according to Chou et al. (2000). Table S2: Elution conditions of HPLC modified based on Chou et al. (2000). Table S3: Elution conditions of HPLC according to Lu et al. (2007). Table S4: Elution conditions of HPLC modified based on Lu et al. (2007). Table S5: Elution conditions of HPLC modified based on supplementary Tables S2–S4. Table S6: Elution conditions of HPLC modified based on Table S5. Table S7: Elution conditions of HPLC modified based on Table S6. Table S8: Summary of calculated/observed system suitability parameters for HPLC system

Author Contributions

Conceptualization, C.W. and K.C.; methodology, C.W., B.Q. and H.L.; software, C.W., B.Q. and H.L.; validation, C.W., B.Q., H.L. and K.C.; formal analysis, C.W., B.Q., H.L. and K.C.; investigation, C.W., B.Q., H.L. and S.F.; resources, C.W., B.Q. and K.C.; data curation, B.Q., C.W., H.L. and K.C.; writing—original draft preparation, C.W., B.Q. and H.L.; writing—review and editing, K.C., S.F., M.W., B.L., L.N., J.H. and H.T.; visualization, C.W., B.Q., H.L. and K.C.; supervision, K.C., S.F., M.W., B.L., L.N., J.H. and H.T.; project administration, C.W., H.T. and K.C.; funding acquisition, C.W., H.T. and K.C. All authors have read and agreed to the published version of the manuscript.

Funding

This research was funded by the National Natural Science Foundation of China (grant numbers 32001471, 30971707, 31760112), the Natural Science Foundation of Jiangsu Province (grant number BK20180537), the Guangxi Science and Technology Bases and Talent Project (grant number AD20297049), the Guangxi Natural Science Foundation (grant number 2020GXNSFAA297027), the Science and Technology Major Project of Guangxi (grant number AA18118015).

Institutional Review Board Statement

Not applicable.

Informed Consent Statement

Not applicable.

Data Availability Statement

All data are available in the manuscript and supplementary material.

Conflicts of Interest

The authors declare no conflict of interest.

References

  1. Sakakibara, H. Cytokinins: Activity, biosynthesis, and translocation. Annu. Rev. Plant Biol. 2006, 57, 431–449. [Google Scholar] [CrossRef] [PubMed] [Green Version]
  2. Stirk, W.A.; Václavíková, K.; Novák, O.; Gajdošová, S.; Kotland, O.; Motyka, V.; Strnad, M.; Staden, J.V. Involvement of cis-Zeatin, dihydrozeatin, and aromatic cytokinins in germination and seedling establishment of maize, oats, and lucerne. J. Plant Growth Regul. 2012, 31, 392–405. [Google Scholar] [CrossRef]
  3. Wu, C.; Tang, S.; Li, G.; Wang, S.; Fahad, S.; Ding, Y. Roles of phytohormone changes in the grain yield of rice plants exposed to heat: A review. PeerJ 2019, 7, e7792. [Google Scholar] [CrossRef] [PubMed] [Green Version]
  4. Li, S.M.; Zheng, H.X.; Zhang, X.S.; Sui, N. Cytokinins as central regulators during plant growth and stress response. Plant Cell Rep. 2021, 40, 271–282. [Google Scholar] [CrossRef]
  5. Wang, Y.; Li, B.; Du, M.W.; Eneji, A.E.; Wang, B.M.; Duan, L.S.; Li, Z.H.; Tian, X.L. Mechanism of phytohormone involvement in feedback regulation of cotton leaf senescence induced by potassium deficiency. J. Exp. Bot. 2012, 63, 5887–5901. [Google Scholar] [CrossRef] [PubMed] [Green Version]
  6. Giannarelli, S.; Muscatello, B.; Bogani, P.; Spiriti, M.M.; Buiatti, M.; Fuoco, R. Comparative determination of some phytohormones in wild-type and genetically modified plants by gas chromatography-mass spectrometry and high-performance liquid chromatography-tandem mass spectrometry. Anal. Biochem. 2010, 398, 60–68. [Google Scholar] [CrossRef]
  7. Song, W.; Li, J.; Sun, H.; Huang, S.; Gong, X.; Ma, Q.; Zhang, Y.; Xu, G. Increased photosynthetic capacity in response to nitrate is correlated with enhanced cytokinin levels in rice cultivar with high responsiveness to nitrogen nutrients. Plant Soil 2013, 373, 981–993. [Google Scholar] [CrossRef]
  8. Cai, W.J.; Ye, T.T.; Wang, Q.; Cai, B.D.; Feng, Y.Q. A rapid approach to investigate spatiotemporal distribution of phytohormones in rice. Plant Methods 2016, 12, 47. [Google Scholar] [CrossRef] [Green Version]
  9. Lu, Y.L.; Dong, C.X.; Dong, Y.Y.; Xiong, C.L.; Shen, Q.R. Simultaneous determination of six endogenous cytokinins components and auxin in plant tissue by high performance liquid chromatography. Plant Nutr. Fertil. Sci. 2007, 13, 129–135. [Google Scholar]
  10. Chou, C.C.; Chen, W.S.; Huang, K.L.; Yu, H.C.; Liao, L.J. Changes in cytokinin levels of Phalaenopsis leaves at high temperature. Plant Physiol. Biochem. 2000, 38, 309–314. [Google Scholar] [CrossRef]
  11. Chen, Y.; Yang, L.; Zhang, W.; Deng, Z.; Wang, F.; Li, Y.; Meng, L.; Wu, N.; Ban, F.; Zhang, S. Simultaneous analysis of two phytohormones in chili and wheat using HPLC using novel calixarene as SPE sorbent. J. Chromatogr. Sci. 2017, 55, 358–365. [Google Scholar] [CrossRef] [Green Version]
  12. Wang, W.; He, M.; Chen, B.; Hu, B. Simultaneous determination of acidic phytohormones in cucumbers and green bean sprouts by ion-pair stir bar sorptive extraction-high performance liquid chromatography. Talanta 2017, 170, 128–136. [Google Scholar] [CrossRef]
  13. Wu, C.; Cui, K.; Wang, W.; Li, Q.; Fahad, S.; Hu, Q.; Huang, J.; Nie, L.; Peng, S. Heat-induced phytohormone changes are associated with disrupted early reproductive development and reduced yield in rice. Sci. Rep. 2016, 6, 34978. [Google Scholar] [CrossRef]
  14. Zhang, Z.; Peng, J.; Li, S.; Peng, H.; Wang, X.; Long, D.; Chen, J.; Xian, H.; Ni, R. Simultaneous determination of cytokinins by high performance liquid chromatography with resonance Rayleigh scattering and mechanism discussion. Analyst 2019, 144, 5186–5192. [Google Scholar] [CrossRef]
  15. Du, F.; Sun, L.; Zhen, X.; Nie, H.; Zheng, Y.; Ruan, G.; Li, J. High-internal-phase-emulsion polymeric monolith coupled with liquid chromatography–electrospray tandem mass spectrometry for enrichment and sensitive detection of trace cytokinins in plant samples. Anal. Bioanal. Chem. 2015, 407, 6071–6079. [Google Scholar] [CrossRef] [PubMed]
  16. Wu, C.; Cui, K.; Wang, W.; Li, Q.; Fahad, S.; Hu, Q.; Huang, J.; Nie, L.; Mohapatra, P.K.; Peng, S. Heat-induced cytokinin transportation and degradation are associated with reduced panicle cytokinin expression and fewer spikelets per panicle in rice. Front. Plant Sci. 2017, 8, 371. [Google Scholar] [CrossRef] [PubMed] [Green Version]
  17. Hoyerová, K.; Gaudinová, A.; Malbeck, J.; Dobrev, P.I.; Kocábek, T.; Šolcová, B.; Trávníčková, A.; Kamínek, M. Efficiency of different methods of extraction and purification of cytokinins. Phytochemistry 2006, 67, 1151–1159. [Google Scholar] [CrossRef] [PubMed]
  18. Hassan, M.; Chattha, M.; Khan, I.; Chattha, B.; Barbanti, L.; Aamer, M.; Iqbal, M.; Nawaz, M.; Mahmood, A.; Ali, A.; et al. Heat stress in cultivated plants: Nature, impact, mechanisms, and mitigation strategies—A review. Plant Biosyst. 2020, 1–56. [Google Scholar] [CrossRef]
  19. Bose, A. HPLC calibration process parameters in terms of system suitability test. Austin Chromatogr. 2014, 1, 1–4. [Google Scholar]
  20. Brenner, M.L. Modern methods for plant growth substance analysis. Annu. Rev. Plant Phys. 2003, 32, 511–538. [Google Scholar] [CrossRef]
  21. Wu, Y.; Hu, B. Simultaneous determination of several phytohormones in natural coconut juice by hollow fiber-based liquid-liquid-liquid microextraction-high performance liquid chromatography. J. Chromatogr. A 2009, 1216, 7657–7663. [Google Scholar] [CrossRef] [PubMed]
  22. Chiang, P.C.; Hu, Y. Simultaneous determination of LogD, LogP, and pKa of drugs by using a reverse phase HPLC coupled with a 96-Well plate auto injector. Comb. Chem. High Throughput Screen. 2009, 12, 250–257. [Google Scholar] [CrossRef] [PubMed]
  23. Xie, J.; Zhang, Y.Z. Determination of plant intrinsic hormones by reversed phase high performance liquid chromatography. J. Instrum. Anal. 2001, 20, 61–62. [Google Scholar]
  24. Naqqash, T.; Hameed, S.; Imran, A.; Hanif, M.K.; Majeed, A.; Dirk, J.; Elsas, V. Differential growth stimulation response of potato towards inoculation with taxonomically diverse plant growth promoting rhizobacteria. Front. Plant Sci. 2016, 7, 144. [Google Scholar] [CrossRef] [Green Version]
  25. Cao, Y.Y.; Chen, Y.H.; Chen, M.X.; Wang, Z.Q.; Wu, C.F.; Bian, X.C.; Yang, J.C.; Zhang, J.H. Growth characteristics and endosperm structure of superior and inferior spikelets of indica rice under high-temperature stress. Biol. Plant. 2016, 60, 532–542. [Google Scholar] [CrossRef]
  26. Liu, H.; Li, X.; Xiao, J.; Wang, S. A convenient method for simultaneous quantification of multiple phytohormones and metabolites: Application in study of rice-bacterium interaction. Plant Methods 2012, 8, 2. [Google Scholar] [CrossRef] [PubMed] [Green Version]
  27. Almeida-Trapp, M.; Mithöfer, A. Quantification of phytohormones by HPLC-MS/MS including phytoplasma-infected plants. Methods Mol. Biol. 2019, 1875, 345–358. [Google Scholar] [PubMed]
  28. Chen, J.; Tang, H.H.; Li, L.; Qin, S.J.; Wang, G.P.; Hong, N. Effects of virus infection on plant growth, root development and phytohormone levels in in vitro-cultured pear plants. Plant Cell Tiss. Org. 2017, 131, 359–368. [Google Scholar] [CrossRef]
  29. Kudo, T.; Kiba, T.; Sakakibara, H. Metabolism and long-distance translocation of cytokinins. J. Integr. Plant Biol. 2010, 52, 53–60. [Google Scholar] [CrossRef]
  30. Takei, K.; Sakakibara, H.; Taniguchi, M.; Sugiyama, T. Nitrogen-dependent accumulation of cytokinins in root and the translocation to leaf: Implication of cytokinin species that induces gene expression of maize response regulator. Plant Cell Physiol. 2001, 42, 85–93. [Google Scholar] [CrossRef]
Figure 1. The HPLC chromatograms under different column temperatures (35, 40, 45, and 50 °C) at a solvent flow rate of 1.5 mL min−1. 1:tZ9G; 2:tZ; 3:diZ; 4:tZR; 5:diZR; 6:iPMP; 7:IAA; 8:iP9G; 9:iP; 10:iPA; 11:ABA.
Sustainability 13 06998 g001
Figure 2. The HPLC chromatograms under different column temperatures (35, 40, 45, and 50 °C) at a solvent flow rate of 1.6 mL min−1. 1:tZ9G; 2:tZ; 3:diZ; 4:tZR; 5:diZR; 6:iPMP; 7:IAA; 8:iP9G; 9:iP; 10:iPA; 11:ABA.
Sustainability 13 06998 g002
Figure 3. The HPLC chromatograms under different solvent flow rates (1.5, 1.6 and 1.7 mL min−1) at column temperature of 45 °C. 1:tZ9G; 2:tZ; 3:diZ; 4:tZR; 5:diZR; 6:iPMP; 7:IAA; 8:iP9G; 9:iP; 10:iPA; 11:ABA.
Sustainability 13 06998 g003
Figure 4. The HPLC chromatograms under two wavelengths (254 and 269 nm) at a column temperature of 45 °C. 1:tZ9G; 2:tZ; 3:diZ; 4:tZR; 5:diZR; 6:iPMP; 7:IAA; 8:iP9G; 9:iP; 10:iPA; 11:ABA.
Sustainability 13 06998 g004
Figure 5. The HPLC chromatograms and separation of various components of standards under the optimized conditions (the extraction and purification method in Figure S11; elution method in Table 1; column temperature of 45 °C, flow rate of 1.6 mL min−1, UV detection at 269 nm). 1:tZ9G; 2:tZ; 3:diZ; 4:tZR; 5:diZR; 6:iPMP; 7:IAA; 8:iP9G; 9:iP; 10:iPA; 11:ABA.
Sustainability 13 06998 g005
Table 1. Elution conditions of HPLC.
Time (min)Methanol (%)ddH2O (%)4.5% Acetic Acid (%)
001000
1730700
1840600
2240600
2435650
2535065
3435065
3501000
4501000
Table 2. Linearity, detection limits, and recovery of phytohormones.
CompoundCalibration EquationrLimit of Detection (ug/L) (S/N = 3)Recovery
(%)
RSD
(%)
tZ9Gy = 47.397x − 0.46080.9980.77490.93.4
tZy = 87.393x + 0.42380.9990.475109.48.6
diZy = 156.59x + 0.08921.0000.421102.28.7
tZRy = 45.161x + 0.05080.9990.95997.87.8
diZRy = 64.128x − 0.53310.9980.84599.18.1
iPMPy = 44.345x − 0.09410.9991.08762.17.1
IAAy = 32.701x + 0.02650.9991.07182.59.5
iP9Gy = 73.153x − 0.08610.9990.82496.78.5
iPy = 91.569x − 0.65830.9990.21496.77.4
iPAy = 55.29x − 0.00450.9990.89397.28.9
ABAy = 85.338x − 0.36670.9991.77299.38.8
Table 3. The inter-day and intra-day precisions (RSD %) of the method.
CompoundInter-DayIntra-Day
Retention TimePeak AreaRetention TimePeak Area
tZ9G0.412.651.009.05
tZ0.871.251.713.50
diZ0.650.701.680.98
tZR0.752.870.972.16
diZR0.381.650.802.86
iPMP0.602.051.239.13
IAA0.822.011.455.81
iP9G0.221.140.224.26
iP0.460.700.741.43
iPA0.411.600.710.68
ABA0.281.310.364.04
Table 4. Contents of phytohormones in young panicles, roots, and xylem sap of rice plants.
CompoundNagina22Huanghuazhan
Young Panicle
(ng/g FW)
Root
(ng/g FW)
Xylem Sap
(ng/L)
Young Panicle
(ng/g FW)
Root
(ng/g FW)
Xylem Sap
(ng/L)
tZ9G111.2 ± 8.0355.0 ± 14.2ND183.7 ± 8.8351.2 ± 8.2ND
tZ37.3 ± 2.962.6 ± 2.4312.5 ± 43.257.5 ± 2.161.4 ± 2.6435.6 ± 24.6
diZNDNDNDNDNDND
tZR76.4 ± 1.9301.0 ± 22.6986.4 ± 37.2111.4 ± 7.2664.4 ± 41.11264.4 ± 78.6
diZRNDNDNDNDNDND
iPMP137.5 ± 11.3178.1 ± 18.878.1 ± 9.1165.3 ± 2.7140.9 ± 9.197.8 ± 7.9
IAA133.9 ± 6.599.2 ± 5.3730.9 ± 91.5122.8 ± 6.1117.3 ± 5.01292.8 ± 42.7
iP9G34.2 ± 2.174.0 ± 5.7ND12.7 ± 0.9104.3 ± 1.7ND
iP16.3 ± 1.29.1 ± 0.319.4 ± 1.14.7 ± 0.38.8 ± 0.334.1 ± 3.3
iPA68.8 ± 6.545.2 ± 2.089.2 ± 10.237.5 ± 2.850.8 ± 3.3124.9 ± 3.8
ABA86.7 ± 5.872.0 ± 3.9273.6 ± 16.858.3 ± 3.982.7 ± 4.8261.7 ± 23.8
Data are presented as mean ± SD (n = 4); ND, Not detected at the detection level of the method.
Publisher’s Note: MDPI stays neutral with regard to jurisdictional claims in published maps and institutional affiliations.

