
Risk-Based Prioritization of Sewer Pipe Inspection from Infrastructure Asset Management Perspective


1
Department of Civil and Environmental Engineering, Yonsei University, Seoul 03722, Korea
2
Intelligent Construction Automation Center, Kyungpook University, Daegu 41566, Korea
3
Department of Civil Engineering, Yeungnam University, Gyeongsan 38541, Korea
*
Authors to whom correspondence should be addressed.
Sustainability 2021, 13(13), 7213; https://0-doi-org.brum.beds.ac.uk/10.3390/su13137213
Submission received: 31 March 2021
/
Revised: 23 June 2021
/
Accepted: 24 June 2021
/
Published: 28 June 2021
(This article belongs to the Special Issue Intelligent Sustainable Technology for Construction, the Civil Sector, and Infrastructure)
Abstract
:The escalating number of aging sewer pipes necessitates an infrastructure asset management approach to achieve an efficient budget allocation for maintenance. This study suggests a risk-based prioritization framework for sewer pipe inspection considering the predicted condition of sewer pipes and the criticality of the economic, social and environmental impacts associated with them. The results from both models can be used to evaluate the risk of sewer pipes by classification into risk groups. A risk matrix is used for the classification, and it divides the sewer pipes into five risk groups. The results of this study show an improvement in the accuracy of finding sewer pipes in a bad condition using this framework. The condition prediction model can successfully find sewer pipes with a bad condition with over 70% precision. High-risk sewer pipes are highlighted using the differences in the environmental features as well as in the physical features associated with other sewer pipes. Additionally, through the combination of both the condition and criticality of sewer pipes, the framework systemically prioritizes needed maintenance for sewer pipes with a very bad condition. This prioritization framework is expected to help the process of deciding which sewer pipes should be prioritized within a constrained budget.
1. Introduction
1.1. Research Background
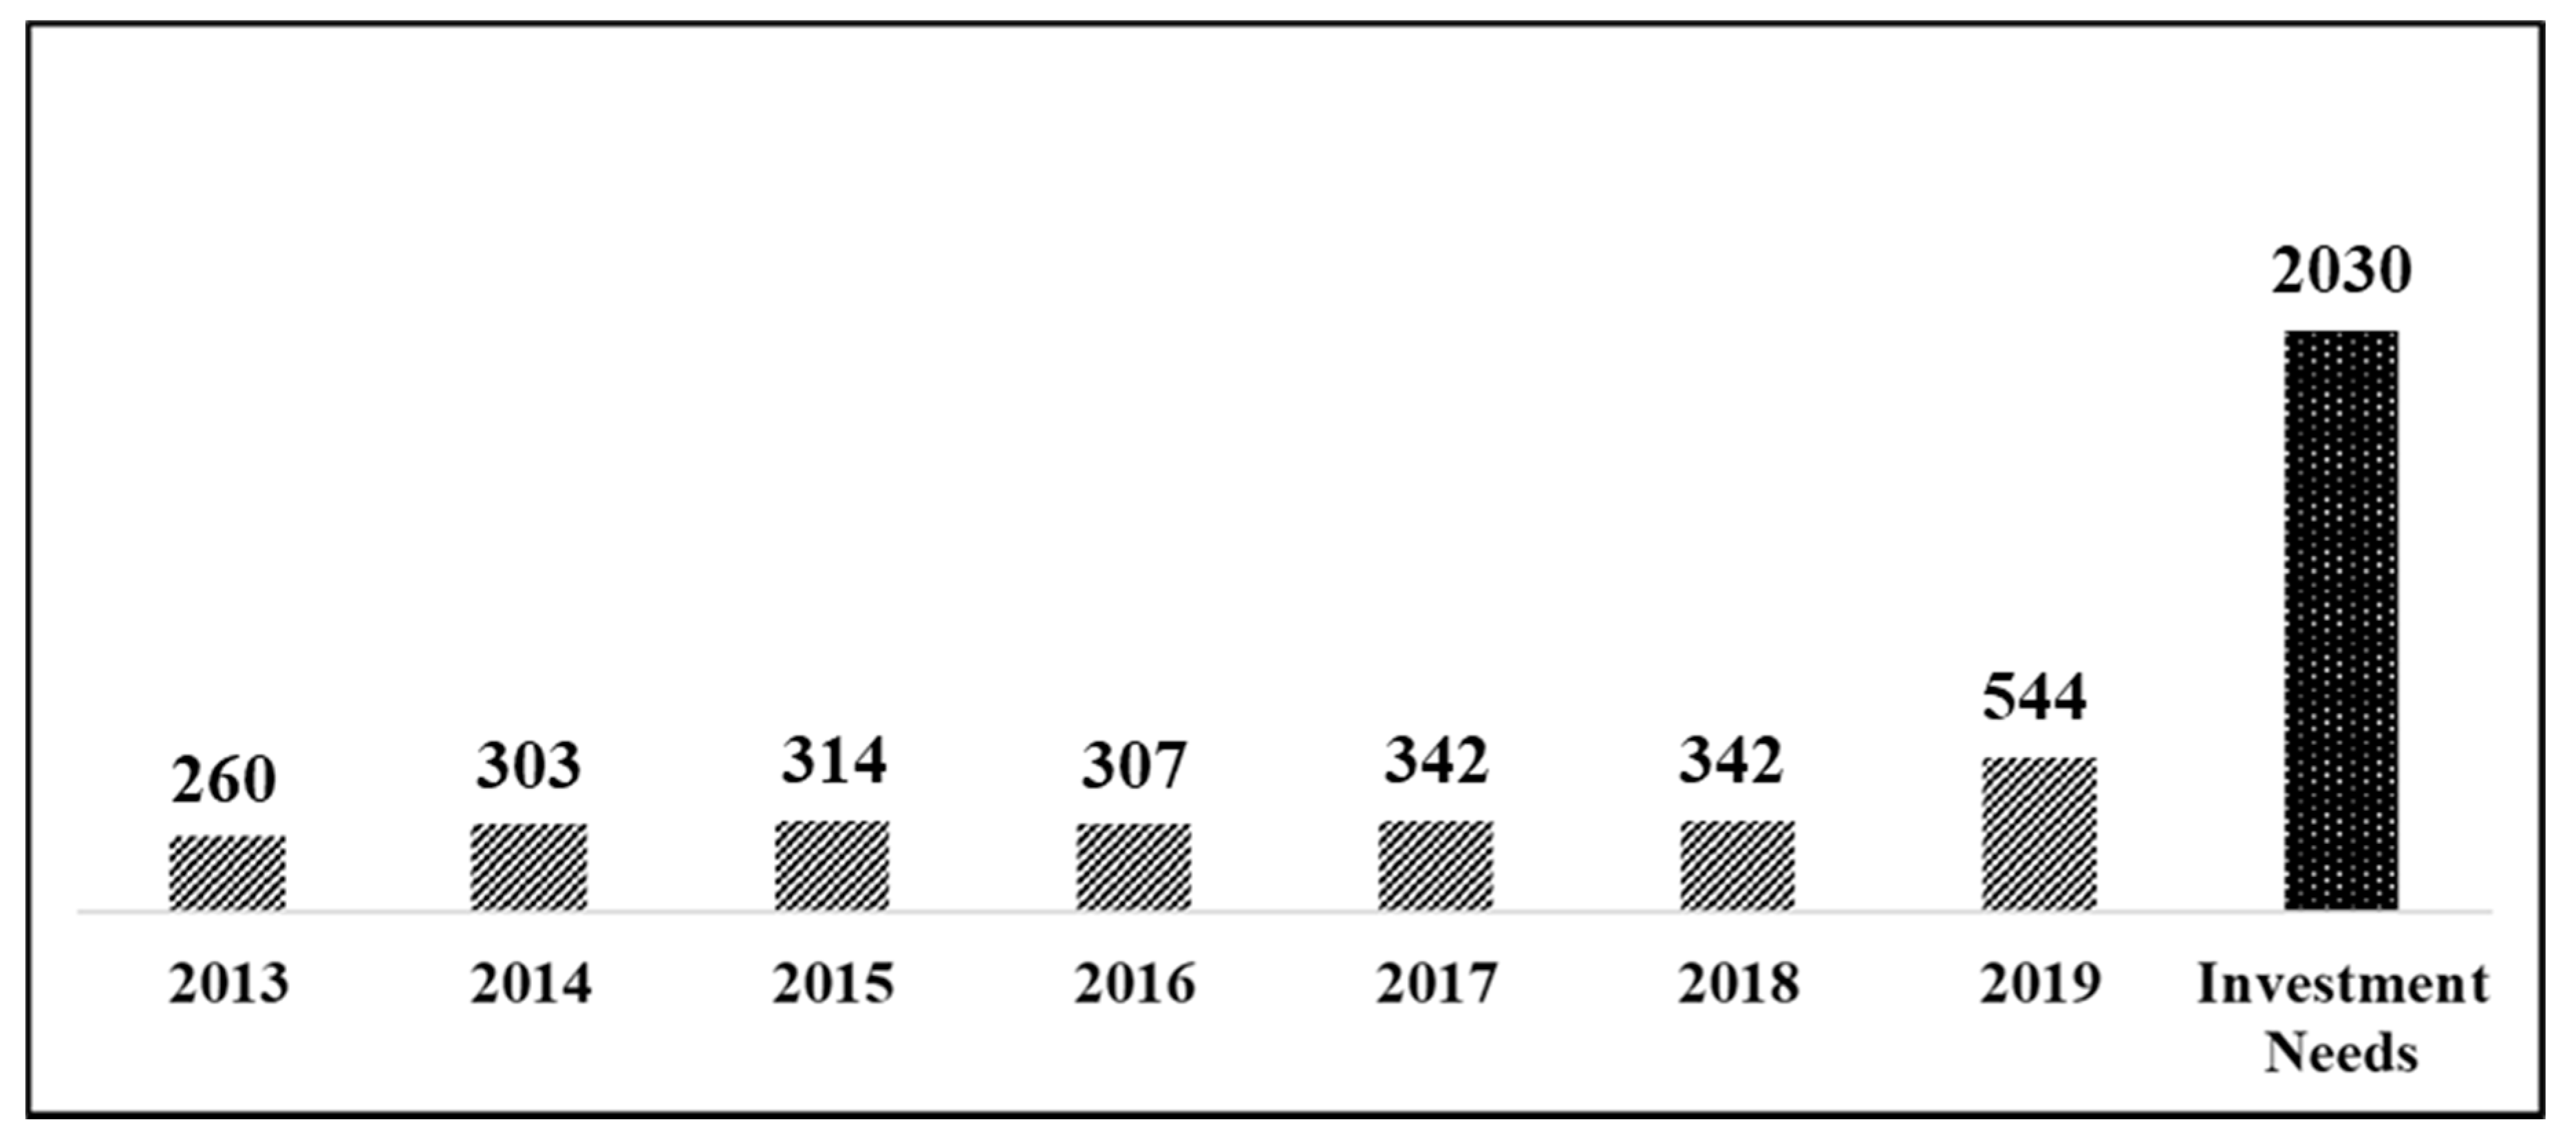
The American Society of Civil Engineers (ASCE) investigates the infrastructure in the US, and it gave the wastewater infrastructure in the US an overall D+ grade [1]. One of the issues in the wastewater infrastructure is deterioration of sewer systems due to aging, excessive usage and lack of maintenance [2]. The sewer system is one part of the capital-intensive infrastructure [3]; however, municipalities have been undergoing a budget shortage for maintenance [4]. This funding gap makes it difficult to properly manage the sewer system. The same problem has been occurring in Seoul, Korea. Sewer pipes of 10,728 km in length had been constructed in Seoul, and 53% (5743 km) of them are over 30 years old. The Seoul Metropolitan Government has increased the annual investment in sewer system maintenance from KRW 260 billion to KRW 544 billion. However, this is still insufficient compared to the total amount of investment needs, which is estimated as KRW 2030 billion (Figure 1). Moreover, the amount of sewer pipes over 30 years old is increasing consistently at more than 100 km every year. The escalating number of aging sewer pipes necessitates an asset management approach for infrastructure sustainability. Since the failure of sewer pipes can cause a huge inconvenience and threat to public health and safety, the objectives of sustainable infrastructure asset management are to maintain the assets to provide an adequate level of service and to maintain the assets in the most cost-effective way [5].
Seoul’s sewer pipes have commonly been repaired only after a failure occurs because it is difficult to discover what the defect is in sewer pipes until it becomes visible [2]. The advantage of this kind of reactive approach is that sewer pipes fulfill their whole service life by continuous repair after a failure. However, researchers and practitioners pointed out that the repair cost often exceeds the proactive maintenance cost as the failure of sewer pipes leads to additional indirect costs caused by service interruptions and damage to surrounding areas [6]. Therefore, many researchers have suggested that elements of infrastructure asset management, such as strategies, policies and procedures, should shift from the reactive to the proactive approach [7,8].
The purpose of proactive maintenance is to prevent the failure of sewer systems and subsequent consequences by constantly monitoring and controlling sewer conditions for long-term sustainability. The main method that the Seoul Metropolitan Government has implemented to proactively manage the sewer systems is to update the condition information of aging sewer pipes regularly. Decision makers scrutinize the results of the condition assessment to determine which sewer pipe is at risk and has to be rehabilitated. This prioritization process can help municipalities allocate their limited budget to urgent assets and, consequently, execute the overall budget more efficiently as a tool for infrastructure asset management. However, since the failure of sewer systems causes a complex impact on economic, social and environmental aspects (such as traffic disruption, flooding and leaking wastewater, which can contaminate nearby soil and rivers [9,10,11,12,13]), the criticality of these impacts due to the failure of sewer pipes, as well as the assessed condition of the sewer pipes, should be considered in order to prioritize their rehabilitation given these limited budgets.
In this area of research, many investigators have contributed to improving infrastructure asset management in various ways. Many researchers have used data-driven models (such as statistical models or machine learning techniques) to predict the deterioration of sewer pipes. Since the purpose of data-driven models is to discover the connection pattern between the deterioration factors and the condition of sewer pipes, it is essential to collect sufficient inspection data [14,15]. Earlier studies were limited to the simulation method because of the difficulties in gathering a sufficient amount of historical sewer pipe data. Additionally, some studies ignored or paid less attention to several factors that might influence the deterioration pattern of sewer pipes for condition prediction (e.g., precipitation and population). Several researchers recommended that the consequences of failure should be considered with the sewer pipe condition when prioritizing sewer pipe rehabilitation [16,17]. These studies have identified and evaluated the economic, social and environmental impacts from the failure of sewer pipes. Despite their efforts and contributions, since they suffered from a lack of data, more detailed investigations could be made. For example, the environmental impact of the failure of sewer pipes (such as soil contamination) has been ignored, and measuring various facilities within a single factor called “land use” could not evaluate social impacts accurately.
1.2. Research Obejctive
In this context, the objective of this study is the development of prioritizing a sewer pipe inspection framework for sustainable infrastructure asset management, by combining a condition prediction model and a criticality assessment model. The condition prediction model is developed to identify the pipes that are most likely to fail in Seoul using vast historical data. Since the model predicts the condition of sewer pipes which have not yet been inspected, it uses historical data to discover the patterns of how influence factors such as the pipe attributes and the inspected condition of the pipes are linked. The criticality assessment model is to identify the pipes expected to have the biggest failure impact in terms of economic, social and environmental aspects. It takes into account the indirect damage to adjacent facilities or natural objects as well as rehabilitation costs of the pipe itself. This study includes diverse factors that were discovered to be influenced by the failure of sewer pipes. The risk of failure is estimated by combining the results of the criticality assessment and condition prediction. Finally, the framework can be utilized to determine the prioritization of which sewer pipes should be inspected.
To achieve these objectives, this study was conducted with the following process: First, the necessity of research and the corresponding body of knowledge were recognized through a literature review. Second, the data for model development were identified, collected and prepared. Third, the condition prediction model was developed by using the random forest method, and the criticality assessment model was developed by using an analytical hierarchy process (weight) and scoring method. Finally, a risk matrix was used to prioritize sewer pipe inspection by combining the results from both models.
2. Literature Review
2.1. Factors Influencing Condition of Sewer Pipes
The condition of sewer pipes worsens through a complex process of a number of influence factors. Previous research [18,19] explained that the condition of sewer pipes is influenced by physical, operational and environmental factors. These three types of influence factors can account for how sewer pipes deteriorate. This study, however, does not consider operational factors since the sewer pipes used for this study are located in a single municipality; hence, they are likely to have a limited impact on condition.
2.1.1. Physical Factors
The most representative physical factor is the pipe age. This factor represents the degree of deterioration since deterioration begins right after the installation of sewer pipes [20]. However, newly installed pipes can also lead to failure because of human errors or damage to the pipes during construction [21]. Pipes that do not fail at this early stage go through a plateau, and such pipes are usually damaged by an external interference, such as extremely heavy loading. As the pipes become aged, the failure rate increases since pipes are weakened. The component materials of the pipe also are an important factor that affects the failure pattern. Material types can be classified into two categories: rigid and flexible [22]. Rigid pipes, such as those made of concrete or cast iron, can carry loadings on their own but are vulnerable to corrosion. On the other hand, flexible pipes (such as those made of plastic or polyethylene (PE)) have to be supported by the soil, but they are relatively light and strong against impact [23]. Since every material type has pros and cons, they should be considered carefully when being assessed for installation. A number of previous studies investigated the impact of diameter on deterioration, but they showed conflicting results. Ariaratnam et al. [2] analyzed the impact of physical factors, and the results indicated that a larger diameter has a positive effect on the structural condition of sewer pipes. Bakry et al. [24] also found the same implication: pipes with larger diameters are less influenced by deterioration in terms of structural and operational conditions. Conversely, several researchers have stated that larger pipes are more likely to fail due to the larger surface, heavier weight and bulk [10,25]. Pipe length is also a factor for which the impact on the pipe condition has not been clearly determined. Jeong et al. [25] suggested that longer sewer pipes are less likely to fail since there are fewer bends where blockages may occur. However, the results from Ana et al. [26] and Salman and Salem [27] indicated that longer pipes are more vulnerable to deterioration due to a higher possibility of exposure to deterioration factors. Moreover, longer pipes are structurally unstable because of higher bending stress [28]. Since sewer pipes are installed under the ground, the burial depth should also be considered. If the burial depth is too shallow, the sewer pipes are exposed to more surface loading and become more susceptible to temperature changes. On the other hand, if the burial depth is too deep, the pipes are influenced by a huge dead load [18]. Therefore, a moderate burial depth needs to be set appropriately to prevent a negative impact on deterioration. The last physical factor is the slope or gradient, which is related to the flow velocity. As the pipe slope increases, the flow rate of sewage becomes faster. A higher flow rate of sewage constantly rinses the inside of the pipe and prevents the pipe from clogging by sediment [26,29,30]. Too steep a slope, however, can accelerate the erosion process, as well as rendering the pipe unstable [18,25,27].
2.1.2. Environmental Factors
Environmental factors include all factors that affect the deterioration of sewer pipes which are not considered as physical factors. One of the most representative environmental factors is surface loading. Sewer pipes are repeatedly exposed to surface loading since it is a part of the underground infrastructure; however, measuring the magnitude of surface loading is quite complicated [15]. Thus, many researchers have estimated it with regard to the location where sewer pipes are installed [18,26,31]. The location can be classified based on the corresponding land use, such as industrial, residential and road. In particular, several studies have divided roads by traffic volume or road type to estimate surface loading [18,31,32]. They stated that the vibration caused by a large traffic volume can deteriorate the pipe condition. Groundwater is also an important factor since it may flow into the pipes when sewer pipes are installed below the groundwater level, thus increasing structural defects [21]. Additionally, the infiltration of groundwater washes the soil surrounding the sewer pipes, meaning that the soil support is weakened [18]. For sewer pipes that are surrounded by soil, it is necessary to consider the type of soil. Different types of soil affect the deterioration of sewer pipes, interacting with the other attributes [18]. For example, the degree of soil resistance against movement is dependent on attributes of the soil such as density. Soil with a low density is vulnerable to external forces such as the infiltration of groundwater or surface loading. Moreover, if the surrounding soil has high corrosivity, the deterioration of sewer pipes can be accelerated. The performance of sewer pipes is also influenced by precipitation [20,33]. Intense precipitation causes a large soil discharge, meaning that the structural stability of pipes can be impaired (Kim et al., 2018). Precipitation indirectly aggravates the pipe condition in conjunction with the soil type, groundwater level, etc. [20]. Moreover, inflow/infiltration (I/I) leads to an overflow which puts extra loading on the pipes [33].
2.2. Condition Prediction Models for Sewer Pipes
As for sewer assets, awareness of the current condition of individual sewer pipes and estimation of the probability of failure are some of the main concerns [17]. Thus, municipalities have collected and incorporated data items from general information on sewer pipes, such as location, length and diameter, to maintenance information, such as inspection history, into the database [34]. However, since keeping the data up to date is costly, many researchers have attempted to determine a model that would predict the deterioration level of sewer pipes using just the general information.
Statistical methods have been widely used to predict the condition of sewer pipes. Among the various statistical methods, the most commonly used method is the general linear regression model. Salman and Salem [32] carried out similar research using three statistical methods (ordinal regression, multinomial logistic regression and binary logistic regression). They presented three different regression models which municipalities can apply depending on the data type they have. Chughtai and Zayed [18] divided the defect types into two groups (i.e., structural defects and operational defects) and identified the corresponding condition influence factors. The comparison of impacts by different defect types showed that the common factor (e.g., slope) had different levels of impact depending on the defect type. Angarita et al. [35] specified the model into three versions based on the dependent variable: overall defect, structural defect and detailed structural defect. This study implemented the linear regression model for each defect type and suggested that the consideration for the deterioration factors should vary with the dependent variable. These regression models are simple statistical methods, and it is easy to understand which deterioration factors are crucial since the factors are directly correlated to the sewer pipe condition [14]. Nevertheless, the application of regression models is restricted to when the relationship between the independent and dependent variables is linear [22,36].
Different statistical methods have been attempted for a better understanding about the deterioration of sewer pipes. Ariaratnam et al. [2] used a logistic regression model to provide decision makers a means for sewage management. This study adopted five basic deterioration factors (age, diameter, sewer type, depth, material) and explored the corresponding effect on the structural condition of sewer pipes. Montoya [17] carried out a survival analysis to infer the impact of different attributes on the probability of defect occurrence. This study analyzed the survival probability according to sewer type, material, diameter, length and shape. Baik et al. [37] used an ordered, probit-based Markov chain method to estimate the condition of sewer pipes. This study generated a transition equation to predict the deterioration pattern over time considering length, diameter, material, age and slope. Kleiner et al. [38] also used a Markov chain method, but they added a fuzzy inference system. Although only the age of sewer pipes was considered in the method, it could present a framework to determine the deterioration rate based on the age and estimated condition of the pipes. The stochastic method, predicting the condition changes over time, can be used as a powerful tool to rank the rehabilitation prioritization since it produces probabilistic values [39]. However, this method requires a large amount of inspection data that can reflect the condition changes of individual pipes [15].
Another representative method is models using machine learning techniques. Tran et al. [40] adopted two types of artificial neural network. They used physical factors (e.g., diameter, age, depth, slope) and environmental factors (e.g., tree, soil type) as input data and then compared the performance of each neural network. This method is highly effective in discovering the complex underlying relationship between input and output data; however, the understanding of the model is limited since the process linking input data with output data is hidden [15,40]. A decision tree model can be considered a method to provide further insights that the neural network is not able to discover. This type of model predicts the target variable through several tree-based rules and offers a visual presentation which decision makers can easily utilize [41]. Syachrani et al. [41] compared the performance of several models: a regression model, a neural network model and a decision tree model. Random forest models are the approach of combining numerous decision tree models into a single model so that a more generalized model can be established. Harvey and McBean [42] used a random forest model to predict the structural condition of sanitary sewer pipes considering the zonal factors which reflect nearby pipes. Machine learning models can identify complex non-linear relationships between input and output variables. However, the aforementioned technique requires an extensive amount of data to develop relationships [36].
2.3. Criticality of Sewer Pipes
The failure of sewer pipes can precipitate enormous damage to the city and threaten the health and safety of the public because the sewer pipes are closely connected to buildings and other infrastructure facilities. This criticality of failure should be considered with the sewer pipe condition when prioritizing rehabilitation for sewer pipes [16,17]. At this point, municipalities make decisions based on sustainability, which is concerned about economic, social and environmental aspects of the decision [16].
Among those three aspects, the economic impact accounts for rehabilitation costs or reconstruction costs [22,43]. Since the real economic impact is composed of various cost items, some studies have tried to estimate the costs using indirect approaches. Elsawah et al. [44] took the physical attributes of sewer pipes (e.g., diameter, depth) and the measures of nearby roads (e.g., road width, number of lanes) into account in order to evaluate the economic impact. Vladeanu and Matthews [45] estimated the economic impact with similar factors. They saw the common factors that can magnify the scale of damage and added some deterioration factors such as age and seismic zone into the economic factors. On the other hand, Anbari et al. [46] evaluated the economic impact with the monetary factor. This study examined the cost per unit length based on the material and diameter and then scored the pipes using the highest cost as the 100-point level.
The social impact accounts for the physical damage to adjacent facilities, and the threat to health and safety caused by the failure of sewer pipes [22]. Since there is no specific consensus about what can represent the scale of the social impact, means to estimate the social impact vary by study. Among them, distance to critical facilities is one of the most commonly used means. Baah et al. [11] used distance to hospitals, schools and any other buildings since defective sewer pipes may result in adverse health impacts. Salman and Salem [27], Rossi [47] and Vladeanu and Matthews [45] also used distance measures in order to assess the social impact of sewer pipes. Another means to score the social impact is to evaluate the land use or the importance of facilities above the sewer pipes. In particular, since roads exist all over the city as with sewer pipes, the traffic volume or the number of lanes above sewer pipes is often measured to determine the social impact of the corresponding pipes [13,48,49]. As for land use, Vladeanu and Matthews [45] classified the type of land use into recreational, residential or commercial in order to estimate the potential damage or inconvenience to land users.
3. Methodology
3.1. Factor Identification
There have been various studies that investigated the correlation between several physical and environmental factors and the deterioration of sewer pipes. Even though there are a lot of factors identified to have an impact on deterioration, this study selected five physical factors and five environmental factors after a thorough literature review and considering data availability. While all physical factors and three of the five environmental factors (number of lanes, precipitation, population) are numerical variables, two environmental factors (road type, land use) are categorized into five groups based on previous studies.
This study selected 12 factors to assess the criticality of failure of sewer pipes based on previous research (Table 1). The economic impact factor refers to the reconstruction cost when sewer pipes fail. Several studies suggested that the accessibility of the site is also an important factor, but it is excluded due to the difficulty in collecting accessibility data for entire sewer pipes. This study selected six social factors considering the importance and the number of facilities. Previous studies often considered some facilities by “land use”, meaning that only a single facility would have to be assessed. This study separates “land use” into six factors in order to consider the overall impact of sewer pipe failure on these facilities. As for the environmental impacts, this study considers forests and farmland as well as rivers (body of water). Forests and farmland are the indicators that show the impact on soil contamination.
3.2. Data Collection and Preparation
3.2.1. Sewer Pipe Data
The data were provided by the Seoul Metropolitan Government, and they contain information about sewer pipes that had been constructed through 2014. In total, the number of sewer pipes was 373,564, and the length was 10,577 km. The raw data were provided in the form suited for a geographic information system (GIS) and were composed of spatial information and attributes. The attributes contain information for the management and maintenance of sewer pipes. The key attributes are the registration information for sewer pipes and their inspection records. The registration information includes the physical data which can characterize the sewer pipes, such as diameter, length and burial depth; the inspection record shows the condition grade of sewer pipes which the municipality has evaluated. The sewer pipes that contain no value for the key features such as diameter and length were excluded, since they were unusable during the research. After removing those data, the number of target sewer pipes was reduced to 282,391. Among the vast number of sewer pipes in Seoul city, this study used 134,541 data with inspection records to develop the condition prediction model. The remaining 147,850 data with no inspection record were used in case application since the purpose of this research is to develop a prioritization framework to be applied before sewer pipe inspection.
3.2.2. Geographic Data
Geographic data were used to determine the location of features (Table 2). This study required the geographic data of several facilities such as medical/educational facilities, roads, railways and commercial/residential areas to fulfill the following analysis.
Since the necessary information from geographic data is the distance between the sewer pipes and each factor, this study used the “Near” function of ArcGIS Pro to calculate the distance. “Near” is the function to calculate the nearest distance between two input features. The “Near” function also transfers the attributes of one feature to another, meaning that certain data can be combined together with the sewer pipe data. As for roads, the number of lanes of the nearest road is combined with the sewer pipe data because the nearest distance between the roads and the sewer pipes is mostly zero (intersected).
3.2.3. Statistical Data
Two statistical datasets were used in this study: the annual precipitation records and the population by census tract.
The Korea Meteorological Administration has been documenting the precipitation records and opening them to the public through the Meteorological Data Portal. This study collected the annual precipitation records of 30 observation stations in Seoul and 66 observation stations adjacent to Seoul (99 observation stations in total). The data collection period was from 2000 to 2018 (19 years). The sewer pipes in the same drainage sector were assumed to collect rainwater in the same place. This means that the loads on the sewer pipes were considered equal during rainfall. Therefore, this study used the Thiessen polygon method to determine average areal precipitation. The Thiessen polygon method is the method to calculate the precipitation of a certain area [54]. The polygons are drawn around the observation stations, and it is assumed that the precipitation of the observation station in the polygon represents the precipitation of the area in the polygon. Thus, the precipitation of random areas can be calculated by a weighted sum of the precipitation statistics where corresponding Thiessen polygons cover the area.
3.3. Condition Prediction
This study developed its model with sewer pipe data from pipes for which the condition grade has been determined. The purpose of the condition prediction model is to identify the sewer pipes that are likely to be rehabilitated (Grades A and B) based on preliminary data, such as the physical information. To achieve the purpose of this model, we used a random forest classifier, one of the machine learning methods, to predict the condition of sewer pipes with no inspection record by training the model with the data from sewer pipes that had been inspected.
The random forest algorithm is an ensemble learning method based on the decision tree approach. The decision tree splits the data at each internal node based on the splitting rules of the features so that each instance (sewer pipe) that reaches the leaf node (final node) is turned into the corresponding value for regression and the corresponding class for classification. The training process for the decision tree model is to optimize the feature and the splitting rules. However, since the decision tree depends on a single tree-based model, it is prone to overfitting with the dataset used for training. To overcome this disadvantage, the random forest algorithm builds multiple decision trees trained by the randomly selected data, and each tree produces the output value according to the corresponding rules. The random forest determines the final output by aggregating the results of decision trees.
The number of data points used for the condition prediction model was 134,541. To train the model, this study used 70% of the total data (94,179) for the training dataset, and the remaining data (40,362) were used to test the model. Testing of the condition prediction model was implemented by verifying the performance obtained by inputting the test dataset into the model determined through the above-described training process. The performance of the model was verified using three indicators: accuracy, precision and recall. The explanation of the performance indicators is shown in Table 3 and Table 4.
Finally, the condition prediction model of which performance meets a certain value can be applied to the sewer pipe data with no inspection records, and the predicted condition can be determined. Since the model output can vary from 0 to 1 when it comes to prediction, the prediction indicates the probability of a bad condition.
3.4. Criticality Assessment
3.4.1. Factor Weight Measurement
The criticality assessment model is a multi-criteria decision-making process that considers several factors comprehensively. Since the preference of decision makers varies over the factors, different weights need to be distributed to the factors. The analytical hierarchical process (AHP) is widely used to determine the relative weights among factors. The AHP is a powerful tool to analyze problems especially in a hierarchical framework [45]. Thus, it can help to establish the criticality assessment model as the factor structure of the model has two hierarchies (category level and factor level).
The AHP is a method that is dependent on an expert survey to evaluate the relative importance between factors. Experts are given two factors on which to compare importance and asked to answer which factor is more important and how important it is on a 1–9 scale. Since the AHP is based on the subjective opinions of experts, it is necessary to check the reliability of answers. The consistency ratio (CR) is commonly used as an indicator of consistency. The consistency ratio must be smaller than a certain threshold, and the range from 0.1 to 0.2 is widely adopted [55]. Therefore, if the consistency ratio of an answer is less than the determined threshold, the answer is acceptable to calculate the relative weights.
This study surveyed 10 experts (5 researchers, 3 from an engineering company and 2 government officers) whose average experience is 13.4 years in the maintenance field of sewer pipes to conduct the AHP. Each expert was asked to evaluate the relative importance between the given options. Since the factor structure for the criticality assessment has two hierarchies, the final weights of the factors were determined by the product of the category weight and the factor weight. This study selectively used the five to eight responses for which the consistency ratio was less than 10% in order to calculate the final weights and adjust the weights so that their sum equals 1.
3.4.2. Factor Scoring
The factor scores, which indicate the relative scale of impact, are determined by classification according to certain criteria. This approach is needed because the scale of impact is greatly difficult to measure [44,46]. Most of the previous studies that deal with the criticality of sewer pipes selected an n-point scoring system [11,44,45,48,49]. The scoring system evaluates the sewer pipes according to the criteria in the physical characteristic and the spatial characteristic (diameter, length, distance, etc.) dimensions (see Table 1).
This study selected three economic factors, six social factors and three environmental factors to assess the criticality of sewer pipes (see Table 1). Since the economic factors are the physical characteristics of sewer pipes, they were assessed according to the criteria in each pipe unit. On the other hand, the social and environmental factors (except for the roads) were mostly assessed according to the distance from the nearest sewer pipe. As for the road measure, roads exist all over the city just like sewer pipes, meaning that measuring the distance between the roads and the sewer pipes cannot properly divide the sewer pipes. Instead, the number of lanes was selected as a criterion to assess the sewer pipes because it can show the estimated traffic interruption on the roads in the case of pipe failure. Overall, this study established the criticality assessment criteria through three steps (Table 5): (1) presetting the criteria referred to in previous studies; (2) adjusting the criteria considering the population distributed in each score; and (3) reviewing and adjusting the criteria by experts.
3.5. Prioritization
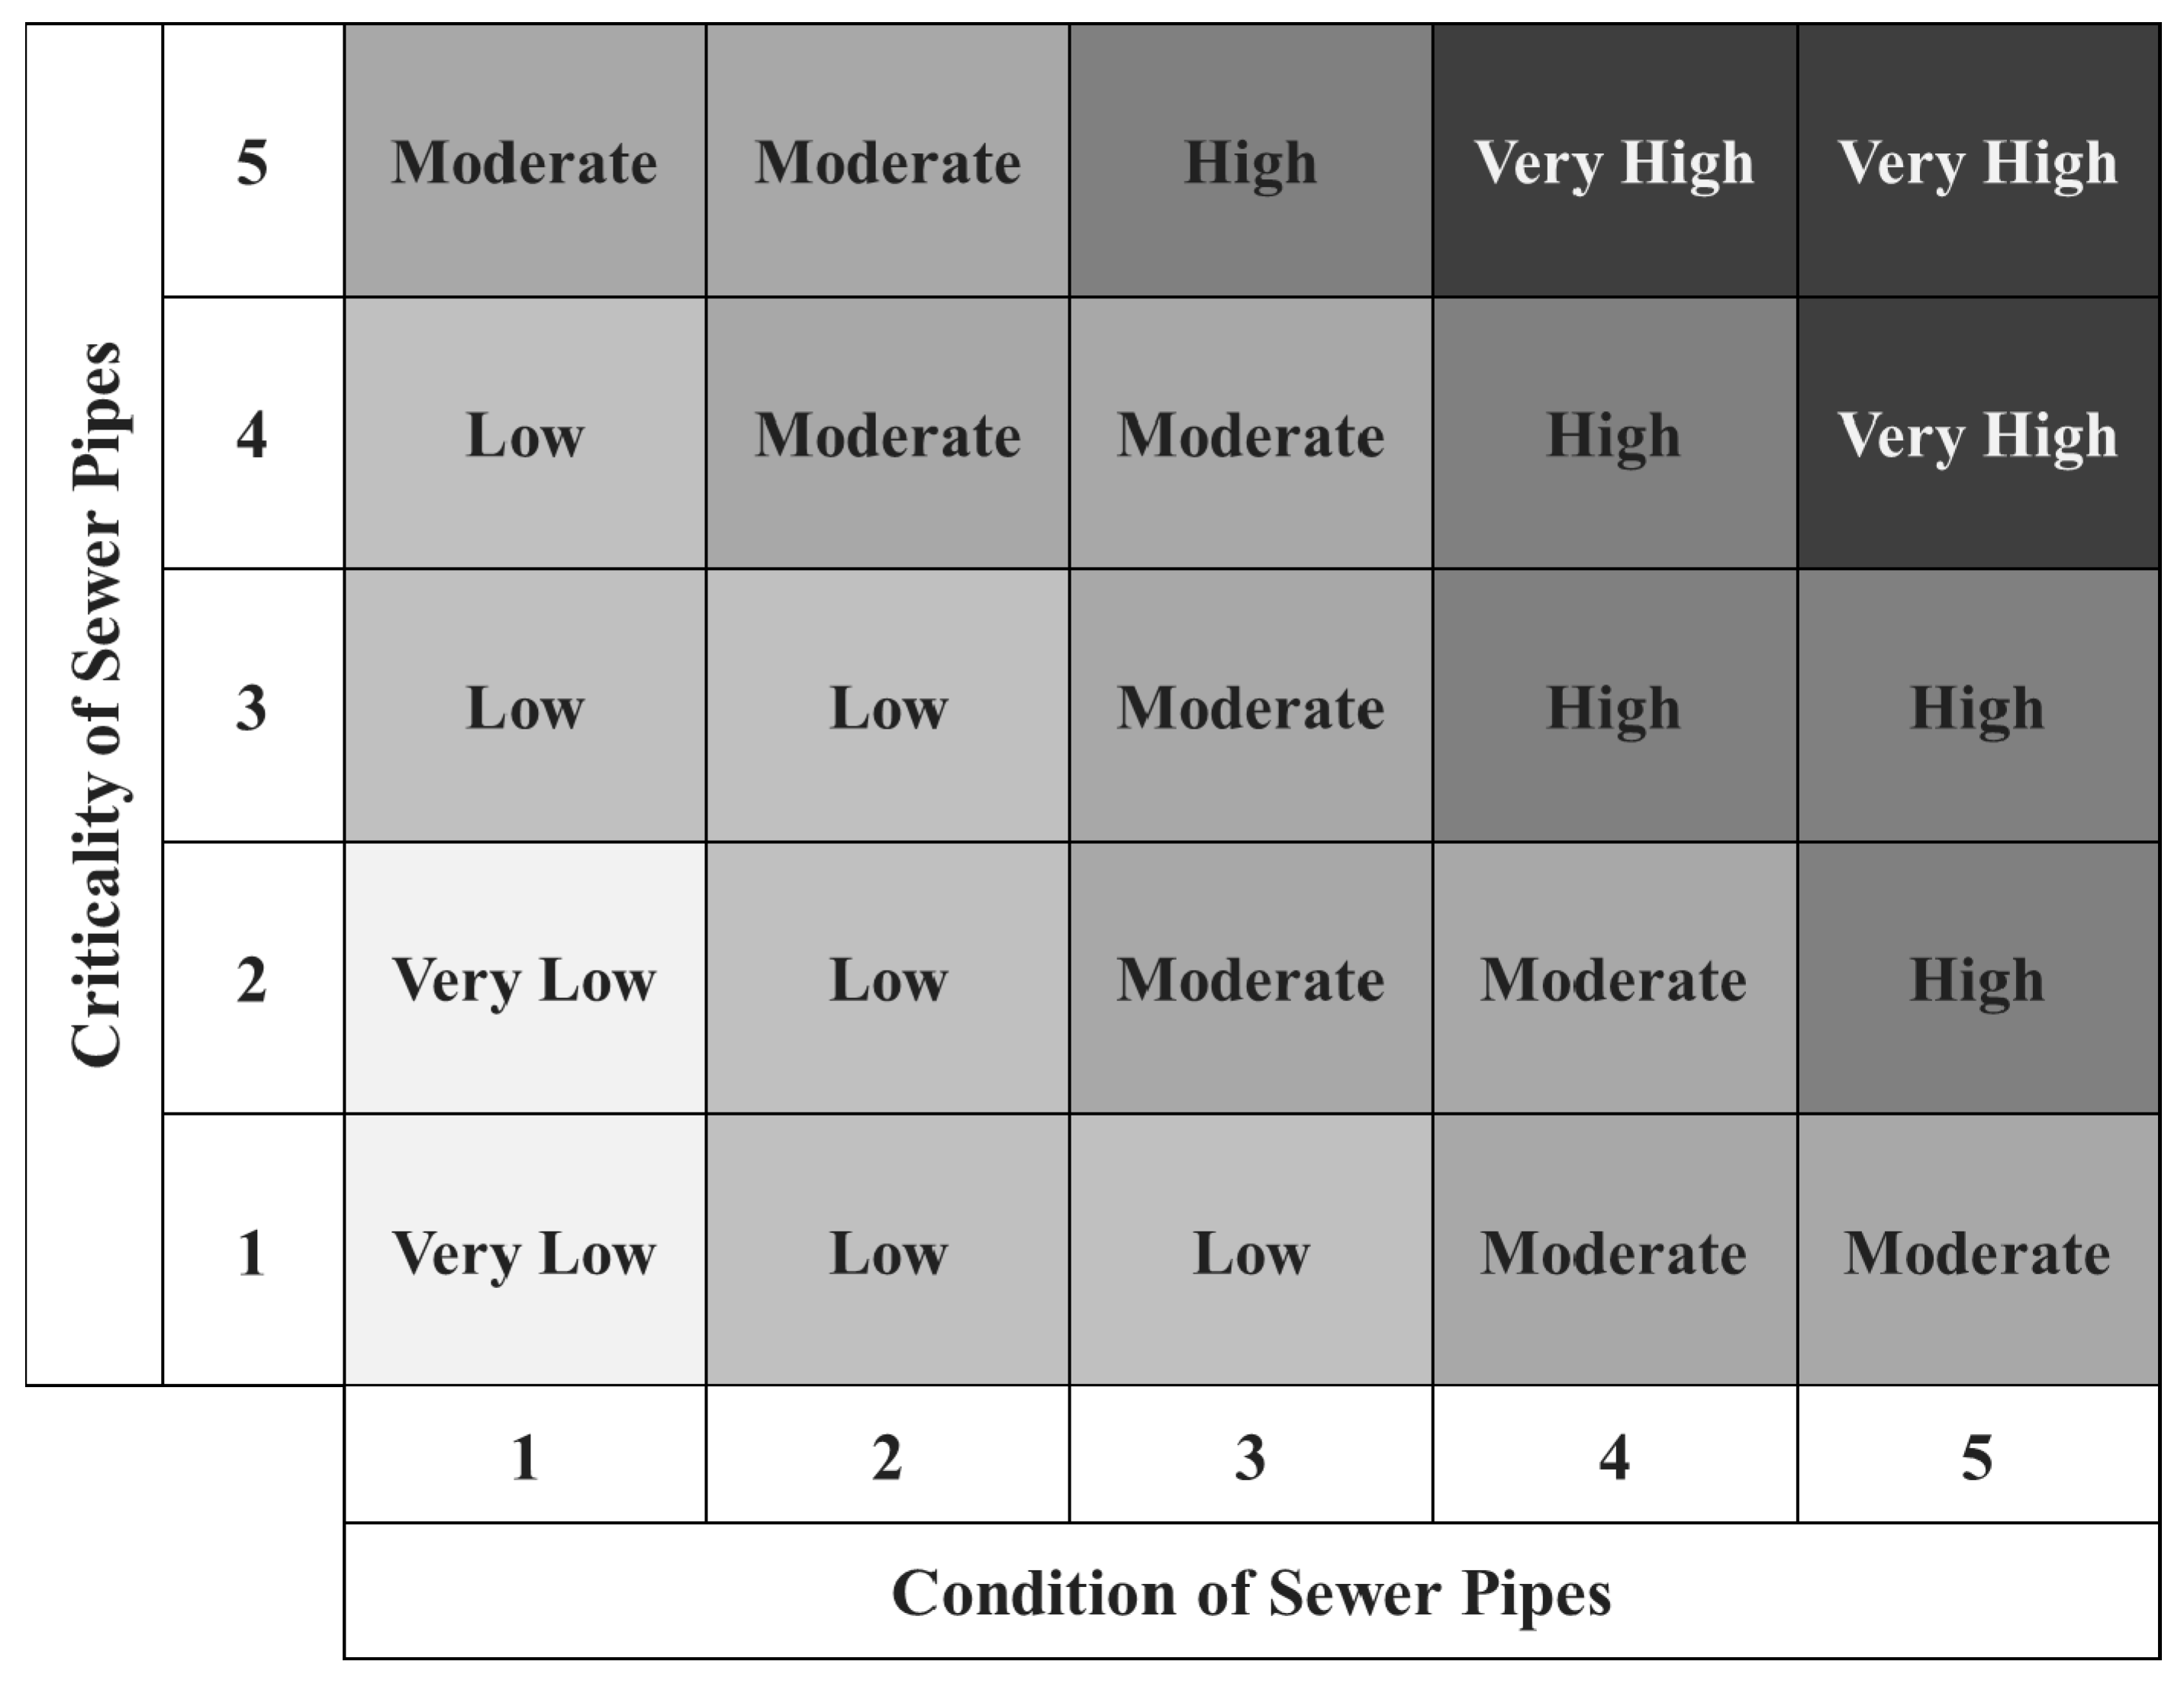
The purpose of prioritization is to classify the sewer pipes considering the results of the condition prediction model and the criticality assessment model together. This study adopted the risk matrix method, which is widely used in decision making, enabling the consideration of both probability and the resultant impact [21]. To form the risk matrix, it was necessary to set the cut-off values for the condition and the criticality. This study used the Jenks natural breaks optimization to determine the cut-off values. The Jenks natural breaks optimization is a method to find the optimal cut-off value that divides the dataset by minimizing the standard deviation within the same group and maximizing the standard deviation between groups.
After determining cut-off values, the risk matrix can be formed, as seen in Figure 2. The suggested risk matrix puts weight on the condition slightly more than on the criticality. This asymmetric matrix reflects the current tendency to prioritize the condition of sewer pipes. Therefore, the risk matrix can be a tool to prioritize sewer pipe rehabilitation by adding the index that has not been taken into account before (criticality), as well as considering the existing index on which the municipalities put weight (condition).
4. Results
4.1. Condition Prediction Model
4.1.1. Model Development and Test
The dataset used to develop the condition prediction model is the data for the sewer pipes that have been inspected. The total number of data points is 134,541. Of the total, there are 15,984 sewer pipes that are rated Grade A, which accounts for 11.9%. Grades B and C take up 32.2% and 55.9%, respectively. Additional information of data on the condition prediction factor is summarized in Appendix A Table A1.
The reliability of the condition prediction model is validated through the model test. As seen in Table 6, there are three types of performance indicators (i.e., accuracy, precision and recall), and this study tested the trained model by confirming a certain level of performance. Moreover, this study compared the model performance by the three methods (i.e., decision tree—C4.5, artificial neural network and logistic regression) which the previous studies have used. The result shows that the random forest method outperforms the other methods in terms of accuracy (Table 6).
One of the strengths of the random forest method is that it can present the feature importance on the classification of data in the decision trees. The feature importance of the trained model is shown in Figure 3. Remarkable features that affect the condition of sewer pipes are slope, length, depth and age, which are included in the physical category. The importance of physical status is well reported in previous research. Precipitation and population also show high importance. Although they have seldom been dealt with in the previous studies, the feature importance for these two measures is very high, while other environmental features have a far lower feature importance. This result suggests that decision makers should thoroughly consider more environmental features such as the precipitation and the population when estimating the condition of sewer pipes.
4.1.2. Model Application
The data for model application are from the sewer pipes that have no condition grade. The total number of corresponding sewer pipes is 147,850. Additional information of data used in the model application is summarized in Appendix A Table A2.
The application result is shown in Table 7. Though data for model development and application are different, the only difference is that the data used in the application do not have an inspection record. Since both pipes are designed and constructed using the same manual and used under the same circumstance, the condition of pipes used in development and application is assumed to change similarly. Since the performance of the developed model was validated by the model test, it can be said that the model will perform at a similar level when applied to data other than the training dataset. Since the output of the model is within continuous numbers from 0 to 1, an output over 0.5 can be considered as the “Bad” class. As a result, the number of sewer pipes predicted to be in a bad condition is 77,484, which accounts for 52.4% of the total.
4.2. Criticality Assessment Model
4.2.1. Factor Weight and Score
The weight of criticality factors obtained from the AHP is shown in Table 8. Among the 12 factors in the three categories, road, railway, river, depth and residential were considered as important factors by experts. The sum of weights of these five factors is above 0.7, and the importance of the remaining factors is slight. Among economic factors, the diameter and length of sewer pipes are not significantly important for criticality. Among social factors, the number of lanes and the distance to railways are the most important. This result is largely due to the fact that sewer pipes are usually buried under a road and/or railway. The distance to medical and commercial facilities is not important. Among environmental factors, the distances to forests and farmland are not significantly important. This result reflects the characteristics of an urbanized city (Seoul) which has a small amount of green area. Thus, the weight of these factors can vary according to regions and countries.
The scores for sewer pipe criticality factors according to our identified criteria are shown in Table 8. As for the economic factors, the sewer pipe scores are distributed relatively evenly in terms of the diameter and the length, whereas most of the sewer pipes score 5 or 4 in terms of the depth (98.6%). Social factors are composed of the point features (medical facility and educational facility), the line features (road and railway) and the polygon features (commercial area and residential area). Since the point features occupy a tiny space on the map, the proportion of low scores is higher than for other types of features. In particular, the sewer pipes evaluated by the educational facility measure are concentrated in score 1. The sewer pipes are not evaluated by the distance but by the number of lanes, meaning over 80% of sewer pipes are distributed in scores 1 and 2. Polygon features occupy a large spatial area, meaning the sewer pipes evaluated for the residential area are mostly in score 5. Lastly, the sewer pipes that are assessed for the environmental factors are distributed in the lower scores since Seoul is an urbanized city, meaning the number of natural objects is small. Nevertheless, the environmental factors should not be ignored as they are essential from the perspective of sustainability [16].
4.2.2. Criticality Assessment Results
The criticality score for sewer pipes is determined by the weighted sum of the weights calculated using the AHP and the factor scores. As shown in Figure 4, most of the sewer pipes are distributed between 2.0 and 3.0. Although the distribution is biased toward the lower scores, it does not mean that there is only a small portion of sewer pipes that should be inspected. The goal of criticality assessment is to identify the relative importance of sewer pipes in order to investigate which sewer pipes should be inspected earlier. Therefore, the criticality assessment model can provide important insights to support prioritizing the sewer pipe inspection program.
4.3. Prioritization Results
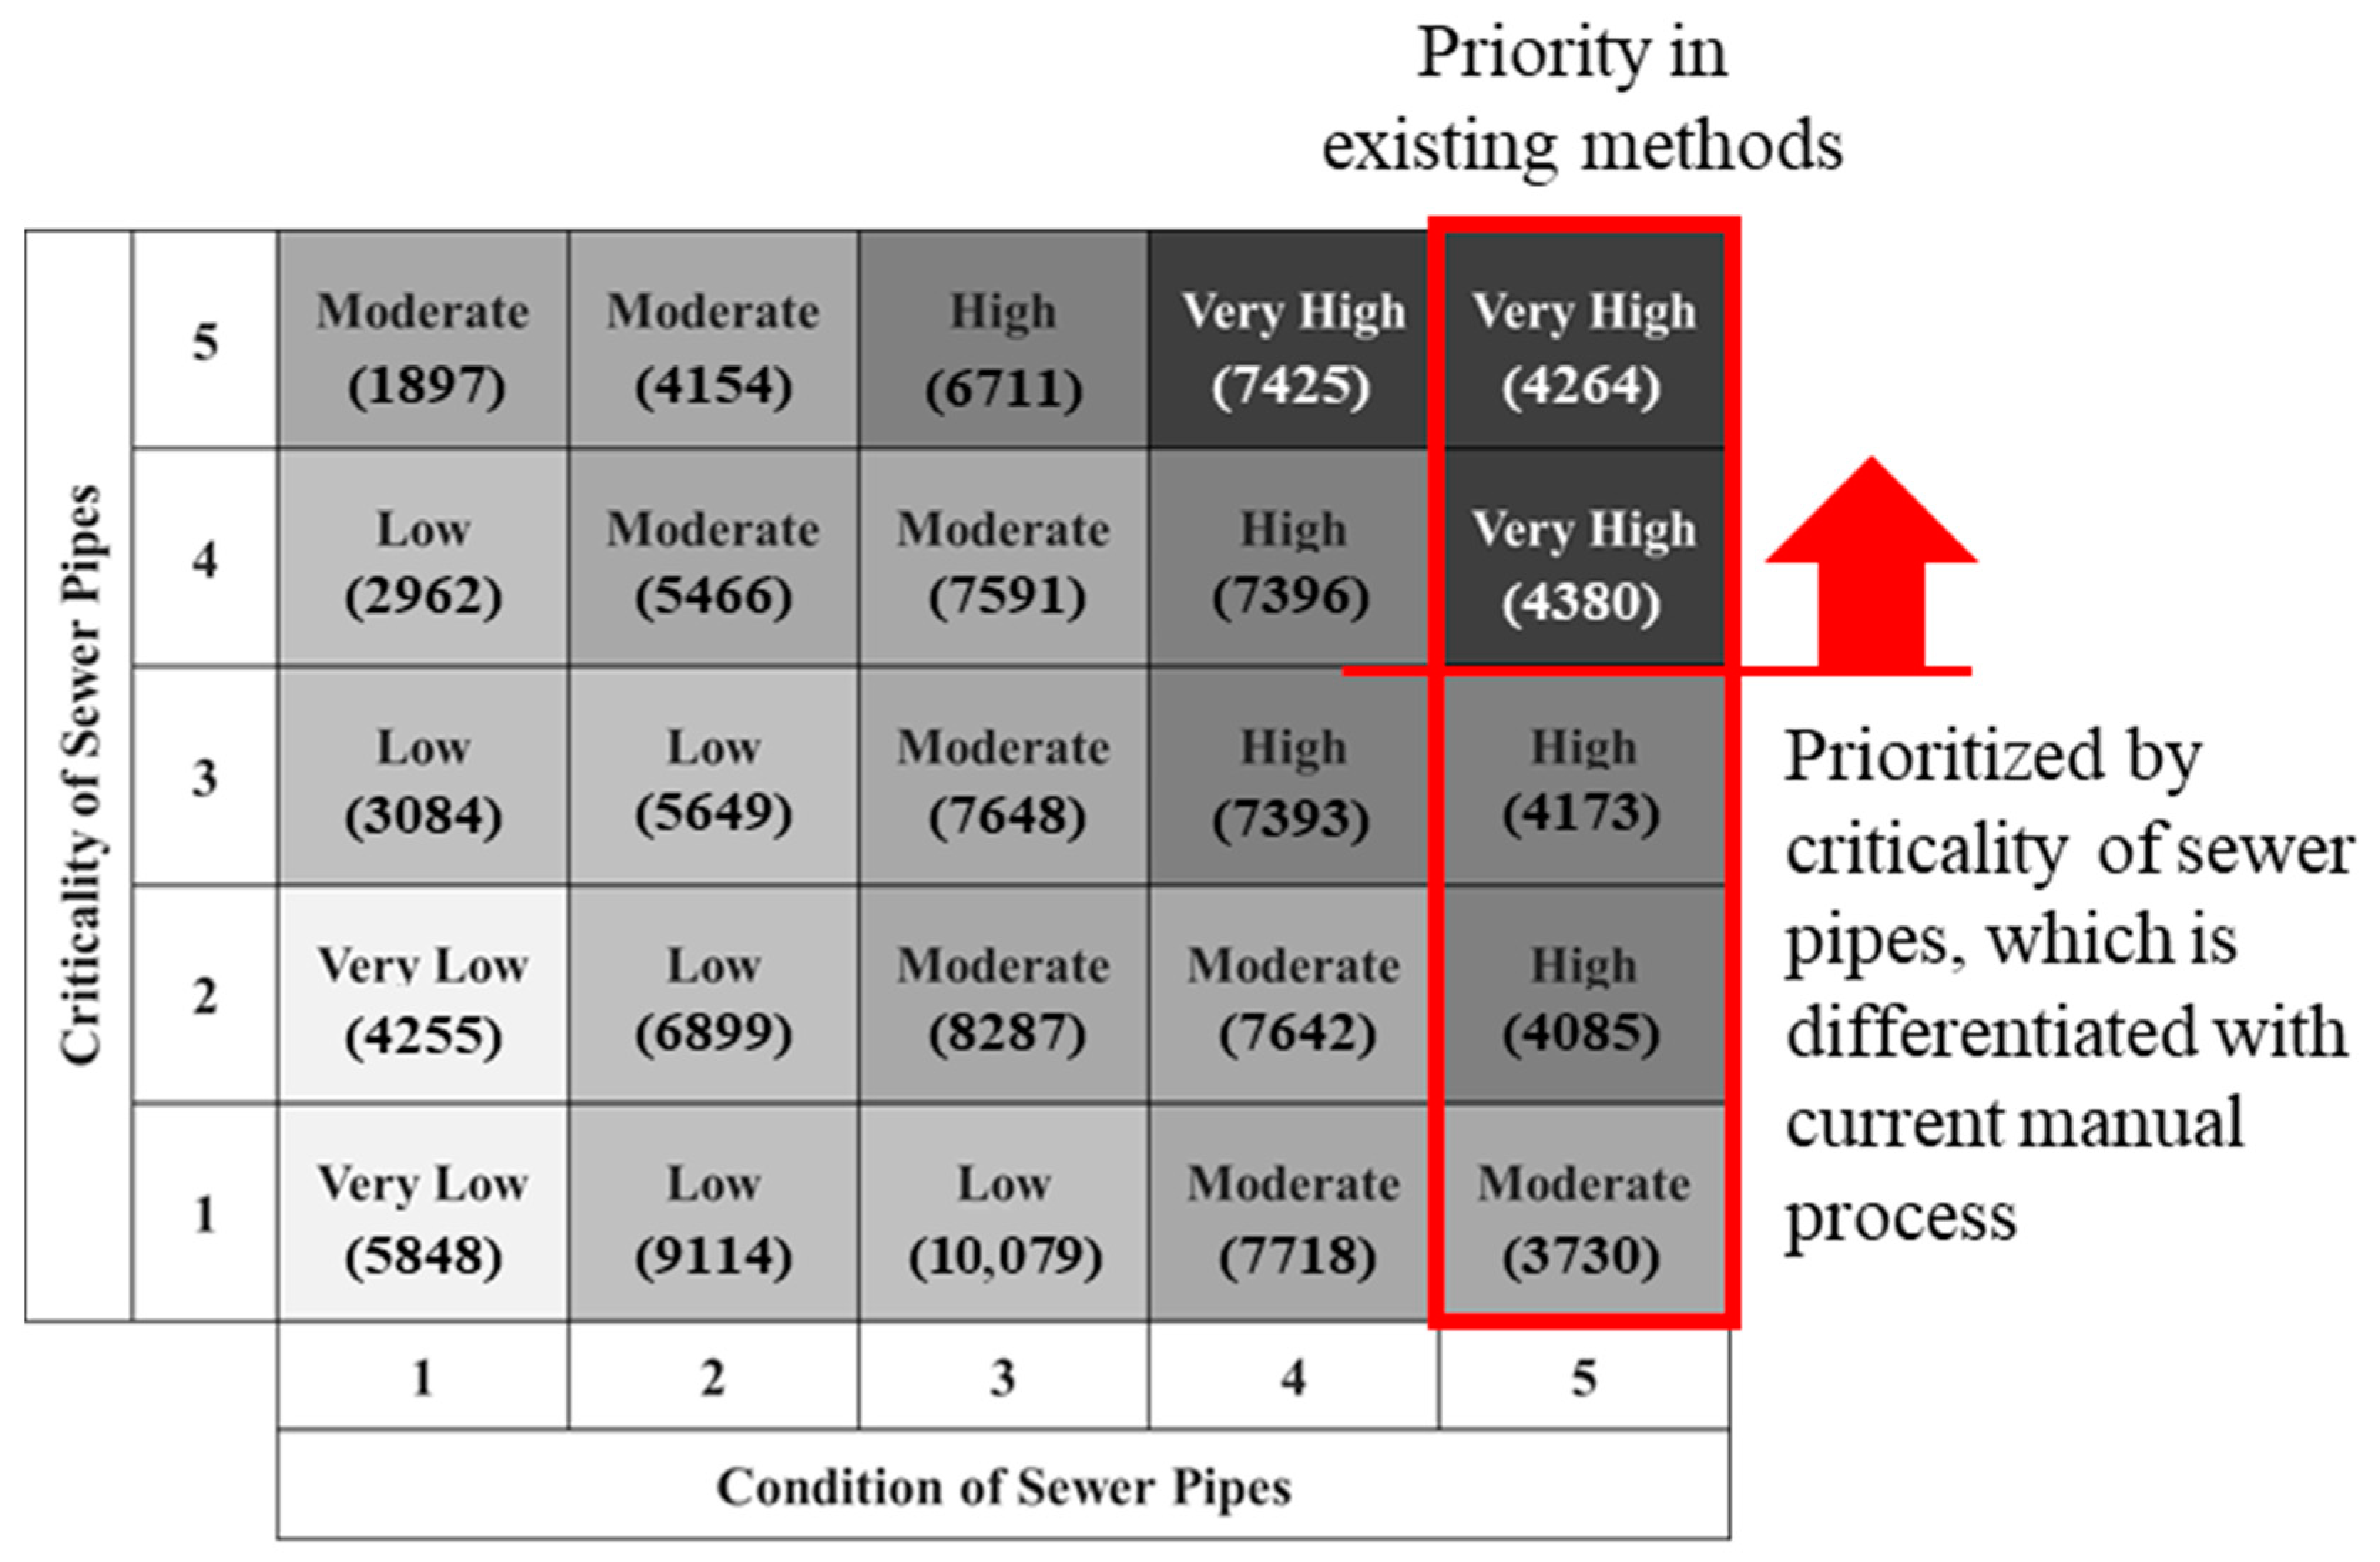
The risk of failure is the combination of the probability and the impact of failure (Baah et al., 2015). This study scrutinized what can influence the sewer pipe condition and what to consider in terms of the criticality to the vicinity. Then, the Jenks natural breaks optimization was applied to both criticality assessment and condition prediction to classify the sewer pipes into five groups through 10,000 iterations in order to find the best cut-off values. The cut-off values divided the condition scores quite evenly, but the range of group 5 for criticality is far wider than that of other groups. This difference occurs because the frequency of sewer pipes with a criticality score over 4 is scanty (0.1%). The risk matrix formed by the cut-off values is presented in Figure 5.
5. Discussion
5.1. Comparing Characteristics of High-Risk Sewer Pipes and Others
This study compared the sewer pipes in the “Very High” group with other sewer pipes in terms of the condition prediction and criticality assessment factors using a t test, and several differences were recognized.
First, in terms of conditional characteristics, the proportion of sewer pipes over 50 years old is larger in the “Very High” group by over 10%. This result is found because aging sewer pipes are more likely to fail due to deterioration. Additionally, the results show that there is more chance of risk for sewer pipes with a larger diameter. As for the length, we found that long sewer pipes are more represented in the “Very High” group. The impact of the burial depth has been controversial, as mentioned in previous research. The result of this study supports the argument of Chughtai and Zayed [18] and Salman and Salem [27], which insists that sewer pipes with shallow cover are subject to a high live load. Additionally, the results indicate the influence of the slope on the risk of failure. The roads near the sewer pipes in the “Very High” group are wider than in the other groups, meaning traffic interruption is expected to be more severe in the case of pipe failure; in addition, the live loads on the sewer pipes are larger in that group. On the other hand, the impact of road type shows a different result from previous studies. Earlier studies [18,31] insisted that the impact of a higher road class is larger than that of a lower road class, whereas our results imply that the impact of a collector road is larger than that of a minor arterial road. As for land use (which represents the sewage quality), our results show that the lower the sewage quality, the more heavily it influences the pipe condition. As for precipitation, our results show that the sewer pipes are overloaded in the wet years. On the other hand, the results for population show an inversely proportional impact on the pipe condition. The population is related to the pipe flow [21], meaning the pipe flow is slow in lower-population areas. This effect might be the result of the settlement of sediments due to low-speed flow. However, this interpretation cannot explain why a lot of high-risk sewer pipes are in the population range of 40,000~50,000.
Second, in terms of criticality, the results show that the distance to medical, educational, commercial and residential facilities, railways and rivers of the “Very High” group is closer than the distance of the rest of the pipes to facilities. These results are expectable because criticality means the impact to nearby areas when sewer pipe failure occurs. Thus, the sewer pipes in the “Very High” group are located nearby railways and rivers, given that these factors are weighted in the top three. Moreover, the location of sewer pipes moves to the suburbs as the risk of sewer pipes becomes lower, while the sewer pipes in the “Very High” group are concentrated in the center of Seoul. Related to this result, the distance to forests and farmland of the “Very High” group is farther than the distance of other groups. This result differentiates from a previous study which emphasized the distance to forests and farms [12].
5.2. Utility of Proposed Framework for Prioritizion of High-Risk Sewer Pipes
As shown in Figure 5, in the developed prioritization framework, the quantity of the “Very High” group of sewer pipes is 16,069 (7425 + 4264 + 4380). This result differentiates from the current prioritization process of Seoul which only considers the expected condition of sewer pipes, and it may derive 20,632 sewer pipes that are judged as being in a very bad condition. Additionally, previous manual processes could not systemically prioritize needed maintenance for the sewer pipes among the 20,632 sewer pipes which were in a very bad condition. The developed framework supports a reasonable decision process and prioritizes the 8644 high-risk sewer pipes by considering the economic, social and environmental aspects of the pipes (Figure 6).
6. Conclusions
This study developed a prioritization framework for the sustainable management of sewer pipes, which is composed of a condition prediction model and a criticality assessment model to aid in determining which sewer pipes should be inspected earlier based on risk. In the condition prediction model, five physical factors (age, diameter, length, depth and slope) and five environmental factors (precipitation, traffic volume, road class, sewage type and population) were identified as influencing the deterioration of sewer pipes. Then, 134,541 data points for sewer pipes having their condition determined by inspection were used to train the model using the random forest classifier method. After the model performance met a certain level, the model was applied to 147,850 data points for sewer pipes. As for the criticality assessment model, 12 factors were considered to evaluate the sewer pipes in terms of economic, social and environmental impacts. Then, each sewer pipe was assessed based on the criteria for the criticality factors. Finally, the risk matrix was formed using the results from both models, and the characteristics of the high-risk group were investigated.
The result shows that sewer pipes with the highest risk are located near railways, rivers and roads that have many lanes. In addition, the result indicates the influence of physical factors on the risk for sewer pipes. Meanwhile, the effects of diameter, length, depth and slope were different from the findings of previous researchers; furthermore, the effect of age in the early stages showed a different shape from the bathtub curve suggested by Singh and Adachi [50]. This difference might have occurred because a preventive inspection cannot find the breaks occurring during construction.
One of the contributions of this study is the improvement in finding the sewer pipes which are likely to fail. About 40% of the pipes chosen for inspection by the current manual process turned out to be in a bad condition (Grades A and B), whereas the condition prediction model can successfully find the bad sewer pipes with about 70% accuracy. Therefore, the model proposed in this study is expected to make the municipalities spend money more efficiently by allocating the rehabilitation budget to the more urgent sewer pipes. Moreover, the result of this study indicates that decision makers should consider the various environmental features when estimating the condition of sewer pipes. In particular, the result shows that precipitation and population influence the risk of sewer pipe failure. This study also took into account the possible indirect impacts as well as the direct impacts. The consideration of criticality can satisfy the key principles of asset management presented by the BSI [16]. Consequently, the prioritization framework proposed in this study supports reasonable decision making of the municipalities by prioritizing the high-risk sewer pipes considering the criticality of economic, social and environmental impacts of failure of sewer pipes.
Despite the contributions of this study, there are also several limitations. First, this study could not consider all factors that previous research had discovered to have a significant influence on the deterioration of sewer pipes. In particular, the soil type and the groundwater level are frequently dealt with in many studies, but this study ignored those factors since collection of the relevant data was restricted to the public. In Korea, municipalities and companies try to accumulate and store more detailed historical data including additional properties. Thus, this limitation can be overcome in the near future. Another limitation is that the type and condition of sewer pipes were not fully specified. Previous studies categorized the failure type of sewer pipes into structural failure and operational failure. However, this study assessed the sewer pipes by a single indicator (i.e., the condition grade) because the current database stores the inspection record only by the condition grade. Since failure can occur for diverse reasons, it is necessary to investigate the deterioration factors by the failure type. Therefore, in future research, when the database is advanced to document the detailed condition of sewer pipes, it will be possible to analyze the deterioration pattern by the failure type.
Author Contributions
J.L. and S.H.H. conceptualized. J.L., C.Y.P. and S.B. developed the questionnaire and collected data. J.L. and C.Y.P. analyzed the data and wrote the manuscript. S.Y. validated the results and revised the manuscript. All authors have read and agreed to the published version of the manuscript.
Funding
This work was supported by the 2016 Yeungnam University Research Grant.
Institutional Review Board Statement
Not applicable.
Informed Consent Statement
Not applicable.
Data Availability Statement
Not applicable.
Conflicts of Interest
The authors declare no conflict of interest.
Appendix A

Table A1.
Data summary for the development of condition prediction model.
| Age (years) | 0~10 | 10~20 | 20~30 | 30~40 | 40~50 | >50 |
| 2676 (2.0%) | 24,008 (17.8%) | 28,356 (21.1%) | 31,003 (23.0%) | 11,900 (8.8%) | 36,598 (27.2%) | |
| Diameter (mm) | 0~400 | 400~500 | 500~600 | 600~700 | 700~800 | >800 |
| 6411 (4.8%) | 55,937 (41.6%) | 51,001 (37.9%) | 4135 (3.1%) | 7291 (5.4%) | 9766 (7.3%) | |
| Length (m) | 0~10 | 10~20 | 20~30 | 30~40 | 40~50 | >50 |
| 17,903 (13.3%) | 22,661 (16.8%) | 28,167 (20.9%) | 26,817 (19.9%) | 20,418 (15.2%) | 18,575 (13.8%) | |
| Depth (m) | 0~0.5 | 0.5~1 | 1~3 | >3 | ||
| 18,710 (13.9%) | 74,664 (55.5%) | 40,474 (30.1%) | 693 (0.5%) | |||
| Slope (‰) | 0 | 0~5 | 5~10 | 10~30 | 30~50 | >50 |
| 1929 (1.4%) | 30,954 (23.0%) | 17,224 (12.8%) | 36,120 (26.8%) | 17,247 (12.8%) | 31,067 (23.1%) | |
| Lane | 0~1 | 1~2 | 2~3 | 3~4 | 4~5 | >5 |
| 53,849 (40.0%) | 48,894 (36.3%) | 3420 (2.5%) | 11,734 (8.7%) | 1744 (1.3%) | 14,900 (11.1%) | |
| Road Type | Major arterial | Minor arterial | Collector | Alley | No-way | |
| 5061 (3.8%) | 82,496 (61.3%) | 39,980 (29.7%) | 6646 (4.9%) | 358 (0.3%) | ||
| Precipitation (mm) | 0~1200 | 1200~1250 | 1250~1300 | 1300~1350 | 1350~1400 | >1400 |
| 10,470 (7.8%) | 28,242 (21.0%) | 36,906 (27.4%) | 42,907 (31.9%) | 7580 (5.6%) | 8436 (6.3%) | |
| Land Use | Industrial | Commercial | Rural | Residential | Others | |
| 2568 (1.9%) | 14,596 (10.8%) | 1233 (0.9%) | 56,383 (41.9%) | 59,761 (44.4%) | ||
| Population | 0~10,000 | 10,000~20,000 | 20,000~30,000 | 30,000~40,000 | 40,000~50,000 | >50,000 |
| 5862 (4.4%) | 26,353 (19.6%) | 56,036 (41.6%) | 37,373 (27.8%) | 6993 (5.2%) | 1924 (1.4%) |
Table A2.
Data summary for the application of condition prediction model.
| Age (years) | 0~10 | 10~20 | 20~30 | 30~40 | 40~50 | >50 |
| 23,110 (15.6%) | 13,866 (9.4%) | 19,672 (13.3%) | 21,034 (14.2%) | 9791 (6.6%) | 60,404 (40.8%) | |
| Diameter (mm) | 0~400 | 400~500 | 500~600 | 600~700 | 700~800 | >800 |
| 22,746 (15.4%) | 59,578 (40.3%) | 40,792 (27.6%) | 3734 (2.5%) | 8825 (6.0%) | 12,202 (8.3%) | |
| Length (m) | 0~10 | 10~20 | 20~30 | 30~40 | 40~50 | >50 |
| 39,856 (27.0%) | 29,470 (19.9%) | 27,594 (18.7%) | 21,463 (14.5%) | 14,724 (10.0%) | 14,770 (10.0%) | |
| Depth (m) | 0~0.5 | 0.5~1 | 1~3 | >3 | ||
| 20,906 (14.1%) | 73,027 (49.4%) | 51,907 (35.1%) | 2037 (1.4%) | |||
| Slope (‰) | 0 | 0~5 | 5~10 | 10~30 | 30~50 | >50 |
| 2959 (2.0%) | 29,037 (19.6%) | 18,233 (12.3%) | 38,302 (25.9%) | 19,458 (13.2%) | 39,888 (27.0%) | |
| Lane | 0~1 | 1~2 | 2~3 | 3~4 | 4~5 | >5 |
| 71,136 (48.1%) | 49,420 (33.4%) | 3548 (2.4%) | 11,034 (7.5%) | 1911 (1.3%) | 10,828 (7.3%) | |
| Road Type | No-way | Alley | Collector | Minor arterial | Major arterial | |
| 387 (0.3%) | 5730 (3.9%) | 48,779 (33.0%) | 83,144 (56.2%) | 9837 (6.7%) | ||
| Precipitation (mm) | 0~1200 | 1200~1250 | 1250~1300 | 1300~1350 | 1350~1400 | >1400 |
| 11,350 (7.7%) | 28,319 (19.2%) | 43,008 (29.1%) | 40,047 (27.1%) | 10,284 (7.0%) | 14,869 (10.1%) | |
| Land Use | Others | Residential | Rural | Commercial | Industrial | |
| 78,627 (53.2%) | 52,969 (35.8%) | 764 (0.5%) | 12,987 (8.8%) | 2530 (1.7%) | ||
| Population | 0~10,000 | 10,000~20,000 | 20,000~30,000 | 30,000~40,000 | 40,000~50,000 | >50,000 |
| 8785 (5.9%) | 28,209 (19.1%) | 60,974 (41.2%) | 39,605 (26.8%) | 9203 (6.2%) | 1101 (0.7%) |
References
- American Society of Civil Engineers (ASCE). 2021 Infrastructure Report Card; American Society of Civil Engineers: Reston, VA, USA, 2021. [Google Scholar]
- Ariaratnam, S.T.; El-Assaly, A.; Yang, Y. Assessment of infrastructure inspection needs using logistic models. J. Infrastruct. Syst. 2001, 7, 160–165. [Google Scholar] [CrossRef]
- Wirahadikusumah, R.; Abraham, D.; Iseley, T. Challenging issues in modeling deterioration of combined sewers. J. Infrastruct. Syst. 2001, 7, 77–84. [Google Scholar] [CrossRef]
- American Society of Civil Engineers. Failure to Act: Closing the Infrastructure Investment Gap for America’s Economic Future; American Society of Civil Engineers: Reston, VA, USA, 2016. [Google Scholar]
- Ingenium, I. International Infrastructure Management Manual; Association of Local Government Engineering NZ Inc. (INGENIUM); The Institute of Public Works Engineering of Australia (IPWEA): Sydney, Australia, 2011. [Google Scholar]
- Ugarelli, R.; Venkatesh, G.; Brattebø, H.; Di Federico, V.; Sægrov, S. Asset management for urban wastewater pipeline networks. J. Infrastruct. Syst. 2010, 16, 112–121. [Google Scholar] [CrossRef]
- Brunetto, Y.; Xerri, M.; Nelson, S. Building a proactive, engagement culture in asset management organizations. J. Manag. Eng. 2014, 30, 04014014. [Google Scholar] [CrossRef] [Green Version]
- Henderson, K.; Pahlenkemper, G.; Kraska, O. Integrated asset management–an investment in sustainability. Procedia Eng. 2014, 83, 448–454. [Google Scholar] [CrossRef]
- Chae, M.J. Automated Interpretation and Assessment of Sewer Pipeline Infrastructure; Purdue University: West Lafayette, IN, USA, 2001. [Google Scholar]
- Khan, Z.; Zayed, T.; Moselhi, O. Stochastic Analysis of Factors Affecting Sewer Network Operational Condition. In ICPTT 2009: Advances and Experiences with Pipelines and Trenchless Technology for Water, Sewer, Gas, and Oil Applications; Shanghai, China, 2009; pp. 389–400. Available online: https://ascelibrary.org/doi/abs/10.1061/41073(361)41 (accessed on 23 June 2021).
- Baah, K.; Dubey, B.; Harvey, R.; McBean, E. A risk-based approach to sanitary sewer pipe asset management. Sci. Total Environ. 2015, 505, 1011–1017. [Google Scholar] [CrossRef] [PubMed]
- Bădilă, I.N.; Rusu, T.; Gabor, T. Study on the Impact of Sewer Pipes on the Environment. J. Environ. Res. Prot. 2014, 11, 1–10. [Google Scholar]
- Halfawy, M.R.; Dridi, L.; Baker, S. Integrated decision support system for optimal renewal planning of sewer networks. J. Comput. Civ. Eng. 2008, 22, 360–372. [Google Scholar] [CrossRef] [Green Version]
- Ana, E.; Bauwens, W. Modeling the structural deterioration of urban drainage pipes: The state-of-the-art in statistical methods. Urban Water J. 2010, 7, 47–59. [Google Scholar] [CrossRef]
- Kley, G.; Caradot, N. Review of Sewer Deterioration Models; KWB Project SEMA Report; Veolia: Berlin, Germany, 2013. [Google Scholar]
- British Standards Institution. 55-2: Asset Management. In Part 2: Guidelines for the Application of PAS 55-1; British Standards Institution: London, UK, 2008. [Google Scholar]
- Montoya Montoya, A. The Influence of Different Characteristics on the Probabilities of Failure of Sewer Pipes. Master’s Thesis, Delft University of Technology, 2019. Available online: https://repository.tudelft.nl/islandora/object/uuid:62bbc111-402f-4e51-b4b6-bfe979ee691d?collection=education (accessed on 23 June 2021).
- Chughtai, F.; Zayed, T. Infrastructure condition prediction models for sustainable sewer pipelines. J. Perform. Constr. Facil. 2008, 22, 333–341. [Google Scholar] [CrossRef]
- Malek Mohammadi, M.; Najafi, M.; Kermanshachi, S.; Kaushal, V.; Serajiantehrani, R. Factors Influencing the Condition of Sew-er Pipes: State-of-the-Art Review. J. Pipeline Syst. Eng. Pract. 2020, 11, 03120002. [Google Scholar] [CrossRef]
- Kulandaivel, G. Sewer Pipeline Condition Prediction Using Neural Network Models. Master’s Thesis, Michigan State University, 2004. Available online: https://0-www-proquest-com.brum.beds.ac.uk/docview/305157063/previewPDF/2E2FA03FF21D42DDPQ/1?accountid=11933 (accessed on 23 June 2021).
- Malek Mohammadi, M. Development of Condition Prediction Models for Sanitary Sewer Pipes. Ph.D. Thesis, University of Texas at Arlington, 2019. Available online: https://rc.library.uta.edu/uta-ir/handle/10106/28665 (accessed on 23 June 2021).
- Salman, B. Infrastructure Management and Deterioration Risk Assessment of Wastewater Collection Systems. Ph.D. Thesis, University of Cincinnati, 2010. Available online: https://etd.ohiolink.edu/apexprod/rws_olink/r/1501/10?clear=10&p10_accession_num=ucin1282051343 (accessed on 23 June 2021).
- Abraham, D.M.; Wirahadikusumah, R.; Short, T.; Shahbahrami, S. Optimization modeling for sewer network management. J. Constr. Eng. Manag. 1998, 124, 402–410. [Google Scholar] [CrossRef]
- Bakry, I.; Alzraiee, H.; Kaddoura, K.; El Masry, M.; Zayed, T. Condition prediction for chemical grouting rehabilitation of sewer networks. J. Perform. Constr. Facil. 2016, 30, 04016042. [Google Scholar] [CrossRef]
- Jeong, H.S.; Baik, H.-S.; Abraham, D.M. An ordered probit model approach for developing markov chain based deterioration model for wastewater infrastructure systems. In Pipelines 2005: Optimizing Pipeline Design, Operations, and Maintenance in Today’s Economy; 2005; pp. 649–661. Available online: https://ascelibrary.org/doi/abs/10.1061/40800(180)52 (accessed on 23 June 2021).
- Ana, E.; Bauwens, W.; Pessemier, M.; Thoeye, C.; Smolders, S.; Boonen, I.; De Gueldre, G. An investigation of the factors influencing sewer structural deterioration. Urban Water J. 2009, 6, 303–312. [Google Scholar] [CrossRef]
- Salman, B.; Salem, O. Risk assessment of wastewater collection lines using failure models and criticality ratings. J. Pipeline Syst. Eng. Pract. 2012, 3, 68–76. [Google Scholar] [CrossRef]
- Davies, J.; Clarke, B.; Whiter, J.; Cunningham, R. Factors influencing the structural deterioration and collapse of rigid sewer pipes. Urban Water 2001, 3, 73–89. [Google Scholar] [CrossRef]
- Baur, R.; Herz, R. Selective inspection planning with ageing forecast for sewer types. Water Sci. Technol. 2002, 46, 389–396. [Google Scholar] [CrossRef]
- Ribalta, M.; Mateu, C.; Bejar, R.; Rubión, E.; Echeverria, L.; Varela Alegre, F.J.; Corominas, L. Sediment Level Prediction of a Combined Sewer System Using Spatial Features. Sustainability 2021, 13, 4013. [Google Scholar] [CrossRef]
- El-Abbasy, M.S.; Zayed, T.; El Chanati, H.; Mosleh, F.; Senouci, A.; Al-Derham, H. Simulation-based deterioration patterns of water pipelines. Struct. Infrastruct. Eng. 2019, 15, 965–982. [Google Scholar] [CrossRef]
- Salman, B.; Salem, O. Modeling failure of wastewater collection lines using various section-level regression models. J. Infrastruct. Syst. 2012, 18, 146–154. [Google Scholar] [CrossRef]
- Nasrin, T.; Sharma, A.K.; Muttil, N. Impact of short duration intense rainfall events on sanitary sewer network performance. Water 2017, 9, 225. [Google Scholar] [CrossRef] [Green Version]
- Marlow, D.; Heart, S.; Burn, S.; Urquhart, A.; Gould, S.; Anderson, M.; Cook, S.; Ambrose, M.; Madin, B.; Fitzgerald, A. Condition Assessment Strategies and Protocols for Water and Wastewater Utility Assets; CSIRO: Australia, 2007; Available online: http://hdl.handle.net/102.100.100/127479?index=1 (accessed on 23 June 2021).
- Angarita, H.; Niño, P.; Vargas, D.; Hernández, N.; Torres, A. Identifying explanatory variables of structural state for optimum asset management of urban drainage networks: A pilot study for the city of Bogota. Ing. Investig. 2017, 37, 6–16. [Google Scholar] [CrossRef]
- Hawari, A.; Alkadour, F.; Elmasry, M.; Zayed, T. A state of the art review on condition assessment models developed for sewer pipelines. Eng. Appl. Artif. Intell. 2020, 93, 103721. [Google Scholar] [CrossRef]
- Baik, H.-S.; Jeong, H.S.; Abraham, D.M. Estimating transition probabilities in Markov chain-based deterioration models for management of wastewater systems. J. Water Resour. Plan. Manag. 2006, 132, 15–24. [Google Scholar] [CrossRef]
- Kleiner, Y.; Sadiq, R.; Rajani, B. Modeling failure risk in buried pipes using fuzzy Markov deterioration process. In Pipeline Engineering and Construction: What’s on the Horizon? 2004; pp. 1–12. Available online: https://ascelibrary.org/doi/abs/10.1061/40745(146)7 (accessed on 23 June 2021).
- Le Gat, Y. Modelling the deterioration process of drainage pipelines. Urban Water J. 2008, 5, 97–106. [Google Scholar] [CrossRef]
- Tran, D.; Perera, B.; Ng, A. Neural network based prediction models for structural deterioration of urban drainage pipes. In Land, Water and Environmental Management: Integrated Systems for Sustainability, Proceedings, Christchurch; 2007; pp. 2264–2270. Available online: https://citeseerx.ist.psu.edu/viewdoc/download?doi=10.1.1.563.9704&rep=rep1&type=pdf (accessed on 23 June 2021).
- Syachrani, S.; Jeong, H.S.D.; Chung, C.S. Decision tree-based deterioration model for buried wastewater pipelines. J. Perform. Constr. Facil. 2013, 27, 633–645. [Google Scholar] [CrossRef]
- Harvey, R.R.; McBean, E.A. Predicting the structural condition of individual sanitary sewer pipes with random forests. Can. J. Civ. Eng. 2014, 41, 294–303. [Google Scholar] [CrossRef]
- Hahn, M.A.; Palmer, R.N.; Merrill, M.S.; Lukas, A.B. Expert system for prioritizing the inspection of sewers: Knowledge base formulation and evaluation. J. Water Resour. Plan. Manag. 2002, 128, 121–129. [Google Scholar] [CrossRef] [Green Version]
- Elsawah, H.; Bakry, I.; Moselhi, O. Decision support model for integrated risk assessment and prioritization of intervention plans of municipal infrastructure. J. Pipeline Syst. Eng. Pract. 2016, 7, 04016010. [Google Scholar] [CrossRef]
- Vladeanu, G.J.; Matthews, J.C. Consequence-of-failure model for risk-based asset management of wastewater pipes using AHP. J. Pipeline Syst. Eng. Pract. 2019, 10, 04019005. [Google Scholar] [CrossRef]
- Anbari, M.J.; Tabesh, M.; Roozbahani, A. Risk assessment model to prioritize sewer pipes inspection in wastewater collection networks. J. Environ. Manag. 2017, 190, 91–101. [Google Scholar] [CrossRef]
- Rossi, R.C., II. Criticality and Risk Assessment for Pipe Rehabilitation in the City of Santa Barbara Sewer System. Master’s Thesis, California Polytechnic State University, 2015. Available online: https://digitalcommons.calpoly.edu/cgi/viewcontent.cgi?referer=https://0-scholar-google-com.brum.beds.ac.uk/&httpsredir=1&article=2553&context=theses (accessed on 23 June 2021).
- Son, J.; Lee, J.; Oh, J. Sewer CCTV Inspection Prioritization Based on Risk Assessment. J. Korean Soc. Civ. Eng. 2017, 37, 585–592. [Google Scholar]
- Kabir, G.; Balek, N.B.C.; Tesfamariam, S. Consequence-based framework for buried infrastructure systems: A Bayesian belief network model. Reliab. Eng. Syst. Saf. 2018, 180, 290–301. [Google Scholar] [CrossRef]
- Singh, A.; Adachi, S. Bathtub curves and pipe prioritization based on failure rate. Built Environ. Proj. Asset Manag. 2013, 3, 105–122. [Google Scholar] [CrossRef]
- Kim, K.; Kim, J.; Kwak, T.-Y.; Chung, C.-K. Logistic regression model for sinkhole susceptibility due to damaged sewer pipes. Nat. Hazards 2018, 93, 765–785. [Google Scholar] [CrossRef]
- Miles, S.W.; Styers, F.C.; Nesbit, C.M. Setting Pipeline Rehabilitation Priorities to Achieve “Best” Results—A Case Study Using Condition and Criticality Criteria. In Pipelines 2007: Advances and Experiences with Trenchless Pipeline Projects; 2007; pp. 1–10. Available online: https://ascelibrary.org/doi/abs/10.1061/40934(252)72 (accessed on 23 June 2021).
- Kaddoura, K.; Zayed, T. Criticality Model to Prioritize Pipeline Rehabilitation Decisions. In Pipelines 2018: Condition Assessment, Construction, and Rehabilitation; American Society of Civil Engineers: Reston, VA, USA, 2018; pp. 75–85. [Google Scholar]
- Şen, Z. Average areal precipitation by percentage weighted polygon method. J. Hydrol. Eng. 1998, 3, 69–72. [Google Scholar] [CrossRef]
- Saaty, T.L. How to make a decision: The analytic hierarchy process. Eur. J. Oper. Res. 1990, 48, 9–26. [Google Scholar] [CrossRef]
Figure 1.
Changes in budget for sewer system maintenance in Seoul (Seoul 2019, KRW billion).

Figure 2.
Risk matrix (modified from [11]).
Figure 2.
Risk matrix (modified from [11]).

Figure 3.
Feature importance of the condition prediction model.

Figure 4.
Histogram of the criticality assessment results.

Figure 5.
Risk matrix determined by condition and criticality.

Figure 6.
Prioritization Result by Proposed Framework.

Table 1.
Factors for the condition prediction and criticality assessment.
| Model | Category | Factor | Reference |
|---|---|---|---|
| Condition Prediction | Physical | Age | [21,28,50] |
| Diameter | [2,10,18,24,25,31] | ||
| Length | [18,25,26,28,32] | ||
| Depth | [10,18,25] | ||
| Slope | [18,25,26,29] | ||
| Environmental | Number of Lanes | [18,27,31] | |
| Road Type | [20,24,46] | ||
| Precipitation | [20,33,51] | ||
| Land Use | [26,31] | ||
| Population | [21,42] | ||
| Criticality Assessment | Economic | Diameter | [11,13,46,47,52] |
| Length | [45,47,49,53] | ||
| Depth | [11,13,27,47,49] | ||
| Social | Distance to Medical Facility | [11,45,47] | |
| Distance to Educational Facility | [11,45,47] | ||
| Number of Lanes | [13,27,45,49] | ||
| Distance to Railway | [11,27,46] | ||
| Distance to Commercial Area | [45,48] | ||
| Distance to Residential Area | [45,46,48] | ||
| Environmental | Distance to River | [46,47,48,52] | |
| Distance to Forest | [12] | ||
| Distance to Farmland | [12] |
Table 2.
Summary of geographic data used in this study.
| Data | # of Data | Year | Type | Source |
|---|---|---|---|---|
| Medical Facility | 22,586 | 2019 | Point | Healthcare Bigdata Hub |
| Educational Facility | 1316 | 2019 | Point | School Information System |
| Road | 328,404 | 2014 | Line | Seoul Metropolitan Government |
| 68,580 | 2018 | Line | National Spatial Data Infrastructure Portal | |
| Railway | 58 | 2018 | Line | National Spatial Data Infrastructure Portal |
| Land Use | 32,250 | 2018 | Polygon | National Spatial Data Infrastructure Portal |
| River | 154 | 2016 | Polygon | National Spatial Data Infrastructure Portal |
| Forest | 1153 | 2019 | Polygon | Forest Geographic Information System |
| Drainage Sector | 239 | 2014 | Polygon | Seoul Metropolitan Government |
Table 3.
Confusion matrix for the condition prediction model.
| Predicted Bad (Grade A + B) | Predicted Good (Grade C) | |
|---|---|---|
| Actual Bad (Grade A + B) | True Positive (TP) | False Negative (FN) |
| Actual Good (Grade C) | False Positive (FP) | True Negative (TN) |
Table 4.
Performance indicators for the condition prediction model.
| Indicator | Description | Equation |
|---|---|---|
| Accuracy | Ratio of data accurately predicted by the model regardless of condition grade | |
| Precision | Ratio of actual Grade A + Bs among Grade A + Bs predicted by the model | |
| Recall | Ratio of Grade A + Bs predicted by the model among total actual Grade A + Bs |
Table 5.
Criteria for the criticality assessment.
| Category | Factor | Score | ||||
|---|---|---|---|---|---|---|
| 5 | 4 | 3 | 2 | 1 | ||
| Economic | Diameter | >900 mm | >650 mm | >450 mm | >350 mm | ≤350 mm |
| Length | >50 m | >30 m | >15 m | >5 m | ≤5 m | |
| Depth | <1 m | <3 m | <7 m | <10 m | ≥10 m | |
| Social | Medical | <20 m | <50 m | <100 m | <150 m | ≥150 m |
| Educational | <50 m | <100 m | <150 m | <200 m | ≥200 m | |
| Road | >7 lanes | >5 lanes | >3 lanes | >1 lane | ≤1 lane | |
| Railway | <70 m | <120 m | <200 m | <400 m | ≥400 m | |
| Commercial | <20 m | <50 m | <100 m | <200 m | ≥200 m | |
| Residential | <20 m | <50 m | <100 m | <200 m | ≥200 m | |
| Environmental | River | <50 m | <150 m | <250 m | <450 m | ≥450 m |
| Forest | <50 m | <150 m | <250 m | <450 m | ≥450 m | |
| Farmland | <50 m | <150 m | <250 m | <450 m | ≥450 m | |
Table 6.
Model performance comparison across classification methods.
| Performance | Method | Mean | Standard Deviation | t-Value | p-Value |
|---|---|---|---|---|---|
| Accuracy | Random Forest | 0.748 | 0.193 | - | - |
| Decision Tree | 0.716 | 0.293 | 109.390 | 0.000 | |
| ANN | 0.612 | 0.834 | 166.992 | 0.000 | |
| Logistic Reg. | 0.605 | 0.013 | 774.685 | 0.000 | |
| Precision | Random Forest | 0.725 | 0.003 | - | - |
| Decision Tree | 0.685 | 0.004 | 92.910 | 0.000 | |
| ANN | 0.584 | 0.029 | 47.754 | 0.000 | |
| Logistic Reg. | 0.578 | 0.000 | 520.173 | 0.000 | |
| Recall | Random Forest | 0.691 | 0.003 | - | - |
| Decision Tree | 0.660 | 0.007 | 43.992 | 0.000 | |
| ANN | 0.464 | 0.129 | 17.588 | 0.000 | |
| Logistic Reg. | 0.384 | 0.000 | 913.766 | 0.000 |
Table 7.
Frequency distribution of the condition prediction result.
| Condition Class | Output Range | Frequency | Cumulative Frequency |
|---|---|---|---|
| Good (Grade C) | 0.0~0.1 | 2842 (1.9%) | 2842 (1.9%) |
| 0.1~0.2 | 7748 (5.2%) | 10,590 (7.2%) | |
| 0.2~0.3 | 13,581 (9.2%) | 24,171 (16.3%) | |
| 0.3~0.4 | 20,299 (13.7%) | 44,470 (30.0%) | |
| 0.4~0.5 | 25,896 (17.5%) | 70,366 (47.6%) | |
| Bad (Grades A and B) | 0.5~0.6 | 27,448 (18.6%) | 97,814 (66.2%) |
| 0.6~0.7 | 23,728 (16.0%) | 121,542 (82.2%) | |
| 0.7~0.8 | 15,978 (10.8%) | 137,520 (93.0%) | |
| 0.8~0.9 | 7816 (5.3%) | 145,336 (98.3%) | |
| 0.9~1.0 | 2514 (1.7%) | 147,850 (100.0%) |
Table 8.
Weight and score distribution of criticality factors.
| Category | Factor | Weight | Score | ||||
|---|---|---|---|---|---|---|---|
| 5 | 4 | 3 | 2 | 1 | |||
| Economic | Diameter | 0.0398 | 8555 (5.8%) | 16,203 (11.0%) | 42,366 (28.6%) | 59,004 (39.9%) | 21,749 (14.7%) |
| Length | 0.0249 | 14,770 (10.0%) | 36,187 (24.5%) | 41,893 (28.3%) | 34,809 (23.5%) | 20,218 (13.7%) | |
| Depth | 0.1121 | 93,933 (63.5%) | 51,907 (35.1%) | 1784 (1.2%) | 100 (0.1%) | 153 (0.1%) | |
| Social | Medical | 0.0445 | 10,314 (7.0%) | 25,183 (17.0%) | 34,722 (23.5%) | 27,552 (18.6%) | 50,106 (33.9%) |
| Educational | 0.0222 | 4388 (3.0%) | 9591 (6.5%) | 13,577 (9.2%) | 15,891 (10.7%) | 104,430 (70.6%) | |
| Lanes | 0.2208 | 4204 (2.8%) | 6624 (4.5%) | 12,945 (8.8%) | 52,968 (35.8%) | 71,136 (48.1%) | |
| Railway | 0.1908 | 28,734 (19.4%) | 12,798 (8.7%) | 16,464 (11.1%) | 32,285 (21.8%) | 57,596 (38.9%) | |
| Commercial | 0.0483 | 25,907 (17.5%) | 11,396 (7.7%) | 17,658 (11.9%) | 30,056 (20.3%) | 62,860 (42.5%) | |
| Residential | 0.0955 | 104,000 (70.3%) | 14,529 (9.8%) | 12,713 (8.6%) | 10,400 (7.0%) | 6235 (4.2%) | |
| Environmental | River | 0.1181 | 9735 (6.6%) | 16,216 (11.0%) | 14,387 (9.7%) | 26,752 (18.1%) | 80,787 (54.6%) |
| Forest | 0.0260 | 19,406 (13.1%) | 14,466 (9.8%) | 13,362 (9.0%) | 25,544 (17.3%) | 75,099 (50.8%) | |
| Farmland | 0.0571 | 3208 (2.2%) | 2871 (1.9%) | 2591 (1.8%) | 6180 (4.2%) | 133,027 (90.0%) | |
Publisher’s Note: MDPI stays neutral with regard to jurisdictional claims in published maps and institutional affiliations. |
© 2021 by the authors. Licensee MDPI, Basel, Switzerland. This article is an open access article distributed under the terms and conditions of the Creative Commons Attribution (CC BY) license (https://creativecommons.org/licenses/by/4.0/).
Share and Cite
MDPI and ACS Style
Lee, J.; Park, C.Y.; Baek, S.; Han, S.H.; Yun, S. Risk-Based Prioritization of Sewer Pipe Inspection from Infrastructure Asset Management Perspective. Sustainability 2021, 13, 7213. https://0-doi-org.brum.beds.ac.uk/10.3390/su13137213
AMA Style
Lee J, Park CY, Baek S, Han SH, Yun S. Risk-Based Prioritization of Sewer Pipe Inspection from Infrastructure Asset Management Perspective. Sustainability. 2021; 13(13):7213. https://0-doi-org.brum.beds.ac.uk/10.3390/su13137213
Chicago/Turabian StyleLee, Jeonghun, Chan Young Park, Seungwon Baek, Seung H. Han, and Sungmin Yun. 2021. "Risk-Based Prioritization of Sewer Pipe Inspection from Infrastructure Asset Management Perspective" Sustainability 13, no. 13: 7213. https://0-doi-org.brum.beds.ac.uk/10.3390/su13137213
Note that from the first issue of 2016, this journal uses article numbers instead of page numbers. See further details here.