Article

Biomass Quantity and Quality from Different Year-Round Cereal–Legume Cropping Systems as Forage or Fodder for Livestock

by
Konapura Nagaraja Manoj
1,*,
Bommalapura Gundanaik Shekara
2,
Shankarappa Sridhara
3,
Prakash Kumar Jha
4 and
P. V. Vara Prasad
4,5
1
Department of Agronomy, Gandhi Krishi Vignan Kendra, University of Agricultural Sciences, Bangalore 560 065, India
2
All India Coordinated Research Project (AICRP) on Forage Crops and Utilization, Zonal Agricultural Research Station, Vishweshwaraiah Canal Farm, Mandya 571 405, India
3
Center for Climate Resilient Agriculture, University of Agricultural and Horticultural Sciences, Shivamogga 577 201, India
4
Sustainable Intensification Innovation Lab, Kansas State University, Manhattan, KS 66506, USA
5
Department of Agronomy, Kansas State University, Manhattan, KS 66506, USA
*
Author to whom correspondence should be addressed.
Sustainability 2021, 13(16), 9414; https://0-doi-org.brum.beds.ac.uk/10.3390/su13169414
Submission received: 18 June 2021 / Revised: 11 August 2021 / Accepted: 18 August 2021 / Published: 22 August 2021

Abstract

:
The quantity and quality of forage and fodder crops is the major drawback of the livestock sector in the country. There is a need to bridge the gap between the supply and demand of fodder through the adoption of specific sustainable fodder production strategies. The field experiments were conducted during kharif (rainy, June–October), rabi (post-rainy, October–February), and summer (March–May) seasons of 2018–19 and 2019–20 to identify a sustainable fodder cropping system module in randomized complete block design with fifteen fodder cropping systems in three replications. The main objective of this research was to identify the most productive cereal–legume cropping system, both in terms of quantity and quality of biomass, to reduce the gap between supply and demand of quality livestock feed around the year. Among cropping systems, Bajra–Napier hybrid intercropped with lucerne, cowpea, and sesbania recorded significantly higher green fodder (163.6, 155.2, and 144.0 t/ha/year, respectively) and dry matter yields (32.1, 30.8, and 31.3 t/ha/year, respectively). Similarly, the same perennial systems also recorded higher quality yield and ash content. However, higher crude protein content was noticed in monocrop legumes, with the highest in sesbania (22.32%), while higher ether extractable fat was found in monocrop sesbania (3.78%). The monocrop oats recorded higher non-fiber carbohydrates (36.90%) while a monocrop of pearl millet recorded higher total carbohydrates (80.75%), however they were on par with other monocrop cereal cropping systems. Cultivation of legumes as a monocrop, and their inclusion as an intercrop with cereals resulted in lower fiber fractions and improved crude protein in intercropping systems. Furthermore, this improved the dry matter intake and digestibility of fodder. With higher sustainable yield index values and land-use efficiency, perennial intercropping systems were also found to be sustainable. Thus, cultivation of the Bajra–Napier hybrid with either lucerne, cowpea, or sesbania as an intercrop will help livestock farmers to achieve higher productivity in terms of quantity and quality, and forms a viable option for overcoming livestock feed scarcity.

1. Introduction

Livestock are major component of the global agricultural production systems. The shift from calorie-based diets to protein rich diets of the burgeoning population gave impetus to grass-based livestock production in last few decades. Moreover, it offers a livelihood opportunity for the global smallholder farming community. In India, livestock production is mainly based upon mixed farming, in which farmers often integrate crops and livestock to maximize income and diversify the use of available resources. Livestock production is considered the backbone of Indian agriculture, as it contributes 7% to national gross domestic product (GDP) and 24.72% to agricultural GDP [1].
According to the National Commission on Agriculture, the recommended area for animal feed (forage or fodder) production should be 10% of arable land i.e., 16.5 million hectares (m ha). This being said, the area under animal feed cultivation has decreased due to increased cultivation of food and commercial crops [2]. At present, only 8.6 m ha area is devoted to livestock feed production in India. Furthermore, there is no standard practice of forage or fodder production in rural areas, and animals are fed with naturally grown grasses, shrubs, and weeds in the agricultural lands, which are of low quality in terms of protein, minerals, and available energy. It has been estimated that feed cost alone accounts for 60% of the milk production cost, as the livestock producers mainly rely on concentrate animal feeds for achieving higher milk yield [3]. Green forage or fodder that is rich in proteins, minerals, vitamins, carbohydrates, and micronutrients, as well as having a high dry matter intake, digestibility, and low fiber content, would help to lower the cost of livestock feeding [4] and increase animal productivity.
The above-mentioned challenges of the livestock sector are creating tremendous pressure on the country’s available total feed and fodder resources. In this context, the cultivation of green fodder or forage crops which can produce greater quantity and quality of biomass will play an important role [5]. At present in India, the availability of green fodder, dry fodder and concentrates are 734.2, 326.4, and 61.0 million tonnes, respectively; this is against the current requirement of 827.2, 426.1, and 85.8 million tonnes, with a net deficit of 11.24%, 23.40%, and 28.90%, respectively [6]. Similarly, in Karnataka, the supply is 85, 15, and 7.5 million tonnes, respectively, compared to the current requirement of 122, 25.4, and 29.5 million tonnes, resulting in a net deficit of 30%, 40.95%, and 74.50%, respectively [7]. To meet the current forage and fodder demand of livestock population, the deficit must be met by either enhancing the productivity of existing animal feed crops or utilizing unconventional fodders and trees along with existing cropping systems. Moreover, increase in the acreage of livestock feeding crops, seems impossible due to increased land use competition by a burgeoning human population [8].
In this context, cereal–legume cropping systems involving annual and perennial fodder or forage crops with high yielding varieties and hybrids is a viable option to meet the forage and fodder demand. Sustainable intensification of livestock feed through increased productivity maintains continuous cover on the soil and has many other benefits besides supplying animal feed. These benefits include reduced incidence of pests and diseases, suppressing weed population, reduced erosion, and additional nitrogen supply through atmospheric nitrogen fixation [9,10]. Higher dry matter yields were realized with sorghum and lima bean intercropping systems at different planting proportions [11]. With maximum utilization of land area and other resources, pearl millet intercropped with cluster bean produced higher forage yield with improved forage quality [12]. The higher productivity of forage and fodder crop under cereal–legume intercropping systems has also been well established [1,2,8,13].
Globally, cereal–legume cropping system-based forage cultivation mitigates the impact of greenhouse gases through reduced use of inorganic nitrogen application and enhancing soil carbon stocks [9], reducing runoff losses [10], drought resilience [13], and improving livelihood and profitability [5]. These types of intercropping are practiced more in countries with low inputs than the intensified high-input farming systems [9]. However, in last two decades, with growing interests in conservation agriculture and growing feed demand for intensive dairy-based farming, cereal–legume-based fodder cultivation has increased in developed countries. With the increasing awareness about resiliency and sustainability of farming system, the importance of these cropping system has been realized by associated stakeholders.
However, very little information is available on the quality of green forage or fodder production in a year-round system of intercropping different annual and perennial crops and their seasonal rotations. Therefore, the main objective of this research is to identify the most productive cereal–legume cropping system, both in terms of quantity and quality of biomass, to reduce the gap between supply and demand of quality livestock feed around the year.

2. Materials and Methods

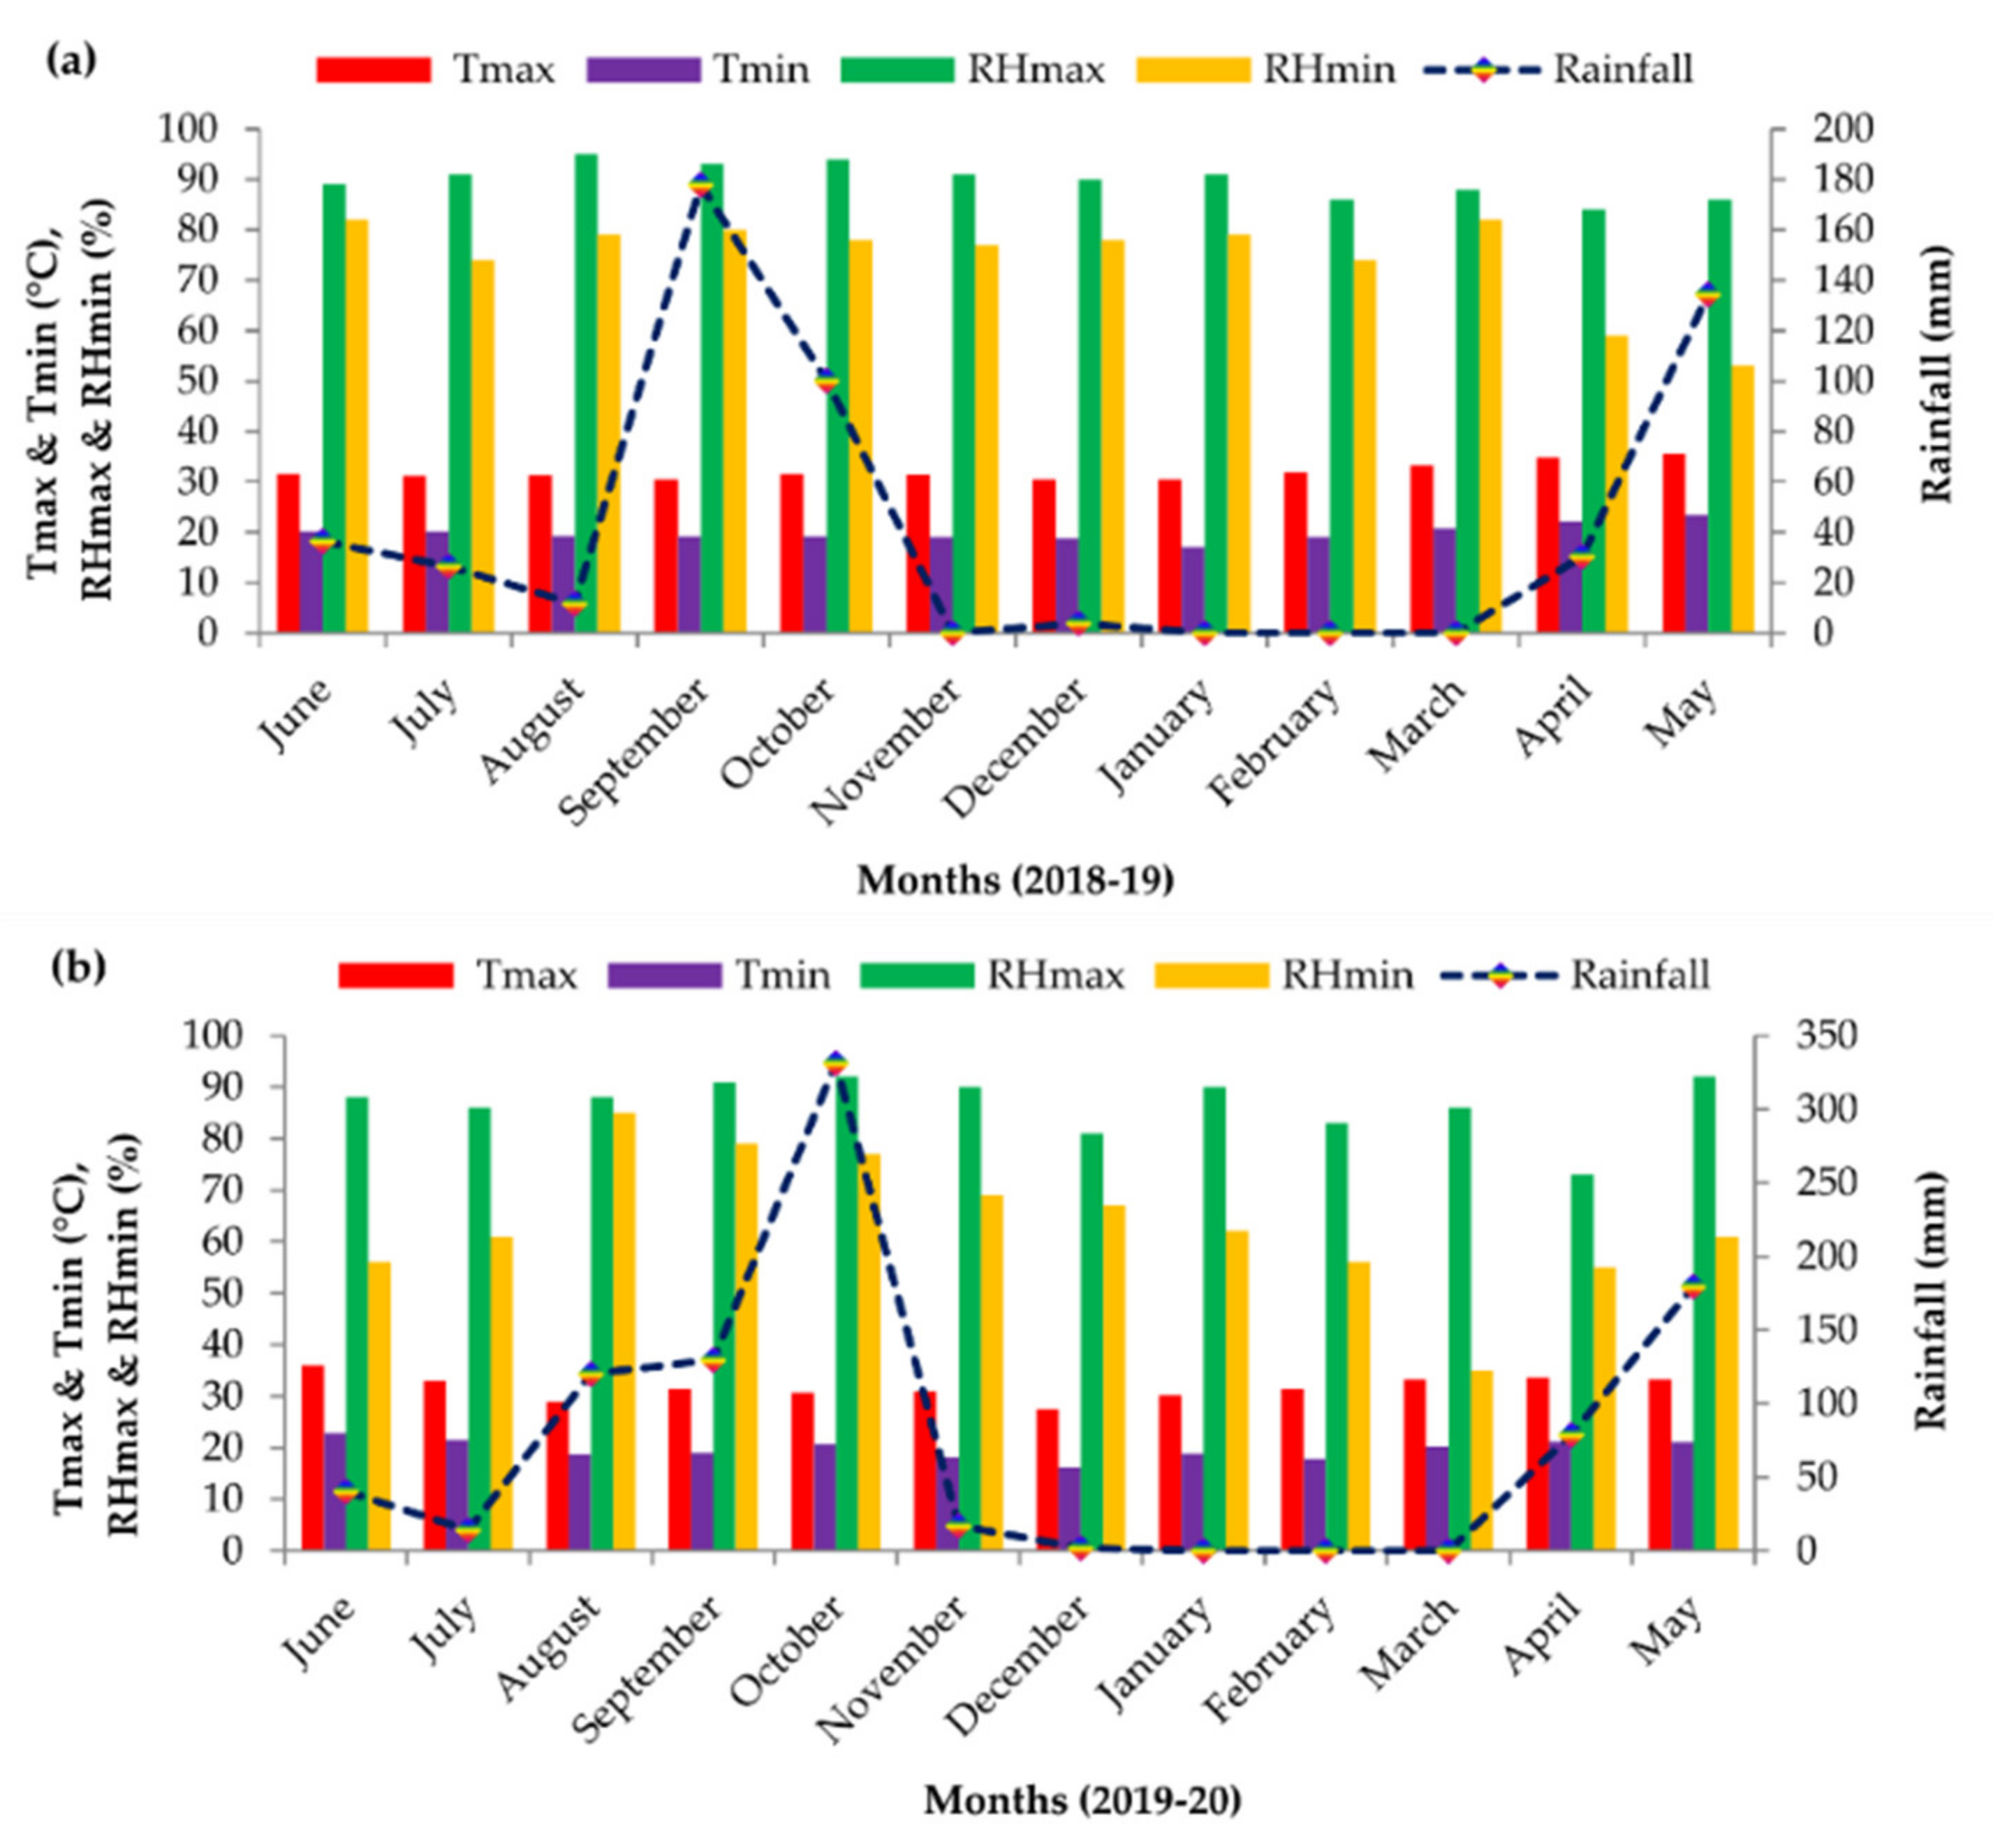
2.1. Site Description and Weather

Field experiments were conducted during the kharif (rainy season, June–October), rabi (post rainy, October–February) and summer (March–May) seasons of 2018–19 and 2019–20 at Zonal Agricultural Research Station, Vishweshwaraiah Canal Farm, Mandya, Karnataka, India. This falls under the southern dry zone (ACZ-VI) of Karnataka between 12°45′ and 13°57′ N latitude and 76°45′ and 78°24′ E longitude at an altitude of 695 m above mean sea level. The location belongs to dry tropical savanna climate as per Koppen’s classification, which often experiences dry seasons with severe drought conditions (http://koeppen-geiger.vu-wien.ac.at; accessed on 8 August 2021). The soil at the experimental site was classified as “Typic Kandiustalf” as per United States Department of Agricultural classification. The soil of the site was red sandy loam in texture, with neutral pH (7.45), medium electrical conductivity (0.38 ds/m), and low organic carbon concentration (0.55%), having a nutrient profile of 265.40 kg N/ha, 49.25 kg P2O5/ha and 162.35 kg K2O/ha. The total amount of rainfall received during the cropping season was 520.7 mm during 2018–19 and 912.7 mm during 2019–20 (Figure 1). The year-round cropping period was from June to May during both the years of the experiment. The peak rainfall was received in September (177.8 mm) during 2018–19 and in October (331.2 mm) during 2019–20. However, during the dry period, lifesaving irrigation was provided to the crops once in fifteen days with water belonging to irritability class 2 as a protective measure. The maximum temperature was recorded in May (35.5 °C), and minimum in January (17 °C) during 2018–19, whereas in 2019–20 the maximum temperature of 36 °C was recorded in June and the minimum temperature of 16.3 °C in December. Maximum relative humidity was observed in August (95%), and minimum in May (53%) during 2018–19, whereas in 2019–20 the maximum relative humidity of 92% was observed in October and the minimum of 35% in March (Figure 1a,b).

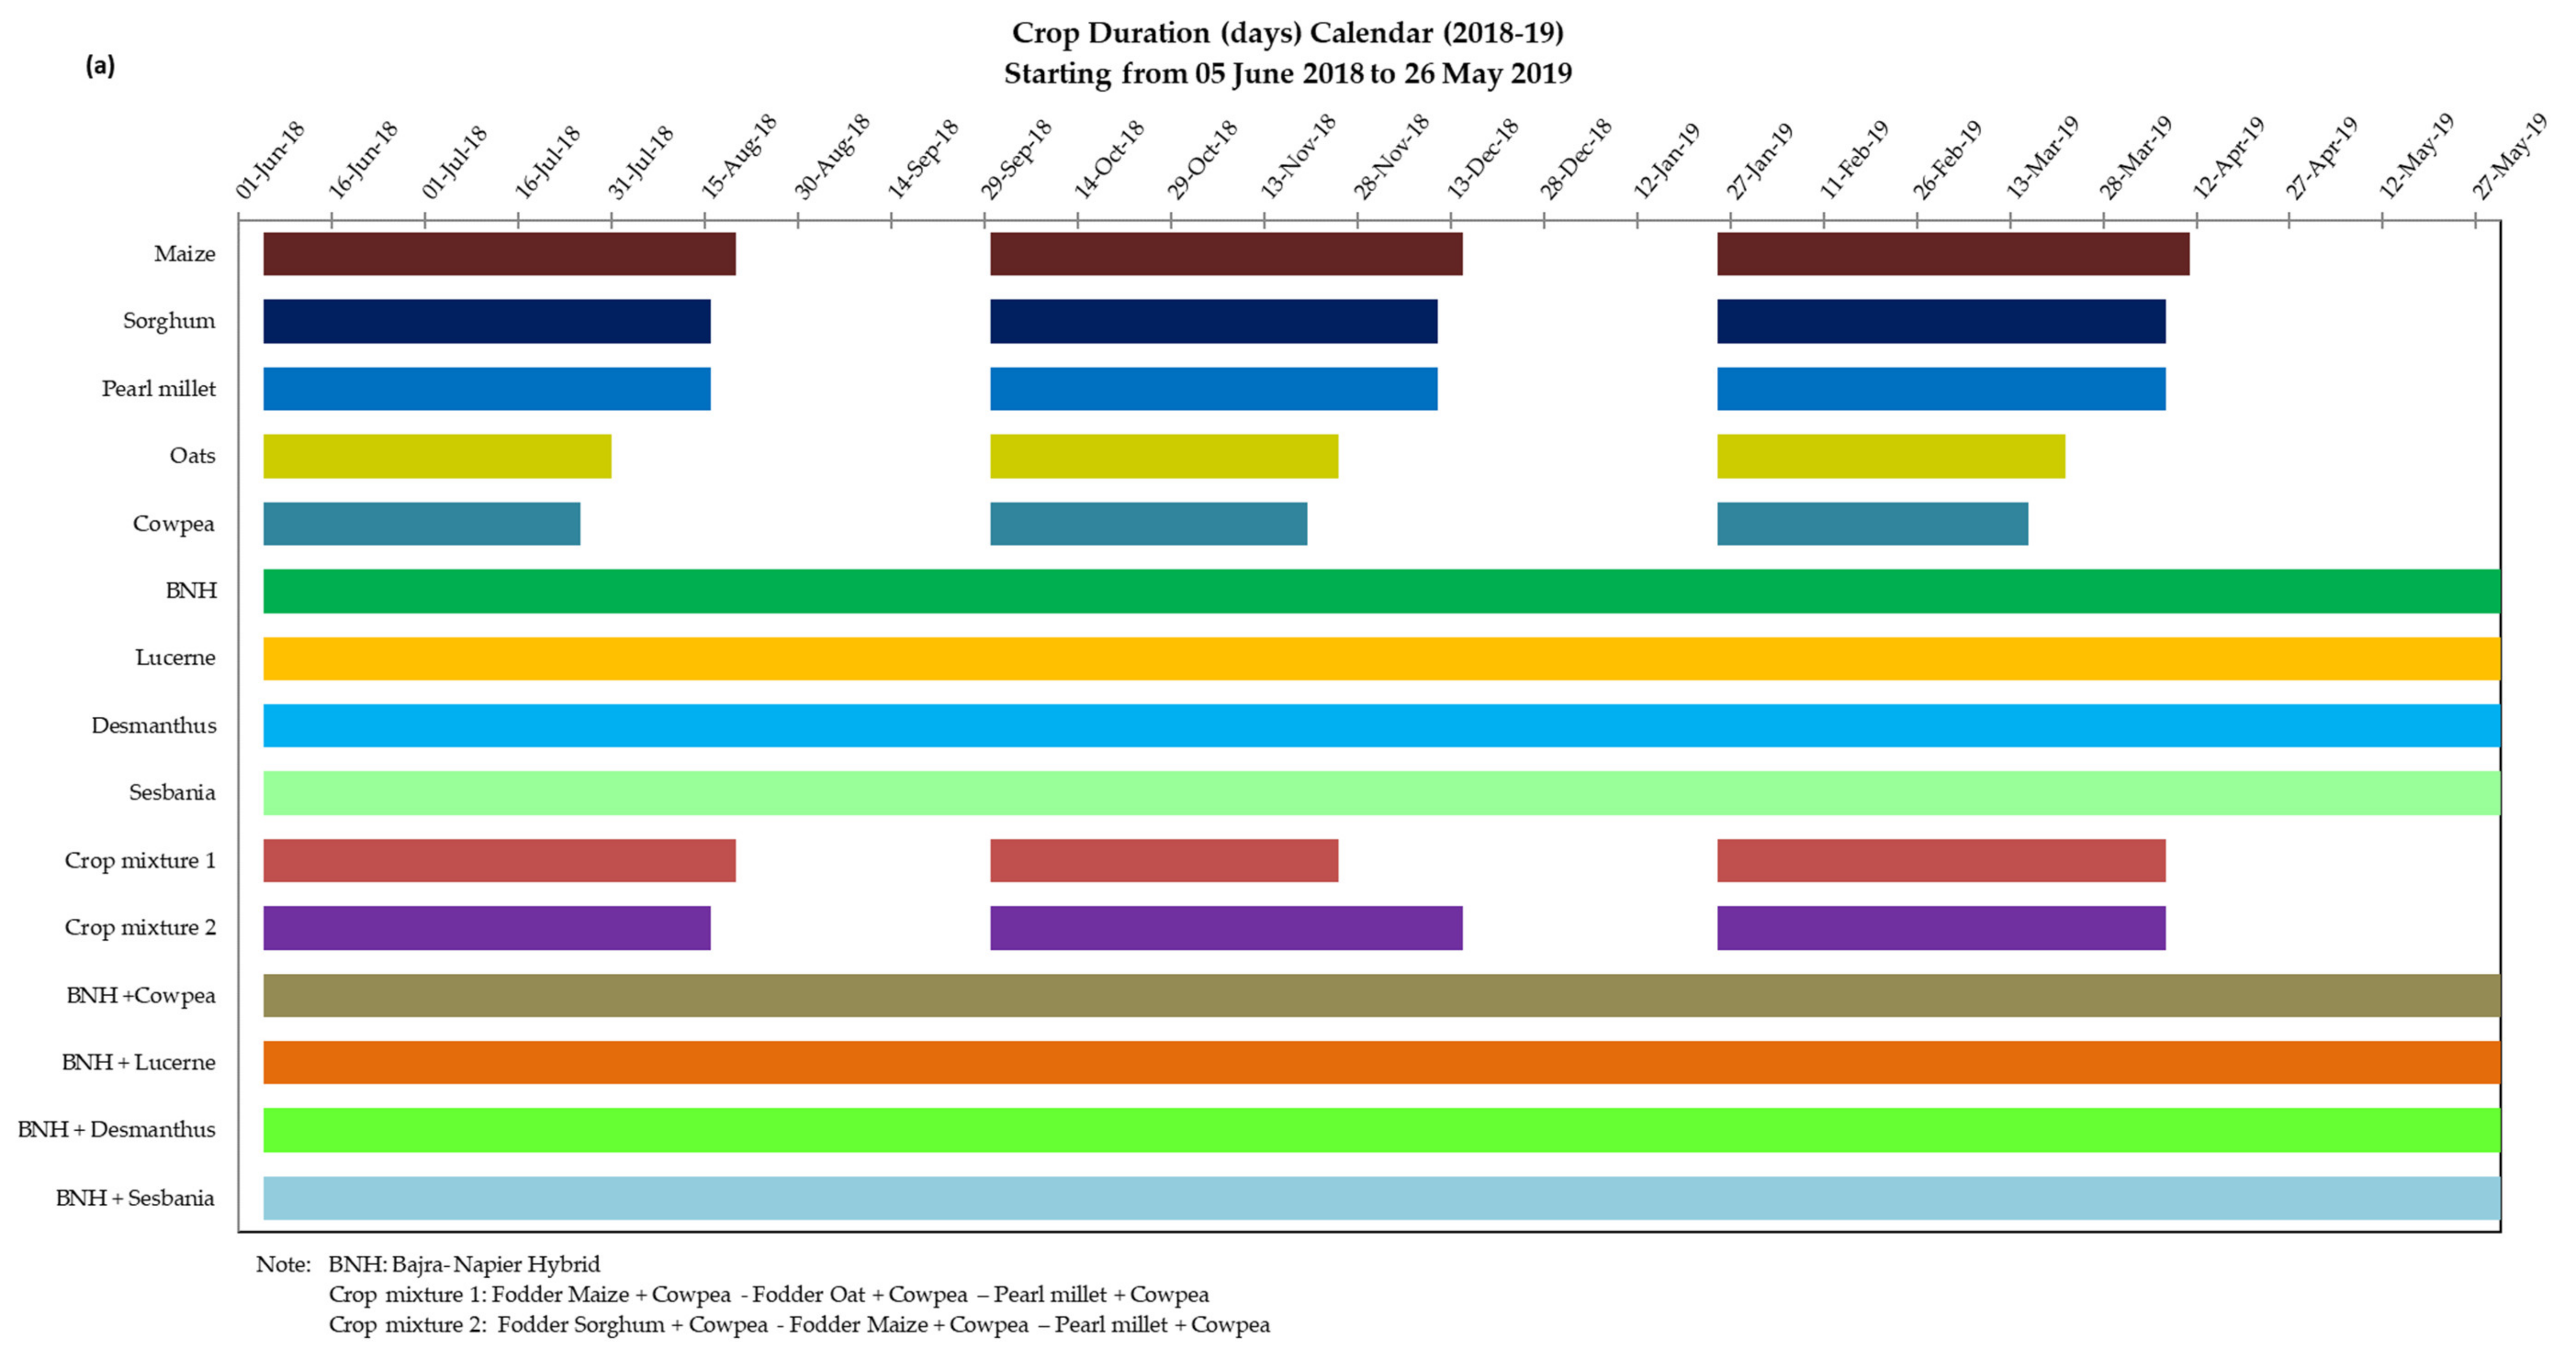
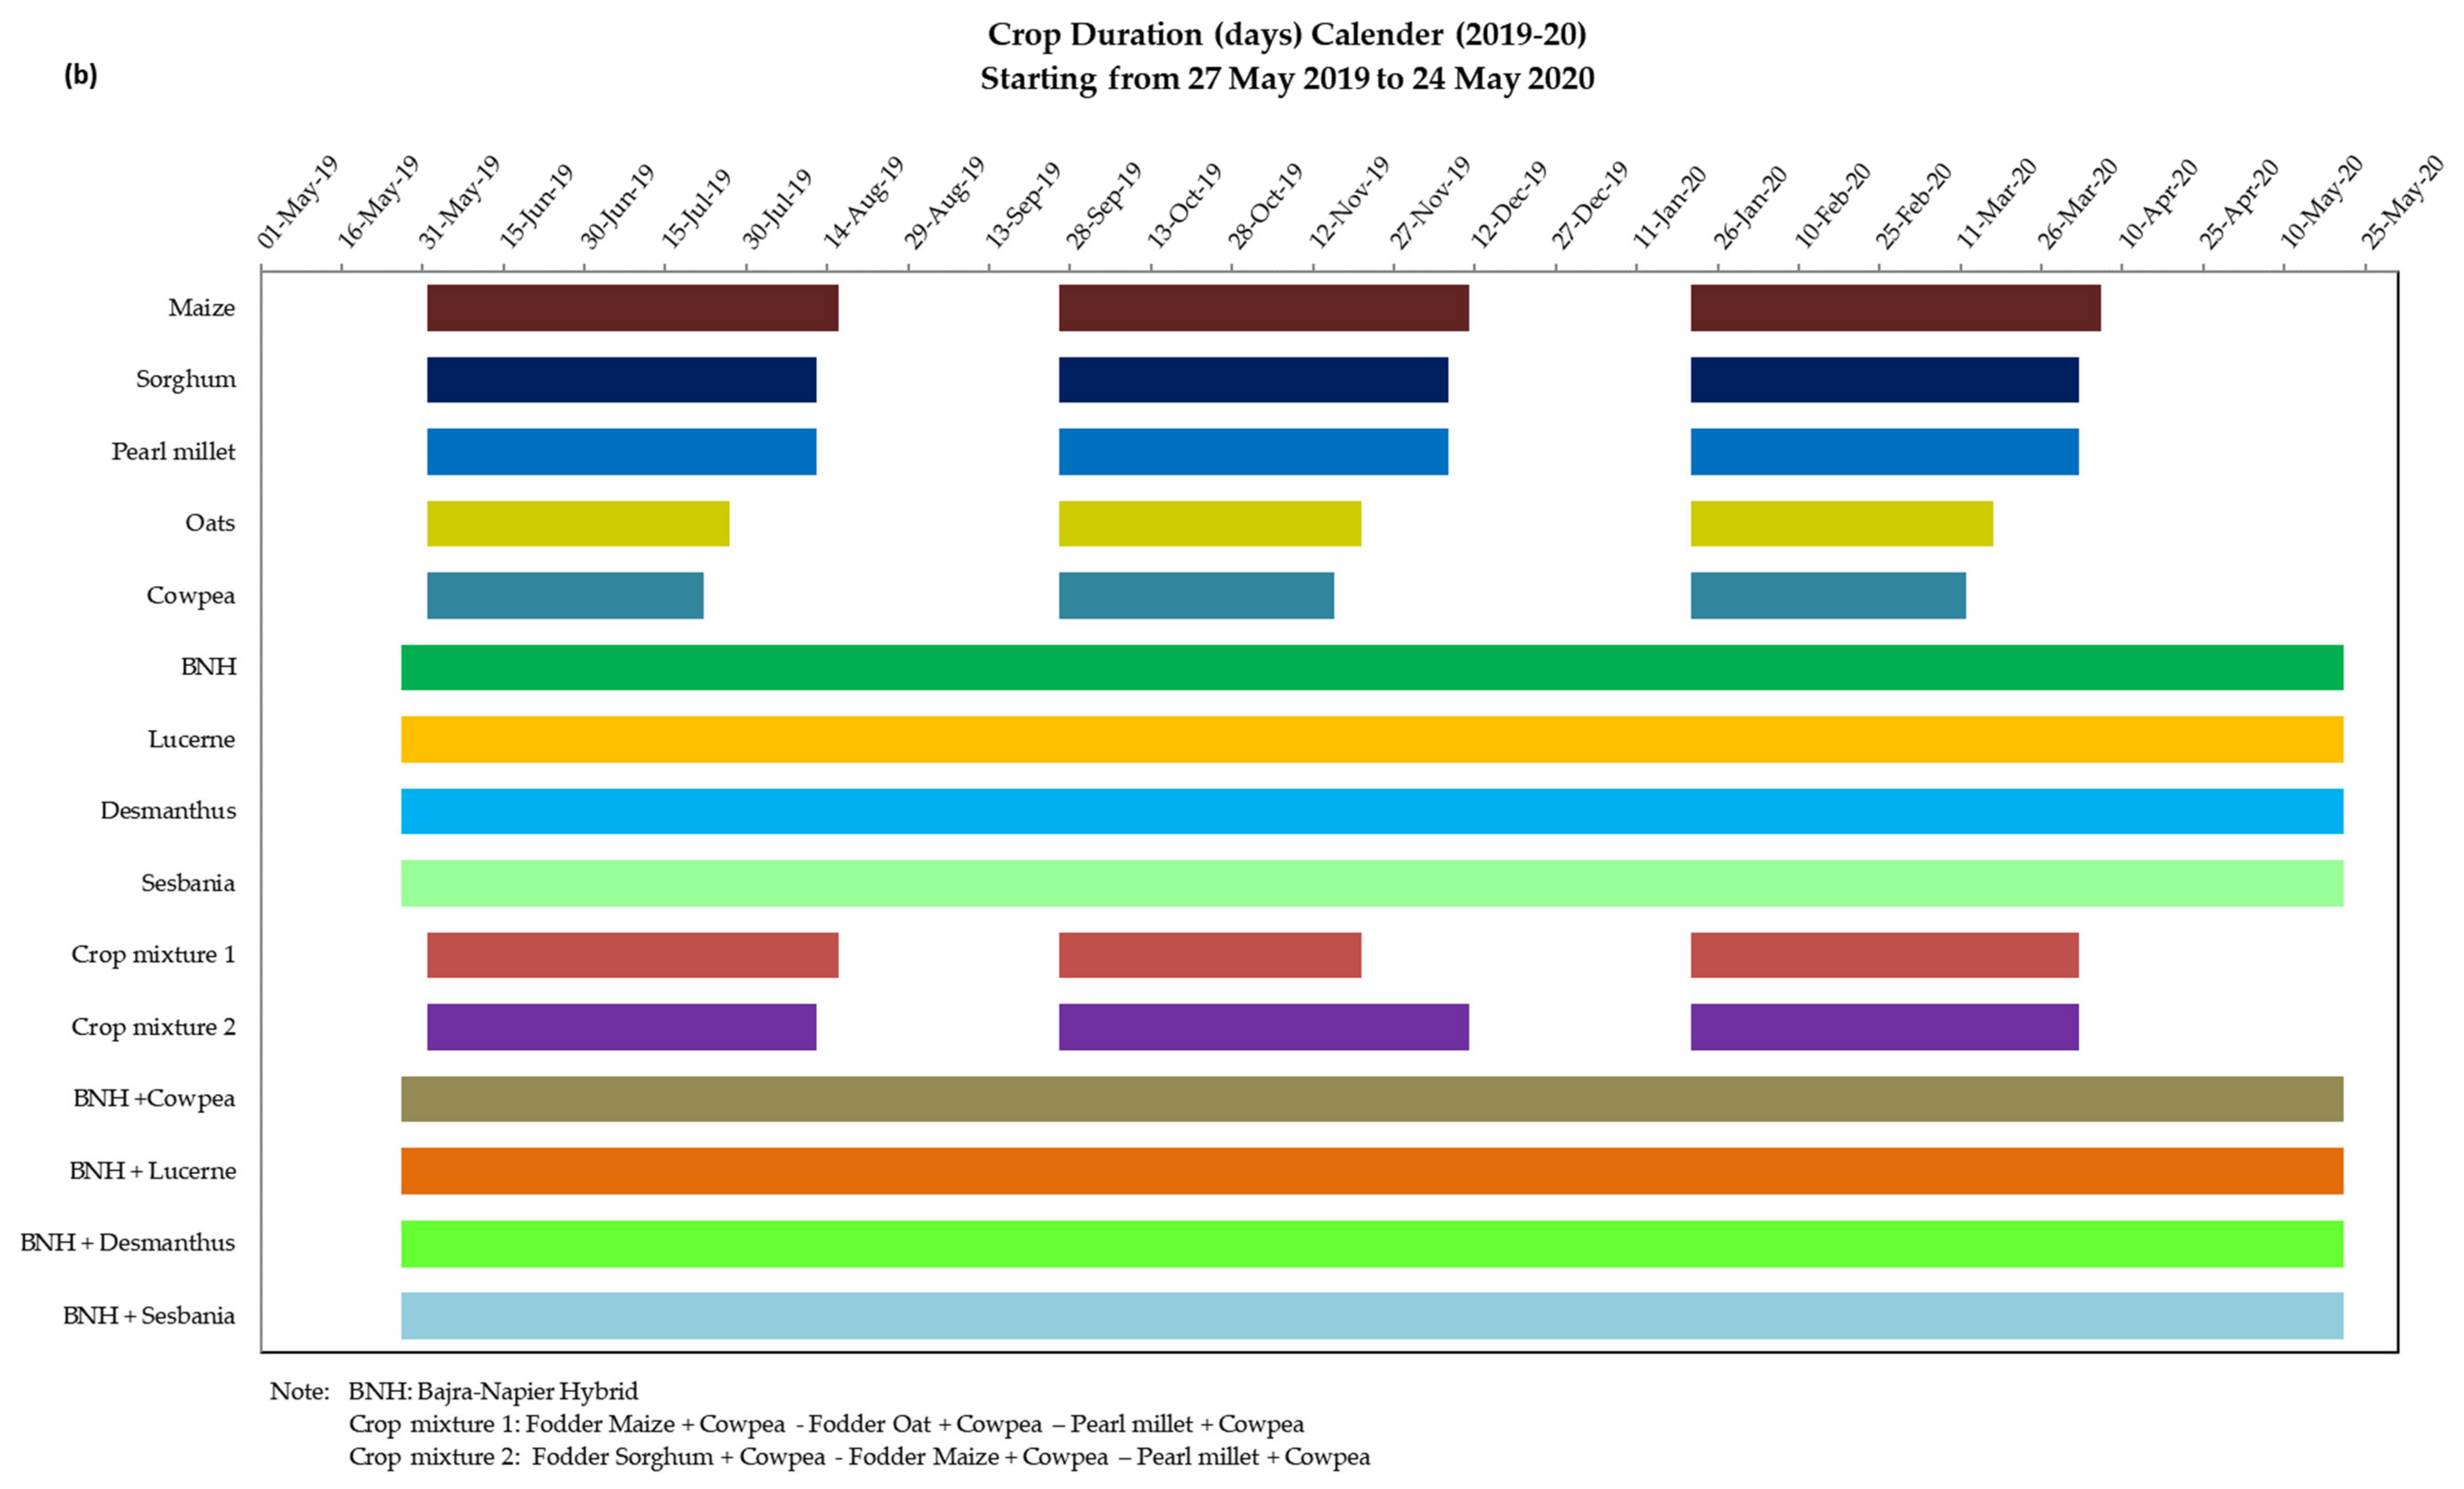
2.2. Experimental Details

The experiment was laid out in a Randomized Complete Block Design (RCBD), comprising of fifteen different forage or fodder cropping systems with three replications (Table 1). The investigation comprised of five cereal crops (maize (variety African Tall), sorghum (variety Sudex Chari-1), pearl millet (variety BAIF bajra-1), oats (variety OS-6), and the Bajra–Napier hybrid (variety BNH-10)) and four legume crops (Cowpea (variety MFC-09-1), Lucerne (variety RL-88), Desmanthus (variety Co-1), and Sesbania (variety Local)). Sowing was carried out using a manually operated marker by opening furrows to a depth of 3 cm. Seeds of main and intercrops were line sown at recommended row proportion as per the treatments at spacing of 30 cm × 10 cm. In Bajra–Napier hybrid-based cropping systems, two eye budded well-matured Napier stem cuttings were planted in paired row system with an inter-row spacing of 60 cm and intra-row spacing of 45 cm. Intercrops were sown as a replacement series between the two paired rows. The perennial crops were sown only once at the initial time of the experiment, while sowing of annual crops was taken up in each season accordingly. The crop calendar for annual and perennials is shown in Figure 2a,b for both the years (2018–2019, 2019–2020). As perennial cropping systems remained in the field around the year, we have taken all the crops included in the experiment in all three seasons as monocrops for better comparison of the systems. Chemical fertilizers were applied in furrows and mixed properly at the time of sowing as per the package of practices. In annual crops, 50% of the recommended nitrogen (N) was applied at the time of sowing, and the remaining N was top-dressed at 30 days after sowing, while in perennial crops 10% of N was applied as basal dose, and the remaining 90% was applied in two equal splits after each cut. A full dose of recommended phosphorus (P) and potassium (K) were applied at the time of sowing.

2.3. Biomass Measurements

The crops were harvested as per the schedule based on crop developmental stage. The seasonal maize and sorghum were harvested at milking and full flowering stage, while pearl millet, oats, and cowpea were harvested at 50% flowering stage. For perennials, Bajra–Napier hybrid, lucerne, desmanthus, and sesbania, the first harvest was taken at 70, 60, 90, and 180 days after sowing, respectively, by leaving stubbles of suitable height. Subsequent harvests were taken at 35–45 days, 25–30 days, 45–50 days, and 45–50 days intervals, respectively, based on the crop growth and developmental stages. Crops from the net area of each experimental plot were harvested separately, weighed in kilograms with the help of a spring balance at each cut, converted to the hectare, and expressed as the green fodder yield (GFY) in quintals per hectare. Later, dry matter (DM) content was determined by drying a known quantity of representative fresh samples from each plot immediately after harvest, and samples were oven-dried at 70 ± 2 °C for 48 h and weighed. After that, dry matter content was determined, and dry matter yield (DMY) was calculated by multiplying the DM content with GFY.

2.4. Quality Parameters and Fiber Fractions

After harvest, plant samples from each treatment were collected, oven-dried, powdered, and used to analyze quality parameters. In the intercropping systems, the plant samples from the main and intercrops were mixed as per the adopted row proportion, and further used for the analysis. The dried samples were ground in Willey mill using a 2 mm sieve for estimation of quality parameters and a 1 mm sieve for fiber fractions analysis. The fiber fractions included neutral detergent fiber (NDF) and acid detergent fiber (ADF). The NDF represents the total fraction of fiber (cellulose, hemicellulose, and lignin) which makes up the structural component (carbohydrates or sugars) of the cell wall. Conversely, ADF is the least digestible plant component which includes cellulose and lignin. The ADF values are inversely related to digestibility. Crude fat percent in the biomass was estimated using ether extractable method. The quality parameters were estimated according to the standard procedure recommended by AOAC [14] protocol, and their respective yields were calculated by multiplying with the dry matter yield of the crops. All the forage quality parameters are reported on a dry matter (DM) basis, or per unit weight of DM. However, non-fiber carbohydrate (CHO), total CHO percent, and total digestible crude protein yield (TDCPY) was determined according to the following equations [15].
Non-fiber CHO (%) = 100 − (crude protein + fat + fiber + ash + moisture)
Total CHO (%) = 100 − (crude protein + fat + ash)
TDCPY (%) = [0.97 × crude protein yield] − 0.67
Dry matter intake (DMI), digestible dry matter (DDM) and relative feed value (RFV) were calculated according to the following formula adopted from Horrocks and Vallentine [16]:
DMI (% body weight) = 120/NDF (%) on dry matter basis
DDM (%) = 88.9 − (0.779 × % ADF on dry matter basis)
RFV (%) = % DDM × % DMI × 0.775

2.5. Land Use Efficiency and Sustainable Yield Index

Land use efficiency (LUE) and sustainable yield index (SYI) were calculated for each cropping system module to assess efficiency and sustainability. LUE is the total number of days a field remains occupied by the crops in a cropping system during an agriculture year [17]. A higher LUE value denotes efficient utilization of land in a year.
LUE = i = 1 n D i 365   ×   100
where i = 0, 1, 2, 3 …, n; n = total number of crops; and Di = number of days occupied by ith crop.
The trend of yield over a year in a system reflects the sustainable yield of a cropping system. SYI values range from 0 to 1. The value nearing unity shows higher stability reflecting that the system is more sustainable [18].
SYI = Y     SD Y max
where Y = average yield of the management practice over the years (n = 0, 1, 2, 3 …); SD = standard deviation of the yield of the management practice over years; and Ymax = observed maximum yield of the experiment.

2.6. Statistical Analysis

The experimental data collected on various parameters were subjected to statistical analysis adopting Fisher’s method of analysis of variance (ANOVA) outlined by Gomez and Gomez [19]. The least significant difference (LSD) was used to compare treatment means at 5% level of significance (p < 0.05). In the case of significant results, the critical difference at 5% level of probability was calculated to test the difference between two treatment means. Correlation graphs were plotted using R software. Initially, analysis was performed separately for both the years of study, and a similar kind of response was observed. Hence, all the results in the present study are interpreted on the pooled mean basis of two years’ data.

3. Results

3.1. Biomass Yield and Dry Matter Concentration

The cropping systems involving cereal–legume perennial intercropping achieved significantly higher green fodder yield (GFY) and dry matter yield (DMY) compared to cereal and legume monocrop throughout the year (Table 2). Bajra–Napier hybrid produced significantly higher GFY and DMY than other cropping systems, when intercropped at 2:8 row proportion with legumes such as lucerne (163.6 and 32.1 t/ha/year, respectively), cowpea (155.2 and 30.8 t/ha/year, respectively) and sesbania (144.0 and 31.3 t/ha/year, respectively). However, when cowpea, desmanthus, oats, and pearl millet cultivated as monocrops throughout the year resulted in significantly lower GFY, and the magnitude of decrease was almost 110%, 106%, 98%, and 92%, respectively, as compared to the superior Bajra–Napier hybrid + lucerne system which had better GFY. Similarly, the same monocrops had significantly lower DMY, and account for only 48%, 49%, 52%, and 56% DMY, respectively, compared to that achieved by the Bajra–Napier hybrid + lucerne perennial system.
In the present study, the DM concentration of fodder was significantly influenced by different cropping system modules (Table 2). The monocropping system of sorghum (22.99%), sesbania (22.10%), the perennial system of Bajra–Napier hybrid + sesbania (21.72%), and the crop mixture of fodder sorghum + cowpea–fodder maize + cowpea–pearl millet + cowpea (21.20%) has shown statistically higher dry matter concentration than other cropping systems. Significantly lower DM concentration was observed in monocrop Bajra–Napier hybrid fodder biomass. Furthermore, intercropping of legumes viz., cowpea, lucerne, and desmanthus with Bajra–Napier hybrid has shown a reduced DM content in their fodder when compared to their sole crops.

3.2. Quality Traits

The nitrogen and protein in fodder is often considered a good determinant of forage quality. Cropping systems involving legumes showed significantly higher nitrogen (N) and crude protein (CP) compared to cereals cultivated throughout the year (Table 3). Compared to other cropping systems, significantly higher N and CP concentrations were found in monocultures of legumes such as sesbania (3.57% and 22.32%, respectively), lucerne (3.34% and 20.62%, respectively), and cowpea (3.28% and 20.51%, respectively). The cereals grown as monocrops have recorded lower N and CP concentration, but they have shown a significant improvement in these concentrations when they are intercropped with legume fodder crops. On the other hand, ash concentration indicates the mineral matter composition of fodder and is significantly higher in perennial Bajra–Napier hybrid + cowpea (11.22%) and Bajra–Napier hybrid + sesbania (11.18%) systems fodder. However, these systems were found statistically on par with monocropping systems viz., sesbania, lucerne, Bajra–Napier hybrid, and perennial Bajra–Napier hybrid + lucerne systems. In contrast, pure culture of pearl millet (8.12%), sorghum (8.26%), and oats (8.44%) throughout the year has shown significantly lower ash concentration among all the fodder cropping systems (Table 3).
Sesbania grown as a monocrop and as an intercrop with Bajra–Napier hybrid has shown significantly higher fat concentration in its fodder (3.78% and 3.77%, respectively), closely followed by lucerne as a monocrop (3.20%) and as an intercrop with Bajra–Napier hybrid (3.28%), indicating higher gross energy from these cropping systems fodder. Conversely, monocrop cereals viz., pearl millet and maize throughout the year showed significantly lower ether extractable fat concentration (2.62% and 2.67%, respectively), indicating lower quality fodder from these crops (Table 3).
Carbohydrates constitute both fibrous (T-CHO) and non-fibrous carbohydrates (NF-CHO). The pure culture of cereals has shown higher NF-CHO concentration over both monocrop legumes, as well as cereal + legume intercropping systems, and ranged from 36.90% in oat fodder to 34.19% in sorghum fodder. Correspondingly, significantly higher T-CHO concentration was noticed in pearl millet (80.75%) and sorghum (80.55%) grown as monocrops (Table 3). However, these crops were found statistically at par with other monocrop cereal fodder crops viz., oats, maize, the Bajra–Napier hybrid, and crop mixtures such as fodder sorghum + cowpea–fodder maize + cowpea–pearl millet + cowpea, and fodder maize + cowpea–fodder oat + cowpea–pearl millet + cowpea. Interestingly, improved forage quality in terms of NF-CHO and T-CHO concentration was also noticed in the present study when legume crops, viz., cowpea, lucerne, sesbania and desmanthus, were grown as an intercrop with Bajra–Napier hybrid over their monocropping.

3.3. Fiber Fractions

Fiber fractions and fodder quality are indirectly related. The fodder with less fiber concentration is considered superior quality, as the higher the fiber fractions, the lower the digestibility and energy from fodder. Cereal crops grown as monocrops, except oats, have recorded significantly higher crude fiber (CF) compared to legume crops, with the highest in sorghum (34.48%) followed by maize (31.95%). However, among the monocrop legumes, desmanthus fodder had higher CF concentration of 28.70% followed by cowpea (27.62%). Similarly, in perennial intercropping systems and crop mixtures, it was ranged from 27.02% in Bajra–Napier hybrid + sesbania perennial system to a maximum of 30.38% in fodder sorghum + cowpea–fodder maize + cowpea–pearl millet + cowpea crop mixture (Table 4).
Significantly lower acid detergent fiber (ADF) concentration was noticed in monocrop oats (31.22%), but this value was found to be on par with perennial legumes grown as monocrops viz., lucerne (34.82%) and desmanthus (35.80%), and both grown as an intercrop with Bajra–Napier hybrid (34.53% and 35.78%, respectively). On the other hand, significantly lower neutral detergent fiber (NDF) concentration when compared to cereal fodder crops was found in monocrop legumes viz., lucerne (43.47%), desmanthus (44.06%), cowpea (47.72%), sesbania (48.74%), and these legumes as an intercrop with Bajra–Napier hybrid (45.85%, 46.35%, 48.96% and 49.29%, respectively) (Table 4).

3.4. Drymatter Intake, Digestible Drymatter, and Relative Feed Value

The fodder quality in terms of fiber concentration determines the intake, digestibility, and feed value of the fodder. In the present study, due to their lower fiber and succulent nature, monocrop lucerne fodders have shown significantly lower DMI (2.76%) but were statistically on par with perennial desmanthus monocrops (2.72%) and Bajra–Napier hybrid + lucerne system (2.62%). Due to higher DMI, pure crop of lucerne (61.78%) and Bajra–Napier hybrid + lucerne system (62%) showed higher DDM. Moreover, due to its more succulent nature, significantly higher DDM was recorded in monocrop oats fodder (64.58%). Conversely, significantly lower DMI (1.87%) and DDM (55.98%) was recorded in the Bajra–Napier hybrid monocropping system due to higher fiber fractions. Overall, legumes as monocrops and cereal–legume intercropping systems showed significantly higher RFV compared to monocultures of cereal crops. The maximum RFV of 132.17% was recorded with monocrop lucerne, but this value was found to be on par with monocrop desmanthus (128.81%) and perennial legumes viz., lucerne and desmanthus grown as an intercrop with the Bajra–Napier hybrid (125.77 and 122.49%, respectively). On the other hand, due to lower DMI and DDM, pure cropping of the Bajra–Napier hybrid (81.11%) and maize (83.56%) had lower RFV (Table 4).

3.5. Yield of Quality Traits

The yield of quality traits was significantly influenced by different year-round fodder cropping system modules (Table 5). Perennial Bajra–Napier hybrids intercropped with legumes viz., sesbania, lucerne, and cowpea have achieved substantially higher CPY (6.18, 6.02, and 5.60 t/ha/year, respectively), TDCPY (5.93, 5.77, and 5.37 t/ha/year, respectively), ash (3.50, 3.48, and 3.46 t/ha/year, respectively), fat (1.18, 1.05, and 0.93 t/ha/year, respectively) and T-CHO (20.3, 21.5, and 20.8 t/ha/year, respectively). However, the Bajra–Napier hybrid intercropped with lucerne (8.63 t/ha/year) achieved significantly higher NF-CHO yield followed by pure crop of Bajra–Napier hybrid (8.47 t/ha/year). Irrespective of quality traits, both cereals and legumes grown as a monocrop recorded lower yield in comparison to perennial cereal–legume intercropping systems in the present study.

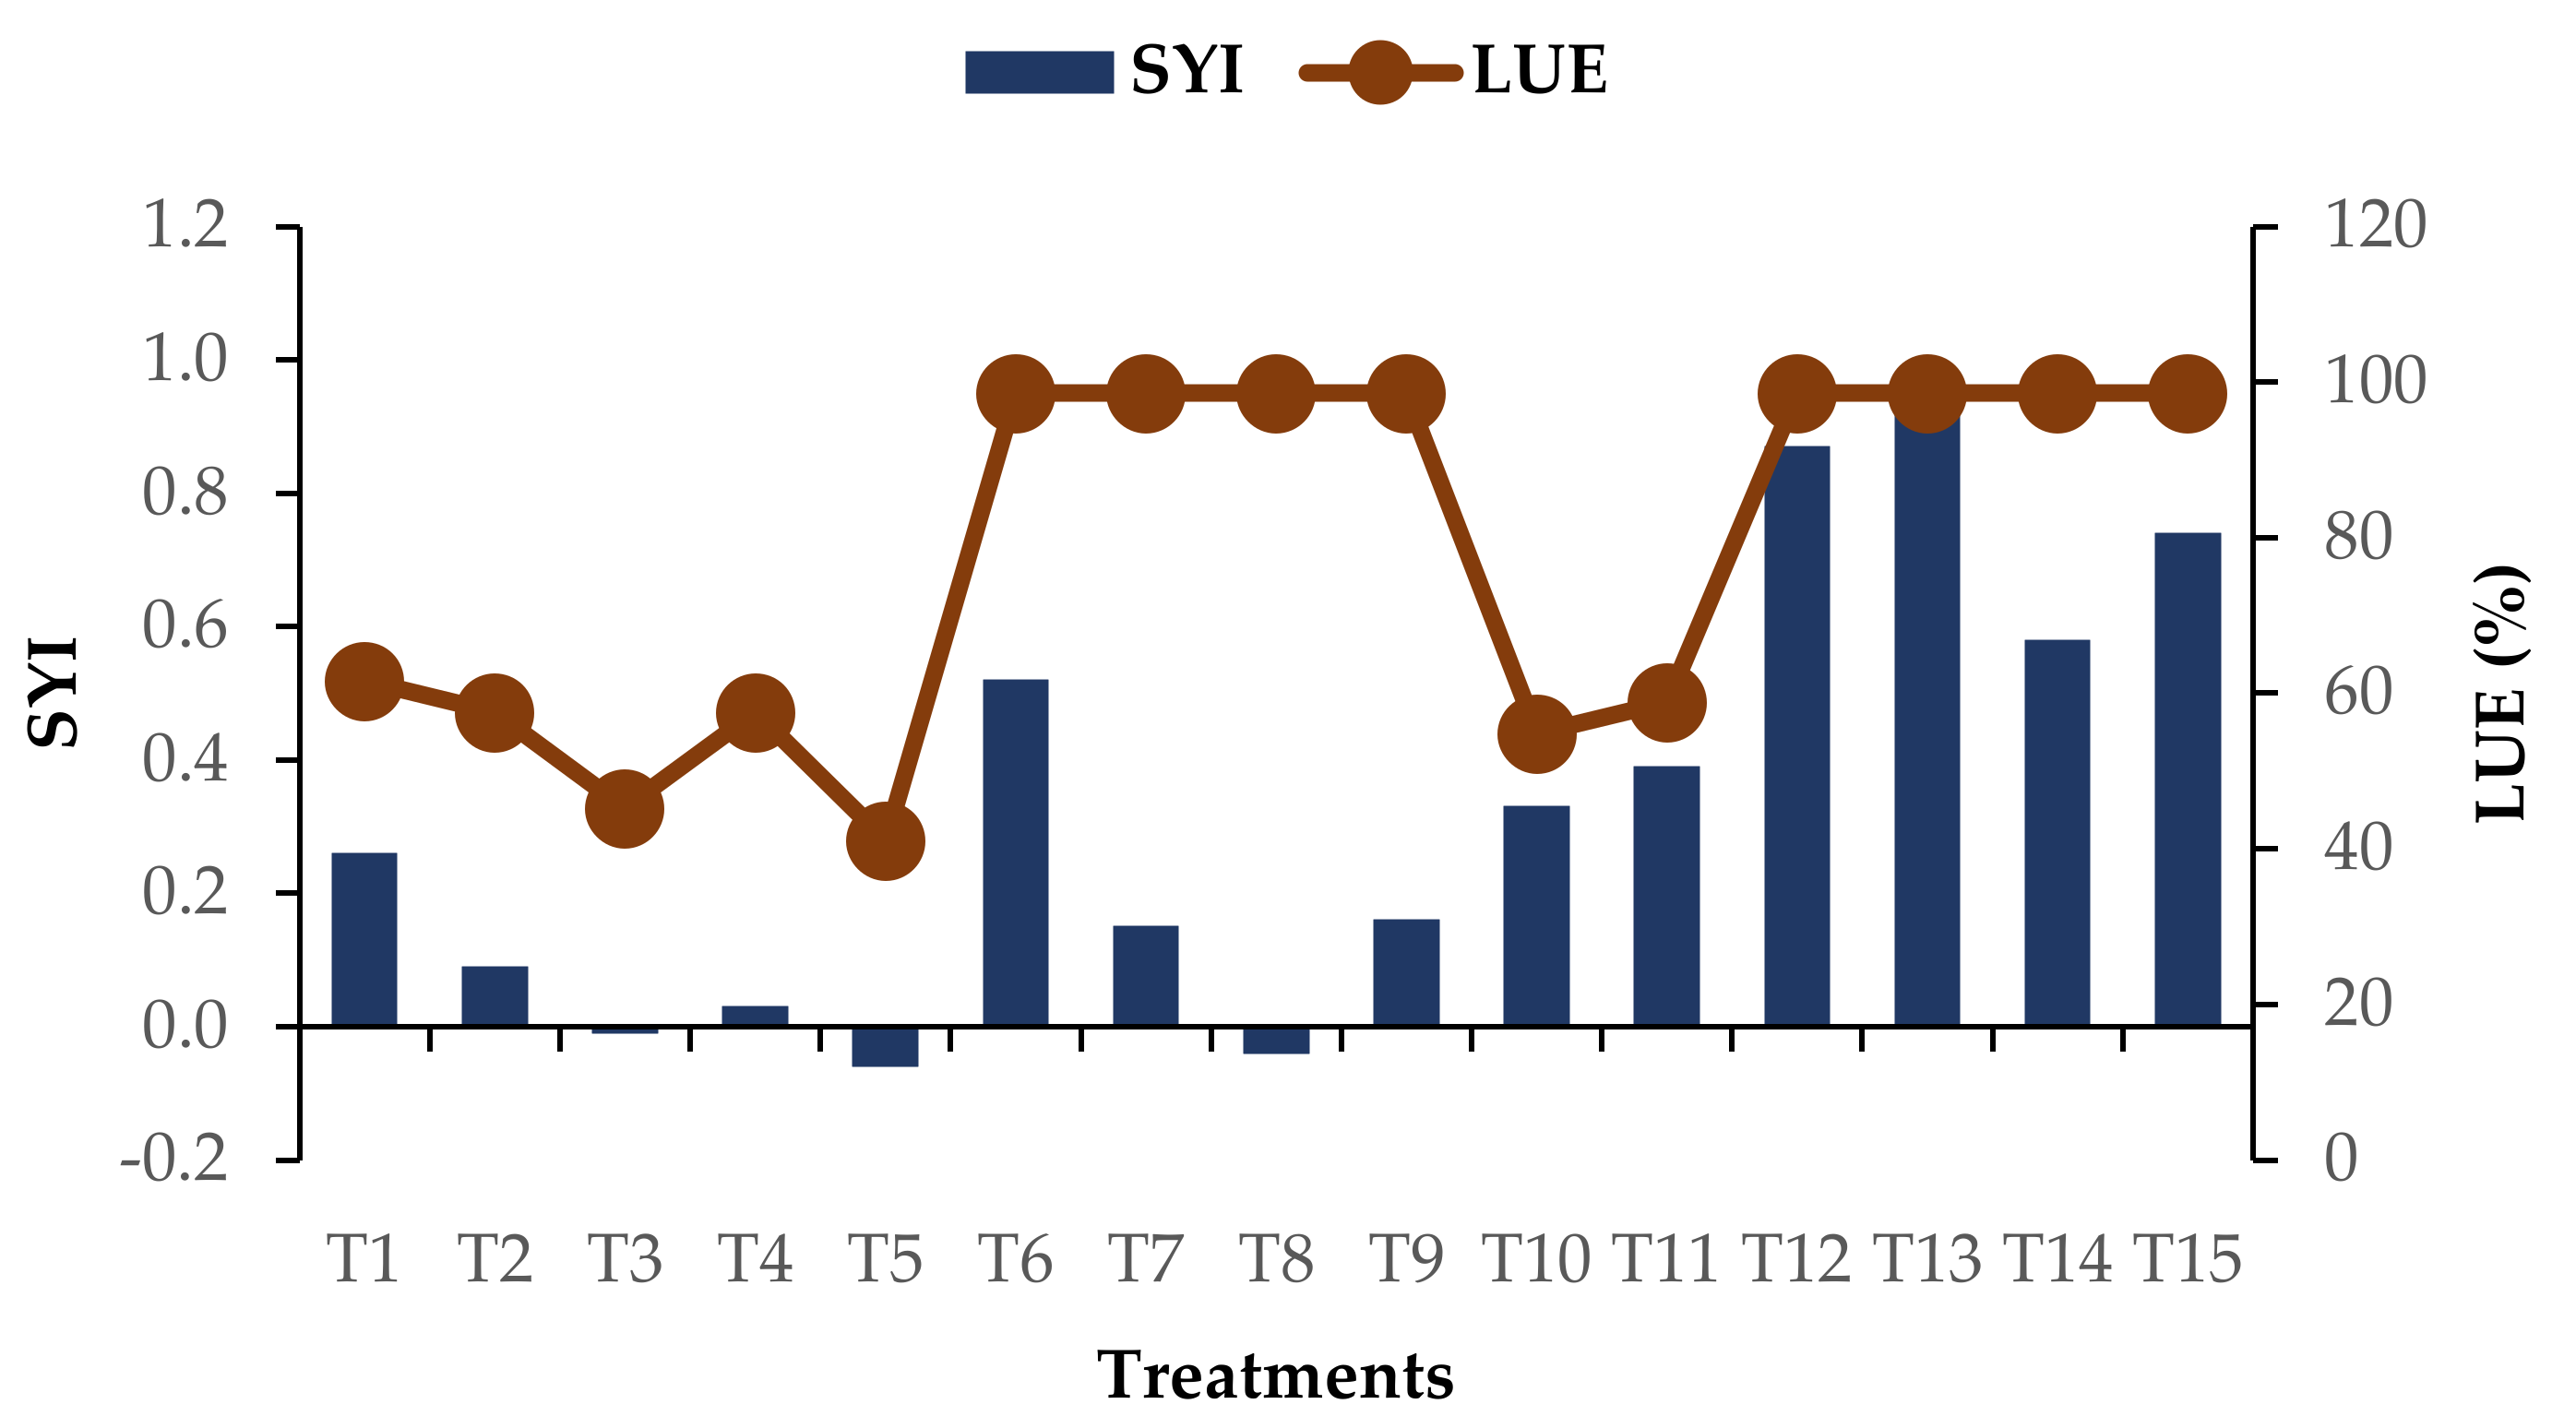
3.6. Sustainable Yield Index and Land Use Efficiency

Based on the productivity, the sustainable yield index (SYI) values were determined for the different cropping systems, and found higher SYI values for perennial intercropping systems in our present study (Figure 3). The perennial Bajra–Napier hybrid + lucerne system had a higher SYI value of 0.97, followed by Bajra–Napier hybrid + cowpea (0.87) and Bajra–Napier hybrid + sesbania perennial systems (0.74). However, monocropping of cowpea, desmanthus, and oats showed negative SYI values (−0.06, −0.04, and −0.01, respectively). Higher LUE was also achieved when the Bajra–Napier hybrid was intercropped with legumes (cowpea, lucerne, desmanthus, and sesbania) and in monocropping desmanthus, sesbania, the Bajra–Napier hybrid, and lucerne, each with 98.63% (Figure 3). In contrast, annual intercropping systems and seasonal fodder crops (maize, sorghum, oats, bajra, and cowpea) showed lower LUE, with the least in the cowpea (41.10%) and oats (45.21%) systems.

4. Discussion

4.1. Biomass Yield

Accessibility of quality green fodder is challenging for the livestock sector due to poor quality, i.e., deficiency in required amount of protein, minerals, and energy, leading to lower productivity of livestock [20]. To meet the current green fodder needs, intensive fodder cropping systems which promote the productivity per unit area and specified time are necessary [21]. In the present study, intercropping of perennial Bajra–Napier hybrid with legume fodder crops viz., cowpea, lucerne, and sesbania had shown significant improvement in the biomass yield over monocropping systems and other crop mixtures. The complementary nature of intercropped cereals and legumes might have resulted in efficient utilization of available resources such as nutrients and water, which eventually improved the fodder yield through better growth parameters [22]. In addition, legumes also supply N through biological N fixation that will favor the enhancement of plant growth and development [23]. The higher GFY of the component crops associated with perennial cropping systems resulted in higher DMY, even with considerable variation in dry matter concentration. Perennial intercropping systems such as Bajra–Napier hybrid + cowpea; guinea grass + cowpea [2]; and Bajra–Napier hybrid (BNH-10) + desmanthus at 1:5 row proportions produced higher GFY [21]. Increased DMY with Napier grass and herbaceous perennial legume intercropping systems were reported by Menbere et al. [24] from research in Ethiopia. These biomass results agree with findings of Eskandari [25], Deore et al. [26], and Shekara et al. [27]. The importance and superiority of Napier grass for livestock feed has been demonstrated in several countries around the world, particularly in Kenya [28] and other parts of East and Central Africa [29]. The more fibrous nature of the stems and considerably lower leaf to stem ratio in the perennial intercropping systems resulted in higher DM concentration in our study. Rajput et al. [30] and Iyanar et al. [31] reported higher DM content of fodder in sorghum grown as a monocrop. In this study, we did not statistically compare individual crop components’ biomass yield in intercropping with the monocropping system on similar land area basis. Our visual observation of the crop growth did not show any differences. The response will depend on the available above- and below-ground resources. However, further research would be needed to compare the productivity of each crop under different systems (monocropping, intercropping, or mixed cropping).

4.2. Quality Traits and its Yield

In general, cereals are the main source of energy (carbohydrates) while legumes are rich in CP [21]. Thus, adopting both cereal and legumes as component crops in cropping systems provides nutritionally rich fodder for the livestock. In the present study, monocrop legumes fodders have shown higher N and CP concentration. However, when they cultivated with cereal crops in intercropping systems, the improvement in the N and CP content was noticed as compared to monocrop with cereal fodder. Symbiotic biological N fixation by legumes in the cereal legume intercropping systems improves nutrient uptake [32], which may have resulted in more availability of N, and thereby more N% in biomass. Subsequently, higher N has resulted in better protein biosynthesis [33]. Studies conducted by Yadav et al. [34] revealed the higher CP in legumes fodder when they were grown as monocrops. Singh et al. [1] and Tamta et al. [10] found the improvement in the CP concentration in Bajra–Napier hybrid + cowpea and maize + cowpea intercropping systems than monocrop Bajra–Napier hybrid and maize fodder, respectively.
Similar to CP, the ash concentration of fodder was found to be improved under perennial Bajra–Napier hybrid + legumes (cowpea and sesbania) cropping systems. Higher growth and dry matter accumulation by the intercropping systems due to the higher availability of N and other nutrients resulted in a higher ash concentration. This was further evident by the strong positive correlation of the ash content with CP (r2 = 0.71) and the N concentration (r2 = 0.71) of the fodder (Figure 4). Higher ash content under guinea grass + cowpea intercropping system was earlier reported by Singh et al. [1]. Likewise, Rasool et al. [35] also reported the higher ash content under cereal–legume intercropping systems. These above-presented results are also concordant with the earlier findings of Akhtar et al. [36], Ayub et al. [37], Iqbal et al. [8], and Uher et al. [38].
Fat concentration is one of the important quality traits that determine the gross energy of various forages and feeds, as fat yields over 9 Kcal/g while proteins and carbohydrates yield about 5 Kcal/g [39]. In our present study, monoculture of perennial legumes and as an intercrop with the Bajra–Napier hybrid had significantly higher fat concentration than other cropping systems. Nadeem et al. [40] reported improved fat content by 3.3% in maize + cowpea fodder than in maize fodder alone.
In contrast to N, CP, ash, and fat concentrations, higher NF-CHO and T-CHO concentration was noticed in cereal fodder crops grown as pure crops. This kind of composition makes fodder inadequate for animal nutrition. Strong negative correlation of non-fiber CHO and total CHO concentration with CP (r2 = −0.96 and r2 = −0.99) and ash (r2 = −0.79 and r2 = −0.80) was also observed in the present study (Figure 4). In contrast, cereal + legume intercropping systems are viable for increasing forage quality and yield [41,42]. Interestingly, we also found improved forage quality with higher CP, ash, fat, NF-CHO, and T-CHO concentration when perennial Bajra–Napier hybrid was intercropped with legumes viz., cowpea, lucerne, sesbania, and desmanthus. The improved forage quality, with higher CP and CHO content under corn + soybean system and lower quality under sole cropping systems, was also reported by Baghdadi et al. [43] and Mallikarjun et al. [30]. With respect to quality traits yield, the Bajra–Napier hybrid intercropped with sesbania, lucerne, and cowpea achieved substantially higher yield in the present study. Higher DMY reflected the higher quality yield in Bajra–Napier hybrid + legume cropping systems, irrespective of quality concentrations. A higher CPY was observed in Bajra–Napier hybrid and guinea grass intercropped with cowpea [2]. Tamta et al. [10] obtained nutritionally rich quality fodder in terms of higher CP and TDCP yields with cereal–legume intercropping systems. Higher ash and ether extractable fat yields in Bajra–Napier hybrid and guinea grass intercropped with cowpea was reported by Singh et al. [1].

4.3. Fibre Fractions

Fodder having the lower CF, ADF, and NDF with the higher CP, ash, fat, and CHO is often considered as a nutritionally rich fodder for the livestock [43]. In our study, when they are grown as monocrops, cereal recorded higher CF, while legumes recorded lower CF. The higher dry matter concentration and better storage of photosynthates as cell wall contents during their partitioning have attributed to the higher CF [44]. Higher CF in sole cropped sorghum was reported by Akhtar et al. [36]. Previous studies also reported lower crude fiber in pearl millet + cowpea [45] and sesbania + pearl millet intercropping systems [35]. Similar to CF, reduced ADF and NDF concentration was noticed with monocrop legumes and Bajra–Napier hybrid + legumes intercropping systems in our study. Generally, ADF and NDF are greater in grasses than legumes, thus the magnitude of this difference and the proportion of legume crops in cropping systems seemed to have impacted fiber fractions of different cropping systems. Studies on monoculture maize [5] and hybrid Napier [46] reported higher ADF and NDF. Maize intercropping with legumes boosted CP content with lowered NDF and ADF concentrations, and so improved fodder nutritive value [25,43]. Furthermore, a strong negative correlation of NDF with CP (r2 = 0.91) (Figure 5) revealed that fodder with higher CP increases the palatability by lowering NDF.

4.4. Intake, Digestibility, and Relative Feed Value of Drymatter

The fodder with higher CP and lower fiber fractions makes it more palatable, and thereby improves the digestibility for livestock [16]. In the present study, the monoculture of legumes (cowpea, lucerne, sesbania, and desmanthus) and Bajra–Napier hybrid + legume intercropping systems have shown improved DMI and DDM compared to monocrop cereals. Legumes, both as sole crops and as an intercrop with cereals, were shown to have lower fiber content, indicating higher palatability and digestibility, leading to higher intake on a dry matter basis [47,48]. The lower ADF concentration and succulent nature makes fodder more palatable and easier for digestion by microbes in the rumen of livestock. The negative correlation (r2 = −1) depicts improvement of DDM with lower ADF (Figure 5). Similar results were revealed by others [48,49,50,51]. RVF reflects both intake potential and digestibility of biomass [52]. Higher CP, DMI and DDM of pure legume crops and Bajra–Napier hybrid + legume intercropping systems reflected in higher RFV in current study. The higher RFV of lucerne forage was reported by others [52,53]. Correlation values (r2 = 0.86, −0.98 and 0.98) showed dependency of RFV on CP, NDF, and DMI of fodder, respectively (Figure 5), and these results were supported by Anil et al. [54] and Prajapati et al. [48,55].

4.5. Stability and Efficiency of the Systems

In the long run, cropping system stability, in terms of the qualitative and quantitative biomass production with an effective utilization of land resources, is critical. Bajra–Napier hybrid + lucerne system was found more stable, with higher SYI (0.97), followed by Bajra–Napier hybrid + cowpea and Bajra–Napier hybrid + sesbania perennial systems. The higher productivity associated with these perennial intercropping systems during both the years of study resulted in higher sustainability over crop mixtures and monocrops. Higher SYI of 0.80 with hybrid Napier−hybrid Napier + berseem–hybrid Napier cropping systems, and higher SYI of perennial cereal–legume cropping system modules are in accordance with other studies [55,56,57]. Higher LUE (98.63%) was also achieved with Bajra–Napier hybrid + legume intercropping systems and perennial monocrops. The greater number of days occupied by the perennial cropping system modules in a calendar year was associated with higher LUE [55,58].
The yields observed in Bajra–Napier hybrid intercropped with legumes (range 131 to 155 t/ha/year GFY; or 25.5 to 32.1 t/ha/year DMY) and the SYI (0.97) in our research were much higher than those observed in other fodder production systems in India. For example, maximum GFY of 118 t/ha and SYI of 0.79 was observed in maize + rice bean–oat–sorghum + cowpea [58]. While the oat + fodder brassica–maize + cowpea system produced the highest GFY of 60.77 t/ha/year [56] was much lower than that which we observed in our system, but the SYI was slightly higher (0.99) compared to our study (0.97). Thus, the yields from our intercropping systems were better than the other fodder production systems.

4.6. Strategies to Promote Fodder Production in India and Around the World

The results from this research are applicable not only in the dry regions of the Karnataka, but also other parts of India and around the world which have similar agro-climatic conditions and a large demand for fodder. Most of the dry regions within India and around the world have limited opportunity to bring additional land area under fodder production without causing environmental damage. Therefore, increased production must come from increasing the productivity per unit area per unit time, using improved fodder production systems. Use of year-long fodder production with a combination of annual and perennial fodder cropping systems identified in this research will be a promising approach. The identified crops and genotypes are versatile and can be grown in different farming systems such as food–forage based cropping systems, inclusion of perennial fodder crops in orchards, plantation crops, agro-forestry, and silvi-pastural systems. The short duration of forage crops can be incorporated in rice fallows to increase cropping intensity. In addition, annual and perennial fodder crops can be grown on less productive land (e.g., waste lands, farm boundaries, problematic soils, and marshy areas). Although this research was targeted to the local context of Karnataka in India, the findings will be useful in regions around the world which have similar agroclimatic conditions. The findings of perennial crop management from this study can be tested and replicated to other agroclimatic conditions. Crop and livestock producers incorporate cereal–legume forage cropping systems to meet the demand for animal feed. The findings of this research will help them improve productivity and contribute to sustainable intensification of forage or fodder-based cropping systems. Perennial and annual forage/fodder cultivation systems in the UK [41], USA [47,59], Africa [60], and other developing countries [61] have been found beneficial for the sustainability of agroecosystem.

5. Conclusions

The benefit of intercropping perennial and annual forage cultivation along with a year-round cereal–legume based cropping system adds value to the livestock production system. Overall, this research has shown that the perennial cereal–legume cropping systems were more productive in terms of both green fodder and dry fodder yield than monocultures of either cereal or legume crops throughout the year. The complementary nature of component crops in intercropping systems may lead to better utilization of available resources, and thereby helps to attain improved quantity and quality of livestock feed yield. Among the various intercropping systems, the perennial cereal crop Bajra–Napier hybrid intercropped with legume crops (e.g., lucerne, cowpea, and sesbania) showed the highest forage production and quality yield in terms of crude protein, ash, and ether extractable fat. The inclusion of legumes as component crops with cereals in crop mixtures also further improved the quality due to lower fiber fractions, which resulted in increased dry matter intake, dry matter digestibility and relative feed value as they were found to be more succulent and palatable. Additionally, the perennial Bajra–Napier hybrid intercropped with lucerne, cowpea, and sesbania showed higher sustainable yield index values of 0.97, 0.87, and 0.74, respectively, than other cropping system modules, demonstrating the sustainability of the modules for achieving higher yield. The result from this research provides alternative options for the livestock farmers in India and other parts of the world which have similar agro-climatic conditions to achieve both qualitative and quantitative forage for livestock production, using cultivated cereal and legume fodder crops in mixtures. The practice of promoting and adopting improved cereal–legume intercropping systems based on available resources in a region can be a pathway to sustain the feeding needs of the increasing livestock population. It can also be a way to combat the higher cost of concentrate feeds and eventually boost the livestock production by the smallholder farmers. Although the varieties of various crops used in this research were tested in a specific region of India, they can be suitable in other dry regions within and outside of India which have similar conditions. However, these varieties must be tested, and suitable agronomic packages need to be developed so they can be adopted by the producers.

Author Contributions

K.N.M.: Investigation, Formal analysis, and Manuscript writing—original draft; B.G.S.: Conceptualization, Methodology, and Supervision; S.S., P.V.V.P. and P.K.J.: Visualization and Writing—review and editing. All authors have read and agreed to the published version of the manuscript.

Funding

This research received no external funding.

Institutional Review Board Statement

Not applicable.

Informed Consent Statement

Not applicable.

Data Availability Statement

Data is available upon request from corresponding author.

Acknowledgments

The authors are grateful to the Department of Science and Technology, New Delhi for their support for this research program. Contribution number 22-060-J from Kansas Agricultural Experiment Station.

Conflicts of Interest

The authors declare no conflict of interest.

References

  1. Singh, H.N.; Kumar, M.R.; Magan, S.; Rakesh, K.; Hardev, R.; Kumar, M.V.; Manish, K. Evaluation of kharif forage crops for biomass production and nutritional parameters in Indo-Gangetic plains of India. Indian J. Anim. Nutr. 2019, 36, 25–29. [Google Scholar] [CrossRef]
  2. Hindoriya, P.S.; Meena, R.K.; Rakesh, K.; Singh, M.; Ram, H.; Meena, V.K.; Ginwal, D.; Dutta, S. Productivity, and profitability of cereal-legume forages vis-a-vis their effect on soil nutrient status in Indo-Gangetic Plains. Legume Res. 2019, 42, 812–817. [Google Scholar] [CrossRef]
  3. Makkar, H.P.S. Animal nutrition in a 360-degree view and a framework for future R&D work: Towards sustainable livestock production. Anim. Prod. Sci. 2016, 56, 1561–1568. [Google Scholar] [CrossRef] [Green Version]
  4. Chaudhary, D.P.; Ashwani, K.; Sapna, S.M.; Srivastava, P.; Kumar, R.S. Maize as Fodder? An Alternative Approach; Technical Bulletin; Directorate of Maize Research, Pusa Campus: New Delhi, India, 2012; p. 32. [Google Scholar]
  5. Kumar, R.; Singh, M.; Meena, B.S.; Ram, H.; Parihar, C.M.; Kumar, S.; Yadav, M.R.; Meena, R.K.; Kumar, U.; Meena, V.K. Zinc management effects on quality and nutrient yield of fodder maize (Zea mays). Indian J. Agric. Sci. 2017, 87, 29–33. [Google Scholar]
  6. Roy, A.K.; Agrawal, R.K.; Bhardwaj, N.R.; Mishra, A.K.; Mahanta, S.K. Revisiting National Forage Demand and Availability Scenario; ICAR-AICRP on Forage Crops and Utilization: Jhansi, India, 2019; pp. 1–21.
  7. Shekara, B.G.; Mahadevu, P.; Chikkarugi, N.M.; Manasa, N. Fodder and livestock scenario in karnataka. In Indian Fodder Scenario: Redefining State Wise Status; Indian Council of Agricultural Research—All India Coordinated Research Project on Forage Crops and Utilization: Jhansi, India, 2019; pp. 79–90. [Google Scholar] [CrossRef]
  8. Iqbal, A.; Iqbal, M.N.; Akbar, N.; Waseem, M.; Khan, H.Z.; Abbas, R.N. Performance of pearl millet (Pennisetum americanum L.) forage grown in association with forage legumes under different sowing techniques. Custose Agrone Aocio Online 2013, 9, 257–269. [Google Scholar]
  9. Marer, S.B.; Lingaraju, B.S.; Shashidhara, G.B. Productivity and economics of maize and pigeon pea intercropping under rainfed Northern transitional Zone of Karnataka. Karnataka J. Agric. Sci. 2007, 20, 1–3. [Google Scholar]
  10. Tamta, A.; Kumar, R.; Ram, H.; Meena, R.K.; Meena, V.K.; Yadav, M.R.; Subrahmanya, D.J. Productivity and profitability of legume-cereal forages under different planting ratio and nitrogen fertilization. Legume Res. 2019, 42, 102–107. [Google Scholar] [CrossRef]
  11. Reza, Z.O.; Allahdadi, I.; Mazaheri, D.; Akbari, G.A.; Jahanzad, E.; Mirshekari, M. Effect of different planting proportions and nitrogen fertilizer in intercropping forage sorghum and lima bean. Afr. J. Agric. Res. 2013, 8, 6488–6498. [Google Scholar] [CrossRef]
  12. Ali, M.A.; Khan, F.H.; Ali, R.S.; Afzal, Z.; Saleem, M.T.; Azeem, M. Effect of intercropping of pearl millet and cluster bean on forage quality and quantity. J. Entomol. Zool. Stud. 2016, 4, 397–400. [Google Scholar]
  13. Sudarshan Reddy, A.; Palled, Y.B. Effect of intercropped fodder cowpea on maize and system productivity in maize + fodder cowpea intercropping systems. J. Farm. Sci. 2016, 29, 265–267. [Google Scholar]
  14. AOAC. The Official Methods of Analysis; Association of Official Analytical Chemists: Washington, DC, USA, 2000. [Google Scholar]
  15. Iqbal, M.; Iqbal, Z.; Farooq, M.; Ali, L.; Fiaz, M. Impact of nitrogenous fertilizer on yield and quality of oat. Pak. J. Sci. 2013, 65, 1–4. [Google Scholar]
  16. Horrocks, R.D.; Vallentine, J.F. Harvested Forages; Academic Press: London, UK, 1999; pp. 17–47. [Google Scholar]
  17. Kumar, M.; Singh, S.R.; Jha, S.K.; Shamna, A.; Mazumdar, S.P.; Singh, A.; Kundu, D.K.; Mahapatra, B.S. System productivity, profitability and resource use efficiency of jute (Corchorus olitorius) based cropping systems in the eastern Indo-gangetic plain. Indian J. Agric. Sci. 2014, 84, 209–213. [Google Scholar]
  18. Singh, R.P.; Parr, J.F.; Stewart, B.A. Dryland agriculture—Strategies for sustainability. Adv. Soil Sci. 1990, 13, 340. [Google Scholar]
  19. Gomez, K.A.; Gomez, A.A. Statistical Procedure for Agriculture Research, 2nd ed.; John Willey and Sons: New York, NY, USA, 1984; p. 68. [Google Scholar]
  20. Prajapati, B.; Prajapati, J.; Kumar, K.; Shrivastava, A. Determination of the relationships between quality parameters and yields of fodder obtained from intercropping systems by correlation analysis. Forage Res. 2019, 45, 219–224. [Google Scholar]
  21. Patil, L.M.; Kauthale, V.K.; Bhalani, T.G.; Modi, D.J. Productivity, and economics of different forage production systems in south Gujarat conditions of India. Forage Res. 2018, 44, 14–18. [Google Scholar]
  22. Dwivedi, A.; Dev, I.; Kumar, V.; Yadav, R.S.; Yadav, M.; Gupta, D.; Singh, A.; Tomar, S.S. Potential role of maize-legume intercropping systems to improve soil fertility status under smallholder farming systems for sustainable agriculture in India. Int. J. Life Sci. Biotech. Pharm. Res. 2015, 4, 145–157. [Google Scholar]
  23. Deori, C.; Thakuria, K.; Kurmi, K. Effect of intercropping and planting methods on perennial grasses. Forage Res. 2019, 45, 162–164. [Google Scholar]
  24. Menbere, S.; Dejene, M.; Abreha, S. Dry matter yield and agronomic performance of herbaceous legumes intercropped with Napier grass (Pennisetum Purpureum) in the semi-arid areas of eastern Amhara region. Int. J. Recent Res. Life Sci. 2015, 2, 7–14. [Google Scholar]
  25. Eskandari, H. Intercropping of maize (Zea mays) with cowpea (Vigna sinensis) and mungbean (Vigna radiata): Effect of complementarity of intercrop components on resource consumption, dry matter production and legumes forage quality. J. Basic Appl. Sci. Res. 2012, 2, 355–360. [Google Scholar]
  26. Deore, S.M.; Patel, M.R.; Patel, P.M.; Patel, H.K.; Patel, U.J. Production potential of forage maize (Zea mays L.)—Cowpea (Vigna unguiculata L.) intercropping system as influenced by row ratios. Adv. Res. J. Crop. Improv. 2013, 4, 110–112. [Google Scholar]
  27. Shekara, B.G.; Lohithaswa, H.C.; Chikkarugi, N.M.; Manasa, N. Fodder production potential of maize grown for baby corn and green cob in different cropping systems. Forage Res. 2015, 41, 92–94. [Google Scholar]
  28. Orodho, A.B. The Role and Importance of Napier Grass in the Smallholder Dairy Industry in Kenya; Food and Agriculture Organization: Rome, Italy, 2006; p. 2011. [Google Scholar]
  29. Kabirizi, J.; Muyekho, F.; Mulaa, M.; Msangi, R.; Pallangyo, B.; Kawube, G.; Zziwa, E.; Mugerwa, S.; Ajanga, S.; Lukwago, G.; et al. Napier Grass Feed Resource: Production, Constraints and Implications for Smallholder Farmers in Eastern and Central Africa; The Eastern African Agricultural Productivity Project: Naivasha, Kenya, 2015. [Google Scholar]
  30. Rajput, R.D.; Paithane, V.A.; Taware, A.S.; Patil, R.P. A comparative study on the proximate and mineral composition of non-leguminous fodder crops. Biosci. Discov. 2017, 8, 890–891. [Google Scholar]
  31. Iyanar, K.; Babu, C.; Kumaravadivel, N.; Kalamani, A.; Velayudham, K.; Sathia Bama, K. A high yielding multicut fodder sorghum CO-31. Electron. J. Plant. Breed. 2015, 6, 54–57. [Google Scholar]
  32. Layek, J.; Das, A.; Mitran, T.; Nath, C.; Meena, R.S.; Yadav, G.S.; Shivakumar, B.G.; Kumar, S.; Lal, R. Cereal + legume intercropping: An option for improving productivity and sustaining soil health. In Legumes for Soil Health and Sustainable Management; Meena, R.S., Das, A., Yadav, G.S., Lal, R., Eds.; Springer: Singapore, 2018; pp. 347–386. [Google Scholar]
  33. Mallikarjun, R.H.; Kumar, R.; Meena, R.K.; Ginwal, D. Yield and chemical composition of cowpea (Vigna unguiculata) fodder as affected by tillage practices and nitrogen management. Indian J. Anim. Nutr. 2018, 35, 333–338. [Google Scholar] [CrossRef]
  34. Yadav, K.; Verma, A.; Yadav, M.K.; Choudhary, M.; Choudhary, K.M. Effect of fertilizer levels on fodder productivity and quality of multi-cut sorghum genotypes. Int. J. Bio-Resour. Stress Manag. 2019, 10, 119–123. [Google Scholar] [CrossRef]
  35. Rasool, T.; Zohaib, A.; Riaz, A.; Abbas, T.; Tabassum, T.; Nadeem, M.A. Forage yield and quality in pearl millet-sesbania intercropping system under various geometrical patterns. Pak. J. Agric. Res. 2017, 30, 75–84. [Google Scholar]
  36. Akhtar, M.F.; Ahmad, A.; Zamir, M.S.; Khalid, F.; Mohsin, A.U.; Afzal, M. Agro-qualitative studies on forage sorghum (Sorghum bicolor L.) sown alone and in mixture with forage legumes. Pak. J. Sci. 2013, 65, 179–185. [Google Scholar]
  37. Ayub, M.; Abbas, H.; Tariq, M.; Tahir, M.; Nadeem, M.A.; Siddiqui, M.H. Periodic assessment of dry matter production and nutritional value of millet legumes mix fodder. Agric. Res. 2013, 2, 265–269. [Google Scholar] [CrossRef] [Green Version]
  38. Uher, D.; Horvatic, I.; Jares, D.; Macesic, D. Influence of intercropping maize with cowpea on forage yield and quality. Direct Res. J. Agric. Food Sci. 2019, 7, 77–80. [Google Scholar]
  39. Idris, O.A.; Wintola, O.A.; Afolayan, A.J. Comparison of the proximate composition, vitamins (ascorbic acid, α-tocopherol and retinol), anti-nutrients (phytate and oxalate) and the GC-MS analysis of the essential oil of the root and leaf of Rumex crispus L. Plants 2019, 8, 51. [Google Scholar] [CrossRef] [PubMed] [Green Version]
  40. Nadeem, M.A.; Iqbal, Z.; Ayub, M.; Mubeen, K.; Ibrahim, M. Effect of nitrogen application on forage yield and quality of maize sown alone and in mixture with legumes. Pak. J. Life Soc. Sci. 2009, 7, 161–167. [Google Scholar]
  41. Anil, L.; Park, J.; Phipps, R.H.; Miller, F.A. Temperate intercropping of cereals for forage: A review of the potential for growth and utilization with particular reference to the UK. Grass Forage Sci. 1998, 53, 301–317. [Google Scholar] [CrossRef]
  42. Sadeghpoura, A.; Jahanzada, E.; Esmaeilib, A.; Hosseinib, M.B.; Hashemia, M. Forage yield, quality and economic benefit of intercropped barley and annual medic in semi-arid conditions: Additive series. Field Crops Res. 2013, 148, 43–48. [Google Scholar] [CrossRef]
  43. Baghdadi, A.; Halim, R.A.; Ghasemzadeh, A.; Ebrahimi, M.; Othman, R.; Yusof, M.M. Effect of intercropping of corn and soybean on dry matter yield and nutritive value of forage corn. Legume Res. 2016, 39, 976–981. [Google Scholar] [CrossRef]
  44. Prasanthi, K. Studies on Fodder Maize and Legume Intercropping System. Ph.D. Thesis, Acharya N.G. Ranga Agricultural University, Hyderabad, India, 2012. [Google Scholar]
  45. Islam, N.; Zamir, M.S.; Din, S.M.; Farooq, U.; Arshad, H.; Bilal, A.; Sajjad, M.T. Evaluating the intercropping of millet with cowpea for forage yield and quality. Am. J. Plant. Sci. 2018, 9, 1781–1793. [Google Scholar] [CrossRef] [Green Version]
  46. Jagadeesh, C.H.; Ramana, R.Y.; Nagalakshmi, D.; Mahender, M.; Nalini, K.N.; Sridhar, K.; Suneetha Devi, K.B. Effect of stage of harvest on the yield, chemical composition, in-vitro and in-sacco digestibility of hybrid Napier (Pennisetum purpureum) variety APBN1. Indian J. Anim. Res. 2017, 51, 116–120. [Google Scholar] [CrossRef] [Green Version]
  47. Lauriault, L.M.; Kirksey, R.E. Yield, and nutritive value of irrigated cereal forage grass-legume intercrops in the Southern high plains, USA. Agron. J. 2004, 96, 352–358. [Google Scholar] [CrossRef]
  48. Prajapati, B.; Tiwari, S.; Kewalanand. Effect of fodder based intercropping systems on quality of fodder. Forage Res. 2018, 43, 308–313. [Google Scholar]
  49. Sohail, H.K.; Abdul, G.K.; Mohammad, S.; Azim, A. Effect of maturity on production efficiency, nutritive value, and in-situ nutrients digestibility of three cereal fodders. Int. J. Agri. Res. 2007, 2, 900–909. [Google Scholar] [CrossRef]
  50. Salama, H.S.A.; Zeid, M.M.K. Hay quality evaluation of summer grass and legume forage monocultures and mixtures grown under irrigated conditions. Aust. J. Crop. Sci. 2016, 10, 1543–1550. [Google Scholar] [CrossRef]
  51. Prajapati, B.; Kewalanand. Production potential of fodder based intercropping systems. Int. J. Chem. Stud. 2017, 5, 834–838. [Google Scholar]
  52. Jeranyama, P.; Garcia, A.D. Understanding Relative Feed Value (RFV) and Relative Forage Quality (RFQ) 2004, Extension Extra. Paper 352. Available online: http://openprairie.sdstate.edu/extension_extra/352 (accessed on 8 August 2021).
  53. Karayilanli, E.; Ayhan, V. Investigation of feed value of alfalfa (Medicago sativa L.) harvested at different maturity stages. Legume Res. 2016, 39, 237–247. [Google Scholar] [CrossRef] [Green Version]
  54. Anil, L.; Park, J.; Phipps, R.H. The potential of forage-maize intercrops in ruminant nutrition. Anim. Feed Sci. Technol. 2000, 85, 157–164. [Google Scholar] [CrossRef]
  55. Prajapati, B. Cropping Systems for Sustainable Fodder and Bioenergy Production. Ph.D. Thesis, G.B. Pant University of Agriculture and Technology, Pantnagar, India, 2017. [Google Scholar]
  56. Naveen, K.; Navell, C.; Sunil, K. Production efficiency and profitability of forage based cropping systems under mid hills of north-western Himalayas. Himachal J. Agric. Res. 2014, 40, 126–131. [Google Scholar]
  57. Jha, S.K.; Tiwari, N. Evaluation of intensive fodder cropping systems for round the year green fodder production in Chhattisgarh. Forage Res. 2018, 44, 115–118. [Google Scholar]
  58. Pandiaraj, T. Studies on Development of Climate Resilient Management Practices in Rice Based Cropping System for Higher Productivity, Resource Conservation and Soil Health. Ph.D. Thesis, G.B. Pant University Agriculture and Technology, Pantnagar, India, 2013. [Google Scholar]
  59. Begna, S.; Fielding, D.; Tsegaye, T.; Van Veldhuizen, R.; Angadi, S.; Smith, D. Intercropping of oat and field pea in Alaska: An alternative approach to quality forage production and weed control. Soil Plant Sci. 2011, 61, 235–244. [Google Scholar] [CrossRef]
  60. Hassen, A.; Talore, D.G.; Tesfamariam, E.H.; Friend, M.A.; Mpanza, T.D.E. Potential use of forage-legume intercropping technologies to adapt to climate-change impacts on mixed crop-livestock systems in Africa: A review. Reg. Environ. Change 2017, 17, 1713–1724. [Google Scholar] [CrossRef] [Green Version]
  61. Ates, S.; Cicek, H.; Bell, L.W.; Norman, H.C.; Mayberry, D.E.; Kassam, S.; Hannaway, D.B.; Louhaichi, M. Sustainable development of smallholder crop-livestock farming in developing countries. In IOP Conference Series: Earth and Environmental Science, Surakarta, Indonesia; IOP Publishing: Bristol, UK, 2018; Volume 142, p. 012076. [Google Scholar] [CrossRef] [Green Version]
Figure 1. Weather conditions (minimum (min) and maximum (max) temperatures (T), relative humidity (RH), and monthly rainfall) during the two experimental years: 2018–19 (a) and 2019–20 (b) at the research site (Zonal Agricultural Research Station, Mandya, Karnataka, India).
Sustainability 13 09414 g001
Figure 2. Crop sowing and harvest schedule for annuals and perennials in 2018–2019 (a) and 2019–2020 (b).
Sustainability 13 09414 g002aSustainability 13 09414 g002b
Figure 3. Sustainability yield index (SYI) and light use efficiency (LUE) as influenced by different cropping system treatments. For treatment details please see Table 1.
Sustainability 13 09414 g003
Figure 4. Relationship between quality parameters of fodder under different cropping system modules. Nitrogen (N); crude protein (CP), ash, fat, total carbohydrate (T-CHO), and non-fiber CHO. *, **, and ***, significant at p < 0.05, 0.01, and 0.001, respectively.
Sustainability 13 09414 g004
Figure 5. Relationship between quality parameters of fodder under different cropping system modules. Crude protein (CP), acid detergent fiber (ADF), neutral detergent fiber (NDF), dry matter intake (DMI), digestible dry matter (DDM), and relative feed value (RFV). *, **, and ***, significant at p < 0.05, 0.01, and 0.001, respectively.
Sustainability 13 09414 g005
Table 1. Treatment details of different cropping systems implemented at the experimental site.
T.No.Treatment DetailsAbbreviations
1Fodder Maize–Fodder Maize–Fodder Maize monocropping systemMono: MZ–MZ–MZ
2Fodder Sorghum–Fodder Sorghum–Fodder Sorghum monocropping systemMono: SG–SG–SG
3Fodder Oats–Fodder Oats–Fodder Oats monocropping systemMono: OT–OT–OT
4Fodder Pearl millet–Fodder Pearl millet–Fodder Pearl millet monocropping systemMono: PM–PM–PM
5Fodder Cowpea–Fodder Cowpea–Fodder Cowpea monocropping systemMono: CP–CP–CP
6Bajra–Napier hybrid perennial systemPerennial: BNH
7Lucerne perennial systemPerennial: LU
8Desmanthus perennial systemPerennial: DS
9Sesbania perennial systemPerennial: SE
10Fodder Maize + Cowpea (3:1)–Fodder Oat + Cowpea (3:1)–Pearl millet + Cowpea (3:1)–Mixed cropping Mixed: MZ + CP–OT + CP–PM + CP
11Fodder Sorghum + Cowpea (3:1)–Fodder Maize + Cowpea (3:1)–Pearl millet + Cowpea (3:1)Mixed: SG + CP – MZ + CP–PM + CP
12Bajra–Napier hybrid + Cowpea (2:8) perennial systemPerennial: BNH + CP
13Bajra–Napier hybrid + Lucerne (2:8) perennial systemPerennial: BNH + LU
14Bajra–Napier hybrid + Desmanthus (2:8) perennial systemPerennial: BNH + DS
15Bajra–Napier hybrid + Sesbania (2:8) perennial systemPerennial: BNH + SE
Note: MZ, Maize; SG, Sorghum; OT, Oats; PM, Pearl millet; CP, Cowpea; BNH, Bajra Napier Hybrid; LU, Lucerne; DS, Desmanthus; SE, Sesbania.
Table 2. Green fodder yield (GFY), dry matter yield (DMY), and dry matter concentration (DM) as influenced by different cropping system treatments.
T. No.AbbreviationsGFY (t/ha/Year)DMY (t/ha/Year)DM (%)
1Mono: MZ–MZ–MZ104.7 ± 5.544 fgh21.5 ± 0.731 cdef20.52 ± 0.607 bcd
2Mono: SG–SG–SG90.6 ± 5.526 hi20.8 ± 0.285 def22.99 ± 1.672 a
3Mono: OT–OT–OT82.7 ± 5.854 i16.7 ± 1.328 g20.20 ± 0.635 bcd
4Mono: PM–PM–PM85.4 ± 3.659 i17.8 ± 1.298 fg20.89 ± 0.318 bcd
5Mono: CP–CP–CP77.8 ± 13.325 i15.5 ± 1.317 g19.98 ± 0.087 cd
6Perennial: BNH126.2 ± 1.271 cde24.8 ± 0.088 bc19.62 ± 0.742 d
7Perennial: LU95.2 ± 0.578 ghi19.1 ± 1.828 efg20.02 ± 0.642 cd
8Perennial: DS79.6 ± 0.617 i15.7 ± 1.271 g19.70 ± 1.288 cd
9Perennial: SE96.0 ± 9.416 ghi21.2 ± 0.433 cdef22.10 ± 0.634 ab
10Mixed: MZ + CP–OT + CP–PM + CP110.3 ± 2.696 efg22.7 ± 1.595 bcde20.59 ± 0.994 bcd
11Mixed: SG + CP–MZ + CP–PM + CP115.4 ± 5.868 def24.4 ± 1.074 bcd21.20 ± 0.692 abcd
12Perennial: BNH + CP155.2 ± 13.279 ab30.8 ± 0.145 a19.81 ± 0.754 cd
13Perennial: BNH + LU163.6 ± 1.037 a32.1 ± 0.291 a19.58 ± 1.102 d
14Perennial: BNH + DS131.0 ± 6.970 cd25.5 ± 2.773 b19.48 ± 0.297 d
15Perennial: BNH + SE144.0 ± 4.020 bc31.3 ± 2.419 a21.72 ± 0.789 abc
SEM6.31.30.70
LSD (p = 0.05)18.33.82.03
SEM: Standard Error of Means; LSD: Least Significant Difference. Superscript represents treatment means with similar alphabets do not differ significantly at LSD = 0.05 probability (p) level. Note: MZ, Maize; SG, Sorghum; OT, Oats; PM, Pearl millet; CP, Cowpea; BNH, Bajra Napier Hybrid; LU, Lucerne; DS, Desmanthus; SE, Sesbania.
Table 3. Nitrogen (N), crude protein (CP), ash, fat, non-fiber CHO (NF-CHO), and total carbohydrate (T-CHO) percent in biomass as influenced by different cropping system treatments.
T. No.AbbreviationsN (%)CP (%)Ash (%)Fat (%)NF-CHO (%)T-CHO (%)
1Mono: MZ–MZ–MZ1.58 ± 0.023 ghi9.92 ± 0.367 fgh10.18 ± 0.268 bcde2.67 ± 0.025 gh32.84 ± 1.209 bc77.23 ± 1.995 abc
2Mono: SG–SG–SG1.30 ± 0.003 i8.10 ± 0.5 h8.26 ± 0.273 gh3.09 ± 0.052 bcd34.19 ± 1.109 ab80.55 ± 0.041 a
3Mono: OT–OT–OT1.66 ± 0.009 fgh10.36 ± 0.26 efg8.44 ± 0.092 gh3.03 ± 0.156 bcde36.9 ± 3.582 a78.16 ± 1.659 ab
4Mono: PM–PM–PM1.36 ± 0.015 hi8.51 ± 0.376 gh8.12 ± 0.028 h2.62 ± 0.069 h35.25 ± 0.75 ab80.75 ± 1.427 a
5Mono: CP–CP–CP3.28 ± 0.012 abc20.51 ± 0.303 ab10.30 ± 0.306 bcd2.70 ± 0.096 fgh26.4 ± 1.21 ef66.5 ± 1.798 d
6Perennial: BNH1.59 ± 0.017 ghi9.92 ± 0.306 fgh10.41 ± 0.078 abc2.90 ± 0.08 defg34.2 ± 0.326 ab76.78 ± 1.664 abc
7Perennial: LU3.34 ± 0.03 ab20.62 ± 1.438 ab10.49 ± 0.06 abc3.20 ± 0.122 bc25.87 ± 0.2 ef65.69 ± 4.942 d
8Perennial: DS2.96 ± 0.007 d18.53 ± 0.589 c9.04 ± 0.017 fg2.92 ± 0.073 def29.2 ± 1.299 cde69.5 ± 2.332 cd
9Perennial: SE3.57 ± 0.02 a22.32 ± 1.267 a10.98 ± 0.275 ab3.78 ± 0.066 a23.05 ± 0.914 f62.93 ± 0.826 d
10Mixed: MZ + CP–OT + CP–PM + CP1.95 ± 0.349 f12.19 ± 0.892 e9.48 ± 0.738 def2.83 ± 0.127 efgh32.91 ± 1.293 bc75.51 ± 2.919 abc
11Mixed: SG + CP–MZ + CP–PM + CP1.86 ± 0.167 fg11.57 ± 0.59 ef9.41 ± 0.60 ef2.99 ± 0.029 cde32.59 ± 1.296 bc76.04 ± 5.62 abc
12Perennial: BNH + CP2.91 ± 0.012 d18.2 ± 1.471 cd11.22 ± 0.572 a3.02 ± 0.01 cde26.93 ± 0.992 de67.57 ± 2.115 d
13Perennial: BNH + LU3.01 ± 0.111 cd18.78 ± 0.912 bc10.86 ± 0.301 abc3.28 ± 0.042 b26.94 ± 1.309 de67.09 ± 2.048 d
14Perennial: BNH + DS2.61 ± 0.029 e16.32 ± 0.664 d10.07 ± 0.279 cde3.05 ± 0.07 bcde30.37 ± 1.292 cd70.57 ± 1.467 bcd
15Perennial: BNH + SE3.16 ± 0.09 bcd19.75 ± 0.709 bc11.18 ± 0.332 a3.77 ± 0.084 a25.82 ± 0.317 ef65.31 ± 2.926 d
SEM0.100.660.290.091.312.67
LSD (p = 0.05)0.301.910.850.253.787.75
SEM: Standard Error of Means; LSD: Least Significant Difference. Superscript represents treatment means with similar alphabets do not differ significantly at LSD = 0.05 probability (p) level. Note: MZ, Maize; SG, Sorghum; OT, Oats; PM, Pearl millet; CP, Cowpea; BNH, Bajra Napier Hybrid; LU, Lucerne; DS, Desmanthus; SE, Sesbania.
Table 4. Crude fiber (CF), acid detergent fiber (ADF), neutral detergent fiber (NDF), dry matter intake (DMI), digestible dry matter (DDM), and relative feed value (RFV) in biomass as influenced by different cropping system treatments.
T. No.AbbreviationsCF (%)ADF (%)NDF (%)DDI (%)DDM (%)RFV (%)
1Mono: MZ–MZ–MZ31.95 ± 1.122 ab40.79 ± 0.214 ab63.58 ± 0.919 a1.89 ± 0.0 ef57.12 ± 2.974 fg83.56 ± 7.461 h
2Mono: SG–SG–SG34.48 ± 1.123 a39.66 ± 2.512 abc62.79 ± 1.243 ab1.91 ± 0.006 ef58.01 ± 0.242 defg85.92 ± 3.127 h
3Mono: OT–OT–OT27.62 ± 0.774 c31.22 ± 1.263 e60.14 ± 1.978 abc1.99 ± 0.003 ef64.58 ± 0.619 a99.89 ± 5.987 efg
4Mono: PM–PM–PM30.52 ± 0.671 bc39.75 ± 0.108 abc60.28 ± 1.233 abc1.99 ± 0.006 ef57.93 ± 0.084 efg89.41 ± 6.166 gh
5Mono: CP–CP–CP27.62 ± 2.424 c36.19 ± 0.087 bcd47.72 ± 1.414 f2.51 ± 0.003 abc60.71 ± 1.389 bcde118.34 ± 8.404 bcd
6Perennial: BNH30.08 ± 0.246 bc42.26 ± 1.107 a64.19 ± 0.983 a1.87 ± 0.006 f55.98 ± 0.217 g81.11 ± 5.846 h
7Perennial: LU27.42 ± 2.338 c34.82 ± 1.097 de43.47 ± 1.481 f2.76 ± 0.003 a61.78 ± 0.094 ab132.17 ± 5.142 a
8Perennial: DS28.70 ± 0.848 bc35.80 ± 1.389 cde44.06 ± 1.215 f2.72 ± 0.006 ab61.02 ± 1.470 bc128.81 ± 8.409 ab
9Perennial: SE27.29 ± 0.088 c39.05 ± 0.212 abcd48.74 ± 1.536 ef2.46 ± 0.006 bc58.48 ± 0.163 cdefg111.58 ± 2.492 de
10Mixed: MZ + CP–OT + CP–PM + CP28.75 ± 2.087 bc36.06 ± 3.569 cd55.48 ± 2.523 cde2.16 ± 0.092 de60.81 ± 0.188 bcd101.94 ± 6.056 ef
11Mixed: SG + CP–MZ + CP–PM + CP30.38 ± 2.066 bc38.04 ± 1.605 abcd56.05 ± 1.422 bcd2.14 ± 0.081 ef59.26 ± 0.129 bcdef98.34 ± 2.809 fg
12Perennial: BNH + CP27.83 ± 1.177 c36.20 ± 1.703 bcd48.96 ± 5.984 def2.45 ± 0.127 bc60.7 ± 0.205 bcde115.32 ± 5.968 cd
13Perennial: BNH + LU27.65 ± 0.831 c34.53 ± 2.604 de45.85 ± 4.653 f2.62 ± 0.312 abc62 ± 0.0 ab125.77 ± 2.877 abc
14Perennial: BNH + DS28.39 ± 0.150 bc35.78 ± 0.116 cde46.35 ± 1.636 f2.59 ± 0.096 abc61.03 ± 0.091 bc122.49 ± 6.739 abcd
15Perennial: BNH + SE27.02 ± 0.768 c38.57 ± 0.042 abcd49.29 ± 2.707 def2.43 ± 0.064 cd58.85 ± 0.036 cdef111.05 ± 3.002 de
SEM1.241.602.520.100.974.25
LSD (p = 0.05)3.594.647.290.282.8212.31
SEM: Standard Error of Means; LSD: Least Significant Difference. Superscript represents treatment means with similar alphabets do not differ significantly at LSD = 0.05 probability (p) level. Note: MZ, Maize; SG, Sorghum; OT, Oats; PM, Pearl millet; CP, Cowpea; BNH, Bajra Napier Hybrid; LU, Lucerne; DS, Desmanthus; SE, Sesbania.
Table 5. Quality yield of crude protein (CP), total dry crude protein (TDCP), ash, fat, total carbohydrate (T-CHO), and non-fiber carbohydrate (NF-CHO) in biomass as influenced by different cropping system treatments.
T. No.AbbreviationsCP
(t/ha/Year)
TDCP
(t/ha/Year)
Ash
(t/ha/Year)
Fat
(t/ha/Year)
NF-CHO
(t/ha/Year)
T-CHO
(t/ha/Year)
1Mono: MZ–MZ–MZ2.13 ± 0.122 efg1.87 ± 0.113 fg2.19 ± 0.096 c0.57 ± 0.009 fg7.06 ± 0.557 bcd16.60 ± 0.520 ef
2Mono: SG–SG–SG1.69 ± 0.085 g1.44 ± 0.075 g1.72 ± 0.029 de0.65 ± 0.064 ef7.12 ± 0.338 bcd16.80 ± 0.214 e
3Mono: OT–OT–OT1.73 ± 0.139 fg1.48 ± 0.112 g1.41 ± 0.025 e0.51 ± 0.023 gh6.16 ± 0.159 de13.00 ± 0.368 gh
4Mono: PM–PM–PM1.52 ± 0.151 g1.27 ± 0.109 g1.45 ± 0.015 e0.47 ± 0.021 h6.29 ± 0.407 cd14.40 ± 0.407 fg
5Mono: CP–CP–CP3.19 ± 0.049 d2.89 ± 0.277 d1.60 ± 0.029 e0.42 ± 0.056 h4.11 ± 0.105 f10.40 ± 0.388 i
6Perennial: BNH2.45 ± 0.110 def2.18 ± 0.195 ef2.57 ± 0.125 b0.72 ± 0.037 de8.47 ± 0.266 a19.00 ± 0.347 bcd
7Perennial: LU3.98 ± 0.309 c3.66 ± 0.252 c2.00 ± 0.015 cd0.61 ± 0.018 f4.93 ± 0.180 ef12.50 ± 0.343 ghi
8Perennial: DS2.90 ± 0.107 d2.62 ± 0.198 de1.42 ± 0.169 e0.46 ± 0.010 h4.58 ± 0.148 f10.90 ± 0.448 hi
9Perennial: SE4.73 ± 0.301 b4.39 ± 0.202 b2.33 ± 0.318 bc0.80 ± 0.027 d4.89 ± 0.209 f13.30 ± 0.811 g
10Mixed: MZ + CP–OT + CP–PM + CP2.75 ± 0.304 de2.60 ± 0.160 de2.18 ± 0.155 c0.64 ± 0.054 ef7.47 ± 0.768 abc17.30 ± 1.208 de
11Mixed: SG + CP–MZ + CP–PM + CP2.82 ± 0.197 de2.67 ± 0.199 de2.30 ± 0.171 bc0.73 ± 0.010 de7.96 ± 0.862 ab18.50 ± 0.828 cde
12Perennial: BNH + CP5.60 ± 0.820 a5.37 ± 0.127 a3.46 ± 0.208 a0.93 ± 0.015 c8.29 ± 0.314 ab20.80 ± 0.693 ab
13Perennial: BNH + LU6.02 ± 0.216 a5.77 ± 0.500 a3.48 ± 0.049 a1.05 ± 0.025 b8.63 ± 0.765 a21.50 ± 0.532 a
14Perennial: BNH + DS4.17 ± 0.222 bc3.98 ± 0.309 bc2.57 ± 0.196 b0.78 ± 0.024 d7.76 ± 0.189 ab18.10 ± 1.335 de
15Perennial: BNH + SE6.18 ± 0.111 a5.93 ± 0.210 a3.50 ± 0.116 a1.18 ± 0.044 a8.08 ± 0.327 ab20.30 ± 1.565 abc
SEM0.260.210.130.030.430.76
LSD (p = 0.05)0.740.610.380.101.242.20
SEM: Standard Error of Means; LSD: Least Significant Difference. Superscript represents treatment means with similar alphabets do not differ significantly at LSD = 0.05 probability (p) level. Note: MZ, Maize; SG, Sorghum; OT, Oats; PM, Pearl millet; CP, Cowpea; BNH, Bajra Napier Hybrid; LU, Lucerne; DS, Desmanthus; SE, Sesbania.
Publisher’s Note: MDPI stays neutral with regard to jurisdictional claims in published maps and institutional affiliations.

