Article

Exploring the Relationships between Demographics, Road Safety Attitudes, and Self-Reported Pedestrian Behaviours in Bangladesh

by
Shahnewaz Hasanat-E-Rabbi
1,*,
Omar Faruqe Hamim
2,
Mithun Debnath
3,
Md. Shamsul Hoque
2,
Rich C. McIlroy
4,
Katherine L. Plant
4 and
Neville A. Stanton
4
1
Accident Research Institute (ARI), Bangladesh University of Engineering and Technology (BUET), Dhaka 1000, Bangladesh
2
Department of Civil Engineering, Bangladesh University of Engineering and Technology (BUET), Dhaka 1000, Bangladesh
3
Department of Civil Engineering, Ahsanullah University of Science and Technology (AUST), Dhaka 1208, Bangladesh
4
Human Factors Engineering, Transportation Research Group, University of Southampton, Southampton SO17 1BJ, UK
*
Author to whom correspondence should be addressed.
Sustainability 2021, 13(19), 10640; https://0-doi-org.brum.beds.ac.uk/10.3390/su131910640
Submission received: 13 July 2021 / Revised: 12 August 2021 / Accepted: 13 August 2021 / Published: 25 September 2021
(This article belongs to the Special Issue Sustainable Analysis of Traffic Crash Risk)

Abstract

:
Pedestrians are the most vulnerable road users in low- and middle-income countries, hence understanding their attitudes towards traffic safety and the pedestrian behaviours associated with those attitudes is vital. The current study identifies the factor structure of a self-report questionnaire on pedestrian behaviours and road safety attitudes and explores the relationships between them. It also assesses demographic effects. A total of 532 people were surveyed. The questionnaire sections related to attitudes and behaviours were developed for use in different, largely high-income settings, hence their suitability for use in the low-income setting of Bangladesh was first assessed using Principal Component Analysis (PCA). A structural equation model was then developed to examine the relationships between attitudes and pedestrian behaviours. It was found that positive attitudes towards traffic safety were associated with safer pedestrian behaviours, and that males, younger respondents, and less educated respondents reported performing riskier behaviours and holding more dangerous attitudes to road safety. Results are discussed in terms of the factors likely to influence such behaviours, as well as a discussion on the need for validation of the research tools which have been developed in high-income settings for low-income settings.

1. Introduction

Road safety is a multifaceted, complex problem comprising various factors [1]. Globally, almost half of all road traffic collision fatalities are pedestrians, cyclists, and motorcyclists—the vulnerable road user groups [2]. Among those groups, pedestrians are the most vulnerable and are over-represented in casualty statistics, especially in low- and middle-income countries (LMICs). Among pedestrian fatalities, about 49% occur in low-income countries [3]. Recently, increased concern about pedestrian fatalities can be observed all over the world, especially in LMICs [4,5,6], therefore building an understanding of pedestrian behaviour in low- and middle-income settings is a necessary precursor to any successful national or global road safety strategy [7].
In order to combat this issue, we need to understand the underlying factors influencing pedestrian behaviours and attitudes towards road safety [4,7,8,9,10]. Previously, Moyano Díaz [11], Schwebel et al. [12], and Papadimitriou et al. [13] have studied the effects of demographic and personality characteristics on pedestrian behaviours, and Reason et al. [14] has used the Driver Behaviour Questionnaire (DBQ) to understand driver behaviours. However, very little research has been undertaken to explore such relationships in LMICs. Almost every human being interacts with the road system as a pedestrian at some instance in their day-to-day life, especially in less motorised, lower-income settings; hence, studies taking pedestrian behaviour as their focus are especially needed in LMICs [7].
Poor planning and infrastructure design and operational deficiencies play central roles in pedestrian-related injuries and fatalities in LMICs [2]; however, pedestrian and driver behaviour also contributes significantly to collisions involving pedestrians (e.g., [14,15,16]). Observational studies and self-report questionnaires have been used to understand the underlying constructs of pedestrian behaviours. Investigating the influence of roadway features, vehicular characteristics, traffic control features, and pedestrian safety facilities on pedestrian behaviours have been the main aims of most observational studies [17,18,19,20], whereas self-report questionnaire surveys deal with understanding various psychological factors underpinning behaviour [21,22,23,24,25,26,27]. Of the many potential methods (e.g., [28,29,30,31,32,33,34,35,36,37,38,39,40]) one can use to study pedestrian behaviour and its antecedents, Granié et al. [41] argued that the questionnaire method provides the most generalisable method.
In questionnaire studies, the validation of the questionnaire structure is vital [41]. For instance, the Adolescent Road User Behaviour Questionnaire (ARBQ) developed in the UK by Elliott and Baughan [42] was then validated in Spain [43], New Zealand [44], Belgium [45], and Iran [46]. These questionnaires included three specific behaviours: Unsafe road crossing, dangerous playing in the road, and planned protective behaviour. Building on this questionnaire and on Reason et al.’s [14] Driver Behaviour Questionnaire (DBQ), Granié et al. [41] developed and validated the Pedestrian Behaviour Scale (PBS) for all ages in France, distinguishing four specific behavioural categories: (i) ‘Transgression’ including both traffic rule violations and errors, (ii) ‘lapses’, (iii) ‘aggressive behaviours’, (iv) ‘positive behaviours’. More recently, Deb et al. [47] expanded upon the PBS of Granié et al. [41] and applied it in a North American setting, calling it the pedestrian behaviour questionnaire (PBQ). In our own previous work [7], the PBQ factor structure was validated across six countries, including Bangladesh; however, in this work, a questionnaire suitable for application across all countries was sought, hence many items originally included in the questionnaire were necessarily excluded. It represented a compromise for use across many distinct settings, and the most suitable factor structure for each individual setting was not explored.
Of the antecedents of behaviour explored in a traffic safety context, road safety attitudes have been the most commonly explored [48,49,50], with some literature available concerning the relationships between road traffic safety attitudes and pedestrian behaviours [7,8,10,11,16,51]. It has been argued by Şimşekoğlu [52] that attitudes concerning tendencies towards the violation of rules and risk taking are significant predictors of pedestrian behaviours, and that pedestrians with safer attitudes demonstrate safer on-road behaviours. Pedestrian behaviours and attitudes are, however, directly influenced by characteristics such as age, gender, education level, socioeconomic status, etc., with age and gender often being shown to have significant influence [11,41,47,48,52]. As aforementioned, some cross-cultural studies involving LMICs have been conducted (e.g., [7,8,9]); however, targeted research in Bangladesh is lacking. Given the likelihood of different PBQ factor structures in different countries (see [10]), how demographic factors and road safety attitudes relate to specific pedestrian behaviour factors in low-income settings such as Bangladesh is still not clear.
The aims of this study are three-fold: Firstly, to identify the factor structure of the attitudes towards traffic safety measures in Bangladesh; Secondly, to explore the constructs underlying pedestrian behaviour; Thirdly, to explore the relationships between attitudes towards traffic safety, self-reported pedestrian behaviours, and several demographic variables (i.e., age, gender, and education) in the context of Bangladesh, a least-developed, low-income country where pedestrians are involved in about 45% of all collisions, and where pedestrian facilities are insufficient [53]. Based on the literature, we hypothesized that safer attitudes would be associated with safer pedestrian behaviours, and that males over females, younger individuals over older individuals, and less educated people over more educated people would report performing riskier pedestrian behaviours and holding more dangerous attitudes to road safety.

2. Materials and Methods

As described above, this research uses the same data as reported in [1,8,9]; where that research provided a view on six countries, ours focuses on Bangladesh, using data only from that sample. The survey methodology and sampling used is described in that work and is repeated here.

2.1. Survey Instrument

A questionnaire survey was used to measure attitudes towards road traffic safety, pedestrian behaviours, and to collect demographic information (age, gender, and education level). To measure people’s general attitudes towards traffic safety, 22 items were used, each measuring responses on a five-point Likert scale (from ‘strongly agree’ to ‘strongly disagree’). The respondents were asked to rate how much they agree with statements concerning the performance of risky on-road behaviours. Fifteen questions were taken from Iversen and Rundmo [54], four were taken from Peltzer and Renner [55], and three were added for this research.
To measure pedestrian behaviour, the short version of the PBQ described by Deb et al. [47] (see also [7]) was used. The PBQ consisted of 20 items in five categories—violations, errors, lapses, aggressive behaviours, and positive behaviours—with four questions in each category. Responses were given on a six-point Likert scale ranging from ‘extremely infrequently or never’ to ‘extremely frequently or always’. One question regarding crossing the street while the pedestrian light is red was excluded from the questionnaire because, in Bangladesh, pedestrian lights are rarely present. Instead, we used another question that refers to the non-use of footbridges or underpasses for road crossing—a common practice in Bangladesh. Respondents were also asked a number of demographic questions including age, gender, and education level.

2.2. Survey Administration
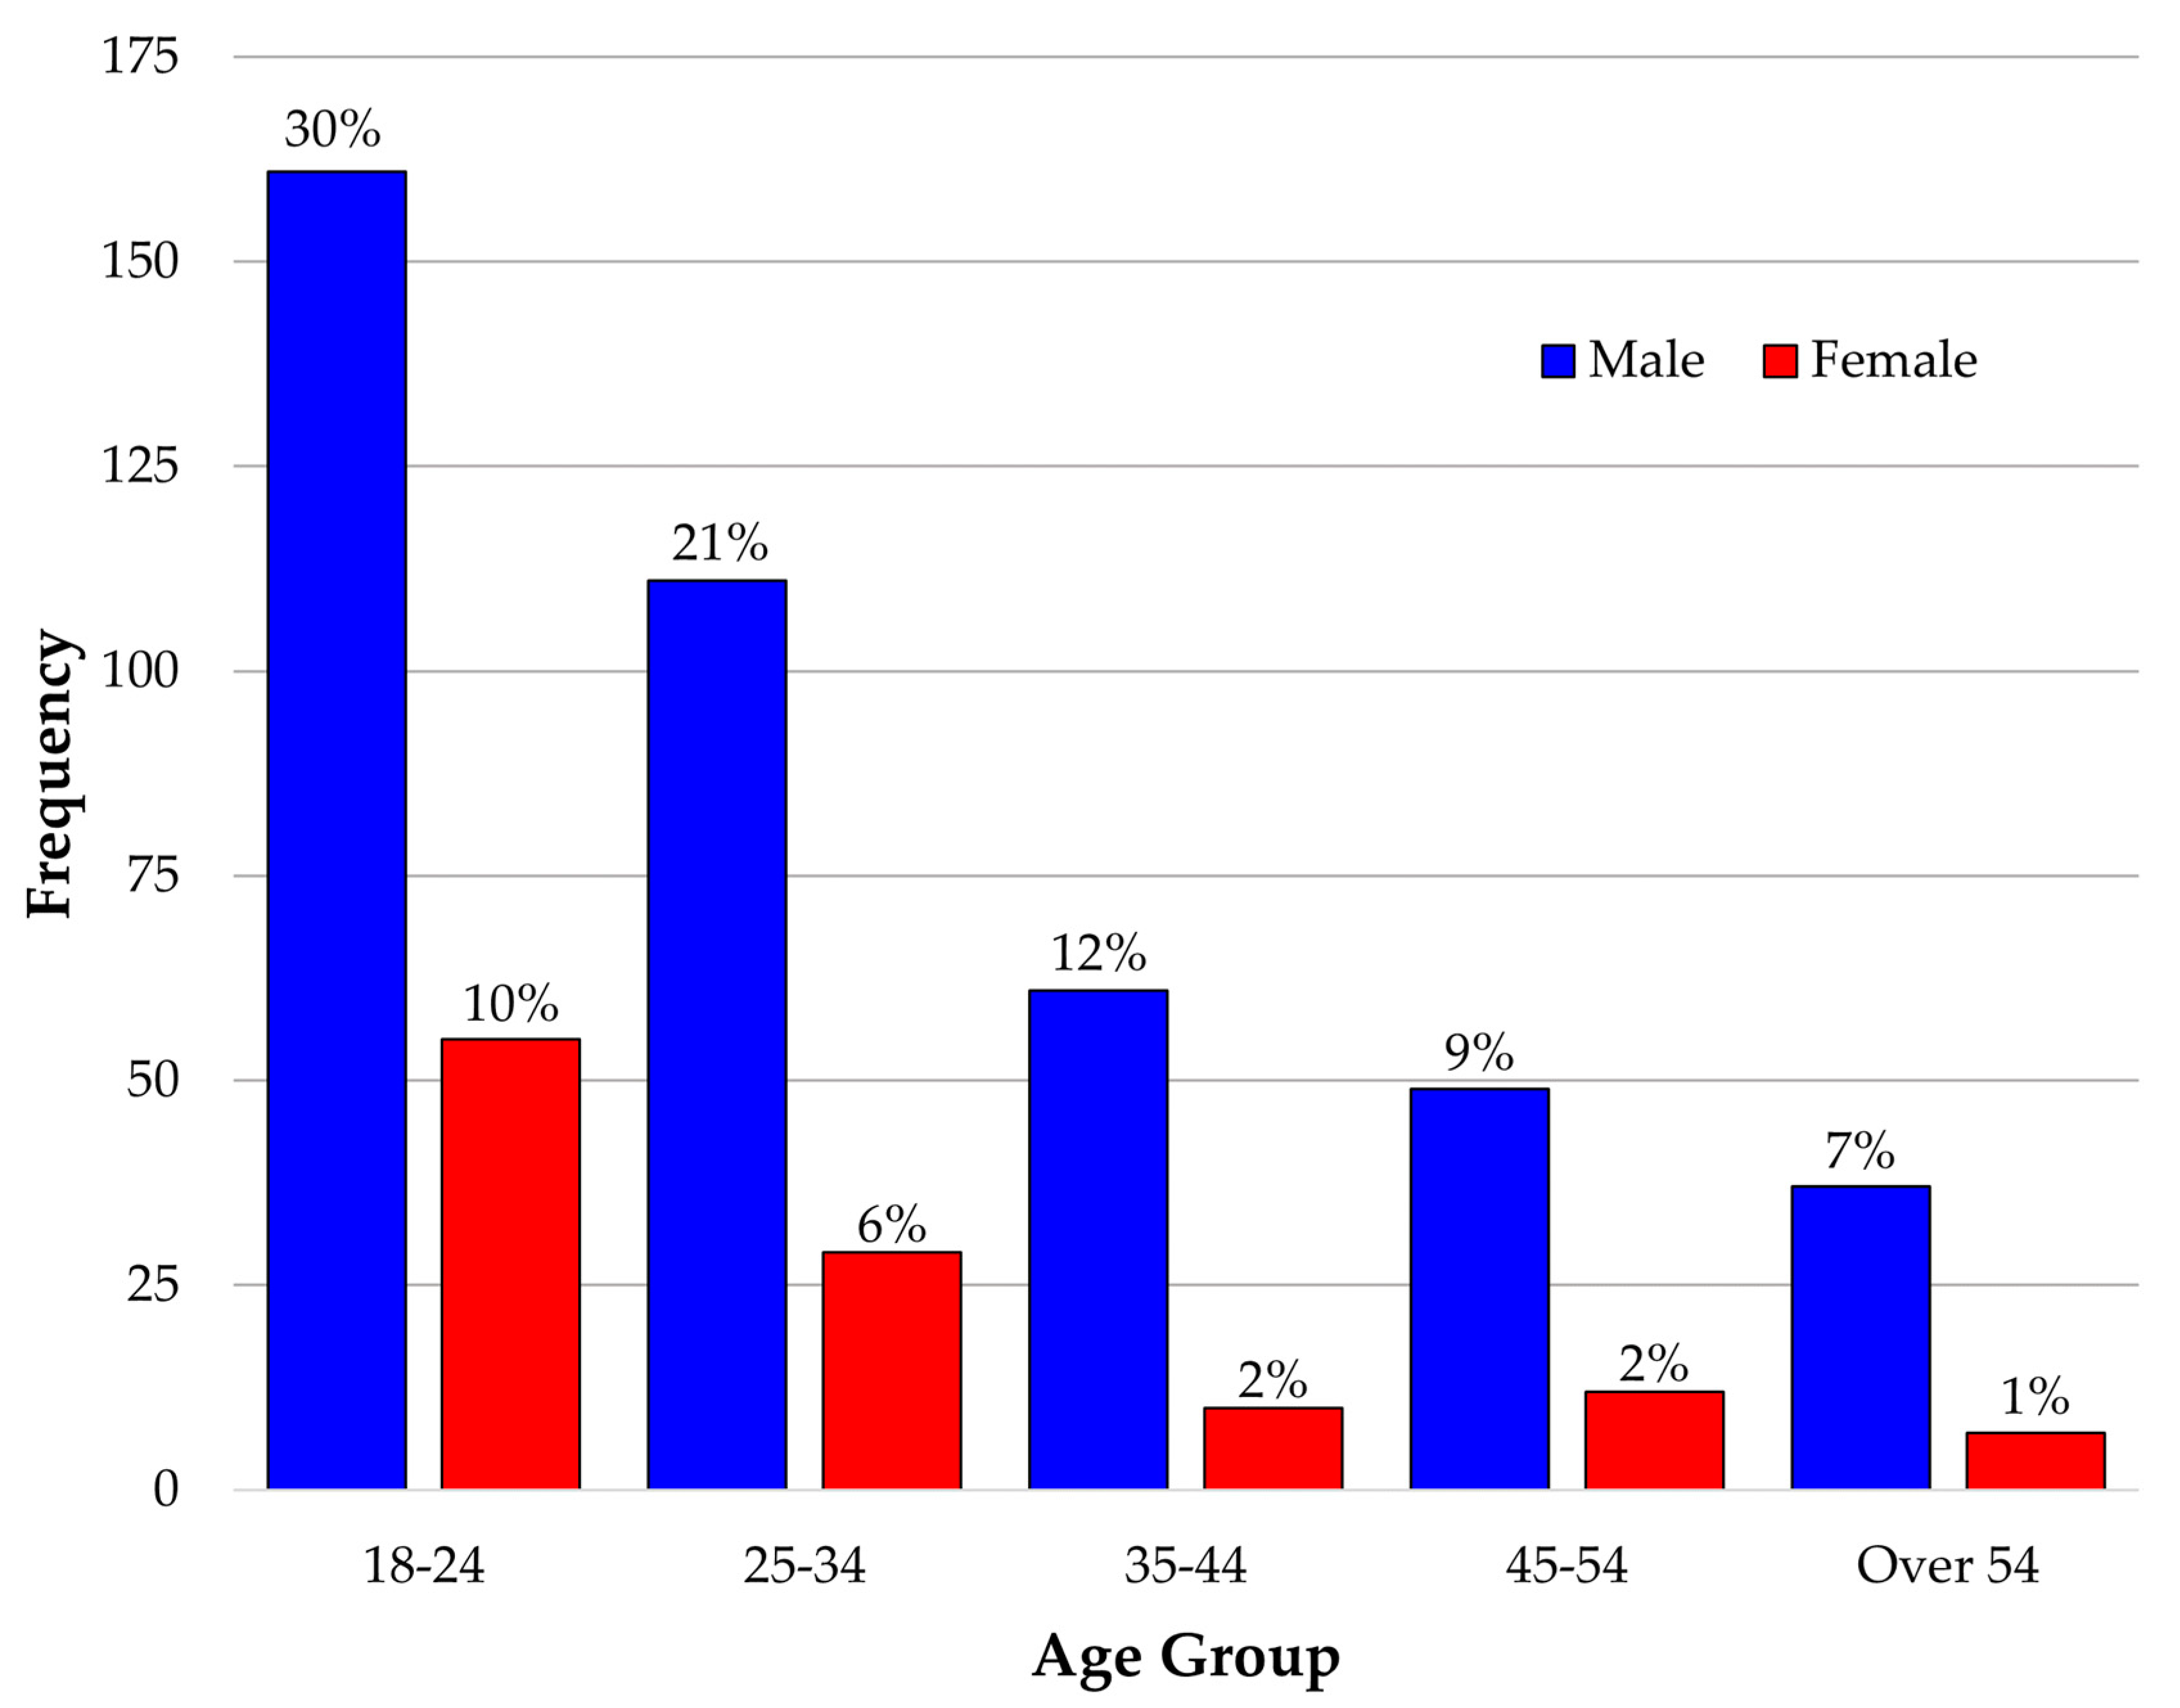
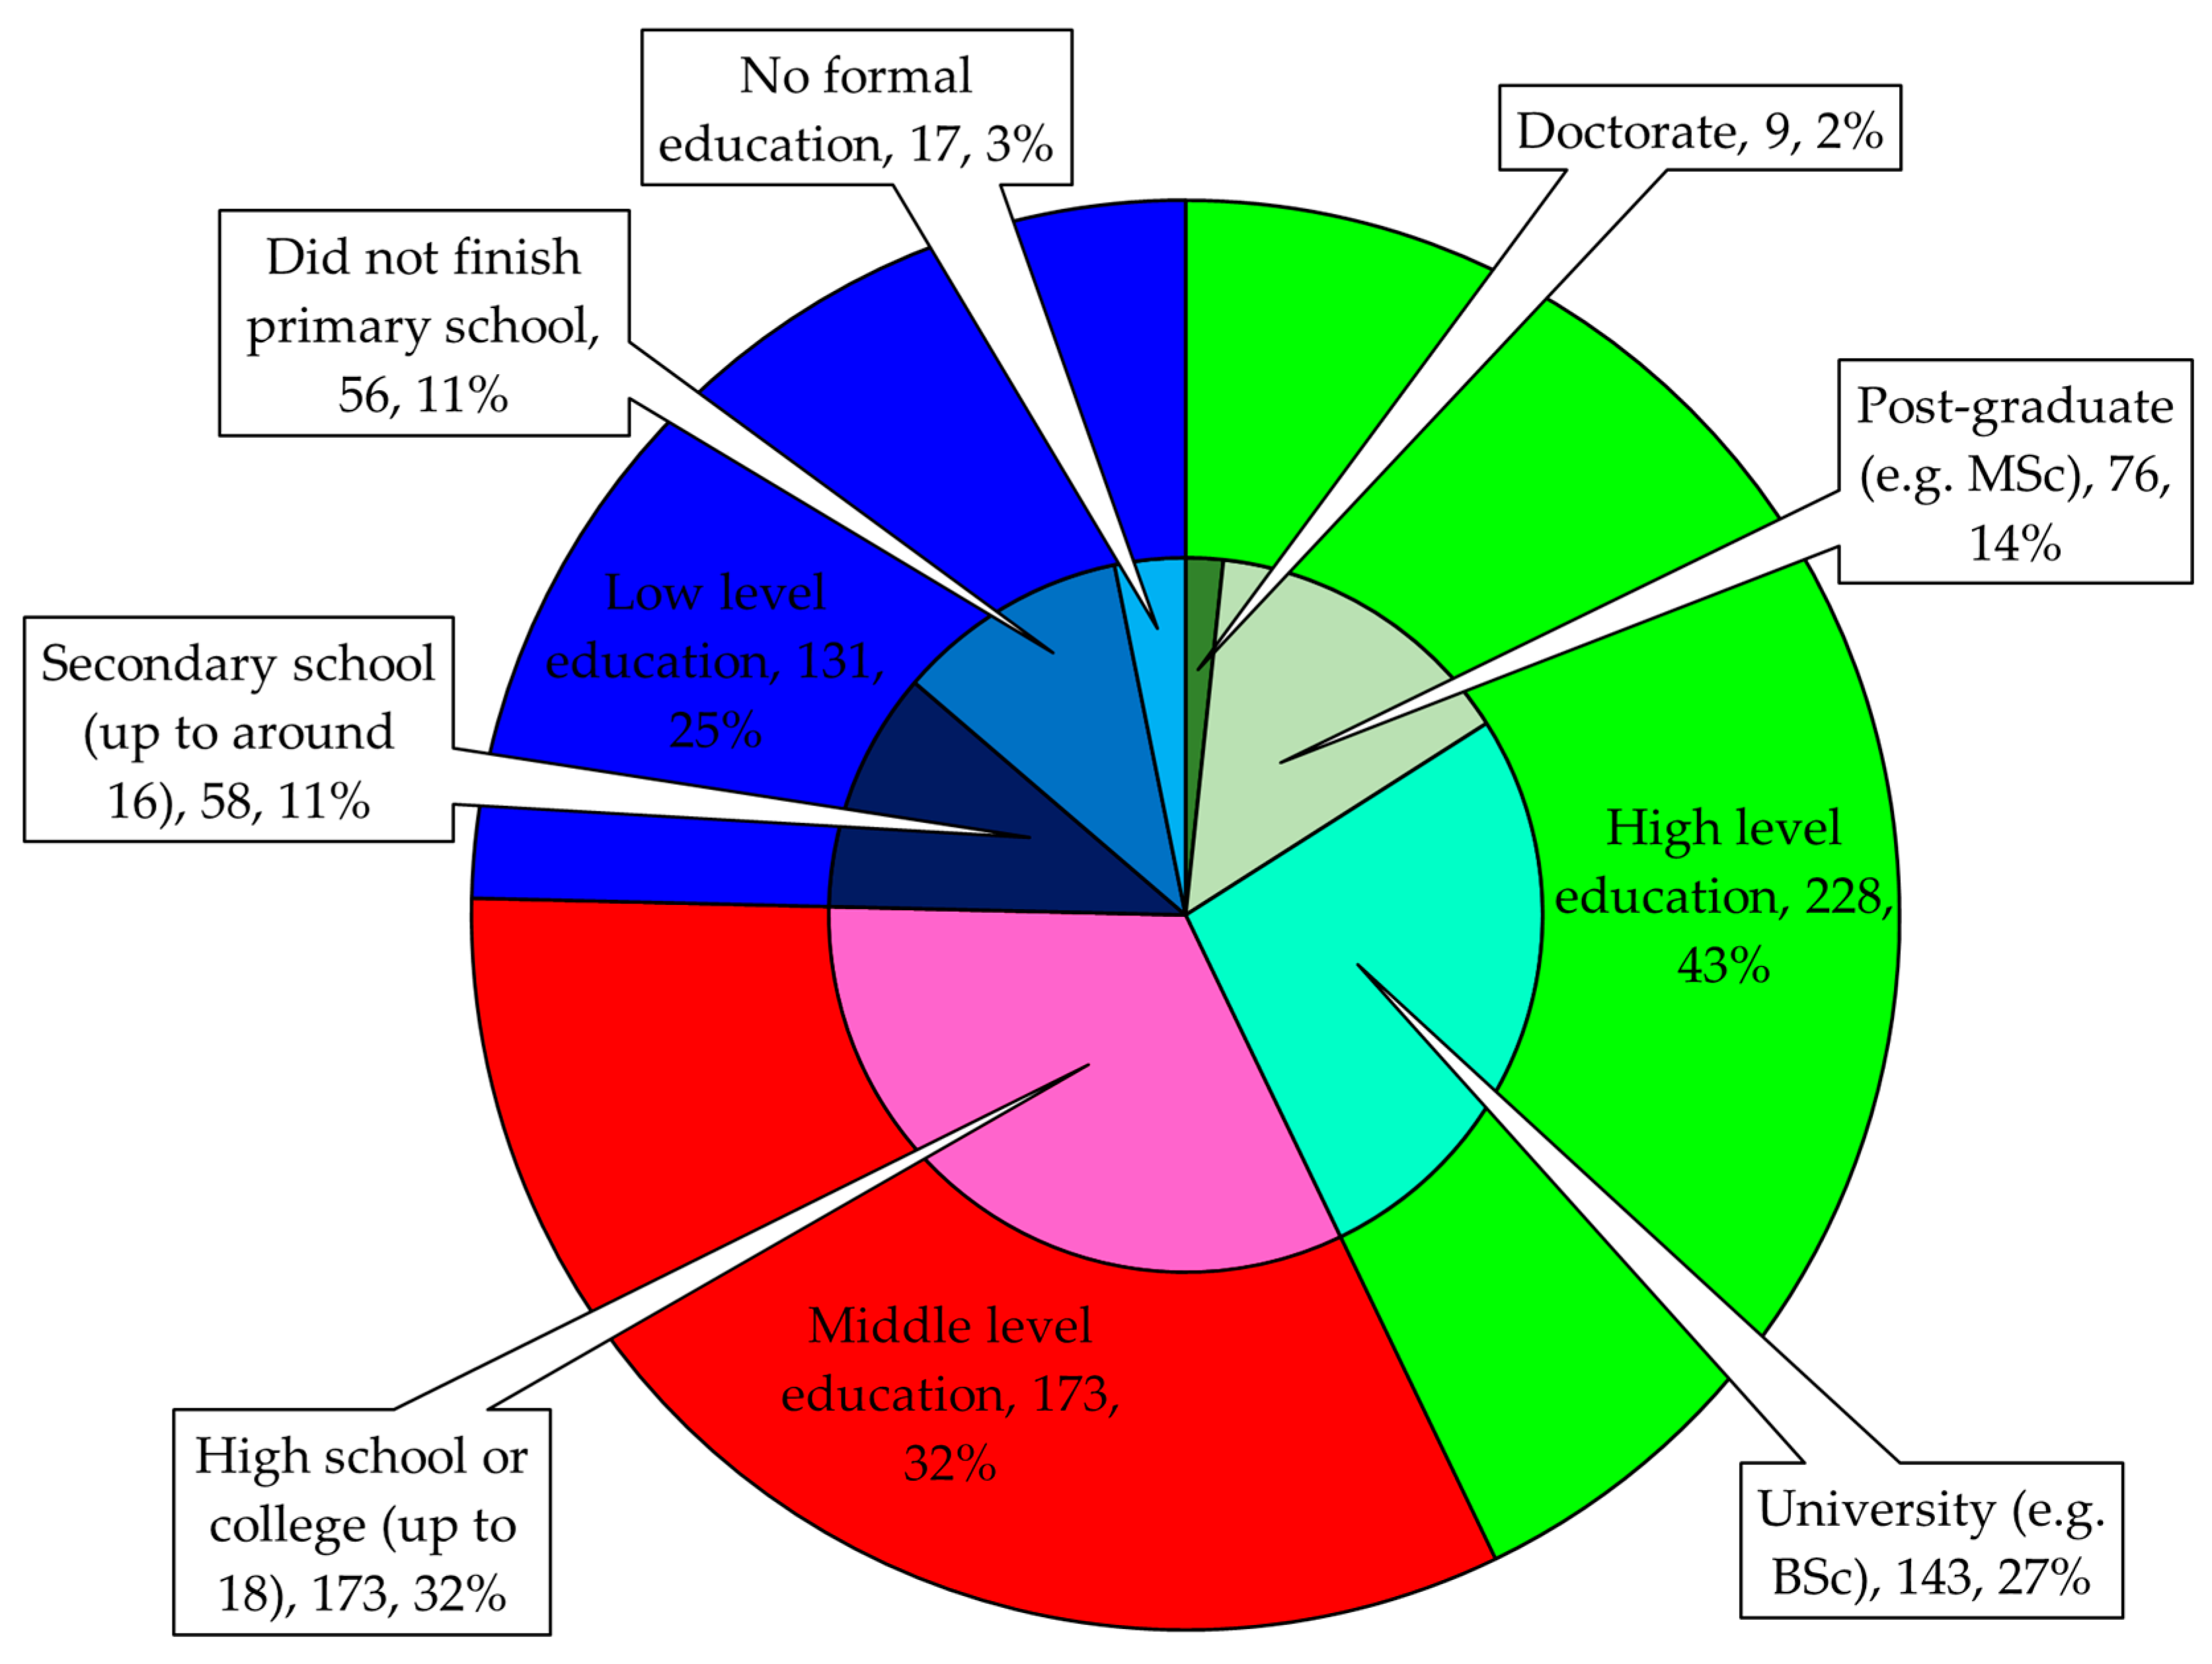
The questionnaire was first developed in English. Since English is not the native language of the Bangladesh population, translation of the survey items to Bengali (the native language of the Bangladeshi people) was carried out in accordance with Brislin [56,57]. The translation was performed by a native speaker, then the Bengali translation was back-translated to English by a different bi-lingual individual. The two English versions were then compared and discussed between researchers in the UK and in Bangladesh to resolve any inconsistencies. The process continued until a satisfactory translation was attained.
The survey was conducted in and around Dhaka city, the capital of Bangladesh, using a paper-based format. Eleven enumerators were briefed and trained by the authors to collect the data. Firstly, the enumerators collected responses around Dhaka city between March and April 2018. Data collection inside Dhaka city took place between August and September 2018 by the same enumerators. Upon receiving the questionnaire, respondents completed it in the presence of an enumerator. In some cases where participants were not literate or if they were unwilling to do it by themselves, the enumerators read out the questions and filled the questionnaire for the respondents. The enumerators were paid for collecting responses.
Approximately 15 to 20 minutes were required to complete the whole questionnaire (including sections not covered in this article). All participants provided fully informed consent. There are no laws or rules for ethical approval in Bangladesh, and hence no ethical approval was sought; however, the project was funded as part of a multi-country project involving, among others, the University of Southampton, UK. Therefore, ethical approval was sought from and granted by the ethics committee of that university (study ID 40682). Participants were not paid for their time.

2.3. Participants

A total of 532 usable responses (229 from around Dhaka city and 303 from inside Dhaka city) were gathered for analysis. The age and gender distribution of the sample is presented in Figure 1, along with education characteristics presented in Figure 2. Respondents were further grouped into three broader education categories, i.e., high-level education (university level degree or higher), middle-level education (high school or college level education), and low-level education (without any formal education, partially attending primary school or completing secondary school level studies). This is also shown in Figure 2.

2.4. Statistical Analysis

Statistical analyses were performed using SPSS (v.25) and AMOS (v.23). Principal Component Analysis (PCA) was undertaken to identify the factor structures of the attitude and behaviour sections. Bi-variate correlations were conducted to examine the associations between these factors. Hierarchical linear regression was applied using the forced entry method, with age and gender in the first block, education in the second block, and attitudes in the final block, to assess how much variance in pedestrian behaviours could be explained by demographics and attitudes towards road safety.

Principal Component Analysis (PCA)

To determine which factors to retain, Kaiser’s criterion of retaining factors with eigenvalues greater than 1 and the graphical observation of tailing off in a scree plot have been used. Varimax with the Kaiser normalization rotation method was used. To test scale internal reliability, Cronbach’s [58] alpha was used. Hinton et al. [59] have argued that a value of 0.90 and above shows excellent reliability, 0.70 to 0.90 shows high reliability, 0.50 to 0.70 shows moderate reliability, and 0.50 and below shows low reliability. The average inter-item correlation was also calculated. Briggs and Cheek [60] recommended that the average inter-item correlation fall in the range of 0.15–0.50.

3. Results

3.1. Data Reduction

3.1.1. Attitudes

Following transformation of the reverse-scored items in this section, across all items a higher score signified safer attitudes. PCA with Varimax rotation initially revealed a six-factor structure; however, low reliability and factor loadings were seen. Further trials were made and, based on the inclusion of fourteen questionnaire items, a three-factor structure was identified. The first and second categories consisted of six items (α = 0.695 and 0.638 respectively), and the third category consisted of two items (α = 0.701; see Table 1). The Kaiser–Meyer–Olkin measure verified the sampling adequacy for the analysis at KMO = 0.792 (‘good’ according to Field [61]), and only one individual item had a KMO value of 0.499, which is very nearly equal to the acceptable limit of 0.5 [61]. Bartlett’s test of sphericity (χ2 (91) = 1250.021, p < 0.001) indicated that correlations between items were sufficiently large. Three factors were therefore extracted which, in combination, explained 44.871% of the variance. These were labelled as ‘Attitudes towards speeding and rule violation’, ‘Attitudes towards taking chances and increasing efficiency’, and ‘Attitudes towards the irresponsible driving of others’ (Table 1).
The individual Cronbach’s alpha values of the first two items are between 0.50 and 0.70, indicating moderately reliable on the scale; the third item has alpha value greater than 0.70, indicating a high reliability [59]. The average inter-item correlation of each scale was found to be in the satisfactory range of 0.15 to 0.50 [60].

3.1.2. Pedestrian Behaviour

The pedestrian behaviour section of the questionnaire consisted of 20 items with some items being reverse-scored such that across all items’ lower scores signified safer behaviours. Initially, the PCA (with varimax rotation) conducted on the data yielded a six-factor structure; however, three factors returned low reliability values (at between α = 0.39 and α = 0.50), hence this six-factor solution was considered inappropriate. After an inspection of the factor of all items, a four-factor structure using 15 items was deemed suitable. The sampling adequacy for the analysis was verified using the Kaiser–Meyer–Olkin measure, KMO = 0.831 (‘great’ according to Field [61]), where all KMO values for individual items were found to be greater than 0.621 (well above the acceptable limit of 0.5 [61]). The correlations between items were sufficiently large for PCA (indicated by the Bartlett’s test of sphericity χ2(105) = 2584.824, p < 0.001). Four components were extracted, each having an eigenvalue greater than one, and, in combination, explained 60.0% of the variance. Based on the similarity in wording and meaning of questionnaire items corresponding to a particular component, four components were retained in the final analysis. The four factors were labeled as ‘Inattention’ (inattentive behaviour while performing an activity), ‘Aggressive Behaviours’ (expressing negative emotions and interacting with other road users aggressively), ‘Violations’ (deliberate deviations from formal or informal practices), and ‘Impermissible Behaviours’ (performing activities which are not allowed). The statistics associated with the items corresponding to four factor labels are displayed in Table 2.
The alpha values of the first and fourth factors were greater than 0.70, indicating a high level of reliability; the second and third dimensions had alpha values within the range of 0.50 to 0.70, indicating moderate reliability [59]. The average inter-item correlation of each scale was found to be in the satisfactory range of 0.15 to 0.50 [60].

3.2. Bivariate Correlations between Dimensions of Attitudes and Behaviours

A bivariate correlation analysis was conducted to explore the relationships between all attitudes and behaviour factors across all participants. The results are shown in Table 3. All three factors of attitudes towards traffic safety were found to be significantly correlated with all four factors of pedestrian behaviours. In all cases, safer attitudes were linked with safer self-reported behaviours. All pedestrian behaviour factors were significantly correlated with each other, whereas only one significantly correlated pair of attitude factors was found.

3.3. Regression Analysis

To assess how much variance in each of the four factors of pedestrian behaviours could be explained by the age and gender, education level, and three attitude factors, four regression models were calculated (one for each behaviour factor). Hierarchical linear regression was applied using the forced entry method. Scores corresponding to age, gender, and education level were dummy coded. The reference variable selected for age was the younger group, with ages between 18 and 24. Males were taken as reference category for dummy coding gender while for education level, the reference group was medium-level education.
Results are displayed in Table 4 and Table 5. Table 4 illustrates that age and gender explained the significant variance in ‘Inattention’ and ‘Violations’. Education level also explained the additional variance (over age and gender) in these two behaviour factors. For all four behaviour factors, attitudes were found to explain significant additional variance (over demographic factors) at 6.5% for ‘Inattention’, 12.6% for ‘Aggressive Behaviours’, 4.9% for ‘Violations’, and 7.3% for ‘Impermissible Behaviours’.
The unstandardised and standardised regression coefficients (B and β) along with standard error for B are presented in Table 5. Gender was found to be an insignificant predictor of the behaviour factors, whereas age and education level had some effect on the violations scale only. In comparison with younger pedestrians (18–24 years), older pedestrians (35–44 years and over 54 years of age) reported performing fewer violations. The β value for respondents in the 35–44 years group is higher than respondents in the over-54 years group, indicating that people in the range of 35 to 44 years of age reported performing the safest behaviours. The high-level education group was found to report performing safer behaviours compared to the medium-level education group, suggesting that the more educated the people become, the safer their behaviours can be expected to be. When all the demographic variables are held constant, it is seen that, when one unit increased in the attitudes score (i.e., safer attitudes), all the behaviour scores decreased (i.e., safer behaviours) by some amount. Safer attitudes towards speeding and rule violation lead to safer self-reported behaviours in terms of inattention compared to safer attitudes towards the irresponsible driving of others. Less aggressive behaviours are reported by people who have safer attitudes towards the irresponsible driving of others in comparison with safer attitudes towards speeding and traffic rule violation. Attitudes towards taking chances and increasing efficiency had a significant effect in predicting behaviours related to violations only, which is greater than the effect of attitudes towards the irresponsible driving of others on violations. Safer behaviours corresponding to impermissible behaviours were found to be more associated with attitudes towards the irresponsible driving of others than to attitudes towards speeding and rule violation.

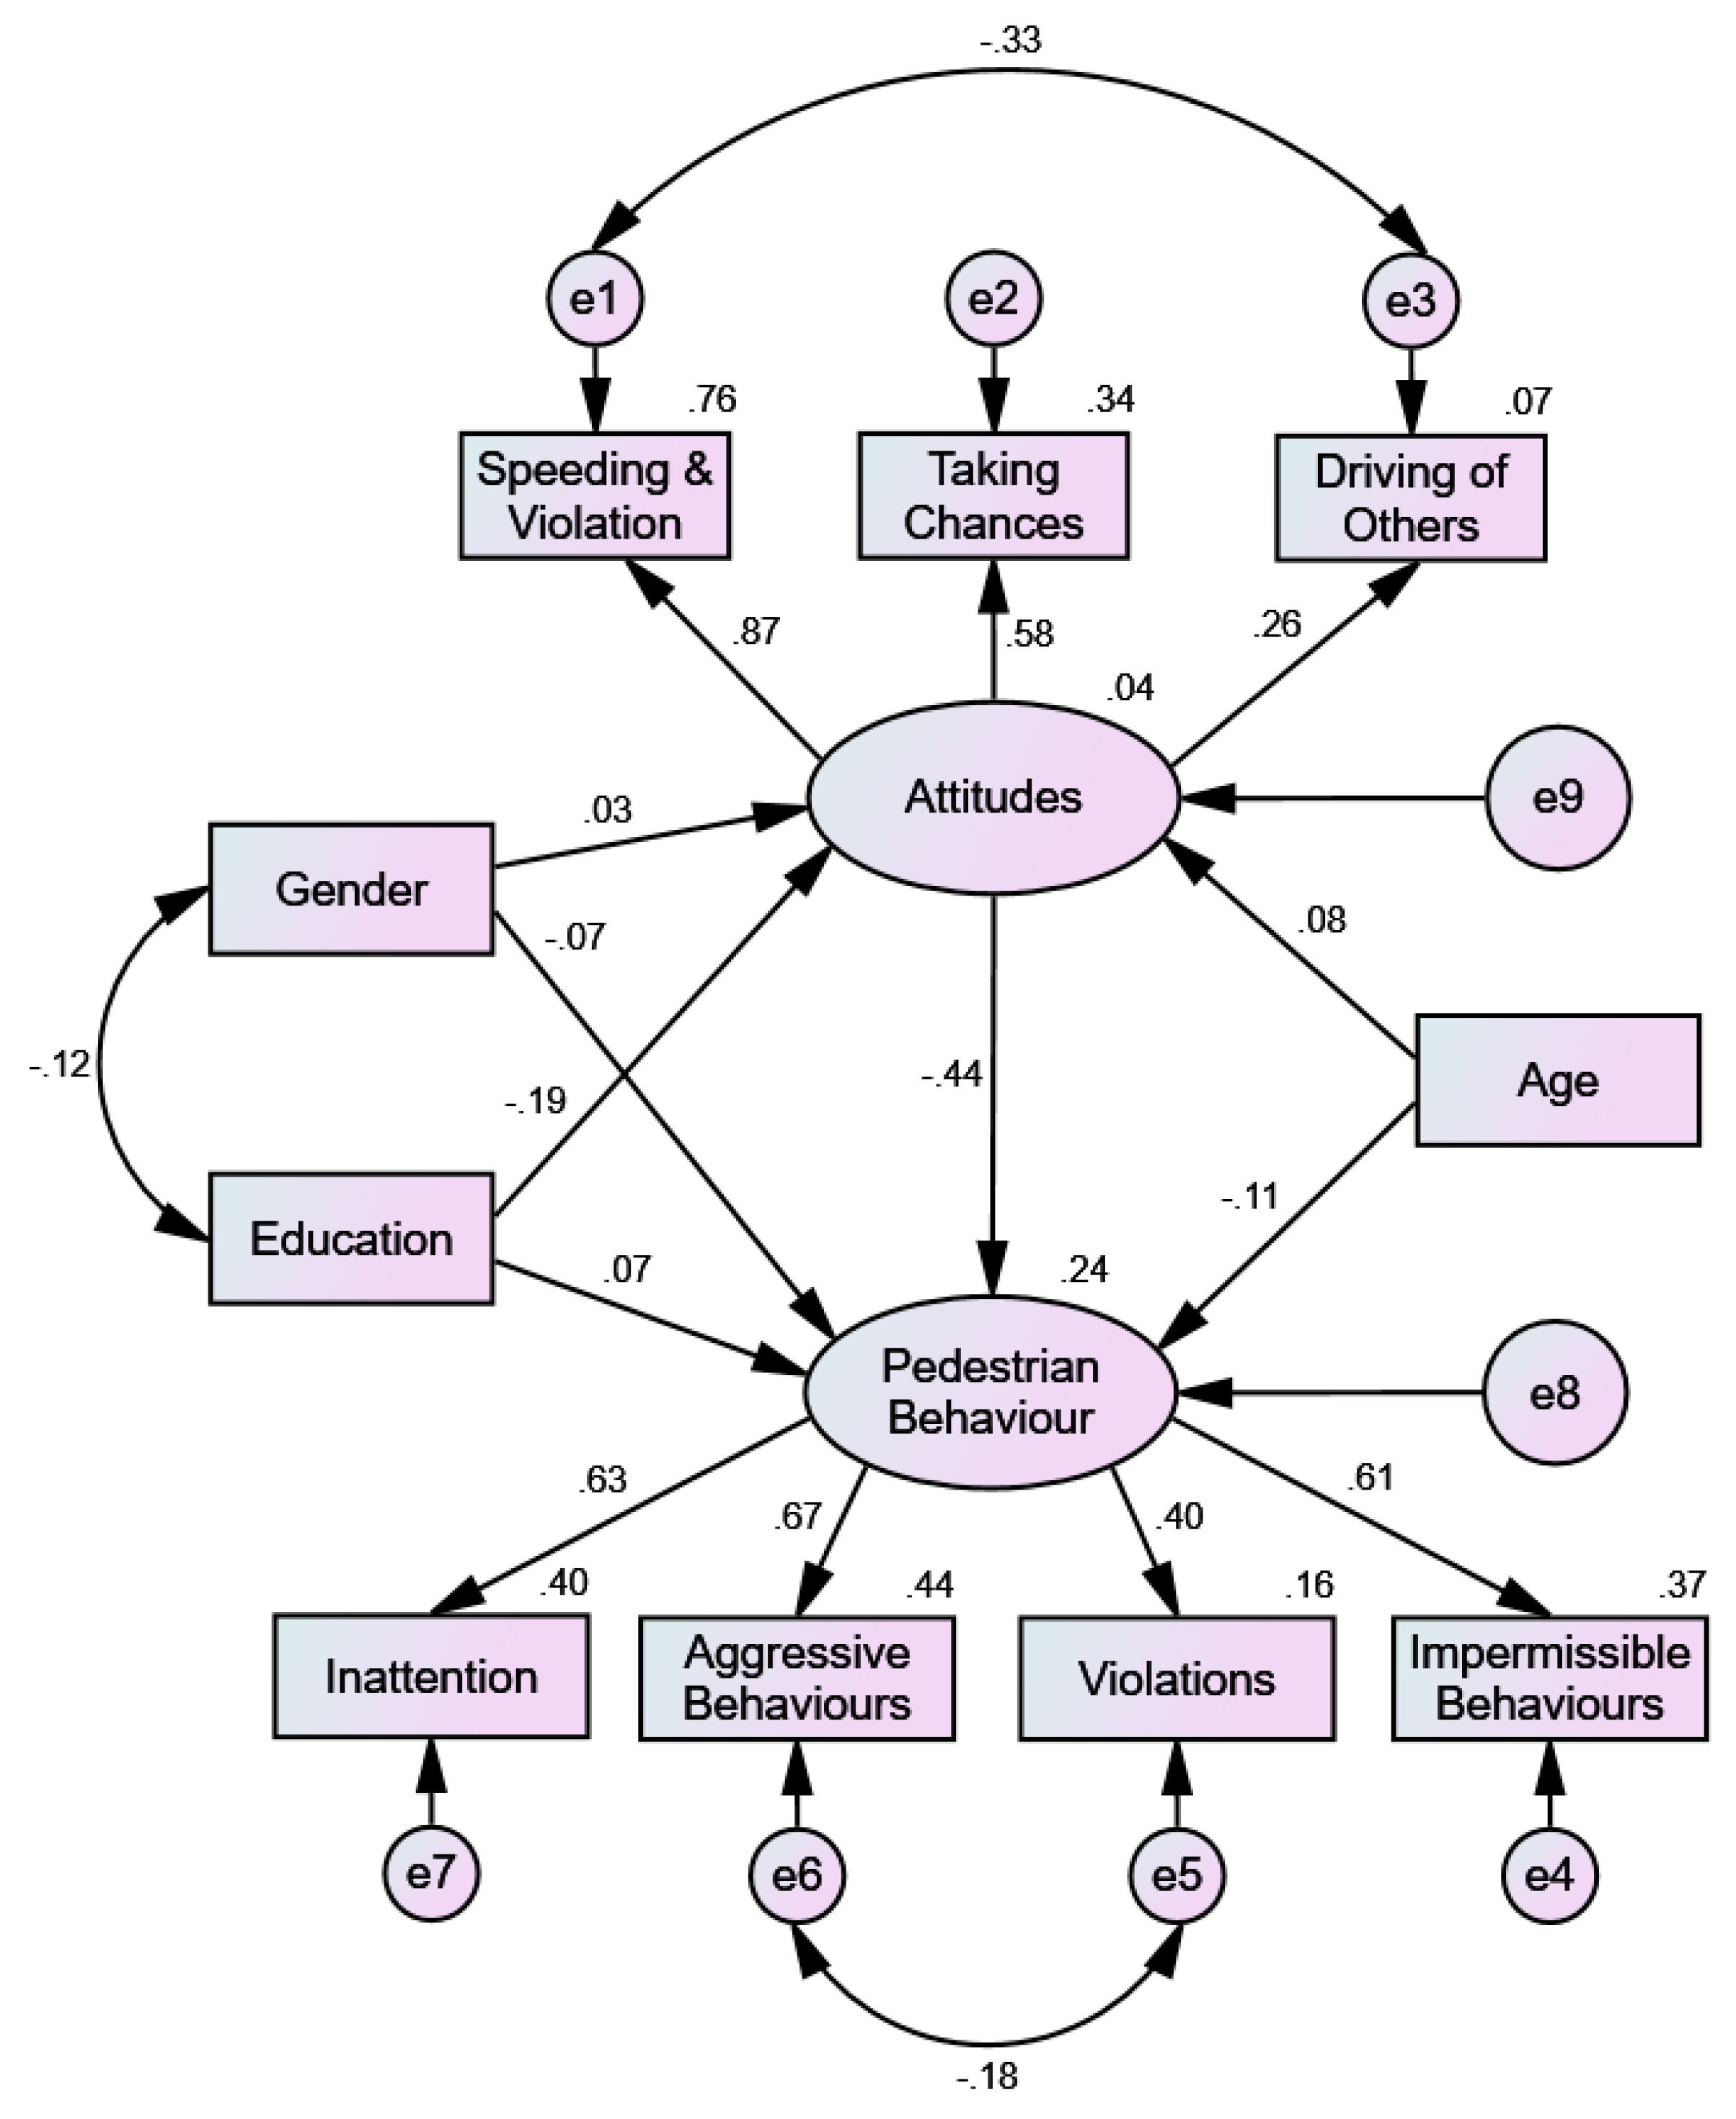
3.4. Structural Equation Model for the Relationships between Attitudes and Pedestrian Behaviours

Structural equation modelling was used to assess the relationships among attitudes, pedestrian behaviour, age, gender, and education level. In the structural equation model (Figure 3), two constructs (attitudes towards traffic safety and pedestrian behaviour) were used as latent factors, representing the average scores of their corresponding questionnaire items. This SEM model (df = 28) depicting the relationships between attitudes and pedestrian behaviour, and the effect of demographic variables (i.e., age, gender, and education level) on attitudes and pedestrian behaviour, has a χ 2 d f value of 3.476, an RMSEA value of 0.068, a CFI value of 0.887, a TLI value of 0.819, an AGFI value of 0.932, and an SRMR value of 0.0518, which shows satisfactory model fitness [62]. The structural equation model presented in Figure 3 shows the relationship between attitudes towards traffic safety and pedestrian behaviour—positive attitudes are related to safer pedestrian behaviours (β = −0.44). Females reported safer attitudes (β = 0.03) and pedestrian behaviours (β = −0.07) compared to males, older people reported safer attitudes (β = 0.08) and pedestrian behaviours (β = −0.11) than younger people, and a lower education level corresponded to more dangerous attitudes (β = −0.19) and riskier self-reported pedestrian behaviours (β = 0.07) compared to a higher education level. Attitudes towards speeding and rule violation (β = 0.87) had a stronger relationship with attitudes towards road safety compared to attitudes towards taking chances and increasing efficiency (β = 0.58) and attitudes towards the irresponsible driving of others (β = 0.26). In assessing risky pedestrian behaviour, aggressive behaviours (β = 0.67) had the greatest impact, followed by inattention (β = 0.63), impermissible behaviours (β = 0.61), and violations (β = 0.16). The model could explain 4% of the variance in attitudes towards traffic safety and 24% of the variance in pedestrian behaviours.

4. Discussion

This research aimed to explore the factor structures underlying measures of attitudes towards traffic safety and pedestrian behaviours, and to explore the relationship between those attitudes and self-reported behaviours and demographic factors in a Bangladeshi sample. The most suitable factor structures for the measures were found to be different to those reported elsewhere [7,8,10,47,56], and a structural equation model helped in revealing a variety of relationships between age, gender, education, the three road safety attitude factors, and the four pedestrian behaviour factors.
Demographic characteristics were found to be related to attitudes towards traffic safety and pedestrian behaviours. Older people reported holding safer attitudes and performing safer behaviours; in particular, respondents in the age group of 35–44 years reported performing the safest behaviours. Males were found to report the performing of riskier behaviours and the holding of more dangerous attitudes than females. A direct influence of educational status was found with attitudes and behaviours: People belonging to the higher education group reported safer attitudes and behaviours, the safest group being the group that had at least a graduate degree. The correlation between demographic variables (e.g., age, gender, and education level), attitudes towards traffic safety, and pedestrian behaviour, corresponds to the outcomes presented in the existing pedestrian behaviour questionnaire research [11,41,47,63,64].
Regarding attitudes to road safety, the majority of the questions in the section were taken from existing literature [54,55]. In McIlroy et al. [8], in a six-country study, questions were grouped to form a single latent factor (i.e., ‘attitudes to road safety’), whereas in Dinh et al. [10], using a sub-section of the same data (i.e., the Vietnam sample), a six-factor solution was identified as most suitable. Following a PCA of the Bangladeshi sample’s data, we found a three-factor solution to be most appropriate. Even though Dinh et al. [10] proposed a six-factored structure for attitudes towards traffic safety, only three factors (i.e., attitude towards the careless driving of others, attitude towards traffic rule violation in specific situations, and attitude towards traffic rules and speed limits in general) were found to be significantly related to self-reported pedestrian behaviours in their study. In this research, the three factors underlying attitudes were all found to be significantly related to pedestrian behaviours, pointing to the differences in the way respondents from different countries interpret and respond to the questions asked. Safer behaviours in relation to ‘Inattention’ are more significantly linked with safer attitudes towards speeding and rule violation; safer attitudes towards the irresponsible driving of others have the most significant effect in predicting both ‘Aggressive Behaviours’ and ‘Impermissible Behaviours’; and less risky behaviours conforming to ‘Violations’ are mostly associated with safer attitudes towards taking chances and increasing efficiency. This suggests, for example, that the people in Bangladesh who demonstrate safer attitudes to speeding and rule violation are less inattentive in nature.
Regarding the measure of pedestrian behaviour, Granie et al. [41] found the short version of PBQ (i.e., that which was used here) to have high internal reliability. Following PCA, we identified a four-factor solution to be most fitting to the Bangladeshi sample’s data. All four of the ‘Lapses’ items and one of the ‘Errors’ item (‘I run across the street without looking because I am in a hurry’) described in [47] were factored as ‘Inattention’, representing inattentive pedestrian road crossing behaviours. The dimension identified as ‘Inattention’ covers the phenomenon of ‘lapses’, i.e., ‘unintentional deviation from practices related to a lack of concentration on the task or forgetfulness’ [47] or ‘ill-suited behaviours related to a lack of concentration on the task’ [41]; this is congruent with Yıldırım [65] regarding the combining of behaviours related to errors and lapses as unintentional deviations from traffic rules.
Regarding ‘Violations’, one questionnaire item in [47] included in their ‘violation’ subscale (‘I cross the street even though the pedestrian light is red’) was replaced with a new question (‘I avoid using pedestrian bridges or underpasses for convenience, even if one is located nearby’) for this study, due to the absence of active pedestrian lights at road intersections in Bangladesh. Unlike the item it was used to replace, however, this was not ultimately included in our measure, due to low factor loading. Our ‘Violation’ sub-scale was similar to that reported by Deb et al. [47], with the addition of one item from their ‘Error’ sub-scale (i.e., ‘I cross between vehicles stopped on the roadway in traffic jams’). In Bangladesh, pedestrians frequently cross between vehicles during congestion, irrespective of the availability of pedestrian crossing facilities. Recently, such behaviour has been considered as unlawful (Bangladesh Road Transport Act, 2018), therefore this is indeed a violation of law. Dinh et al. [10] also combined violations and errors items under the dimension of ‘Violations and errors’ (similar to our findings).
The ‘Aggressive behaviour’ sub-scale in this study followed the same structure as that of [7,10,41,47]. This suggests that pedestrian aggressiveness while interacting with the road system is similar across nations with differing economies, cultures, traffic systems, and levels of enforcement.
The fourth factor underlying pedestrian behaviour has been termed as ‘Impermissible Behaviours’ and consists of two items: one from the ‘violation’ sub-scale (‘I take passageways forbidden to pedestrians to save time’) and the other from the ‘error’ sub-scale (‘I walk on cycling paths when I could walk on the pavement’) described in [47]. ‘Impermissible Behaviours’ refers to the tendency of pedestrians to perform activities that are explicitly forbidden but it might be perceived as convenient and beneficial for a pedestrian. Even though cycle paths can rarely be seen in the streets of Bangladesh, pedestrians often avoid footpaths and walk along the roadside, which is usually used by cyclists, showing a disinclination to abide by the rules (though one must accept that these behaviours are shaped by many other factors).
It has been argued by Deb et al. [47] that questionnaires related to ‘Positive Behaviours’ need to be restructured as they were not found to be reliable. The same was argued by Granie et al. [41] and McIlroy et al. [7] The same was found here, with the scale returning low reliability, internal consistency, and factor loadings. The items used to judge ‘Positive Behaviours’ included thanking a driver who prioritizes pedestrian crossing, walking without bothering fellow pedestrians, and letting a car to go if there are no vehicles behind it. Even if such behaviours can be observed in high-income countries with well-maintained footpaths, organized traffic management systems, and the strict enforcement of traffic laws, it seems unlikely that people will demonstrate such behaviours in low-income countries with less developed road infrastructures (e.g., inadequate pedestrian facilities, improper maintenance of footpaths and footbridges), undisciplined traffic systems, and insufficient enforcement of traffic laws [4,66,67,68,69,70,71]. Population density may also affect the responses to the questions measuring ‘Positive Behaviours’, as it is less expected that a driver will prioritize a pedestrian crossing or that a pedestrian will let a car go by in densely populated countries with a high volume of traffic on the roads and pedestrians on the footpaths.
In terms of the relationships between the factors studied, namely underlying attitudes and pedestrian behaviour, age, gender, and education, hierarchical regression analysis showed that all of the factors of attitudes, as well as all demographic variables, significantly contributed to the explained variance in self-reported pedestrian behaviours. Such outcomes are in line with previous studies (e.g., [8,10,11,72,73]). In the study of Iversen and Rundmo [54] on drivers, three attitude factors explained about 50% of the variance in risk behaviours, while Dinh et al. [10] found that attitudes towards traffic safety was able to explain about 21% of the variance in pedestrian behaviour. In the case of respondents in Bangladesh, attitudes could explain only 4.9% to 12.6% variance in pedestrian behaviour. The inclusion of demographic variables (i.e., age, gender, and education level) increased the explained variance to between 8.9% and 14.3%. It is to be mentioned that the road environment for walking in Bangladesh is not adequate, and that pedestrians are often forced to walk on the road instead of using the footpaths [4]. This, in addition to very low enforcement levels, might compel pedestrians to act in a way considered as dangerous or risky [66,67,68,69,70].
It has been argued by Cambon de Lavalette [74] that the surrounding environment is linked with the safe road crossing behaviours of pedestrians, and found that behaviours related to violations increased with the absence of crossing signals. Additionally, personal beliefs, social norms, values, or perceptions of people might also affect a person’s risk-taking behaviour (e.g., violation of speed limits) [75]. The questionnaire section covering attitudes towards traffic safety was general in nature, without measuring attitudes specific to the behaviours expressed in the pedestrian behaviour questionnaire. It is possible that a greater amount of variance could have been explained if the attitudes questionnaire was specifically related to the pedestrian behaviours measured (see [72]).
The structural equation model presented in Figure 3 revealed the factors affecting attitudes and pedestrian behaviours, the effect of attitudes on pedestrian behaviours, and the impact of age, gender, and education level on both attitudes and pedestrian behaviours. Attitudes towards speeding and rule violation was found to be more closely related to attitudes towards road safety than attitudes towards taking chances and increasing efficiency, as well as attitudes towards the irresponsible driving of others. Therefore, initiatives targeting pedestrians to demonstrate safer attitudes in terms of speeding and rule violation could be beneficial in terms of enhancing overall safer attitudes towards road safety. Aggressive behaviours accounted for risky pedestrian behaviours more than inattention, impermissible behaviours, and violations, indicating that policies intended to educate pedestrians towards demonstrating less aggressive behaviours could be fruitful in contributing to safer pedestrian behaviours. Even in a general sense, attitudes are related to pedestrian behaviours, hence awareness campaigns to foster safer attitudes could lead to safer behaviours. Finally, males, younger people, and less educated people were found to report more dangerous attitudes and riskier pedestrian behaviours. Therefore, road safety campaigns focused on these groups could yield positive results in creating a safer road environment in Bangladesh.

5. Limitations

The first limitation is the nature of data: in self-report studies, there is always a possibility of bias in answering, driven by, for example, the desire to make the best possible impression. It is possible that this was especially the case for those who had the enumerator read questions and record results for them. The second limitation concerns the translation of items, with the questionnaire first developed in English and then translated into Bengali. Language represents cultural views [76], hence this presents a limitation with all work requiring translation; however, we applied best practice in our translation efforts [57], and would therefore argue that the outcomes of this study can be interpreted as valid.
However, it is evident that using a larger sample size would result in an increased chance of reliably representing the wider population [61] in terms of the structural equation modelling performed here. Wolf et al. [77] have suggested that a sample size in the range of 30 to 460 is suitable. In this regard, our sample, at 532, satisfies this requirement. There are also limitations in the makeup of the sample; for example, we saw a high percentage of young males compared to other groups, and a low percentage of females overall. In Bangladesh, young males are by far the most highly represented group on urban streets, and females are found to have limited public activity space [4,78]. Moreover, the decrease in samples towards the older age groups reflects the population scenario of Bangladesh [79]. As such, the makeup of the sample quite closely reflects that which one would be expected to see on the streets of Dhaka; however, observational studies along with pedestrian counts by age-group might help in identifying the true on-road reality, thus eliminating such limitations. Finally, it is of course true that attitudes and behaviours are also affected by many other characteristics, e.g., individual income levels, modes of transport use, general beliefs, and road environmental factors. Future work including these variables might give us a better overall understanding of pedestrian behaviour in Bangladesh.

6. Conclusions

The present study aimed to explore the dimensions underlying attitudes towards traffic safety and self-reported pedestrian behaviours in Bangladesh, and to assess their interrelationships while also evaluating the effects of age, gender, and education on those constructs. A paper-based questionnaire survey was conducted on 532 respondents from in and around Dhaka city. PCA was used to identify the factors of the road safety attitude and pedestrian behaviour scales, revealing that a different model structure than those provided in the literature best represented the responses of our Bangladeshi sample. Attitudes as well as demographic variables were found to be significantly related to self-reported pedestrian behaviours, as males over females, younger people over older people, and less educated people over more educated people, were found to report performing riskier pedestrian behaviours and holding more dangerous attitudes towards road safety. Through hierarchical regression analysis, it was found that attitudes and demographic variables could explain a significant variance in pedestrian behaviours.

Author Contributions

Conceptualization, R.C.M., K.L.P. and N.A.S.; methodology, R.C.M.; formal analysis, S.H.-E.-R. and O.F.H.; writing—original draft preparation, S.H.-E.-R. and O.F.H.; writing—review and editing, M.D., M.S.H. and R.C.M.; supervision, M.S.H. and R.C.M.; project administration, K.L.P.; funding acquisition, N.A.S. All authors have read and agreed to the published version of the manuscript.

Funding

This research was funded by the National Institute for Health Research (NIHR; 16/137/122) using UK aid from the UK Government to support global health research. The views expressed in this publication are those of the author(s) and not necessarily those of the NIHR or the UK Department of Health and Social Care.

Institutional Review Board Statement

The study was conducted according to the guidelines of the Declaration of Helsinki, and approved by the Institutional Review Board (or Ethics Committee) of the UNIVERSITY OF SOUTHAMPTON, UK (ID: 40682 and approved on Saturday, 25 November 2017).

Informed Consent Statement

Informed consent was obtained from all subjects involved in the study.

Data Availability Statement

The data presented in this study are available on request from the corresponding author. The data are not publicly available due to privacy.

Conflicts of Interest

The authors declare no conflict of interest.

References

  1. McIlroy, R.C.; Plant, K.A.; Hoque, M.S.; Wu, J.; Kokwaro, G.O.; Nam, V.H.; Stanton, N.A. Who is responsible for global road safety? A cross-cultural comparison of Actor Maps. Accid. Anal. Prev. 2019, 122, 8–18. [Google Scholar] [CrossRef]
  2. WHO. Global Status Report on Road Safety 2018; WHO: Geneva, Switzerland, 2018. [Google Scholar]
  3. WHO. Global Status Report on Road Safety 2013; WHO: Geneva, Switzerland, 2013. [Google Scholar]
  4. Debnath, M.; Hasanat-E-Rabbi, S.; Hamim, O.F.; Hoque, M.S.; McIlroy, R.C.; Plant, K.L.; Stanton, N.A. An investigation of urban pedestrian behaviour in Bangladesh using the Perceptual Cycle Model. Saf. Sci. 2021, 138, 105214. [Google Scholar] [CrossRef]
  5. Dinh, D.D.; Vu, N.H.; McIlroy, R.C.; Plant, K.A.; Stanton, N.A. Examining the roles of multidimensional fatalism on traffic safety attitudes and pedestrian behaviour. Saf. Sci. 2020, 124, 104587. [Google Scholar] [CrossRef]
  6. Hamim, O.F.; Hoque, M.S.; McIlroy, R.C.; Plant, K.L.; Stanton, N.A. Representing two road traffic collisions in one Accimap: Highlighting the importance of emergency response and enforcement in a low-income country. Ergonomics 2020, 63, 1512–1524. [Google Scholar] [CrossRef]
  7. McIlroy, R.C.; Plant, K.L.; Jikyong, U.; Nam, V.H.; Bunyasi, B.; Kokwaro, G.O.; Wu, J.; Hoque, M.S.; Preston, J.M.; Stanton, N.A. Vulnerable road users in low-, middle-, and high-income countries: Validation of a Pedestrian Behaviour Questionnaire. Accid. Anal. Prev. 2019, 131, 80–94. [Google Scholar] [CrossRef] [PubMed]
  8. McIlroy, R.C.; Nam, V.H.; Bunyasi, B.W.; Jikyong, U.; Kokwaro, G.O.; Wu, J.; Hoque, M.S.; Plant, K.L.; Preston, J.M.; Stanton, N.A. Exploring the relationships between pedestrian behaviours and traffic safety attitudes in six countries. Transp. Res. Part F Traffic Psychol. Behav. 2020, 68, 257–271. [Google Scholar] [CrossRef]
  9. McIlroy, R.C.; Kokwaro, G.O.; Wu, J.; Jikyong, U.; Nam, V.H.; Hoque, M.S.; Preston, J.M.; Plant, K.L.; Stanton, N.A. How do fatalistic beliefs affect the attitudes and pedestrian behaviours of road users in different countries? A cross-cultural study. Accid. Anal. Prev. 2020, 139, 105491. [Google Scholar] [CrossRef] [PubMed]
  10. Dinh, D.D.; Vũ, N.H.; McIlroy, R.C.; Plant, K.A.; Stanton, N.A. Effect of attitudes towards traffic safety and risk perceptions on pedestrian behaviours in Vietnam. IATSS Res. 2020, 44, 238–247. [Google Scholar] [CrossRef]
  11. Díaz, E.M. Theory of planned behavior and pedestrians’ intentions to violate traffic regulations. Transp. Res. Part F Traffic Psychol. Behav. 2002, 5, 169–175. [Google Scholar] [CrossRef]
  12. Schwebel, D.C.; Severson, J.; Ball, K.K.; Rizzo, M. Individual difference factors in risky driving: The roles of anger/hostility, conscientiousness, and sensation-seeking. Accid. Anal. Prev. 2006, 38, 801–810. [Google Scholar] [CrossRef]
  13. Papadimitriou, E.; Theofilatos, A.; Yannis, G. Patterns of pedestrian attitudes, perceptions and behaviour in Europe. Saf. Sci. 2013, 53, 114–122. [Google Scholar] [CrossRef]
  14. Reason, J.; Manstead, A.; Stradling, S.; Baxter, J.; Campbell, K. Errors and violations on the roads: A real distinction? Ergonomics 1990, 33, 1315–1332. [Google Scholar] [CrossRef] [PubMed]
  15. Tulu, G.S.; Washington, S.; King, M.; Haque, M. Why are pedestrian crashes so different in developing countries? A review of relevant factors in relation to their impact in Ethiopia. In Australasian Transport Research Forum 2013 Proceedings; Australasian Transport Research Forum Incorporated: Brisbane, QLD, Australia, 2013; pp. 1–18. [Google Scholar]
  16. Zhou, R.; Horrey, W.J.; Yu, R. The effect of conformity tendency on pedestrians’ road-crossing intentions in China: An application of the theory of planned behavior. Accid. Anal. Prev. 2009, 41, 491–497. [Google Scholar] [CrossRef] [PubMed]
  17. Kadali, R.B.; Vedagiri, P. Effect of Vehicular Lanes on Pedestrian Gap Acceptance Behaviour. Procedia Soc. Behav. Sci. 2013, 104, 678–687. [Google Scholar] [CrossRef] [Green Version]
  18. Pawar, S.D.; Patil, G.R. Pedestrian temporal and spatial gap acceptance at mid-block street crossing in developing world. J. Saf. Res. 2015, 52, 39–46. [Google Scholar] [CrossRef] [PubMed]
  19. Zhang, C.; Zhou, B.; Qiu, T.Z.; Liu, S. Pedestrian crossing behaviors at uncontrolled multi-lane mid-block crosswalks in developing world. J. Saf. Res. 2018, 64, 145–154. [Google Scholar] [CrossRef] [PubMed]
  20. Yannis, G.; Golias, J.; Papadimitriou, E. Modeling Crossing Behavior and Accident Risk of Pedestrians. J. Transp. Eng. 2007, 133, 634–644. [Google Scholar] [CrossRef] [Green Version]
  21. Poudel-Tandukar, K.; Nakahara, S.; Ichikawa, M.; Poudel, K.C.; Jimba, M. Risk perception, road behavior, and pedestrian injury among adolescent students in Kathmandu, Nepal. Inj. Prev. 2007, 13, 258–263. [Google Scholar] [CrossRef]
  22. Oviedo-Trespalacios, O.; Scott-Parker, B. Footbridge usage in high-traffic flow highways: The intersection of safety and security in pedestrian decision-making. Transp. Res. Part F Traffic Psychol. Behav. 2017, 49, 177–187. [Google Scholar] [CrossRef]
  23. Lennon, A.; Oviedo-Trespalacios, O.; Matthews, S. Pedestrian self-reported use of smart phones: Positive attitudes and high exposure influence intentions to cross the road while distracted. Accid. Anal. Prev. 2017, 98, 338–347. [Google Scholar] [CrossRef]
  24. Ibrahim, J.M.; Day, H.; Hirshon, J.M.; El-Setouhy, M. Road risk-perception and pedestrian injuries among students at Ain Shams University, Cairo, Egypt. J. Inj. Violence Res. 2012, 4, 71–78. [Google Scholar] [CrossRef] [PubMed]
  25. Holm, A.; Jaani, J.; Eensoo, D.; Piksööt, J. Pedestrian behaviour of 6th grade Estonian students: Implications of social factors and accident-prevention education at school. Transp. Res. Part F Traffic Psychol. Behav. 2018, 52, 112–119. [Google Scholar] [CrossRef]
  26. Koekemoer, K.; Van Gesselleen, M.; Van Niekerk, A.; Govender, R.; Van As, A.B. Child pedestrian safety knowledge, behaviour and road injury in Cape Town, South Africa. Accid. Anal. Prev. 2017, 99, 202–209. [Google Scholar] [CrossRef] [PubMed]
  27. Alhajyaseen, M.W.K.; Iryo-Asano, M. Studying critical pedestrian behavioral changes for the safety assessment at signalized crosswalks. Saf. Sci. 2017, 91, 351–360. [Google Scholar] [CrossRef]
  28. Tapiro, H.; Oron-Gilad, T.; Parmet, Y. Cell phone conversations and child pedestrian’s crossing behavior; A simulator study. Saf. Sci. 2016, 89, 36–44. [Google Scholar] [CrossRef]
  29. Tapiro, H.; Oron-Gilad, T.; Parmet, Y. The effect of environmental distractions on child pedestrian’s crossing behavior. Saf. Sci. 2018, 106, 219–229. [Google Scholar] [CrossRef]
  30. Quistberg, D.A.; Howard, E.J.; Hurvitz, P.M.; Moudon, A.V.; Ebel, B.E.; Rivara, F.P.; Saelens, B.E. The Relationship Between Objectively Measured Walking and Risk of Pedestrian–Motor Vehicle Collision. Am. J. Epidemiol. 2017, 185, 810–821. [Google Scholar] [CrossRef] [Green Version]
  31. Obeng-Atuah, D.; Poku-Boansi, M.; Cobbinah, P.B. Pedestrian crossing in urban Ghana: Safety implications. J. Transp. Health 2017, 5, 55–69. [Google Scholar] [CrossRef]
  32. Jha, A.; Tiwari, G.; Mohan, D.; Mukherjee, S.; Banerjee, S. Analysis of Pedestrian Movement on Delhi Roads by Using Naturalistic Observation Techniques. Transp. Res. Rec. J. Transp. Res. Board 2017, 2634, 95–100. [Google Scholar] [CrossRef]
  33. Brosseau, M.; Zangenehpour, S.; Saunier, N.; Miranda-Moreno, L. The impact of waiting time and other factors on dangerous pedestrian crossings and violations at signalized intersections: A case study in Montreal. Transp. Res. Part F Traffic Psychol. Behav. 2013, 21, 159–172. [Google Scholar] [CrossRef]
  34. Hamann, C.; Dulf, D.; Baragan-Andrada, E.; Price, M.; Peek-Asa, C. Contributors to pedestrian distraction and risky behaviours during road crossings in Romania. Inj. Prev. 2017, 23, 370–376. [Google Scholar] [CrossRef] [PubMed]
  35. Koh, P.P.; Wong, Y.D.; Chandrasekar, P. Safety evaluation of pedestrian behaviour and violations at signalised pedestrian crossings. Saf. Sci. 2014, 70, 143–152. [Google Scholar] [CrossRef]
  36. Larue, G.S.; Naweed, A.; Rodwell, D. The road user, the pedestrian, and me: Investigating the interactions, errors and escalating risks of users of fully protected level crossings. Saf. Sci. 2018, 110, 80–88. [Google Scholar] [CrossRef]
  37. Pešić, D.; Antić, B.; Glavić, D.; Milenković, M. The effects of mobile phone use on pedestrian crossing behaviour at unsignalized intersections—Models for predicting unsafe pedestrians behaviour. Saf. Sci. 2016, 82, 1–8. [Google Scholar] [CrossRef]
  38. Read, G.J.; Stevens, E.L.; Lenné, M.G.; Stanton, N.A.; Walker, G.H.; Salmon, P.M. Walking the talk: Comparing pedestrian ‘activity as imagined’ with ‘activity as done’. Accid. Anal. Prev. 2018, 113, 74–84. [Google Scholar] [CrossRef]
  39. Shaaban, K.; Muley, D.; Mohammed, A. Analysis of illegal pedestrian crossing behavior on a major divided arterial road. Transp. Res. Part F Traffic Psychol. Behav. 2018, 54, 124–137. [Google Scholar] [CrossRef]
  40. Zhuang, X.; Wu, C. Display of required crossing speed improves pedestrian judgment of crossing possibility at clearance phase. Accid. Anal. Prev. 2018, 112, 15–20. [Google Scholar] [CrossRef]
  41. Granié, M.-A.; Pannetier, M.; Guého, L. Developing a self-reporting method to measure pedestrian behaviors at all ages. Accid. Anal. Prev. 2013, 50, 830–839. [Google Scholar] [CrossRef] [Green Version]
  42. Elliott, M.A.; Baughan, C.J. Developing a self-report method for investigating adolescent road user behaviour. Transp. Res. Part F Traffic Psychol. Behav. 2004, 7, 373–393. [Google Scholar] [CrossRef]
  43. Sullman, M.J.; Gras, M.E.; Font-Mayolas, S.; Masferrer, L.; Cunill, M.; Planes, M. The pedestrian behaviour of Spanish adolescents. J. Adolesc. 2011, 34, 531–539. [Google Scholar] [CrossRef] [Green Version]
  44. Sullman, M.J.M.; Mann, H.N. The road user behaviour of New Zealand adolescents. Transp. Res. Part F Traffic Psychol. Behav. 2009, 12, 494–502. [Google Scholar] [CrossRef] [Green Version]
  45. Sullman, M.J.M.; Thomas, A.; Stephens, A.N. The road user behaviour of school students in Belgium. Accid. Anal. Prev. 2012, 48, 495–504. [Google Scholar] [CrossRef] [PubMed] [Green Version]
  46. Nabipour, A.R.; Nakhaee, N.; Khanjani, N.; Moradlou, H.Z.; Sullman, M.J. The road user behaviour of school students in Iran. Accid. Anal. Prev. 2015, 75, 43–54. [Google Scholar] [CrossRef]
  47. Deb, S.; Strawderman, L.; DuBien, J.; Smith, B.; Carruth, D.W.; Garrison, T.M. Evaluating pedestrian behavior at crosswalks: Validation of a pedestrian behavior questionnaire for the U.S. population. Accid. Anal. Prev. 2017, 106, 191–201. [Google Scholar] [CrossRef]
  48. Iversen, H. Risk-taking attitudes and risky driving behaviour. Transp. Res. Part F Traffic Psychol. Behav. 2004, 7, 135–150. [Google Scholar] [CrossRef]
  49. Lund, I.O.; Rundmo, T. Cross-cultural comparisons of traffic safety, risk perception, attitudes and behaviour. Saf. Sci. 2009, 47, 547–553. [Google Scholar] [CrossRef]
  50. Ulleberg, P.; Rundmo, T. Personality, attitudes and risk perception as predictors of risky driving behaviour among young drivers. Saf. Sci. 2003, 41, 427–443. [Google Scholar] [CrossRef]
  51. Evans, D.; Norman, P. Understanding pedestrians’ road crossing decisions: An application of the theory of planned behaviour. Health Educ. Res. 1998, 13, 481–489. [Google Scholar] [CrossRef] [Green Version]
  52. Şimşekoğlu, Ö. How Do Attitudes, Personality Traits, and Driver Behaviors Relate to Pedestrian Behaviors?: A Turkish Case. Traffic Inj. Prev. 2015, 16, 84–89. [Google Scholar] [CrossRef]
  53. Accident Research Institute. Road Safety Facts 2014; Accident Research Institute: Dhaka, Bangladesh, 2014. [Google Scholar]
  54. Iversen, H.; Rundmo, T. Attitudes towards traffic safety, driving behaviour and accident involvement among the Norwegian public. Ergonomics 2004, 47, 555–572. [Google Scholar] [CrossRef]
  55. Peltzer, K.; Renner, W. Superstition, risk-taking and risk perception of accidents among South African taxi drivers. Accid. Anal. Prev. 2003, 35, 619–623. [Google Scholar] [CrossRef]
  56. Bazargan, H.S.; Haghighi, M.; Heydari, S.T.; Soori, H.; Shahkolai, F.R.; Motevalian, S.A.; Tabrizi, R.; Mohammadkhani, M. Developing and validating a measurement tool to self-report pedestrian safety-related behavior: The Pedestrian Behavior Questionnaire (PBQ). Bull. Emerg. Trauma 2020, 8, 229–235. [Google Scholar]
  57. Brislin, R.W. Back-Translation for Cross-Cultural Research. J. Cross-Cult. Psychol. 1970, 1, 185–216. [Google Scholar] [CrossRef]
  58. Cronbach, L.J. Coefficient alpha and the internal structure of tests. Psychometrika 1951, 16, 297–334. [Google Scholar] [CrossRef] [Green Version]
  59. Hinton, P.; McMurray, I.; Brownlow, C. SPSS Explained, 2nd ed.; Routledge: London, UK, 2014. [Google Scholar]
  60. Briggs, S.R.; Cheek, J.M. The role of factor analysis in the development and evaluation of personality scales. J. Personal. 1986, 54, 106–148. [Google Scholar] [CrossRef]
  61. Field, A.P. Discovering Statistics Using IBM SPSS Statistics, 5th ed.; North American edition; Sage Publications: Los Angeles, CA, USA, 2018. [Google Scholar]
  62. Hooper, D.; Coughlan, J.; Mullen, M. Structural Equation Modelling: Guidelines for Determining Model Fit. Electron. J. Bus. Res. Methods 2008, 6, 53–60. [Google Scholar]
  63. O’Hern, S.; Stephens, A.N.; Estgfaeller, N.; Moore, V.; Koppel, S. Self-reported pedestrian behaviour in Australia. Transp. Res. Part F Traffic Psychol. Behav. 2020, 75, 134–144. [Google Scholar] [CrossRef]
  64. Şimşekoğlu, Ö.; Nordfjærn, T.; Zavareh, M.F.; Hezaveh, A.M.; Mamdoohi, A.R.; Rundmo, T. Risk perceptions, fatalism and driver behaviors in Turkey and Iran. Saf. Sci. 2013, 59, 187–192. [Google Scholar] [CrossRef]
  65. Yıldırım, Z. Religiousness, Conservatism and their Relationship with Traffic Behaviour. Master’s Thesis, Middle East Technical University, Ankara, Turkey, 2007. [Google Scholar]
  66. Ahamad, R. Capital’s Footbridges, Underpasses Underused. 2017. Available online: http://www.newagebd.net/article/16996/capitals-footbridges-underpasses-underused (accessed on 12 January 2021).
  67. Aowsaf, S.M.A. Dhaka Pedestrians Keep Avoiding Foot Over-Bridges. Dhaka Tribune. 2018. Available online: https://www.dhakatribune.com/bangladesh/dhaka/2018/09/26/dhaka-pedestrians-keep-avoiding-foot-over-bridges (accessed on 12 January 2021).
  68. Masum, O. Space on Dhaka Walkways Shrinks as Shops, Trees or Construction Encroach Them. 2019. Available online: https://bdnews24.com/bangladesh/2019/03/26/space-on-dhaka-walkways-shrinks-as-shops-trees-or-construction-encroach-them (accessed on 12 January 2021).
  69. Khan, M.J. Nobody Cares About Signs. 2019. Available online: https://www.thedailystar.net/backpage/news/nobody-cares-about-signs-1689301 (accessed on 12 January 2021).
  70. Sarkar, S. Jaywalking—A Blot on Dhaka’s Image. 2018. Available online: https://thefinancialexpress.com.bd/views/jaywalking-a-blot-on-dhakas-image-1532794823 (accessed on 12 January 2021).
  71. Das, R.C.; Shafie, I.K.; Hamim, O.F.; Hoque, M.S.; McIlroy, R.C.; Plant, K.L.; Stanton, N.A. Why do road traffic collision types repeat themselves? Look back before moving forward. Hum. Factors Ergon. Manuf. Serv. Ind. 2021. Available online: https://0-onlinelibrary-wiley-com.brum.beds.ac.uk/doi/abs/10.1002/hfm.20932 (accessed on 12 January 2021).
  72. Nordfjærn, T.; Zavareh, M.F. Individualism, collectivism and pedestrian safety: A comparative study of young adults from Iran and Pakistan. Saf. Sci. 2016, 87, 8–17. [Google Scholar] [CrossRef]
  73. Nordfjærn, T.; Şimşekoğlu, Ö. The role of cultural factors and attitudes for pedestrian behaviour in an urban Turkish sample. Transp. Res. Part F Traffic Psychol. Behav. 2013, 21, 181–193. [Google Scholar] [CrossRef]
  74. de Lavalette, B.C.; Tijus, C.; Poitrenaud, S.; Leproux, C.; Bergeron, J.; Thouez, J.P. Pedestrian crossing decision-making: A situational and behavioral approach. Saf. Sci. 2009, 47, 1248–1253. [Google Scholar] [CrossRef]
  75. Eiksund, S. A geographical perspective on driving attitudes and behaviour among young adults in urban and rural Norway. Saf. Sci. 2009, 47, 529–536. [Google Scholar] [CrossRef]
  76. Kramsch, C.; Widdowson, H.G. Language and Culture, 1st ed.; Oxford University Press: Oxford, UK, 1998. [Google Scholar]
  77. Wolf, E.J.; Harrington, K.M.; Clark, S.L.; Miller, M.W. Sample Size Requirements for Structural Equation Models: An Evaluation of Power, Bias, and Solution Propriety. Educ. Psychol. Meas. 2013, 76, 913–934. [Google Scholar] [CrossRef] [PubMed]
  78. Sharmeen, N.; Houston, D. Urban Form, Socio-Demographics, Attitude and Activity Spaces: Using Household-Based Travel Diary Approach to Understand Travel and Activity Space Behaviors. Urban Sci. 2020, 4, 69. [Google Scholar] [CrossRef]
  79. Population Pyramids. Population Pyramids of the World from 1950 to 2100. Available online: https://www.populationpyramid.net/ (accessed on 11 August 2021).
Figure 1. Age and gender characteristics of the samples (N = 532): Percentages of each group against total number of respondents are shown as data labels.
Sustainability 13 10640 g001
Figure 2. Levels of education of the samples (N = 532): Number and percentages of each group against total number of respondents are shown in callout boxes. Three broader education categories are presented in the outer rings.
Sustainability 13 10640 g002
Figure 3. Attitudes affecting pedestrian behaviour.
Sustainability 13 10640 g003
Table 1. Summary of exploratory factor analysis results for attitudes towards traffic safety with descriptive statistics (N = 532).
Item No.ItemMeanStandard DeviationRotated Factor Loadings for Attitudes Towards
Speeding and Traffic Rule ViolationTaking Chances and Increasing EfficiencyIrresponsible Driving of Others
Q2.9If you are a good driver it is acceptable to drive a little faster3.3891.4490.673
Q2.10When road conditions are good and nobody is around driving in 100 mph (~160 kmh) is ok3.6241.4360.668
Q2.13I will ride with someone who speeds if others do4.0131.2080.662
Q2.2It makes sense to exceed speed limits to get ahead of slow drivers3.3671.4730.546
Q2.12I will ride with someone who speeds if that’s the only way to get home at night3.3141.3530.520
Q2.8Traffic rules are often too complicated to be carried out in practice3.7221.3770.5050.337
Q2.6Taking chances and breaking a few rules does not necessarily make bad drivers3.1581.441 0.723
Q2.7It is acceptable to take chances when no other people are involved2.9571.495 0.639
Q2.22It is acceptable to ride a bicycle without a helmet3.0981.557 0.589
Q2.1Many traffic rules must be ignored to ensure traffic flow3.7091.383 0.507
Q2.17When the road is clear, there is no need to stop at a stop sign3.5751.456 0.467
Q2.4Speed limits are exceeded because they are too restrictive3.4941.373 0.4110.345
Q2.14 (*)I don’t want to risk my life and health by riding with an irresponsible driver (*)4.4791.176 0.854
Q2.15 (*)I would never ride with someone I knew has been drinking alcohol (*)4.4701.239 0.846
Eigenvalue3.5211.6231.138
% Variance17.23915.67711.955
α0.6950.6380.701
Average inter-item correlation0.2760.2280.541
Note: Factor loadings over 0.40 appear in bold, with factor loadings below 0.3 suppressed for legibility. (*) represents reverse scored items.
Table 2. Summary of exploratory factor analysis results for pedestrian behaviours with descriptive statistics (N = 532).
Item No.Item MeanStandard DeviationRotated Factor Loadings for
InattentionAggressive BehavioursViolationsImpermissible Behaviours
Q6.18I run across the street without looking because I am in a hurry2.1581.5450.821
Q6.17I forget to look before crossing because I am thinking about something else2.3671.5680.813
Q6.15I cross without looking because I am talking with someone2.1451.4250.798
Q6.16I forget to look before crossing because I want to join someone on the pavement on the other side2.1671.5030.812
Q6.13I realize that I have crossed several streets and intersections without paying attention to traffic2.4611.6060.682
Q6.14I get angry with another road user (pedestrian, driver, cyclist, etc.), and I make a hand gesture1.9571.378 0.787
Q6.19I get angry with another road user (pedestrian, driver, cyclist, etc.), and I yell at them2.2161.473 0.619 0.345
Q6.9I have gotten angry with a driver and hit their vehicle1.5431.0980.3120.675
Q6.12I cross very slowly to annoy a driver1.4551.036 0.556
Q6.4I cross outside the pedestrian crossing even if there is one (e.g. a crosswalk or zebra crossing) less than 50 m away3.2971.806 0.715
Q6.2I cross between vehicles stopped on the roadway in traffic jams4.2731.609 0.683
Q6.3I cross diagonally to save time3.6391.786 0.655
Q6.7I avoid using pedestrian bridges or underpasses for convenience, even if one is located nearby3.1921.799 0.616
Q6.11I walk on cycling paths when I could walk on the pavement2.1561.482 0.802
Q6.10I take passageways forbidden to pedestrians to save time2.3331.540 0.794
Eigenvalue4.6531.7511.5111.083
% Variance22.77713.91112.36710.937
α0.8730.6860.6050.707
Average inter-item correlation0.5820.3550.2780.547
Note: Factor loadings over 0.40 appear in bold. Factor loadings below 0.3 have been suppressed for legibility.
Table 3. Correlations between all factors of attitudes and behaviours.
Impermissible BehavioursViolationsAggressive BehavioursInattentionAttitudes towards the Irresponsible Driving of OthersAttitudes towards Taking Chances and Increasing Efficiency
Attitudes towards speeding and rule violation−0.194 **−0.142 **−0.267 **−0.242 **0.0690.524 **
Attitudes towards taking chances and increasing efficiency−0.119 **−0.208 **−0.139 **−0.132 **0.076
Attitude towards the irresponsible driving of others−0.207 **−0.090 *−0.262 **−0.139 **
Inattention0.403 **0.216 **0.428 **
Aggressive Behaviours0.393 **0.141 **
Violations0.259 **
Note: ** p < 0.01, * p < 0.05.
Table 4. Hierarchical linear regression results for explaining variance in four types of behaviours.
Predictor VariablesInattentionAggressive BehavioursViolationsImpermissible Behaviours
R2Adjusted R2R2 ChangeR2Adjusted R2R2 ChangeR2Adjusted R2R2 ChangeR2Adjusted R2R2 Change
Step 1 (age and gender)0.028 **0.019 **-0.0140.005-0.030 **0.021-0.0080.001-
Step 2 (with the addition of education)0.043 **0.030 **0.015 **0.0170.0040.0030.048 **0.035 **0.018 **0.0160.0020.007
Step 3 (with the addition of attitudes)0.109 ***0.092 ***0.065 ***0.143 ***0.126 ***0.126 ***0.097 ***0.080 ***0.049 ***0.089 ***0.071 ***0.073 ***
Note: *** p< 0.001, ** p < 0.01.
Table 5. Standardised and unstandardised regression coefficients and standard errors of predictor variables for the four types of behaviours.
Predictor VariablesInattentionAggressive BehavioursViolationsImpermissible Behaviours
BS.E. BβBS.E. BβBS.E. BβBS.E. Bβ
25–34 years (Ref: 18–24 years)0.0880.1360.031−0.1340.096−0.066−0.2140.130−0.079−0.0780.146−0.026
35–44 years (Ref: 18–24 years)0.3060.1670.084−0.0460.119−0.017−0.2610.160−0.075−0.2240.180−0.057
45–54 years (Ref: 18–24 years)−0.1470.179−0.038−0.2180.127−0.077−0.6060.171−0.163 ***−0.0700.193−0.017
Over 54 years (Ref: 18–24 years)−0.2770.204−0.061−0.2180.145−0.066−0.4770.195−0.111 *−0.3630.219−0.075
Female (Ref: Male)−0.2080.128−0.068−0.1410.091−0.0640.0470.1230.016−0.1040.138−0.032
Low-level education (Ref: Medium-level education)0.1490.1710.0410.0020.1220.0010.0550.1640.0160.0700.1840.018
High-level education (Ref: Medium-level education)−0.2070.116−0.0820.0190.0820.010−0.2640.111−0.110 *−0.1620.125−0.060
Attitudes towards speeding and rule violation−0.3170.071−0.222 ***−0.2510.05−0.242 ***−0.0010.068−0.001−0.2460.076−0.162 ***
Attitudes towards taking chances and increasing efficiency0.0320.0720.0220.0080.0510.007−0.2730.068−0.200 ***−0.0190.077−0.012
Attitude towards irresponsible driving of others−0.1610.049−0.137 ***−0.2150.035−0.252 ***−0.1030.047−0.092 *−0.2550.053−0.203 ***
Note: *** p < 0.001, * p < 0.05.
Publisher’s Note: MDPI stays neutral with regard to jurisdictional claims in published maps and institutional affiliations.

