1. Introduction
Drunk driving continues to be a significant cause of highway crashes and deaths. If there is any good news with respect to drunk driving, it is that there has been a significant decline in drunk driving-related deaths over the past 40 years or so. In the early 1980s, nearly 45–50% of crash-related fatalities involved a driver with a BAC > 80 mg/dL (aka 0.08%), whereas today that figure has been cut significantly, with approximately 30% of the crash-related fatalities involving drivers with a BAC > 80 mg/dL ([
1,
2]. Several factors likely contributed to this decline. Legislative changes like the National Drinking Age Act of 1984 [
3] and the National 80 mg/dL BAC Cut-Off Act [
4] have contributed significantly, as have the use of breathalyzer-dependent ignition lock-out devices [
5,
6] and sobriety checkpoints in states where they are allowed [
7,
8,
9]. In addition, advocacy/awareness groups such as Mothers against Drunk Driving [
10], Students Against Destructive Decisions [
11] and Designated Driver campaigns [
12] have likely had a significant positive effect. Many public service announcements, like “Friends don’t let friends drive drunk”, “Be sober or get pulled over”, have likely had an impact as well [
13]. Finally, improvements in car and road conditions have contributed greatly.
Despite the positive effects of these various initiatives to reduce drunk driving deaths from the levels of the early 1980s, messaging from the alcohol industry has continued to (mis)inform public health policy [
14], with one result being that alcohol-related traffic deaths have nonetheless remained relatively flat—and far too high—for the past decade or so. The National Safety Council estimates that for the past 10 years, drunk driving crashes (BAC > 80 mg/dL) have continued to be responsible for approximately 30% of all crash fatalities in the US [
2], which equates to approximately 10,000 deaths every year [
2]. Thus, although significant inroads have been made in reducing drunk driving crashes and fatalities, drunk driving continues to claim the lives of far too many on our roadways.
The COVID-19 pandemic has had significant consequences on alcohol and drug use. Alcohol sales increased as people were required to become more homebound [
15], and now studies are showing increases in both the amount of alcohol consumed and in the number of days under the influence during lockdown phase of the pandemic [
16]. With more and more states’ lifting of COVID restrictions on group gatherings on the horizon, an increase in group gatherings and travel—with a resulting increase in driving after drinking—is highly likely.
Currently, the blood alcohol concentration (BAC) cut-off level for drunk driving is set at 80 mg/dL for most states in the USA. Research from many sources has shown that driving performance is impaired at even lower concentrations (see [
17] for review). Several countries [
18] and the State of Utah [
19] in the US have adopted a lower drunk driving BAC cut-off at 50 mg/dL, and several other states—including Hawaii, Virginia, New York and Michigan—have considered and debated legislation to reduce their BAC cut-off to 50 mg/dL [
17]. Many groups such as the World Health Organization and the National Transportation Safety Board have supported this move [
20]. It has been estimated that lowering the drunk driving BAC cut-off to 50 mg/dL would save on average 500–800 lives every year in the US alone [
20,
21].
BAC cut-offs for drunk driving differ across countries throughout the world [
18]. In many countries in Africa and South America, in most of the countries of the European Union (EU) and in Australia, the BAC cut-off for drunk driving is 50 mg/dL. Indeed, the 80 g/dL BAC cut-off for drunk driving is used in only a handful of countries, including the US. Reducing the BAC cut-off has reduced crashes and saved lives lost to drunk drivers. For example, in 1998, Austria decreased the BAC cut-off to 50 mg/dL; this change decreased drunk driving accidents by nearly 10% [
22]. According to the National Transportation Safety Board [
20], in 2015, 31% of the crash deaths in the United States involved alcohol. By contrast, in the Netherlands, where the BAC cut-off is 50 mg/dL, only 19% of traffic related deaths involved alcohol. The NTSB concluded “...twenty years of international studies have shown that when a country lowers BAC limits from 80 mg/dL to 50 mg/dL, alcohol-related fatal and injury crashes decrease between 5% and 10%.” [
20].
The statistics regarding the effects of alcohol on driving performance often have focused on fatal crashes, with less emphasis on severe or non-severe non-fatal crashes. Perhaps this reflects the impact of limited resources available for investigation, i.e., greater investigative resources for fatal crash investigations. For whatever reason, it remains the case that the quality of the databases is oftentimes less robust for non-fatal crashes (see, for example [
23]). Focusing on high-profile fatal crashes may result in the skewing of the data toward higher BAC levels, and thus understate the adverse consequences of more moderate alcohol intoxication.
Several studies have reported adverse effects of ethanol on road driving [
24,
25], as well as simulator performance [
26,
27,
28]. These studies have used many measures, but one of the most commonly used measures of drunk driving is the Standard Deviation of Lane Position (SDLP), essentially a measure of weaving while driving. Recently, our laboratory has used a driving simulator to study crash avoidance reaction time, a measure related to defensive driving ability. We have shown that both low dose alcohol (BAC: 50–80 mg/dL) and marijuana (10 mg edible THC, blood concentration < 3 ng/mL) cause an increase in crash avoidance reaction time in this defensive driving task [
29].
Driving simulators have also been used as educational tools regarding the hazards of distracted and impaired driving. For example, the APlusB simulator company has advocated for using portable simulators with a drunk driving program to provide educational experiences regarding the effects of alcohol on simulator driving performance (APlusB Inc., Richmond, OH, USA, 2021) In addition, Innocorp has developed a hands on educational tool using go-carts and ‘beer goggles’ to help young drivers appreciate the hazards of drunk and impaired driving [
30].
In addition to our academic studies on the effects of distractions (texting [
31,
32], and drug effects [
29] on driving performance and driving safety, our research group also has been involved in public safety presentations to the community regarding the dangers of distracted driving and impaired driving. In the impaired driving presentations we have used a fixed-base driving simulator located in our college, with a ‘demonstration subject’ consuming real alcohol to achieve a measured BAC 50–75 mg/dL (not legally drunk in Michigan) and then demonstrating an impairment in crash avoidance driving performance. These hands-on demonstrations are an engaging and useful educational tool, but with a fixed base simulator (full size car in a laboratory room) they are limited to in-house presentations.
Recently, our research group started working with a portable driving simulator [
17], using virtual reality (VR) technology and specific software provided by Mahmoud Mattan at Brand XR (Orlando, FL). Before the COVID-19 outbreak, it was our plan to take this portable system “on the road”—figuratively speaking—for hands-on community informational presentations about the hazards of buzzed and/or drunk driving. Imagine, for example, a community leader in your town—the Mayor or the Chief of Police—‘driving’ (in an auditorium in a ‘town hall’ setting) a VR-based simulator (described below in detail) and providing a first-hand demonstration of how even low doses of alcohol can adversely affect your driving ability. (Of course, they would have a designated driver for the trip home afterward). Since we cannot take our presentation to the community during the pandemic, we are sharing it at this time with the readers of Substance Abuse Treatment, Prevention, and Policy. The testing procedure is fun and easy to learn and, as we shall demonstrate, is highly sensitive to the disruptive effects of ethanol on driving performance. Thus, the present paper describes a hands-on public awareness outreach program for demonstrating the hazards of (real) drunk driving, and the relationship between BAC levels and driving performance. The present paper also demonstrates very clearly the impairing effects of ethanol on driving even when the BAC is less than 80 mg/dL, i.e., the legal cut-off for drunk driving in most states in the US.
2. Materials and Methods
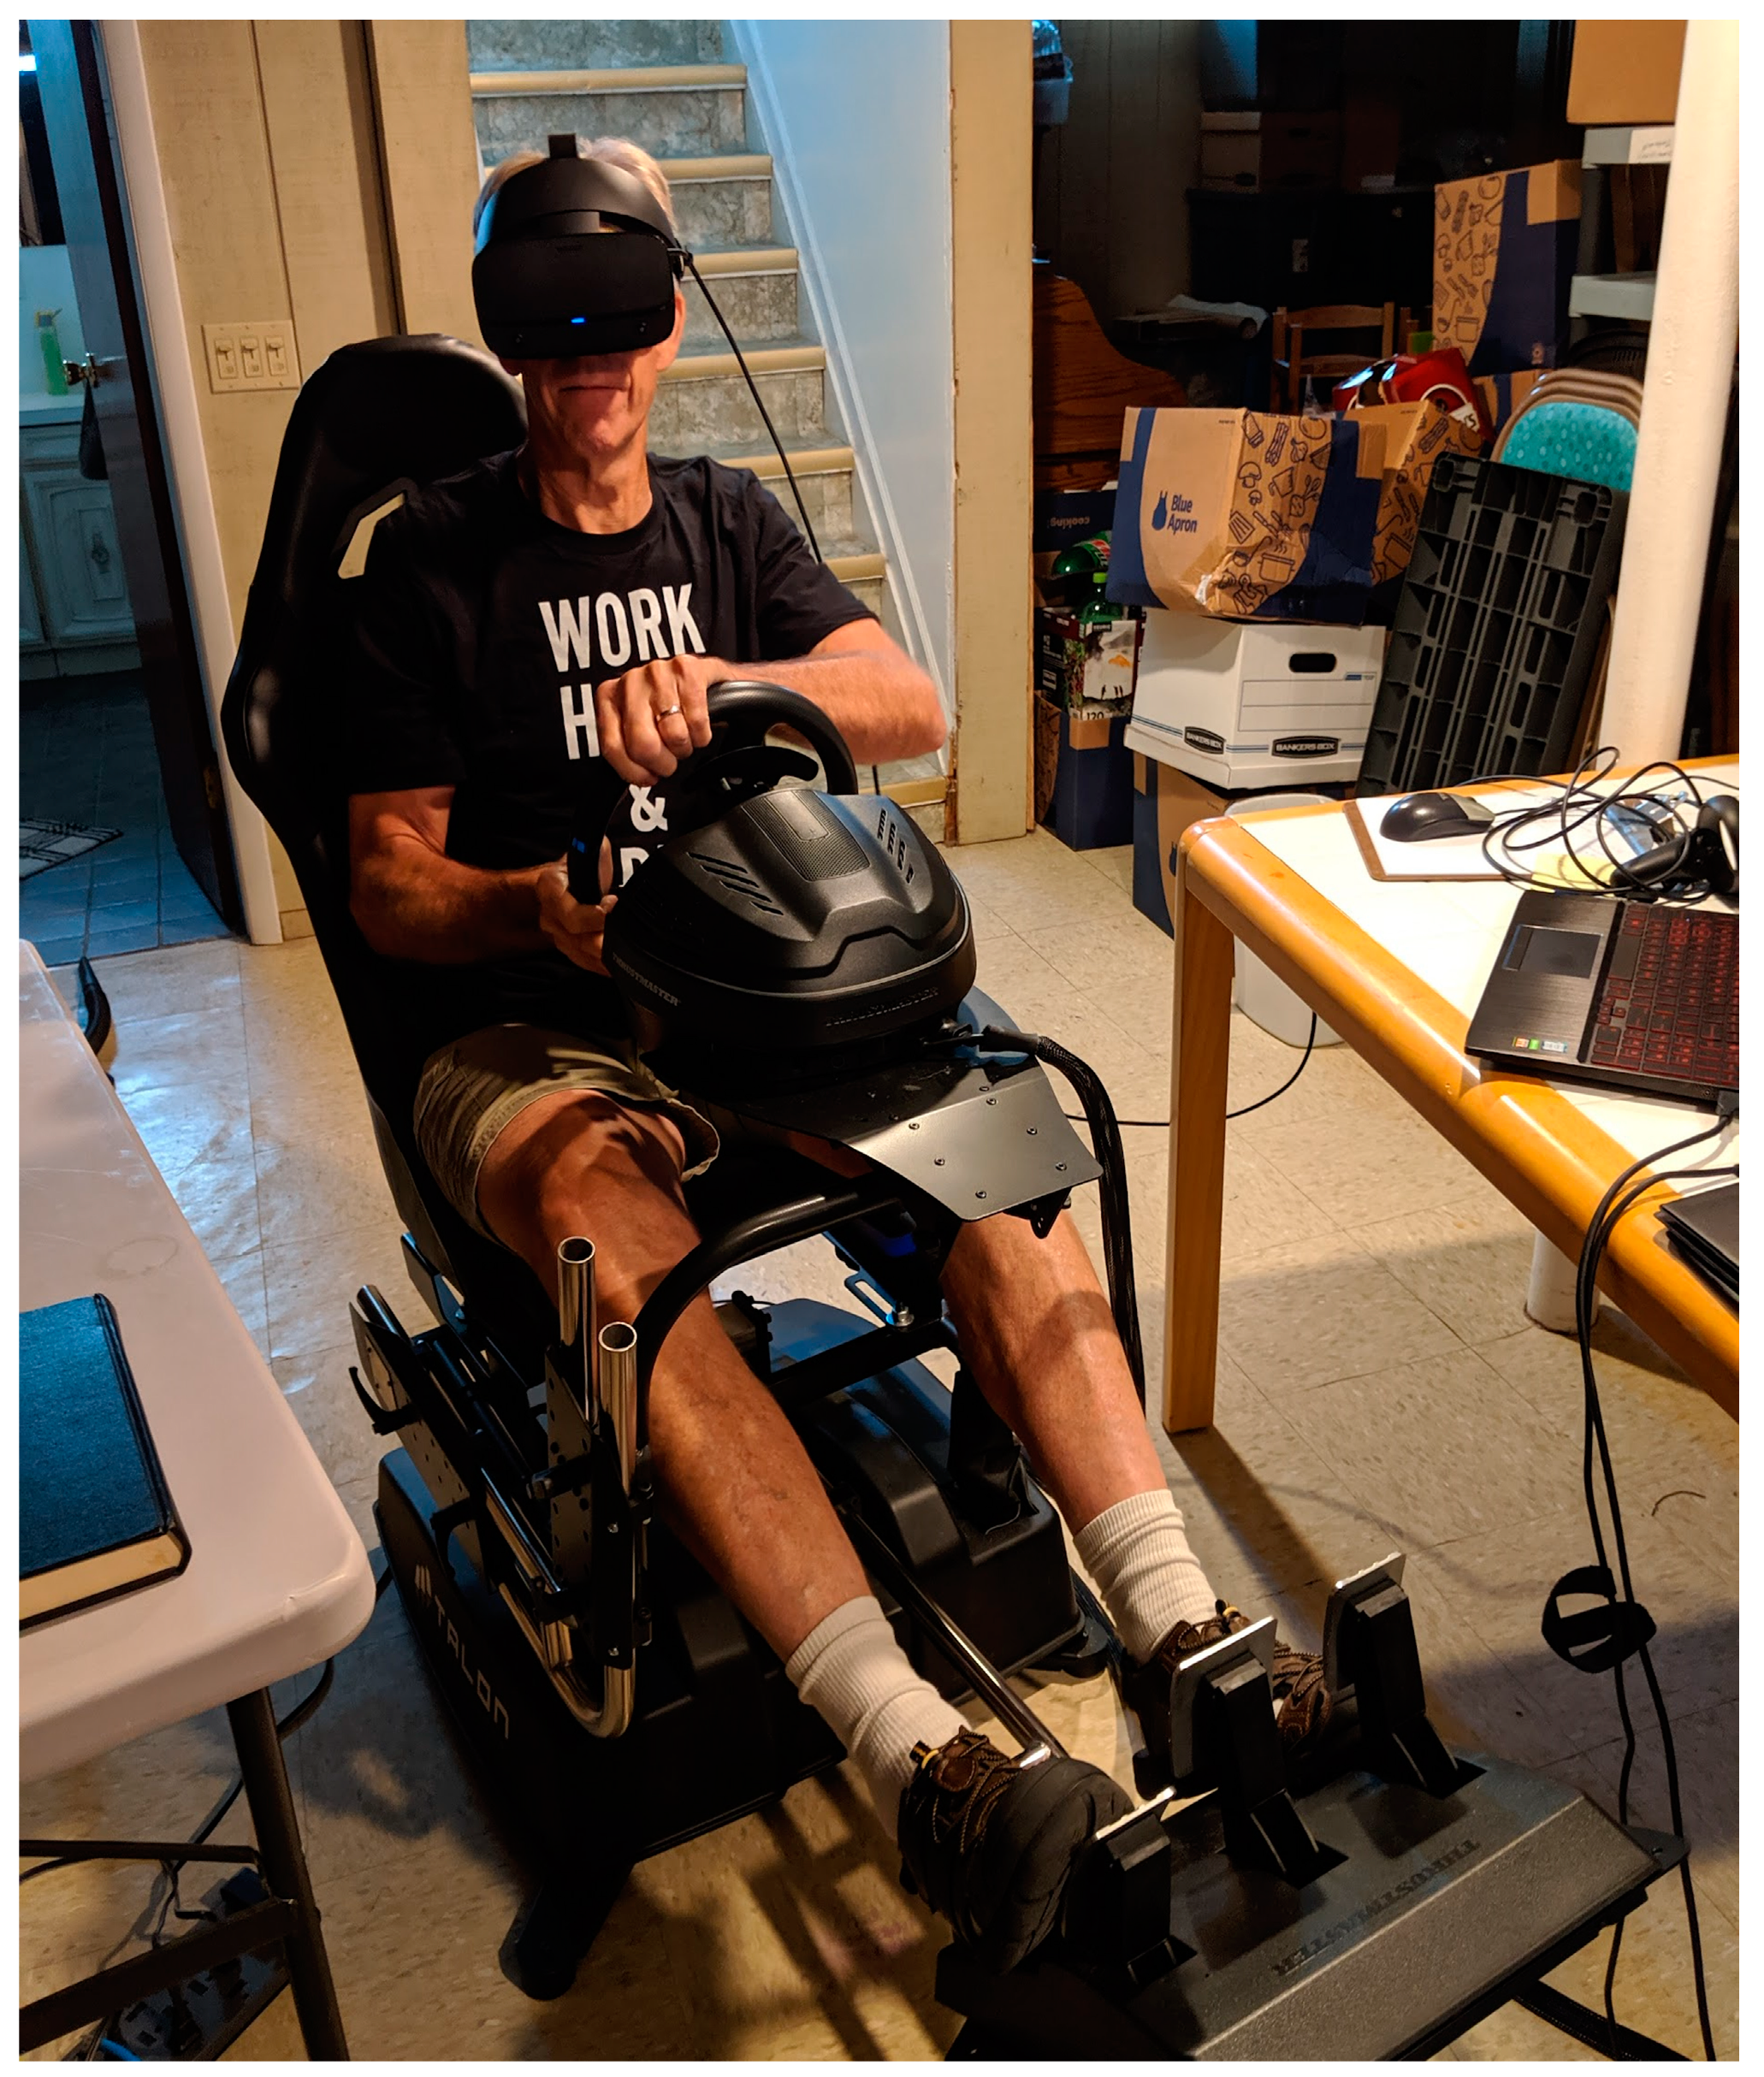
Subject. Rather than the Mayor or the Chief of Police from the local municipality, the subject for this study is Dr. Commissaris, the project’s Principal Investigator. At the time of the study, he weighed 205 pounds and had a body mass index (BMI) of 26. The subject has a history of occasional drinking, i.e., up to two alcoholic drinks/day socially as frequently as 2–3 times per week for the past six months. Except for his participation in the present study, he has not consumed more than 4–5 drinks in a single setting in over 20 years. The studies were conducted in accordance with Wayne State University IRB #066716B3E. Normally, i.e., in non-COVID times, i.e., with the current IRB, subjects would be male and female, across a range of ages. In addition, the subjects would be characterized via survey as occasional, moderate or relatively heavy alcohol users. This would allow for an analysis of the potential influence of alcohol tolerance.
Apparatus.
Figure 1 below depicts the subject and the test apparatus used in the present.
Study. The gaming chair was purchased from Talon Corporation (Los Angeles, CA, USA) and the model was the Atomic A3 Motion Simulator using the racing/flight system. The VR headset was a standard commercial Oculus Rift-S headset. The specific crash avoidance computer program is a proprietary product created for Wayne State University by Brand XR (Orlando, FL, USA). The open source platform Steam was used to communicate between the software and the VR headset and the gaming chair.
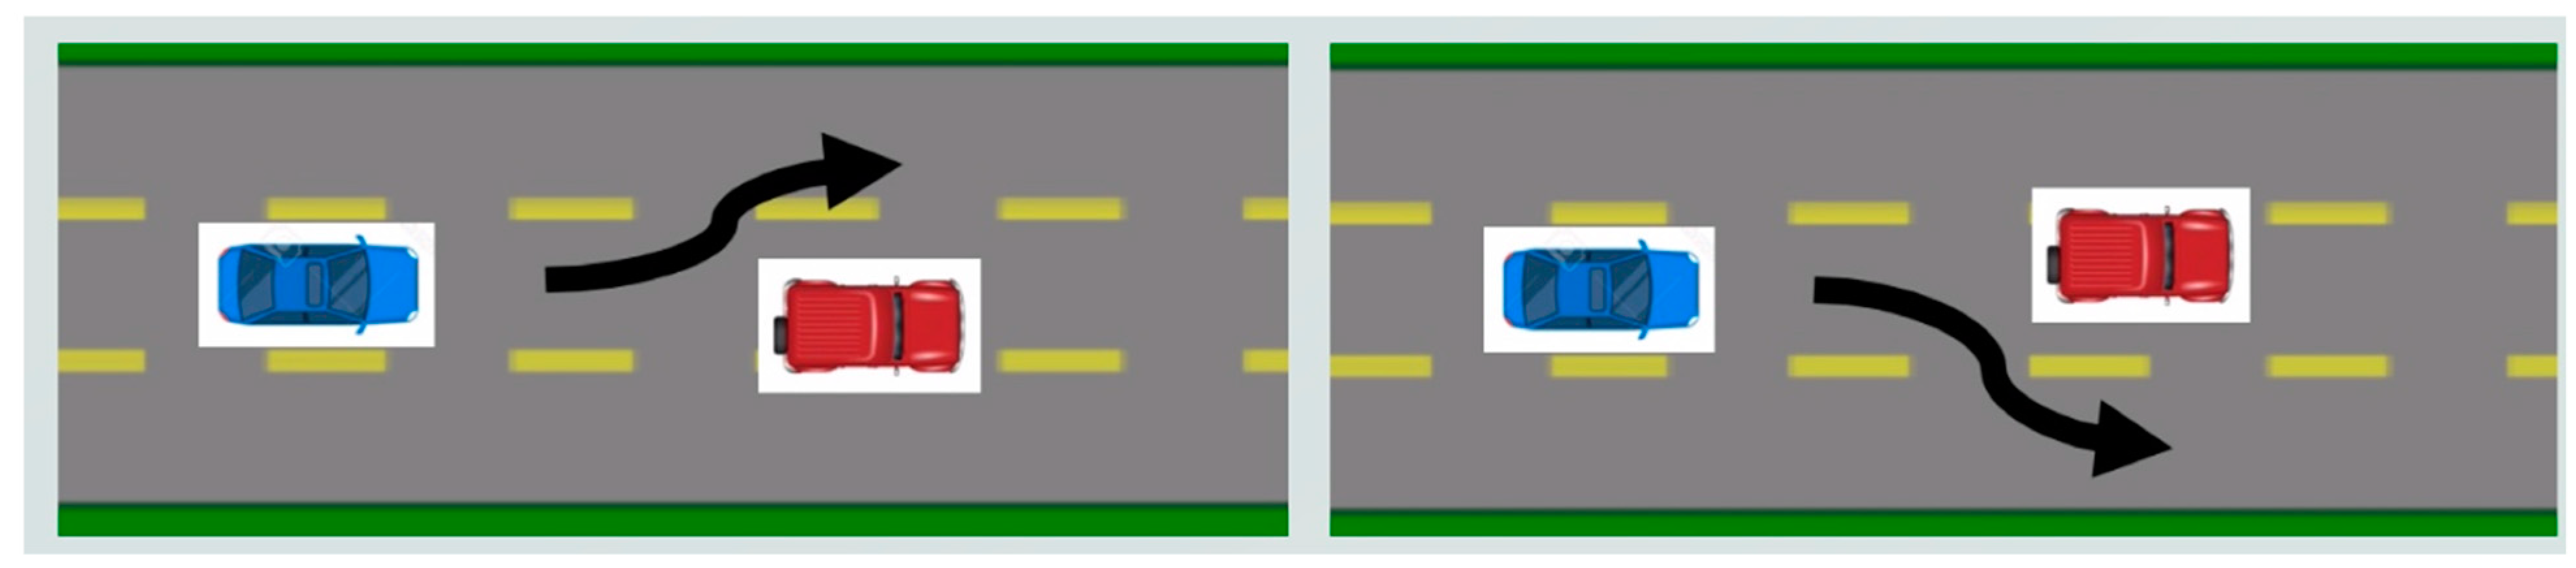
Crash avoidance reaction time was the primary measure of driving performance. In this VR-based game-like procedure, the driver is instructed to drive at 70 mph (‘pedal to the metal’; a programming governor limits the top speed at 70 mph) and stay in the middle lane of a three-lane road. At randomly occurring times during the drive, a ‘stalled car’ instantly appears in the road ahead. The stalled car is too close (40 m headway distance) to avoid a crash via braking; the only way to avoid crashing into the stalled car is to rapidly steer around the car. The steering response should be hard to the left or hard to the right, and is determined by the location of the stalled car, i.e., slightly right of center or slightly left of center; the relative position of the stalled car is unknown to the driver. Thus, this is a type of ‘choice’ reaction time measure.
The timing during the drive for the appearance of the stalled car and the crash avoidance trials was random and different for every drive. The average interval between crash avoidance trials was 25 s, but some individual trials occurred at an interval as short as 10 s and others as long as 45 s after the previous trial. The subject knew that a crash avoidance trial would occur, but the subject did not know precisely when the crash avoidance situation would be presented.
Figure 2 presents a cartoon depicting the nature of this choice reaction driving task.
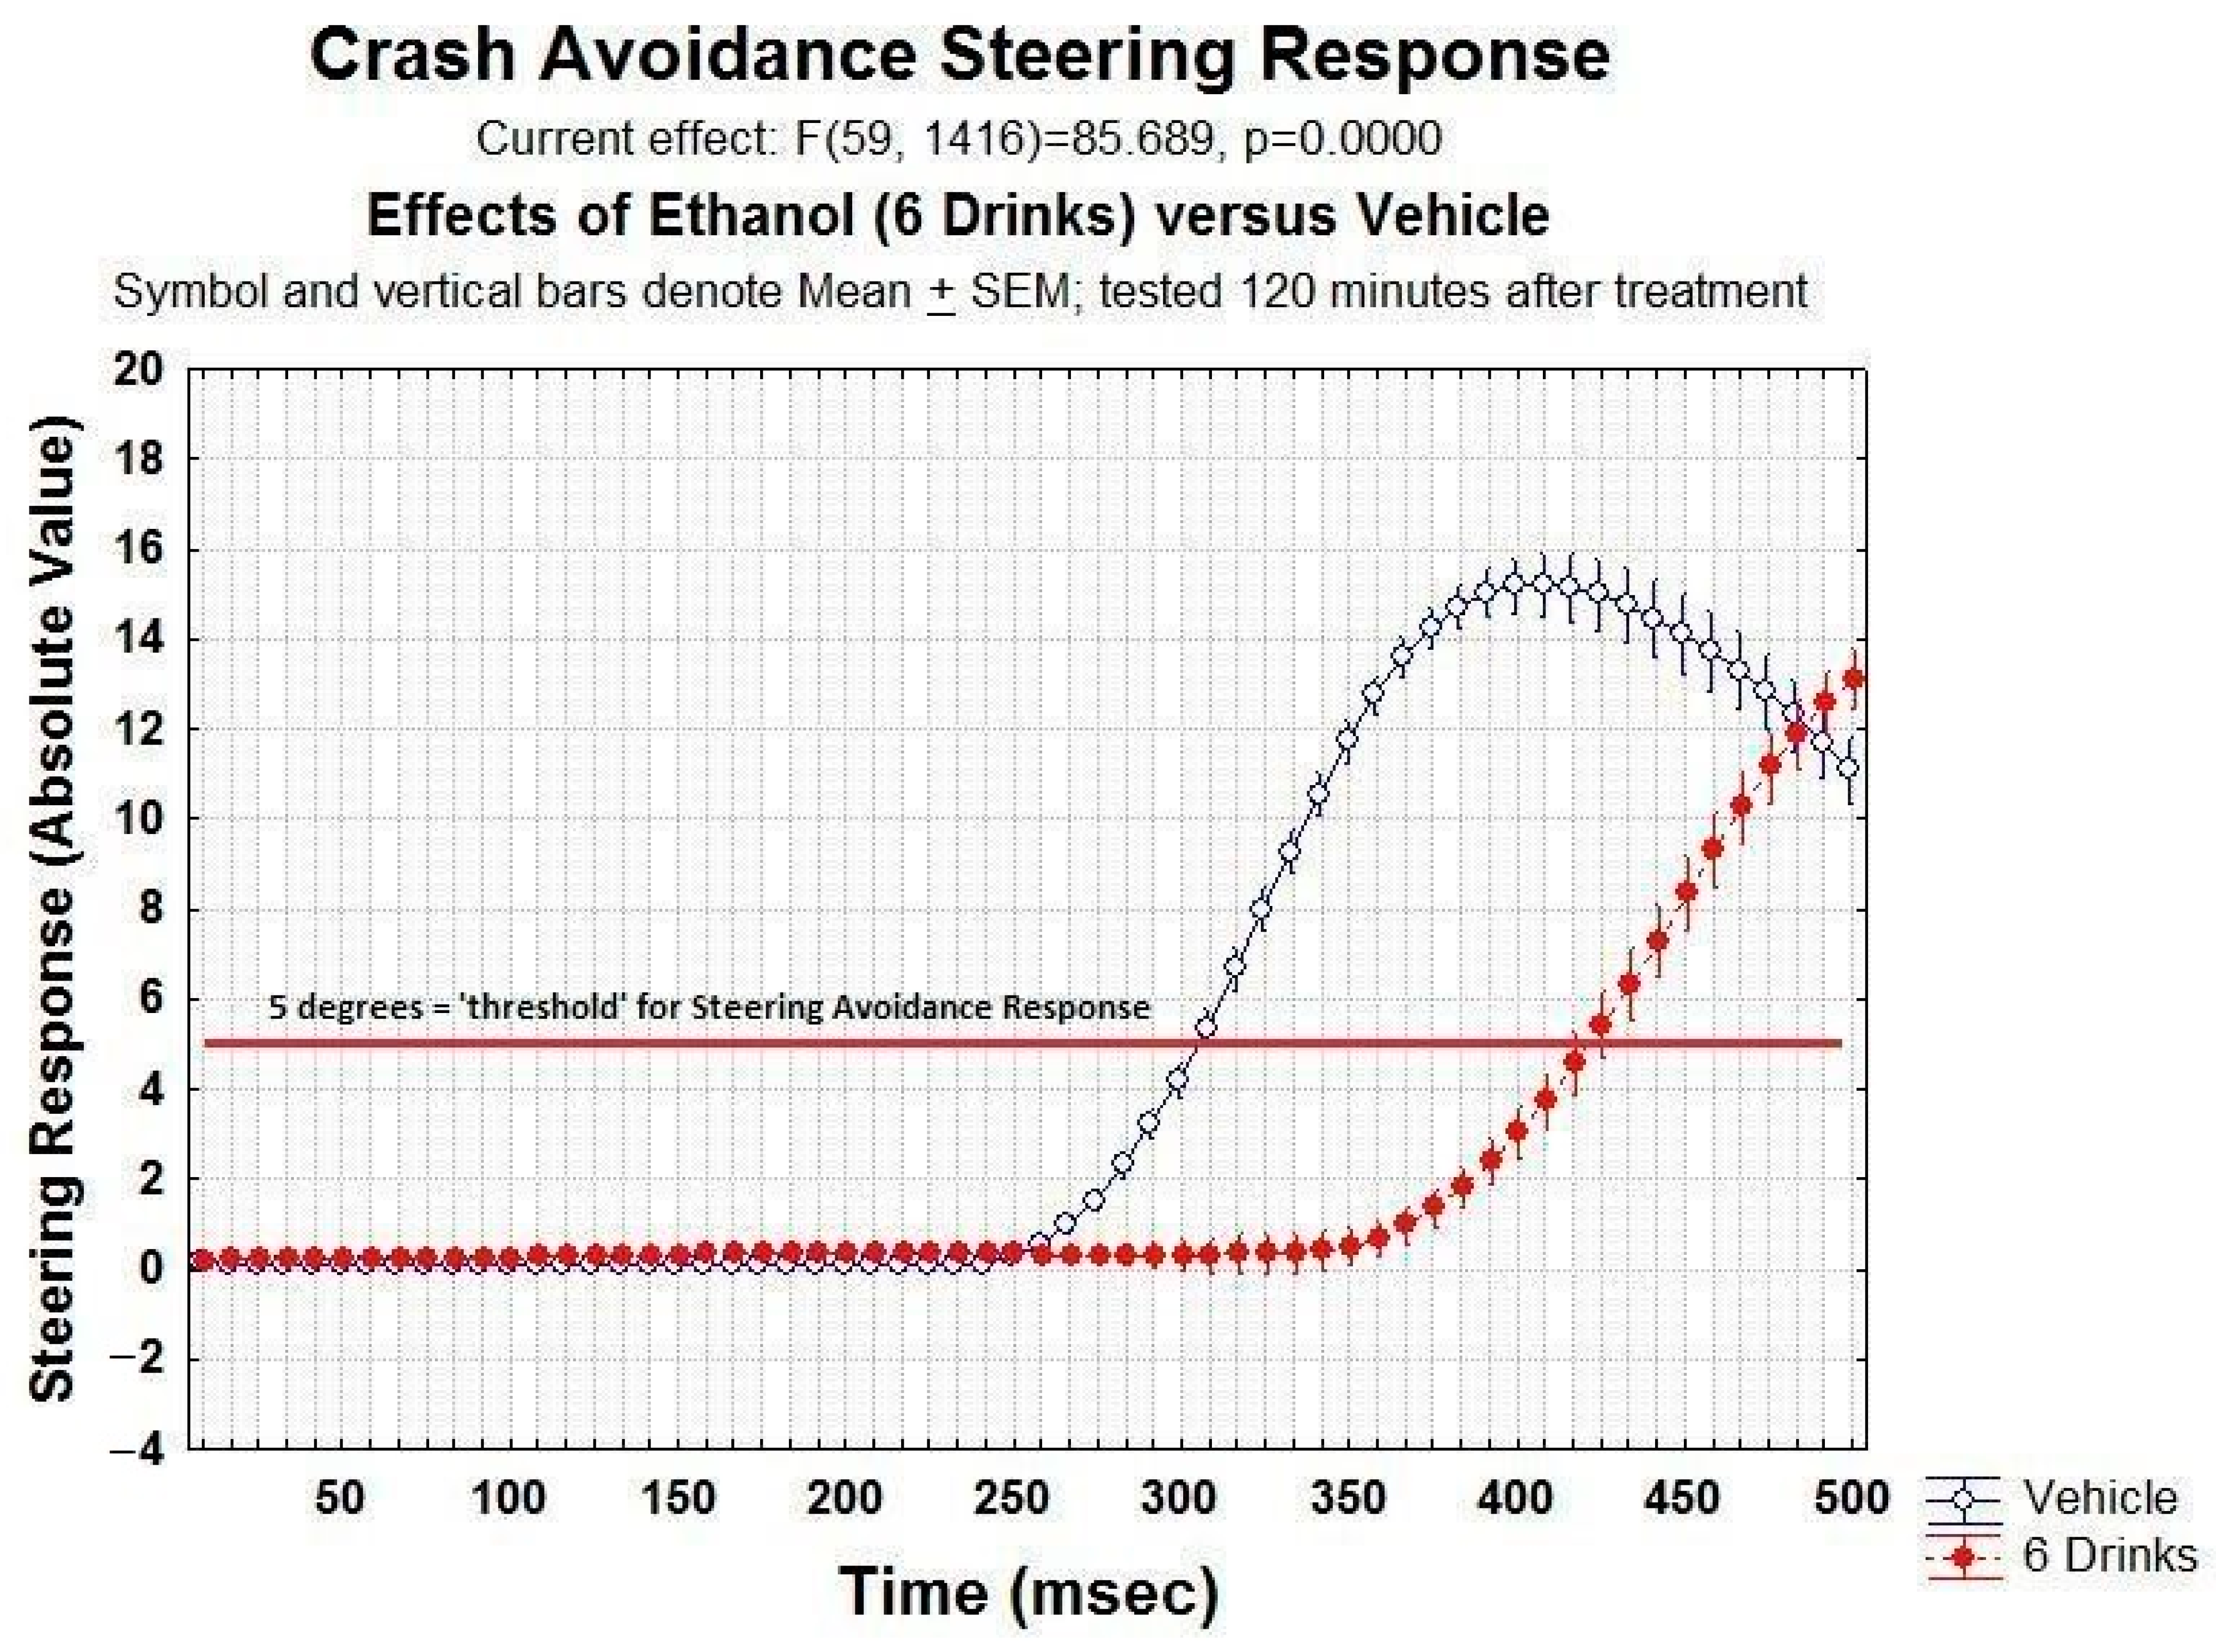
In the present study, initiation of an avoidance steering response was defined as the moment that the steering wheel reading reached 5 degrees or greater. This cut-off was selected somewhat arbitrarily, and reflects a balance between serious aggressive crash avoidance turning and the more slight moment-to-moment minor steering corrections that a driver engages in while driving in the center lane at 70 mph. Pilot studies revealed that simply “wiggling” the steering wheel a little bit while remaining in the center lane generates steering responses of <1–2 degrees, i.e., well below the 5 degree cut-off. As you can see in
Figure 3 of the manuscript, 5 degrees of turning in this task corresponds to about 30% of the maximal turning accomplished; thus, this steering response is clearly an aggressive crash avoidance steering response and not the ordinary ‘wiggle’ that one engages in simply in order to remain in the middle lane.
The primary measure of driving ability is the reaction time (in ms) to initiate an avoidance steering response, i.e., steering ≥5 degrees. Dr Commissaris is an experienced driver in this task, and he typically performs this crash avoidance response reliably (correct avoidances >99% of all trials), with an average reaction time between 305 and 315 ms.
Procedure. On multiple occasions during a three-month period, with each occasion separated by approximately 3–5 days, the laboratory group (via ZOOM meetings) conducted a study on the effects of alcohol or placebo (no drug) on crash avoidance reaction time using the VR-based driving simulator. All treatments (vehicle, 2 drinks, 4 drinks or 6 drinks) were ‘replicated’ on 4 occasions over the course of three months. On each of the treatment days, the subject was tested in a pre-treatment drive, with subsequent drives conducted every 30 min after treatment for a period of 4–6 h, depending on the treatment. For the alcohol treatment days, drives were immediately preceded by estimations of BAC using the BAC track S80 personal use breathalyzer device (KHN Solutions, San Francisco, CA). Two BAC track devices were used; the BAC value recorded at each pre-drive time-point was the average of the two meter readings. The duration of the drive test is 5–7 min, so the pre-drive BAC determinations were closely connected with driving performance at that time.
The repetitive nature of the task is not problematic. It is correct that subjects exhibit something of a learning curve, i.e., reduced reaction times over the course of the first 3–5 trials in the first driving test, i.e., when first introduced to this task. This learning curve occurs rapidly and stabilizes within the first few trials. After this initial accommodation to the task, crash avoidance reaction times are remarkably stable across multiple subsequent test sessions. This is evidenced by the similarity in the reaction times for the pre-treatment (control) drives both within and across multiple test sessions.
Dependent Variables and Statistical Analyses. The dependent variables measured were: (1) the crash avoidance reaction time, defined as the time in ms from the appearance of the stalled car until the steering wheel was turned ≥5 degrees and (2) BAC, measured using the BAC Track devices. For the analysis of the time-course for the effects of different treatments on crash avoidance Reaction time, the data were analyzed using a 4 (Doses: Veh, 2, 4, 6 Drinks) × 7 (Time: Pre-Tx, 30, 60, 90, 120, 150, 180 min) Factorial ANOVA, with the time as a repeated measure. In the analysis of the time-course for alcohol concentrations versus treatments, the data were analyzed using 4 (Doses: Veh, 2, 4, 6 Drinks) × 6 (Time: 30, 60, 90, 120, 150, 180 min) factorial ANOVA, with the time as a repeated measure. Reaction times for various BAC concentration groups were analyzed using a One-way ANOVA with four levels (0.0 mg/dL {Pre-Tx}, 10–49.9 mg/dL, 50–79.9 mg/dL, ≥80 mg/dL) irrespective of dose administered. In all comparisons, p < 0.05 was the criterion for statistical significance.
3. Results
Figure 3 below illustrates the typical raw data generated for this crash avoidance steering response two hours after treatment with a relatively high dose of ethanol (6 drinks = 9 ounces of 80 proof vodka; red line) or vehicle (blue line). This figure depicts the steering wheel response (absolute value) as a function of time after the appearance of the stalled car. Steering wheel activity is sampled 120 times/sec with this device, so each point along the
x-axis represents steering wheel activity (
y-axis) during the first 500 ms following the appearance of the stalled car, separated into approximately 8.3 ms epochs. As can be seen, even when sober (vehicle curve) there is a significant delay for the initiation of a steering avoidance response. Using the criterion of 5 degrees steering as the operationally defined initiation of a significant avoidance response, the time for initiation of a significant steering response was approximately 310 ms after vehicle treatment, but increased dramatically to over 430 ms-two hours after the subject had consumed six alcoholic drinks (red trace). Statistically, there was a significant main effect for ethanol treatment (F (1,24) = 131.62,
p < 0.05) and for Time (8.33 ms steering epochs) (F (59,1416) = 311.84,
p < 0.05); the ethanol treatment–time interaction also was significant (F(5,1416) = 85.69,
p < 0.05).
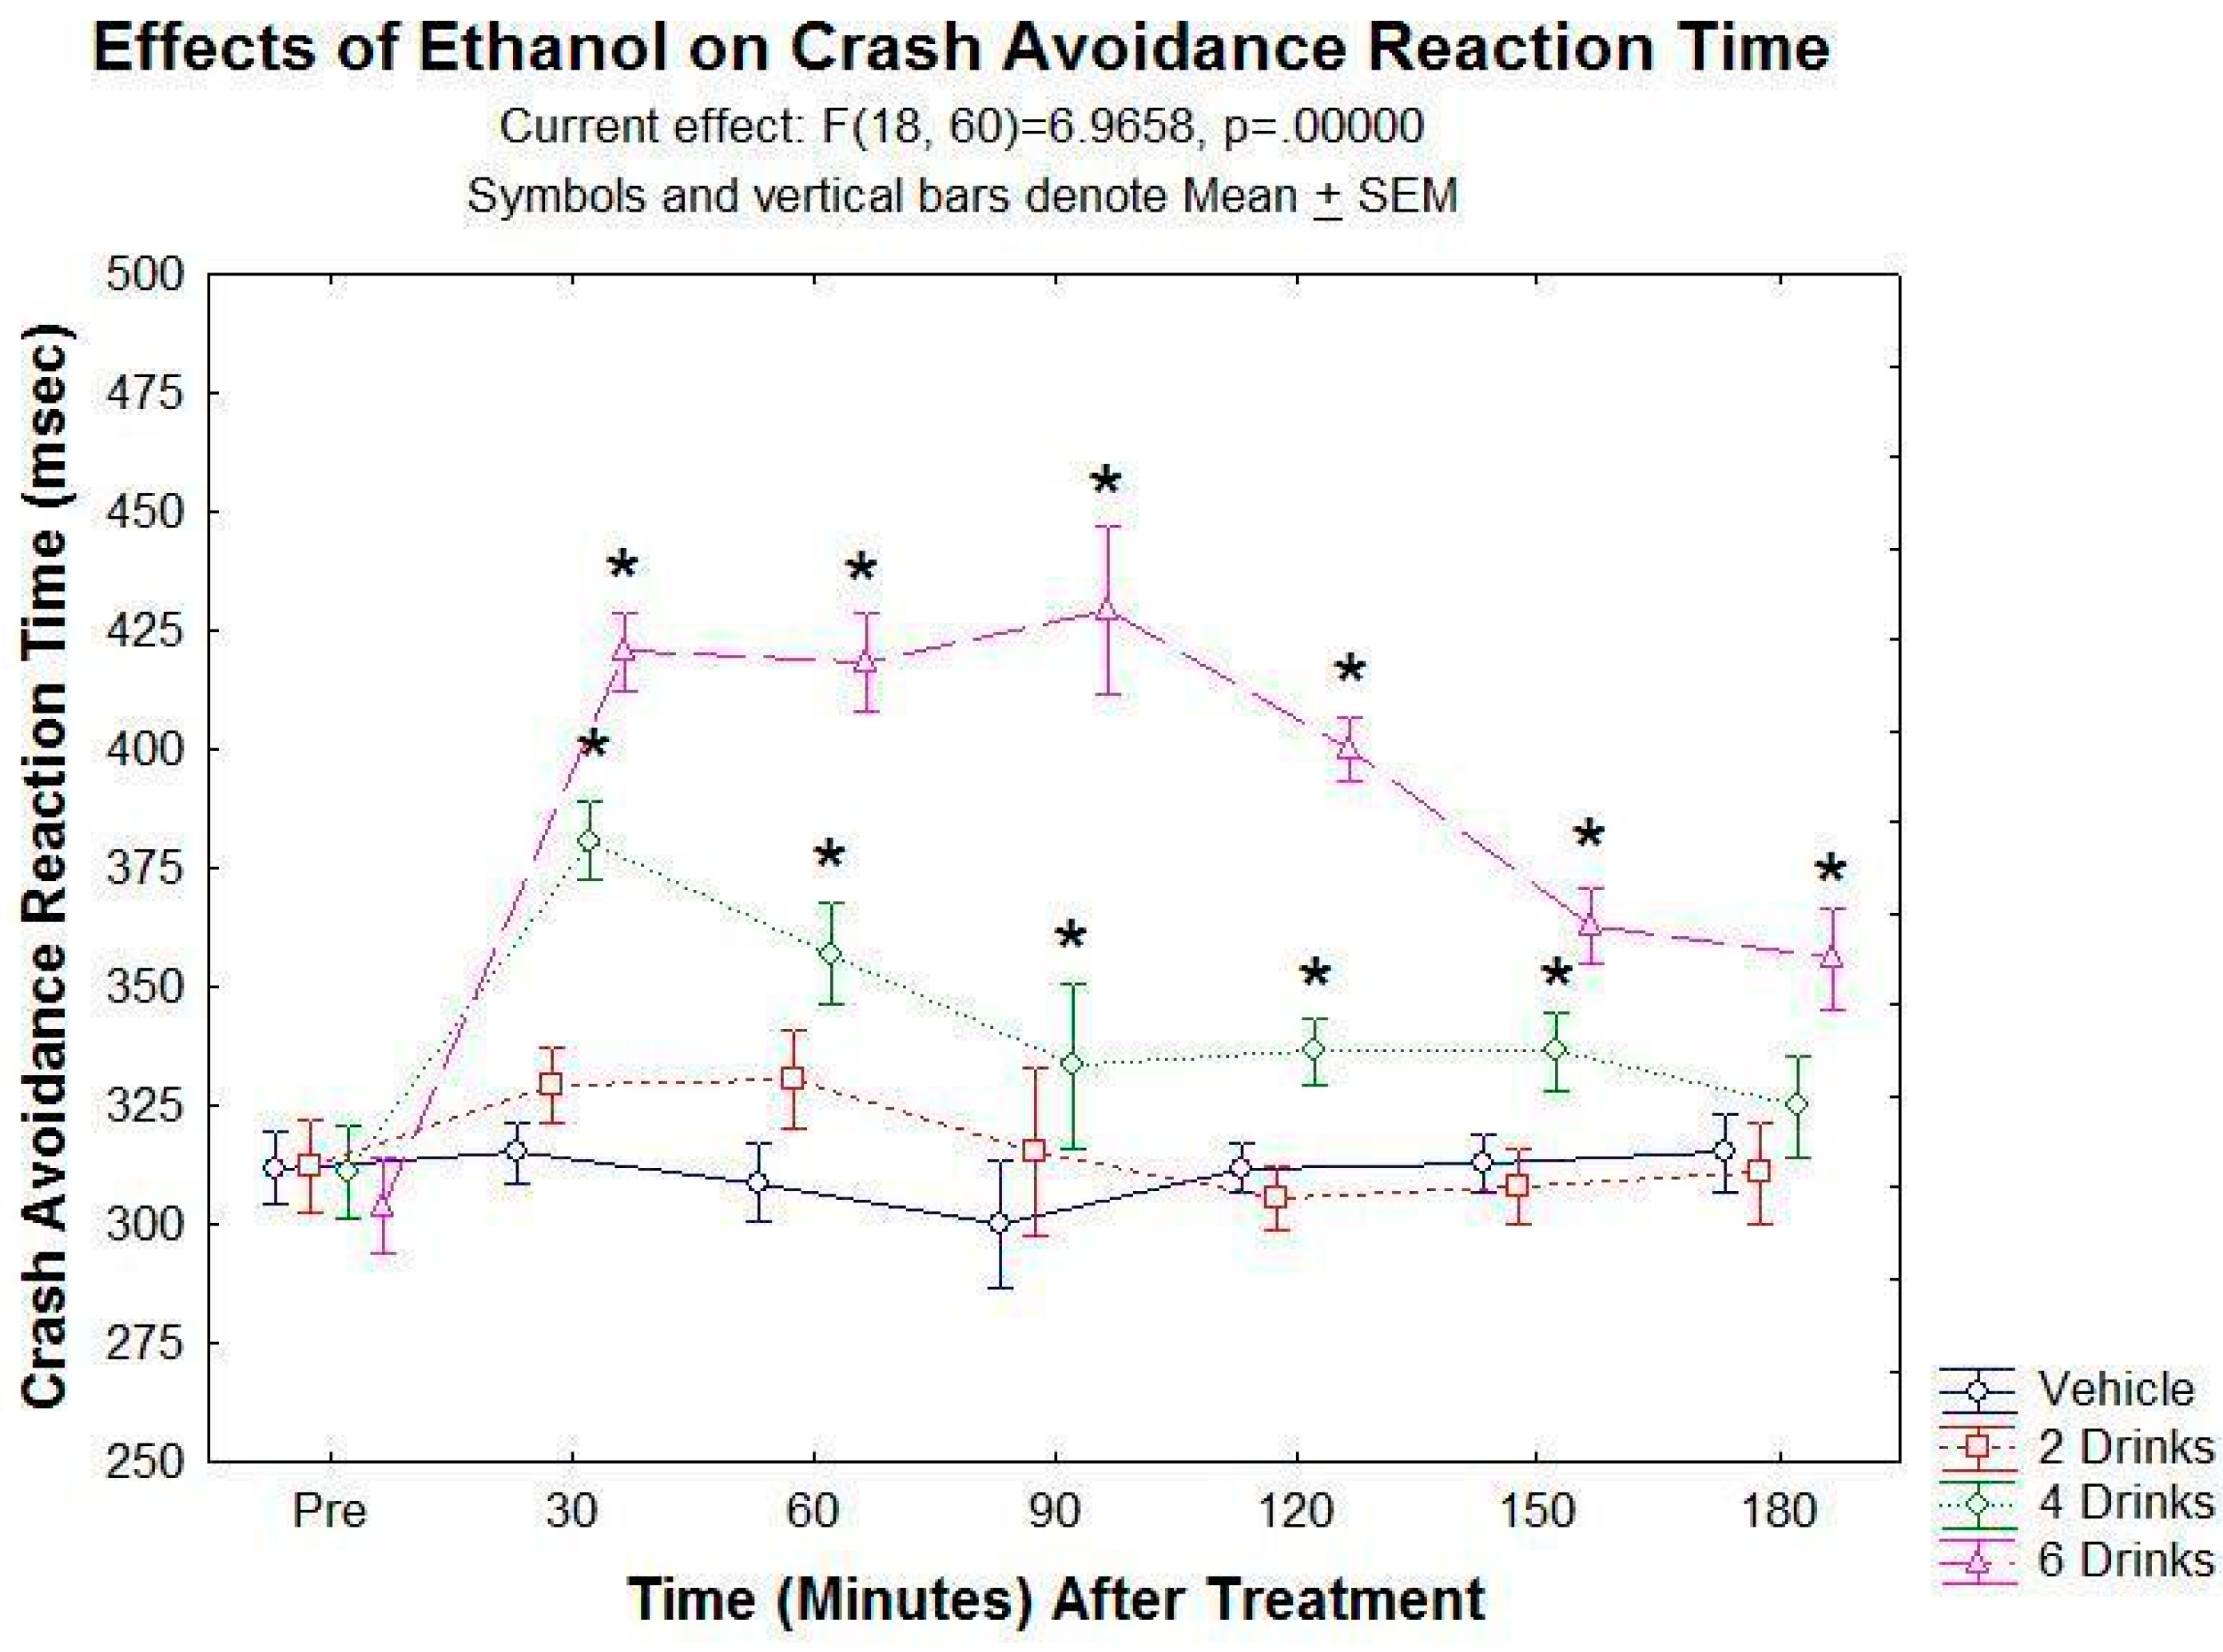
Figure 4 below illustrates the time course for the effects of different doses alcohol. In this graph, the
y-axis is the mean crash avoidance reaction time in ms, i.e., the time to initiation of a 5 degree steering response; the
x-axis is the time (in 30 min epochs) after treatment with vehicle, two, four or six drinks. As can be seen, vehicle treatment had no effect on crash avoidance reaction time. Alcohol significantly increased crash avoidance reaction time in both a dose-dependent and time-dependent manner. Statistically, there was a significant main effect for ethanol dose (F(3,10) = 56.61,
p < 0.05) and a significant main effect for time (F(6,60) = 16.49,
p < 0.05); and a significant ethanol dose–time interaction (F(18,60) = 6.97,
p < 0.05). Post hoc Student–Newman–Keuls (SNK) tests revealed significant increases in reaction time (compared to vehicle treatment) following four drinks or six drinks at several times post-treatment.
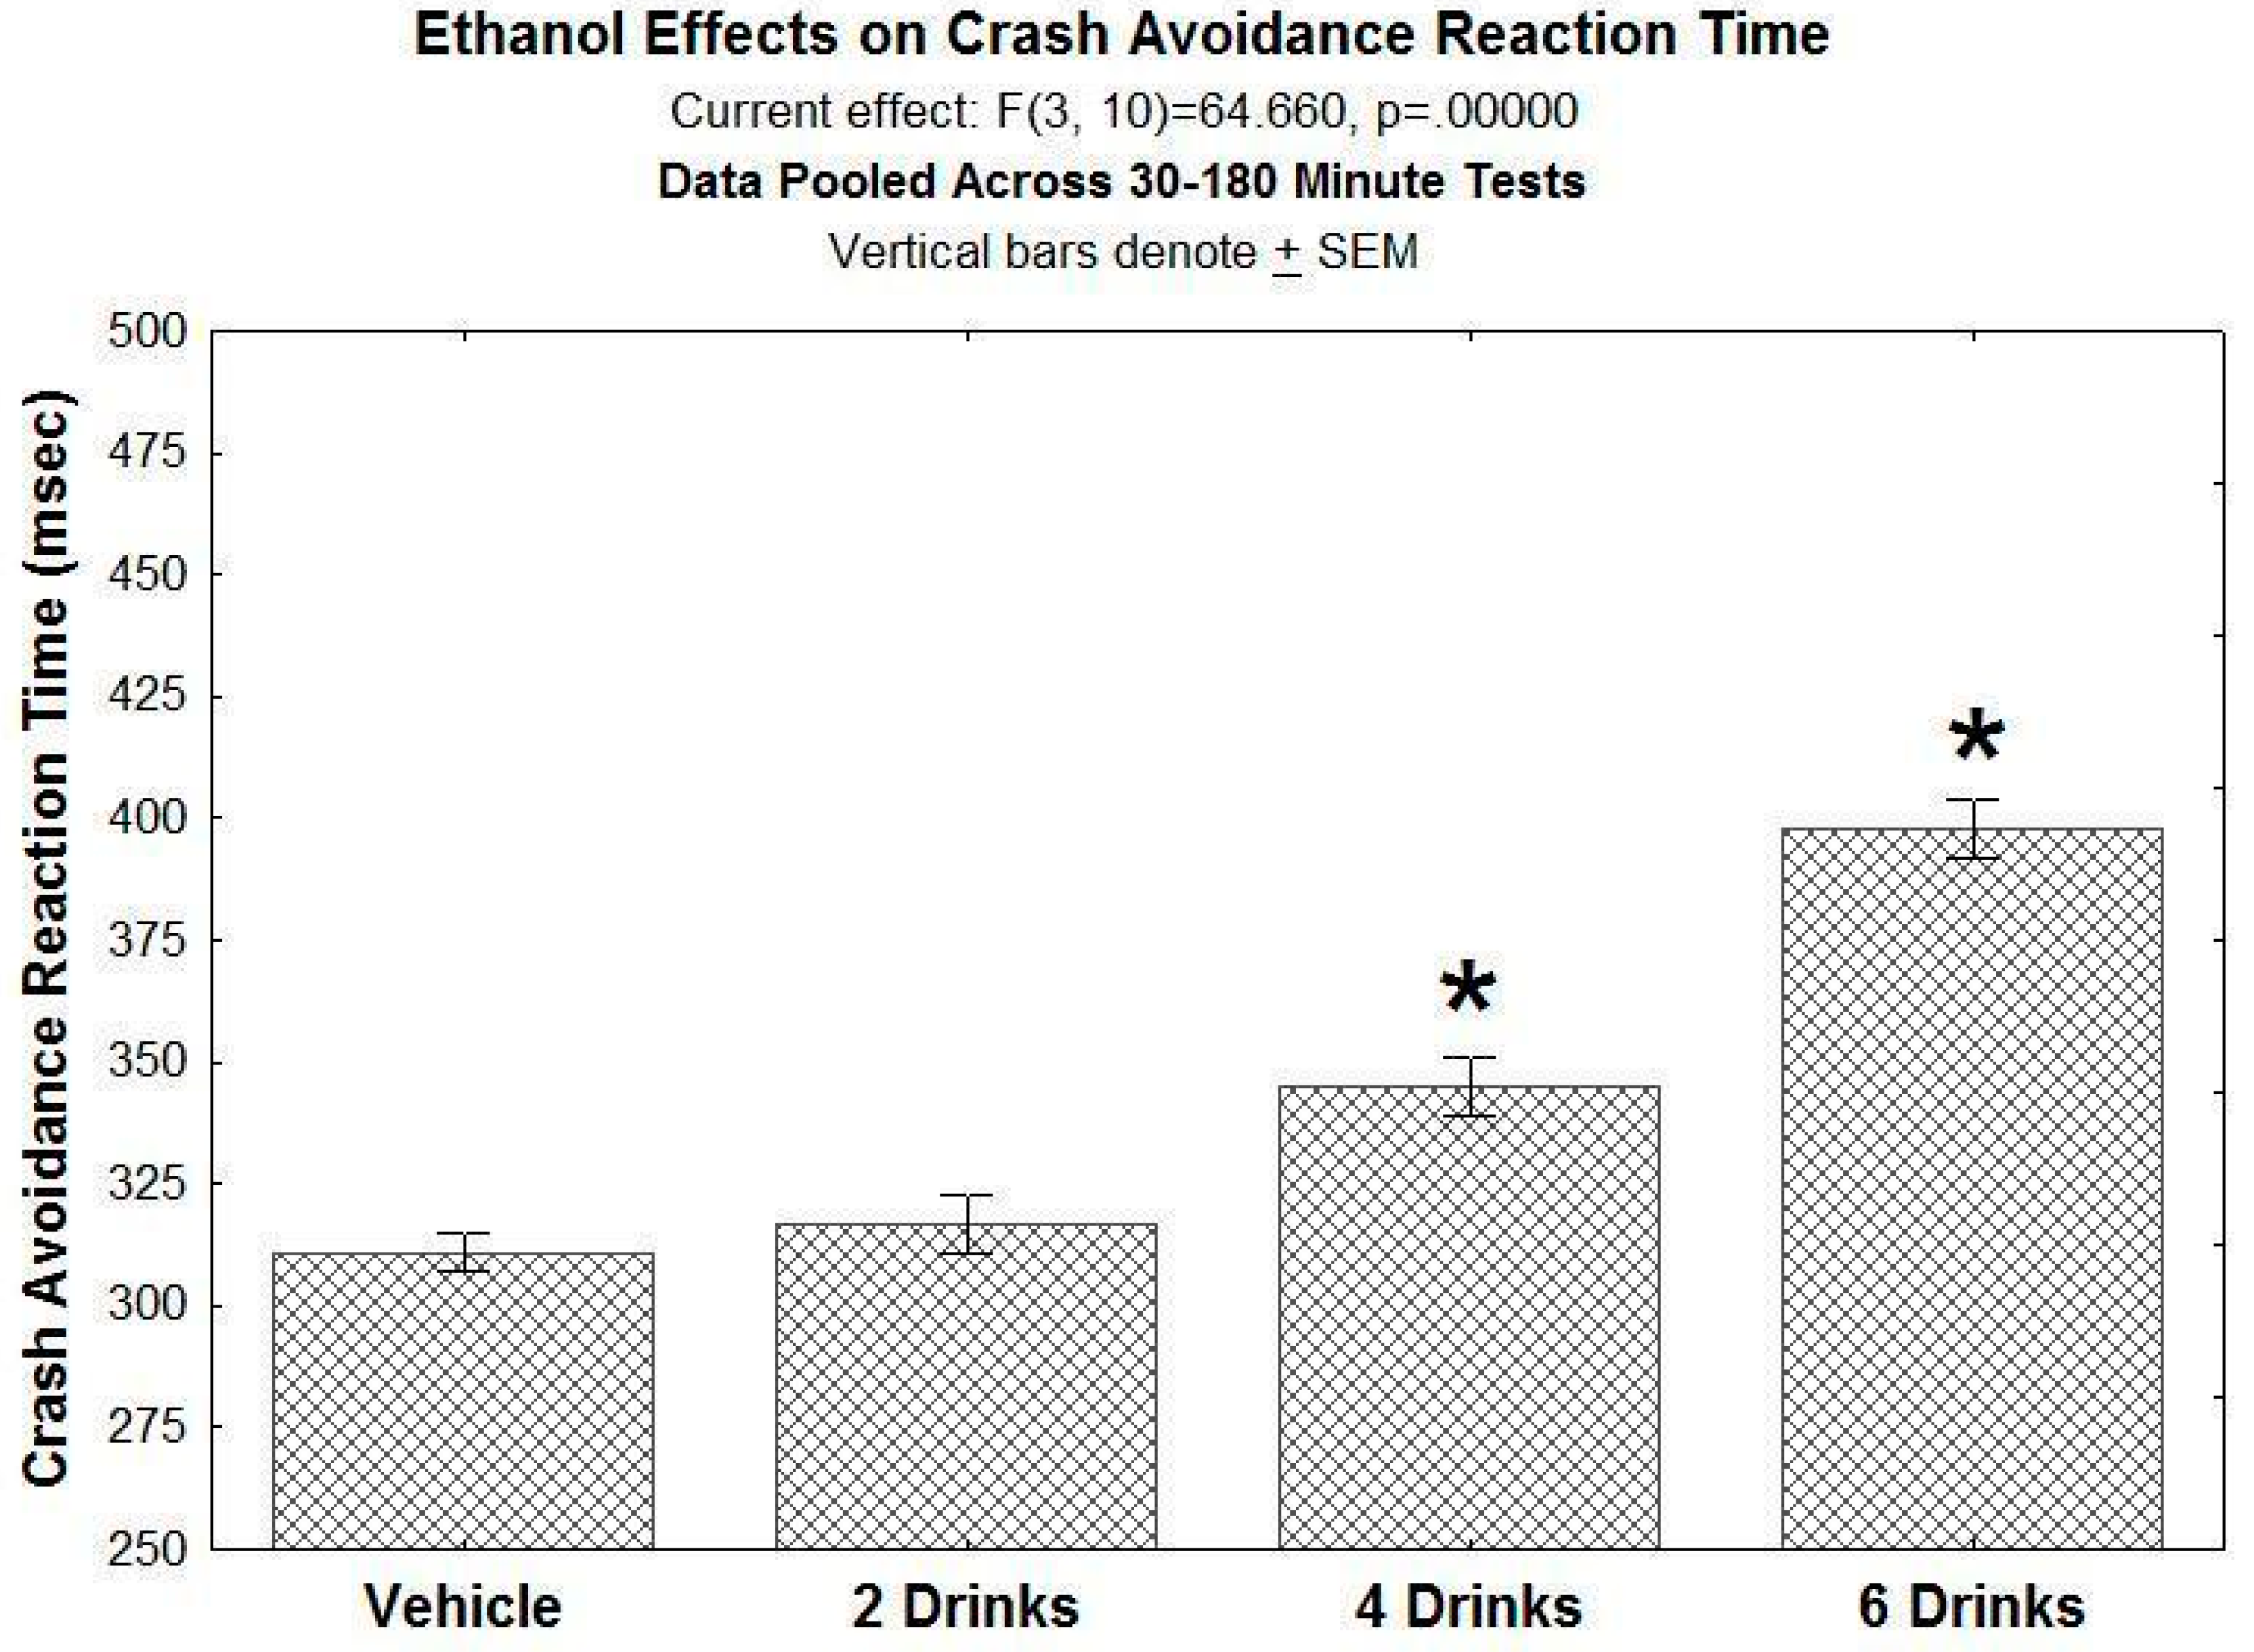
Figure 5 depicts the dose–response plot for the effects of ethanol on crash avoidance reaction time for the period 30–180 min post administration. As can be seen, ethanol produced a dose-dependent increase in crash avoidance reaction time. Statistically, there was a significant effect of Ethanol dose (F(3,10) = 64.60,
p < 0.05); post hoc SNK comparisons revealed that both four drinks (6 ounces of vodka) and six drinks significantly increased crash avoidance reaction time when compared to vehicle-treated controls over the same period.
BAC concentration measurements using the two BAC Track devices were in strong agreement, with a correlation of r = 0.98 across the multiple BAC determinations (data not shown).
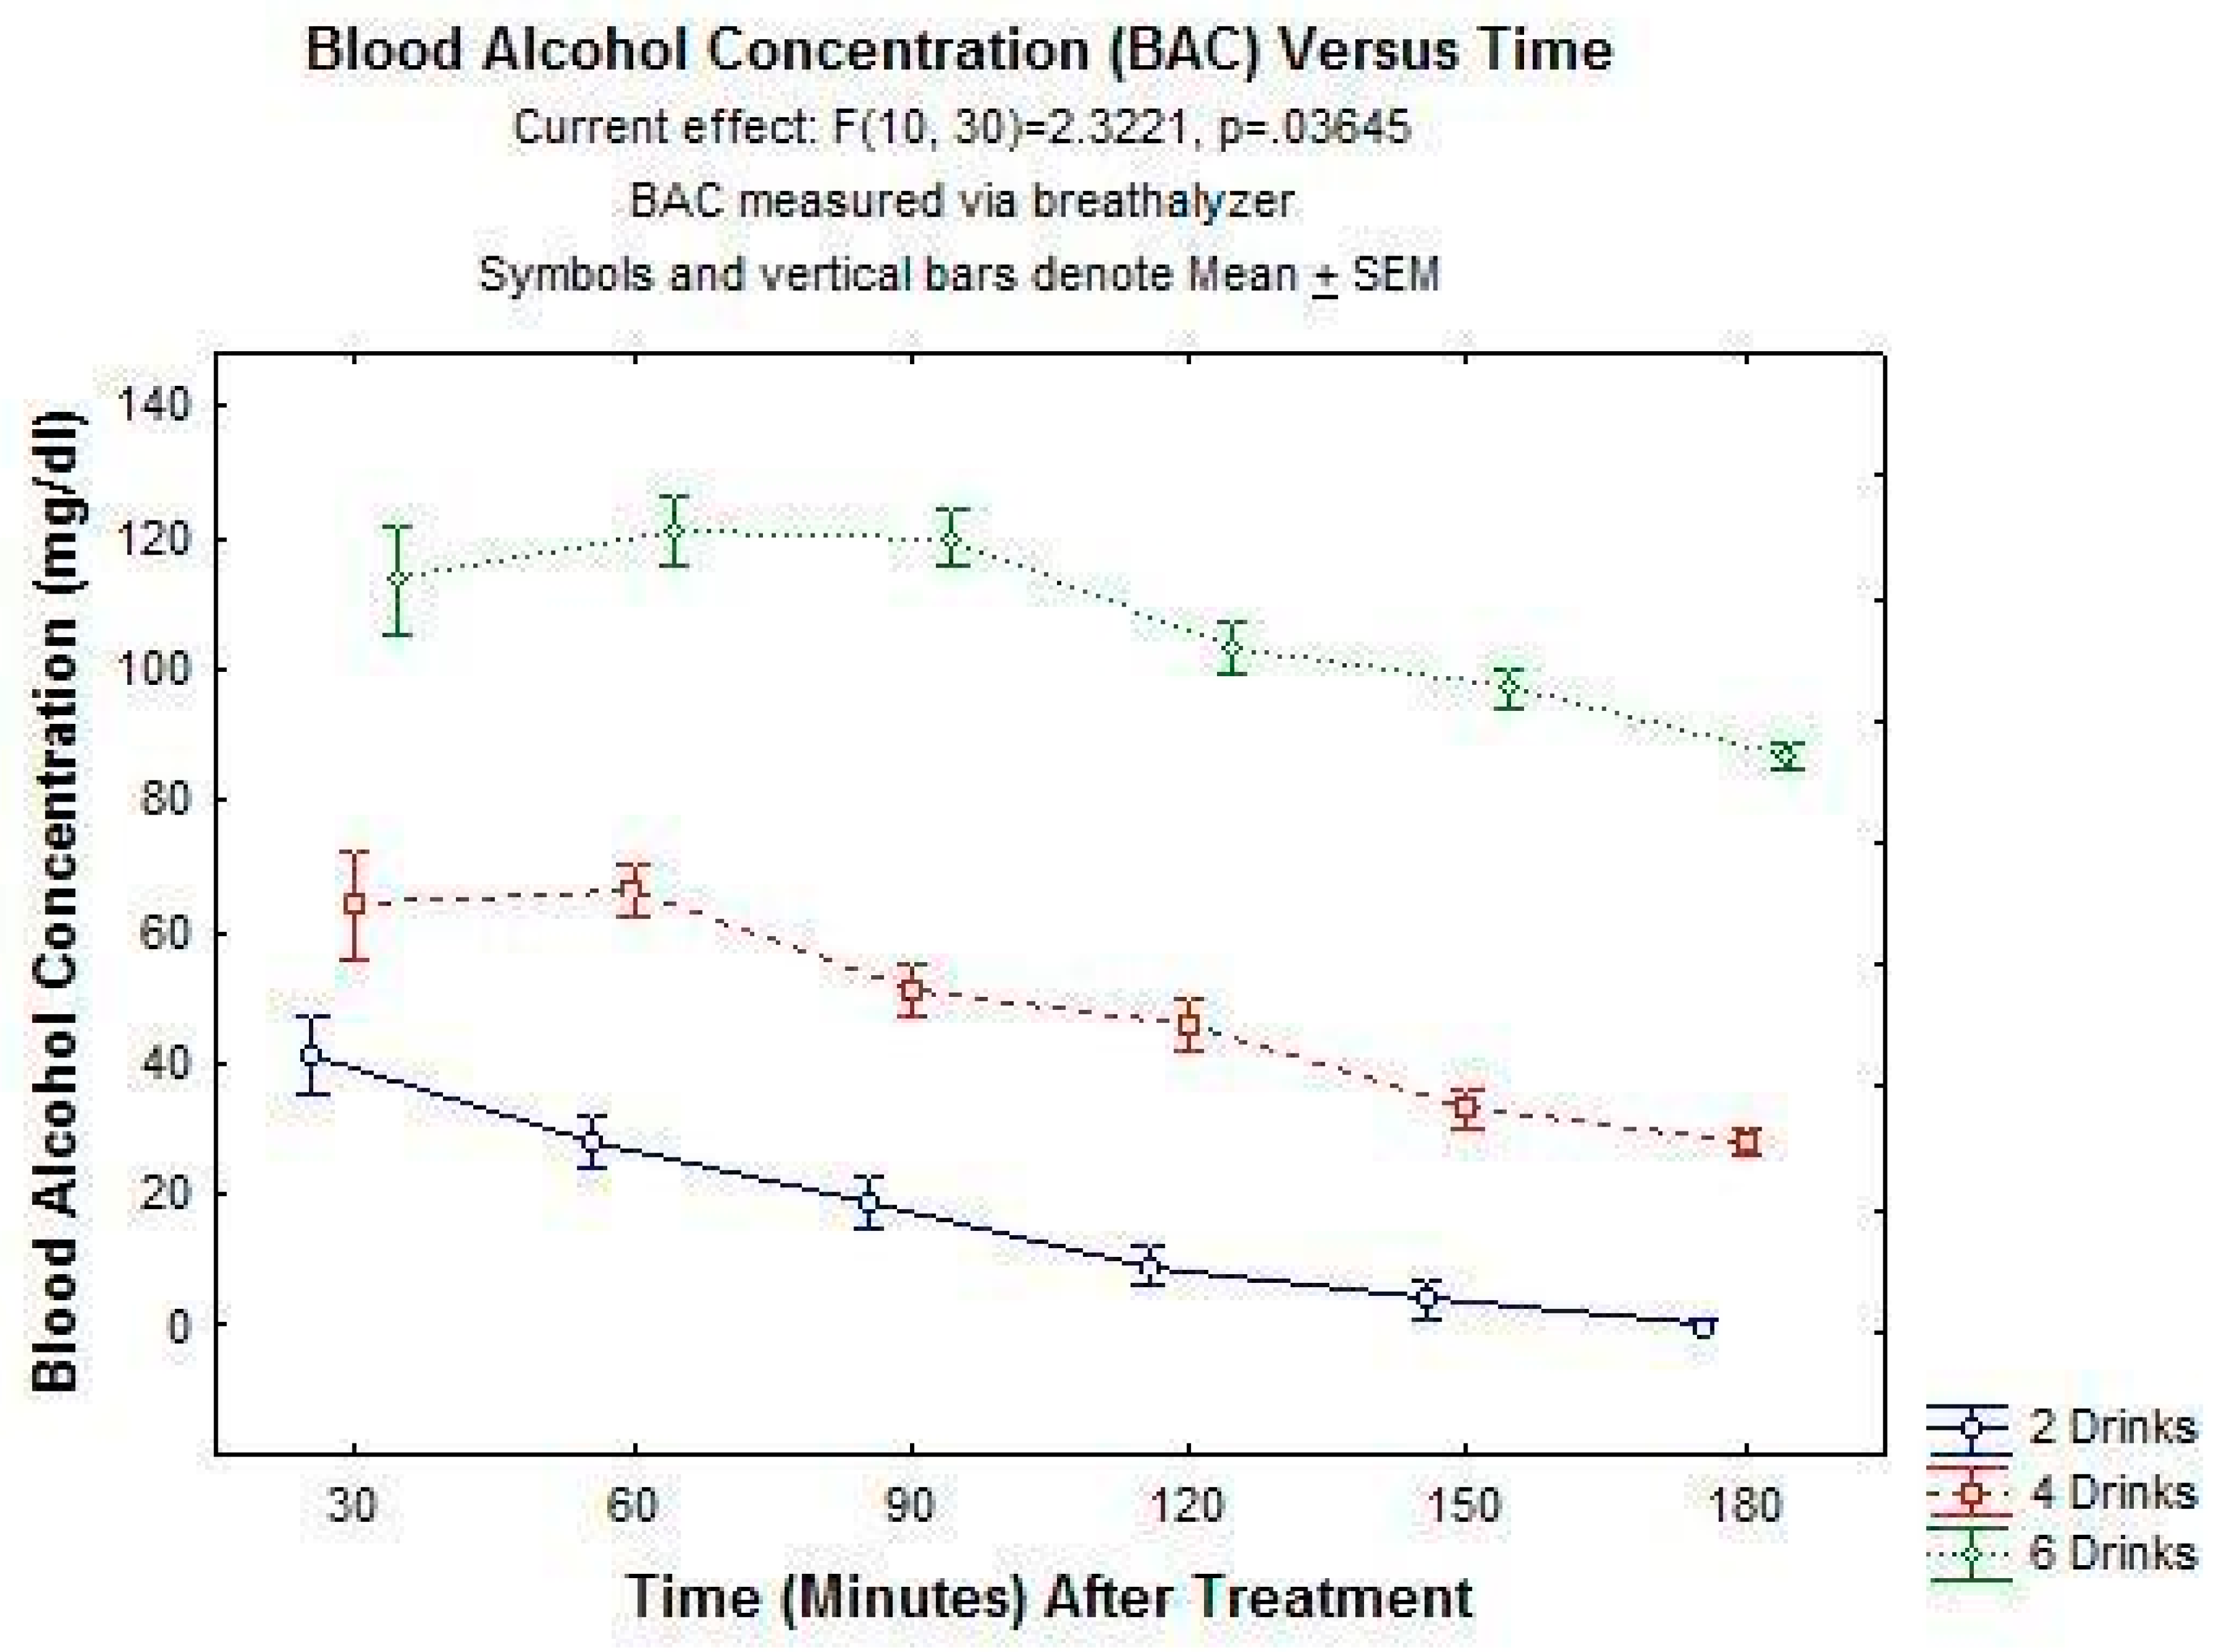
Figure 6 below depicts the ethanol concentrations for the 3 h post-treatment period for the three ethanol doses. As can be seen, the peak ethanol concentration varied significantly with ethanol dose, but the fall in the concentration over time was similar across the three doses, consistent with the primarily zero order metabolism of ethanol (Pawan, 1972). Statistically, there was a significant main effect for ethanol dose (F(2,6) = 308.83,
p < 0.05) and for time (F(5,30) = 43.58,
p < 0.05); the ethanol dose–time interaction was also significant (F(10,30) = 2.32,
p < 0.05).
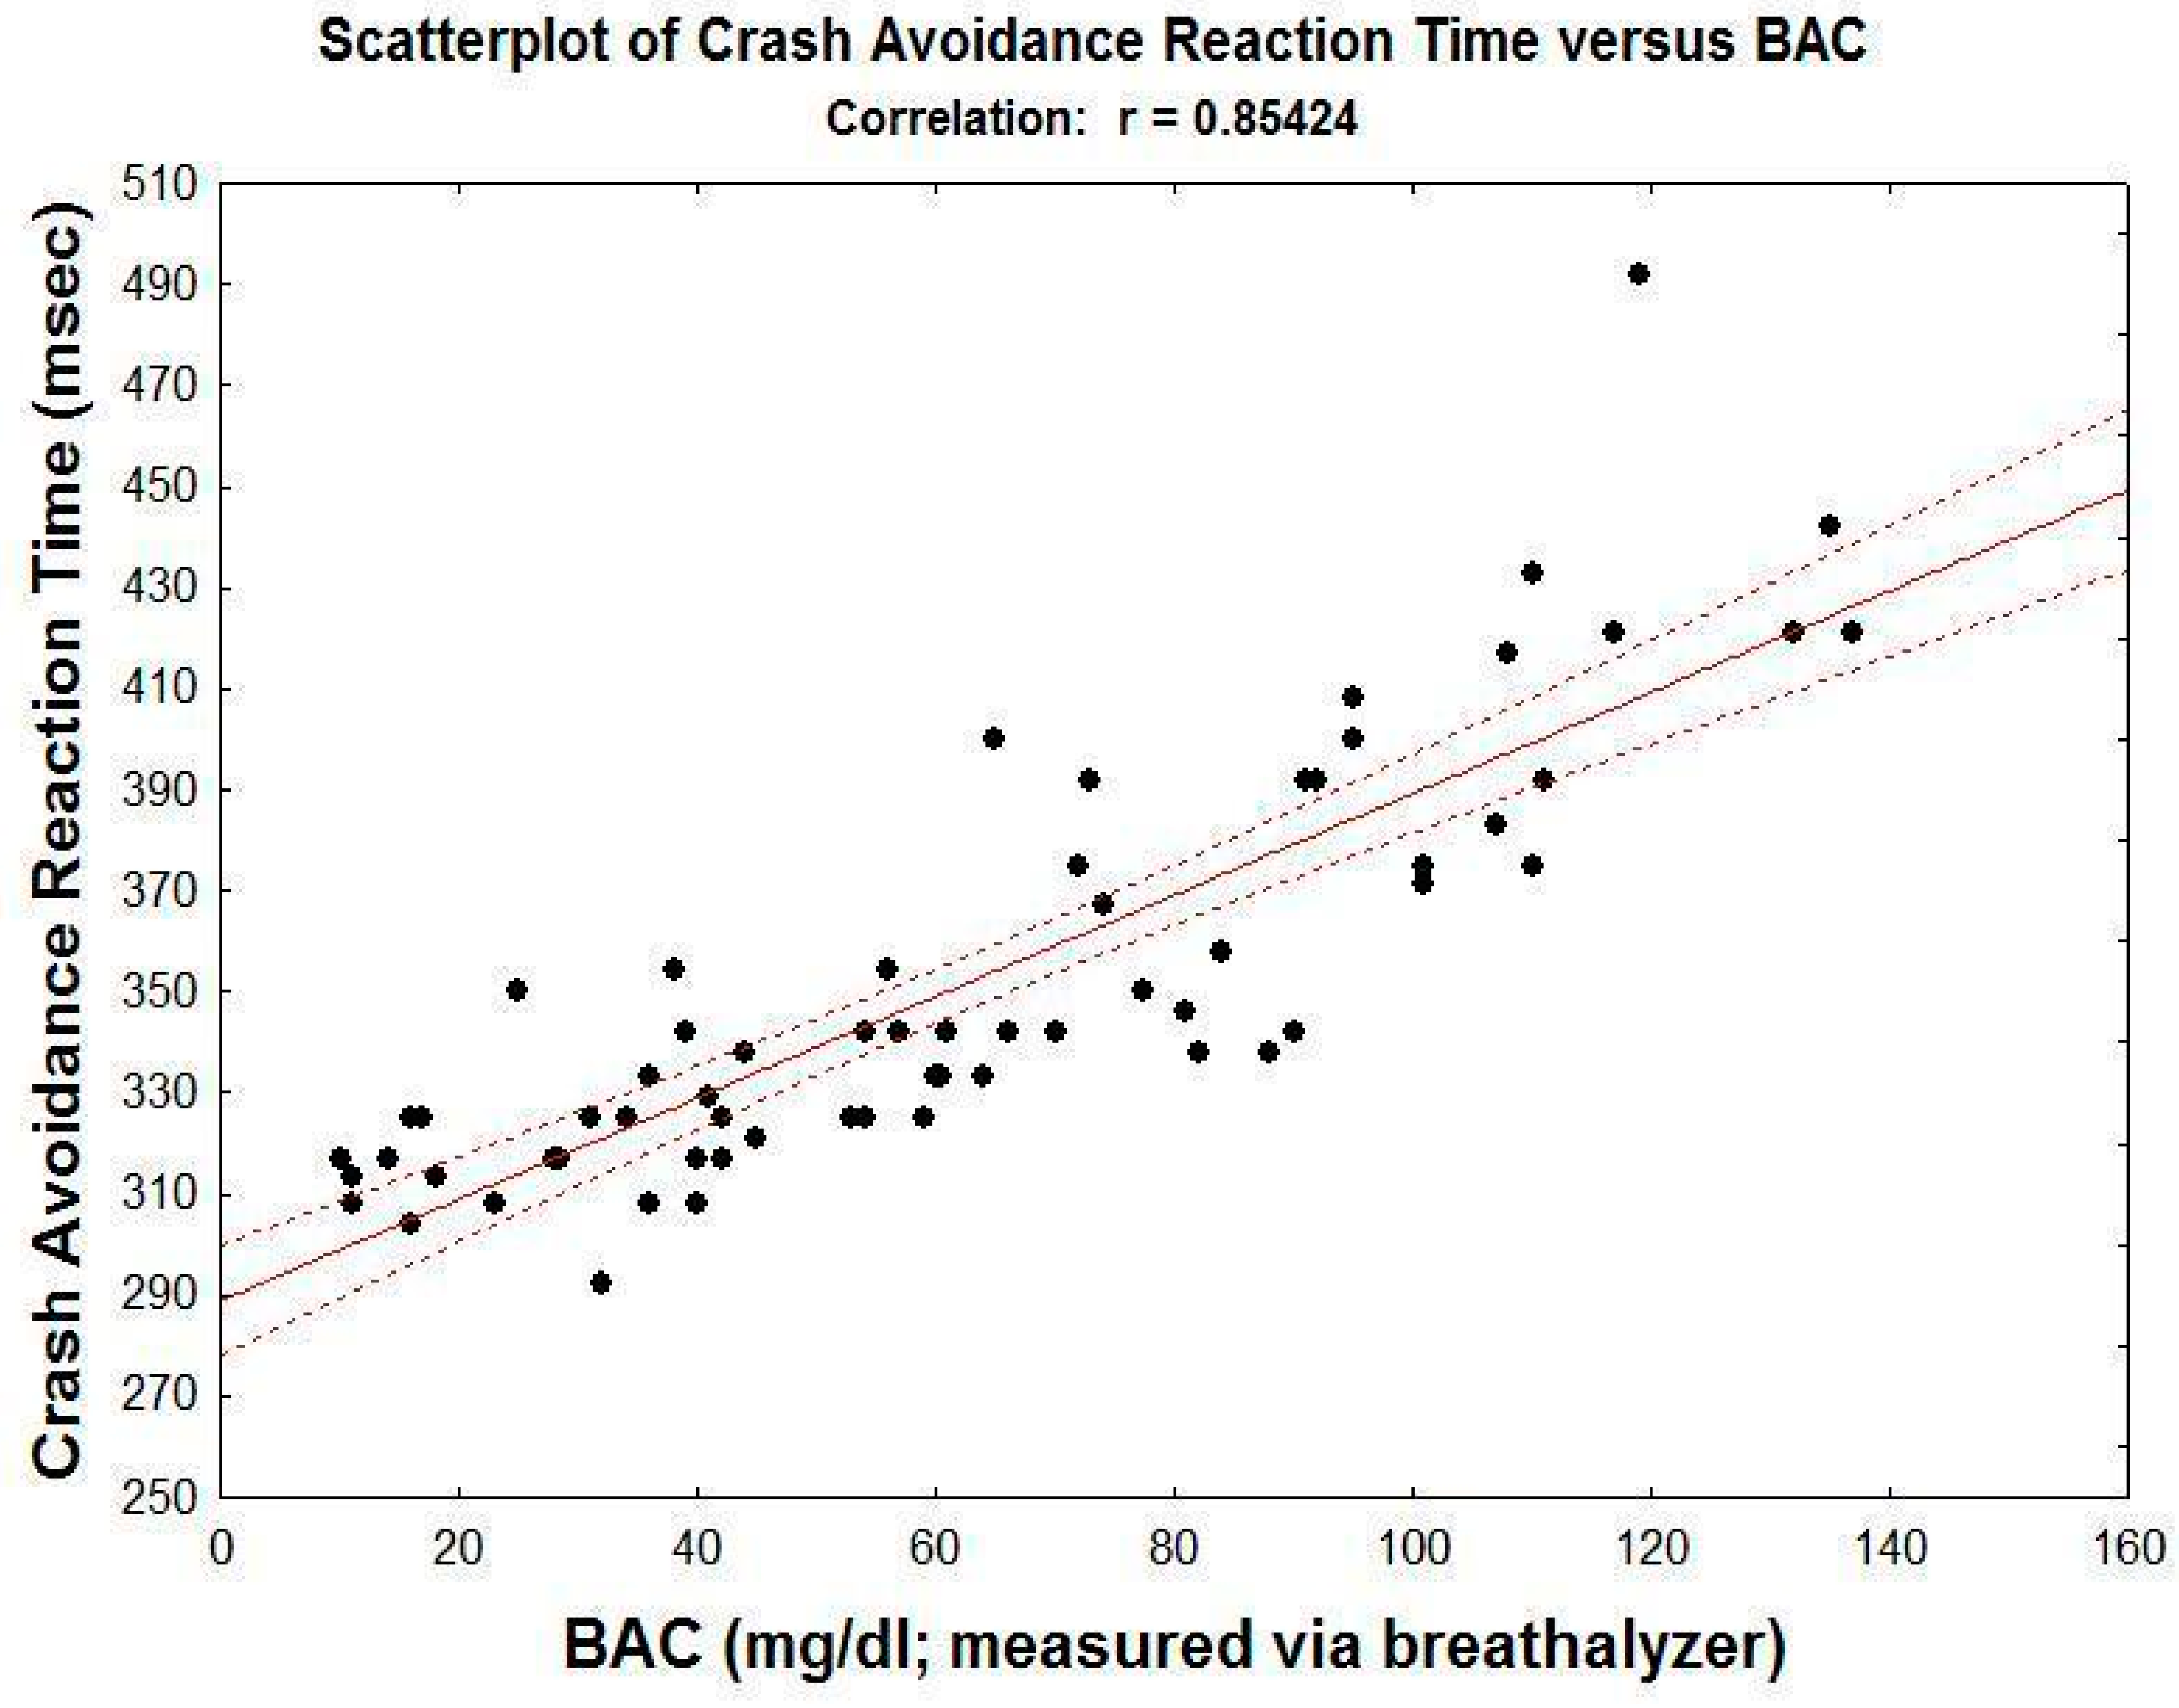
Figure 7 below is a scatterplot depicting the relationship between BAC (>10 mg/dL; the threshold for detection with the BAC Trak devices) and driving performance across multiple driving tests at various times following the alcohol treatments. As can be seen, there is a highly significant correlation (r = 0.854;
p < 0.05) between BAC and crash avoidance reaction time across the full range of BAC levels.
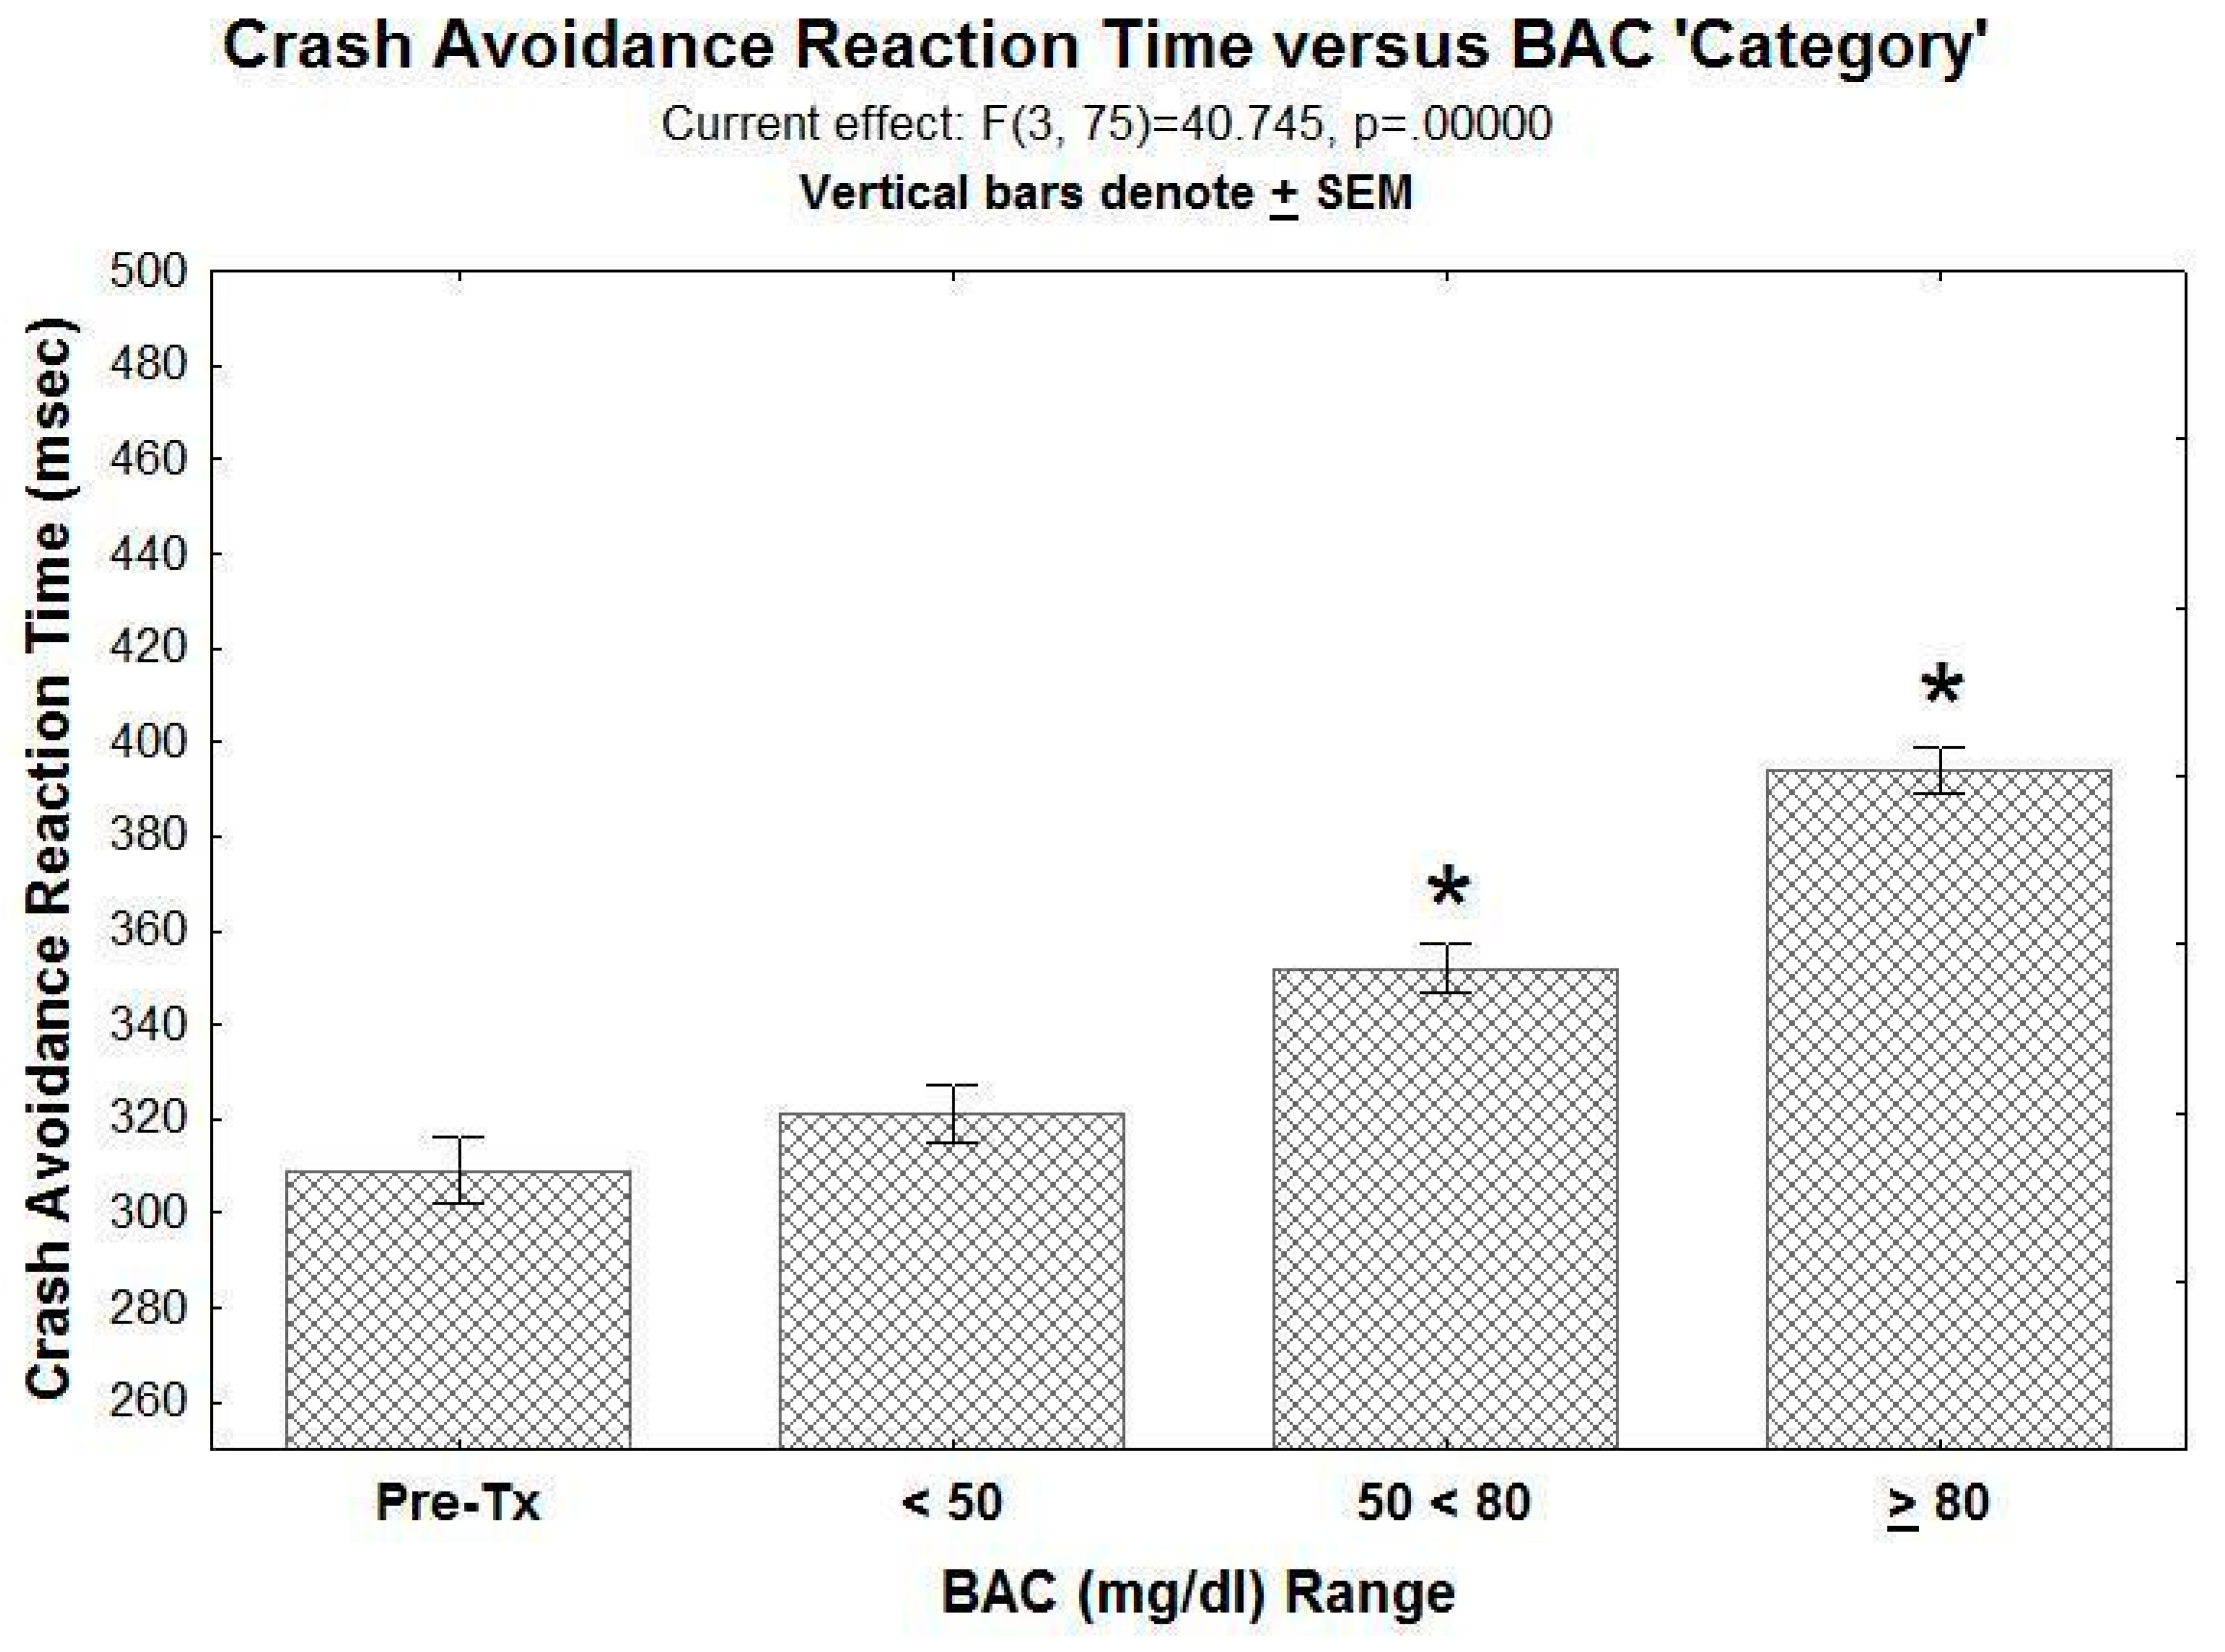
Finally,
Figure 8 below illustrates crash avoidance reaction time when the data are grouped into various BAC categories: (1) 0.0 mg/dL, i.e., from Pre-Tx drives, (2) >10 but less than 50 mg/dL, (3) ≥50 mg/dL but < 80 mg/dL and (4) ≥80 mg/dL. As can be seen, concentrations of 50–80 mg/dL significantly increased crash avoidance reaction time. Statistically, there was a significant effect for BAC category (F(3,75) = 40.75,
p < 0.05); post hoc SNK tests revealed a significant difference between Pre-Tx performance and both the BAC = 50–79.9 mg/dL group and the BAC ≥80 mg/dL condition.
4. Discussion
The problem of drunk driving has existed as a significant issue in society ever since the first automobile was built. Over the past 40 years, there have been significant improvements in vehicle crash safety features (air bags, anti-lock brakes, lane-keeping functions, etc.), and there have been public service campaigns to increase awareness of the problem. As discussed by Madden and McCambridge [
14], over the same time span alcohol marketing messaging often has run counter to the road safety messaging. Given the significantly greater resources of the latter, this creates a ‘David and Goliath’ situation, resulting in the situation where drunk drivers continue to take a significant number of lives on our roadways [
14]. The present paper argues that this sad statistic may relate in part to the lack of full appreciation of the adverse effects of moderate intoxication on driving ability and performance. This paper then describes a method for delivering a “Don’t drink and drive” message that is hands-on, fun and engaging, but perhaps most important, clearly demonstrates the significant adverse effects of even moderate alcohol intoxication.
The present paper describes the effects of alcohol on driving performance using a portable VR-based driving simulator choice reaction task for assessing defensive driving skills. The procedure is fun and easy to learn, and crash avoidance reaction times are robust and reliable using only a single demonstration subject. As expected, crash avoidance reaction time was increased by alcohol treatment in a dose- and time-dependent manner. Breath-based BAC determinations conducted immediately before testing revealed a strong correlation between BAC and crash avoidance reaction time. Finally, analysis of the crash avoidance reaction time based on the range of pre-drive BAC values revealed a significant increase in crash avoidance when BAC values ranged between 50 and 79.9 mg/dL, with an even greater increase in crash avoidance time when BAC values were ≥80 mg/dL, i.e., what is currently considered ‘alcohol intoxicated’ in most US states.
Increased reaction time is a potential cause for alcohol-related crashes, and several studies have reported that alcohol increases reaction time ([
33,
34,
35,
36]. These studies have included tests where the reaction time task was a secondary task in the driving setting. The present study uses a two-choice reaction defensive driving task in which the avoidance reaction task is a central component of the safe driving situation. In the present study, the reaction time on control/sober drives (i.e., Pre-Treatment or following vehicle treatment) was approximately 300–315 ms. The actual initiation of the steering response is closer to 260 ms (see
Figure 3), a reaction time that is comparable to the average ‘mouse click’ reaction time achieved by this subject (255–275 ms) in an online reaction time assessment test (
https://faculty.washington.edu/chudler/java/redgreen.html; accessed on 5 August 2021). Finally, it should be noted that in the present study, driving speed was held constant at 65 mph. This creates an opportunity to separate the potentially confounding effects of alcohol on driving speed (alcohol typically increases driving speed significantly) from the effects of alcohol on reaction time.
The present results support the argument that BAC values of 50 < 80 mg/dL should be included as part of the legal cut-off for drunk driving. This argument has been argued by several driving safety organizations (see Zohr et al [
7]) and has been supported by the results of previous open road [
24,
25] as well as simulator studies [
26,
27,
28]. The present study is the first to demonstrate the adverse effects of these relatively low alcohol concentrations using a simulator-based defensive driving choice reaction task. Given that reaction time is critical for avoiding a crash in many defensive driving situations, the present results would translate to an impaired ability to engage effectively in defensive driving maneuvers, and thus would increase the likelihood of a crash at BAC values 50–80 mg/dL alcohol. These findings are consistent with studies that have demonstrated reduced alcohol-related crashes after the legal BAC cut-off for impaired driving was reduced to 50 mg/dL [
20]. As has been argued previously [
17], from a policy and legal perspective, it also makes sense for the penalty for driving with a BAC 50–79.9 to be less severe than the penalty for driving with a BAC ≥80 mg/dL.
The second conclusion is more of a prediction, which is that public, hands on demonstrations using this VR-based driving simulator procedure-or something similar-could be a powerful, cool and user-friendly tool to use in combating the problem of drunk and buzzed driving, especially among younger drivers. A somewhat similar approach utilizing go-cart driving and ‘beer goggles’ has been promoted by the Innocorp Corporation as a way to increase appreciation of the dangers of drunk driving [
37]. Similarly, we have used beer goggles in both research projects [
31] and in public service presentations (“Don’t text and drive in the motor city”) to demonstrate how visual disturbances can exacerbate distracted driving problems (i.e., texting while driving). Although useful, these beer goggle approaches focus only on the visual problems produced by alcohol (and other drugs) and yet, as demonstrated in the present study, other effects of alcohol, such as those on reaction time, are also critically important for safe driving.
This VR driving experience is fairly modest in terms of the VR effects, i.e., it does not simulate your whole body moving through space as in, for example, when someone is interacting with others via the Internet in a multi-party virtual game situation. As such, the need for VR adaptation by the subject is minimal. Indeed, VR-naive subjects adapt rapidly to the VR aspect of this task. It is also the case that, in contrast to many more interactive game situations, participating in this VR game produces little or no VR sickness. We are currently pursuing an answer to that question now that the COVID-19 pandemic is settling down. Initial studies suggest that control driving is comparable for the VR headset when compared to driving while watching on a flat screen instead of watching via the VR headset. However, of course, the VR experience is a bit ‘cooler’.
In terms of implementing law and policy changes, sometimes seeing is believing, which makes this the first step. As recalled by retired Los Angeles Police Department (LAPD) officer Thomas Page, the value of a ‘hands on’ approach to understanding the effects of alcohol was demonstrated in the 1980s when officers from the LAPD met with a cohort of judges and prosecuting attorneys in LA County and got them intoxicated to a BAC level of 80 mg/dL, at a time when the BAC cut-off for drunk driving was then still 100 mg/dL. Experiencing the effects of 80 mg/dL for themselves, and seeing their colleagues experiencing the effects of 80 mg/dL, was strong evidence, and led to significantly increased support for implementation of the BAC 80 mg/dL cut-off [
38]. In a similar manner, a greater appreciation of the dangers of drunk driving, even when the BAC is less than the current legal cut-off for intoxicated driving (80 mg/dL in Michigan, for example), might come from hands on experience with the effects of alcohol using a driving simulator. We have beta-tested this ‘hands on’ approach in internet ZOOM presentations as part of a university class, and also for an advocacy group (Michael Tobias and the Michigan Coalition to Reduce Underage Drinking; mcrud.org) and a State of Michigan legislator (Legislative Director Megan Kiefer from the Office of State Legislator Abdullah Hammoud, Dearborn). We plan to take this portable VR-based driving simulator ‘on the road’ and bring “Move the BAC cut-off for drunk driving to 50 mg/dL” messaging [
17] to community groups as soon as possible after the current COVID-19 situation. This public outreach approach has been highlighted recently in a feature article in the
Detroit News by Neil Rubin [
39].
It is also the case that a driver’s self-perception of the level of her/his intoxication is an important factor that sometimes results in a ‘buzzed’ driver getting behind the wheel and driving [
40], i.e., “I’m a little tipsy, yeah, but I think I’m still OK to drive”. That perhaps is one of the more important aspects of the approach described in the present paper, since the driver/subject may feel pretty good, i.e., ‘unaffected’, after only a few drinks, but when driving performance is directly assessed, it becomes clear to the subject that her/his ‘buzzed driving’ is indeed drunk driving.
The approach and results described in the present studies could be used to complement many of the strategies that are currently used to reduce drunk driving today [
21,
41,
42]. Use of BAC-based ignition lockout devices has been permitted in all 50 states since 2012, and has been proposed as part of the federal government infrastructure bill ([
43]; see also [
6]. In addition, designated driver campaigns have been in existence for several years and have been shown to reduce alcohol use by, and subsequent intoxication of, the designated driver [
44]. Hafner and colleagues showed that viewing mock alcohol-related car crashes, combined with authoritative and accurate information regarding the adverse effects of alcohol on driving, significantly reduced the likelihood to drink and drive [
45]. It is anticipated that a hands-on and user-friendly, “Don’t drink and drive” campaign involving real alcohol intoxication in a driving scenario will further reduce driving while intoxicated.
The present study has several limitations. Perhaps first and foremost is the fact that only one subject was studied, and the study was conducted in an open label manner. It is correct that the data are from only one subject. This was because of the ‘lock-down’ associated with the COVID-19 outbreak. However, two things should be noted. First, this subject was tested on multiple occasions and under identical conditions with each of the various treatment conditions. Second, pilot studies in other subjects, although far less extensive in their scope, have also revealed similar control response times and impaired crash avoidance reaction times with BAC levels 50–80 mg/dL. Future studies to replicate and expand upon these findings are needed; these studies are indeed planned.
Another limitation is that the present study analyzed only one component of driving safety, i.e., the latency for a steering avoidance response to a potential crash situation. Although the debilitating effects of alcohol on this measure are clear and dramatic even at low ethanol concentrations, the effects of alcohol on other measures of driving safety, e.g., driving speed, braking time, decision-making, should be evaluated in future studies. Nonetheless, these studies demonstrate a significant impairment of defensive driving behavior at relatively low BAC levels.


