
Considering Space Syntax in Bicycle Traffic Assignment with One or More User Classes


1
Korea Institute of Science and Technology Information, Daejeon 34141, Korea
2
Department of Civil and Environmental Engineering, The Hong Kong Polytechnic University, Hong Kong, China
3
Department of Urban Planning, University of California, Los Angeles, Los Angeles, CA 90095, USA
4
Department of Land Surveying and Geo-Informatics, The Hong Kong Polytechnic University, Hong Kong, China
5
AECOM, San Francisco, CA 94104, USA
*
Author to whom correspondence should be addressed.
Sustainability 2021, 13(19), 11078; https://0-doi-org.brum.beds.ac.uk/10.3390/su131911078
Submission received: 24 August 2021
/
Revised: 30 September 2021
/
Accepted: 5 October 2021
/
Published: 7 October 2021
(This article belongs to the Special Issue Challenges in the Integrated Physical–Virtual Modeling of Sustainable Smart Cities)
Abstract
:Modeling bicycle traffic assignment requires consideration of the various factors and criteria that could play a role in a cyclist’s route decision-making process. However, existing studies on bicycle route choice analysis tend to overlook the less tangible or measurable aspects of cyclist route decision-making, such as a cyclist’s cognitive understanding of the network and a cyclist’s biking experience. This study explores the applicability of space syntax as a route cognitive attribute in a bicycle traffic assignment model. Since space syntax is a tool that links urban spatial layout to human movement, the results of a space syntax model can be used as a cognitive attribute for modeling bicycle movements with explicit consideration of the cognitive complexities of navigating through the environment. In developing a bicycle traffic assignment model, we considered relevant attributes such as route cognition, distance, and safety and integrated multiple user class analysis to reflect different biking experience levels. Numerical experiments using the Winnipeg network are conducted to demonstrate the applicability of the proposed bicycle traffic assignment model with one or more user classes.
1. Introduction
It is well known that cycling can improve urban mobility, livability, and public health as an alternative mode of transportation. In addition, cycling can help to reduce impedance among competitive modes and therefore can improve the integration of multi-modal transportation networks [1,2]. Although the share of people who use bicycles as their primary mode of transportation was slightly more than 1% in the 2017 National Households Travel Survey (NHTS) in the United States [3], cycling is gaining popularity.
In terms of the route choice model, bicycle traffic route choice modeling requires more affection factors compared to route choice modeling for motorized vehicles. Although cyclist behavior is complex and not yet fully understood, the general consensus in the research community indicates that cyclists choose routes based on distance, the number of intersections, road grade, bicycle facility, safety, weather conditions, and land use [4,5,6,7,8,9,10]. However, existing bicycle studies tend to focus on observable attributes associated with street segments and intersections, and some existing studies that do consider route cognition are still in a preliminary stage. For example, Hood et al. [11], Ryu et al. [7], and Wang et al. [12] considered turn frequency/delay in route utility functions, while Menghini et al. [13], Broach et al. [4], and Ehrgott et al. [14] considered bicycle route signs or recommended bike routes as a proxy for cyclist awareness, ease, and/or suitability to navigate new/unknown neighborhoods. Conventional bicycle route choice set generation has also considered route complexity as a factor using a hypothesized cognitive structure in the labeling technique [11,15]. They overlook the less tangible or measurable aspects of cyclist route decision-making, such as a cyclists’ cognitive understanding of the network. In this study, we explore space syntax as a route cognitive attribute along with route distance and route safety and one or more user classes with varying levels of cycling experience in a bicycle route choice model.
Space syntax can provide a measure of route cognition to help quantify cyclist perceptions of the network. Space syntax analyzes street networks to figure out how people move in urban environments. Instead of using social activity to discern human movement patterns in urban settings, space syntax focuses on the structure of the built urban environment. This is a reverse approach to study urban morphology and human behavior [16,17]. Space syntax is particularly applicable to bicycle traffic assignment because it is the analysis of the configurations of space based on human spatial perceptions. The configurations of spatial layouts hold meaning to the way people travel because people do not consciously analyze configurations even though they can understand them [17]. This notion is highly relevant for cyclist route choice decision-making, especially when considering route cognition as a criterion in a bicycle traffic assignment model.
Although the primary objective of this study is to explore the applicability of space syntax as a route cognitive attribute, we also consider other relevant criteria (route distance and route safety) and incorporate one or more user classes into the bicycle traffic assignment model, as indicated by some studies that determined that cycling experience and preferences can have an impact on cycle route choice to some extent (e.g., [8,18]). Route distance is a composite measure of not only the sum of link distances along the route but also the delays at signalized intersections. Route safety is based on the bicycle level-of-service used in traffic engineering. It is also a composite measure of the segment bicycle scores and intersection bicycle scores along the route. As for the analysis of one or more user classes, we acknowledge that there are different types of cyclists with different levels of biking experience and factor that information into the model.
2. Space Syntax Model
The space syntax model is a set of theories and technologies to derive and analyze the spatial configuration of urban or architectural spaces [17]. Space syntax also calculates the significance of space structure by using the accessibility of the total network [19]. In space syntax analysis, a spatial layout can be broken down into an axial map featuring two-dimensional convex spaces connected by a network of the least number of longest axial lines. The importance of axial lines can be measured through a variety of network centralities, such as depth and the least number of vertices between axial lines. Mean depth is then selected to understand the relationship between the singular axial lines to the rest of the network [20]. The ability of the space syntax model to quantify each axial line’s network accessibility is one of its greatest advantages. Because of this advantage, space syntax is applied to many different network models, such as the pedestrian model [21,22,23,24], the bicycle model [20,25,26,27], and the vehicle model [28,29].
In the past, the space syntax model has been criticized for its treatment of turn angles and for its translation incompatibility with transportation networks. Since space syntax categorizes both slight turns and sharp turns as one step, it does not fully capture the smoothness of a route as it transitions from one convex space to another. In addition, it is not an easy task to create an axial map from a transportation network because a long straight line on a GIS map could be composed of several transportation links (e.g., see Paul [30] for a discussion on the limitations of axial analysis for modeling motorized vehicular movement in the context of route choice analysis). To resolve this issue in a GIS network, Turner [31] introduced the angular-based space syntax model, and Turner and Dalton [32] developed the angular-based shortest path model. In essence, the model computes the turning effect with the different angles between two links on a junction. Figure 1a provides an example of the different turning types between two links. A 90-degree angle is assumed to represent one complete turn. Following the space syntax principle, spaces are first broadly perceived as discrete components (i.e., a segment or a link in a transportation network). The depth (or turning) from one segment (i.e., a link in a transportation network) to other links can be directly measured by the sum of the angles between two links. The total depth (TD) of link a to all other links can be measured by summing the angular-based depth to other links, and the mean depth (MD) value is given by the total depth divided by the total number of links minus 1 (N−1). This MD value measures an average depth of a particular link.
where is the total depth of link a; A is the set of links; is the angular-based depth from link a to another link, link b, based on angle ; is the mean depth value of link a; and N is the number of links.
Using the concept of angular-based turning from Figure 1a and the example network in Figure 1b–d provides an example of computing TD and MD for Link 1. From Figure 1b, we can observe that Link 2 has the lowest MD. This means that it takes an average of 1.25 turns to go from Link 2 to other links. It also means that Link 2 has a higher accessibility or cognitive link. For more details, the readers should refer to Turner [33].
Space syntax is highly applicable to bicycle traffic assignment analysis because it can provide a route cognition attribute. People can subconsciously understand configurations such as street networks, and this subconscious understanding may reveal their preferences for routes. From space syntax analysis, transportation links are measured by their connectivity to the other links, so the length of each link becomes irrelevant to the analysis. Thus, cyclists are more concerned about the quantity of axial lines than the distance in any given trip. In other words, if cyclists perceive that a certain route is smoother and requires fewer turns than alternative routes, they may choose to travel along that route even if the trip distance is not minimized on that route. Note that Hood et al. [11] and Broach et al. [4] incorporate the turning effect as an attribute in the utility function based on the observed GPS data. Meanwhile, the space syntax concept adopted in this paper is the result of global measurements with angles between two consecutive links based on the network topology.
3. Overview of Bicycle Traffic Assignment Model
The methodology for modeling bicycle traffic assignment using three criteria (i.e., route cognition, route distance, and route bicycle level of service (BLOS)) is described in this section. For bicycle traffic assignment, a two-stage model was adopted. In the first stage, route generation is performed to determine available route sets for one or more user classes, and then multi-criteria bicycle traffic assignment is performed. For the assignment, the path-size logit (PSL) model is adopted in the second stage.
3.1. Criteria Affecting Cyclists’ Travel
Many empirical studies on bicycle travel analysis show that there are many factors that are considered when cyclists choose routes. They include travel distance or time [4]; safety [5]; stress [34]; pollution [35]; travel distance/time and safety [7]; travel time and suitability [14]; travel time and pollution [12]; travel distance, safety, and pollution [8]; and bikeability [36,37]. Due to the diverse set of influential factors that are at play during bicycle travel, route planners provide a variety of bicycle routes based on different factors (e.g., least elevation gain route, shortest distance route, safest route, bike friendly route, etc.) to satisfy the requirements of different cyclists.
Figure 2 illustrates how diverse factors contribute to three key aggregated factors. In the general criteria level, we categorized three motorized-related attributes, network-related attributes, and observation-related attributes. The disaggregated criteria level shows the detailed attributes related to the three general criteria area. A total of 10 criteria (e.g., traffic volume, speed, turning penalty, roadside parking, etc.) is shown in the disaggregated level. For simplification, these 10 factors are further combined into the three key aggregated criteria for different user classes choice decisions. Although some factors (e.g., intersection delay and roadside parking) are directly related on the three key aggregated criteria, these factors can affect the criteria indirectly. For example, intersection delay causes more traffic congestion, and drivers require more attention. Regarding roadside parking, there may be traffic sight problems when drivers turn right or left. In this study, route cognition attributes, route distance attributes, and route safety attributes are adopted as three key criteria to develop a multi-objective approach for the generation of bicycle route sets, as shown in Figure 2.
3.1.1. Route Cognition
For route cognition, the sum of the link MD measures computed by the space syntax model described in Section 2 is adopted as a surrogate measure. Route cognition is computed as follows:
where is the route cognition on path k connecting O-D pair rs; is the mean depth on link a; is the path-link indicator: 1 if link a is on path k between O-D pair rs and 0 otherwise; is the set of paths connecting the O-D pair rs of class m; and RS is the set of O-D pairs. The obtained MD measurement is interpreted as of the route accessibility.
3.1.2. Route Distance
Route distance is a composite measure that includes the sum of the link distances along the route and the turning movement delays at the intersections that the route passes through. To solve the unit incompatibility problem (i.e., distance and delay), an appropriate conversion factor is used to convert a delay to an equivalent distance unit. The route distance can be computed as follows:
where is the distance (in meters) on path k connecting the O-D pair rs; is the length (in meters) of link a; is an appropriate conversion factor for turning movement t at intersection i; is the delay (in seconds) of turning movement t at intersection i; INi and OUTi are the sets of links terminating into and originating out of intersection i.
3.1.3. Route Safety
The safety aspect of bicycle facilities can be assessed by a variety of different measures. For the safety measurement, the bicycle level of service (BLOS) measure introduced by the Highway Capacity Manual (HCM) [38] is used as a surrogate measure. The route BLOS can be computed as follows:
where is the bicycle level of service on path k between O-D pair rs; is the length-weighted average segment bicycle score on path k between the O-D pair rs (); la is the length of link a (in meters); is the average intersection bicycle score on path k between the O-D pair rs (); is the number of intersections on path k between the O-D pair rs; and is the number of unsignalized conflicts per km on route k between the O-D pair rs. Note that the segment and intersection bicycle scores (Bseg and IntBLOS) are calibrated based on the flow and speed of motorized vehicles, the width configuration of bicycle facilities, etc. Please refer to NCHRP Report 616 [39] for the details of the BLOS development.
3.2. Route Generation
Solving the multi-criteria shortest path problem is different from solving the single criterion shortest path problem; there may not be a single optimal path that dominates all other paths in all of the criteria. Hence, solving multi-criteria shortest path problems requires generating a set of efficient (or non-dominated) paths. In the literature, there are several solution algorithms for solving the multi-criteria shortest path problem, including the ranking method, the label setting approach, the two-phase method, and the label correcting approach. In this paper, we adopted the ranking method proposed by Climaco and Martins [40] and appropriately modified the ranking method to handle the non-additive route structure and one or more user classes in the bicycle traffic assignment model. Of the three key criteria, route BLOS is non-additive (i.e., not a simple sum of the link BLOS on the route), as it is a composite measure of four terms in Equation (5). Despite the fact that the sum of these four terms is additive, the individual terms are non-additive, which makes the overall route BLOS non-additive. In addition, efficient route sets will be generated according to one or more user classes. Readers can refer to Ryu et al. [8] for the detailed implementation procedure of the modified ranking method, which generates the multi-criteria paths that form the efficient routes for bicycle traffic assignment with one or more user classes.
3.3. Bicycle Traffic Assignment for One or More User Classes
After the generation of efficient routes in Section 3.2, we performed bicycle traffic assignment based on the generated efficient routes for one or more user classes. For the user classes, we used the cyclist classification by Geller [41], which includes three types: strong and fearless, enthused and confident, and interested but concerned. The percentages of each user class are based on data collected in Portland, Oregon, USA. For network assignment, we adopted the path size logit (PSL) model as a route choice model for bicycle traffic assignment. In bicycle traffic assignment literature, Menghini et al. [13] and Hood et al. [11] adopted the PSL model on a path set using a link elimination approach and a doubly stochastic shortest path. Broach et al. [4] also used the PSL model on a pre-generated path set. With the PS value, the PS-logit (PSL) probability for the bicycle traffic assignment problem with one or more user classes can be expressed as
where is the PS factor of path k between the O-D pair rs ; la is the length of link a; and is the length on path k between the O-D pair rs. is the utility of path k between the O-D pair rs. The utility is as follows:
where is the route attribute of criterion C on path k between the O-D pair rs; C is the number of criteria.
4. Numerical Results
To demonstrate the applicability of the bicycle traffic assignment procedure with one or more user classes, a real bicycle network in the city of Winnipeg, Canada, was used.
4.1. Network Characteristics
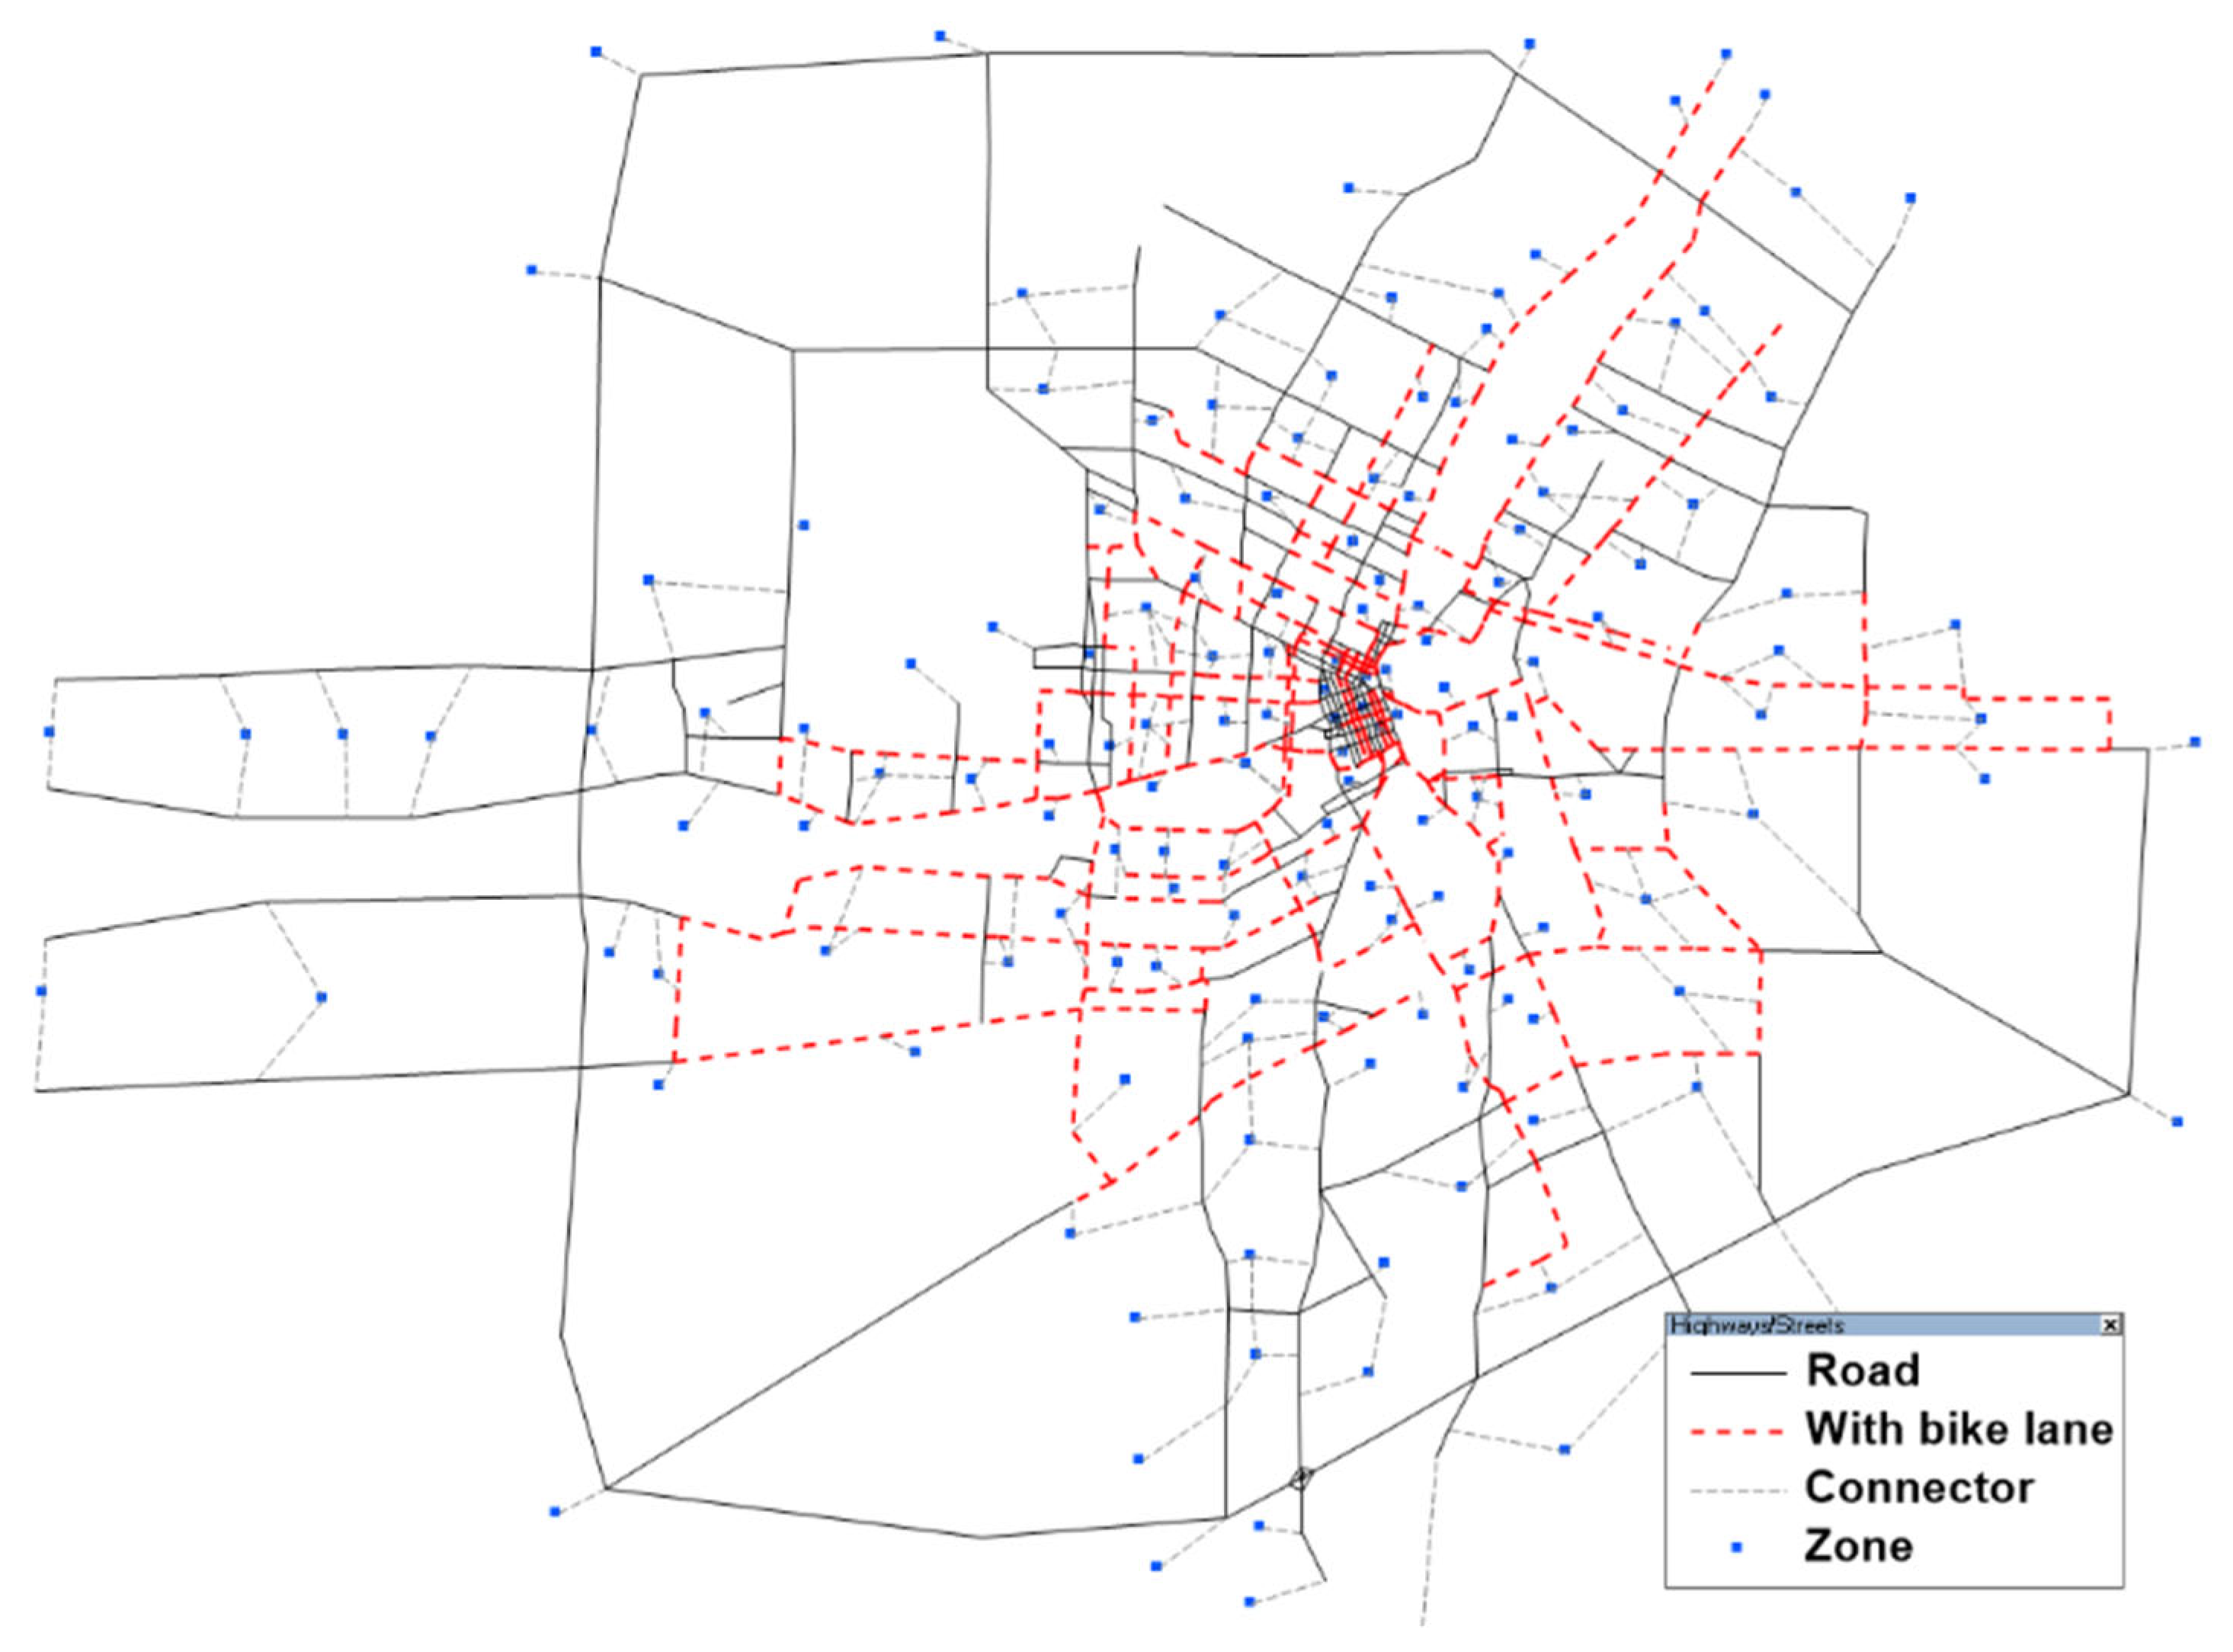
In Figure 3, the Winnipeg road network with bike lanes is shown. The network structure, O-D trip table for motorized vehicles, and link performance parameters are from Emme/4 (INRO Consultants, Montréal, QC, Canada) a commercial transportation software. The bicycle network was assembled based on the information obtained from the city of Winnipeg. Among the 2555 links, 541 links are bike paths or bike lanes. The bicycle O-D demand was created based on the gravity model using 2006 Census data. Based on the bicycle commute trip length measurements featured in Aultman-Hall et al. [42], approximately 99% of trip distances are less than 5.6 miles (9 km). In this study, bicycle trips with lengths greater than 10.0 km are excluded from the generation of the skim trees for the gravity model. After excluding non-reasonable skim trees, 7368 O-D pairs were used to generate the bicycle trip distribution (i.e., 5575 trips). Figure 4 shows the trip length frequency distribution (TLFD) for bicycle trips.
4.1.1. Space Syntax Analysis
As mentioned in Section 2, space syntax decomposes the large and continuous urban spaces into a set of the least number of the longest axial lines (axial map). Each axial line represents a cognitive small space, and all of the lines form a spatial network to model spatial cognition from the network perspective. To begin the space syntax model analysis, the Winnipeg geographical information system (GIS) network obtained from the Emme/4 software was used as input for the model. We first computed the MD value in Equation (2) of the spatial network using the space syntax software, which was Depth Map software, and then the computed MD was inputted into the network. Figure 5 visualizes the spatial network according to the computed MD value in the Winnipeg road network. Longer distance links have relatively higher cognition values (less MD), whereas shorter distance links have relatively lower cognition values (more MD). In addition, residential areas (shown on the west side of Figure 5) have lower cognition values (more MD) because more turning is required to approach the area.
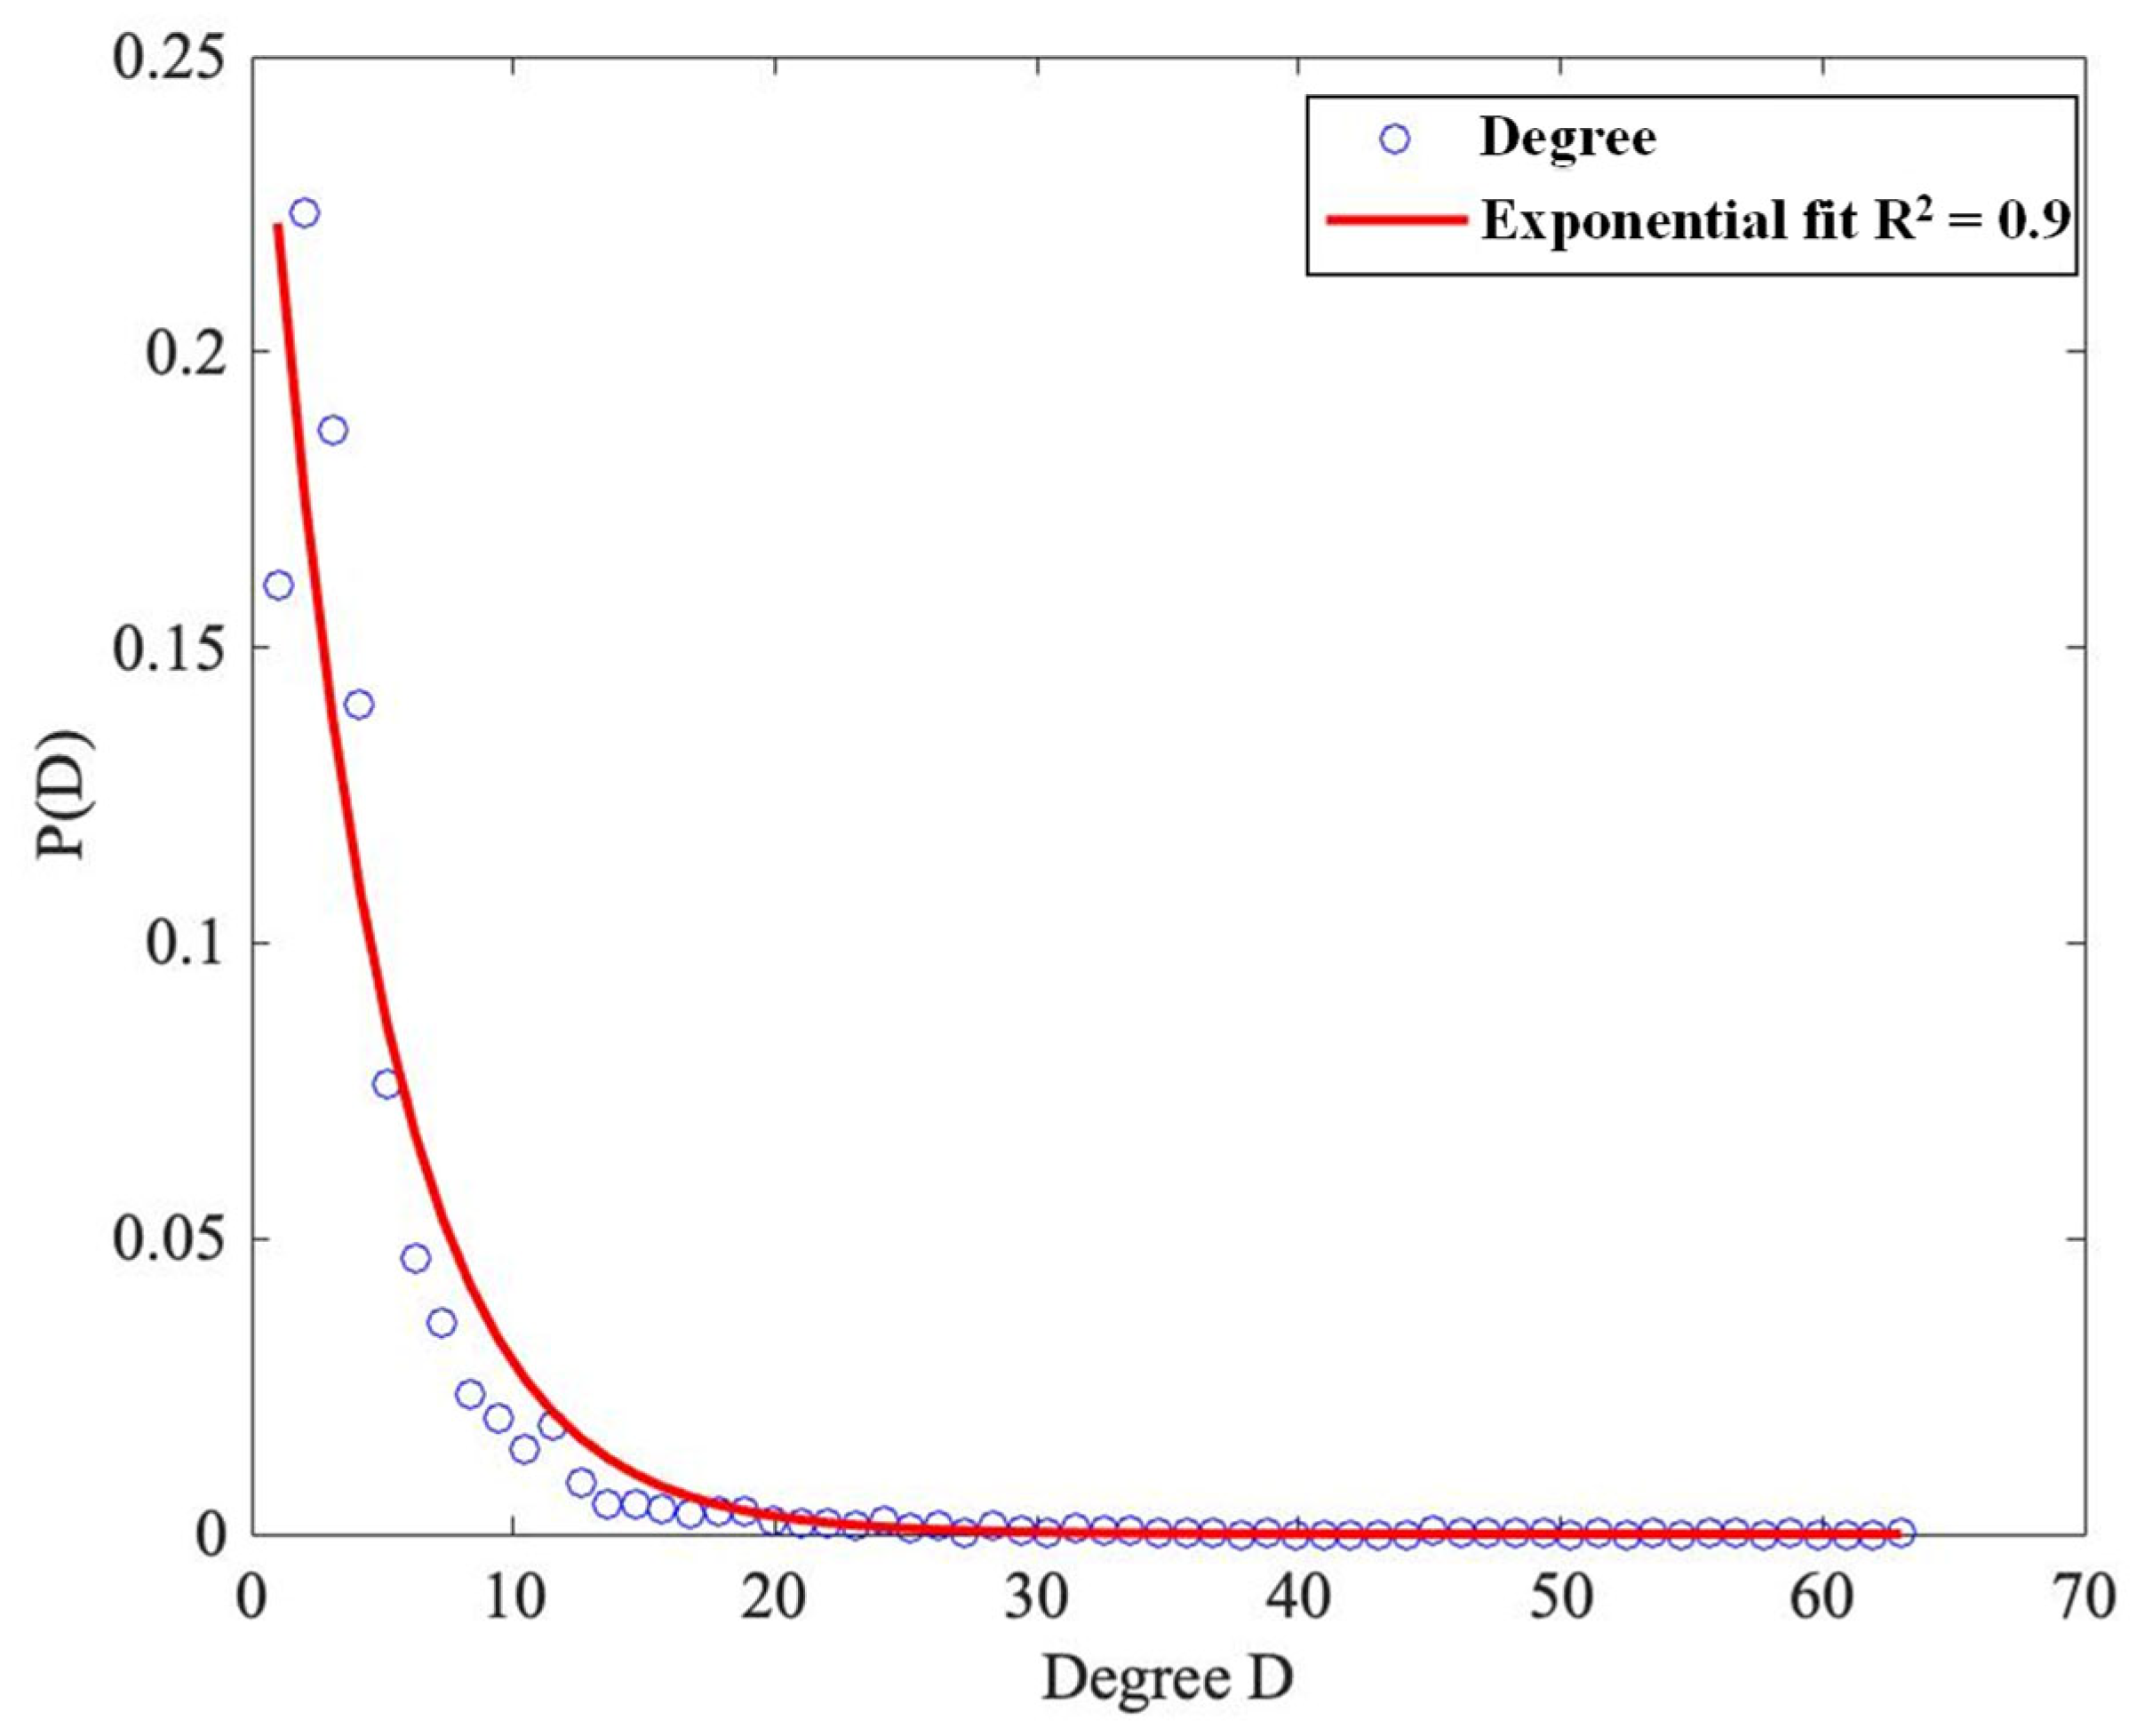
In theory, the space syntax network is the urban spatial structure, which reflects the way that people perceive the space. The imbalanced spatial structure of the cycle network depicted by space syntax reflects how the space is self-organized in the same way as a complex system: a large percentage of the routes (in green and yellow) possess low cycling route cognition, while a small percentage of the routes (in red) have high cycling route cognition according to the visualization in Figure 5. By nature, the way people perceive space can be well represented by the complex spatial network structure from the “global” perspective instead of the “local” turns. Therefore, the network-based parameter MD can adequately depict the route cognition for cyclists in this network. As shown in Figure 6, the probability distributions of the centrality degree in Winnipeg’s spatial network demonstrate an exponential distribution, indicating the scaling property of complex networks and is consistent with previous studies. The heavy-tailed distribution further validates the imbalanced phenomenon of a complex system and supports the applicability of space syntax in route cognition.
4.1.2. Bicycle Level of Service
Figure 7a,b show the Bseg and IntBLOS distributions based on the first two terms of Equation (5) from HCM. From these two measures, the route BLOS is calculated using Equation (5).
4.2. Single User Class Traffic Assignment
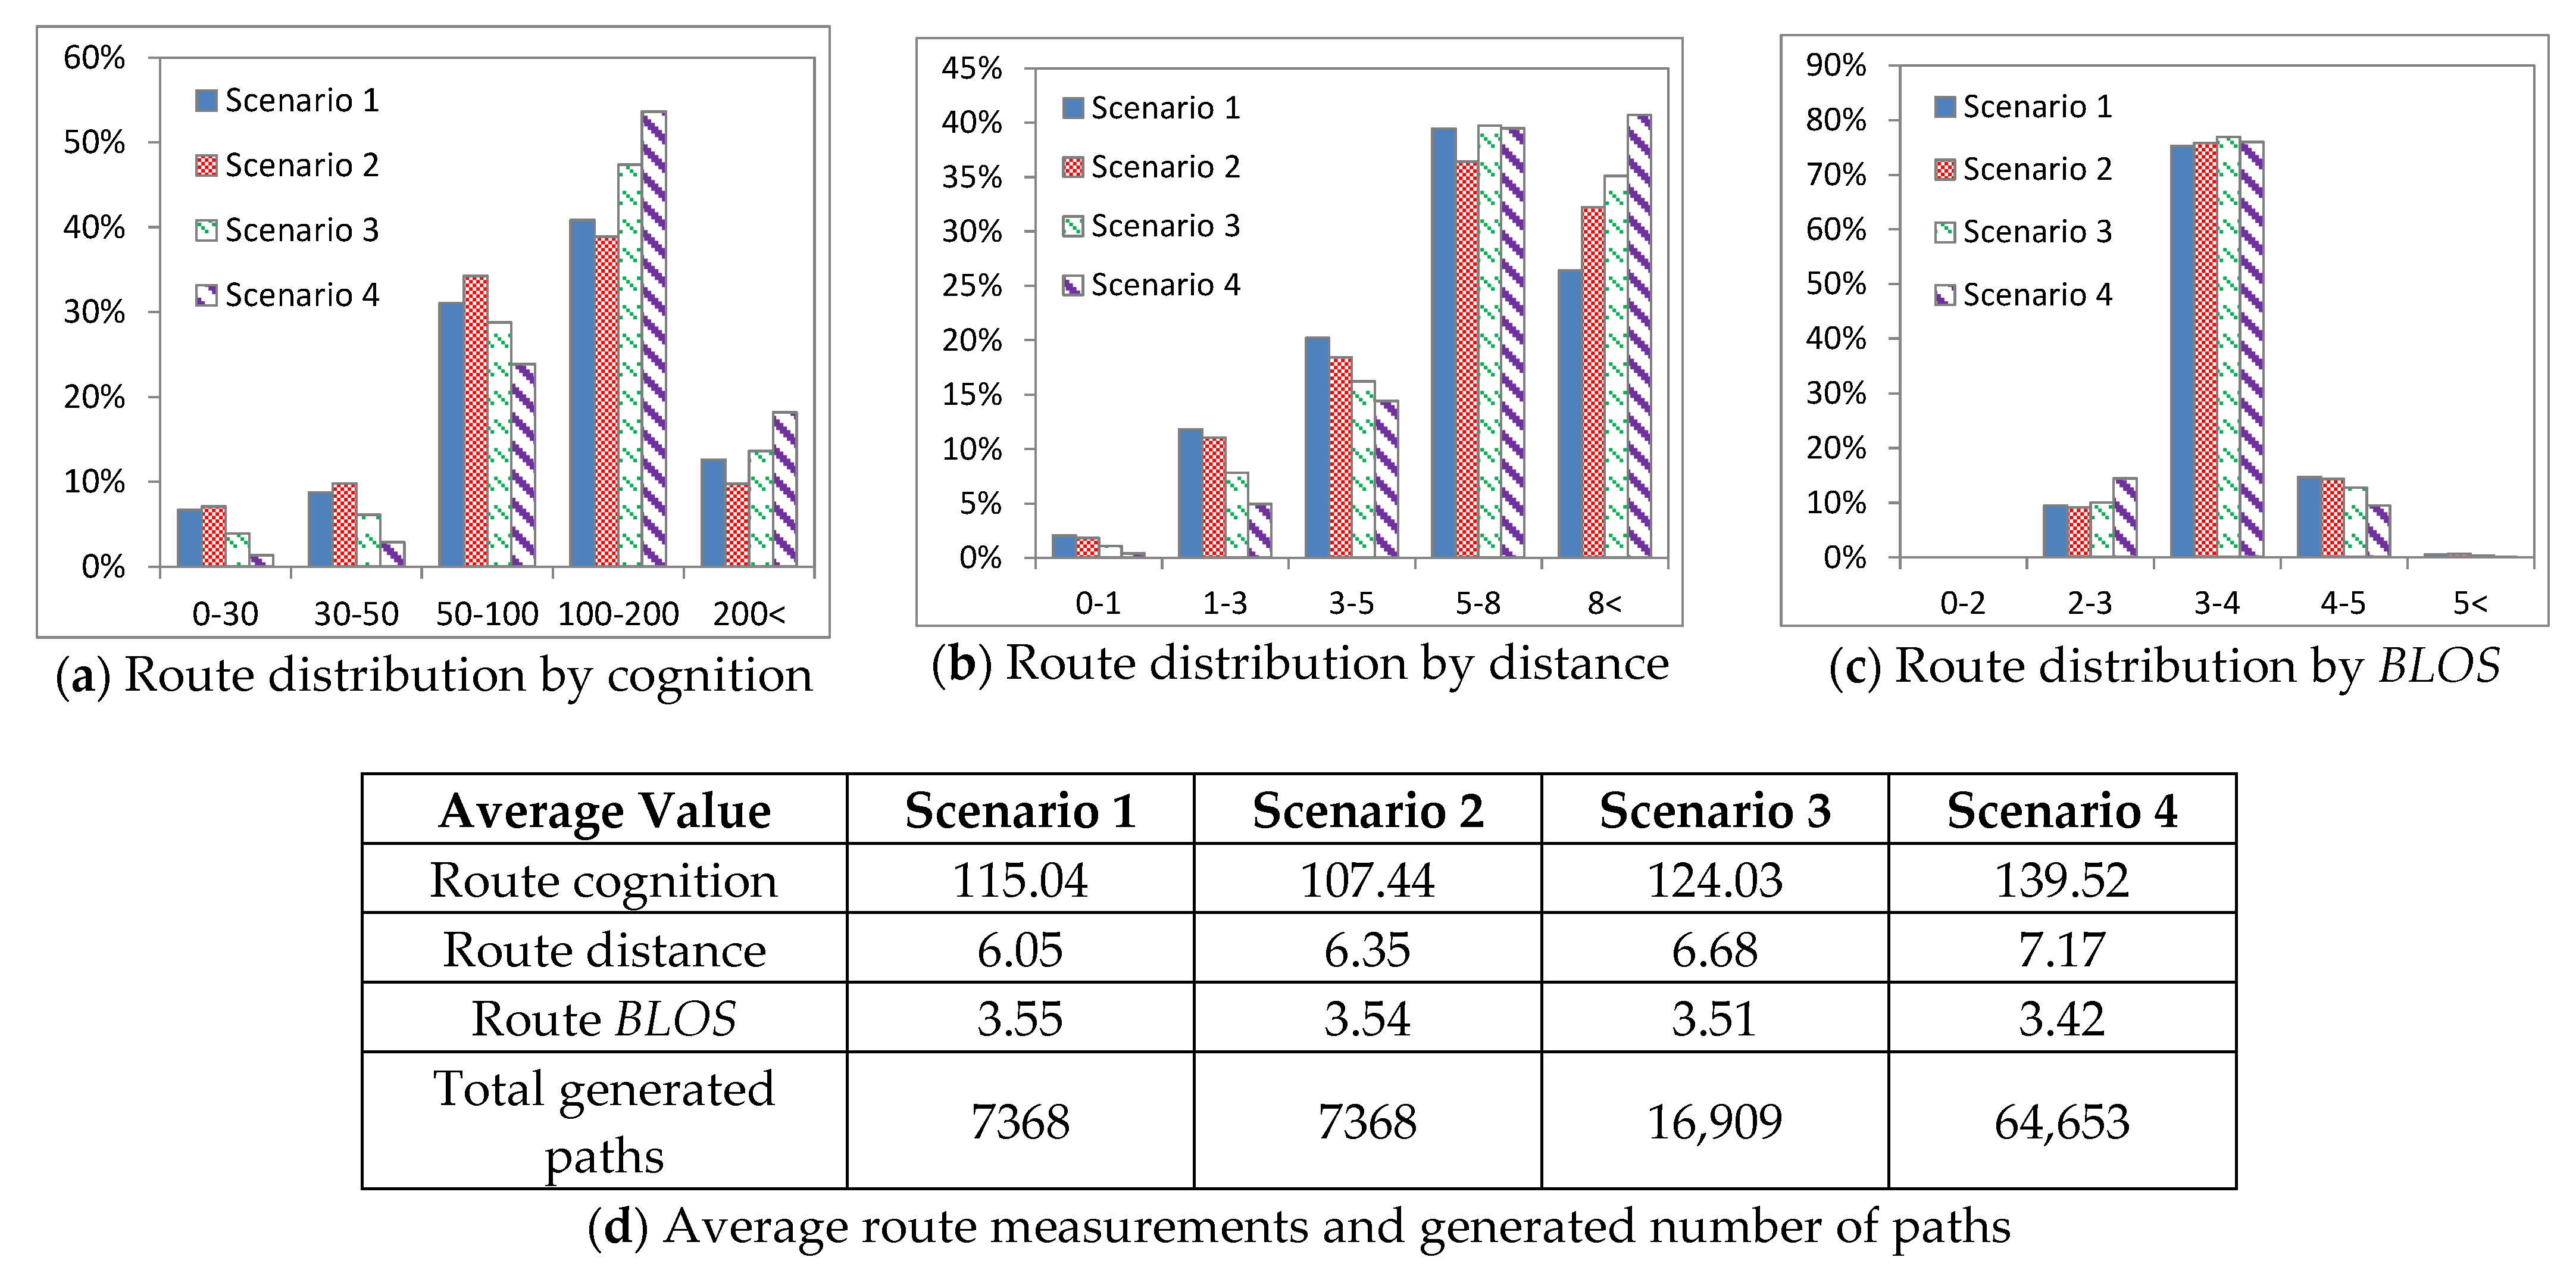
Four scenarios are set up for a single-user class. Scenarios 1 and 2 assume that users use a single criterion to choose their travel paths (distance for Scenario 1 and cognition for Scenario 2). Conversely, Scenarios 3 and 4 assume that users use multiple criteria to choose their travel paths (distance and cognition for Scenario 3 and distance, cognition, and BLOS for Scenario 4). Based on the setup, the bicycle traffic assignment procedure first generates a set of efficient routes based on the adopted criteria in the four scenarios. Figure 8 provides the results of the route distribution based on the four scenarios. Figure 8a–c show the results of the single-criterion route distribution using cognition, distance, and BLOS, respectively, while Figure 8d compares the total number of efficient routes and the average values for each attribute in the four scenarios.
There are two major effects that occur when more criteria are added into the analysis: (1) both the average values for route cognition and route distance increase, and (2) the average values of the route BLOS decrease. The first major effect (increased route cognition and route distance values) can be explained by the increase in the total generated routes (i.e., from 7368 routes in the two single-criterion scenarios to 16,909 routes in the bi-criteria scenario and 64,653 routes in the tri-criteria scenario). The second effect (decreased BLOS values) can be explained by examining Scenarios 3 and 4. When the BLOS criterion is finally included in the tri-criteria analysis of Scenario 4, the route measurement value of BLOS is minimized. In the bi-criteria analysis of Scenario 3, which does not include route BLOS, the average attribute measurements decrease because the route BLOS is negatively correlated with route distance.
Using the efficient routes generated for one or more user classes in the four scenarios, we performed the bicycle traffic assignment by loading the bicycle O-D trip tables according to the PSL route choice probabilities. In this study, the following multiplicative utility function was used:
with the parameters (these two values are obtained from Kang and Fricker [43] for route distance and route BLOS) and (this value is assumed for route cognition).
Figure 9 depicts the link flow pattern for the four scenarios. As seen in the subfigures, the flow patterns are different, especially in the central business district (CBD) area. Because the generated efficient routes and the route choice utility with different criteria are different, the flow patterns are also shown differently. When a single criterion is used (e.g., Scenario 1(a) and Scenario 2(b)), the flows are more concentrated on major roads using the best path of the indicated criterion, while the flows in Scenario 3(c) and Scenario 4(d) are more dispersed to multiple efficient routes generated according to the bi-objective and tri-objective shortest path procedures. Table 1 shows the effects of using different quantities of criteria with respect to the cognition measurement. As it can be seen, when a certain criterion is used in the traffic assignment, the calculations result in the lowest value for that criterion category (e.g., lowest values are marked in red). From these values, we can observe how route cognition is related to other criteria. For example, we can observe that the minimization of any one specific criterion could lead to increases in all of the other criteria values for their respective criterion categories. However, the increasing rate of the distance measurement and the BLOS measurement is relatively smaller when route cognition is used in single criterion analysis. The BLOS is minimized to 3.85 when the distance criterion was used, but the BLOS is even further minimized to 3.84 when the cognition criterion was used. Likewise, the route distance under the BLOS criterion was minimized to 6.18 but became further minimized to 5.04 under the cognition criterion. This implies that route complexity (route cognition) is not an independent attribute; it is correlated to other attributes in route choice decision-making.
4.3. Multiple User Class Traffic Assignment
Based on the Portland study (Geller, 2006) [41], multi-class bicycle O-D trip tables were created: (1) strong and fearless cyclists (1.5% of the population, 82 trips), (2) enthused and confident cyclists (10.3% of the population, 574 trips), and (3) interested but concerned cyclists (88.2% of the population, 4919 trips). The total number of trips in the dataset is 5575, which is the same as the single user class in Section 4.1, representing an average user for all cyclists. There is a fourth user class (no way no how), but it is not considered in the bicycle traffic assignment procedure. Dill and McNeil [44,45] explored this topic in more detail and updated the percentage of cyclist types in the Portland metro area and national metro area, respectively. For the purposes of this study, we assumed the following: the strong and fearless cyclist class (Class 1) is only concerned with route distance; the enthused and confident cyclist class (Class 2) considers route cognition and route distance; and the interested but concerned cyclist class (Class 3) adopts all criteria (route cognition, route distance, and route BLOS). For the bicycle assignment, the same parameters used in the single user class assignment were adopted.
Figure 10 presents the assigned link flow of each class. For the link flow pattern of Class 1(a), which uses distance as its only criterion, the assigned demand is 82 trips (1.5% of total demand). In contrast, Class 2(b) has assigned flows of 574 trips with its dual distance and cognition attributes, and Class 3(c) has assigned flows of 4919 trips with its distance, cognition, and BLOS attributes. The link flow patterns of the three classes (a)–(d) are quite different since different trips and route utilities are being used to assign the O-D demand of each class.
In Figure 10, we can observe the changes made to average travel characteristics (cognition, distance, and BLOS), as different criteria are used in the route choice model. Class 1 has the minimum distance value (i.e., 4.79 km), but its other values are higher compared to the other two classes. Class 2 has lower cognition and BLOS values compared to Class 1, but its distance is a little bit longer, while Class 3 has a much lower BLOS compared to either Class 1 or 2, but its distance and cognition values are relatively large due to the addition of BLOS as one of the route choice criteria. These results imply that: (1) route cognition and route distance have a slight negative correlation and that (2) route BLOS has a relatively stronger negative correlation with route cognition and route distance. This makes intuitive sense because route cognition is a form of route difficulty (such as distance and slope); it is not the physical measure of route difficulty but rather the perceived measure of how much effort the cyclist may need to provide to make their trip successful. Since route cognition and route distance are both forms of route difficulty, they would not share a strong negative relationship. This is proven in the data: when route cognition was added into the analysis (comparing Class 1 with Class 2), route cognition decreased from 87.17 to 84.66 while route distance increased from 4.79 to 4.87. These route cognition and distance differences from Class 1 and 2 are much smaller than in Class 3 or Class 4. As for route BLOS, it makes sense that the routes with the highest values of BLOS would avoid excessive turning (route cognition) because collisions are intuitively more likely to occur during turning.
However, routes with more turns may be relatively shorter in distance. Thus, in avoiding turns, the routes that concentrate on BLOS are longer. Table 2 presents the average traveled distance, BLOS, and cognition values between single user classes and multiple user classes. As it can be seen, the average traveled values are slightly different. In the all-criteria analysis, using multi-class assignment resulted in better performance in terms of traveled distance and the traveled cognition compared to the single class case study. However, the traveled BLOS increased slightly from 3.65 to 3.67.
5. Conclusions
The cognition effect may not be observed from traditional tangible data sources (e.g., count data, GPS data, etc.), but the cognition factor is important in decision making. In this paper, we presented the route cognition effect using the space syntax theory in a multi-class and multi-criteria bicycle traffic assignment model. The route cognition factors were obtained from network topology. To consider other affected factors, we incorporated route distance and route safety as route choice decisions. The overall procedure consists of route generation and flow allocation using a path size logit model. A real network in Winnipeg, Canada, was used to demonstrate its applicability. The Winnipeg experiment revealed three main outcomes: First, minimizing one specific criterion led to increases in all of the other criteria values. Second, the flow allocations were highly sensitive to the number of criteria. Finally, the flow patterns between the single-class model and multi-class model are significantly different. This implies that route cognition is not an independent attribute; it is correlated to other attributes in the route choice decision-making of each user class. From the model, we can infer which links or segments have more bicycle flows, and this information could help policymakers determine what policies or plans to implement for cyclists based on the estimated flows. In addition, this information will help cyclists determine which route is suitable for them. Hence, the proposed model will contribute to the following bicycle network models: (a) bicycle facility design problems, (b) bicycle network planning models, and (c) bicycle route planning and cycling navigation.
Future research concerning route cognition models should incorporate traveler characteristics into the analysis and should conduct more tests with different network topologies and bicycle facilities. Observed route and count data should also be attained to help support the modeled route cognition results. In addition, the proposed model could be extended to consider other bike types (e.g., e-bikes) and other modes of transportation (e.g., walking). However, there is another variable, electric charging, and it is necessary to set up other criteria to solve this problem. For walking, it is useful to apply the proposed model after setting the criteria that are considered when walking.
Author Contributions
Conceptualization, S.R. and A.C.; methodology, S.R. and A.C.; formal analysis, S.R. and A.C.; investigation, X.L. and J.Y.; writing—original draft preparation, S.R., A.C. and J.S.; writing—review and editing, A.C. and J.S. All authors have read and agreed to the published version of the manuscript.
Funding
This research was funded by the Ministry of Science, ICT, Republic of Korea (K-21-L01-C05-S01), the Smart Cities Research Institute (P0036472), and the Research Institute for Sustainable Urban Development (1-BBWF and P0038289) at the Hong Kong Polytechnic University.
Institutional Review Board Statement
Not applicable.
Informed Consent Statement
Not applicable.
Data Availability Statement
The data presented in this study are available, upon request, from the corresponding author.
Conflicts of Interest
The authors declare no conflict of interest.
References
- Martens, K. Promoting bike-and-ride: The Dutch experience. Transp. Res. Part A 2007, 41, 326–338. [Google Scholar] [CrossRef]
- Nam, D.; Yang, D.; An, S.; Yu, J.G.; Jayakrishnan, R.; Masoud, N. Designing a transit-feeder system using multiple sustainable modes: Peer-to-Peer (P2P) ridesharing, bike sharing, and walking. Transp. Res. Rec. 2018, 2672, 754–763. [Google Scholar] [CrossRef]
- 2017 NHTS Data User Guide; Federal Highway Administration and Westat: Washington, DC, USA, 2018.
- Broach, J.; Dill, J.; Gliebe, J. Where do cyclists ride? A route choice model developed with revealed preference GPS data. Transp. Res. Part A 2012, 46, 1730–1740. [Google Scholar] [CrossRef]
- Fernández-Heredia, Á.; Monzón, A.; Jara-Díaz, S. Understanding cyclists’ perceptions, keys for a successful bicycle promotion. Transp. Res. Part A 2014, 63, 1–11. [Google Scholar] [CrossRef]
- Bauer, M.; Kisielewski, P. The Influence of the Duration of Journey Stages on Transport Mode Choice: A Case Study in the City of Tarnow. Sustainability 2021, 13, 5922. [Google Scholar] [CrossRef]
- Ryu, S.; Chen, A.; Su, J.; Choi, K. Two-stage bicycle traffic assignment model. J. Transp. Eng. Part A: Syst. 2018, 144, 04017079. [Google Scholar] [CrossRef]
- Ryu, S.; Chen, A.; Su, J.; Choi, K. A multi-class, multi-criteria bicycle traffic assignment model. Int. J. Sustain. Transp. 2021, 15, 524–540. [Google Scholar] [CrossRef]
- Guo, X.; Lu, C.; Sun, D.; Gao, Y.; Xue, B. Comparison of Usage and Influencing Factors between Governmental Public Bicycles and Dockless Bicycles in Linfen City, China. Sustainability 2021, 13, 6890. [Google Scholar] [CrossRef]
- Nikitas, A.; Tsigdinos, S.; Karolemeas, C.; Kourmpa, E.; Bakogiannis, E. Cycling in the Era of COVID-19: Lessons Learnt and Best Practice Policy Recommendations for a More Bike-Centric Future. Sustainability 2021, 13, 4620. [Google Scholar] [CrossRef]
- Hood, J.; Sall, E.; Charlton, B. A GPS-based bicycle route choice model for San Francisco, California. Int. J. Transp. Res. 2011, 3, 63–75. [Google Scholar] [CrossRef]
- Wang, J.Y.T.; Dirks, K.N.; Ehrgott, M.; Pearce, J.; Cheung, A.K.L. Supporting healthy route choice for commuter cyclists: The trade-off between travel time and pollutant dose. Oper. Res. Health Care 2018, 19, 156–164. [Google Scholar] [CrossRef] [Green Version]
- Menghini, G.; Carrasco, N.; Schussler, N.; Axhausen, K.W. Route choice of cyclists in Zurich. Transp. Res. Part A 2010, 44, 754–765. [Google Scholar] [CrossRef]
- Ehrgott, M.; Wang, J.; Raith, A.; van Houtte, A. A bi-objective cyclist route choice model. Transp. Res. Part A 2012, 46, 652–663. [Google Scholar] [CrossRef]
- Broach, J.; Gliebe, J.; Dill, J. Calibrated labeling method for generating bicyclist route choice sets incorporating unbiased attribute variation. Transp. Res. Rec. 2010, 2197, 89–97. [Google Scholar] [CrossRef]
- Hillier, B.; Hanson, J. The Social Logic of Space; Cambridge University Press: Cambridge, UK, 1984. [Google Scholar]
- Hillier, B. Space Is the Machine: A Configurational Theory of Architecture; Cambridge University Press: Cambridge, UK, 1996. [Google Scholar]
- Aldred, R.; Dales, J. Diversifying and normalising cycling in London, UK: An exploratory study on the influence of infrastructure. J. Transp. Health 2017, 4, 348–362. [Google Scholar] [CrossRef] [Green Version]
- Batty, M.; Rana, S. The automatic definition and generation of axial lines and axial maps. Environ. Plan. B Plan. Des. 2004, 31, 615–640. [Google Scholar] [CrossRef]
- McCahil, C.; Garrick, N. The applicability of space syntax to bicycle facility planning. Transp. Res. Rec. 2008, 2074, 46–51. [Google Scholar] [CrossRef]
- Hillier, B.; Burdett, R.; Peponis, J.; Penn, A. Creating life; or, does architecture determine anything? Arch. Comport. Arch. Behav. 1987, 3, 233–250. [Google Scholar]
- Hillier, B. The common language of space: A way of looking at the social, economic and environmental functioning of cities on a common basis. J. Environ. Sci. 1999, 11, 344–349. [Google Scholar]
- Eisenberg, B. Space syntax on the waterfront: The Hamburg case study. In Proceedings of the 5th International Space Syntax Symposium, Delft, The Netherlands, 13–17 June 2005; pp. 342–353. [Google Scholar]
- Dhanani, A.; Tarkhanyan, L.; Vaughan, L. Estimating pedestrian demand for active transport evaluation and planning. Transp. Res. Part A 2017, 103, 54–69. [Google Scholar] [CrossRef] [Green Version]
- Manum, B.; Nordstrom, T. Integrating bicycle network analysis in urban design: Improving bikeability in Trondheim by combining space syntax and GIS-methods using the place syntax tool. In Proceedings of the 9th International Space Syntax Symposium, Seoul, Korea, 31 October–3 November 2013; pp. 28.1–28.14. [Google Scholar]
- Law, S.; Sakr, F.; Martinez, M. Measuring the changes in aggregate cycling patterns between 2003 and 2012 from a space syntax perspective. Behav. Sci. 2014, 4, 278–300. [Google Scholar] [CrossRef] [PubMed]
- Liu, Z.; Song, Z.; Chen, A.; Ryu, S. Exploring Bicycle Route Choice Behavior with Space Syntax Analysis; Report 15–13; Transportation Research Center for Livable Communities (TRCLC): Kalamazoo, MI, USA, 2016. [Google Scholar]
- Dawson, P. Analysing the effects of spatial configuration on human movement and social interaction in Canadian Arctic communities. In Proceedings of the 4th International Space Syntax Symposium, London, UK, 17–19 June 2003; pp. 37.1–37.14. [Google Scholar]
- Lee, S.; Ryu, S. Multiple path-finding models using Kalman filtering and space syntax techniques. Transp. Res. Rec. 2007, 2029, 87–95. [Google Scholar] [CrossRef]
- Paul, A. Reviewing the axial-line approach to capturing vehicular trip-makers’ route-choice decisions with ground reality. Transportation 2013, 40, 697–711. [Google Scholar] [CrossRef]
- Turner, A. Angular analysis. In Proceedings of the 3rd International Space Syntax Symposium, Atlanta, GA, USA, 7–11 May 2001; pp. 30.1–30.11. [Google Scholar]
- Turner, A.; Dalton, A.T.N. A simplified route choice model using the shortest angular path assumption. In Proceedings of the 8th International Conference on GeoComputation, Ann Arbor, MI, USA, 5–8 October 2008; Volume 31. [Google Scholar]
- Turner, A. From axial to road-centre lines: A new representation for space syntax and a new model of route choice for transport network analysis. Environ. Plan. B Plan. Des. 2007, 34, 539–555. [Google Scholar] [CrossRef] [Green Version]
- Mekuria, M.; Furth, P.; Nixon, H. Low-Stress Bicycling and Network Connectivity; Mineta Transportation Institute, San José State University: San José, CA, USA, 2012. [Google Scholar]
- Tran, P.T.M.; Zhao, M.; Yamamoto, K.; Minet, L.; Nguyen, T.; Balasubramanian, R. Cyclists’ personal exposure to traffic-related air pollution and its influence on bikeability. Transp. Res. Part D 2020, 88, 102563. [Google Scholar] [CrossRef]
- Castañon, U.N.; Ribeiro, P.J. Bikeability and Emerging Phenomena in Cycling: Exploratory Analysis and Review. Sustainability 2021, 13, 2394. [Google Scholar] [CrossRef]
- Schmid-Querg, J.; Keler, A.; Grigoropoulos, G. The Munich Bikeability Index: A practical approach for measuring urban bikeability. Sustainability 2021, 13, 428. [Google Scholar] [CrossRef]
- Highway Capacity Manual; Transportation Research Board: Washington, DC, USA, 2011.
- Dowling, R.G.; Reinke, D.B.; Flannery, A.; Ryus, P.; Vandehey, M.; Petritsch, T.A.; Landis, B.W.; Rouphail, N.M.; Bonneson, J.A. Multimodal Level of Service Analysis for Urban Streets Multimodal Level of Service Analysis for Urban Streets; Report 616; National Cooperative Highway Research Program: Washington, DC, USA, 2008. [Google Scholar]
- Climaco, J.C.N.; Martins, E.Q.V. A bicriterion shortest path problem. Eur. J. Oper. Res. 1982, 11, 399–404. [Google Scholar] [CrossRef]
- Geller, R. Four Types of Cyclists. Portland Bureau of Transportation, Portland, OR. 2006. Available online: http://www.portlandoregon.gov/transportation/article/264746 (accessed on 13 December 2014).
- Aultman-Hall, L.; Hall, F.; Baetz, B. Analysis of bicycle commuter routes using geographic information systems implications for bicycle planning. Transp. Res. Rec. 1997, 1578, 102–110. [Google Scholar] [CrossRef]
- Kang, L.; Fricker, J. Bicycle route choice model incorporating distance and perceived risk. J. Urban Plan. Dev. 2018, 144, 09018001. [Google Scholar] [CrossRef]
- Dill, J.; McNeil, N. Four types of cyclists? Examination of typology for better understanding of bicycling behavior and potential. Transp. Res. Rec. 2013, 2387, 129–138. [Google Scholar] [CrossRef] [Green Version]
- Dill, J.; McNeil, N. Revisiting the four types of cyclists: Findings from a national survey. Transp. Res. Rec. 2016, 2587, 90–99. [Google Scholar] [CrossRef]
Figure 1.
Example of computing TD and MD on the simple network (a) Example of turning with different angular, (b) Example network, (c) Depth step on the link 1, (d) Computing TD and MD on the link 1.
Figure 1.
Example of computing TD and MD on the simple network (a) Example of turning with different angular, (b) Example network, (c) Depth step on the link 1, (d) Computing TD and MD on the link 1.

Figure 2.
Factors used to compute the three key criteria.

Figure 3.
Winnipeg road network with bike lanes.

Figure 4.
Bicycle trip length frequency distribution.

Figure 5.
Space Syntax analysis of the Winnipeg road network.

Figure 6.
Probability distribution of the centrality degree of the space syntax network in Winnipeg.
Figure 6.
Probability distribution of the centrality degree of the space syntax network in Winnipeg.

Figure 7.
Segment and intersection LOS distributions of the Winnipeg road network (a) Segment LOS distribution, (b) Intersection LOS distribution.
Figure 7.
Segment and intersection LOS distributions of the Winnipeg road network (a) Segment LOS distribution, (b) Intersection LOS distribution.

Figure 8.
Route distribution by route criterion for four scenarios and average measurements and total number of efficient routes (a) Route distribution by cognition, (b) Route distribution by distance, (c) Route distribution by BLOS, (d) Average route measurements and generated number of paths.
Figure 8.
Route distribution by route criterion for four scenarios and average measurements and total number of efficient routes (a) Route distribution by cognition, (b) Route distribution by distance, (c) Route distribution by BLOS, (d) Average route measurements and generated number of paths.

Figure 9.
Link flow patterns of four scenarios (a) Scenario 1, (b) Scenario 2, (c) Scenario 3, (d) Scenario 4.
Figure 9.
Link flow patterns of four scenarios (a) Scenario 1, (b) Scenario 2, (c) Scenario 3, (d) Scenario 4.

Figure 10.
Link flow patterns of each user class (a) Class 1, (b) Class 2, (c) Class 3, (d) All.


Table 1.
Summary of assigned link flows.
| Used Criteria | Distance (km) | BLOS | Cognition |
|---|---|---|---|
| Distance | 4.79 | 3.85 | 87.17 |
| BLOS | 6.18 | 3.31 | 110.61 |
| Cognition | 5.04 | 3.84 | 81.56 |
| Distance/BLOS | 5.18 | 3.61 | 95.17 |
| Distance/Cognition | 4.87 | 3.84 | 84.66 |
| BLOS/Cognition | 5.64 | 3.54 | 95.36 |
| All | 5.19 | 3.65 | 92.89 |
Table 2.
Average traveled distance, BLOS, and cognition with different combinations of criteria.
| Used Criteria | Distance (km) | BLOS | Cognition | |
|---|---|---|---|---|
| Single-userclass | Distance | 4.79 | 3.85 | 87.17 |
| Distance/BLOS | 5.18 | 3.61 | 95.17 | |
| Distance/cognition | 4.87 | 3.84 | 84.66 | |
| All | 5.19 | 3.65 | 92.89 | |
| Multiple-user class | 5.15 | 3.67 | 91.96 | |
Publisher’s Note: MDPI stays neutral with regard to jurisdictional claims in published maps and institutional affiliations. |
© 2021 by the authors. Licensee MDPI, Basel, Switzerland. This article is an open access article distributed under the terms and conditions of the Creative Commons Attribution (CC BY) license (https://creativecommons.org/licenses/by/4.0/).
Share and Cite
MDPI and ACS Style
Ryu, S.; Chen, A.; Su, J.; Liu, X.; Yu, J. Considering Space Syntax in Bicycle Traffic Assignment with One or More User Classes. Sustainability 2021, 13, 11078. https://0-doi-org.brum.beds.ac.uk/10.3390/su131911078
AMA Style
Ryu S, Chen A, Su J, Liu X, Yu J. Considering Space Syntax in Bicycle Traffic Assignment with One or More User Classes. Sustainability. 2021; 13(19):11078. https://0-doi-org.brum.beds.ac.uk/10.3390/su131911078
Chicago/Turabian StyleRyu, Seungkyu, Anthony Chen, Jacqueline Su, Xintao Liu, and Jiangbo (Gabe) Yu. 2021. "Considering Space Syntax in Bicycle Traffic Assignment with One or More User Classes" Sustainability 13, no. 19: 11078. https://0-doi-org.brum.beds.ac.uk/10.3390/su131911078
Note that from the first issue of 2016, this journal uses article numbers instead of page numbers. See further details here.