
Assessing the Impact of Policy Measures in Reducing the COVID-19 Pandemic: A Case Study of South Asia


1
Department of Economics, Kohat University of Science & Technology, Kohat 26000, Pakistan
2
Department of Economics, Neusoft Institute Guangdong, Foshan 528225, China
*
Author to whom correspondence should be addressed.
Sustainability 2021, 13(20), 11315; https://0-doi-org.brum.beds.ac.uk/10.3390/su132011315
Submission received: 21 July 2021
/
Revised: 25 September 2021
/
Accepted: 3 October 2021
/
Published: 13 October 2021
(This article belongs to the Special Issue Covid-19 Impacts and Recovery: Ethical, Economic, Legal, Societal and Eco-system Issues)
Abstract
:The COVID-19 pandemic is considered to be the world’s most urgent health disaster and the greatest challenge humanity has faced since World War II. One of the most significant concerns is the effectiveness of the extraordinary efforts undertaken around the world to prevent the spread of the coronavirus. This study applied the Westerlund cointegration test and the Pooled Mean Group–Autoregressive Distributed Lag (PMG-ARDL) model to investigate the effectiveness of government policy measures in reducing the COVID-19 pandemic using weekly data for the period 1 January 2020 to 31 May 2021. The results of the Westerlund cointegration test validate the presence of a cointegration relationship between government policy measures and the COVID-19 pandemic. In addition, results of PMG-ARDL show that economic support, stringency, and health and containment measures play a significant role in reducing the COVID-19 pandemic. Therefore, this study concluded that pharmaceutical and non-pharmaceutical measures have a substantial impact on mitigating the COVID-19 pandemic in South Asia. Policy implications such as government financial support for poor families, stringency, and health and containment measures must be adopted during the pandemic to curb/reduce the spread of COVID-19. Furthermore, it is also recommended to provide vaccines free of charge to developing countries and a stimulus package to support health research to expand the capacity for rapid vaccine in this region.
1. Introduction
The coronavirus infectious disease pandemic (COVID-19) is evolving at a frantic pace, driven by the transmission of new variants of the severe acute respiratory syndrome coronavirus 2 (SARS-CoV-2). New variations of SARS-CoV-2 emerged throughout the second part of 2020 and early 2021. After the EU2 variant (mutation S: 447N) was discovered in July 2020 in Western Europe, several worrisome variants (VOC) were identified, including the B.1.1.7 first developed in the UK in September 2020, the B.1.351 variant developed in South Africa in December 2020, the P.1 developed in Brazil in January 2021 and the ‘Indian’ variant B.1,617 first reported in Maharashtra, India, in July 2020 [1]. Several studies have found that the B.1.1.7 variation is associated with an increased risk of transmissibility, hospitalization, and even mortality [2,3].
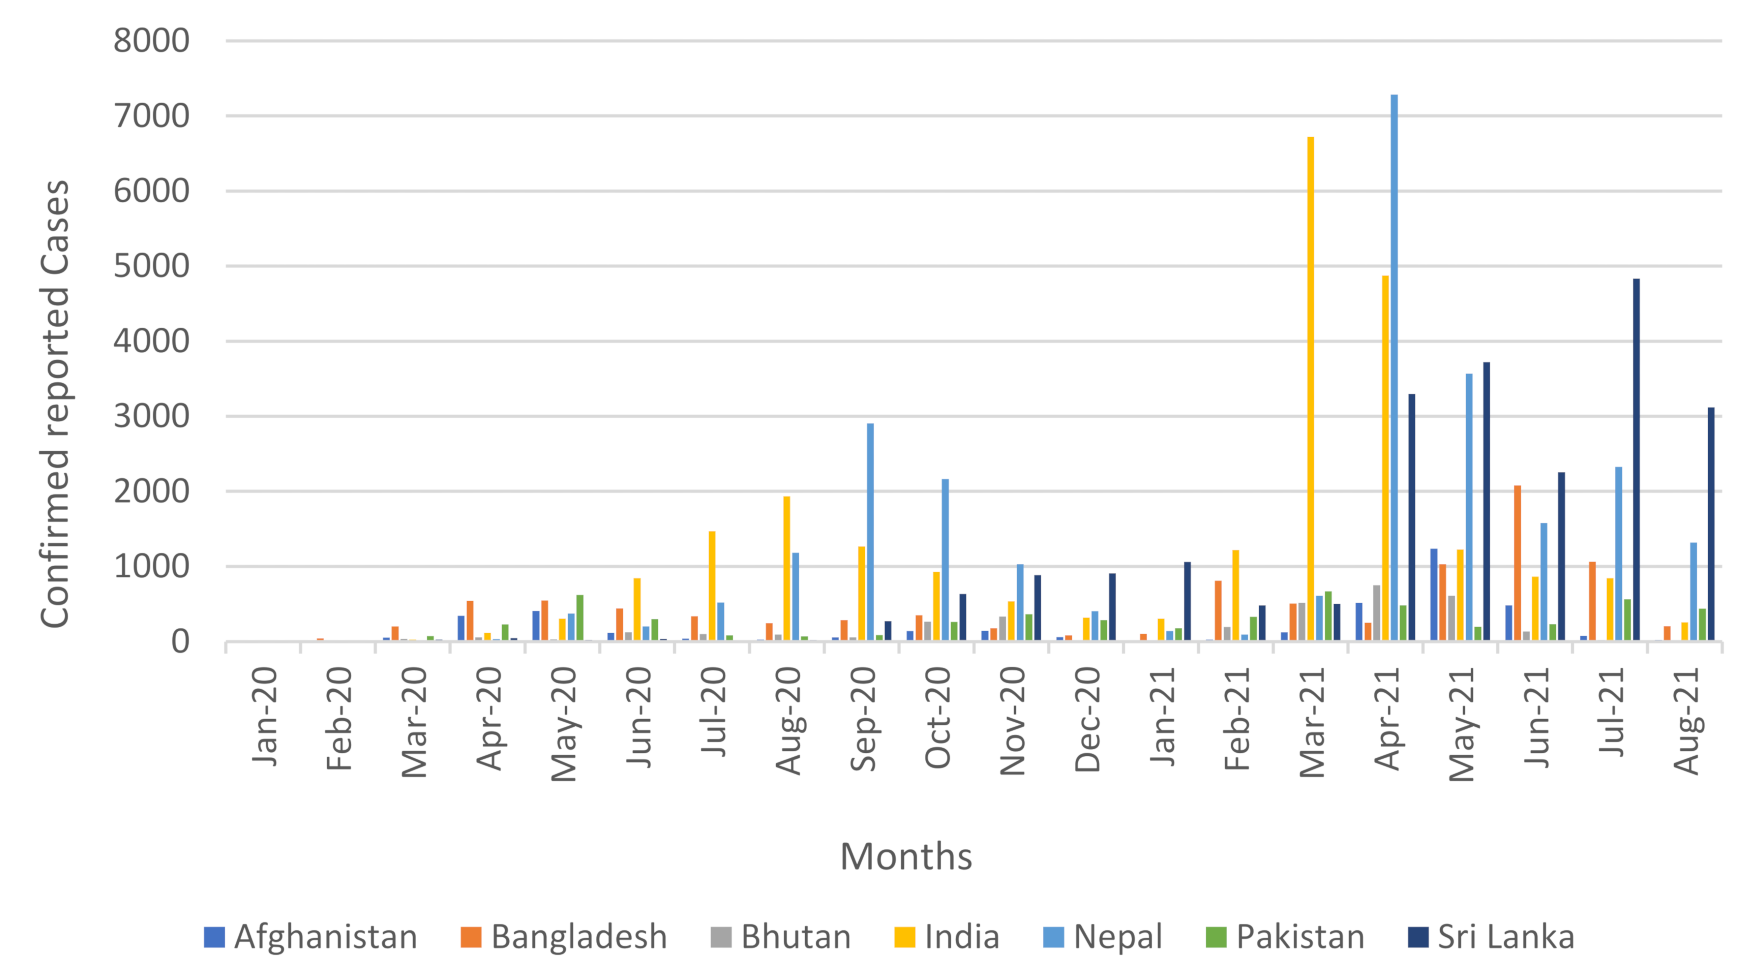
The COVID-19 epidemic quickly spread to every country in the world and left the world paralyzed. However, there are some notable variations in the behavior of COVID-19 in different regions. As of 17 September 2021, there were approximately 37.42 million COVID-19 infections recorded, which equates to an average of 74,391 cases per million population, with the highest readings in India and Nepal [4]. Several pharmaceutical and non-pharmaceutical policy measures are being implemented by governments around the world to prevent the COVID-19 pandemic. Pharmaceutical measures include vaccinations and non-pharmaceutical measures include containment measures including border closures, school closings, restrictions on public transport and air travel, contact tracing, testing policy, quarantine and isolation in countries that constitute the largest economies in the world [5,6]. Figure 1 shows the maximum reported cases of COVID-19 per million people in a month in South Asia. In addition, Figure 2 depicts the monthly reported cases of COVID-19 per million population in South Asia.
Children are being affected most by the COVID-19 pandemic in South Asia. Expanded school closures and limited access to distance learning have deprived children of their universal right to education [7]. Since the onset of the COVID-19 pandemic and its subsequent lockdown, schoolchildren around the world have lost an estimated 1.8 trillion hours of in-person learning [8]. UNESCO figures also show that two-thirds of an academic year has been lost on average worldwide due to COVID-19 school closures [8]. Moreover, government remittances declined when lockdown measures were taken in the early stage of the COVID-19 pandemic in South Asia. However, the increase in the government revenues began in late 2020, indicating a temporary change in the sources of possible informal remittances, increased transfers to support families, and the returns of foreign workers [9].
The closure of all modes of transit in South Asia (including freight) had a direct negative impact. Numerous bottlenecks in the food supply chain and resulting food inflation have been attributed to transport delays and municipal reactions, notably food export bans. Supply-side disruptions due to containment measures have increased food prices in the South Asia region since the start of the pandemic [10]. Food inflation was the main driver of overall price inflation in South Asia, particularly Pakistan and Sri Lanka, until 2020. South Asia economic prospects are improving as growth is expected to accelerate from a low record in 2020 and put the area on a food recovery route. However, uneven growth and economic activity is significantly lower than estimates prior to COVID-19, as many companies struggle to make up for lost income and millions of workers, most of whom are in the informal sector, continue to fight against job losses, declining incomes, growing inequalities, and human capital deficits [11].
To meet today’s economic challenges, South Asian policymakers have made aggressive efforts. Almost all countries have approved sizeable stimulus packages, with a strong emphasis on the most disadvantaged members of society. Due to economic constraints, Afghanistan, Bangladesh, Nepal, and Pakistan have redirected available resources from the construction sector to health and social assistance. Stimulus packages include reductions in some recurrent expenses, allowing the government to temporarily discount energy bills, lower gasoline, and diesel prices, and imposing a debt moratorium on business loans, housing, and students. As a result, recurring expenses decreased, while capital expenditures increased significantly, because most of the projects related to COVID-19 were completed on time [9].
Although vaccination has enormous economic benefits, vaccination in 2021 will prevent a total loss of 10% in 2022 at a cost of up to 0.55 percent of GDP in the region [9]. Despite the favorable cost-effectiveness of vaccination, South Asian governments lack the financial resources, health infrastructure and delivery capacity needed to purchase and distribute vaccines. A better infrastructure is needed to centrally procure and distribute vaccines to resource-constrained nations. South Asian governments spend less than 2% of GDP on health, lagging all other regions [10]. Countries must continue to invest in preventive care, support health research, and expand their health infrastructure, especially the capacity for rapid and extensive production of vaccines. To dramatically reduce COVID-19-related morbidity and mortality, an efficient and safe vaccine must be made widely available to the public as soon as possible. However, just having a vaccine available does not guarantee universal immunological protection; the vaccine must also be considered acceptable by the medical profession and the public [12]. Table 1 shows the percentage of population vaccinated in South Asia.
Several studies have been conducted in the past to explore different effects of the pandemic on economies and societies in different parts of the world. COVID-19 also poses unique challenges for South Asian economies due to its large population and high poverty rates, deplorable health infrastructure, and poor socioeconomic conditions [14,15]. COVID-19 is not only a global pandemic, but it has also severely affected the global economy [16]. It has pushed millions of families into poverty and significantly increased income and wealth inequality [17]. Usman, Ali [18] explored how COVID-19 severely affects human lives around the world. Clark et al. (2020) investigated the impact of coronavirus disease 2019 (COVID19) on health systems and domestic resources in Africa and South Asia. Health systems in these regions are particularly at risk due to the potential for high prevalence of acute disease risk factors, household size, and limited health potential. The study also suggests that they desperately need intensive care beds, healthcare workers, and financial resources to meet demand during the COVID-19 pandemic. In addition, since the onset of the COVID-19 pandemic and its subsequent lockdown, schoolchildren around the world have lost an estimated 1.8 trillion hours of in-person learning [8].
Keeping in mind the previous discussion, COVID-19 infection has affected all sectors and parts of the world. It has also created a major challenge for South Asia due to its large population and poor socioeconomic conditions. Different measures are being taken in South Asia and other parts of the world to curb/reduce COVID-19 infection. Thus, this study was carried out with the aim of empirically analyzing different measures, including economic support measures, stringent measures, and health and containment measures implemented by South Asian countries to curb the spread of the corona virus in the region. This study will help policy makers in these countries to stem the spread of the COVID-19 pandemic based on the findings of the study.
2. Materials and Methods
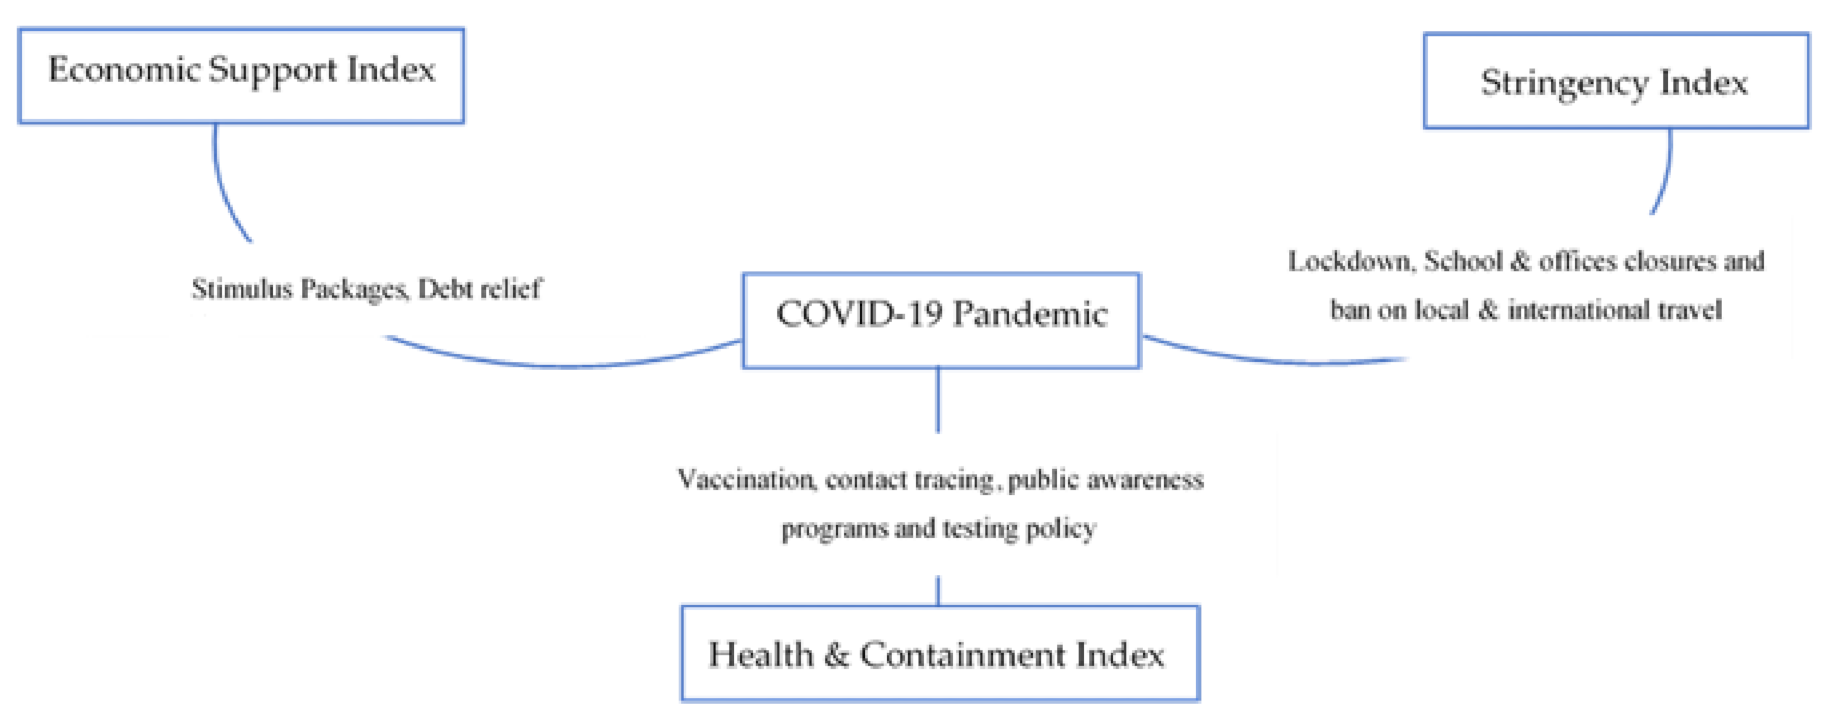
The core objective of this study was to assess the impact of policy measures adopted by the South Asian countries in reducing the COVID-19 pandemic. The study included seven countries of the region including Afghanistan, Bangladesh, Bhutan, Nepal, Pakistan, and Sri Lanka. Maldives was excluded from the study due to the unavailability of data on several variables. The study used weekly data for the time span from 1 January 2020 to 31 May 2021. The variables used are described in Table 2. Figure 3 depicts government policy measures to curb the spread of coronavirus.
The methodology of this study is threefold: first, before performing model regression, it is prudent to validate the properties of the variables. Several preliminary tests were carried out. These include: (a) the variance inflation factor (VIF), and the tolerance test which was applied to estimate the degree of multicollinearity between the variables. This test shows the influence of multilinearity on the precision of the calculated regression coefficients; (b) in addition, the cross sectional dependence (CSD) test was also employed to validate the cross-sectional dependence in the variables—this study used the Bias-corrected Scale LM [22], Pesaran Scaled LM test [23], Pesaran CSD test [24], and Breusch–Pagan LM test [25] to examine the CSD in the data series; (c) moreover, the second generation panel unit root test was used with the objective of avoiding biased information and inconsistent results. It was necessary to check the stationary level of the concerned variables. First, the study employed three unit-root tests i.e., Pesaran CADF [23], Breitung and Das [26], and the CIPS test [24]. The null hypothesis is that the variable is I(0) and the alternate hypothesis is that the variable is I(1). Second, this study employed Westerlund and Edgerton [27], which is a dynamically based error correction panel cointegration test that can combat the problems of heterogeneity and cross-dependence. It is a second-generation cointegration test that provides reliable and more accurate information about the long-term cointegration relationship between variables. Here, the null hypothesis is that there is no cointegration between the variables, against the alternative hypothesis where we have cointegration between the variables. If the probability value of the Z-statistic is less than the critical value; then we accept the alternative hypothesis of cointegration.
Third, this study used pooled mean group–autoregressive distributed lag (PMG-ARDL) model to explore the impact of different policy measures in reducing the COVID-19 pandemic in South Asia. The empirical model used in this study is expressed as below:
where, i = 1, …, N denotes the country and t = 1, …, t represents the period. CO is the COVID-19 index; ESI is the economic support index; HCI is the health and containment index. Moreover, β0, β1, β2, β3, and β4 are the parameters to be computed, ɛit is the residual term and assumed to be distributed normally with zero mean and constant variance, i.e., N (0, δ2). To investigate the short-run and long-run effect of policy measures on the COVID-19 pandemic, this study employed the pooled mean group–autoregressive distributed lag (PMG-ARDL) model developed by Pesaran, Shin [28]. According to Pesaran and Smith [29], the conventional approach like GMM estimators is considered to be inconsistent and potentially misleading, unless the slopes are identical [30,31]. Specification of the PMG-ARDL model including the short- and long-run impact of policy measures in reducing the COVID-19 pandemic is expressed as follows: Pesaran, Shin [28].
where ∆ denotes the difference operator, β and σ represent the parameters in the short and long-run respectively. represents the residual term of i cross section at time t. The ECT term represents the error correction term.
Finally, several diagnostics tests were applied to validate the variables’ characteristics, such as: (a) The Hausman test [32] was applied to test whether there is a significant difference between the pooled mean group and mean group estimators—null hypothesis under the Hausman test [32] is that the pooled mean group (PMG) is preferred; against the alternate hypothesis; where the mean group (MG) is preferred; (b) the Normality test [33] was applied to check whether the residual terms are normal distribution or not; and (c) the omitted variable bias test was employed to check the presence of a correlation between the regressor and the omitted variable. The Stata version 16 and EViews version 10 statistical software were used to perform econometric analysis.
3. Results and Discussions
This section displays the empirical results and discussions of the study. The first section presents descriptive statistics of the data series used in this study. Table 3 shows the descriptive statistics of the data series used in the study. These include average value and median of each data series followed by standard deviation for each country in South Asia. The mean value is the central value/average value of the dataset. The standard deviation gives the dispersion of the data from its mean value. A lower value of the standard deviation indicates that the date is clustered around the average value. In addition, it provides reliability and confidence in statistical conclusions.
Second, this study applied the tolerance and variance inflation factor (VIF) to test the presence of the multicollinearity problem between the independent variables, i.e., economic support index (ESI), stringency index (SI), and health and containment index (HCI). The findings validate the absence of severe multicollinearity amidst the independent variables as the value of tolerance in each case is larger than 0.2. Moreover, the value of VIF in each case is less than the global acceptable values of 5. These findings therefore imply that the independent variables can be assumed to have an effect on the COVID-19 pandemic.
Third, this study applied the cross-sectional dependence test to check the cross-sectional dependence in the error terms. Models of panel data are likely to show substantial cross-sectional dependence in the error terms, which may arise due to the presence of common shocks and unobserved components which, finally, become part of the residual term [34,35,36,37]. This leads to inconsistent and inefficient estimated coefficients. Therefore, the dependency of the error term must be checked to avoid this problem. Cross-sectional dependence occurs because of common shocks, overlooked shared effects, externalities, unobserved or latent components, and spatial effects [38]. This study employed four cross sectional dependency tests to check the cross-sectional interdependence. These include the Pesaran Scaled LM test [23], Bias-corrected Scale [22], Pesaran CSD [24], and Breusch–Pagan LM [25]. The findings of the CSD tests conclude that error terms have unobserved shocks across the cross-section [39,40].
Fourth, this study applied panel unit root tests to examine each data series for non-stationarity. Most economic data series follow a unit root process, thus non-stationary data series may lead to biased information and inconsistent results. Therefore, it is important to check the data series for unit root. Consequently, this study employed three second-generation panel unit root tests, i.e., Pesaran CADF [23], Breitung and Das test [26], and CIPS test [24]. Findings of the panel unit root tests are given in Table 4. Findings of all three second-generation panel unit root tests signified that all the variables are stationarized at first integrated order I(1) in both intercept and intercept and trend, at 1 and 5% level of significance.
Fifth, the findings of the panel unit root tests validated that none of the study data series is stationary at the second difference, i.e., I(2), so this study goes further with the cointegration test. The study employed the Westerlund and Edgerton [27] test, which is a dynamically based error correction panel cointegration test that can combat the problems of heterogeneity and cross-dependence. It is a second-generation cointegration test that provides reliable and more accurate information about the long-run cointegration relationship between the variables. Here, the null hypothesis is that there is no cointegration between the variables, against the alternative hypothesis where there is cointegration between the variables. Since the probability value of the Z-statistic is less than the critical value, we accept the alternative hypothesis of cointegration. Table 5 presents the results of the second-generation error correction panel cointegration test proposed by [27]. The results of this approach validated the presence of a cointegration relationship between the variables, which indicates that at least one variable contains a long-run unidirectional association.
Table 6 shows the results of the diagnostic tests. First, this study employs [32] to estimate the significant difference between the pooled mean group (PMG) and mean group (MG) estimators. The chi-square value is 1.37, which is statistically insignificant at the 5% significance level. This implies that the null hypothesis is accepted and concludes that the PMG-ARDL approach is preferred over MG-ARDL. Furthermore, PMG has the advantage of being less sensitive to outliers even for a small data cross-section and, at the same time, it can correct the serial autocorrelation problem. Second, the result of the normality test [41] shows that the residual terms are normally distributed, as its statistical value is insignificant, as the probability value is greater than 0.05. Third, the model used in this study was correctly specified, as the statistical value of the Ramsey RESET test [34] is also insignificant at the 5% significance level.
Finally, this study applied the dynamic pooled mean group–autoregressive distributed lag (PMG-ARDL) model to investigate the effectiveness of government policy measures in reducing the COVID-19 pandemic. In addition, we applied both pooled mean group (PMG) and mean group (MG) based on the panel ARDL approach to derive the asymptotic and coherent properties of the estimator for both stationarity at the level and first difference [42,43]. The PMG technique not only allows for the estimation of the cointegration, but also provides the error correction coefficient that validates the presence of the long-run relationship between cointegrated variables. Table 7 presents the findings of both PMG-ARDL and MG-ARDL. Results of both PMG-ARDL and MG-ARDL show that coefficients of the economic support index, stringency index, and health and containment index carry a negative sign and are significant at the 5% level of significance in the long-run. These results concluded that all these measures play a significant role in reducing the COVID-19 pandemic in the long-run. The coefficient of economic support index with a negative sign, and p-value of less than 5% explored how government financial support for poor families during the pandemic plays a significant role in reducing the spread of COVID-19 infection. These results are in line with the findings of [44,45]. The stringency coefficient index with negative sign and significant p value provides evidence that the spread of the COVID-19 epidemic can be significantly suppressed by stringency measures adopted by the South Asian countries in the long-run. These findings are consistent with the findings of [12,46,47].
Finally, the health and containment index with a negative and significant coefficient validated the strong effectiveness of health and containment measures in reducing the infection of COVID-19. These results are also consistent with the findings of [48,49].
In the short-run, the findings of the present study support that only the health and containment index with a negative and significant coefficient indicates that health and containment measures significantly reduce the risk of resurgence. These outcomes are consistent with the results of [50]. Although stimulus packages and other stringent measures play a substantial role in reducing COVID-19 morbidity in the long-run, these findings are consistent with [51]. The ECT coefficient carries a negative sign and is significant at the 5% level of significance, implying that the model converges to a long-run relationship and is dynamically stable. A long-run relationship exists if the error correction term carries a negative sign and is significant [52]. Furthermore, the ECT value illustrates that the short-run imbalance will automatically adjust in the long-run with an adjustment effect of 58% per year [53].
4. Conclusions and Policy Implications
The core objective of this study was to assess the role of the pharmaceutical and non-pharmaceutical policy measures adopted by South Asian countries to reduce the COVID-19 pandemic using the weekly data for the time span from 1 January 2020 to 31 May 2021. The study applied the dynamic pooled mean group–autoregressive distributed lag (PMG-ARDL) model to explore the role of government policy measures in reducing the COVID-19 pandemic.
Findings of PMG-ARDL and MG-ARDL show that economic support, stringency, and health and containment measures play a significant role in reducing the COVID-19 pandemic in the long-run. The health and containment index also validated the strong effectiveness of health and containment measures in reducing the incidence of COVID-19. In the short-run, the findings of the present study support that only the health and containment index significantly reduces the risk of resurgence. The study also concluded that stimulus packages and other stringent measures play a substantial role in reducing COVID-19 in the long-run. Furthermore, the ECT value illustrates that the short-term imbalance will automatically adjust in the long-term with an adjustment effect of 58% per year. The study’s findings will support policy makers in preventing new waves and uncontrolled outbreaks of infections. In addition, strategic public health campaigns related to the COVID-19 pandemic are effective in controlling the spread of SARS-CoV-2.
Finally, this study recommends that government financial support for poor families, stringency, health and containment measures, must all be adopted during the pandemic to reduce the spread of COVID-19. In addition, it is also recommended to provide vaccines free of charge to developing countries and a stimulus package to support health research to expand the capacity for rapid vaccination in this region.
Author Contributions
Conceptualization, D.K. and N.A.; methodology, I.u.H.; software, N.A.; validation, D.K., N.A., I.u.H., and B.M.; formal analysis, D.K., N.A.; investigation, I.u.H.; resources, B.M.; data curation, N.A. and I.u.H.; writing—original draft preparation, N.A., D.K., B.M. and I.u.H.; writing—review and editing, D.K., N.A., B.M., and I.u.H.; visualization, B.M.; supervision, D.K. and B.M.; project administration, I.u.H. and B.M.; funding acquisition, I.u.H. and B.M. All authors have read and agreed to the published version of the manuscript.
Funding
This research received no external funding.
Institutional Review Board Statement
Not applicable.
Informed Consent Statement
Not applicable.
Data Availability Statement
Data is openly accessed and freely available to everyone.
Conflicts of Interest
The authors declare no conflict of interest.
References
- DeSimone, D.C. COVID-19 Variants: What’s the Concern? Available online: https://www.mayoclinic.org/diseases-conditions/coronavirus/expert-answers/covid-variant/faq-20505779 (accessed on 21 August 2021).
- Dougherty, K. SARS-CoV-2 B.1.617.2 (Delta) Variant COVID-19 Outbreak Associated with a Gymnastics Facility—Oklahoma, April–May 2021. Available online: https://www.cdc.gov/mmwr/volumes/70/wr/mm7028e2.htm (accessed on 16 June 2021).
- Miller, A.; Reandelar, M.J.; Fasciglione, K.; Roumenova, V.; Li, Y.; Otazu, G.H. Correlation between universal BCG vaccination policy and reduced morbidity and mortality for COVID-19: An epidemiological study. MedRxiv 2020, 2020.03.24.20042937. [Google Scholar] [CrossRef] [Green Version]
- Ourworldindata. Coronavirus (COVID-19) Cases–Statistics and Research. Available online: https://ourworldindata.org/covid-cases (accessed on 23 September 2021).
- Perra, N. Non-pharmaceutical interventions during the COVID-19 pandemic: A review. Phys. Rep. 2021, 913, 1–52. [Google Scholar] [CrossRef]
- Ceylan, Z. Estimation of COVID-19 prevalence in Italy, Spain, and France. Sci. Total Environ. 2020, 729, 138817. [Google Scholar] [CrossRef]
- UNICEF. Nearly 22 Million Children in South Asia Miss Out on Early Education in Critical Pre-School Year Due to COVID-19. Available online: https://economictimes.indiatimes.com/news/international/world-news/22-million-children-from-south-asia-missed-out-on-early-childhood-education-due-to-covid-19-unicef/articleshow/77111511.cms?from=mdr (accessed on 22 June 2020).
- UNICEF. Schoolchildren Worldwide Have Lost 1.8 Trillion Hours and Counting of In-Person Learning Due to COVID-19 Lockdowns, Says UNICEF. Available online: https://www.unicef.org/press-releases/schoolchildren-worldwide-have-lost-18-trillion-hours-and-counting-person-learning (accessed on 17 July 2021).
- World Bank. South Asia Economic Focus: South Asia Vaccination. 2021. Available online: https://www.worldbank.org/en/region/sar/publication/south-asia-vaccinates-south-asia-economic-focus-spring-2021 (accessed on 23 September 2021).
- Haldar, A.; Sethi, N. The effect of country-level factors and government intervention on the incidence of COVID-19. Asian Econ. Lett. 2020, 1, 17804. [Google Scholar] [CrossRef]
- Erokhin, V.; Gao, T. Impacts of COVID-19 on trade and economic aspects of food security: Evidence from 45 developing countries. Int. J. Environ. Res. Public Health 2020, 17, 5775. [Google Scholar] [CrossRef] [PubMed]
- Moghadas, S.M.; Fitzpatrick, M.C.; Sah, P.; Pandey, A.; Shoukat, A.; Singer, B.H.; Galvani, A.P. The implications of silent transmission for the control of COVID-19 outbreaks. Proc. Natl. Acad. Sci. USA 2020, 117, 17513–17515. [Google Scholar] [CrossRef] [PubMed]
- Ourworldindata. Coronavirus (COVID-19) Vaccinations. Available online: https://ourworldindata.org/covid-vaccinations (accessed on 16 September 2021).
- Hossain, M.M.; Purohit, N.; Sharma, R.; Bhattacharya, S.; McKyer, E.L.J.; Ma, P. Suicide of a farmer amid COVID-19 in India: Perspectives on social determinants of suicidal behavior and prevention strategies. SocArXiv 2020, ekam3. [Google Scholar] [CrossRef]
- Rasul, G.; Nepal, A.K.; Hussain, A.; Maharjan, A.; Joshi, S.; Lama, A.; Gurung, P.; Ahmad, F.; Mishra, A.; Sharma, E. Socio-Economic Implications of Covid-19 Pandemic in South Asia: Emerging risks and growing challenges. Front. Sociol. 2021, 6, 629693. [Google Scholar] [CrossRef] [PubMed]
- Pak, A.; Adegboye, O.A.; Adekunle, A.I.; Rahman, K.M.; McBryde, E.S.; Eisen, D.P. Economic consequences of the COVID-19 outbreak: The need for epidemic preparedness. Front. Public Health 2020, 8, 241. [Google Scholar] [CrossRef]
- Younas, U. The Impact of COVID-19 on South Asian Economies. Available online: https://www.usip.org/publications/2021/08/impact-covid-19-south-asian-economies (accessed on 3 August 2021).
- Usman, M.; Ali, Y.; Riaz, A.; Riaz, A.; Zubair, A. Economic perspective of coronavirus (COVID-19). J. Public Aff. 2020, 20, e2252. [Google Scholar]
- Khan, D.; Ullah, A.; Alim, W.; Haq, I.U. Does terrorism affect the stock market returns and volatility? Evidence from Pakistan’s stock exchange. J. Public Aff. 2020, e2304. [Google Scholar] [CrossRef]
- Dong, E.; Du, H.; Gardner, L. An interactive web-based dashboard to track COVID-19 in real time. Lancet Infect. Dis. 2020, 20, 533–534. [Google Scholar] [CrossRef]
- Hale, T.; Angrist, N.; Goldszmidt, R.; Kira, B.; Petherick, A.; Phillips, T.; Webster, S.; Cameron-Blake, E.; Hallas, L.; Majumdar, S.; et al. A global panel database of pandemic policies (Oxford COVID-19 Government Response Tracker). Nat. Hum. Behav. 2021, 5, 529–538. [Google Scholar] [CrossRef]
- Baltagi, B.H.; Feng, Q.; Kao, C. A Lagrange Multiplier test for cross-sectional dependence in a fixed effects panel data model. J. Econom. 2012, 170, 164–177. [Google Scholar] [CrossRef] [Green Version]
- Pesaran, M. General Diagnostic Tests for Cross Section Dependence in Panels; University of Cambridge: Cambridge, UK, 2004. [Google Scholar]
- Pesaran, M.H. A simple panel unit root test in the presence of cross-section dependence. J. Appl. Econom. 2007, 22, 265–312. [Google Scholar] [CrossRef] [Green Version]
- Breusch, T.S.; Pagan, A.R. The Lagrange multiplier test and its applications to model specification in econometrics. Rev. Econ. Stud. 1980, 47, 239–253. [Google Scholar] [CrossRef]
- Breitung, J.; Pesaran, M.H.; Institute of Economic Policy Research. Unit Roots and Cointegration in Panels (No. 05.32). 2005. Available online: https://econpapers.repec.org/RePEc:scp:wpaper:05-32 (accessed on 20 July 2021).
- Westerlund, J.; Edgerton, D.L. A panel bootstrap cointegration test. Econ. Lett. 2007, 97, 185–190. [Google Scholar] [CrossRef]
- Pesaran, M.H.; Shin, Y.; Smith, R.P. Pooled mean group estimation of dynamic heterogeneous panels. J. Am. Stat. Assoc. 1999, 94, 621–634. [Google Scholar] [CrossRef]
- Pesaran, M.H.; Smith, R. Estimating long-run relationships from dynamic heterogeneous panels. J. Econom. 1995, 68, 79–113. [Google Scholar] [CrossRef]
- Bahmani-Oskooee, M.; Domac, I. On the link between dollarisation and inflation: Evidence from Turkey. Comp. Econ. Stud. 2003, 45, 306–328. [Google Scholar] [CrossRef]
- Kumar, S.; Managi, S. Does stringency of lockdown affect air quality? Evidence from Indian cities. Econ. Disasters Clim. Chang. 2020, 4, 481–502. [Google Scholar] [CrossRef]
- Hausman, J.A. Specification tests in econometrics. Econom. J. Econom. Soc. 1978, 46, 1251–1271. [Google Scholar] [CrossRef] [Green Version]
- Galvao, A.F.; Montes-Rojas, G.; Sosa-Escudero, W.; Wang, L. Tests for skewness and kurtosis in the one-way error component model. J. Multivar. Anal. 2013, 122, 35–52. [Google Scholar] [CrossRef]
- Ramsey, J.B. Tests for specification errors in classical linear least-squares regression analysis. J. R. Stat. Soc. Ser. B Methodol. 1969, 31, 350–371. [Google Scholar] [CrossRef]
- Robertson, D.; Symons, J. Factor Residuals in SUR Regressions: Estimating Panels Allowing for Cross Sectional Correlation; Centre for Economic Performance, London School of Economics and Political Science: London, UK, 2000. [Google Scholar]
- Baltagi, B.H.; Bratberg, E.; Holmås, T.H. A panel data study of physicians’ labor supply: The case of Norway. Health Econ. 2005, 14, 1035–1045. [Google Scholar] [CrossRef] [Green Version]
- Anselin, L. Spatial Econometrics, in A Companion to Theoretical Econometrics; John & Wiley & Sons: Hoboken, NJ, USA, 2007; pp. 310–330. [Google Scholar]
- De Hoyos, R.E.; Sarafidis, V. Testing for cross-sectional dependence in panel-data models. Stata J. 2006, 6, 482–496. [Google Scholar] [CrossRef] [Green Version]
- Piani, C.; Weedon, G.P.; Best, M.; Gomes, S.M.; Viterbo, P.; Hagemann, S.; Haerter, J.O. Statistical bias correction of global simulated daily precipitation and temperature for the application of hydrological models. J. Hydrol. 2010, 395, 199–215. [Google Scholar] [CrossRef]
- Teutschbein, C.; Seibert, J. Bias correction of regional climate model simulations for hydrological climate-change impact studies: Review and evaluation of different methods. J. Hydrol. 2012, 456, 12–29. [Google Scholar] [CrossRef]
- Jarque, C.M.; Bera, A.K. A Test for Normality of Observations and Regression Residuals. Int. Stat. Rev. 1987, 55, 163–172. [Google Scholar] [CrossRef]
- Asteriou, D.; Hall, S.G. Applied Econometrics: A Modern Approach, Revised Edition; Palgrave Macmillan: Hampshire, UK, 2007; Volume 46, pp. 117–155. [Google Scholar]
- Roudet-Tavert, G.; Michon, T.; Walter, J.; Delaunay, T.; Redondo, E.; Le Gall, O. Central domain of a potyvirus VPg is involved in the interaction with the host translation initiation factor eIF4E and the viral protein HcPro. J. Gen. Virol. 2007, 88, 1029–1033. [Google Scholar] [CrossRef]
- Siddik, M. Economic stimulus for COVID-19 pandemic and its determinants: Evidence from cross-country analysis. Heliyon 2020, 6, e05634. [Google Scholar] [CrossRef] [PubMed]
- Fiore, V.G.; DeFelice, N.; Glicksberg, B.S.; Perl, O.; Shuster, A.; Kulkarni, K.; O’Brien, M.; Pisauro, M.A.; Chung, D.; Gu, X. Containment of COVID-19: Simulating the impact of different policies and testing capacities for contact tracing, testing, and isolation. PLoS ONE 2021, 16, e0247614. [Google Scholar] [CrossRef] [PubMed]
- Atalan, A. Is the lockdown important to prevent the COVID-19 pandemic? Effects on psychology, environment and economy-perspective. Ann. Med. Surg. 2020, 56, 38–42. [Google Scholar] [CrossRef]
- Rader, B.; White, L.F.; Burns, M.R.; Chen, J.; Brilliant, J.; Cohen, J.; Shaman, J.; Brilliant, L.; Kraemer, M.U.G.; Hawkins, J.B.; et al. Mask wearing and control of SARS-CoV-2 transmission in the United States. medRxiv 2020, 2020.08.23.20078964. [Google Scholar] [CrossRef]
- Jabłońska, K.; Aballéa, S.; Toumi, M. The real-life impact of vaccination on COVID-19 mortality in Europe and Israel. Public Health 2021, 198, 230–237. [Google Scholar] [CrossRef] [PubMed]
- Nesteruk, I. Impact of vaccination and undetected cases on the COVID-19 pandemic dynamics in Qatar in 2021. medRxiv 2021, 2021.05.27.21257929. [Google Scholar] [CrossRef]
- Skoll, D.; Miller, J.C.; Saxon, L.A. COVID-19 testing and infection surveillance: Is a combined digital contact-tracing and mass-testing solution feasible in the United States? Cardiovasc. Digit. Health J. 2020, 1, 149–159. [Google Scholar] [CrossRef]
- Prusty, S.; Anubha; Gupta, S. On the Road to Recovery: The Role of Post-Lockdown Stimulus Package. FIIB Bus. Rev. 2021, 23197145211013691. [Google Scholar] [CrossRef]
- Apostolidou, I.; Mattas, K.; Loizou, E.; Michailidis, A. Agriculture’s Role in Economic Growth: An Exploratory Study Among Southern and Northern EU Countries; Springer: Cham, Switzerland, 2015; pp. 147–162. [Google Scholar]
- Odhiambo, N.M. Electricity consumption and economic growth in South Africa: A trivariate causality test. Energy Econ. 2009, 31, 635–640. [Google Scholar] [CrossRef]
Figure 1.
Maximum reported cases of COVID-19 per million population [4].
Figure 1.
Maximum reported cases of COVID-19 per million population [4].

Figure 2.
Monthly reported cases of COVID-19 per million population [4].
Figure 2.
Monthly reported cases of COVID-19 per million population [4].

Figure 3.
Government policy measures to curb the spread of coronavirus.


Table 1.
Percentage of population vaccinated in South Asia.
| Countries | Percentage of Population Vaccinated | Dated |
|---|---|---|
| Afghanistan | 1.94% | 31 August 2021 |
| Bangladesh | 12.8% | 15 September 2021 |
| Bhutan | 62.5% | 15 September 2021 |
| India | 41.4% | 15 September 2021 |
| Nepal | 20.2% | 15 September 2021 |
| Pakistan | 23.5% | 14 September 2021 |
| Sri Lanka | 63.3% | 15 September 2021 |
Source: [13].
Table 2.
Description of the data series used in the study.
| COVID-19 index | The COVID-19 index was constructed from two components, namely confirmed reported cases and death cases from coronavirus 2. (SARS-CoV-2) for selected countries. The study uses the following formula to estimate the index [19]: where; Ln is the natural logarithm, Rit is the number of cases reported at time t for country i; Dit is the number of death cases at time t for ith country [20]. |
| Economic support index | The economic support index was constructed from two indicators. These include government income support and debt/contract relief for family programs, based on a tracker compiled by Oxford University’s Blavatnik School of Government [21]. |
| Stringency index | Stringency index was calculated from nine indicators. These include closing schools, closing workplaces, canceling public events, restrictions on public gathering, closing public transport, stay at home requirements, public information campaigns, internal movement restrictions, and restrictions on international travel, based on a tracker compiled by Oxford University’s Blavatnik School of Government [21]. |
| Health and containment index | The health and containment index was calculated based on 4 indicators representing the total vaccinated per million population, public awareness campaigns, testing policy and contact tracking, based on a tracker compiled by the Oxford University’s Blavatnik School of Government [21]. |
Table 3.
Descriptive statistics of the data series used in the study.
| Countries | Variables | Mean | Median | S. Deviation |
|---|---|---|---|---|
| Afghanistan | CO | 1.48 | 0.82 | 1.45 |
| ESI | 37.52 | 35.70 | 3.03 | |
| SI | 69.65 | 65.45 | 11.98 | |
| HCI | 69.23 | 66.64 | 11.02 | |
| Bangladesh | CO | 10.59 | 11.01 | 1.43 |
| ESI | 45.98 | 45.22 | 8.32 | |
| SI | 87.91 | 85.68 | 9.00 | |
| HCI | 57.87 | 60.40 | 16.37 | |
| Bhutan | CO | 0.15 | 0.00 | 0.46 |
| ESI | 47.61 | 45.22 | 7.81 | |
| SI | 49.97 | 46.41 | 10.57 | |
| HCI | 60.32 | 58.31 | 8.28 | |
| India | CO | 5.96 | 5.68 | 2.18 |
| ESI | 59.74 | 57.12 | 8.27 | |
| SI | 71.91 | 69.02 | 8.29 | |
| HCI | 71.36 | 69.02 | 7.72 | |
| Nepal | CO | 4.88 | 3.62 | 2.98 |
| ESI | 80.08 | 79.73 | 8.78 | |
| SI | 81.22 | 80.92 | 8.65 | |
| HCI | 64.12 | 62.82 | 8.68 | |
| Pakistan | CO | 9.14 | 9.97 | 3.53 |
| ESI | 65.66 | 64.26 | 7.90 | |
| SI | 77.59 | 76.16 | 8.41 | |
| HCI | 60.34 | 58.31 | 8.93 | |
| Sri Lanka | CO | 7.24 | 7.50 | 2.36 |
| ESI | 80.91 | 83.01 | 11.28 | |
| SI | 83.80 | 83.01 | 11.94 | |
| HCI | 61.99 | 60.69 | 7.76 |
Table 4.
Second generation panel unit root findings.
| Series | Breitung and Das Test | CIPS Test | CADF Test | |||
|---|---|---|---|---|---|---|
| Level | First Diff | Level | First Diff | Level | First Diff | |
| Intercept | ||||||
| CO | −2.72 | −3.63 ** | −1.23 | −3.09 ** | −1.98 | −2.33 ** |
| ESI | −2.09 | 3.74 * | −2.31 | 3.49 ** | −3.18 | 4.19 * |
| SI | −2.34 | −3.12 ** | −0.12 *** | −2.16 ** | −2.48 | −3.31 ** |
| HCI | −2.34 | −3.13 ** | −2.41 | −3.48 ** | −2.71 | −3.61 ** |
| Intercept and trend | ||||||
| CO | −1.33 *** | −4.66 * | −2.39 | 3.91 * | −1.05 *** | −2.42 * |
| ESI | −2.18 | 3.19 ** | −3.28 | 4.53 ** | −2.50 | 3.67 ** |
| SI | −2.51 | −3.79 * | −2.66 | 4.13 * | −2.09 | −3.70 * |
| HCI | −1.16 | −2.73 * | −2.09 | −4.33 ** | −2.30 *** | −3.83 * |
*, **, and *** indicate 1%, 5%, and 10% level of significance.
Table 5.
Results of Westerlund second-generation error correction panel cointegration test.
| Statistics | Values | Z-Values | p Values |
|---|---|---|---|
| Gt | −3.12 | −6.21 | <0.01 |
| Ga | −16.32 | −8.51 | <0.01 |
| Pt | −10.14 | −4.26 | <0.01 |
| Pt | −14.5 | −9.91 | <0.01 |
Source: Authors’ calculation.
Table 6.
Findings of the diagnostic tests.
| Diagnostic Tests | Test Statistics | p-Value |
|---|---|---|
| Hausman test [32] | 1.37 | 0.11 |
| Normality test [41] | 0.87 | 0.69 |
| Ramsey RESET test [34] | 1.41 | 0.57 |
Source: Authors’ calculation.
Table 7.
Findings of the pooled mean group (PMG) and mean group (MG).
| Pooled Mean Group Estimates | Mean Group Estimates | ||||||
|---|---|---|---|---|---|---|---|
| Long-run estimates | |||||||
| Series | Parameters | Value | Std. error | t-stat | Value | Std. error | t-stat |
| CO | σ1 | −2.91 ** | 0.94 | −3.10 | −3.32 ** | 1.07 | −3.10 |
| ESI | σ2 | −3.40 ** | 1.20 | −2.83 | −3.88 ** | 1.37 | −2.83 |
| SI | σ3 | −4.19 ** | 1.89 | −2.22 | −4.78 ** | 2.15 | −2.22 |
| HCI | σ4 | −3.41 ** | 1.02 | −3.34 | −3.89 ** | 1.16 | −3.34 |
| Short-run estimates | |||||||
| ∆CO | βij | −2.21 ** | 0.79 | −2.80 | −2.52 ** | 0.90 | −2.80 |
| ∆ESI | βil | −2.59 *** | 1.36 | −1.91 | −2.47 | 1.37 | −1.81 |
| ∆SI | βir | −2.75 ** | 2.19 | −1.26 | −3.14 ** | 2.50 | −1.26 |
| ∆HCI | βis | −4.79 | 1.82 | −2.63 | −5.46 | 2.07 | −2.63 |
| Constant | Βo | −2.85 ** | 0.96 | −2.97 | −3.25 ** | 1.09 | −2.97 |
| Error Correction Term | σ5 | −0.58 ** | 0.17 | −3.41 | −0.66 ** | 0.19 | −3.41 |
*, **, & *** show 1%, 5%, and 10% level of significance.
Publisher’s Note: MDPI stays neutral with regard to jurisdictional claims in published maps and institutional affiliations. |
© 2021 by the authors. Licensee MDPI, Basel, Switzerland. This article is an open access article distributed under the terms and conditions of the Creative Commons Attribution (CC BY) license (https://creativecommons.org/licenses/by/4.0/).
Share and Cite
MDPI and ACS Style
Khan, D.; Ahmed, N.; Mehmed, B.; Haq, I.u. Assessing the Impact of Policy Measures in Reducing the COVID-19 Pandemic: A Case Study of South Asia. Sustainability 2021, 13, 11315. https://0-doi-org.brum.beds.ac.uk/10.3390/su132011315
AMA Style
Khan D, Ahmed N, Mehmed B, Haq Iu. Assessing the Impact of Policy Measures in Reducing the COVID-19 Pandemic: A Case Study of South Asia. Sustainability. 2021; 13(20):11315. https://0-doi-org.brum.beds.ac.uk/10.3390/su132011315
Chicago/Turabian StyleKhan, Dilawar, Nihal Ahmed, Bahtiyar Mehmed, and Ihtisham ul Haq. 2021. "Assessing the Impact of Policy Measures in Reducing the COVID-19 Pandemic: A Case Study of South Asia" Sustainability 13, no. 20: 11315. https://0-doi-org.brum.beds.ac.uk/10.3390/su132011315
Note that from the first issue of 2016, this journal uses article numbers instead of page numbers. See further details here.