
The Interface between the Brand of Higher Education and the Influencing Factors


 ,
,  and
and
Abstract
:1. Introduction
2. Literature Review
2.1. Social Network
2.2. Student Motivation
- characteristics of the user (cultural, social, and personal);
- user psychology (motivation, perception, learning, and memory).
- Primary—Groups with which a person interacts on a regular basis. For example, family, friends, co-workers;
- Secondary—These are groups with which communication is more formal. For example, professional, religious, or interest groups.
2.3. Measures of Brand Distinctiveness
3. Methodological Approach and Methods
- the Cronbach alpha coefficient, used in order to determine the reliability of the variables of the formed model;
- the Kaiser–Meyer–Olkin measure of sampling adequacy (KMO) and Bartlett’s test of sphericity, used in order to check data suitability for the factor analysis;
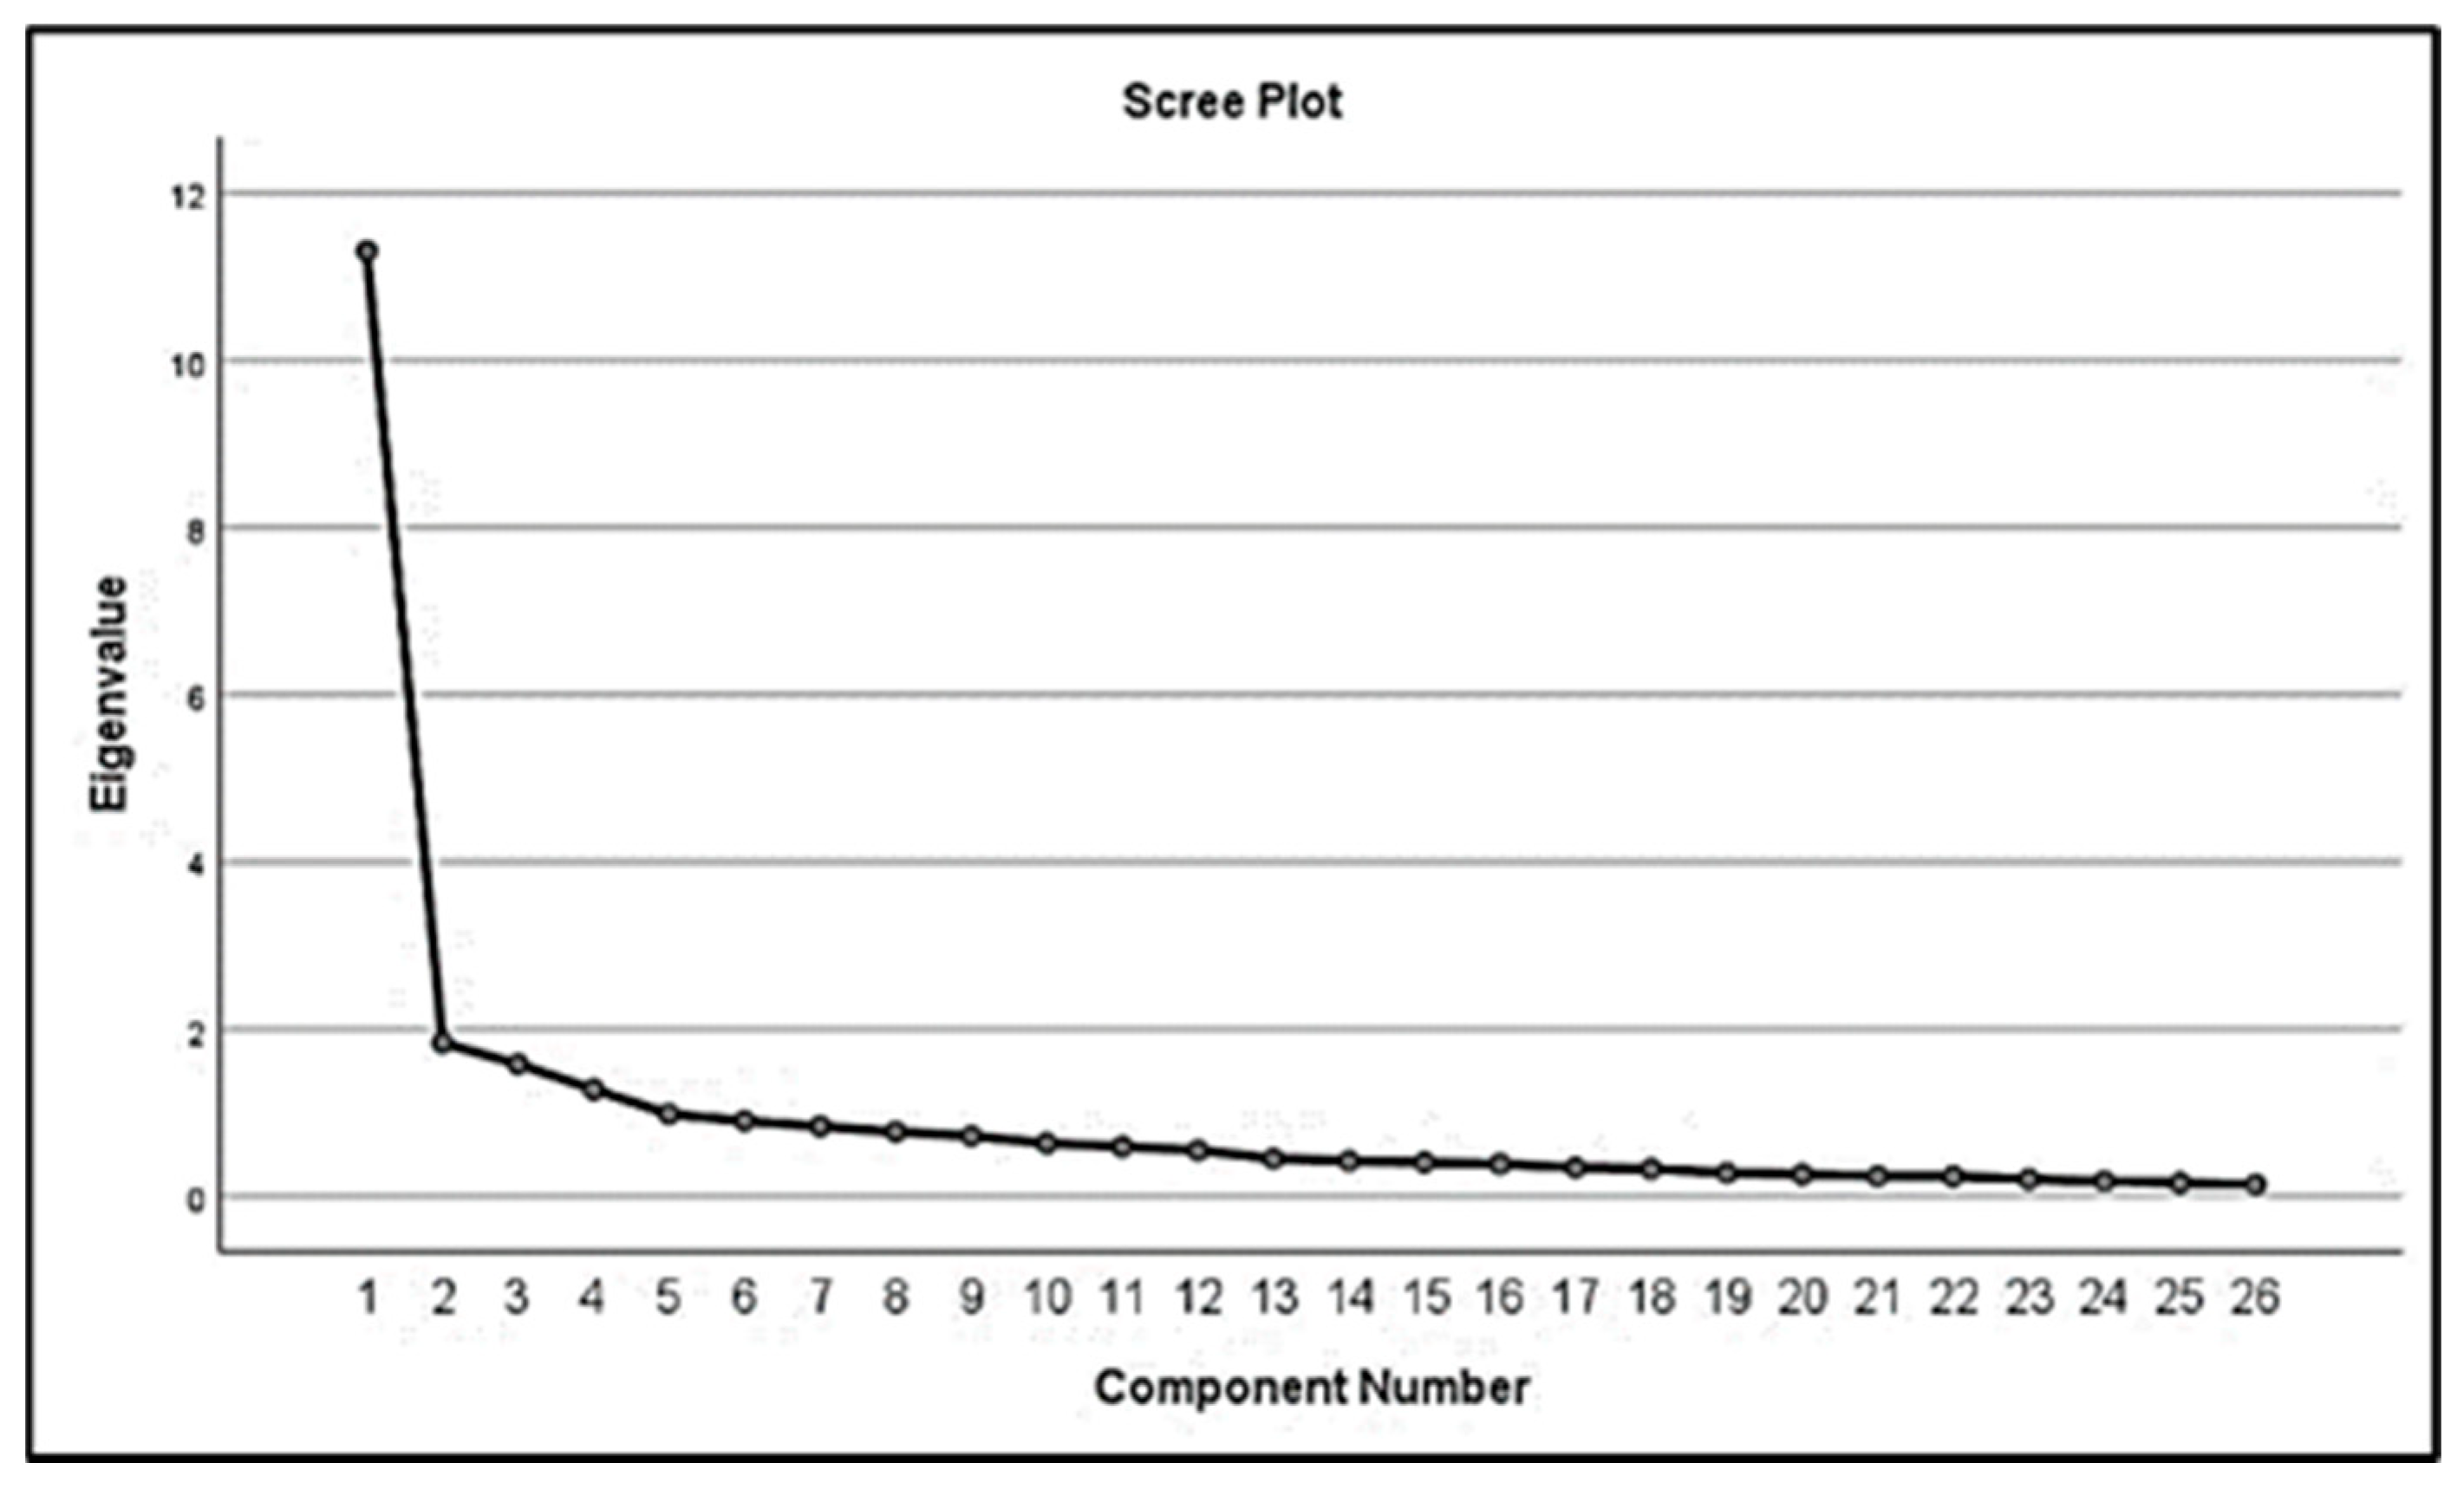
- the scree plot, used to determine the breakpoint;
- descriptive statistics, aimed at summing up the collected data in a clear and understandable way;
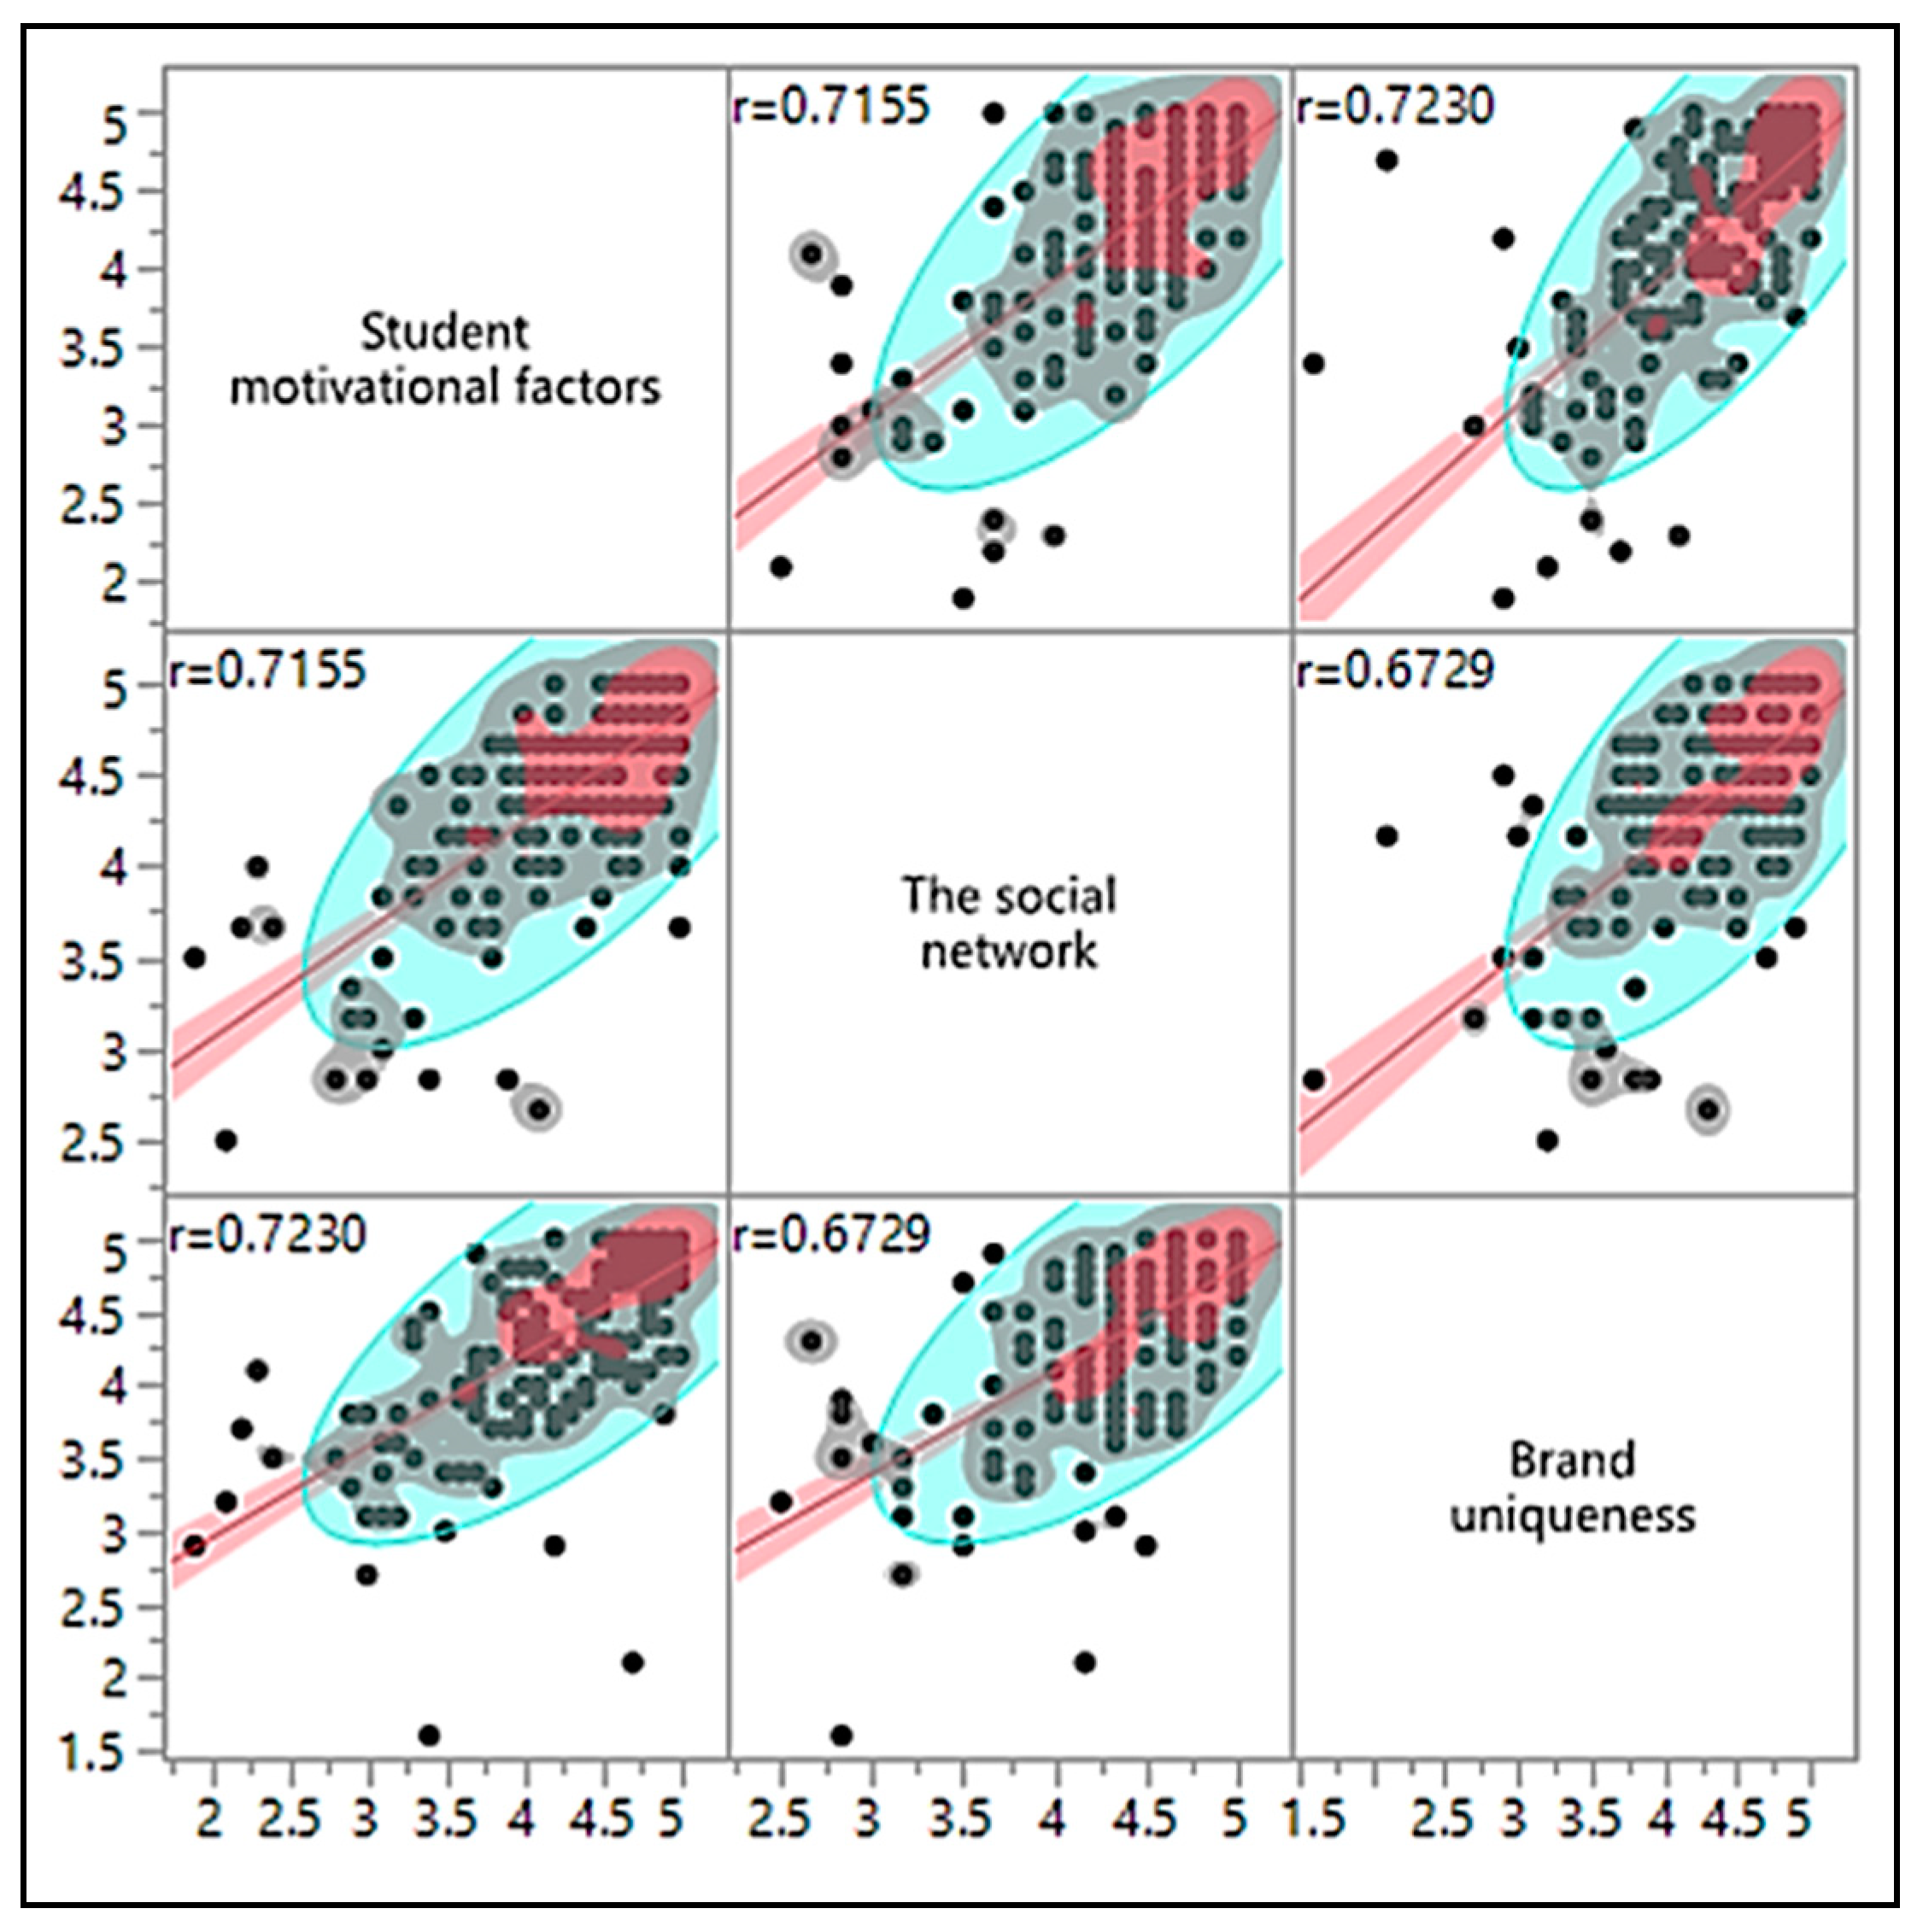
- correlation analysis, made so as to determine mutual connectedness between the phenomena;
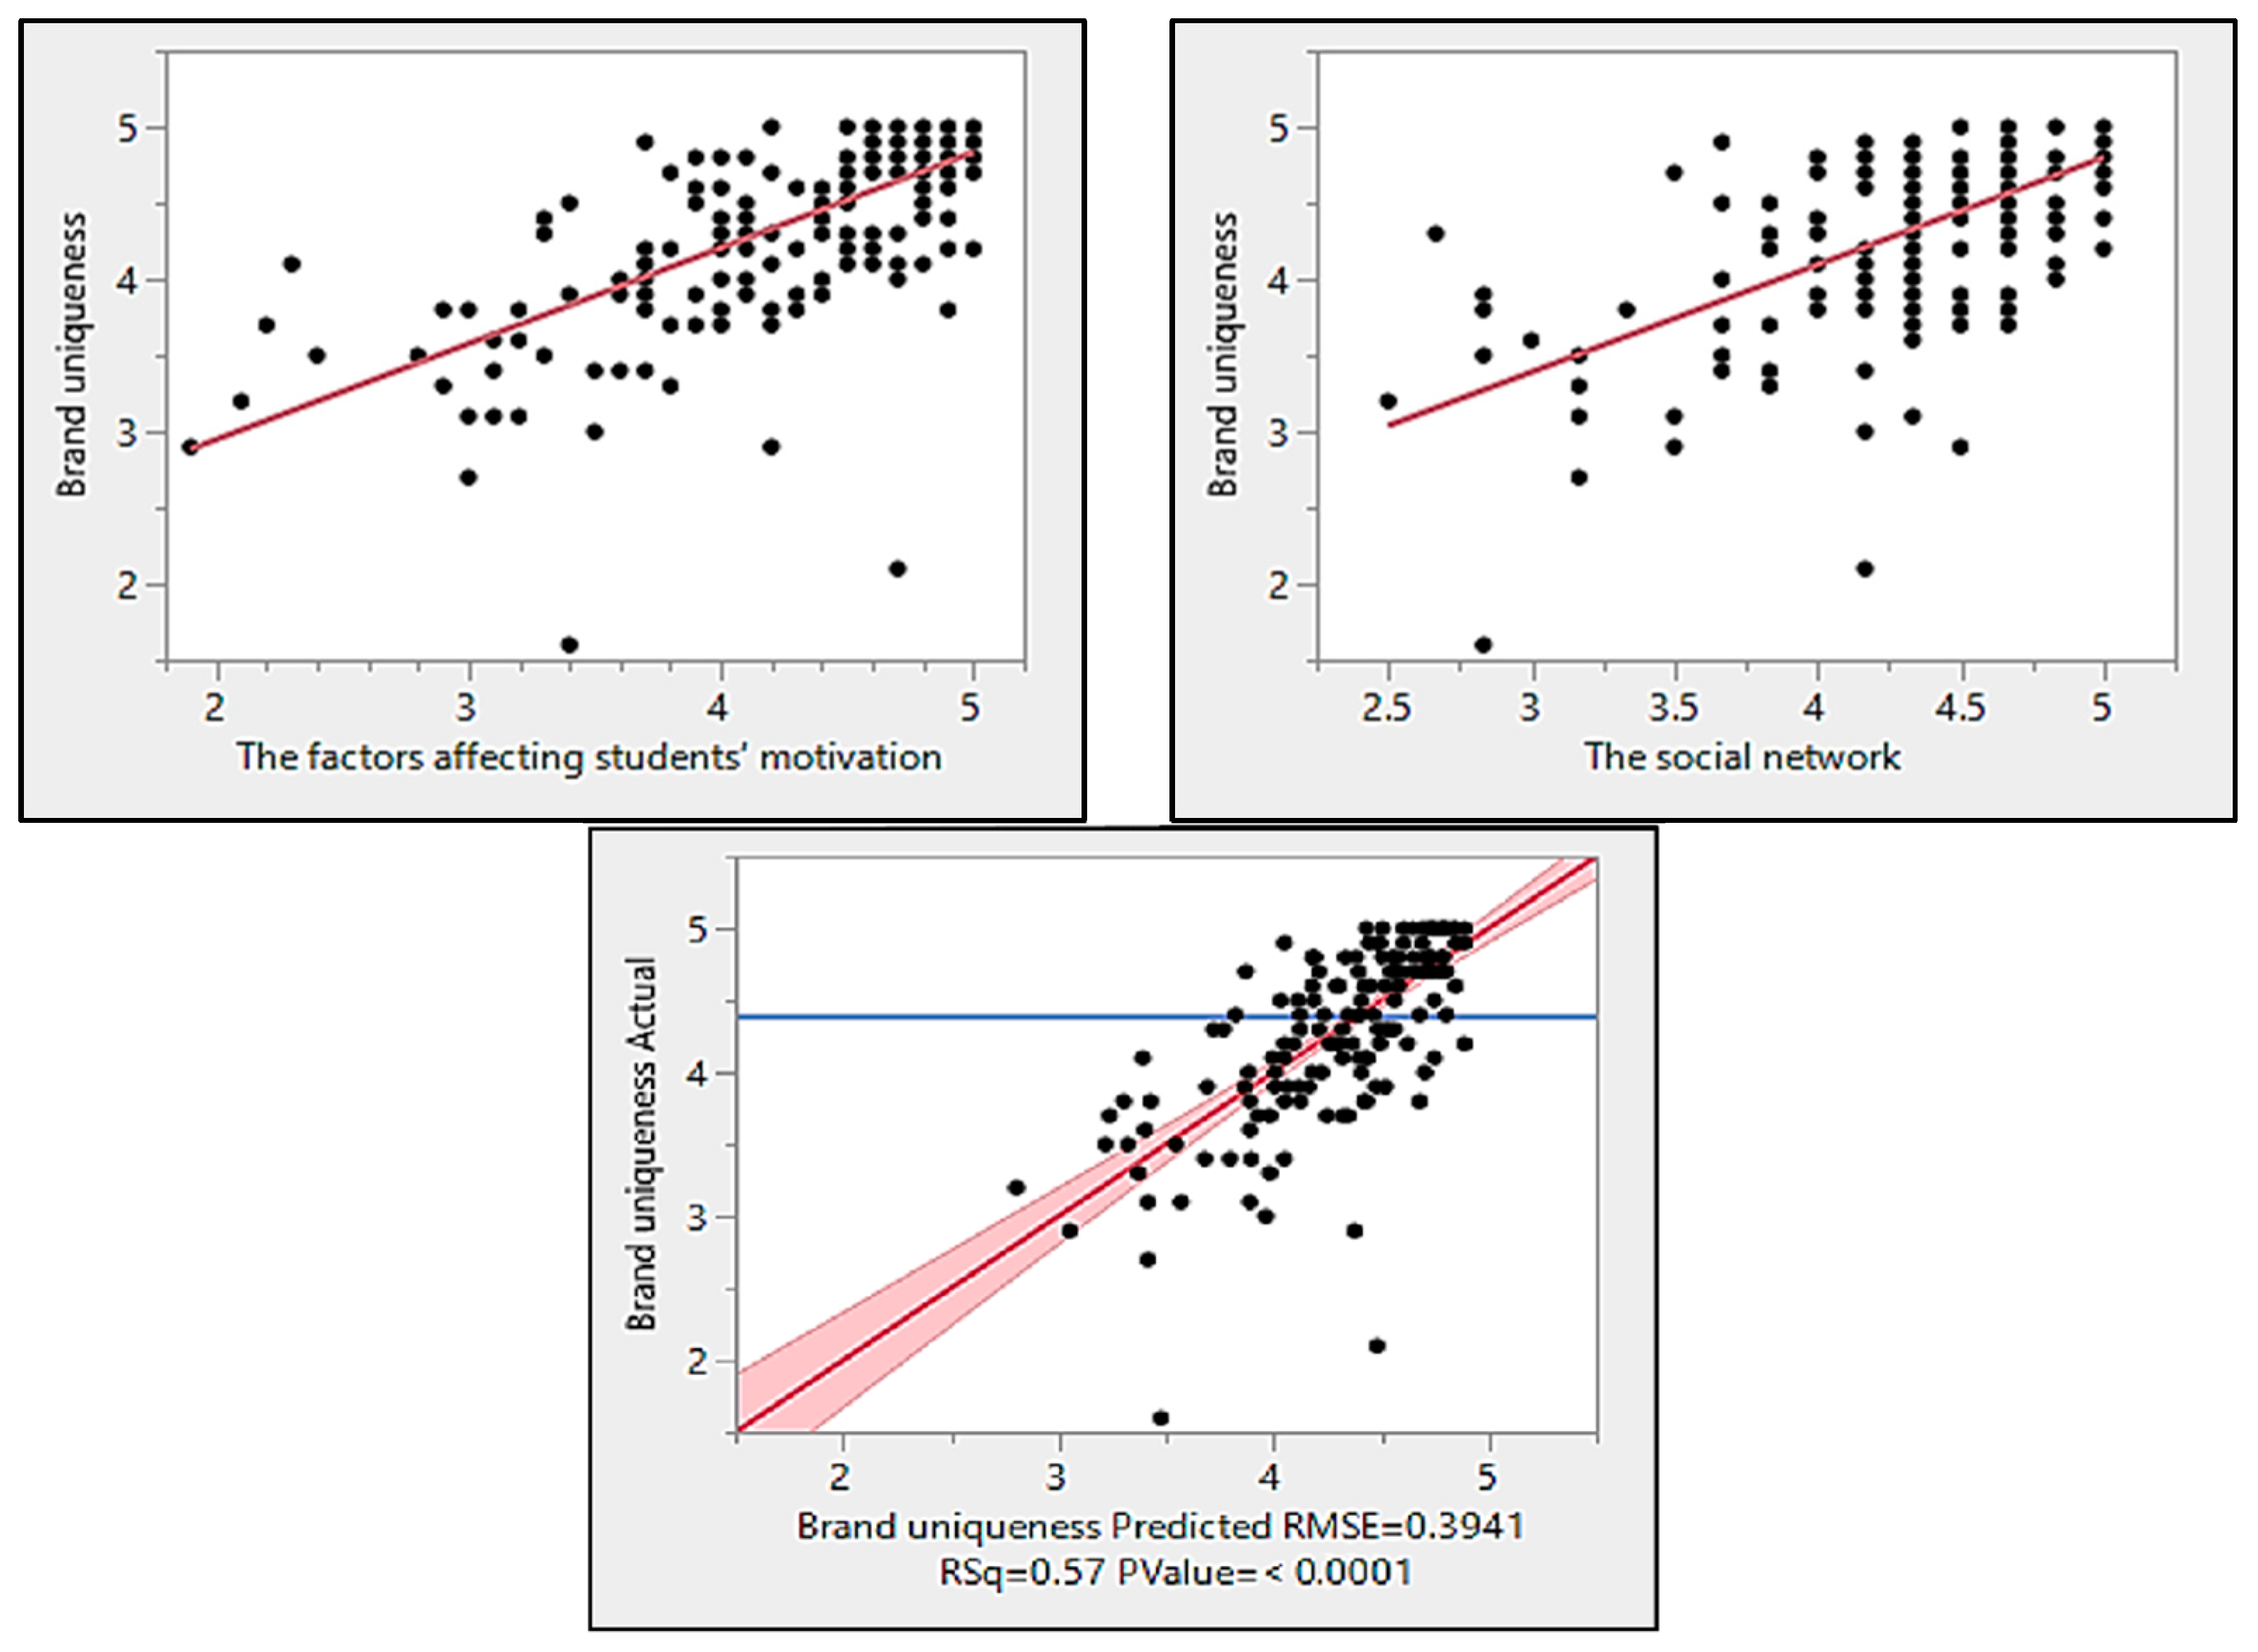
- regression analysis, used with the aim of making an assessment of the connections between the independent and the dependent variables;
- linear regression, which served to model the connection between two variables by forming a linear equation;
- the ANOVA test, performed in order to compare the two groups of variables; and
- multiple linear correlation analysis and regression analysis, which showed the influence of several independent variables.
4. Results
- for Component 1: Factors Affecting Students’ Motivation: Q19, Q18, Q20, Q21, Q17, Q16, Q22, Q14, Q15, and Q23;
- for Component 2: Brand Uniqueness: Q4, Q2, Q1, Q6, Q5, Q3, Q7, Q9, Q8, and Q10; and
- for Component 3: The Social Network: Q12, Q25, Q13, Q26, Q24, and Q11.
5. Discussion
6. Conclusions
Author Contributions
Funding
Institutional Review Board Statement
Informed Consent Statement
Conflicts of Interest
References
- Casidy, R. The role of brand orientation in the higher education sector: A student-perceived paradigm. Asia Pac. J. Mark. Logist. 2013, 25, 803–820. [Google Scholar] [CrossRef]
- Merchant, A.; Rose, G.M.; Moody, G.; Mathews, L. Effect of university heritage and reputation on attitudes of prospective students. Int. J. Nonprofit Volunt. Sect. Mark. 2015, 20, 25–37. [Google Scholar] [CrossRef]
- Nguyen, B.; Yu, X.; Melewar, T.C.; Hemsley-Brown, J. Brand ambidexterity and commitment in higher education: An exploratory study. J. Bus. Res. 2016, 69, 3105–3112. [Google Scholar] [CrossRef] [Green Version]
- Cretu, A.E.; Brodie, R.J. The influence of brand image and company reputation where manufacturers market to small firms: A customer value perspective. Ind. Mark. Manag. 2007, 36, 230–240. [Google Scholar] [CrossRef]
- Priporas, C.-V.; Kamenidou, I. Perceptions of potential postgraduate Greek business students towards UK universities, brand and brand reputation. J. Brand Manag. 2011, 18, 264–273. [Google Scholar] [CrossRef]
- Zhang, M.; Guo, L.; Hu, M.; Liu, W. Influence of customer engagement with company social networks on stickiness: Mediating effect of customer value creation. Int. J. Inf. Manag. 2017, 37, 229–240. [Google Scholar] [CrossRef]
- Alalwan, A.A. Investigating the impact of social media advertising features on customer purchase intention. Int. J. Inf. Manag. 2018, 42, 65–77. [Google Scholar] [CrossRef]
- Patrutiu-Baltes, L. Inbound Marketing-the most important digital marketing strategy. Econ. Sci. 2016, 9, 61–68. [Google Scholar]
- Halligan, B.; Shah, D. Inbound Marketing: Get Found Using Google, Social Media, and Blogs; John Wiley & Sons: Hoboken, NJ, USA, 2009. [Google Scholar]
- Gao, H.; Tate, M.; Zhang, H.; Chen, S.; Liang, B. Social Media Ties Strategy in International Branding: An Application of Resource-Based Theory. J. Int. Mark. 2018, 26, 45–69. [Google Scholar] [CrossRef]
- Romão, M.T.; Moro, S.; Rita, P.; Ramos, P. Leveraging a luxury fashion brand through social media. Eur. Res. Manag. Bus. Econ. 2019, 25, 15–22. [Google Scholar] [CrossRef]
- Hamilton, M.; Kaltcheva, V.D.; Rohm, A.J. Social Media and Value Creation: The Role of Interaction Satisfaction and Interaction Immersion. J. Interact. Mark. 2016, 36, 121–133. [Google Scholar] [CrossRef]
- Malthouse, E.C.; Haenlein, M.; Skiera, B.; Wege, E.; Zhang, M. Managing Customer Relationships in the Social Media Era: Introducing the Social CRM House. J. Interact. Mark. 2013, 27, 270–280. [Google Scholar] [CrossRef]
- Holliman, G.; Rowley, J. Business to business digital content marketing: Marketers’ perceptions of best practice. J. Res. Interact. Mark. 2014, 8, 269–293. [Google Scholar] [CrossRef] [Green Version]
- Brophy, J. Conceptualizing student motivation. Educ. Psychol. 1983, 18, 200–215. [Google Scholar] [CrossRef]
- Entwistle, N. Motivational Factors in Students’ Approaches to Learning. In Learning Strategies and Learning Styles; Springer: Boston, MA, USA, 1988; pp. 21–51. [Google Scholar]
- Oliver, R.; Reeves, T.C. Dimensions of effective interactive learning with telematics for distance education. Educ. Technol. Res. Dev. 1996, 44, 45–56. [Google Scholar] [CrossRef]
- Justina, R.I. Motivational Factors that Enhance Students Learning/Achievement. SSRN Electron. J. 2015, 4, 323–332. [Google Scholar] [CrossRef]
- Steinmayr, R.; Weidinger, A.F.; Schwinger, M.; Spinath, B. The Importance of Students’ Motivation for Their Academic Achievement—Replicating and Extending Previous Findings. Front. Psychol. 2019, 10, 1730. [Google Scholar] [CrossRef] [Green Version]
- Loi, R.; Ngo, H.-Y.; Zhang, L.; Lau, V.P. The interaction between leader-member exchange and perceived job security in predicting employee altruism and work performance. J. Occup. Organ. Psychol. 2011, 84, 669–685. [Google Scholar] [CrossRef]
- Zhang, F.; Bae, C.L. Motivational factors that influence student science achievement: A systematic literature review of TIMSS studies. Int. J. Sci. Educ. 2020, 42, 2921–2944. [Google Scholar] [CrossRef]
- Wang, J.; Shen, L.; Ren, Y.; Ochoa, J.J.; Guo, Z.; Yan, H.; Wu, Z. A lessons mining system for searching references to support decision making towards sustainable urbanization. J. Clean. Prod. 2019, 209, 451–460. [Google Scholar] [CrossRef] [Green Version]
- Green, M.R. The impact of social networks in the development of a personal sports brand. Sport Bus. Manag. Int. J. 2016, 6, 274–294. [Google Scholar] [CrossRef] [Green Version]
- Wu, L. Understanding the Impact of Media Engagement on the Perceived Value and Acceptance of Advertising Within Mobile Social Networks. J. Interact. Advert. 2016, 16, 59–73. [Google Scholar] [CrossRef]
- Su, J.; Chang, A. Factors affecting college students’ brand loyalty toward fast fashion. Int. J. Retail Distrib. Manag. 2018, 46, 90–107. [Google Scholar] [CrossRef] [Green Version]
- Seo, E.-J.; Park, J.-W. A study on the effects of social media marketing activities on brand equity and customer response in the airline industry. J. Air Transp. Manag. 2018, 66, 36–41. [Google Scholar] [CrossRef]
- So, K.K.F.; Wu, L.; Xiong, L.; King, C. Brand Management in the Era of Social Media: Social Visibility of Consumption and Customer Brand Identification. J. Travel Res. 2018, 57, 727–742. [Google Scholar] [CrossRef]
- Kaplan, A.M.; Haenlein, M. Users of the world, unite! The challenges and opportunities of Social Media. Bus. Horiz. 2010, 53, 59–68. [Google Scholar] [CrossRef]
- Peters, K.; Chen, Y.; Kaplan, A.M.; Ognibeni, B.; Pauwels, K. Social Media Metrics—A Framework and Guidelines for Managing Social Media. J. Interact. Mark. 2013, 27, 281–298. [Google Scholar] [CrossRef]
- Lamberton, C.; Stephen, A.T. A Thematic Exploration of Digital, Social Media, and Mobile Marketing: Research Evolution from 2000 to 2015 and an Agenda for Future Inquiry. J. Mark. 2016, 80, 146–172. [Google Scholar] [CrossRef]
- Chen, Y.; Wang, Q.; Xie, J. Online Social Interactions: A Natural Experiment on Word of Mouth versus Observational Learning. J. Mark. Res. 2011, 48, 238–254. [Google Scholar] [CrossRef]
- Moe, W.W.; Schweidel, D.A. Opportunities for Innovation in Social Media Analytics. J. Prod. Innov. Manag. 2017, 34, 697–702. [Google Scholar] [CrossRef]
- Gnizy, I. Big data and its strategic path to value in international firms. Int. Mark. Rev. 2019, 36, 318–341. [Google Scholar] [CrossRef]
- Saritaş, A.; Korkmaz, İ.; Tunca, M.Z. Use of social media as an innovative channel in marketing communication: A research on automotive sector. Int. J. Econ. Adm. Stud. Ahmet Hamdi İslamoğlu Özel Sayısı 2017, 12, 95–108. [Google Scholar]
- Evans, D.; Bratton, S. Social Media Marketing—The Next Generation of Business Engagement; John Wiley & Sons Inc.: Hoboken, NJ, USA, 2012. [Google Scholar]
- Kumar, V.; Choi, J.B.; Greene, M. Synergistic effects of social media and traditional marketing on brand sales: Capturing the time-varying effects. J. Acad. Mark. Sci. 2017, 45, 268–288. [Google Scholar] [CrossRef]
- Coles, L. Marketing with Social Media: 10 Easy Steps to Success for Business; John Wiley & Sons Inc.: Hoboken, NJ, USA, 2014. [Google Scholar]
- Muntinga, D.G.; Moorman, M.; Smit, E.G. Introducing COBRAs. Int. J. Advert. 2011, 30, 13–46. [Google Scholar] [CrossRef]
- Järvinen, J.; Taiminen, H. Harnessing marketing automation for B2B content marketing. Ind. Mark. Manag. 2016, 54, 164–175. [Google Scholar] [CrossRef] [Green Version]
- Pulizzi, J.; Barrett, N. Get Content, Get Customers: Turn Prospects into Buyers with Content Marketing; McGraw-Hill: New York, NY, USA, 2009. [Google Scholar]
- Libai, B.; Muller, E.; Peres, R. Decomposing the Value of Word-of-Mouth Seeding Programs: Acceleration versus Expansion. J. Mark. Res. 2013, 50, 161–176. [Google Scholar] [CrossRef] [Green Version]
- Bock, D.E.; Poole, S.M.; Joseph, M. Does branding impact student recruitment: A critical evaluation. J. Mark. High. Educ. 2014, 24, 11–21. [Google Scholar] [CrossRef]
- Joseph, M.; Mullen, E.W.; Spake, D. University branding: Understanding students’ choice of an educational institution. J. Brand Manag. 2012, 20, 1–12. [Google Scholar] [CrossRef]
- Dörnyei, Z.; Csizér, K. Ten commandments for motivating language learners: Results of an empirical study. Lang. Teach. Res. 1998, 2, 203–229. [Google Scholar] [CrossRef] [Green Version]
- Wilkins, S.; Huisman, J. Student Recruitment at International Branch Campuses: Can They Compete in the Global Market? J. Stud. Int. Educ. 2011, 15, 299–316. [Google Scholar] [CrossRef] [Green Version]
- Hoffman, D.L.; Novak, T.P. Marketing in Hypermedia Computer-Mediated Environments: Conceptual Foundations. J. Mark. 1996, 60, 50–68. [Google Scholar] [CrossRef]
- Bakanauskas, A.; Liesionis, V. Elektroninis Marketingas; VDU Leidyk: Kaunas, Lithuania, 2008. [Google Scholar]
- Kotler, P.; Keller, K.L. A framework for marketing. Sloan Manag. Rev. 2012, 32, 94–104. [Google Scholar]
- Luna, D.; Forquer Gupta, S. An integrative framework for cross-cultural consumer behavior. Int. Mark. Rev. 2001, 18, 45–69. [Google Scholar] [CrossRef] [Green Version]
- Pranulis, V.; Pajuodis, A.; Urbonavičius, S.V.R. Marketingas; Garnelis: Vilnius, Lithuania, 2008. [Google Scholar]
- Koltko-Rivera, M.E. Rediscovering the Later Version of Maslow’s Hierarchy of Needs: Self-Transcendence and Opportunities for Theory, Research, and Unification. Rev. Gen. Psychol. 2006, 10, 302–317. [Google Scholar] [CrossRef]
- Ramanauskas, G. Evaluation of International Competitiveness. Ekonomika 2004, 68, 91–112. [Google Scholar] [CrossRef]
- Ward, E.; Yang, S.; Romaniuk, J.; Beal, V. Building a unique brand identity: Measuring the relative ownership potential of brand identity element types. J. Brand Manag. 2020, 27, 393–407. [Google Scholar] [CrossRef]
- De Chernatony, L. From Brand Vision to Brand Evaluation. The Strategic Process of Growing ans Trengthening Brands, 3rd ed.; Elsevier: Amsterdam, The Netherlands, 2010. [Google Scholar]
- Keller, K.L.; Heckler, S.E.; Houston, M.J. The Effects of Brand Name Suggestiveness on Advertising Recall. J. Mark. 1998, 62, 48. [Google Scholar] [CrossRef]
- Walsh, M.F.; Page Winterich, K.; Mittal, V. Do logo redesigns help or hurt your brand? The role of brand commitment. J. Prod. Brand Manag. 2010, 19, 76–84. [Google Scholar] [CrossRef]
- Chen, Y.-S.A.; Bei, L.-T. Free the brand: How a logo frame influences the potentiality of brand extensions. J. Brand Manag. 2019, 26, 349–364. [Google Scholar] [CrossRef]
- Jiang, Y.; Gorn, G.J.; Galli, M.; Chattopadhyay, A. Does Your Company Have the Right Logo? How and Why Circular- and Angular-Logo Shapes Influence Brand Attribute Judgments. J. Consum. Res. 2016, 42, 709–726. [Google Scholar] [CrossRef]
- Machado, J.C.; de Carvalho, L.V.; Torres, A.; Costa, P. Brand logo design: Examining consumer response to naturalness. J. Prod. Brand Manag. 2015, 24, 78–87. [Google Scholar] [CrossRef] [Green Version]
- Aaker, J.L. Dimensions of Brand Personality. J. Mark. Res. 1997, 34, 347–356. [Google Scholar] [CrossRef]
- Lieven, T.; Grohmann, B.; Herrmann, A.; Landwehr, J.R.; van Tilburg, M. The effect of brand design on brand gender perceptions and brand preference. Eur. J. Mark. 2015, 49, 146–169. [Google Scholar] [CrossRef]
- Phillips, B.J.; McQuarrie, E.F.; Griffin, W.G. The Face of the Brand: How Art Directors Understand Visual Brand Identity. J. Advert. 2014, 43, 318–332. [Google Scholar] [CrossRef]
- Henderson, P.W.; Cote, J.A. Guidelines for Selecting or Modifying Logos. J. Mark. 1998, 62, 14. [Google Scholar] [CrossRef]
- Rahinel, R.; Nelson, N.M. When Brand Logos Describe the Environment: Design Instability and the Utility of Safety-Oriented Products. J. Consum. Res. 2016, 43, 478–496. [Google Scholar] [CrossRef]
- Van der Lans, R.; Cote, J.A.; Cole, C.A.; Leong, S.M.; Smidts, A.; Henderson, P.W.; Bluemelhuber, C.; Bottomley, P.A.; Doyle, J.R.; Fedorikhin, A.; et al. Cross-National Logo Evaluation Analysis: An Individual-Level Approach. Mark. Sci. 2009, 28, 968–985. [Google Scholar] [CrossRef] [Green Version]
- Park, C.W.; Eisingerich, A.B.; Pol, G.; Park, J.W. The role of brand logos in firm performance. J. Bus. Res. 2013, 66, 180–187. [Google Scholar] [CrossRef]
- Torres, A.; César Machado, J.; Vacas de Carvalho, L.; van de Velden, M.; Costa, P. Same design, same response? Investigating natural designs in international logos. J. Prod. Brand Manag. 2019, 28, 317–329. [Google Scholar] [CrossRef]
- Foroudi, P.; Melewar, T.C.; Gupta, S. Linking corporate logo, corporate image, and reputation: An examination of consumer perceptions in the financial setting. J. Bus. Res. 2014, 67, 2269–2281. [Google Scholar] [CrossRef]
- Hynes, N. Colour and meaning in corporate logos: An empirical study. J. Brand Manag. 2009, 16, 545–555. [Google Scholar] [CrossRef]
- Madden, T.J.; Hewett, K.; Roth, M.S. Managing Images in Different Cultures: A Cross-National Study of Color Meanings and Preferences. J. Int. Mark. 2000, 8, 90–107. [Google Scholar] [CrossRef]
- Amsteus, M.; Al-Shaaban, S.; Wallin, E.; Sjöqvist, S. Colors in marketing: A study of color associations and context (in) dependence. Int. J. Bus. Soc. Sci. 2015, 6, 32–45. [Google Scholar]
- Labrecque, L.I.; Milne, G.R. Exciting red and competent blue: The importance of color in marketing. J. Acad. Mark. Sci. 2012, 40, 711–727. [Google Scholar] [CrossRef]
- Labrecque, L.I.; Patrick, V.M.; Milne, G.R. The Marketers’ Prismatic Palette: A Review of Color Research and Future Directions. Psychol. Mark. 2013, 30, 187–202. [Google Scholar] [CrossRef]
- Abril, P.S.; Olazábal, A.M.; Cava, A. Marketing and the Law. J. Acad. Mark. Sci. 2009, 37, 375–380. [Google Scholar] [CrossRef]
- Bottomley, P.A.; Doyle, J.R. The interactive effects of colors and products on perceptions of brand logo appropriateness. Mark. Theory 2006, 6, 63–83. [Google Scholar] [CrossRef] [Green Version]
- Casidy, R.; Wymer, W. The impact of brand strength on satisfaction, loyalty and WOM: An empirical examination in the higher education sector. J. Brand Manag. 2015, 22, 117–135. [Google Scholar] [CrossRef]
- Dholakia, R.R.; Acciardo, L.A. Branding a state university: Doing it right. J. Mark. High. Educ. 2014, 24, 144–163. [Google Scholar] [CrossRef]
- da Silveira, C.; Lages, C.; Simões, C. Reconceptualizing brand identity in a dynamic environment. J. Bus. Res. 2013, 66, 28–36. [Google Scholar] [CrossRef]
- Suomi, K.; Kuoppakangas, P.; Hytti, U.; Hampden-Turner, C.; Kangaslahti, J. Focusing on dilemmas challenging reputation management in higher education. Int. J. Educ. Manag. 2014, 28, 461–478. [Google Scholar] [CrossRef]
- Harsha, P.; Shah, J. Creating Brand Value of Higher Education Institution. Int. J. Manag. Technol. 2011, 19, 152–158. [Google Scholar]
- Panda, S.; Pandey, S.C.; Bennett, A.; Tian, X. University brand image as competitive advantage: A two-country study. Int. J. Educ. Manag. 2019, 37, 117–128. [Google Scholar] [CrossRef]
- Cuneo, A.; Milberg, S.J.; Alarcon-Del-Amo, M.D.C.; Lopez-Belbeze, P. Private label and manufacturer brand choice in a new competitive reality: Strategic directions and the future of brands. Eur. Manag. J. 2019, 37, 117–128. [Google Scholar] [CrossRef]
- Appiah, D.; Howell, K.E.; Ozuem, W.; Lancaster, G. Building resistance to brand switching during disruptions in a competitive market. J. Retail. Consum. Serv. 2019, 50, 249–257. [Google Scholar] [CrossRef]
- Hsieh, S.H.; Chang, A. The Psychological Mechanism of Brand Co-creation Engagement. J. Interact. Mark. 2016, 33, 13–26. [Google Scholar] [CrossRef]
- Saenger, C.; Jewell, R.D.; Grigsby, J.L. The Strategic Use of Contextual and Competitive Interference to Influence Brand-Attribute Associations. J. Advert. 2017, 46, 424–439. [Google Scholar] [CrossRef]


| Cronbach Alpha | Cronbach Alpha Based on Standardized Items | No. of Items |
|---|---|---|
| 0.944 | 0.946 | 26 |
| Kaiser–Meyer–Olkin Measure of Sampling Adequacy | 0.922 | |
|---|---|---|
| Approx. chi-square | 4016.811 | |
| Bartlett’s test of sphericity | df | 325 |
| Sig. | 0.000 | |
| Total Variance Explained | ||||||
|---|---|---|---|---|---|---|
| Component | Initial Eigenvalues | Extraction Sums of Squared Loadings | ||||
| Total | % of Variance | Cumulative % | Total | % of Variance | Cumulative % | |
| 1 | 11.311 | 43.503 | 43.503 | 11.311 | 43.503 | 43.503 |
| 2 | 1.837 | 7.065 | 50.568 | 1.837 | 7.065 | 50.568 |
| 3 | 1.579 | 6.073 | 56.641 | 1.579 | 6.073 | 56.641 |
| 4 | 1.277 | 4.911 | 61.552 | 1.277 | 4.911 | 61.552 |
| 5 | 0.986 | 3.792 | 65.344 | |||
| 6 | 0.903 | 3.472 | 68.816 | |||
| 7 | 0.838 | 3.223 | 72.039 | |||
| 8 | 0.772 | 2.971 | 75.010 | |||
| 9 | 0.722 | 2.776 | 77.785 | |||
| 10 | 0.633 | 2.434 | 80.219 | |||
| 11 | 0.593 | 2.281 | 82.500 | |||
| 12 | 0.548 | 2.107 | 84.607 | |||
| 13 | 0.447 | 1.720 | 86.327 | |||
| 14 | 0.420 | 1.615 | 87.942 | |||
| 15 | 0.401 | 1.544 | 89.486 | |||
| 16 | 0.382 | 1.471 | 90.957 | |||
| 17 | 0.340 | 1.307 | 92.264 | |||
| 18 | 0.324 | 1.247 | 93.511 | |||
| 19 | 0.276 | 1.062 | 94.573 | |||
| 20 | 0.260 | 0.999 | 95.572 | |||
| 21 | 0.237 | 0.912 | 96.484 | |||
| 22 | 0.236 | 0.907 | 97.391 | |||
| 23 | 0.202 | 0.777 | 98.168 | |||
| 24 | 0.177 | 0.682 | 98.850 | |||
| 25 | 0.159 | 0.610 | 99.460 | |||
| 26 | 0.140 | 0.540 | 100.000 | |||
| Extraction method: principal component analysis. | ||||||
| No. of Components | Characteristic Value Obtained from PCA | Threshold Values Obtained through the Parallel Analysis | Decision |
|---|---|---|---|
| 1 | 11.311 | 1.6532 | accepted |
| 2 | 1.837 | 1.5508 | accepted |
| 3 | 1.579 | 1.4675 | accepted |
| 4 | 1.277 | 1.4020 | rejected |
| Total Variance Explained | |||||||
|---|---|---|---|---|---|---|---|
| Component | Initial Eigenvalues | Extraction Sums of Squared Loadings | Rotation Sums of Squared Loadings | ||||
| Total | % of Variance | Cumulative % | Total | % of Variance | Cumulative % | Total | |
| 1 | 11.311 | 43.503 | 43.503 | 11.311 | 43.503 | 43.503 | 8.701 |
| 2 | 1.837 | 7.065 | 50.568 | 1.837 | 7.065 | 50.568 | 8.434 |
| 3 | 1.579 | 6.073 | 56.641 | 1.579 | 6.073 | 56.641 | 6.130 |
| 4 | 1.277 | 4.911 | 61.552 | ||||
| 5 | 0.986 | 3.792 | 65.344 | ||||
| 6 | 0.903 | 3.472 | 68.816 | ||||
| 7 | 0.838 | 3.223 | 72.039 | ||||
| 8 | 0.772 | 2.971 | 75.010 | ||||
| 9 | 0.722 | 2.776 | 77.785 | ||||
| 10 | 0.633 | 2.434 | 80.219 | ||||
| 11 | 0.593 | 2.281 | 82.500 | ||||
| 12 | 0.548 | 2.107 | 84.607 | ||||
| 13 | 0.447 | 1.720 | 86.327 | ||||
| 14 | 0.420 | 1.615 | 87.942 | ||||
| 15 | 0.401 | 1.544 | 89.486 | ||||
| 16 | 0.382 | 1.471 | 90.957 | ||||
| 17 | 0.340 | 1.307 | 92.264 | ||||
| 18 | 0.324 | 1.247 | 93.511 | ||||
| 19 | 0.276 | 1.062 | 94.573 | ||||
| 20 | 0.260 | 0.999 | 95.572 | ||||
| 21 | 0.237 | 0.912 | 96.484 | ||||
| 22 | 0.236 | 0.907 | 97.391 | ||||
| 23 | 0.202 | 0.777 | 98.168 | ||||
| 24 | 0.177 | 0.682 | 98.850 | ||||
| 25 | 0.159 | 0.610 | 99.460 | ||||
| 26 | 0.140 | 0.540 | 100.000 | ||||
| Extraction method: principal component analysis. | |||||||
| Component Correlation Matrix | |||
|---|---|---|---|
| Component | 1 | 2 | 3 |
| 1 | 1.000 | 0.509 | 0.425 |
| 2 | 0.509 | 1.000 | 0.427 |
| 3 | 0.425 | 0.427 | 1.000 |
| Extraction method: principal component analysis. Rotation method: Oblimin with Kaiser normalization. | |||
| Pattern Matrix | |||
|---|---|---|---|
| Component | |||
| 1 | 2 | 3 | |
| Q19 | 0.879 | ||
| Q18 | 0.828 | ||
| Q20 | 0.737 | ||
| Q21 | 0.678 | ||
| Q17 | 0.667 | ||
| Q16 | 0.662 | ||
| Q22 | 0.658 | 0.331 | |
| Q14 | 0.582 | ||
| Q15 | 0.532 | 0.333 | |
| Q23 | 0.395 | 0.375 | |
| Q4 | 0.821 | ||
| Q2 | 0.786 | ||
| Q1 | 0.763 | ||
| Q6 | 0.761 | ||
| Q5 | 0.720 | ||
| Q3 | 0.669 | ||
| Q7 | 0.605 | ||
| Q9 | 0.403 | 0.303 | |
| Q8 | 0.379 | 0.350 | |
| Q10 | 0.353 | 0.311 | |
| Q12 | 0.708 | ||
| Q25 | 0.322 | 0.699 | |
| Q13 | 0.648 | ||
| Q26 | 0.604 | ||
| Q24 | 0.443 | ||
| Q11 | 0.325 | ||
| Extraction method: principal component analysis. Rotation method: Oblimin with Kaiser normalization. | |||
| Structure Matrix | |||
|---|---|---|---|
| Component | |||
| 1 | 2 | 3 | |
| Q19 | 0.888 | 0.481 | 0.357 |
| Q16 | 0.828 | 0.596 | 0.525 |
| Q20 | 0.826 | 0.441 | 0.560 |
| Q18 | 0.797 | 0.409 | |
| Q22 | 0.774 | 0.614 | |
| Q14 | 0.743 | 0.538 | 0.500 |
| Q15 | 0.737 | 0.639 | 0.452 |
| Q21 | 0.735 | 0.417 | 0.399 |
| Q17 | 0.725 | 0.407 | 0.406 |
| Q23 | 0.526 | 0.306 | 0.519 |
| Q4 | 0.395 | 0.822 | 0.389 |
| Q6 | 0.507 | 0.809 | 0.327 |
| Q2 | 0.472 | 0.799 | |
| Q1 | 0.483 | 0.775 | |
| Q7 | 0.559 | 0.736 | 0.377 |
| Q5 | 0.351 | 0.732 | 0.378 |
| Q3 | 0.366 | 0.718 | 0.439 |
| Q8 | 0.598 | 0.659 | 0.621 |
| Q9 | 0.369 | 0.550 | 0.490 |
| Q10 | 0.369 | 0.515 | 0.486 |
| Q26 | 0.430 | 0.501 | 0.721 |
| Q12 | 0.364 | 0.718 | |
| Q25 | 0.472 | 0.713 | |
| Q13 | 0.448 | 0.306 | 0.705 |
| Q24 | 0.333 | 0.505 | |
| Q11 | 0.380 | 0.313 | 0.442 |
| Extraction method: principal component analysis. Rotation method: Oblimin with Kaiser normalization. | |||
| Pattern Matrix | Structure Matrix | Communalities | |||||
|---|---|---|---|---|---|---|---|
| Component | Component | ||||||
| 1 | 2 | 3 | 1 | 2 | 3 | ||
| Q19 | 0.879 | 0.050 | −0.038 | 0.888 | 0.481 | 0.357 | 0.792 |
| Q18 | 0.828 | 0.038 | −0.118 | 0.828 | 0.596 | 0.525 | 0.646 |
| Q20 | 0.737 | -0.048 | 0.267 | 0.826 | 0.441 | 0.560 | 0.738 |
| Q21 | 0.678 | 0.029 | 0.098 | 0.797 | 0.409 | 0.250 | 0.550 |
| Q17 | 0.667 | 0.018 | 0.115 | 0.774 | 0.614 | 0.298 | 0.538 |
| Q16 | 0.662 | 0.190 | 0.163 | 0.743 | 0.538 | 0.500 | 0.746 |
| Q22 | 0.658 | 0.331 | −0.123 | 0.737 | 0.639 | 0.452 | 0.676 |
| Q14 | 0.582 | 0.164 | 0.183 | 0.735 | 0.417 | 0.399 | 0.612 |
| Q15 | 0.532 | 0.333 | 0.084 | 0.725 | 0.407 | 0.406 | 0.643 |
| Q23 | 0.395 | −0.055 | 0.375 | 0.526 | 0.306 | 0.519 | 0.386 |
| Q4 | −0.047 | 0.821 | 0.058 | 0.395 | 0.822 | 0.389 | 0.678 |
| Q2 | 0.119 | 0.786 | −0.113 | 0.507 | 0.809 | 0.327 | 0.653 |
| Q1 | 0.167 | 0.763 | −0.171 | 0.472 | 0.799 | 0.273 | 0.634 |
| Q6 | 0.145 | 0.761 | −0.059 | 0.483 | 0.775 | 0.226 | 0.670 |
| Q5 | −0.056 | 0.720 | 0.094 | 0.559 | 0.736 | 0.377 | 0.544 |
| Q3 | −0.048 | 0.669 | 0.173 | 0.351 | 0.732 | 0.378 | 0.539 |
| Q7 | 0.245 | 0.605 | 0.015 | 0.366 | 0.718 | 0.439 | 0.588 |
| Q9 | 0.035 | 0.403 | 0.303 | 0.598 | 0.659 | 0.621 | 0.383 |
| Q8 | 0.256 | 0.379 | 0.350 | 0.369 | 0.550 | 0.490 | 0.620 |
| Q10 | 0.057 | 0.353 | 0.311 | 0.369 | 0.515 | 0.486 | 0.354 |
| Q12 | 0.105 | -0.082 | 0.708 | 0.430 | 0.501 | 0.721 | 0.524 |
| Q25 | −0.292 | 0.322 | 0.699 | 0.364 | 0.274 | 0.718 | 0.601 |
| Q13 | 0.212 | -0.079 | 0.648 | 0.170 | 0.472 | 0.713 | 0.528 |
| Q26 | 0.067 | 0.209 | 0.604 | 0.448 | 0.306 | 0.705 | 0.569 |
| Q24 | 0.144 | 0.002 | 0.443 | 0.333 | 0.265 | 0.505 | 0.272 |
| Q11 | 0.206 | 0.069 | 0.325 | 0.380 | 0.313 | 0.442 | 0.244 |
| No. | Assertion | Response | |||||||
|---|---|---|---|---|---|---|---|---|---|
| 1 | 2 | 3 | 4 | 5 | Total | Mean | Std Dev | ||
| Q1 | The brand of a private faculty creates a clear image in your mind of that faculty, which makes it different from the competition. | 0 0.0% | 2 0.8% | 47 19.2% | 64 26.1% | 132 53.9% | 245 | 4.3306 | 0.8103 |
| Q2 | The brand of a private faculty identifies a brand as a unique value. | 2 0.8% | 1 0.4% | 35 14.3% | 90 36.7% | 117 47.8% | 245 | 4.3020 | 0.7883 |
| Q3 | The brand of a private faculty enables growth. | 1 0.4% | 3 1.2% | 44 18.0% | 65 26.5% | 132 53.9% | 245 | 4.3224 | 0.8384 |
| Q4 | The brand of a private faculty is unique (original) and differs from the brands of other faculties. | 5 2.0% | 0 0.0% | 15 6.1% | 58 23.7% | 167 68.2% | 245 | 4.5592 | 0.7851 |
| Q5 | The brand of a private faculty is motivational and easy to remember. | 2 0.8% | 8 3.3% | 24 9.8% | 69 28.2% | 142 58.0% | 245 | 4.3918 | 0.8550 |
| Q6 | The brand of a private faculty is easy to understand. | 2 0.8% | 9 3.7% | 35 14.3% | 81 33.1% | 118 48.2% | 245 | 4.2408 | 0.8889 |
| Q7 | The brand of a private faculty is well positioned for achieving a long-term success. | 0 0.0% | 8 3.3% | 38 15.5% | 76 31.0% | 123 50.2% | 245 | 4.2816 | 0.8434 |
| Q8 | The slogan of a private faculty is convincing. | 0 0.0% | 10 4.1% | 29 11.8% | 62 25.3% | 144 58.8% | 245 | 4.3878 | 0.8497 |
| Q9 | The brand of a private faculty is capable of dealing with the competition. | 5 2.0% | 6 2.4% | 30 12.2% | 71 29.0% | 133 54.3% | 245 | 4.3102 | 0.9242 |
| Q10 | It is important for the brand of a private faculty that its professors have good contact with the students. | 1 0.4% | 1 0.4% | 13 5.3% | 38 15.5% | 192 78.4% | 245 | 4.7102 | 0.6221 |
| Q11 | The brand of a private faculty has good promotion (marketing, communication). | 9 3.7% | 30 12.2% | 84 34.3% | 81 33.1% | 41 16.7% | 245 | 3.4694 | 1.0263 |
| Q12 | The YouTube channel has an interesting video material. | 2 0.8% | 1 0.4% | 10 4.1% | 63 25.7% | 169 69.0% | 245 | 4.6163 | 0.66510 |
| Q13 | Students’ shared experiences on the faculty’s website are credible. | 0 0.0% | 3 1.2% | 12 4.9% | 43 17.6% | 187 76.3% | 245 | 4.6898 | 0.6221 |
| Q14 | The brand of a private faculty has good study programs. | 4 1.6% | 5 2.0% | 39 15.9% | 81 33.1% | 116 47.3% | 245 | 4.2245 | 0.9023 |
| Q15 | The brand of a private faculty stimulates scientific research. | 4 1.6% | 6 2.4% | 51 20.8% | 55 22.4% | 129 52.7% | 245 | 4.2204 | 0.9669 |
| Q16 | The brand of a private faculty encourages ambition and interests. | 4 1.6% | 9 3.7% | 33 13.5% | 93 38.0% | 106 43.3% | 245 | 4.1755 | 0.9131 |
| Q17 | The brand of a private faculty has a favorable price for the tuition fee. | 2 0.8% | 2 0.8% | 21 8.6% | 64 26.1% | 156 63.7% | 245 | 4.5102 | 0.7554 |
| Q18 | Satisfaction in learning is the strength of the brand of a private faculty. | 10 4.1% | 18 7.3% | 47 19.2% | 71 29.0% | 99 40.4% | 245 | 3.9429 | 1.1221 |
| Q19 | The brand of a private faculty offers the satisfactory knowledge and skills necessary for students’ future work. | 0 0.0% | 5 2.0% | 34 13.9% | 81 33.1% | 125 51.0% | 245 | 4.3306 | 0.7898 |
| Q20 | The brand of a private faculty offers good prospects for a career. | 0 0.0% | 9 3.7% | 34 13.9% | 77 31.4% | 125 51.0% | 245 | 4.2980 | 0.8426 |
| Q21 | The brand of a private faculty offers students the opportunity to engage themselves in students’ organizations. | 0 0.0% | 3 1.2% | 20 8.2% | 79 32.2% | 143 58.4% | 245 | 4.4776 | 0.6987 |
| Q22 | The brand of a private faculty encourages creativity. | 5 2.0% | 5 2.0% | 45 18.4% | 68 27.8% | 122 49.8% | 245 | 4.2122 | 0.9516 |
| Q23 | The brand of a private faculty has a good location. | 6 2.4% | 5 2.0% | 30 12.2% | 38 15.5% | 166 67.8% | 245 | 4.4408 | 0.9547 |
| Q24 | The Facebook page of a private faculty is of a high quality. | 9 3.7% | 16 6.5% | 44 18.0% | 53 21.6% | 123 50.2% | 245 | 4.0816 | 1.1278 |
| Q25 | The website of a private faculty is customized for mobile phones. | 1 0.4% | 5 2.0% | 18 7.3% | 58 23.7% | 163 66.5% | 245 | 4.5388 | 0.7544 |
| Q26 | The website of a private faculty is of a high quality. | 4 1.6% | 10 4.1% | 31 12.7% | 62 25.3% | 138 56.3% | 245 | 4.3061 | 0.9539 |
| Factors Affecting Students’ Motivation | The Social Network | Brand Uniqueness | |
|---|---|---|---|
| Mean | 4.2832653 | 4.4095238 | 4.3836735 |
| Std Dev | 0.6899198 | 0.5732739 | 0.6001868 |
| Std Err Mean | 0.0440774 | 0.0366251 | 0.0383445 |
| Upper 95% Mean | 4.370086 | 4.4816656 | 4.459202 |
| Lower 95% Mean | 4.1964446 | 4.3373821 | 4.308145 |
| N | 245 | ||
| Independent Component | ANOVA | Std Beta | RSquare (%) | Connectedness | Hypothesis | Regression Equation |
|---|---|---|---|---|---|---|
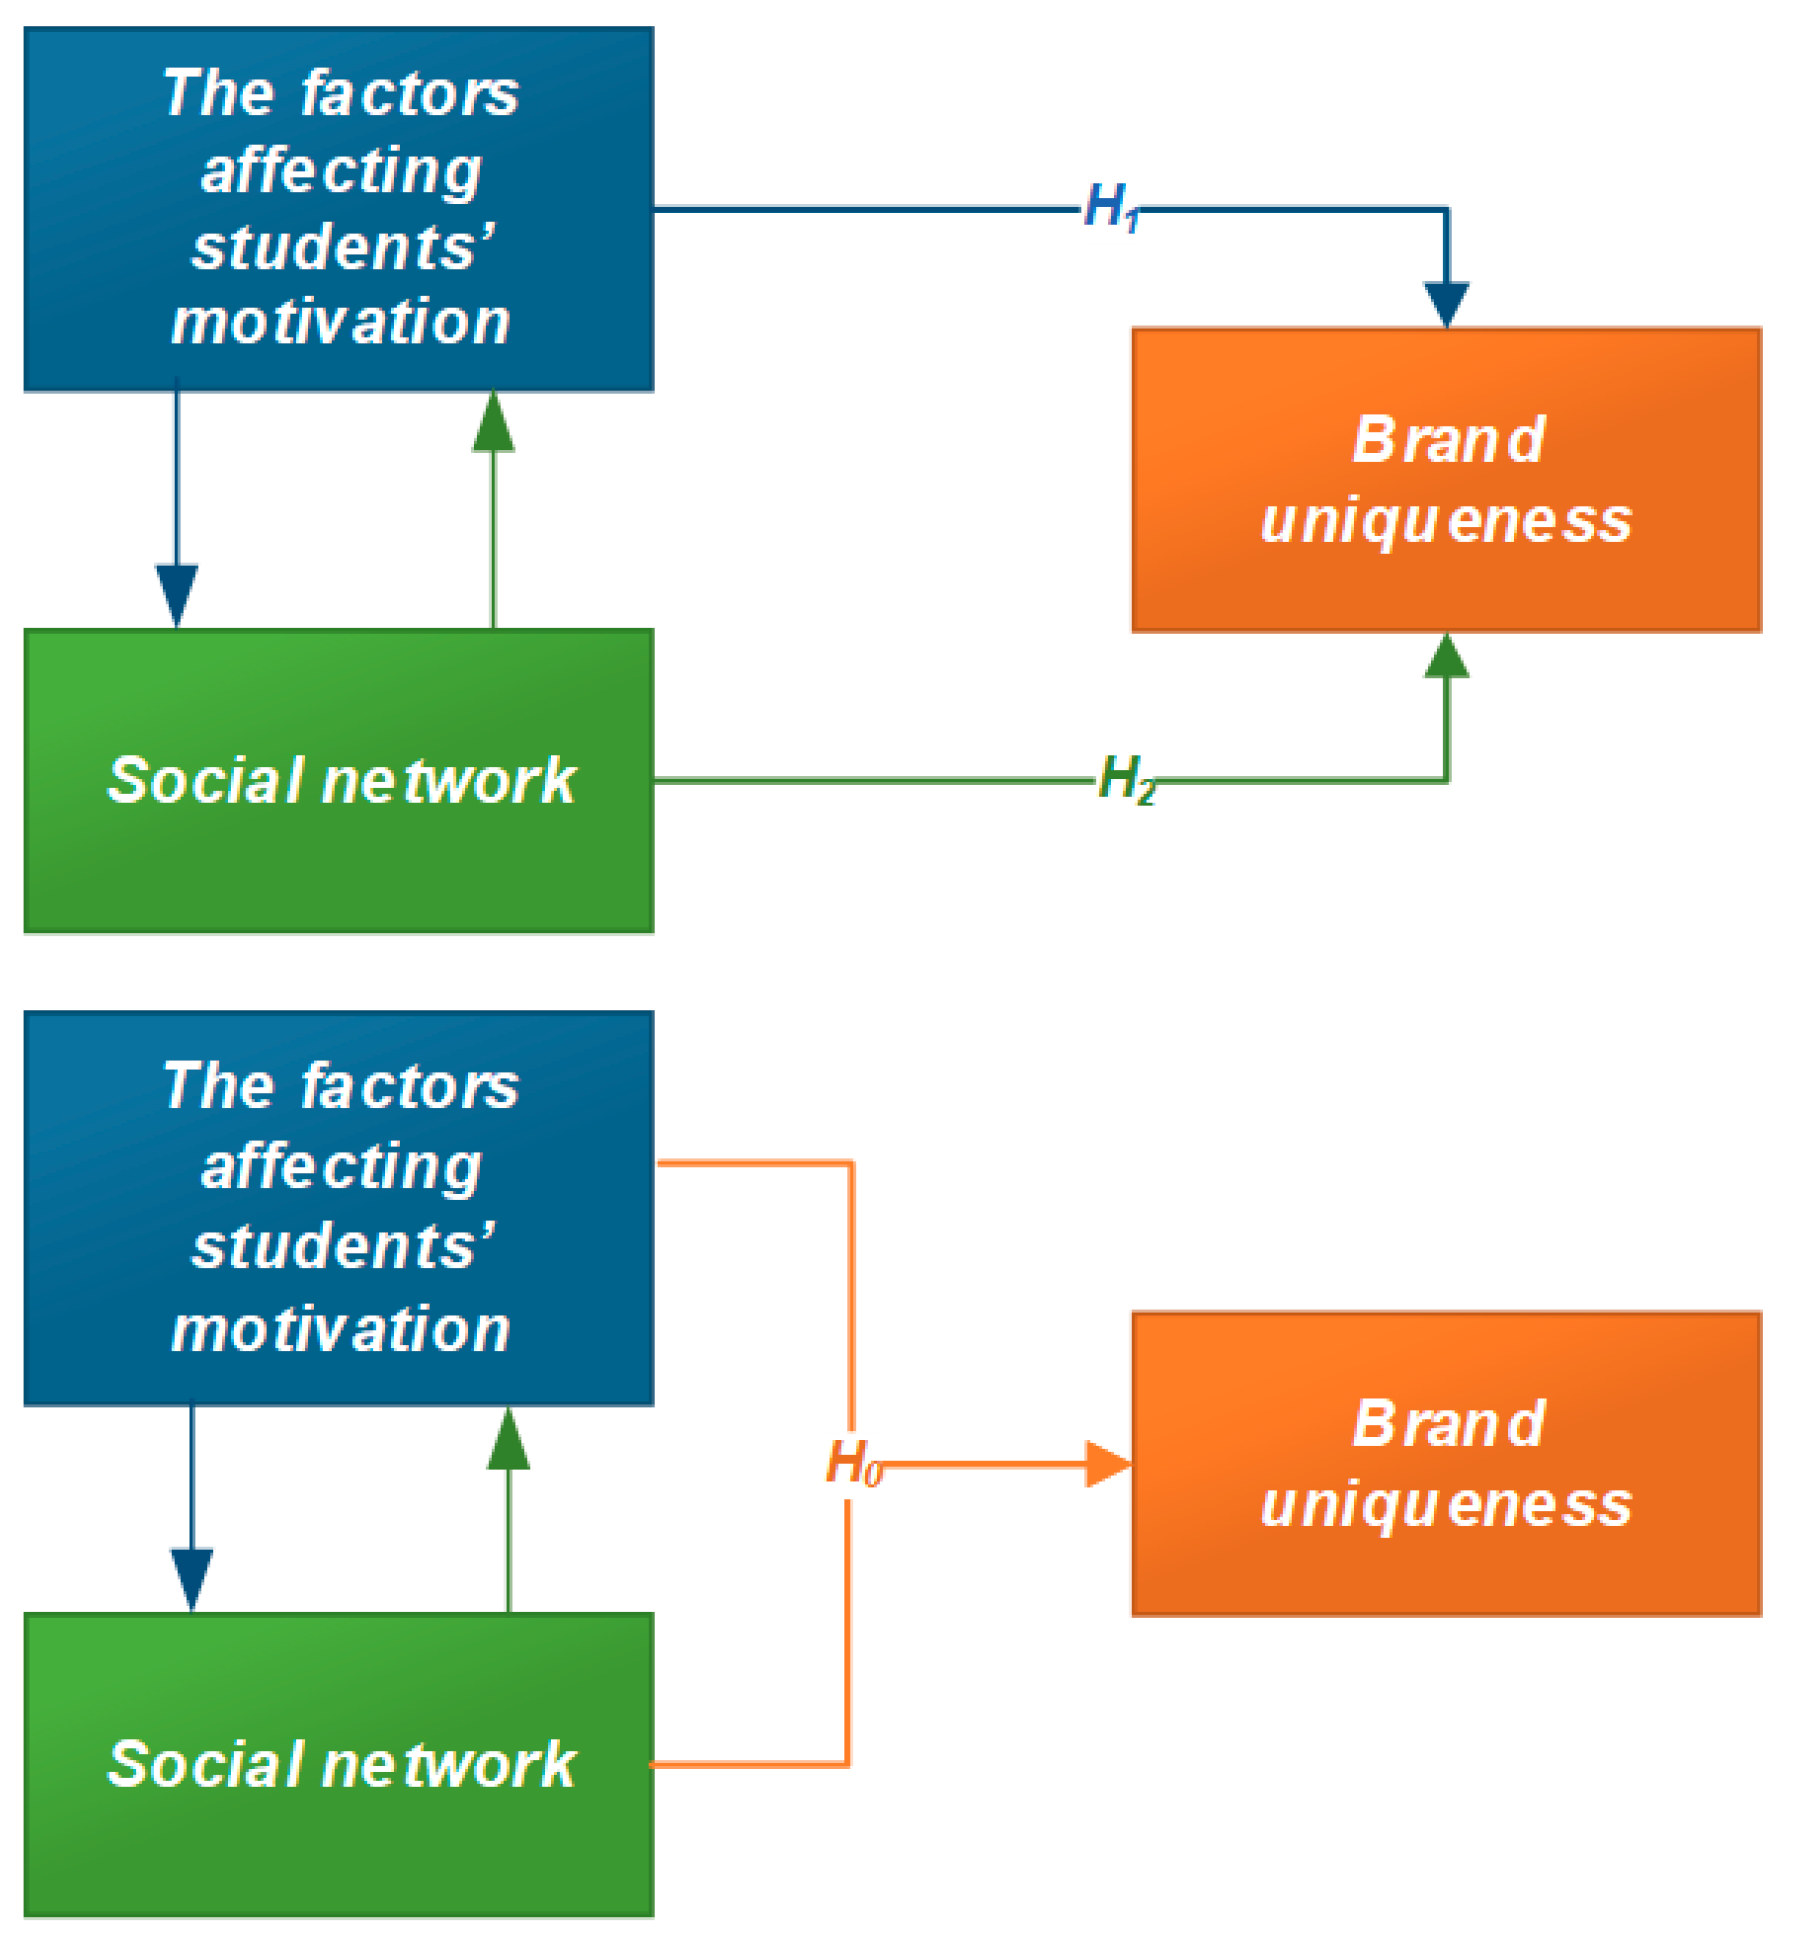
| Factors Affecting Students’ Motivation | [F(1243) = 266.2097, p < 0.0001] | 0.72304 | 52.27 | Medium strong | H1—accepts the level Factors Affecting Students’ Motivation influences the level of Brand Uniqueness. | |
| The Social Network | [F(1243) = 201.0202, p < 0.0001] | 0.67285 | 45.27 | Medium strong | H2—accepts the level of The Social Network influences the level of Brand Uniqueness. |
| Independent Component | ANOVA | Std Beta | RSquare (%) | Connectedness | Hypothesis | Regression Equation |
|---|---|---|---|---|---|---|
| Factors Affecting Students’ Motivation and The Social Network | [F(2242) = 161.9446, p < 0.0001] | 0.75654 | 57.23 | Medium strong | H0—accepts the levels of Factors Affecting Students’ Motivation and The Social Network influence the level of Brand Uniqueness. |
Publisher’s Note: MDPI stays neutral with regard to jurisdictional claims in published maps and institutional affiliations. |
© 2022 by the authors. Licensee MDPI, Basel, Switzerland. This article is an open access article distributed under the terms and conditions of the Creative Commons Attribution (CC BY) license (https://creativecommons.org/licenses/by/4.0/).
Share and Cite
Brzaković, A.; Brzaković, T.; Karabašević, D.; Popović, G.; Činčikaitė, R. The Interface between the Brand of Higher Education and the Influencing Factors. Sustainability 2022, 14, 6151. https://0-doi-org.brum.beds.ac.uk/10.3390/su14106151
Brzaković A, Brzaković T, Karabašević D, Popović G, Činčikaitė R. The Interface between the Brand of Higher Education and the Influencing Factors. Sustainability. 2022; 14(10):6151. https://0-doi-org.brum.beds.ac.uk/10.3390/su14106151
Chicago/Turabian StyleBrzaković, Aleksandar, Tomislav Brzaković, Darjan Karabašević, Gabrijela Popović, and Renata Činčikaitė. 2022. "The Interface between the Brand of Higher Education and the Influencing Factors" Sustainability 14, no. 10: 6151. https://0-doi-org.brum.beds.ac.uk/10.3390/su14106151