
ICT and Environmental Sustainability: A Comparative Study


1
Ted Rogers School of Management, Toronto Metropolitan University, Toronto, ON M5B 2K3, Canada
2
Ted Rogers School of Information Technology Management, Toronto Metropolitan University, Toronto, ON M5B 2K3, Canada
*
Author to whom correspondence should be addressed.
Sustainability 2022, 14(14), 8651; https://0-doi-org.brum.beds.ac.uk/10.3390/su14148651
Submission received: 8 June 2022
/
Revised: 5 July 2022
/
Accepted: 13 July 2022
/
Published: 14 July 2022
(This article belongs to the Special Issue IT-Enabled Sustainability and Development)
Abstract
:This study investigates the role of information and communication technology (ICT), political instability and violence, and international protocols on global carbon emissions. Our empirical analysis used archival data for 146 economies from 1996 to 2019. The study’s estimates are also based on subsamples from the Organization for Economic Co-operation and Development member countries. The study found that ICT has statistically significant impacts on reducing CO2 emissions globally, but the extension of the impact for OECD member countries is considerably more substantial. Therefore, the subject of study is considered to be among the first few studies to measure the effects of violence and regional conflicts on global warming—a notable result for conflict regions around the world. Additionally, the authors narrowed down the findings to a micro level and conducted a comparative study between Canada and the United Kingdom to evaluate the countries’ performances concerning climate mitigation initiatives.
1. Introduction
The United Nations (UN) General Assembly 2015 implemented the 2030 Agenda for Sustainable Development as a way of a “plan of action for people, planet and prosperity that seeks to strengthen universal peace in larger freedom” [1] (p. 1) through the introduction of 17 Sustainable Development Goals (SDGs). Combating climate change and its impacts represents Goal 13 of the United Nations SDGs [1].
The United Nations Global Compact 2018 [2] recognized that organizations worldwide could play a vital role in advancing the Sustainable Development Agenda by incorporating SDGs in their business strategies and manufacturing processes to discover and present new solutions for combating universal sustainable problems. Furthermore, such efforts could help organizations reach new target markets, benefit from collaborating and cooperating with new business partners, and ultimately enjoy the opportunity to enhance their productivity levels [3,4,5].
Exponential growth in greenhouse gas (GHG) emissions from human-induced activities negatively impacts climate change. It has been universally agreed that carbon dioxide emissions are the leading cause of global warming. They can also increase societal costs by harming social welfare and social security. In this research, we focused on the carbon dioxide (CO2) emission as the primary contributor to GHG since “each gas that contributes to global warming has a carbon dioxide equivalent, and that weighting factor is used to convert it into a common metric” [6] (p. 10).
Although a relatively new concept, carbon curbing mechanisms have been compared in the literature, and an emerging debate has appeared around which program contributes more to reducing GHG emissions. In some countries, strategies have been implemented to limit GHG emissions at various governmental levels. Some of these strategies have presented three-carbon abatement mechanisms, namely, the command-and-control system, the cap-and-trade, and the carbon tax program [7,8]. Through the command-and-control system, a government possesses the authority to impose administrative measures to minimize GHG and carbon emissions. However, according to Nordhaus [9] the command-and-control GHG abatement method is inefficient, and therefore, not suggested to be implemented. The other two mechanisms, carbon tax and cap-and-trade, provide economic disincentives to using carbon-intensive fuels for industry and the general public [7,10,11]. One of the main differences between both carbon abatement mechanisms is the method in which the cost of minimizing carbon emissions has been allocated and distributed. For the cap-and-trade, the trade permits are provided to consumers for free, known as ‘Grandfathering’. Due to free permits, users are initially not charged for most of their carbon emissions. Since customers only pay for the additional licenses obtained by industry, this form of enforcement has been hailed as a less expensive way to reduce carbon emissions, aiding consumers to gradually adapt and control their carbon emissions. Conversely, under the carbon tax, consumers are compelled to pay for every unit of carbon emitted. While the cap-and-trade initially seems to be an attractive short-term solution to investors, it does not necessarily imply an overall more optimal approach.
Aside from debates around the “optimal” carbon curbing mechanism, other factors impact firms’ green decisions by influencing firms’ willingness to invest in more sustainable technologies and practices. According to the literature, the main drivers of environmental advancement are market pull, technology push, and the regulatory push–pull effect [12]. Similarly, information and communication technology (ICT) developments have grown inquiries about its applicability for reducing the production of carbon dioxide globally through “developing smarter cities, transportation systems, industrial processes and energy-saving gains” [13] (p. 85). While climate change could be combated through conventional tactics, the situation’s urgency urges the need for a faster and smarter transition towards more sustainable industrial processes and advancements.
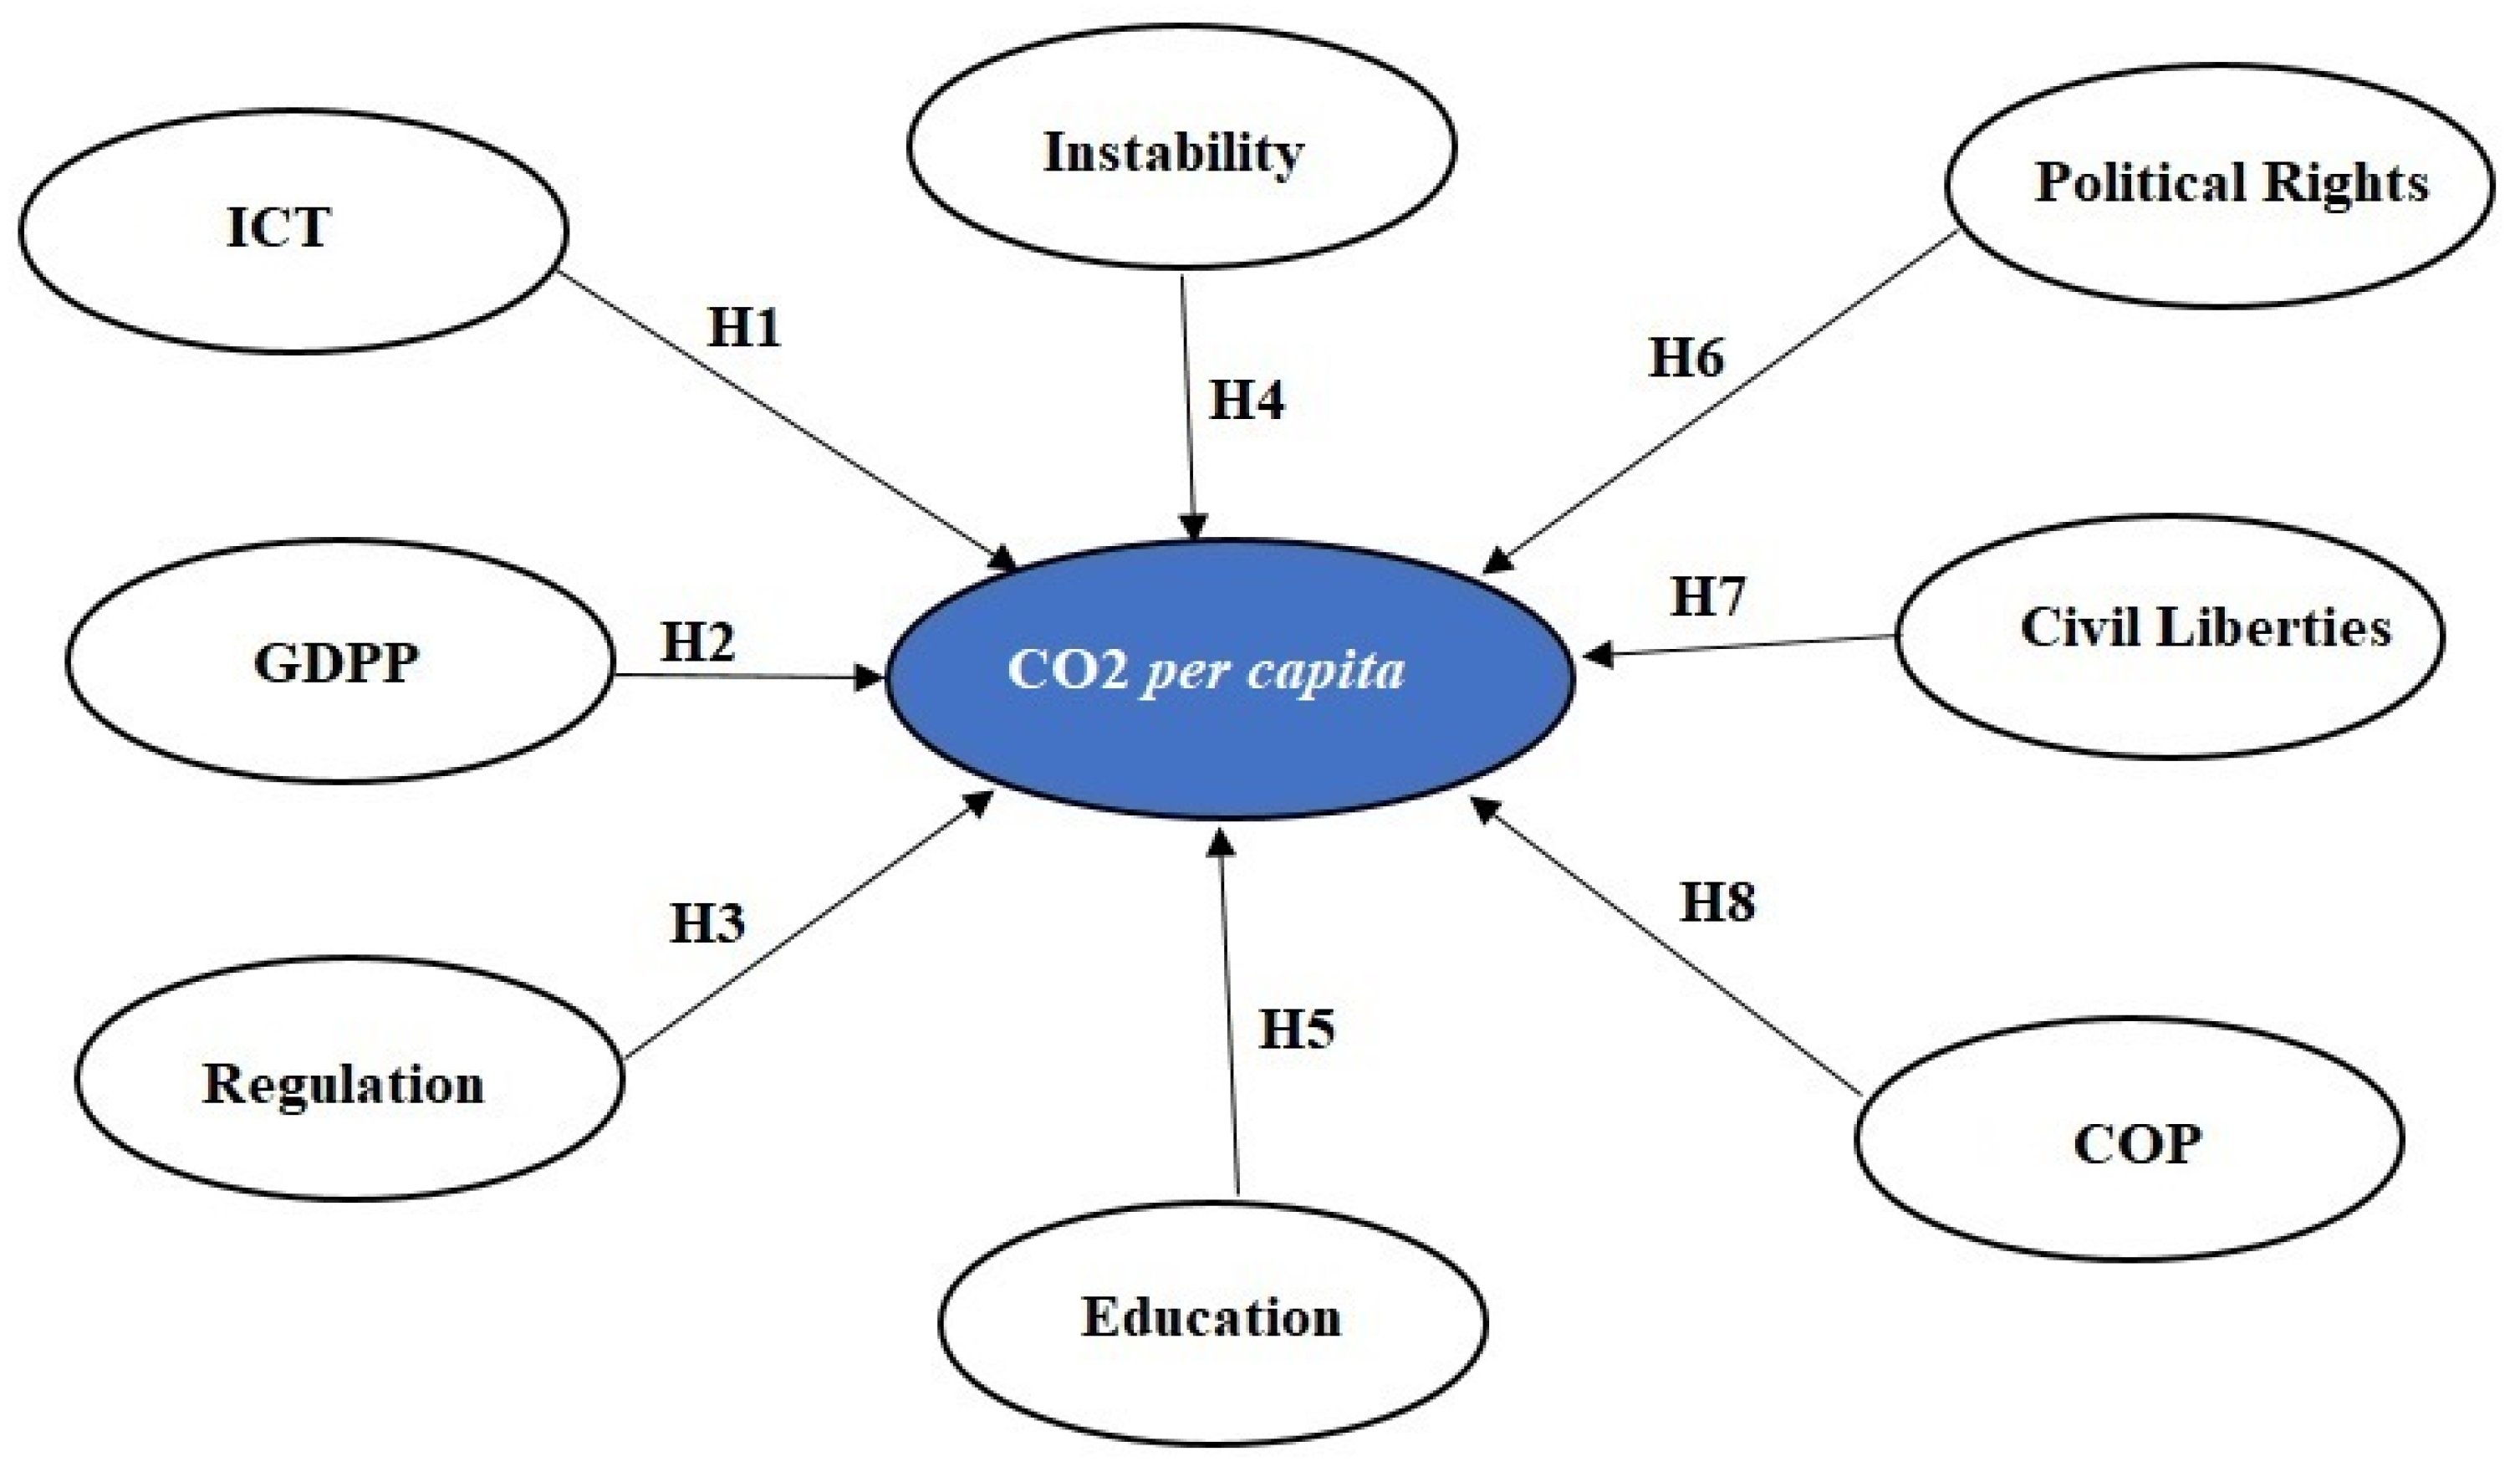
This empirical study is deductive research, or a top-down approach, starting with a literature review and the theory of sustainability. It establishes hypothesis settings as depicted in Figure 1 and, through data collection and analysis, confirms the results based on the theory. In particular, we analyze the global data to determine the influence of variables (e.g., each hypothesis) on the target variable (e.g., CO2). Then we narrowed down OECD data for the sake of the same settings, and then we focused on two well-developed ICT nations and members of OECD to find their environmental performances. Finally, we are interested in finding the gaps between these two countries to address them and help policymakers tackle the issues promptly.
To do so, we investigated and quantified the effect and extent of ICT and international protocols in combating climate change by reducing carbon emissions for 146 nations from 1996 to 2019. We examined the relationships between CO2 emissions in metric tons per capita and the model’s independent variables, namely, ICT, education, GDPP, political instability, resistance, political rights (PR), and civil liberties (CL) on a global scale. The following main research questions drove the study:
- RQ1.
- What is the role of ICT in reducing the carbon footprint?
- RQ2.
- What is the role of international treaties/protocols in reducing the carbon footprint?
- RQ3.
- How compatible are Canadian environmental policies with OECD and the United Kingdom to reach its emission reduction targets?
2. Theoretical Background and Hypotheses Development
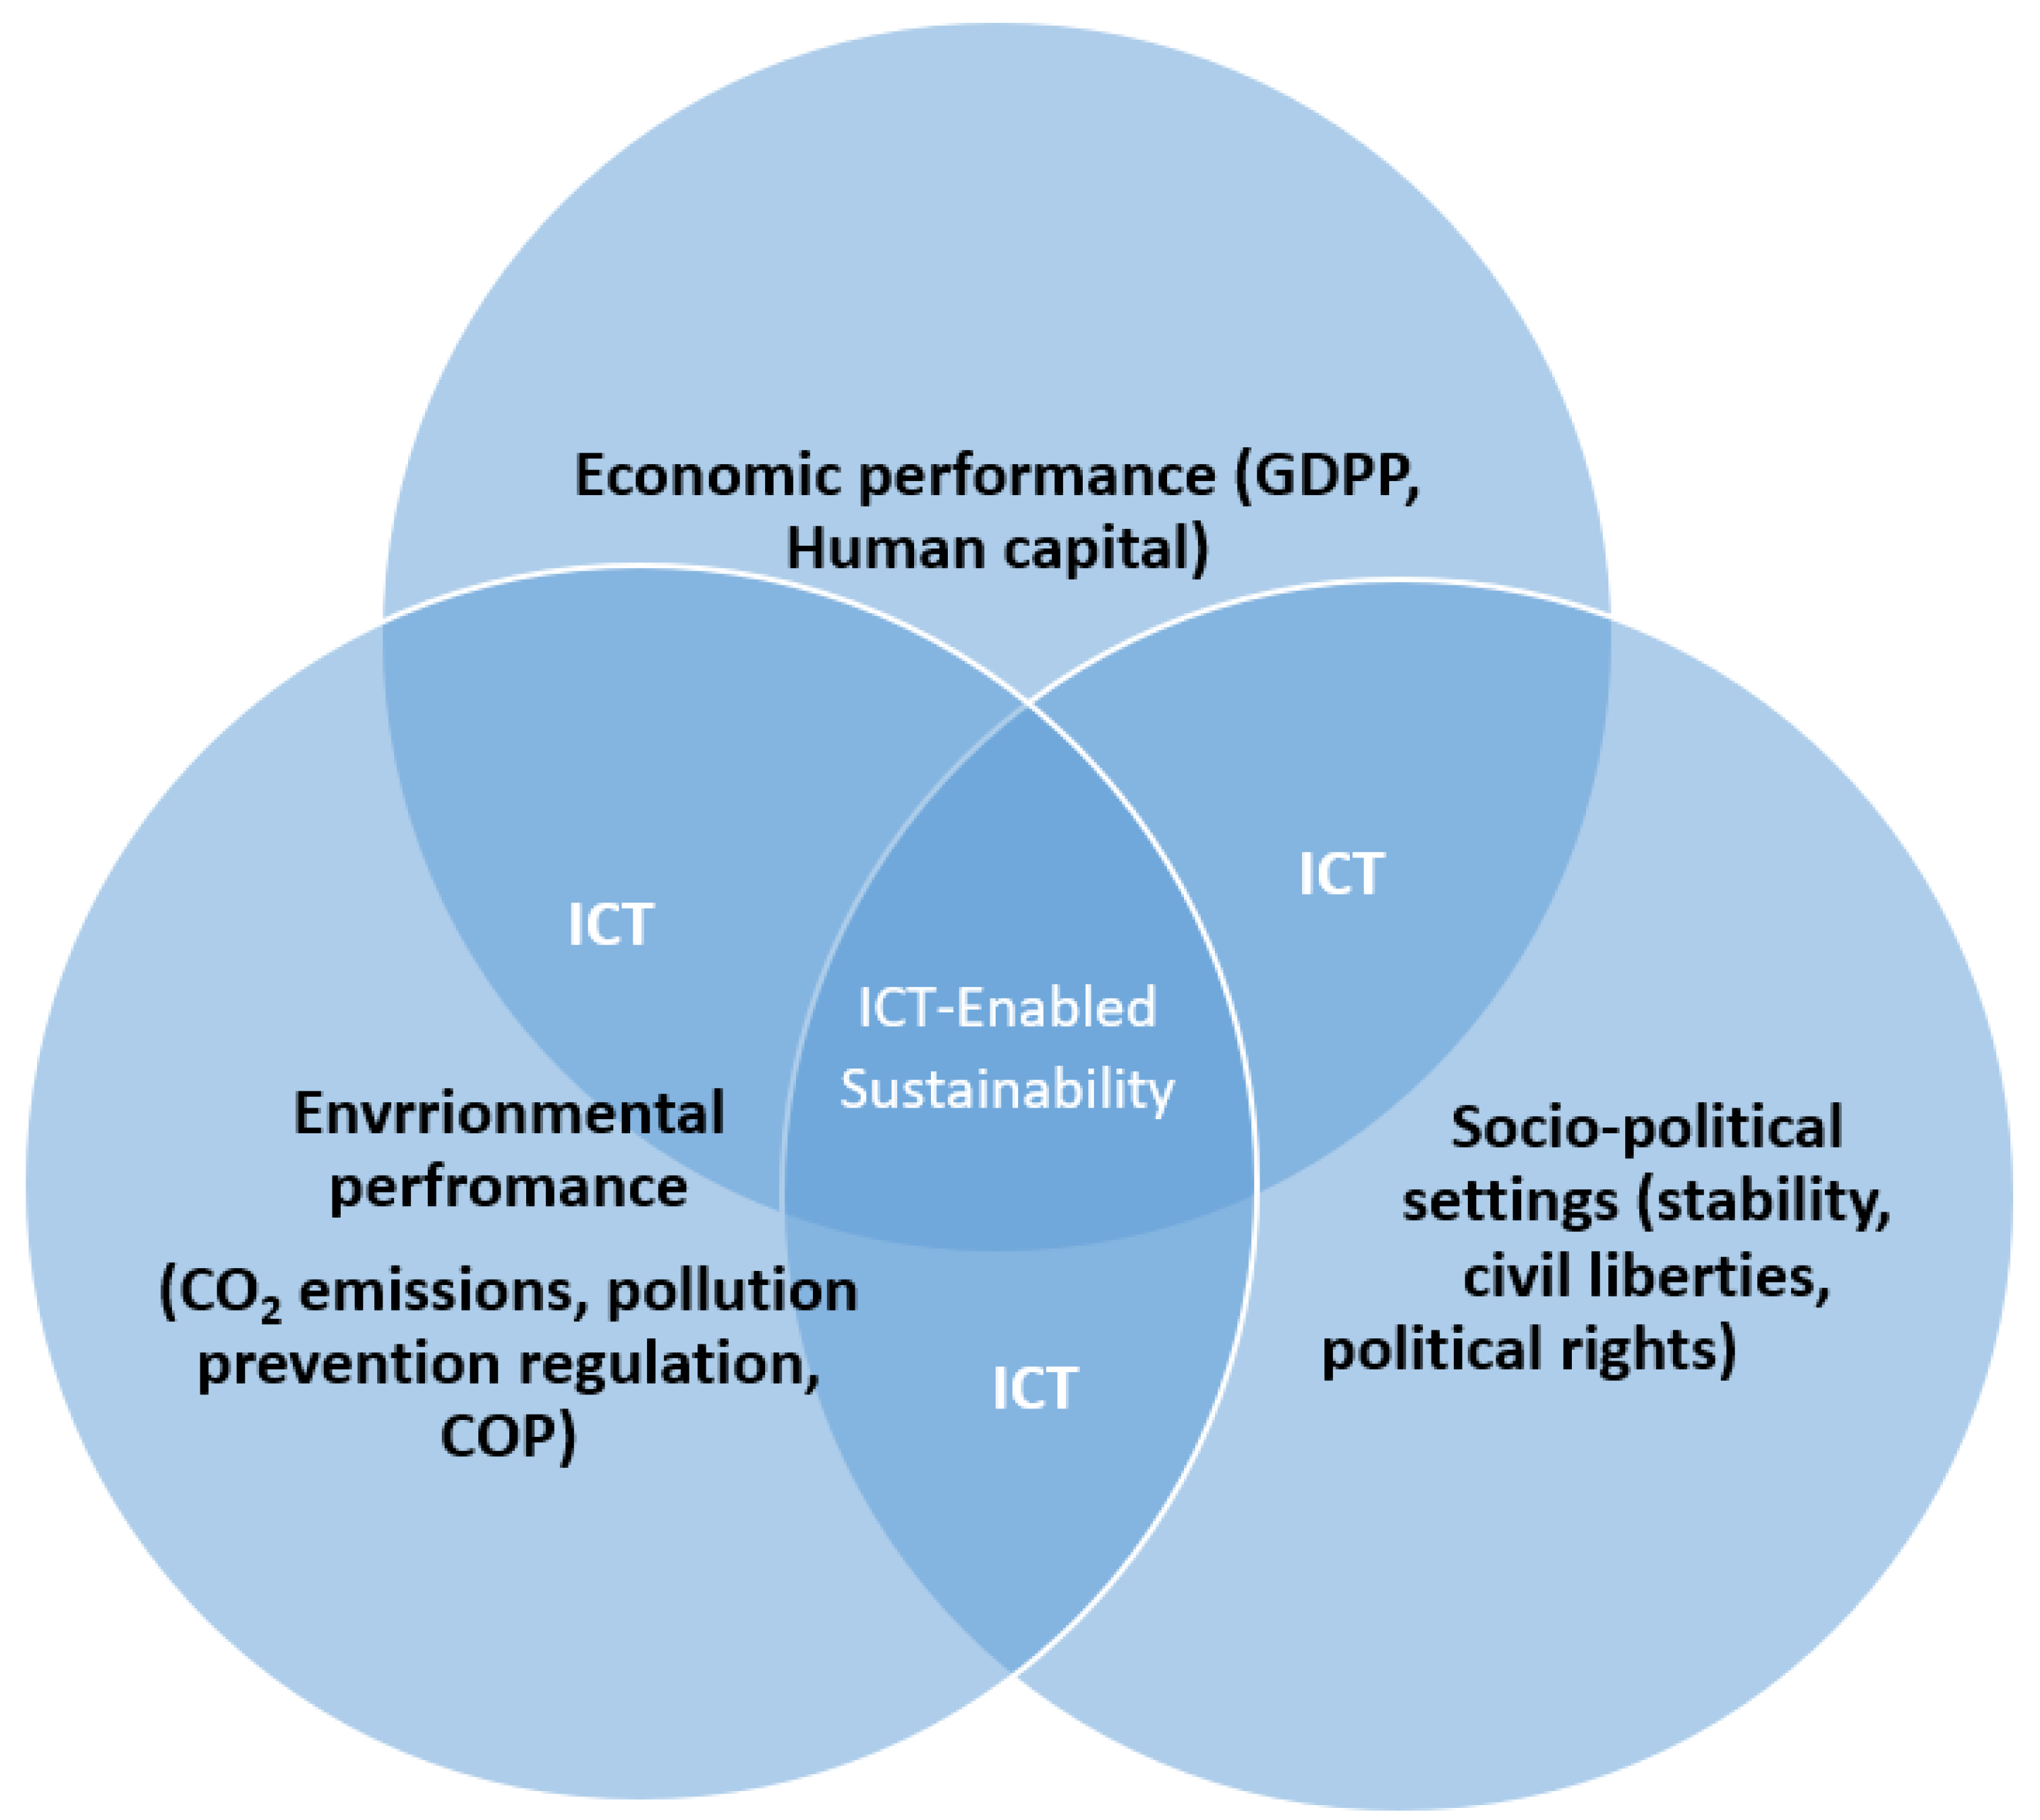
Environmental sustainability and, in particular, ICT-enabled sustainability is a complex and multi-domain phenomenon. This includes compliance with economic growth, people’s well-being, and other sociopolitical and environmental parameters focusing on ICT as an enabler for sustainability, as depicted in Figure 1.
The idea behind sustainability was initially introduced in 1987 by the World Commission on Environmental and Development (WCED) through the Brundtland report named “Our Common Future”. Soon after, the WCED defined the Sustainable Development concept and later a theory that defines Sustainable Development as “development that meets the needs of the present without compromising future generations’ ability to meet their own needs” [14] (p. 16). Throughout the years, the concept evolved from theory-based ideation, while now it is a topic used in both contexts of corporate social responsibility by practitioners and scholars within academia. Sustainability is framed through three pillars of social, environmental, and economic objectives. It is also noteworthy to mention that another way of looking at the topic is through the lens of “Triple-Bottom-Line”, encompassing the three “p’s” of People, Planet, and Profit, which correspond to the three pillars of sustainability, respectively [15].
2.1. ICT, Economic Growth and Their Impacts on CO2 Emission
ICT has been considered as an effective tool to reduce carbon dioxide emissions globally by developing smarter cities, transportation systems, industrial processes, and energy-saving gains [13,16]. ICT directly affects building systems and other infrastructures’ overall efficiency and electricity consumption. While ICT has been forecast to produce around two percent of the globe’s overall GHG emissions [13], the Global e-Sustainability Initiative report [17] states that ICT will help combat global GHG emissions and, more specifically, CO2 emissions by 15 percent. Moreover, AI and machine learning provide valuable resources for policy and decision making in the era of big data and digital imaging relevant to environmental studies.
Similarly, it has been argued that while ICT positively impacts economic growth as measured by per capita GDP (GDPP) [18], GDP’s growth contributes to the increase in CO2 emission; as such, the notion of sustainable development has become vital to today’s economic development. In this context, developments in ICT worldwide are causing inquiries about the degree to which these developments could be influential in designing better environmentally friendly patterns in our lives. Misuraca and Viscusi [19] argue that ICT is the primary driver of innovation. “Going smart” is a relatively new concept that is promptly shaping and influencing both academia and the literature related to policymaking. According to Shirazi and Hajli [20], ICT is the primary engine for sustainable innovation.
The latest ICT innovations encourage the implementation of “smarter” tactics for developing sustainable products, suggesting a disappearance of conventional methods in supporting the development of environmentally friendly commodities. Gazzola et al. [21] research results propose that the conjunction of “green” and “smart” designs for green advancements could be accomplished if “smart-centric” methods for both policymaking and planning (strategic decision making) are incorporated into the central vision for developing green urban setting through sustainable tactics. Therefore, this offers a “win-win” answer to sustainable concerns. Thus, this can be likened to concepts of “ecological modernization”, which argues that technological developments and better use of natural resources and institutional change can help us move towards more environmentally friendly movements and growth in the future [21].
The empirical studies of [13,22] show that ICT has a significantly negative effect on CO2 emissions. In this context, ICT is regarded as one of the critical strategies introduced to mitigate carbon dioxide emissions in various countries. Also, causality results show that energy consumption, GDP growth, and financial development all increase carbon dioxide emissions [22,23].
Based on the above discussion on the relationship between GDPP, ICT, and CO2 emissions, we propose the following hypotheses:
Hypothesis 1 (H1).
ICT reduces the level of CO2 emissions.
Hypothesis 2 (H2).
The growth of GDPP is positively related to higher levels of CO2 emissions.
2.2. The Impact of Government Environmental Policies and Regulations on CO2 Emissions
Based on the triple bottom line theory introduced by Elkington [24], any organization’s outcome should be compared and judged against the interdependent ecological, financial, and societal dimensions. The “Win-win” hypothesis or Porter’s hypothesis indicates that organizations’ sustainable and financial progress could be improved by enacting environmental regulations and policies as they focus on firms’ innovational enhancements.
Regulations are divided into flexible and inflexible groups [25]. Relaxed/flexible regulations are “innovation-friendly”. They would encourage firms to pursue reasonable practices, innovations, and products to meet the regulatory requirements. Flexible regulations would only indicate the required outcome by leaving some autonomy to firms in choosing their path (and how) towards the result. For instance, EU-ETS can be categorized under a flexible regulatory regime as it has only has set a cap on the overall quantity of carbon emissions while granting tradable permits to firms [26]. On the other hand, strict regulations would prescribe specific products or practices for organizations to follow to meet the obligatory requirement(s) set by the regulatory body to achieve a specific result [26].
Consumers and policymakers can employ constant pressure on businesses to produce products in a way that would minimize their harmful effect on the ecosystem [27,28]. If companies’ productions and practices are doubtful, they will experience fewer consumer demands, but fines for not complying with policies and regulations will increase [29]. However, it is essential to highlight that consumers’ non-consumption of a particular product(s) or brand(s) also plays a crucial role in moving towards sustainability [30]. According to [30], the action taken by consumers not to consume a particular product(s) can be either voluntary or compulsory. When non-consumption is compulsory, government officials impose a specific penalty through regulations and policies on consumers who consume the forbidden product(s). This is an example of a country’s resistance to consumption of a certain product(s) by enacting certain laws and regulations to forbid certain actions. Product banning directly impacts firms’ investment decisions towards innovations and sustainability developments [31]. Therefore, governments can promote and demote sustainable production and consumption [31].
According to the EPI [32], lack of enforcement, strong regulatory actions, and adoption of safe industrial practices have caused the global scorecard to be scored relatively low as environmental risks, including dangerous and heavy pollutants, continue to harm human lives. For instance, heavy metal pollution remains to be a global problem. To address this, certain regions where they banned or limited the “lead” in petrol, paint, and plumbing could successfully reduce the life-years lost to death or disability caused by lead exposure [32]. Therefore, sustainable outcomes will be achieved if countries pay attention to all areas of sustainability, backing strong regulations with suitable investments [32] (p. 28).
Even though pressure on firms may result in advanced environmental performance of firms, stricter environmental regulations may adversely impact the ecosystem [33]. Similarly, [34] who have considered a dual-stage of the decision-making process for a couple of firms under both uniform and discriminatory tax regimes, explored that consumers’ profit under the discriminatory tax policy (as an element of social welfare) might fade. Under the uniform tax strategy, an identical tax rate is executed on all companies on every production unit. In contrast, greater tax rates are executed on companies with less environmental qualities under the discriminatory tax strategy.
Sustainable regulations and policies, dependent upon firms’ investments in green technologies, such as regulations for industries, are tricky since huge investments should be made to control and monitor carbon production rather than focus on the operational process [35]. Conversely, governmental regulations that are more dependent upon investments of governments in firms, such as subsidies, will help the industry partially comprehend the regulation itself while leaving firms with enough capital to invest in R&D and green technologies. Thus, such regulations would positively impact firms’ performance toward more sustainable developments [36,37]. Furthermore, according to “institutional innovation theory”, new laws, regulations and policies should focus more on helping firms invest in green technologies rather than compelling them to obey the regulations through enforcement techniques. Hence, regulations related to environmental subsidies and tax breaks are necessary to motivate firms toward more sustainable advancements [36,37].
This study would help policymakers effectively measure any voluntary program’s efficiency and design to achieve the optimal outcome. Based on the above discussion, we propose the following hypothesis:
Hypothesis 3 (H3).
Governments’ sound environmental policies and regulations influence the reduction of CO2 emissions.
2.3. The Impact of Regional and Political Instability on an Economy and Sustainable Developments
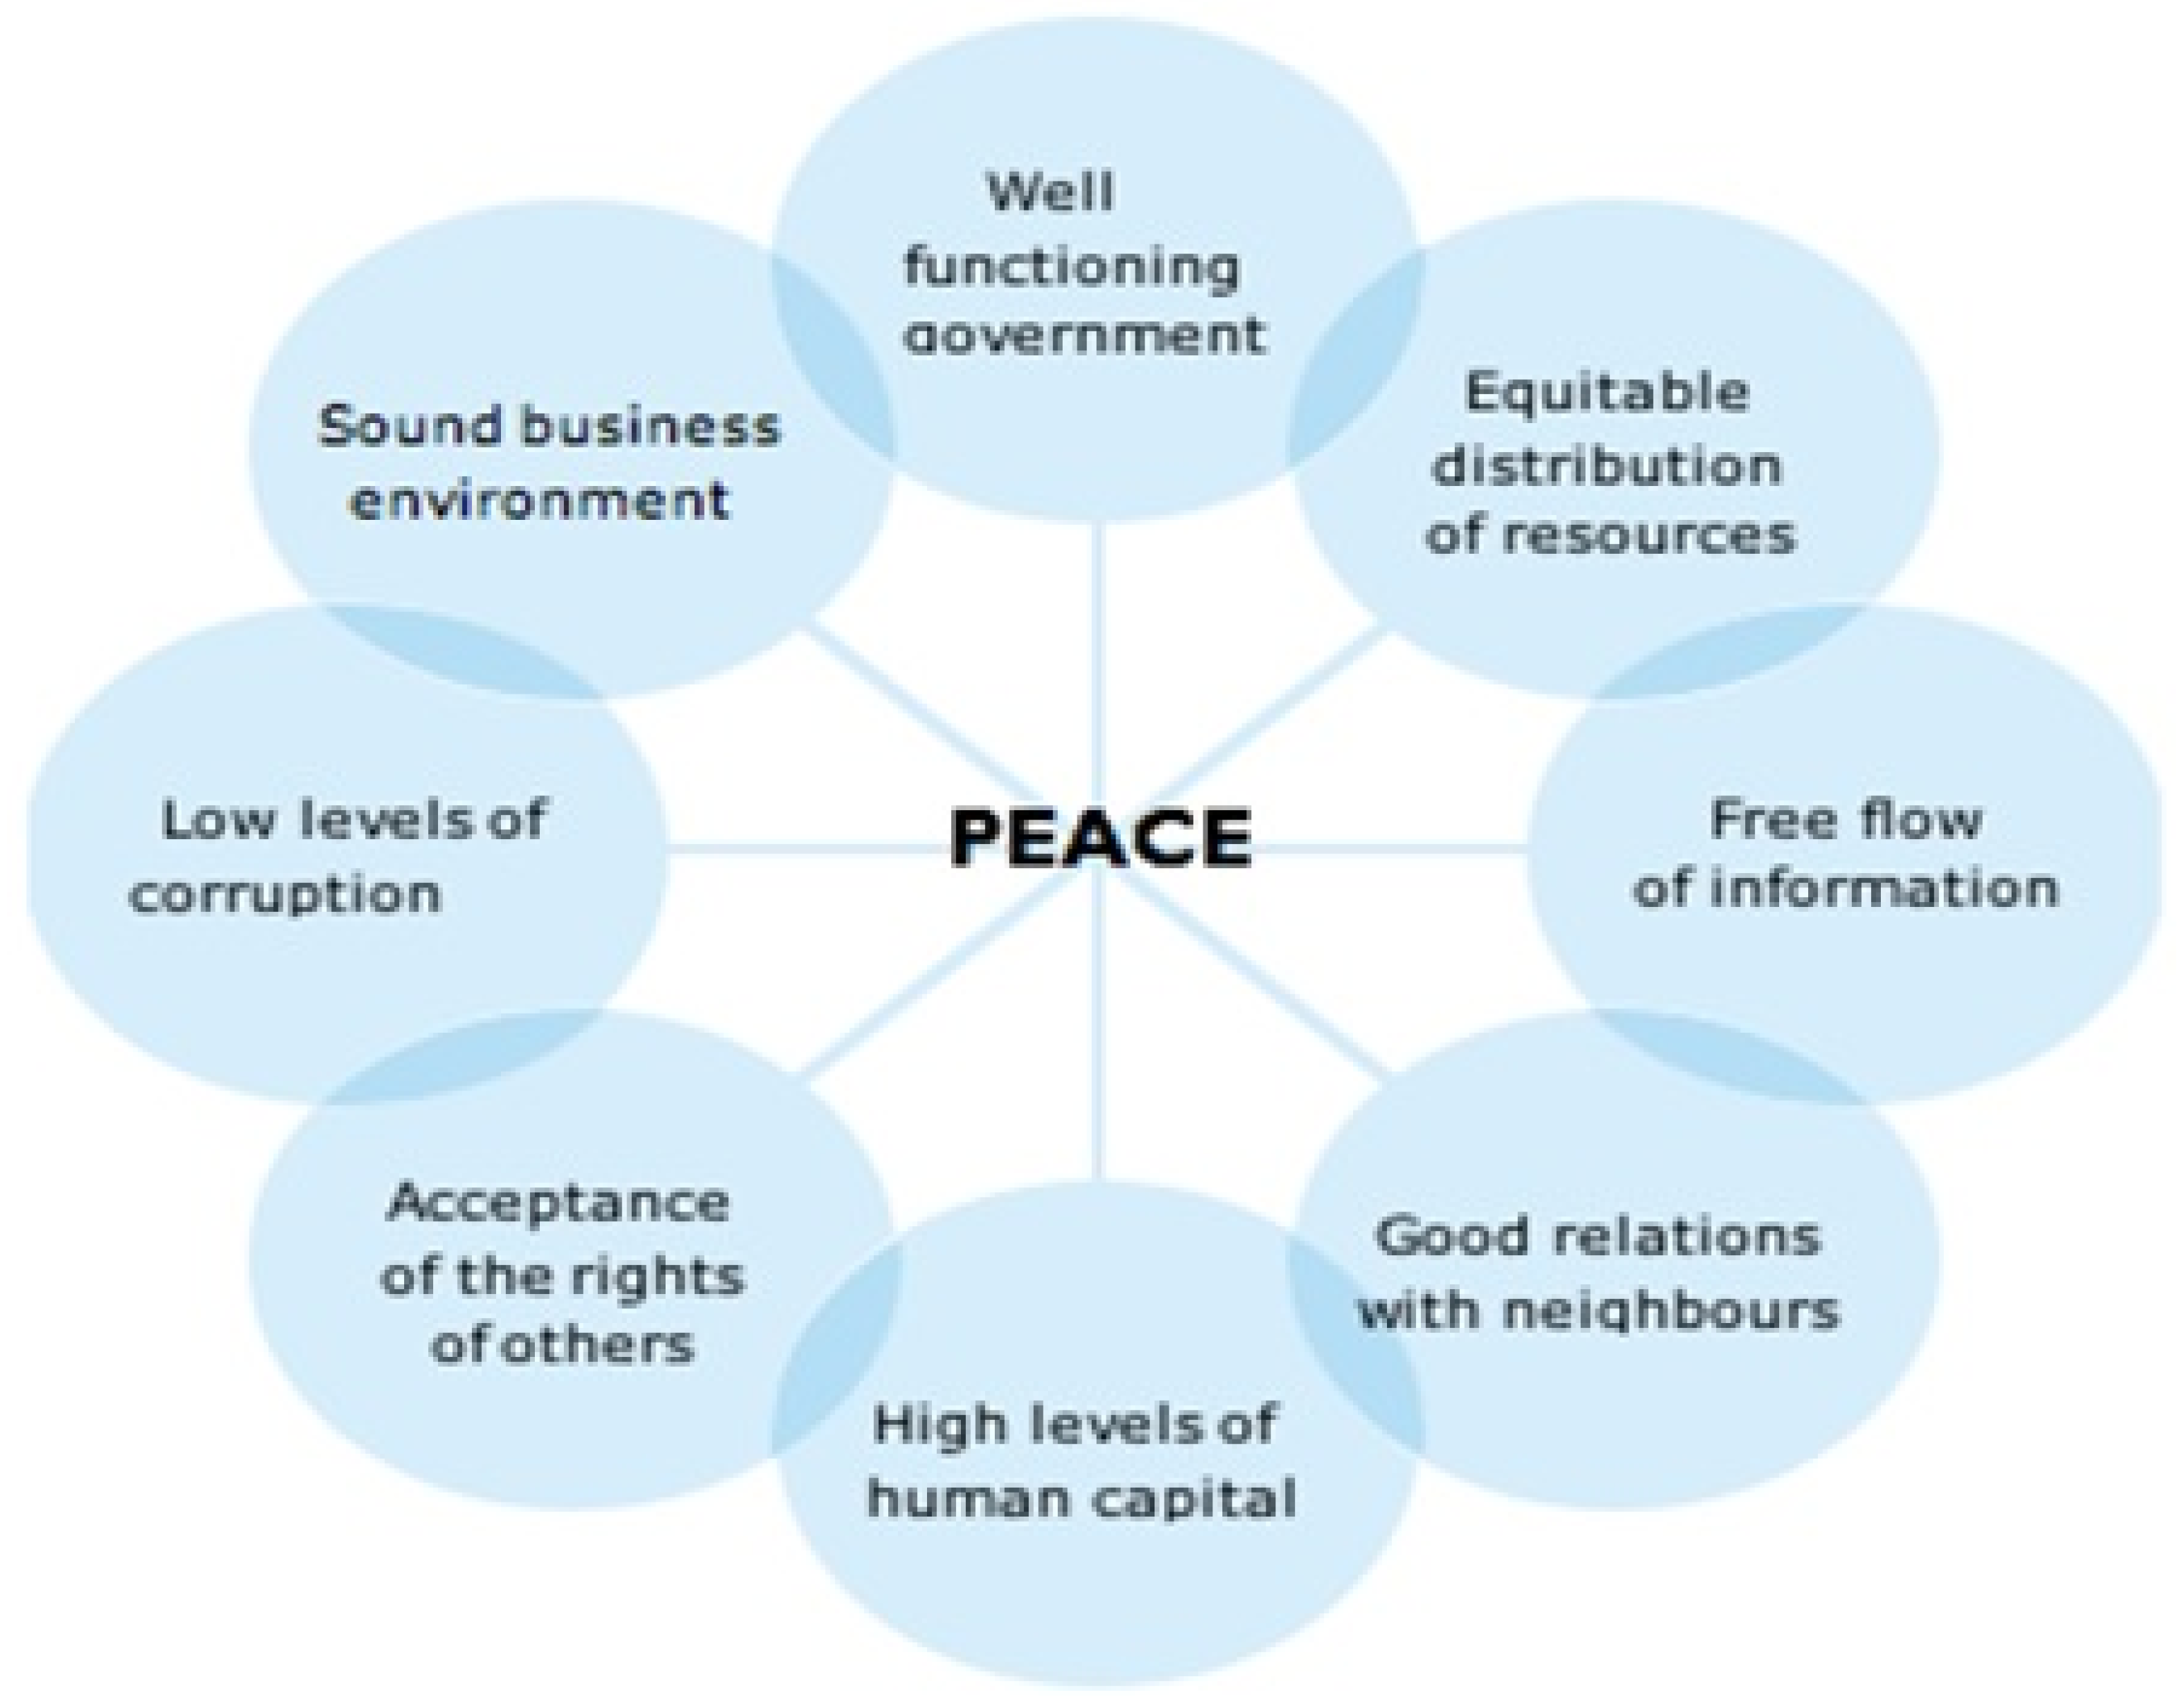
Countries’ stability is directly related to their level of peacefulness. The higher the country’s level of stability, the faster it develops. According to the report of the Global Peace Index [38], “Positive Peace” factors are independent factors that are significantly associated with “stronger business environments, better performance on well-being measures, gender equality and better performance on ecological measures” of a country [38] (p. 83). Positive Peace has been defined as “the attitudes, institutions and structures which create and sustain peaceful societies. These same factors also lead to many other positive outcomes supporting the optimum environment for flourishing human potential” [39] (p. 6). As shown in Figure 2, Positive Peace has many pillars, from a well-functioning government to a sound business environment, low corruption, good relations with neighbors, and a fair distribution of resources.
It has been argued that societal and economic advancements are expected to be attained in countries with greater Positive Peace ratios. For instance, Europe has kept its position as the most peaceful continent globally. The continent also experienced the most significant environmental, social, and economic developments throughout the eight-year peacefulness trend [38].
Conversely, countries with weak “Positive Peace” factors tend to use the military to suppress internal conflicts. According to [38] the direct and indirect cost of violence was USD 14.96 trillion PPP in 2020, equivalent to 11.6 percent of global GDP or USD 1942 per person. Syria, South Sudan, Afghanistan, and the Central African Republic had the highest proportional economic cost of violence, equivalent to 82, 42, 40, and 37 percent of GDP. Aside from the adverse financial impact of militarization, it has been proven that militarization and peacefulness have a negative correlation. “As countries become more militarized, they are more likely to experience negative changes in other domains such as social welfare and security” [39] (p. 38). Primarily, the factors leading countries towards development are almost the same factors needed for societies and countries to be peaceful.
The recent Russian invasion of Ukraine has left the country with a devastating tragedy that has caused extensive damage and loss of life, catastrophic suffering and health consequences, immeasurable environmental costs and disastrous environmental effects which ultimately impacted the country’s infrastructure. Russian aggression’s environmental costs and dimensions range from burning oil refineries and depots, buildings, hospitals, schools, telecommunication centers, and damaging energy facilities, including nuclear ones, to burning cars, busses, and military vehicles and equipment. As such, we propose the following hypothesis:
Hypothesis 4 (H4).
War and political instability negatively impact the reduction of CO2 emissions.
2.4. The Impact of Education, Political Rights, and Civil Liberty on Sustainable Developments
For Vare and Scott [40], sustainable development is the most significant challenge of our time, in which education is now being urged to affirm its support. McKeown et al. [41] argue that education is essential for achieving sustainability. People worldwide recognize that current economic development trends are not sustainable, and that public awareness, education, and training are vital for moving society toward sustainability. Education for Sustainable Development (ESD) is commonly understood as education that encourages changes in knowledge, skills, values, and attitudes to enable a more sustainable society for all. ESD aims to empower and equip current and future generations to meet their needs using a balanced and integrated approach to sustainable developments’ economic, social, and environmental dimensions [42]. In this context, ESD aims to develop competencies that enable and empower individuals to reflect on their actions by considering their current and future social, cultural, economic, and environmental impacts from local and global perspectives [43].
According to Higón et al. [13], lack of education inhibits innovation and slows the economy down. Education is a component of human capital and a determinant of economic growth. Thus, countries with high GDP and high levels of educational attainment have high capital stocks, which is the basis for innovation capability and sustainable economic competitiveness [13]. De Marchi [44] also emphasizes the significance of incorporating educational and research institutions in creating demands for eco-friendly products. Recent studies have also found that higher education levels are positively related to economic and national sustainability development [45].
Similarly, according to [46], the level of freedom and democracy is positively related to educational attainment, ICT advancements and sustainable development of a country. Furthermore, based on the report “Freedom in the World”, freedom and democracy have been defined and assessed based on each state’s political rights and civil liberties [47]. Based on the report, political rights consist of the “electoral process, political pluralism and participation, and function of government” [47]. Consistently, civil liberties include “freedom of expression and belief, associational and organizational rights, the rule of law, and personal autonomy and individual rights” [47]. In this context, Oates [48] argues that the more the public participates in political debates, events, and exercises their fundamental political and civil rights, the more involved they become in matters that impact their sociopolitical lives, including sustainable development movements such as moving toward smart cities.
Based on these arguments, the following hypotheses are proposed:
Hypothesis 5 (H5).
The level of educational attainment in each country influences the level of CO2 emissions.
Hypothesis 6 (H6).
The level of political rights in each country influences the level of CO2 emissions.
Hypothesis 7 (H7).
The level of civil liberties in each country influences the level of CO2 emissions.
2.5. International Protocols
The most recent international protocol on climate change, the Paris Agreement, wrapped up the third chapter of the UN climate change framework. The initial round of negotiations about climate change goes back to the period 1990–1995, when it involved the adoption of the United Nations Framework Convention on Climate Change (UNFCCC). The second phase of these negotiations covered the period of 1995–2004 when the Kyoto Protocol came into existence and force. Nevertheless, the current framework is more holistic and focuses on GHG emissions globally. The Paris Agreement came into existence due to negotiations in 2005 when nations switched their attention to what needed to be done after 2012 (post-Kyoto) when the first round of Kyoto Protocol commitments ended.
Although developing countries fought to keep the Kyoto Protocol alive, Annex I and Annex B countries with specific cap targets refused to partake. They did not find it fair to be bound by emission targets when big economies such as the United States and China were not bound. Instead, they argued for a more comprehensive scheme [49]. Aside from disputes and debates over the emission targets, the ultimate goals of these negotiations were to amend the Kyoto Protocol, establish another commitment period, and encourage a long-term collaboration plan under the UNFCCC.
The Kyoto Protocol’s first track was initiated in 2005, and the second track followed in 2007 in the Bali Action Plan. Finally, the tracks were completed in 2009 through the Copenhagen Conference, bringing all threads together [49].
The Copenhagen Conference ended with immense frustration, disappointment, and failure since parties only had two years to resolve numerous issues on their plates [50]. While heads of major economies and states’ leaders accepted and agreed to the Accord, the Accord was more political than legal. It is noteworthy to mention that the Accord could not gather the acceptance of the entire conference participants [50]. Nevertheless, countries such as India, China, Brazil, and other emerging economies approved the Accord and issued their national emission quotas and commitments for the first time [50].
While the Cancun Agreement in 2010 formally incorporated the Copenhagen Accord’s vital elements into the UNFCCC system, including country commitments to reduce emissions, it failed to resolve the following two main issues: whether these pledges and obligations should be continued beyond 2020 and whether Kyoto should be extended beyond 2012.
These issues led to the Durban Conference “Durban Platform for Enhanced Action” in 2011. The negotiations in the Durban Conference ultimately led to the Paris Agreement and resolved the issues mentioned above. As a result, the EU and some countries with the Kyoto Protocol’s targets accepted the second round of commitments. They officially adopted the agreement a year later in Doha. However, India, China, Brazil, and South Africa agreed to the mandate to negotiate a new platform that came legally into force in 2020.
It is important to highlight that the United States accepted the new mandate as it did not differentiate between developed and developing countries and applied it to all parties involved. The Durban Platform also included the Warsaw decision (“Further Advancing the Durban Platform”) in 2013, which meant to articulate the novel hybrid structure of the recent agreement that asked nations to submit their “Intended Nationally Determined Contributions (INDCs) before the Paris Conference [51]. After many years of trial and error, countries eventually established a platform known to be the modest approach taken so far.
The Paris Agreement intended to build a stronger foundation for combating climate change than heading towards ambitious expectations that the Kyoto Protocol created. Countries terminated the rigid Kyoto platform and agreed on a more relaxed regime at the Copenhagen Accord in 2009. Though it is still early to assess the success of the Paris Agreement, some call it “historical, and the world’s greatest diplomatic success” [52,53]. Eight features differentiate the Paris Agreement from the rest:
- Unlike the Copenhagen Accord, which was more diplomatic than a legal agreement, it is legally binding.
- Unlike the Kyoto Protocol, it makes no distinction between developed and emerging countries, and both nations are interested in minimizing and reducing global pollution.
- It identified and recognized the principal core obligations of all countries.
- It has established a long-term plan to combat climate change, unlike the Copenhagen Accord.
- It has established a durable framework that parties will need to meet every five years to share their accomplishments and introduce their new targets for the years ahead.
- It has set the stage for gradually strengthening mitigatory strategies over time.
- It has established an improved transparency and accountability framework by recording and announcing states’ targets internationally.
- It commands the universe to follow the framework (Bodansky, 2016).
In addition, in the Paris Agreement COP21, ninety percent of major carbon dioxide emitters pledged to declare their emission targets [11]. Based on the above discussions, we propose the following hypothesis.
Hypothesis 8 (H8).
The international environmental agreements, or Conference of the Parties (COP), positively influences the reduction of CO2 emission.
3. The Empirical Research Model
This research aims to examine the impact of external and internal influences on carbon production. As the optimal methodology, the quantitative approach gathers and interprets data. Moreover, since the authors investigate a social phenomenon (the impact of ICT and international treaties on the carbon footprint), the natural research methodology to pursue was the quantitative approach.
The empirical analysis to assess the impact of ICT and international treaties on carbon production is based on a linear statistical model, which has been presented in Equation (1) below:
CO2it = αit + β1*ICTit + β2*ln(GDPP)it + β3*regulationit + β4*instabilityit + β5*eduit + + β6*PR it + β7*CLit + β7* COP it + εit
The subscripts i and t refer to country and time, respectively; α is a constant; β is the variable coefficient, and ε is the stochastic error term. As shown in Figure 3, we assume that CO2 emission per capita (metric tons) is influenced by independent variables such as ICT, education, GDPP, regulation, instability, political rights (PR), civil liberties (CL), and COP.
Using Stata software version 15.0, we conducted two sets of regression analyses on global panel data and OECD data. The latter is used for our comparative study between Canada and the United Kingdom, as these countries are part of the OECD group and G7 countries, a subset of the OECD.
We deployed two sets of regression analyses, the ordinary least squares (OLS) and feasible generalized least squares (FGLS), on the global dataset and OECD data, generating four-panel data or investigation models. There are possible heteroscedasticity (or heteroskedasticity) and autocorrelation issues associated with OLS regression. While the former indicated the absence of homoscedasticity, the latter is the correlation between values of variables across different points in time. Furthermore, autocorrelation can become a problem with conventional estimates such as OLS regression as it assumes the independence of observations. To overcome the above issues, we deployed FGLS regression according to the literature [54,55,56].
Data
We used data for 146 economies from 1996 to 2019, resulting in 3504 unbalanced observations. This study has used various sources to collect data. Table 1 below shows the variable description and related data sources.
We collected CO2 emission per capita (metric tons) data from the European Union’s EDGAR Database [57,58]. Gross domestic product (GDP) per capita is measured based on purchasing power parity (constant 2017 international USD) drawn from World Bank’s database [59]. As shown in Table 1, the ICT index comprises five indicators collected from the ITU database [60]. The index of educational attainment was drawn from the UNESCO [61] database and the political rights (PR) and civil liberties (CL) data from Freedom House [47], with values ranging from one (highest) to seven (lowest). These values were transformed and converted to values between 1 and 100 (highest PR and CL). The stability index refers to socioeconomic and political stability and the absence of violence and terrorism at a country level. The index was collected from the World Bank’s resources at the World Governance Indicators site [62] with values ranging from −2.5 (lowest stability) to +2.5 (highest stability). These values were converted into values between 1 (lowest stability) and 100 (highest stability). The regulation index is an average value of two indices, the Quality of Regulation index from the Environmental Performance Index [32] and the quality of public administration from the World Bank’s Country Policy and Institutional Assessment database [63]. The EPI index is a value between −2.5 (lowest) to +2.5 (highest), while the CPIA index is a value from 1 (lowest) to 6 (highest). Before generating variable regulation from the above indices, these values were converted to values between 1 (lowest) and 100 (highest). Finally, as shown in Table 1, the variable COP is a binary value indicating the presence of each county at all three major international environmental conferences (Kyoto, Copenhagen, and Paris) or the Conference of the Parties (COP). Value zero represents the lack of participation or partly participation, while value one represents full participation.

Table 1.
Variable description and data sources.
| Variable | Unit of Measurement | Source |
|---|---|---|
| CO2 | Carbon Dioxide (metric tons per capita) | European Union, EDGAR [58] |
| GDPP | GDP per Capita in purchasing power parity terms in 2015 international dollars | The World Bank [59] |
| ICT | The composite ICT index used in this study combines indicators measuring ICT readiness, including fixed telephone subscribers, mobile cellular subscriptions, Internet users, and fixed broadband Internet subscribers per 100 inhabitants. | ITU Database [60] |
| Education | This index comprises the gross enrolment ratio of primary, secondary, and tertiary education (% of school-age population). | UNESCO [61] |
| Political Rights | The aggregated level of political rights for each country (one being the highest and seven being the lowest). | Freedom House [47] |
| Civil Liberties | The aggregated level of civil liberties for each country. (One being the highest and seven being the lowest). | Freedom House [47] |
| Instability | An index of regional and political instability impacting a country (1 = lowest stability, 100 = highest stability) | WGI [62] |
| Regulation | The quality of regulation is a measure of government environmental efficiency (environmental regulations and policies) for each country. The index converted and transformed to 1 as the lowest and 100 as the highest regulation quality. | Environmental Performance Index [32] Yale Center for Environmental Law and Policy, and WGI [62] |
| COP | A binary value indicates the country’s participation in three major environmental conferences (Conference of the Parties): Kyoto, Copenhagen, and Paris (zero = lack or partial participation, one = full participation) |
4. Empirical Results
Table 2 and Table 3 describe statistics related to heteroscedasticity and autocorrelation among variables associated with the global and OECD datasets. As indicated, there are no issues associated with the above problems in our datasets, and therefore, we can analyze the results of the OLS and FGLS as depicted in Table 3.
As shown in Table 4, as expected and supported by the literature, ICT had an inverse impact on the growth of CO2 emissions. The negative sign of the ICT variable indicates its inverse effect on the global CO2 emissions, and this impact is statistically significant at p < 0.001. ICT has helped private and public organizations, NGOs, and citizens to use nonrenewable natural resources more efficiently and responsibly. For example, in transportation the Internet provides an efficient platform for managing and monitoring transport systems (planes, trains, ships, busses, trucks, drones, and cars) compared to the traditional systems. The new transportation system, coupled with satellite-based communication such as GPS, improves transportation quality in terms of timing, cargo management, and movements. It ultimately impacts urban traffic and reduces CO2 emissions. Also, ICT-based video conferencing platforms (hardware and software) drastically reduce the number of business trips across the globe, reducing CO2 emissions. ICT has contributed to the energy efficiency of homes via smart home monitoring systems, industrial processes, products, and services which ultimately reduce global CO2 emissions.
Also, ICT software and simulation packages have improved the efficiency of using materials and other resources in manufacturing, agriculture, finance, building, and other industries by reducing the material losses in the industry. Similarly, ICT sensors provide smart water consumption in agriculture and reduce the volume of paper consumption (e.g., print forms and documents), traditionally used in finance and other industries, thus saving trees. As mentioned in the IAE report [64], ICT offers design tools to support building designers in estimating the combined impact of the different technologies during the design phase of a new building, allowing them to manage many alternatives to find optimal and sustainable design solutions.
Similarly, according to the results, political instability directly impacts CO2 emissions. It is statistically significant at the p < 0.001 level since regional conflicts, political instability, and violence have enormous effects on people’s health, socioeconomic, and environmental matters (see Table 4). War and political violence cost human lives, cause physical and psychological injuries, destroy a country’s infrastructure (e.g., water systems, roads, bridges, hospitals, schools, ICT networks, and so forth), and collapse the economy. It also has a wide range of environmental impacts. Table A1 in Appendix A shows the economic cost of political instability and violence for the top 20 ranked countries. As shown, the destruction of counties’ economies is enormous when measured as a percentage of GDP. For example, the economic cost of political instability and violence in Syria and Venezuela in 2019 constitutes 60% and 48% of the countries’ GDP.
Finally, as shown in Table 3, the year-specific dummy variable (time) is statistically significant for models (3) and (4) at the p < 0.001 level. This is because it captures exogenous advances in carbon-saving technology for all countries. As indicated, the time variable for the global dataset is positively associated with the increased CO2 emissions. However, the negative sign of this variable related to OECD countries indicates the countries’ overall progress in combating the CO2 emission during the period of this study.
Ivanova [65] mentioned that the global GHG emissions amounted to 6.3 tCO2eq/cap in 2011; however, these are highly unequally distributed across income groups and countries.
For example, the average per capita carbon footprint of North America and Europe amounts to 13.4 and 7.5 tCO2eq/cap, respectively, while that of Africa and the Middle East amounts to 1.7 tCO2eq/cap on average (p. 2), which is confirmed by our study. One of the countries in North America is Canada, with high CO2 emissions compared with a European country such as the UK. One of the main goals of this study is to highlight shortcomings in Canada, despite the efforts to tackle the issues, by highlighting the lessons learned from the UK.
5. The Case of Canada and the United Kingdom
As mentioned above, OECD countries had overall success in tackling the issue of global warming in terms of CO2 emissions during the period of this study. However, the degree of success in combating the problems varies vastly in a country-level analysis. Therefore, one of the objectives of this study is to learn lessons from nations with similar economic, social, and political developments. For this purpose, we selected the case study of Canada and the United Kingdom based on the above metrics and other similarities such as oil production, which is a source of pollution despite some geospatial and climate differences (e.g., the size of countries, the weather, and natural resources). Also, both countries are part of the G7, G20, and OECD groups of economies. However, when it comes to environmental sustainability performances, they vary greatly.
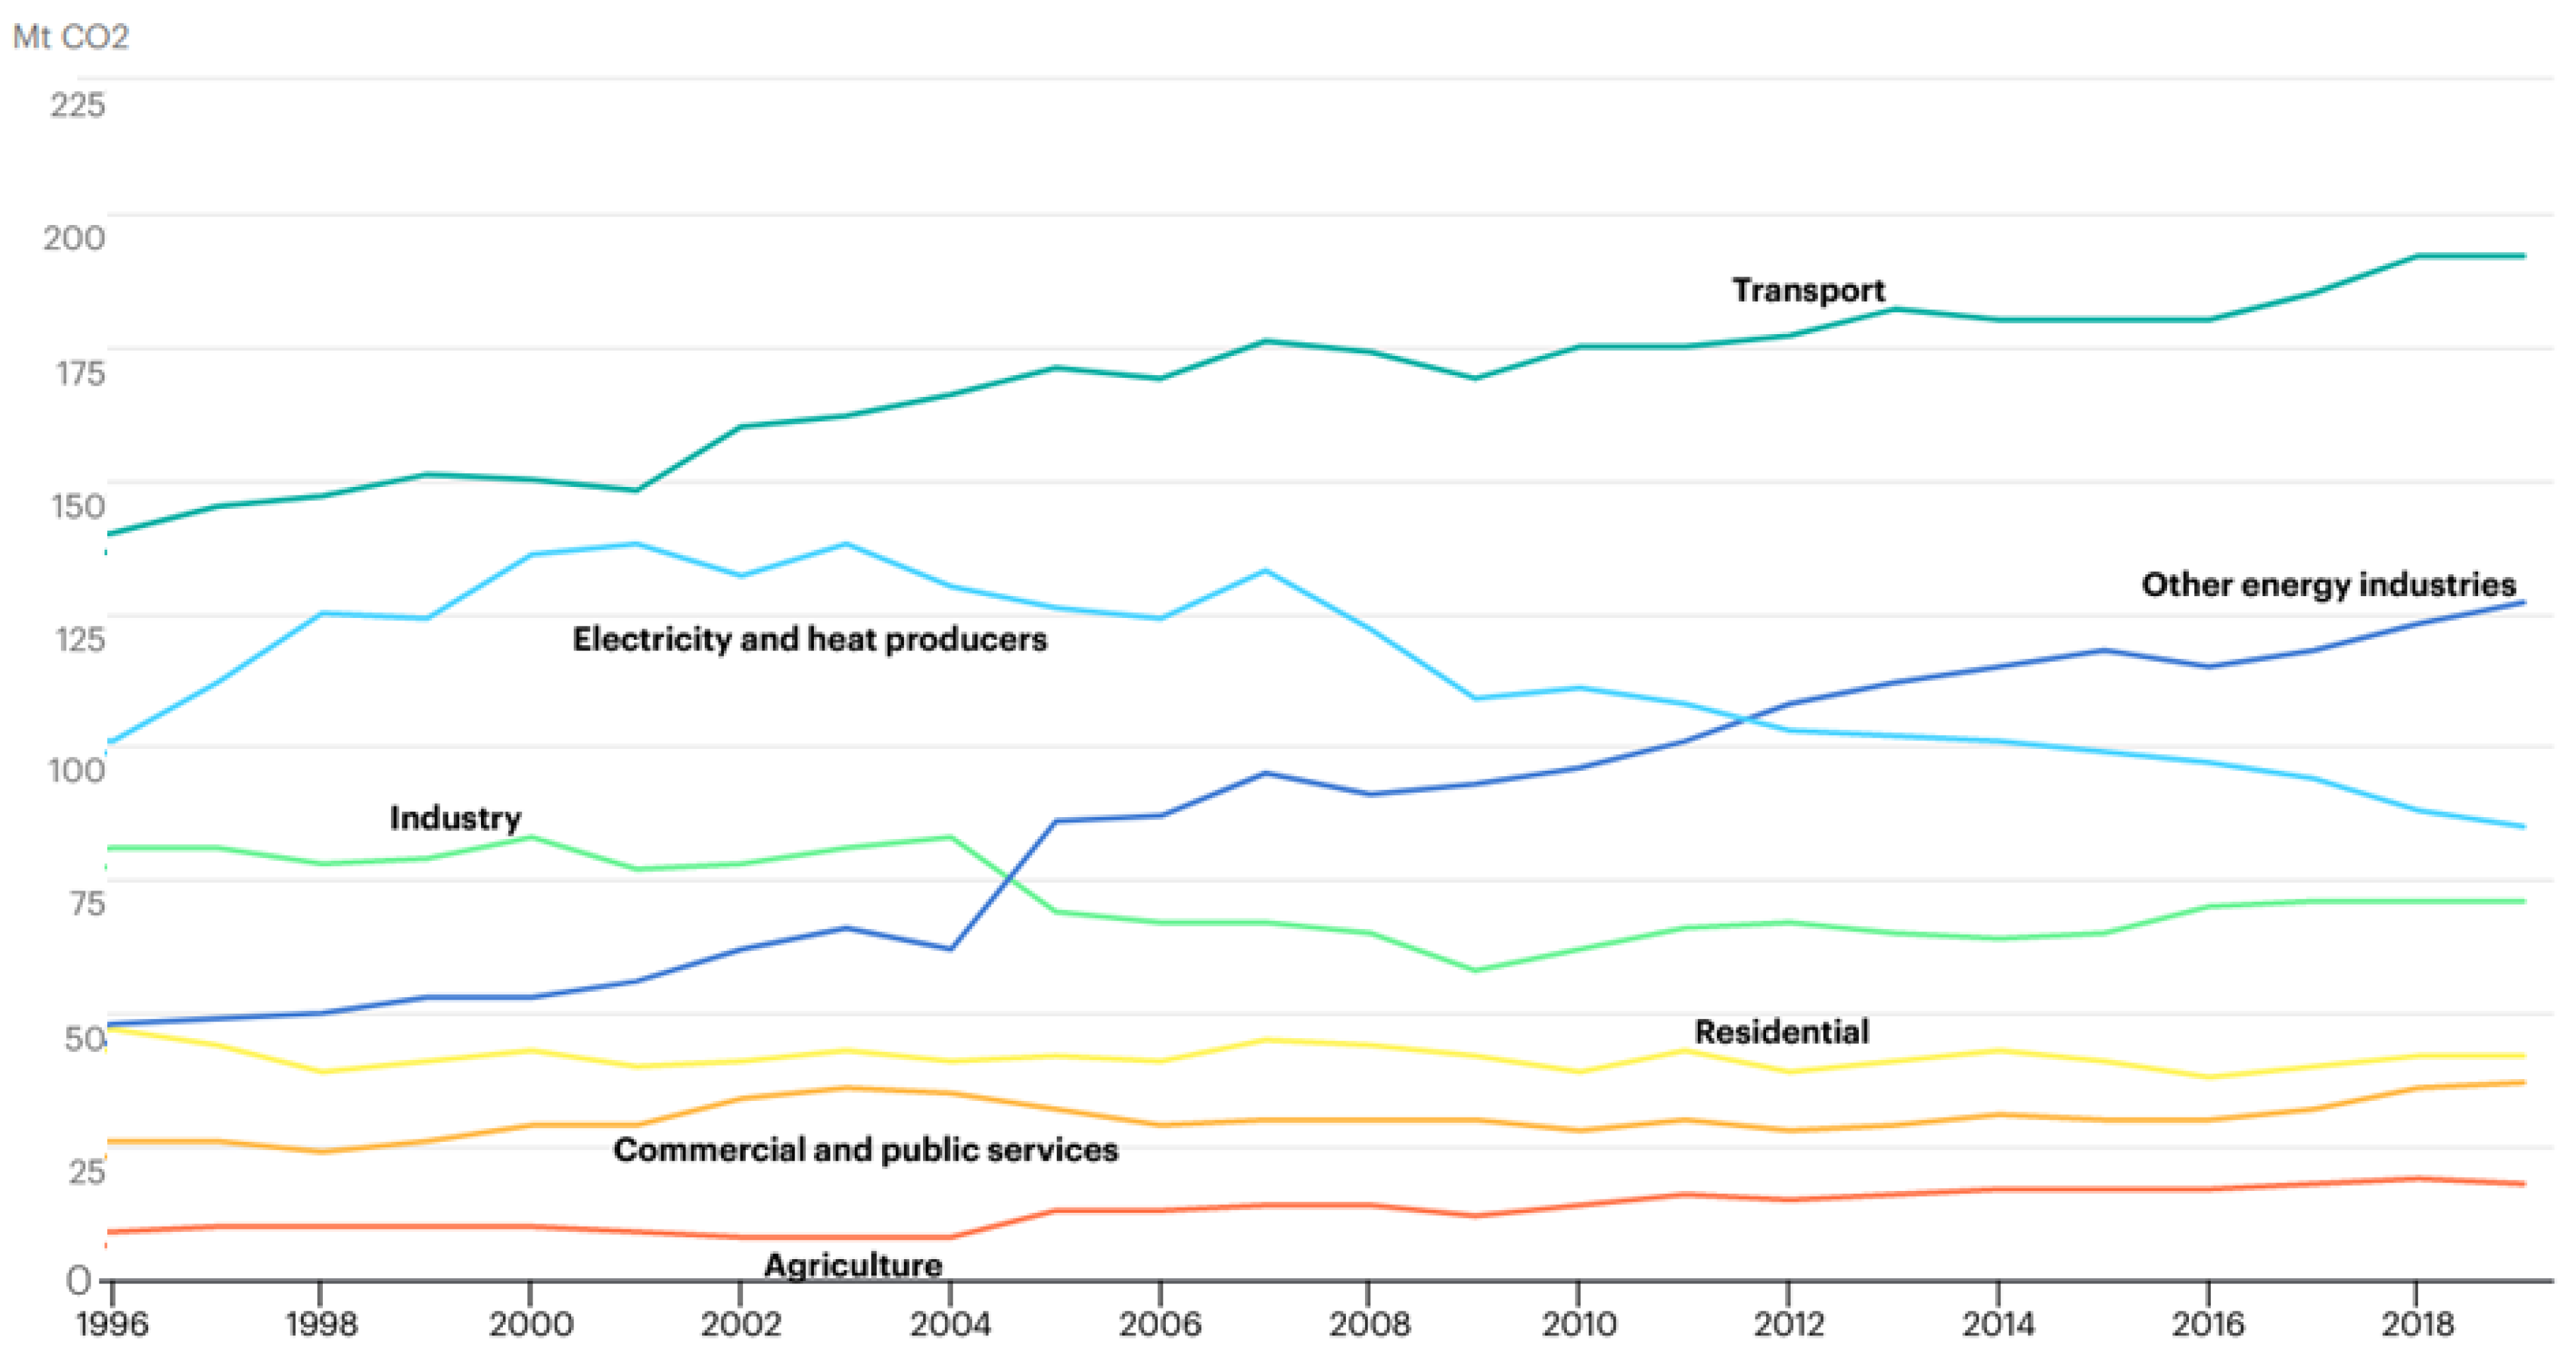
Table A4 in Appendix C shows the environmental performance progress of the top 20 countries of this study, in which the United Kingdom has been placed 4th and Canada at the 20th ranking position. Despite progress made in tackling CO2 emissions in Canada, particularly in electricity and heat production, industrial and residential emissions, the reduction in CO2 emissions was at a much slower pace than in the United Kingdom (see Table A5 and Table A6 in Appendix C). For example, we are witnessing increasing CO2 emissions in the transport and agriculture sectors. The CO2 outputs from agriculture have doubled from 1996 to 2019. Also, the CO2 emissions in the transport sector have increased from 140 megaton metrics (MTC) in 1996 to 192 MTC in 2019. In contrast, the United Kingdom’s scores for the same sectors show a noticeable decrease, particularly in the transport sector, by almost 36% for the same period. Effective deployment of ICT innovation can help revert Canada’s current state of environmental pollution.
As mentioned by many scholars and public reports, it is expected that ICT innovations, tools, and applications would contribute to sustainable agro-ecological farming and the four pillars of food security—availability, access, utilization, and stability [66] (p. 12). Also, as mentioned in the UNCC report [67], ICT applications can help increase agricultural crop yields by 30%, save over 300 trillion litres of water [67], lower environmental costs, monitor the soil quality, and provide effective pest control and fertilizer management, among others. Also, several scholars highlight the importance of managing chemicals in agricultural waste. For example, fertilizers are water-soluble. Therefore, they can leak into food surface runoff and eventually enter water bodies such as lakes and rivers, leading to severe ecological and human health impacts [68,69]. ICT innovation in agriculture or e-agriculture offers innovative methods for agriculture, from farming to food processing, quality management, and distribution [70].
In addition, it is expected that IoT networks and applications can improve many aspects of human lives, from sustainable smart cities to enhanced business processes, sustainable consumption, and production. For example, IoT can transform many existing industrial systems such as transportation, energy, and manufacturing methods, decrease energy use of households and companies, and reduce energy consumption [71]. In addition, IoT can be used to deploy, monitor, and measure the quality of air, airborne particles, or particulate matter (e.g., PM2.5 and PM10), the flow of traffic, and the application of e-vehicles [72,73]. For example, a recent United Kingdom government report indicates that petrol and diesel-engine vehicles emit many pollutants, including CO2, nitrogen oxides, and particulate matter (PM10 and PM2.5). However, the United Kingdom successfully implemented regulations and policies to tackle these increasing issues. For example, between 2015 and 2017, the United Kingdom decreased pollutants from road transport sources such as CO2 by 9.5%, nitrogen oxides (NOx, a source of acid rain), PM10 and PM 2.5 by 6.3% and 9.9%, respectively [74].
Another issue is related to environmental regulation and policies. One effective measure for reducing environmental pollution is carbon pricing tax systems. The system is expected to provide an economically efficient mechanism for emission reduction. According to OECD (2021), the pan-Canadian framework (PCF) carbon pricing system doubled from 38% in 2016 to 78% in 2020. Some weaknesses in the PFC carbon pricing framework remain. These include that provincial and territorial carbon pricing systems differ widely in emission coverage, effective carbon price, and cost burden on industry [75].
As a result of the PCF, several carbon pricing systems coexist in Canada, as shown in Table A2 (Appendix B). As of 2020, a carbon tax was in place in British Columbia and Northwest Territories, and a cap-and-trade method was applied in Nova Scotia and Quebec. The national backstop carbon pricing system was used, in whole or in part, in the other jurisdictions (see Table A2 and Table A3 in Appendix B). Stronger and more unified environmental regulations are needed if the mechanism is to conduct the necessary heavy lifting toward climate change goals [75].
Finally, the finding of this study has also confirmed an earlier study by Ivanova et al. [65] that one of the central issues of CO2 emissions, in general, and in Canada mainly, is related to the transport sector. As shown in Figure A1 (Appendix C) and mentioned above, ICT tools and services, from IoT devices to cloud computing and user interface software packages, can help drastically solve many issues associated with transportation along with more federal and provincial investments in public transportation.
6. Conclusions and Implications
According to [76], the number of web pages that cover topics and themes on sustainable development was estimated to be around 8,720,000 by 2005. Six years later, Bettencourt and Kaur [77] reported an increase of the number of web pages to be around 21,500,000 records. As of the writing of this paper (27 March 2022), a Google search on the topic returns 2,190,000,000 web documents covering topics relevant to the theme of sustainable development. Sustainable development, as a subject that emphasizes long-term processes that touch all levels of our society, focuses on continuous improvement of populations’ quality of life by putting human beings at the heart of concerns and decision-making processes. The significant growth in the number of web records since 2005 not only highlights the urgency and importance of the topic but also explains why it should be considered an urgent call for action by all.
Human-induced activities have exponentially increased GHG emissions worldwide. The United Nations General Assembly has introduced the 2030 Agenda and defined 17 SDGs as a shared blueprint for peace and prosperity for people and the planet. Combating climate change and its impact, represents goal 13 of this agenda.
For the purpose of the study, the authors have focused on CO2 as the main contributory gas that contributes to global warming. According to the literature, there are three main instruments to reduce carbon emissions, namely, command-and-control, cap-and-trade, and carbon tax. Among these three, the cap-and-trade and carbon tax have proved to be more effective mechanisms to reduce GHG and carbon emissions worldwide. However, the debate remains in its early stage. Regardless of the positions taken by researchers, a common barrier to the generalization of their findings is the recognition that jurisdictionally specific regulation can be a controlling factor.
Along with carbon abatement mechanisms, other factors also impact firms’ decisions to employ and invest in green technologies. As mentioned by [78], the process of authorization and the obligation to transmit information throughout the supply chain plays a vital role in ‘pushing’ eco-innovation, suggesting that policymakers should promote new ‘green knowledge’ to encourage eco-innovation (p. 1536).
This study examined the impact of the ICT, GDPP, Edu, PR, CL, resistance, education, political instability, and international protocols on CO2 emissions. The findings of the study support all eight proposed hypotheses, and, in particular, the results show that ICT (H1) has an inverse impact on CO2 emissions. Similar findings were found for the following variables and hypotheses: education (H5), political rights (H6), and civil liberties (H7). Furthermore, GDPP was found to have a statistically significant impact on the exponential increase in CO2 emissions (H2).
According to the literature, ICT can offer several innovative tools to save energy. A few examples are the emergence of 5G networks associated with big data analytics, AI, and machine learning that are expected to provide connections for massive IoT (mIoT), where billions of smart devices can be connected to the Internet [79]. They also offer several environmentally friendly applications, from monitoring the environment and animals to applications of e-agriculture, improved business processes, and manufacturing. In addition, ICT wireless sensors provide energy-saving applications such as smart grids, homes, buildings, and renewable energy integrated with sustainable smart city projects and the application of e-government, all of which can in part reduce the alarming level of CO2 emissions caused by human economic activities. Moreover, the level of educational attainment shows a negative and significant impact on CO2 emissions (H5). For instance, citizens who are more educated may be more environmentally conscious and demand eco-friendlier products and services [42,80,81,82,83,84,85].
The study also found that the international environmental agreements, or Conference of the Parties (H8) and environmental regulations (H3) have a statistically significant impact on global warming at p < 0.001 level (global data) and p < 0.05 level (OECD). Similarly, another important outcome of this study reveals how regional conflicts and wars positively impact the increasing growth of CO2 emissions, at a statistically significant p < 0.001 level. In addition, the time as a dummy variable shows a positive sign toward CO2 emission when it comes to global data. However, this impact is negatively associated with OECD countries indicating their progress toward reducing CO2 emissions. These impacts for both regions are statistically significant at p < 0.001 levels.
Narrowing down our study to two OECD nations, namely Canada and the United Kingdom, despite the similarity in socioeconomic and institutional democracy and the fact that both countries are classified as oil-producing regions, their performances and approaches toward environmental regulations and policies vary greatly. As discussed above, while the United Kingdom has successfully implemented environmental policies, the majority of Canadian provinces have recently adopted different carbon curbing mechanisms introduced under the Pan-Canadian Framework (PCF). This study offers recommendations to policymakers and government agencies dealing with environmental issues to take proper action to revert the current state to a more effective and tangible setting.
6.1. Theoretical Implications
This study is among the first studies incorporating a diverse set of variables to thoroughly investigate the complex issues of global warming by deploying a set of variables highlighted in the literature. The study started with a global outlook of the current state of CO2 emissions and highlighted the pressing increase in CO2 emissions worldwide over the period of the study. The study emphasized the fact that ICT can play a major role in enhancing environmental advancement and help tackle the issue of environmental sustainability. Therefore, to address this impact and the impact of other variables, the study narrowed its empirical investigation to developed nations clustered as OECD member countries. The ICT’s strong coefficient and the negative sign associated with the time (dummy variable) in relation to the OCED member countries showcase ICT’s strong impact in combating global warming and reducing CO2 emissions within the examined timeframe in OECD member countries—an implication that emerging countries should consider in their quest to tackle the issues. It is also among the first studies to incorporate regional conflicts and wars to measure violence and regional instability within environmental sustainability. Finally, the study examined the effect of wars and violence on the growth of CO2 emissions. According to the findings, wars and violence positively impact global warming through an increase in CO2 emissions—a result notable for conflicting regions worldwide.
6.2. Practical Implications
This study investigated the impacts of international environmental treaties (H8) and environmental regulations (H3) along with a comparative study investigating the efficiency of environmental policies between Canada and the United Kingdom. Lessons learned from the United Kingdom’s environmental regulations highlight the importance of tackling environmental issues through a unified, cross-national program supported by all political parties across the aisles to communicate a clear message [86]. This study also offers policymakers in developing and transitional economies to put more rigorous environmental monitoring and policies in place to conduct a current state assessment of their performance on sustainable development goals. Miola and Schiltz [86] mentioned that the lack of environmental monitoring and policies could be considered a major weakness of the existing methods to meet the 2030 Sustainable Development targets (Lee [86,87,88,89,90]). The debate remains in its early stage; nevertheless, it has policy significance for large emitting countries still considering the appropriate carbon-abatement programs.
Another important lesson to learn is related to sustainable economic growth. The study highlighted that integrating ICT in economic activities from agriculture and manufacturing to services provides a wide range of benefits. For example, deploying IoT associated with AI and cloud computing can save scarce natural resources and increase productivity, offering managers and policymakers the opportunity to integrate ICT in all aspects of production and services. For instance, ICT applications can help increase agricultural crop yields by 30%, saving over 300 trillion litres of water, and 25 billion barrels of oil a year, generating USD 11 trillion in economic benefits by 2030 [67].
7. Limitations and Future Research
The present study has several limitations. First, this research included educational attainment to measure the nation’s human capital. As Shirazi, Gholami, and Higón [91] mentioned, a central role is often assigned to accumulating human capital via either formal education or learning-by-doing. However, the latter was not included in our study. Future studies should also include informal education such as adult learning and workplace learning [92,93]. It is also important to explore new methods of learning, such as web-based learning [94] and collaborative learning [95,96] integrated with the application of e-government. As a collaborative platform, e-government applications can be utilized for engaging citizens, business, and NGOs concerning the environmental matters. The second limitation was related to the fact that we have focused on carbon emission as a footprint for measuring global warming; future studies should also include other measures such as the air quality (PM2.5, PM10) associated with IoT sensors [97,98]. Third, our comparative study was limited to Canada and the United Kingdom, many other examples of successful case studies can be used to highlight pits and falls of sustainable development on a regional basis [99,100]. Fourth, the study did not include social media content analysis and its effects on tackling global warming issues. ICT tools such as big data analytics and machine learning in Natural Language Processing (NLP) offer advanced mechanisms to explore social media content [101,102]. As a final point, future studies should also focus on regional violence, wars, and ecological conflict and their impacts on environmental pollution by integrating more measurement analyses such as pollution impacts on health of humans and other inhabitants and species [103,104,105,106].
Author Contributions
Formal analysis, S.S.-N.; Methodology, F.S. All authors have read and agreed to the published version of the manuscript.
Funding
This research received no external funding.
Institutional Review Board Statement
Not applicable.
Informed Consent Statement
Not applicable.
Data Availability Statement
Not applicable.
Conflicts of Interest
The authors declare no conflict of interest.
Appendix A
Table A1.
Top 20 ranked economic cost of political instability and violence among countries of the study.
Table A1.
Top 20 ranked economic cost of political instability and violence among countries of the study.
| Economic Cost of Violence Rank by % of GDP | Country | Economic Cost of Violence (Millions, 2019 PPP) | Per Capita Impact (2019, PPP) | Economic Cost of Violence (% of GDP) | Economic Cost of Violence (Millions, 2019 PPP) |
|---|---|---|---|---|---|
| 1 | Syria | 13,460.00 | 913.6 | 60% | 16,705.40 |
| 4 | Venezuela | 38,174.80 | 1289.70 | 48% | 41,760.90 |
| 6 | Central African Republic | 1574.50 | 401.3 | 38% | 1901.20 |
| 8 | Cyprus | 10,027.90 | 9499.30 | 31% | 11,295.50 |
| 10 | Sudan | 36,354.20 | 1375.70 | 24% | 57,107.60 |
| 11 | Colombia | 169,517.80 | 4355.70 | 23% | 215,451.20 |
| 12 | Yemen | 17,756.70 | 870 | 22% | 25,155.90 |
| 13 | Libya | 20,615.00 | 5396.40 | 22% | 34,920.00 |
| 16 | El Salvador | 9850.70 | 2066.50 | 18% | 13,249.60 |
| 17 | Mali | 6575.50 | 551.3 | 14% | 10,533.50 |
| 18 | Georgia | 5830.70 | 2011.70 | 14% | 7859.80 |
| 19 | Jamaica | 3853.70 | 1740.30 | 14% | 5044.60 |
| 20 | Lesotho | 954.7 | 549.9 | 14% | 1244.50 |
| 21 | Zimbabwe | 2364.10 | 210.8 | 13% | 3565.10 |
| 22 | South Africa | 99,977.00 | 2533.00 | 13% | 145,387.80 |
| 23 | Honduras | 6506.40 | 897.7 | 13% | 8453.50 |
| 24 | Mauritania | 2315.60 | 905.9 | 12% | 4113.00 |
| 25 | Oman | 22,846.70 | 9314.50 | 12% | 44,988.40 |
| 26 | Saudi Arabia | 212,186.90 | 12,415.00 | 11% | 416,578.60 |
| 27 | Ukraine | 50,420.60 | 1870.10 | 11% | 82,303.70 |
Source: IEP [64].
Appendix B
Table A2.
Carbon pricing systems across Canada.
| Provinces | Carbon Tax | Cap-and-Trade | Federal Fuel Charge | Technology Innovation and Emissions Reduction (TIER) | Output Based Pricing System (OBPS) | Date of Implementation | Code |
|---|---|---|---|---|---|---|---|
| Alberta | Yes | Yes | 1 January 2020 | A1 | |||
| British Columbia | Yes | 1 July 2008 | B1 | ||||
| Manitoba | Yes | Yes | 1 January 2019 | M1 | |||
| New Brunswick | Yes | 1 April 2020 | N1 | ||||
| Nova Scotia | Yes | 1 January 2019 | N2 | ||||
| Newfoundland and Labrador | Yes | Yes | 1 January 2019 | N3 | |||
| Northwest Territories | Yes | 1 September 2019 | N4 | ||||
| Nunavut | Yes | Yes | 1 January 2019 | N5 | |||
| Ontario | Yes | Yes | 4 July 2019 | O1 | |||
| Prince Edward Island | Yes | Yes | 1 April 2019 | P1 | |||
| Quebec | Yes | 1 January 2013 | Q1 | ||||
| Saskatchewan | Yes | Yes | 1 January 2019 | S1 | |||
| Yukon | Yes | Yes | 1 January 2019 | Y1 |
Table A3.
The code.
| Code | Authorizing Legislation |
|---|---|
| A1 | Emissions Management and Climate Resilience Act |
| B1 | The Carbon Tax Act (2008) |
| M1 | The Management and Reduction of Greenhouse Gases Act; The Management and Reduction of Greenhouse Gases (Standards and Compliance) Regulations; The Management and Reduction of Greenhouse Gases (Baselines, Returns and Verification) Standard; The Management and Reduction of Greenhouse Gases (Upstream Oil and Gas Aggregate Facility) Standard |
| N1 | Gasoline and Motive Fuel Tax Act; Climate Change Act and the proposed draft Reduction of Greenhouse Gas Emissions Regulation |
| N2 | Environment Act; Cap and Trade Program Regulations; Petroleum Products Pricing Regulations |
| N3 | Management of Greenhouse Gas Act (2017); Management of Greenhouse Gas Regulations (2018); Management of Greenhouse Gas Reporting Regulations (2017); Administrative Penalty Regulations (2017); Opted-In Facilities Regulations (2018); Revenue Administration Act (2009); Revenue Administration Regulations (2011) |
| N4 | Petroleum Products and Carbon Tax Act; Petroleum Products and Carbon Tax Regulations |
| N5 | The Management and Reduction of Greenhouse Gases Act; The Management and Reduction of Greenhouse Gases (Standards and Compliance) Regulations; The Management and Reduction of Greenhouse Gases (Baselines, Returns and Verification) Standard; The Management and Reduction of Greenhouse Gases (Upstream Oil and Gas Aggregate Facility) Standard |
| O1 | The Management and Reduction of Greenhouse Gases Act; The Management and Reduction of Greenhouse Gases (Standards and Compliance) Regulations; The Management and Reduction of Greenhouse Gases (Baselines, Returns and Verification) Standard; The Management and Reduction of Greenhouse Gases (Upstream Oil and Gas Aggregate Facility) Standard; Ontario’s Environmental Protection Act |
| P1 | Climate Leadership Act |
| Q1 | An Act to amend the Environment Quality Act and other legislative provisions in relation to climate change; regulation respecting a cap-and-trade system for greenhouse gas emission allowances |
| S1 | The Management and Reduction of Greenhouse Gases Act; The Management and Reduction of Greenhouse Gases (Standards and Compliance) Regulations; The Management and Reduction of Greenhouse Gases (Baselines, Returns and Verification) Standard; The Management and Reduction of Greenhouse Gases (Upstream Oil and Gas Aggregate Facility) Standard |
| Y1 | The Management and Reduction of Greenhouse Gases Act; The Management and Reduction of Greenhouse Gases (Standards and Compliance) Regulations; The Management and Reduction of Greenhouse Gases (Baselines, Returns and Verification) Standard; The Management and Reduction of Greenhouse Gases (Upstream Oil and Gas Aggregate Facility) Standard |
Source: Environment and Climate Change Canada [107].
Appendix C
Table A4.
The 2020 Environmental Performance Index rank.
| Rank | Country | Score |
|---|---|---|
| 1 | Denmark | 82.5 |
| 2 | Luxembourg | 82.3 |
| 3 | Switzerland | 81.5 |
| 4 | United Kingdom | 81.3 |
| 5 | France | 80.0 |
| 6 | Austria | 79.6 |
| 7 | Finland | 78.9 |
| 8 | Sweden | 78.7 |
| 9 | Norway | 77.7 |
| 10 | Germany | 77.2 |
| 11 | Netherlands | 75.3 |
| 12 | Japan | 75.1 |
| 13 | Australia | 74.9 |
| 14 | Spain | 74.3 |
| 15 | Belgium | 73.3 |
| 16 | Ireland | 72.8 |
| 17 | Iceland | 72.3 |
| 18 | Slovenia | 72.0 |
| 19 | New Zealand | 71.3 |
| 20 | Canada | 71.0 |
Source: EPI [32].
Table A5.
Canada’s CO2 emissions (mega ton metrics) by sectors.
| Year | Electricity and Heat Producers | Other Energy Industries | Industry | Transport | Residential | Commercial and Public Services | Agriculture |
|---|---|---|---|---|---|---|---|
| 1996 | 101 | 81 | 81 | 140 | 47 | 26 | 9 |
| 2000 | 136 | 53 | 83 | 150 | 43 | 29 | 10 |
| 2005 | 126 | 86 | 69 | 171 | 42 | 32 | 13 |
| 2010 | 111 | 96 | 62 | 175 | 39 | 28 | 14 |
| 2015 | 99 | 118 | 65 | 180 | 41 | 30 | 17 |
| 2019 | 85 | 127 | 71 | 192 | 42 | 37 | 18 |
Source: IEA [108].
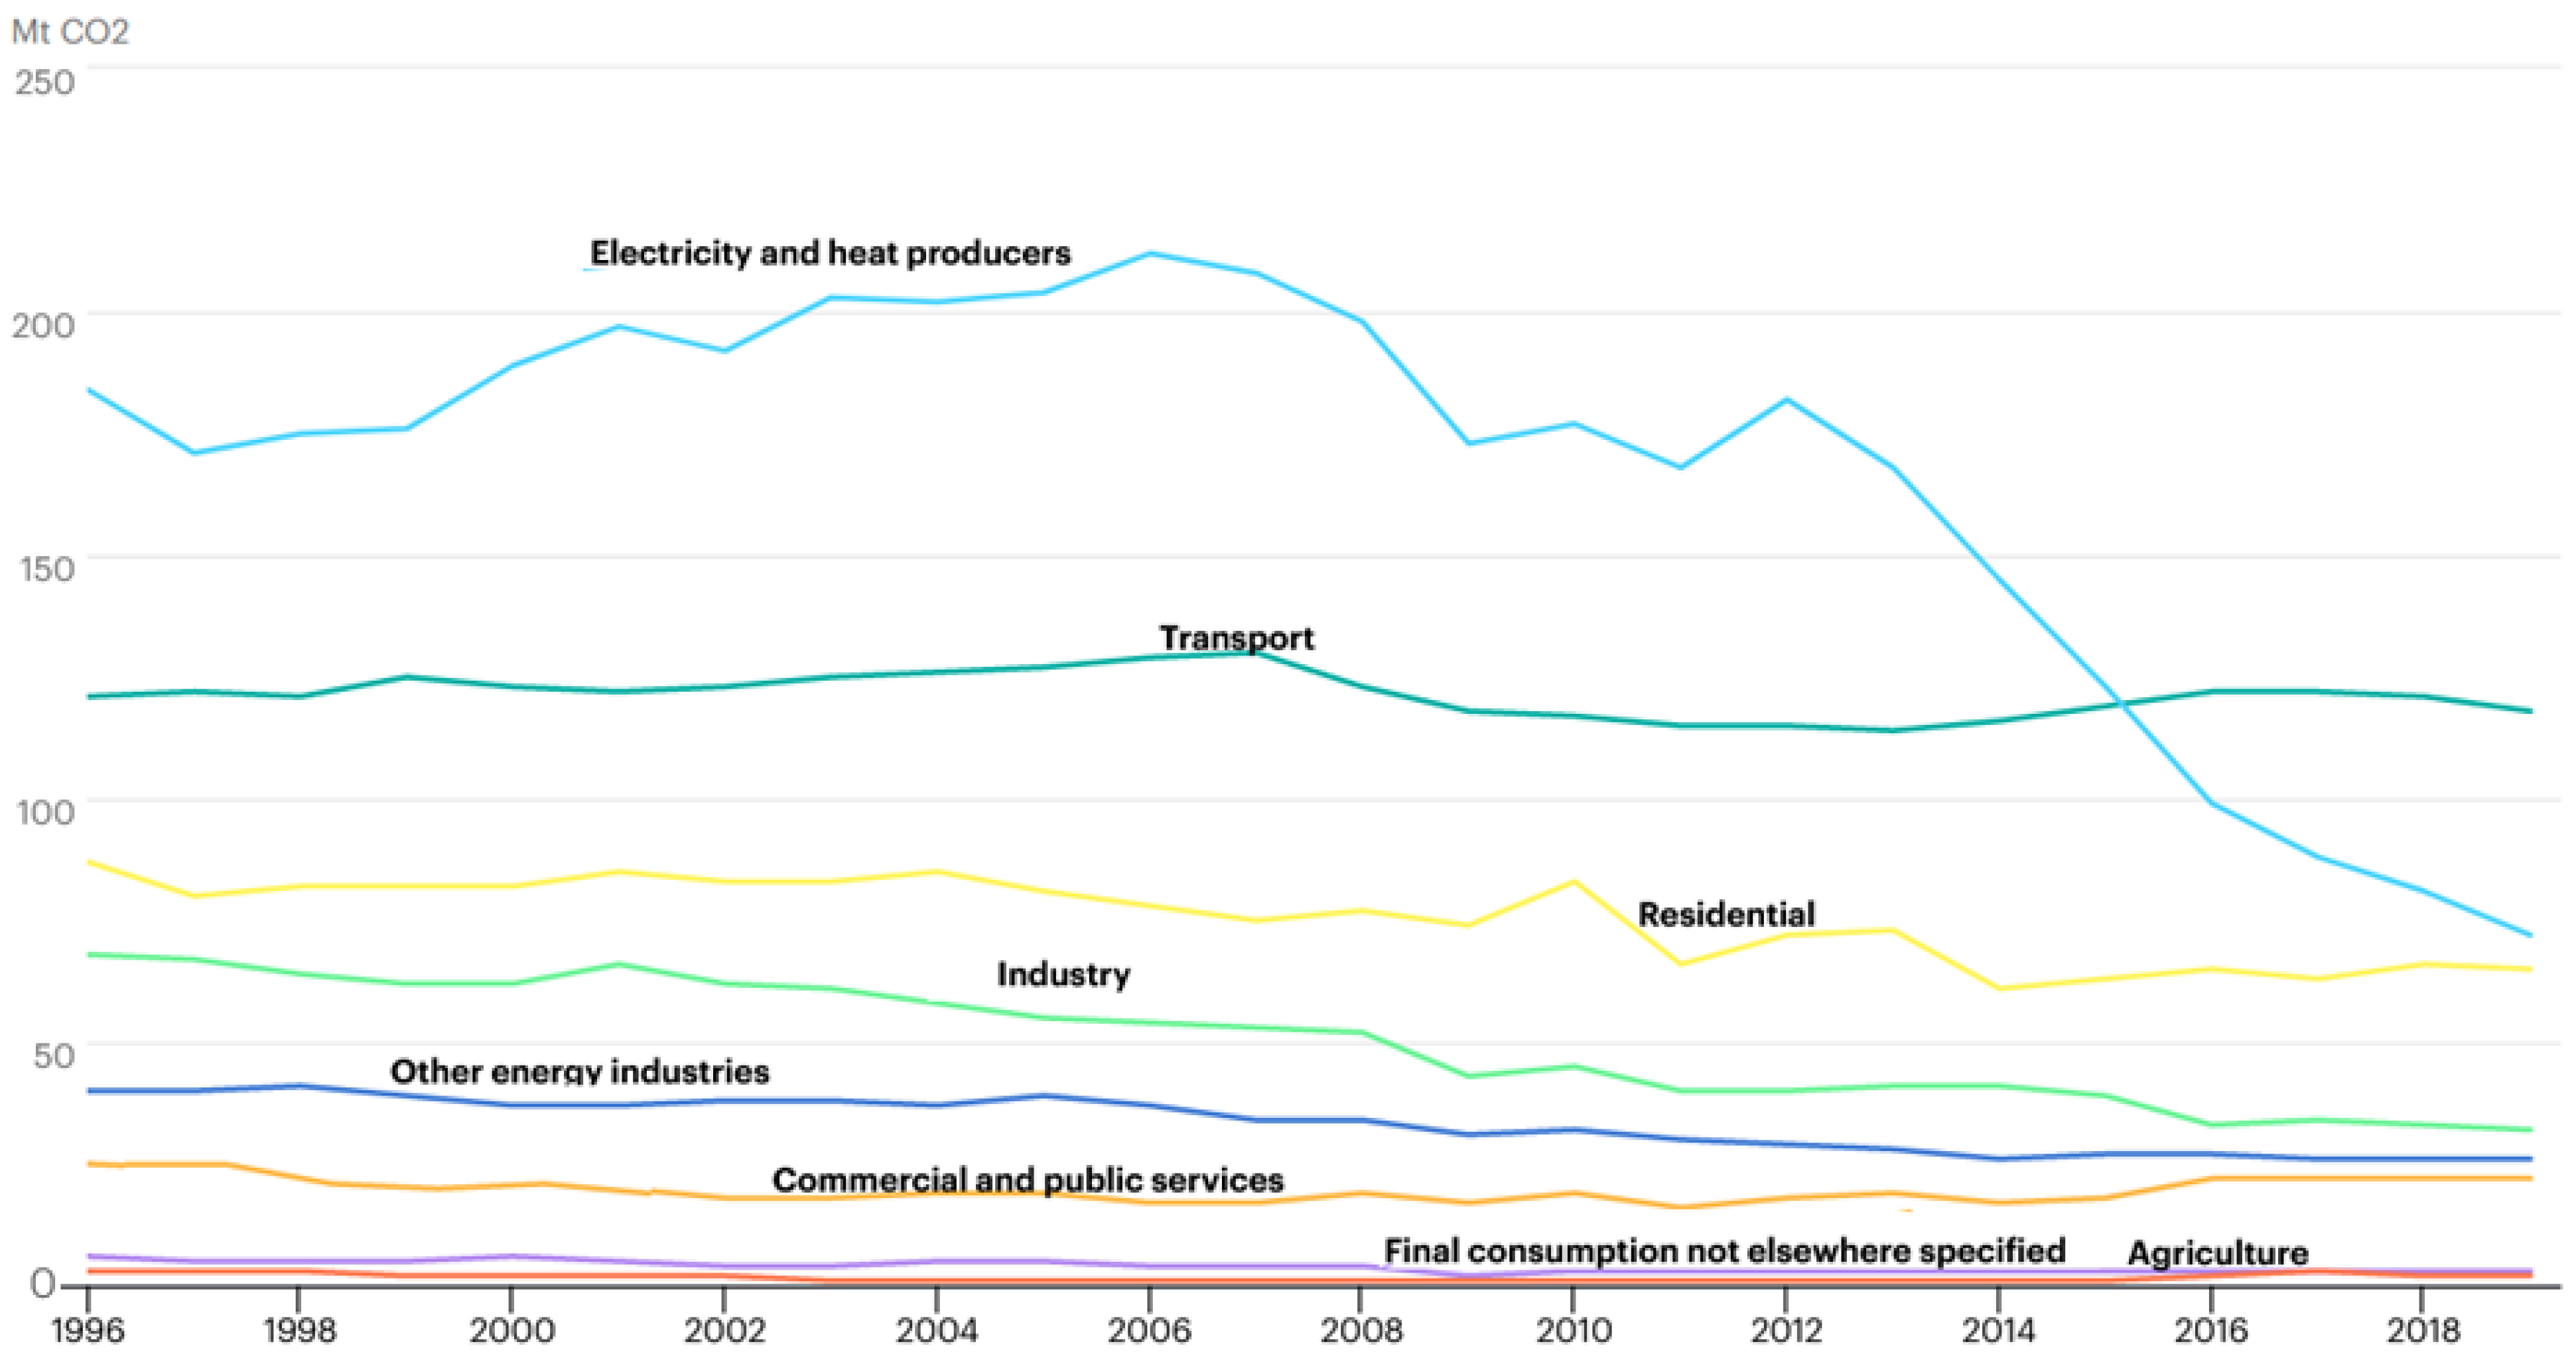
Figure A1.
Canada’s CO2 emission by sector 1996–2019. Notes: CO2 Emissions from fuel combustion only. Source: IEA [108].
Figure A1.
Canada’s CO2 emission by sector 1996–2019. Notes: CO2 Emissions from fuel combustion only. Source: IEA [108].

Table A6.
The United Kingdom’s CO2 emissions (mega ton metrics) by sectors.
| Year | Electricity and Heat Producers | Other Energy Industries | Industry | Transport | Residential | Commercial and Public Services | Agriculture | Final Consumption Not Elsewhere Specified |
|---|---|---|---|---|---|---|---|---|
| 1996 | 184 | 40 | 68 | 184 | 87 | 25 | 3 | 8 |
| 2000 | 189 | 37 | 62 | 123 | 82 | 19 | 2 | 6 |
| 2005 | 204 | 39 | 55 | 127 | 81 | 19 | 1 | 5 |
| 2010 | 177 | 32 | 45 | 117 | 83 | 19 | 1 | 3 |
| 2015 | 123 | 27 | 39 | 119 | 63 | 18 | 1 | 3 |
| 2019 | 72 | 26 | 32 | 118 | 65 | 22 | 2 | 3 |
Source: IEA [108].
Figure A2.
The United Kingdom’s CO2 emission by sector 1996–2019. Notes: CO2 Emissions from fuel combustion only. Source: IEA [108].
Figure A2.
The United Kingdom’s CO2 emission by sector 1996–2019. Notes: CO2 Emissions from fuel combustion only. Source: IEA [108].

References
- United Nations. Transforming Our World: The 2030 Agenda for Sustainable Development. 2015, pp. 1–42. Available online: https://sustainabledevelopment.un.org/content/documents/21252030 Agenda for Sustainable Development web.pdf (accessed on 12 February 2019).
- United Nations Global Compact. 17 Goals to Transform Our World. 2018. Available online: https://www.unglobalcompact.org/sdgs/17-global-goals (accessed on 12 February 2019).
- Bocken, N.M.; Short, S.W.; Rana, P.; Evans, S. A literature and practice review to develop sustainable business model archetypes. J. Clean. Prod. 2014, 65, 42–56. [Google Scholar] [CrossRef] [Green Version]
- Boons, F.; Lüdeke-Freund, F. Business models for sustainable innovation: State-of-the-art and steps towards a research agenda. J. Clean. Prod. 2013, 45, 9–19. [Google Scholar] [CrossRef]
- Morioka, S.N.; Bolis, I.; Evans, S.; Carvalho, M.M. Transforming sustainability challenges into competitive advantage: Multiple case studies kaleidoscope converging into sustainable business models. J. Clean. Prod. 2017, 167, 723–738. [Google Scholar] [CrossRef]
- Melville, N.P. Information systems innovation for environmental sustainability. MISQ 2010, 34, 1–21. [Google Scholar] [CrossRef]
- Xu, X.; Xu, X.; He, P. Joint production and pricing decisions for multiple products with cap-and-trade and carbon tax regulations. J. Clean. Prod. 2016, 112, 4093–4106. [Google Scholar] [CrossRef]
- Wei, Y.M.; Mi, Z.F.; Huang, Z. Climate policy modeling: An online SCI-E and SSCI based literature review. Omega 2015, 57, 70–84. [Google Scholar] [CrossRef] [Green Version]
- Nordhaus, W.D. After Kyoto: Alternative mechanisms to control global warming. Am. Econ. Rev. 2006, 96, 31–34. [Google Scholar] [CrossRef]
- Carl, J.; Fedor, D. Tracking global carbon revenues: A survey of carbon taxes versus cap-and-trade in the real world. Energy Policy 2016, 96, 50–77. [Google Scholar] [CrossRef] [Green Version]
- Weitzman, M.L. Voting on prices vs. voting on quantities in a World Climate Assembly. Res. Econ. 2017, 71, 199–211. [Google Scholar] [CrossRef] [Green Version]
- Horbach, J.; Rammer, C.; Rennings, K. Determinants of eco-innovations by type of environmental impact—The role of regulatory push/pull, technology push and market pull. Ecol. Econ. 2012, 78, 112–122. [Google Scholar] [CrossRef] [Green Version]
- Higón, D.A.; Gholami, R.; Shirazi, F. ICT and environmental sustainability: A global perspective. Telemat. Inform. 2017, 34, 85–95. [Google Scholar] [CrossRef]
- Brundtland, G.H. Our common future—Call for action. Environ. Conserv. 1987, 14, 291–294. [Google Scholar] [CrossRef]
- Porter, M.E.; Kramer, M.R. The link between competitive advantage and corporate social responsibility. Harv. Bus. Rev. 2006, 84, 78–92. [Google Scholar] [PubMed]
- Ollo-Lopez, A.; Aramendía-Muneta, M.E. ICT impact on competitiveness, innovation and environment. Telemat. Inform. 2012, 29, 204–210. [Google Scholar] [CrossRef]
- GeSI. SMART 2020. Enabling the Low Carbon Economy in the Information Age. 2008. Available online: http://gesi.org/files/Reports/Smart%202020%20report%20in%20English.pdf (accessed on 22 January 2021).
- Erumban, A.A.; Das, D.K. Information and communication technology and economic growth in India. Telecommun. Policy 2016, 40, 412–431. [Google Scholar] [CrossRef]
- Misuraca, G.; Viscusi, G. Shaping public sector innovation theory: An interpretative framework for ICT-enabled governance innovation. Electron. Commer. Res. 2015, 15, 303–322. [Google Scholar] [CrossRef]
- Shirazi, F.; Hajli, N. IT-Enabled Sustainable Innovation and the Global Digital Divides. Sustainability 2021, 13, 9711. [Google Scholar] [CrossRef]
- Gazzola, P.; Del Campo, A.G.; Onyango, V. Going green vs going smart for sustainable development: Quo vadis? J. Clean. Prod. 2019, 214, 881–892. [Google Scholar] [CrossRef] [Green Version]
- Lu, W.C. The impacts of information and communication technology, energy consumption, financial development, and economic growth on carbon dioxide emissions in 12 Asian countries. Mitig. Adapt. Strateg. Glob. Change 2018, 23, 1351–1365. [Google Scholar] [CrossRef]
- Toader, E.; Firtescu, B.N.; Roman, A.; Anton, S.G. Impact of information and communication technology infrastructure on economic growth: An empirical assessment for the EU countries. Sustainability 2018, 10, 3750. [Google Scholar] [CrossRef] [Green Version]
- Elkington, J.; Rowlands, I.H. Cannibals with forks: The triple bottom line of 21st century business. Altern. J. 1999, 25, 42. [Google Scholar]
- Majumdar, S.K.; Marcus, A.A. Rules versus discretion: The productivity consequences of flexible regulation. Acad. Manag. J. 2001, 44, 170–179. [Google Scholar]
- Zhang, Y.J.; Wei, Y.M. An overview of current research on EU ETS: Evidence from its operating mechanism and economic effect. Appl. Energy 2010, 87, 1804–1814. [Google Scholar] [CrossRef]
- Kleindorfer, P.R.; Singhal, K.; Van Wassenhove, L.N. Sustainable operations management. Prod. Oper. Manag. 2005, 14, 482–492. [Google Scholar] [CrossRef]
- Sarkis, J.; Zhu, Q.; Lai, K.H. An organizational theoretic review of green supply chain management literature. Int. J. Prod. Econ. 2011, 130, 1–15. [Google Scholar] [CrossRef]
- Kassinis, G.I.; Soteriou, A.C. Greening the service profit chain: The impact of environmental management practices. Prod. Oper. Manag. 2003, 12, 386–403. [Google Scholar] [CrossRef] [Green Version]
- Cherrier, H.; Black, I.R.; Lee, M. Intentional non-consumption for sustainability: Consumer resistance and/or anti-consumption? Eur. J. Mark. 2011, 45, 1757–1767. [Google Scholar] [CrossRef] [Green Version]
- Stevens, C. Linking sustainable consumption and production: The government role. In Natural Resources Forum; Blackwell Publishing Ltd.: Oxford, UK, 2010; Volume 34, pp. 16–23. [Google Scholar]
- EPI. Environmental Performance Index 2020 Global Metrics for the Environment: Ranking Country Performance on Sustainability Issues, New Haven, CT: Yale Center for Environmental Law & Policy. 2020. Available online: Epi.yale.edu (accessed on 21 May 2020).
- Chen, C. Design for the environment: A quality-based model for green product development. Manag. Sci. 2001, 47, 250–263. [Google Scholar] [CrossRef]
- Bansal, S.; Gangopadhyay, S. Tax/subsidy policies in the presence of environmentally aware consumers. J. Environ. Econ. Manag. 2003, 45, 333–355. [Google Scholar] [CrossRef]
- Ford, J.A.; Steen, J.; Verreynne, M.L. How environmental regulations affect innovation in the Australian oil and gas industry: Going beyond the Porter Hypothesis. J. Clean. Prod. 2014, 84, 204–213. [Google Scholar] [CrossRef] [Green Version]
- Lei, P.; Tian, X.; Huang, Q.; He, D. Firm size, government capacity, and regional environmental regulation: Theoretical analysis and empirical evidence from China. J. Clean. Prod. 2017, 164, 524–533. [Google Scholar] [CrossRef]
- Das, G.G.; Alavalapati, J.R.; Carter, D.R.; Tsigas, M.E. Regional impacts of environmental regulations and technical change in the US forestry sector: A multiregional CGE analysis. For. Policy Econ. 2005, 7, 25–38. [Google Scholar] [CrossRef]
- GPI. Measuring Peace in a Complex World. 2021. Available online: https://www.visionofhumanity.org/wp-content/uploads/2020/10/GPI_2020_web.pdf (accessed on 17 December 2021).
- GPI. Measuring Peace, Its Causes and Its Economic Value. 2015. Available online: https://www.economicsandpeace.org/wp-content/uploads/2015/06/Global-Peace-Index-Report-2015_0.pdf (accessed on 8 June 2020).
- Vare, P.; Scott, W. Learning for a change: Exploring the relationship between education and sustainable development. J. Educ. Sustain. Dev. 2007, 1, 191–198. [Google Scholar] [CrossRef]
- McKeown, R.; Hopkins, C.A.; Rizi, R.; Chrystalbridge, M. Education for Sustainable Development Toolkit; Energy, Environment and Resources Center, University of Tennessee: Knoxville, TN, USA, 2002; p. 2002. [Google Scholar]
- UNESCO. Issues and Trends in Education for Sustainable Development; UNESCO: Paris, France, 2018. [Google Scholar]
- Rieckmann, M. Learning to transform the world: Key competencies in Education for Sustainable Development. Issues Trends Educ. Sustain. Dev. 2018, 39, 39–59. [Google Scholar]
- De Marchi, V. Environmental innovation and R&D cooperation: Empirical evidence from Spanish manufacturing firms. Res. Policy 2012, 41, 614–623. [Google Scholar]
- Park, H.; Russell, C.; Lee, J. National culture and environmental sustainability: A cross-national analysis. J. Econ. Financ. 2007, 31, 104–121. [Google Scholar] [CrossRef]
- Shirazi, F.; Ngwenyama, O.; Morawczynski, O. ICT expansion and the digital divide in democratic freedoms: An analysis of the impact of ICT expansion, education and ICT filtering on democracy. Telemat. Inform. 2010, 27, 21–31. [Google Scholar] [CrossRef]
- Freedom House. Global Freedom Scores. 2020. Available online: https://freedomhouse.org/countries/freedom-world/scores (accessed on 10 October 2020).
- Oates, B.J. The potential contribution of ICTs to the political process. Electron. J. E-Gov. 2003, 1, 31–39. [Google Scholar]
- Bodansky, D. The Paris climate change agreement: A new hope? Am. J. Int. Law 2016, 110, 288–319. [Google Scholar] [CrossRef] [Green Version]
- Bodansky, D. The Copenhagen climate change conference: A postmortem. Am. J. Int. Law 2010, 104, 230–240. [Google Scholar] [CrossRef] [Green Version]
- Bodansky, D. The Durban platform negotiations: Goals and options. In Harvard Project on Climate Agreements Viewpoint; 2012; Available online: https://papers.ssrn.com/sol3/papers.cfm?abstract_id=2102994 (accessed on 10 October 2021).
- Harvey, F. Paris Climate Change Agreement: The World’s Greatest Diplomatic Success. The Guardian, 14 December 2015. [Google Scholar]
- Warrick, J.; Mooney, C. 196 Countries Approve Historic Climate Agreement. The Washington Post, 12 December 2015; 12. [Google Scholar]
- Johnston, J. Econometric Methods; McGraw-Hill: New York, NY, USA, 1972; pp. 214–221. [Google Scholar]
- Asteriou, D.; Hall, S.G. Applied Econometrics; Macmillan International Higher Education: London, UK, 2015. [Google Scholar]
- Ginker, T.; Lieberman, O. Robustness of binary choice models to conditional heteroscedasticity. Econ. Lett. 2017, 150, 130–134. [Google Scholar] [CrossRef]
- EDGAR. Emission Database for Global Atmospheric Research. 2021. Available online: https://edgar.jrc.ec.europa.eu/ (accessed on 11 November 2021).
- Teorell, J.; Aksel Sundström, A.; Holmberg, S.; Rothstein, B.; Pachon, N.A.; Dalli, C.M. The Quality of Government Standard Dataset, Version Jan21; The Quality of Government Institute, University of Gothenburg: Gothenburg, Sweden, 2021. [Google Scholar]
- World Bank. World Development Indicators. 2020. Available online: https://databank.worldbank.org/home.aspx (accessed on 24 June 2020).
- ITU. International Telecommunication Union, World Telecommunication/ICT Indicators Database 2021, 25th ed.; ITU Publication: Geneva, Switzerland, 2021. [Google Scholar]
- UNESCO. The United Nations Educational, Scientific and Cultural Organization) Institute for Statistics. Data Centre. 2020. Available online: http://data.uis.unesco.org (accessed on 17 July 2020).
- WGI. World Governance Indicators. 2020. Available online: https://info.worldbank.org/governance/wgi/ (accessed on 18 July 2020).
- CPIA. The World Bank’s Country Policy and Institutional Assessment Database. 2020. Available online: https://data.worldbank.org/indicator/IQ.CPA.PROP.XQ (accessed on 24 August 2020).
- Institute for Economics & Peace (IEP). Global Peace Index 2020: Measuring Peace in a Complex World, Sydney, June 2020. Available online: http://visionofhumanity.org/reports (accessed on 19 February 2021).
- Ivanova, D.; Barrett, J.; Wiedenhofer, D.; Macura, B.; Callaghan, M.; Creutzig, F. Quantifying the potential for climate change mitigation of consumption options. Environ. Res. Lett. 2020, 15, 093001. [Google Scholar] [CrossRef]
- Flammini, A.; Puri, M.; Pluschke, L.; Dubois, O. Walking the Nexus Talk: Assessing the Water-Energy-Food Nexus in the Context of the Sustainable Energy for All Initiative; FAO Publishing: Rome, Italy, 2014. [Google Scholar]
- UNCC. ICT Sector Helping to Tackle Climate Change. 2016. Available online: https://unfccc.int/news/ict-sector-helping-to-tackle-climate-change (accessed on 18 May 2020).
- Karunanidhi, D.; Aravinthasamy, P.; Subramani, T.; Kumar, D.; Venkatesan, G. Chromium contamination in groundwater and Sobol sensitivity model based human health risk evaluation from leather tanning industrial region of South India. Environ. Res. 2021, 199, 111238. [Google Scholar] [CrossRef]
- Ramírez-García, R.; Gohil, N.; Singh, V. Recent advances, challenges, and opportunities in bioremediation of hazardous materials. In Phytomanagement of Polluted Sites; Elsevier: Amsterdam, The Netherlands, 2019; pp. 517–568. [Google Scholar]
- Mahant, M.; Shukla, A.; Dixit, S.; Patel, D. Uses of ICT in Agriculture. Int. J. Adv. Comput. Res. 2012, 2, 46. [Google Scholar]
- Janssen, M.; Luthra, S.; Mangla, S.; Rana, N.P.; Dwivedi, Y.K. Challenges for adopting and implementing IoT in smart cities: An integrated MICMAC-ISM approach. Internet Res. 2019, 29, 1589–1616. [Google Scholar] [CrossRef] [Green Version]
- Kapustin, A.; Rakov, V. Results of assessing CO2 emissions from e-vehicles in case of their possible switching to electricity. Transp. Res. Procedia 2018, 36, 266–273. [Google Scholar] [CrossRef]
- Campisi, T.; Ticali, D.; Ignaccolo, M.; Tesoriere, G.; Inturri, G.; Torrisi, V. Factors influencing the implementation and deployment of e-vehicles in small cities: A preliminary two-dimensional statistical study on user acceptance. Transp. Res. Procedia 2022, 62, 333–340. [Google Scholar] [CrossRef]
- The UK Report. Voluntary National Review of Progress towards the Sustainable Development Goals: United Kingdom of Great Britain and Northern Ireland. 2019. Available online: https://sustainabledevelopment.un.org/content/documents/23678UK_12072019_UK_Voluntary_National_Review_2019.pdf (accessed on 17 January 2021).
- OECD. The pan-Canadian Framework for Carbon Pricing. 2021. Available online: https://www.oecd.org/climate-action/ipac/practices/the-pan-canadian-framework-for-carbon-pricing-a2f5b6a1/ (accessed on 16 October 2021).
- Robert, K.W.; Parris, T.M.; Leiserowitz, A.A. What is sustainable development? Goals, indicators, values, and practice. Environ. Sci. Policy Sustain. Dev. 2005, 47, 8–21. [Google Scholar] [CrossRef]
- Bettencourt, L.M.; Kaur, J. Evolution and structure of sustainability science. Proc. Natl. Acad. Sci. USA 2011, 108, 19540–19545. [Google Scholar] [CrossRef] [PubMed] [Green Version]
- Arfaoui, N. Eco-innovation and regulatory push/pull effect in the case of REACH regulation: Empirical evidence based on survey data. Appl. Econ. 2018, 50, 1536–1554. [Google Scholar] [CrossRef]
- Li, S.; Xu, D.L.; Zhao, S. 5G internet of things: A survey. J. Ind. Inf. Integr. 2018, 10, 1–9. [Google Scholar] [CrossRef]
- Lim, E.; Arita, S.; Joung, S. Advancing Sustainable Consumption in Korea and Japan- From Re-Orientation of Consumer Behavior to Civic Actions. Sustainability 2019, 11, 6683. [Google Scholar] [CrossRef] [Green Version]
- Chen, F.Y.; Hsu, P.Y.; Lin, T.W. Air Travelers’ environmental consciousness: A preliminary investigation in Taiwan. Int. J. Bus. Manag. 2011, 6, 78. [Google Scholar] [CrossRef] [Green Version]
- Nijaki, L.K.; Worrel, G. Procurement for sustainable local economic development. Int. J. Public Sect. Manag. 2012, 25, 133–153. [Google Scholar] [CrossRef] [Green Version]
- Weisz, M. Connection between sources of information and motivation for environmental awareness. Reg. Bus. Stud. 2017, 9, 19–31. [Google Scholar]
- Nam, S.J. Moderating effects of consumer empowerment on the relationship between involvement in eco-friendly food and eco-friendly food behaviour. Int. J. Consum. Stud. 2020, 44, 297–305. [Google Scholar] [CrossRef]
- Shahsavar, T.; Kubeš, V.; Baran, D. Willingness to pay for eco-friendly furniture based on demographic factors. J. Clean. Prod. 2020, 250, 119466. [Google Scholar] [CrossRef]
- Miola, A.; Schiltz, F. Measuring sustainable development goals performance: How to monitor policy action in the 2030 Agenda implementation? Ecol. Econ. 2019, 164, 106373. [Google Scholar] [CrossRef]
- Lee, B.X.; Kjaerulf, F.; Turner, S.; Cohen, L.; Donnelly, P.D.; Muggah, R.; Davis, R.; Realini, A.; Kieselbach, B.; MacGregor, L.S.; et al. Transforming our world: Implementing the 2030 agenda through sustainable development goal indicators. J. Public Health Policy 2016, 37, 13–31. [Google Scholar] [CrossRef] [PubMed]
- Adenle, A.A. Assessment of solar energy technologies in Africa-opportunities and challenges in meeting the 2030 agenda and sustainable development goals. Energy Policy 2020, 137, 111180. [Google Scholar] [CrossRef]
- Weiland, S.; Hickmann, T.; Lederer, M.; Marquardt, J.; Schwindenhammer, S. The 2030 Agenda for Sustainable Development: Transformative Change through the Sustainable Development Goals? Politics Gov. 2021, 9, 90–95. [Google Scholar] [CrossRef]
- Guo, F.; Duan, Y.; He, S.; Gong, Q.; Yao, Z. Analysis of Sustainable Development Questions of College Entrance Examination Geography Papers in China: 2010–2020. Sustainability 2022, 14, 1526. [Google Scholar] [CrossRef]
- Shirazi, F.; Gholami, R.; Higón, D.A. The impact of information and communication technology (ICT), education and regulation on economic freedom in Islamic Middle Eastern countries. Inf. Manag. 2009, 46, 426–433. [Google Scholar] [CrossRef]
- Hoekstra, A.; Korthagen, F.; Brekelmans, M.; Beijaard, D.; Imants, J. Experienced teachers’ informal workplace learning and perceptions of workplace conditions. J. Workplace Learn. 2009, 21, 276–298. [Google Scholar] [CrossRef]
- López, O.S. Informal Workplace Learning; Springer International Publishing: Berlin/Heidelberg, Germany, 2020; pp. 475–485. [Google Scholar]
- Mukhtar, K.; Javed, K.; Arooj, M.; Sethi, A. Advantages, Limitations and Recommendations for online learning during COVID-19 pandemic era. Pak. J. Med. Sci. 2020, 36, S27. [Google Scholar] [CrossRef]
- Otchie, W.O.; Pedaste, M. Using Social Media for Learning in High Schools: A Systematic Literature Review. Eur. J. Educ. Res. 2020, 9, 889–903. [Google Scholar]
- Ansari JA, N.; Khan, N.A. Exploring the role of social media in collaborative learning the new domain of learning. Smart Learn. Environ. 2020, 7, 9. [Google Scholar] [CrossRef] [Green Version]
- Awokola, B.I.; Okello, G.; Mortimer, K.J.; Jewell, C.P.; Erhart, A.; Semple, S. Measuring air quality for advocacy in Africa (MA3): Feasibility and practicality of longitudinal ambient PM2. 5 measurement using low-cost sensors. Int. J. Environ. Res. Public Health 2020, 17, 7243. [Google Scholar] [CrossRef]
- Marques, G.; Miranda, N.; Kumar Bhoi, A.; Garcia-Zapirain, B.; Hamrioui, S.; de la Torre Díez, I. Internet of things and enhanced living environments: Measuring and mapping air quality using cyber-physical systems and mobile computing technologies. Sensors 2020, 20, 720. [Google Scholar] [CrossRef] [PubMed] [Green Version]
- Shan, M.; Liu, W.Q.; Hwang, B.G.; Lye, J.M. Critical success factors for small contractors to conduct green building construction projects in Singapore: Identification and comparison with large contractors. Environ. Sci. Pollut. Res. 2020, 27, 8310–8322. [Google Scholar] [CrossRef] [PubMed]
- Harwood, A.D.; Nutile, S.A.; Simpson, A.M. A comparison of activated carbon remediation success in floodplain soils contaminated with DDT and its metabolites using ex situ and in situ experimentation. Environ. Pollut. 2022, 295, 118687. [Google Scholar] [CrossRef] [PubMed]
- Strubell, E.; Ganesh, A.; McCallum, A. Energy and policy considerations for deep learning in NLP. arXiv 2019, arXiv:1906.02243. [Google Scholar]
- Vogelaar, A.; Priante, A. The Role of Social Media Normative Interventions and Environmental Awareness in Intentions to Change Pro-Environmental Behaviors. In Proceedings of the 54th Hawaii International Conference on System Sciences, Kauai, HI, USA, 5–8 January 2021. [Google Scholar]
- Chae, Y.; An, Y.J. Current research trends on plastic pollution and ecological impacts on the soil ecosystem: A review. Environ. Pollut. 2018, 240, 387–395. [Google Scholar] [CrossRef] [PubMed]
- Levin, N.; Ali, S.; Crandall, D. Utilizing remote sensing and big data to quantify conflict intensity: The Arab Spring as a case study. Appl. Geogr. 2018, 94, 1–17. [Google Scholar] [CrossRef]
- Sabadash, V.; Denysenko, P. Economic and social dimensions of ecological conflicts: Root causes, risks, prevention and mitigation measures. Int. J. Environ. Technol. Manag. 2018, 21, 273–288. [Google Scholar] [CrossRef]
- Genchi, G.; Carocci, A.; Lauria, G.; Sinicropi, M.S.; Catalano, A. Nickel: Human health and environmental toxicology. Int. J. Environ. Res. Public Health 2020, 17, 679. [Google Scholar] [CrossRef] [Green Version]
- Environment and Climate Change Canada. 2020 Expert Assessment of Carbon Pricing Systems. Canadian Institute for Climate Choices. 2020. Available online: https://publications.gc.ca/collections/collection_2021/eccc/En4-434-2021-eng.pdf (accessed on 12 November 2021).
- IEA. Data and Statistics. 2020. Available online: https://www.iea.org/data-and-statistics/data-browser/?country=WORLD&fuel=CO2%20emissions&indicator=CO2BySource (accessed on 18 March 2021).
Figure 1.
The triple bottom framework.

Figure 2.
The pillars of Positive Peace. Source: Global Peace Index (2021).

Figure 3.
Research model.

Table 2.
Cross-sectional time-series FGLS regression (Global).
| Coefficients: generalized least squares | ||
| Panels: homoskedastic | ||
| Correlation: no autocorrelation | ||
| Estimated covariances = 1 | Number of obs = | 3504 |
| Estimated autocorrelations = 0 | Number of groups = | 146 |
| Estimated coefficients = 10 | Time periods = | 24 |
| Wald chi2(9) = | 2908.52 | |
| Log likelihood = −10,721.48 | Prob > chi2 = | 0.000 |
Table 3.
Cross-sectional time-series FGLS regression (OECD).
| Coefficients: generalized least squares | ||
| Panels: homoskedastic | ||
| Correlation: no autocorrelation | ||
| Estimated covariances = 1 | Number of obs = | 912 |
| Estimated autocorrelations = 0 | Number of groups = | 38 |
| Estimated coefficients = 10 | Time periods = | 24 |
| Wald chi2(9) = | 1061.07 | |
| Log likelihood = −2310.59 | Prob > chi2 = | 0.000 |
Table 4.
OSL and FGLS regressions for Global and OECD panel data.
| Model | (1) | (2) | (3) | (4) | Hypothesis |
|---|---|---|---|---|---|
| OLS (Global) | OLS (OECD) | FGLS (Global) | FGLS (OECD) | ||
| ict | −0.00955 *** | −0.0159 *** | −0.00995 *** | −0.0142 *** | H1 |
| (−5.95) | (−7.32) | (−6.21) | (−6.71) | ||
| gdpp | 3.215 *** | 2.159 *** | 3.223 *** | 2.432 *** | H2 |
| (25.98) | (8.96) | (26.12) | (10.35) | ||
| regulation | 0.0434 *** | 0.121 *** | 0.0409 *** | 0.113 *** | H3 |
| (7.36) | (8.07) | (6.91) | (7.83) | ||
| instability | 0.0246 *** | 0.0169 ** | 0.0253 *** | 0.0176 ** | H4 |
| (4.85) | (2.59) | (5.00) | (2.80) | ||
| edu | −0.0141 *** | −0.0182 *** | −0.0132 *** | −0.0177 *** | H5 |
| (−5.36) | (−3.84) | (−5.03) | (−3.70) | ||
| pr | −0.0226 ** | 0.0663 *** | −0.0361 ** | 0.0409 ** | H6 |
| (−3.10) | (4.21) | (−3.10) | (4.23) | ||
| cl | −0.0361 *** | −0.0409 ** | −0.0361 *** | −0.049 ** | H7 |
| (−4.00) | (−2.76) | (−4.01) | (−2.77) | ||
| cop | 0.0434 *** | 0.1210 ** | 0.0409 *** | 0.113 ** | H8 |
| (4.00) | (2.76) | (3.84) | (2.79) | ||
| time | 0.00789 *** | −0.0215 *** | |||
| (3.70) | (−7.67) | ||||
| _cons | −22.34 *** | −20.58 *** | −23.14 *** | −17.97 *** | |
| (−25.25) | (−10.57) | (−25.48) | (−9.42) | ||
| # of countries | 146 | 38 | 146 | 38 | |
| observations | 3504 | 912 | 3504 | 912 |
Notes: CO2 per capita is measured in metric tons per capita, and GDPP is in logs. t statistics in parentheses. ** p < 0.01, *** p < 0.001
Publisher’s Note: MDPI stays neutral with regard to jurisdictional claims in published maps and institutional affiliations. |
© 2022 by the authors. Licensee MDPI, Basel, Switzerland. This article is an open access article distributed under the terms and conditions of the Creative Commons Attribution (CC BY) license (https://creativecommons.org/licenses/by/4.0/).
Share and Cite
MDPI and ACS Style
Shaaban-Nejad, S.; Shirazi, F. ICT and Environmental Sustainability: A Comparative Study. Sustainability 2022, 14, 8651. https://0-doi-org.brum.beds.ac.uk/10.3390/su14148651
AMA Style
Shaaban-Nejad S, Shirazi F. ICT and Environmental Sustainability: A Comparative Study. Sustainability. 2022; 14(14):8651. https://0-doi-org.brum.beds.ac.uk/10.3390/su14148651
Chicago/Turabian StyleShaaban-Nejad, Samin, and Farid Shirazi. 2022. "ICT and Environmental Sustainability: A Comparative Study" Sustainability 14, no. 14: 8651. https://0-doi-org.brum.beds.ac.uk/10.3390/su14148651
Note that from the first issue of 2016, this journal uses article numbers instead of page numbers. See further details here.