Article

Sustainable Food Production: An Intelligent Fault Diagnosis Framework for Analyzing the Risk of Critical Processes

by
Hamzeh Soltanali
1,2,
Mehdi Khojastehpour
1,*,
José Edmundo de Almeida e Pais
3,4 and
José Torres Farinha
2,5
1
Department of Biosystems Engineering, Ferdowsi University of Mashhad, Mashhad 9177948974, Iran
2
Centre for Mechanical Engineering, Materials, and Processes (CEMMPRE), 3030-199 Coimbra, Portugal
3
CISE—Electromechatronic Systems Research Centre, University of Beira Interior, 6201-001 Covilhã, Portugal
4
EIGeS—Research Centre in Industrial Engineering, Management and Sustainability, Lusófona University, Campo Grande 376, 1749-024 Lisboa, Portugal
5
Coimbra Institute of Engineering, Polytechnic of Coimbra, 3030-199 Coimbra, Portugal
*
Author to whom correspondence should be addressed.
Sustainability 2022, 14(3), 1083; https://0-doi-org.brum.beds.ac.uk/10.3390/su14031083
Submission received: 20 December 2021 / Revised: 12 January 2022 / Accepted: 13 January 2022 / Published: 18 January 2022

Abstract

:
Fault diagnosis and prognosis methods are the most useful tools for risk and reliability analysis in food processing systems. Proactive diagnosis techniques such as failure mode and effect analysis (FMEA) are important for detecting all probable failures and facilitating the risk analysis process. However, significant uncertainties exist in the classical-FMEA when it comes to ranking the risk priority numbers (RPNs) of failure modes. Such uncertainties may have an impact on the food sector’s operational safety and maintenance decisions. To address these issues, this research provides a unique FMEA framework for risk analysis within an edible oil purification facility that is based on certain well-known intelligent models. Fuzzy inference systems (FIS), adaptive neuro-fuzzy inference systems (ANFIS), and support vector machine (SVM) models are among those used. The findings of the comparison of the proposed FMEA framework with the classical model revealed that intelligent strategies were more effective in ranking the RPNs of failure modes. Based on the performance criteria, it was discovered that the SVM algorithm classifies the failure modes more accurately and with fewer errors., e.g., RMSE = 7.30 and MAPE = 13.19 with that of other intelligent techniques. Hence, a sensitivity FMEA analysis based on the SVM algorithm was performed to put forward suitable maintenance actions to upgrade the reliability and safety within food processing lines.

1. Introduction

With the increasing automation and development of smart technologies in modern food industries, the higher guarantee of functional safety and reliability is poised to be the major challenge towards sustainable food production [1,2,3]. In this context, the intelligent platforms provide the hardware and software solutions for process control and safety management within many food manufacturing systems [4,5]. They attempt to represent the novel fault diagnostic and prognostic methods for risk predicting and analysis processes [6,7]. One of the most essential parts of risk in analyzing system reliability and safety is the risk analysis procedure [8,9,10]. In general, the novel methods are mainly classified into the knowledge-based and data-driven approaches for risk and reliability analysis and prediction under various situations [11,12,13].
In such circumstances, there are many types of knowledge-based approaches that refer to fault diagnosis and risk analysis, such as fault tree analysis (FTA), hazard analysis, critical control points (HACCP), root cause analysis (RCA), etc. [14,15,16]. Among them, the failure mode and effect analysis (FMEA) technique is widely used in numerous industries to assess and mitigate the risk of unexpected failures [17]. Besides, it has been a well-established procedure for upgrading the production quality and reducing the severity and occurrence of failure using corrective tasks [18]. A complete FMEA dominated by experts’ knowledge includes the following four main steps: identifying the failure modes, determining their causes and effects, ranking the risk of failure modes, and finally suggesting the maintenance activities for the high-risk failures [19]. A risk priority number (RPN) is frequently inserted in a traditional FMEA to evaluate the risk level of a process, rank failures, and prioritize maintenance operations [20]. The RPN value is calculated by multiplying the following three risk parameters: occurrence (O), severity (S), and detection (D). They are ranked from 1 to 10 on a discrete ordinal scale. Ultimately, by arranging the RPNs in a descending order, the most critical failures can be identified [21].
The classical-FMEA has been particularly effective in detecting system bottlenecks and assessing the risk of failure modes in food production systems. They include the possibility of having the same RPN values, failing to assess the relative importance of risk parameters, and estimating the precise value of risk parameters incorrectly. Such major fluctuations in the real situation may not only affect the accuracy of estimated risks, but also the proposed maintenance and safety functions within food processing systems [21,22,23]. The main objective of this study is to take such uncertainties into account, particularly when ranking the RPNs of failure modes to supplement the current classical-FMEA in the food sector. The key contribution is a new systematic FMEA framework for risk analysis procedure based on certain well-known intelligent models to overcome RPN issue classification within an edible oil purification plant. The intelligent techniques include the fuzzy inference systems (FIS), adaptive neuro-fuzzy inference systems (ANFIS), and support vector machine (SVM) models. The findings of the current study could help managers to establish practical functional safety and maintenance programs in the edible oil industry.
The remainder of this research is organized as follows: A description of the literature linked to various types of FMEA in the food sector and its associated uncertainties in the risk analysis process is included in the part “Literature review.” The “Research methodology” section compares the traditional and intelligent-FMEA risk analysis methodologies to come up with an upgraded fault diagnosis framework. The “Results and Discussion” section contains the key comparison data of traditional and intelligent-FMEA risk analysis approaches, as well as how to use the results to propose appropriate maintenance tasks. Finally, the “conclusion” section is provided, along with further remarks and perspectives.

2. Literature Review

Over the years, various types of FMEA, such as process-FMEA (PFMEA), design-FMEA (DFMEA), and total-FMEA (TFMEA) have been conducted within a wide range of applications in food processing industries. Table 1 presents a summary review of the applied FMEAs in the food sector. The PFMEA is known as the main practical solution tool for analyzing various risks in food processing. For example, a PFMEA framework was performed to recognize the main critical points and analyze the risk by determining the RPN in the processing of potato chips. The results revealed that packaging, storage, potato receiving, frying, and distribution were the main critical points with the highest RPN, respectively [23]. In another study, a combined structure of PFMEA and ISO22000 was carried out on poultry slaughtering and manufacturing. In their work, the critical failure modes with high risks were identified by determining the RPN. [24]. Following this study, analyzing the risk of salmon processing has been conducted using PFMEA and its conjunction with the ISO 22000. The research findings could be beneficial for the manufacturers and their customers [25]. One of the FMEA applications is to control the quality and safety of food products. For example, the high quality of products has been a major challenge in the tea manufacturing industry. In this direction, a TFMEA model combined with the total quality management (TQM) technique was theoretically explored [26]. Following this, a FMEA structure for risk management in the confectionery industry has been designed to control system safety and quality [22]. In another work, a practical safety improvement plan for dairy product manufacturing under PFMEA analysis was suggested [27]. The results could be used by the manufacturers to produce safer dairy products. Another practical aspect of FMEA methods is its application to fault detection and optimization in food industries. For instance, the FMEA model was dedicated to allowing precise identification of food safety in verified HACCP systems. The incorporation of FMEA was verified to the procedure of the HACCP system in the bakery industry for better food safety assurance and fault detection [28]. Furthermore, a general structure of FMEA was suggested to detect the potential faults and their effects in primary food processing [29].
A summary of the literature, the application of FMEAs in the food sector can be divided into several topics such as analyzing the risks, finding the critical points, improving the quality and safety, and selecting the maintenance activities. Despite the advantages of classical-FMEAs in the food industry, they have been criticized for several flaws and limitations that may affect proposed maintenance and safety decisions. The majority of epistemic uncertainties are included in the new systematic FMEA framework to improve the prior classical-FMEA in the food business. Intelligent approaches, on the other hand, have been deemed a very valuable alternative to enhance the accuracy of classical-FMEA for risk analysis under various uncertainties [34,35].
During the last few years, intelligent techniques such as support vector machine (SVM), fuzzy inference systems (FIS) and, adaptive neuro-fuzzy inference systems (ANFIS) have given great attention to modeling the FMEA and risk analysis processes. The FIS model, for example, has been used in the field of FMEA due to its software programming-based approach and its capacity to avoid cumbersome computations [19,36,37]. Currently, a comprehensive survey on the FIS-FMEA model was conducted with various rules and membership functions [MFs]. Based on the results, the combined MFs and model with a 10-class of fuzzy numbers have a higher possibility to create the larger risk cluster of failure modes [17]. Simşek and Ic [38] conducted an FMEA using a FIS model to evaluate and eliminate potential failure modes in a ready-mixed concrete plant. Their findings revealed that the fuzzy-rule-based system was effective in identifying and eliminating potential failure modes. Yucesan et al. [39] proposed a holistic FMEA approach based on a fuzzy-based Bayesian network and the best–worst method to deal with uncertain failure data. The proposed model might resolve the uncertainty in failure data and give a strong probabilistic risk analysis logic to represent the dependency between failure events in a manufacturing plant. The FUCOM and CoCoSo approaches were considered by Yousefi et al. [40] to improve the classical-FMEA technique in an unpredictable setting. Furthermore, Z-number theory was used to combine the ideas of reliability and uncertainty in evaluating the weight of risk variables. In an actual case study, the Z-FUCOM-CoCoSo approach was compared to the Fuzzy FMEA technique and a fuzzy variant of this approach. It was found that the Z-FUCOM-CoCoSo approach could provide the most feasible separation among failure modes when compared to traditional techniques. Rezaee et al. [41] presented a hybrid approach based on the Linguistic FMEA, FIS, and fuzzy data envelopment model to calculate a score for covering some RPN shortcomings and the prioritization of risks within the chemical industry. The results demonstrated that the proposed approach was very effective in prioritizing risks by taking uncertainty into account. In addition, to handle the uncertainties of classical-FMEA in other literature, the hybrid perception of fuzzy rule-based theories has been given a lot of attention [42,43,44].
On the other hand, the ANFIS model, with the benefits of both neural networks (NNs) and FIS principles in a single framework, has been used to reinforce the FMEA capabilities and manage the uncertainties in risk analysis [45,46,47]. For instance, an ANFIS model was developed to improve risk management and manage the uncertainties in risk variables. The proposed model was more convenient and efficient concerning risk management for single and clustered station facilities in transportation systems [48]. Moreover, the SVM algorithms constitute powerful regression and classification capabilities with that of FIS, neural networks (NNs), or genetic algorithms (GAs). They generally suffer from the presence of multiple local minima, structure selection problems, and overfitting issues [49,50,51]. Meanwhile, the SVMs have been approved as validation methods for failure mode analyses, fault detection as well as risk assessment in industrial fields [52,53,54,55].
Based on the literature, the performance comparison of such intelligent models in risk analysis, especially in food processing systems has not been previously evaluated. Hence, as the main motivation and innovation, we have contributed to proposing a new FMEA framework by intelligent techniques and comparing their outcomes with the classical model within food processing systems. In addition, given the need for monitoring the complex processes in the food sector, the proposed framework was implemented in the edible oil purification process. The outcomes were used to help the engineers to establish convenient safety and maintenance programs. Therefore, the main objective of this study is to propose a novel FMEA framework under intelligent techniques for analyzing the risks of the edible oil purification process.

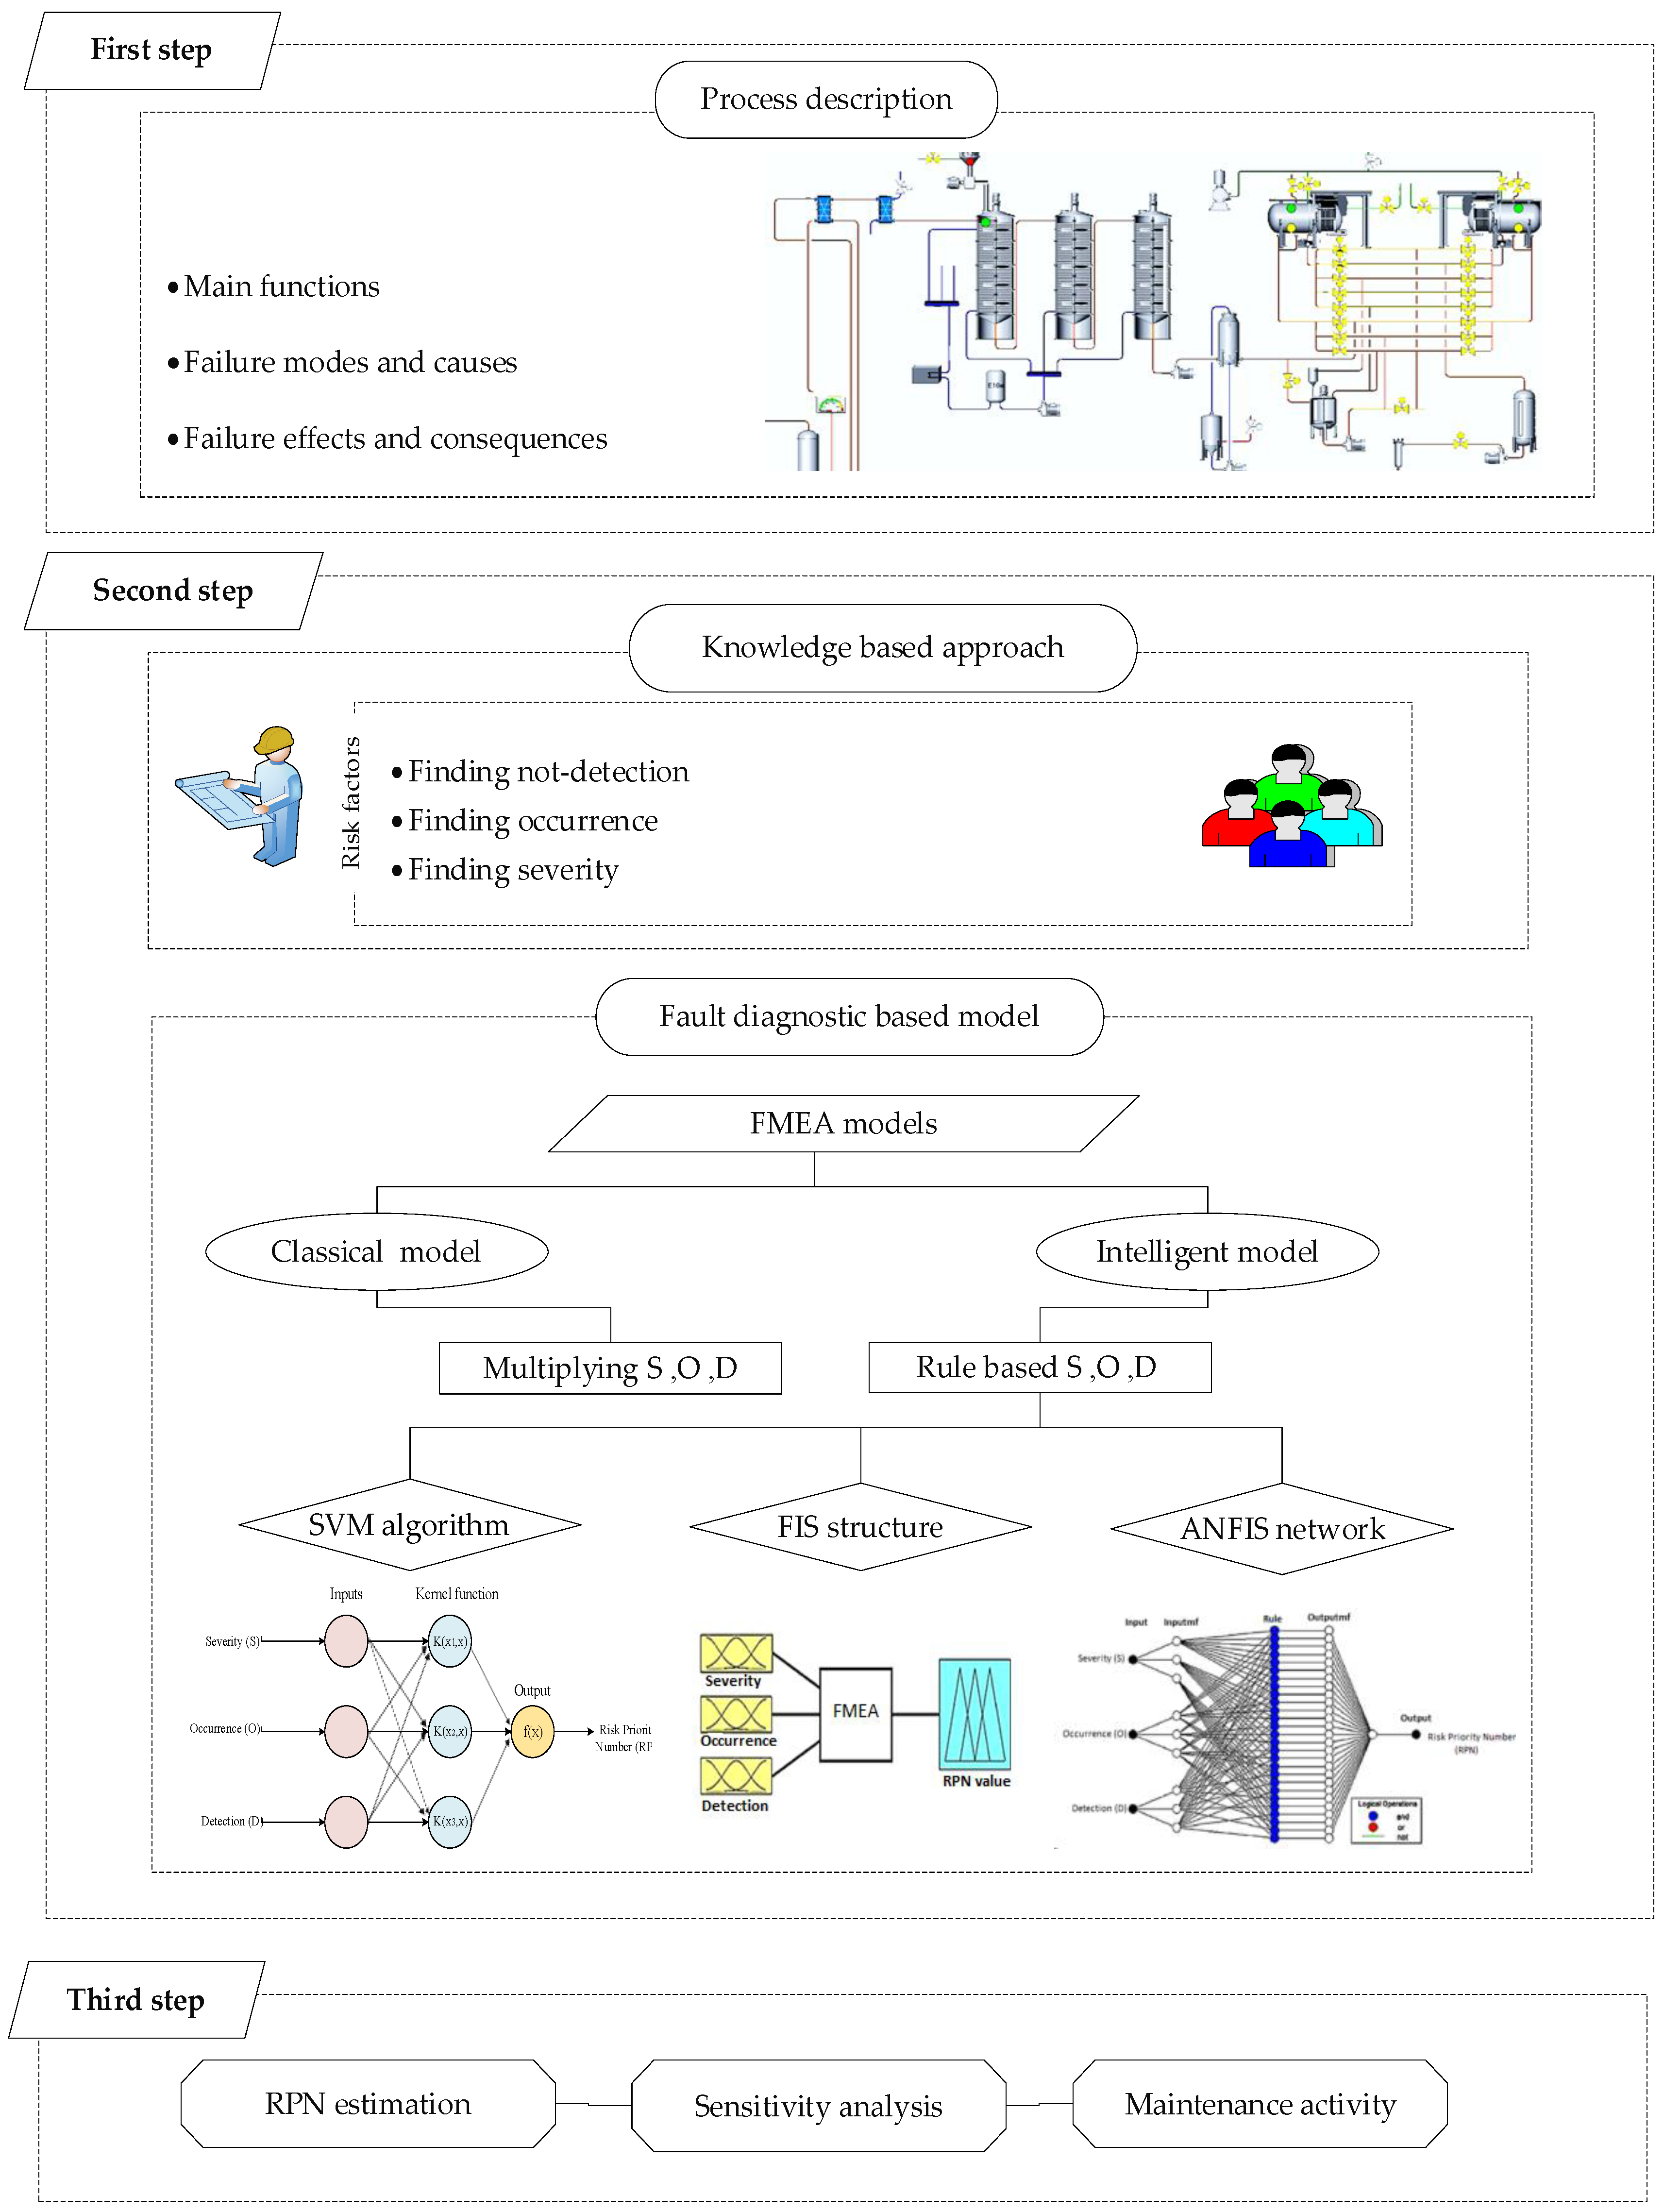
3. Materials and Methods

An improved fault diagnosis framework for risk analysis with three main steps is shown in Figure 1. The first step includes process description such as main functions, potential failure modes as well as failure effects for the edible oil purification process. The main risk factors are defined in the second step using a knowledge-based approach, and the factors are then used as the main inputs of diagnostic models such as classical and intelligent-FMEAs. The multiplication and rule-based methods are used to determine the interaction of risk factors. The final step is to estimate RPN and use sensitivity analysis to investigate the impact of risk factors on RPN as well as suggest the convenient maintenance activities for the failure modes with the highest RPN. The details of the first and second steps are provided in the next sub-sections. The last one will be discussed in Section 4.

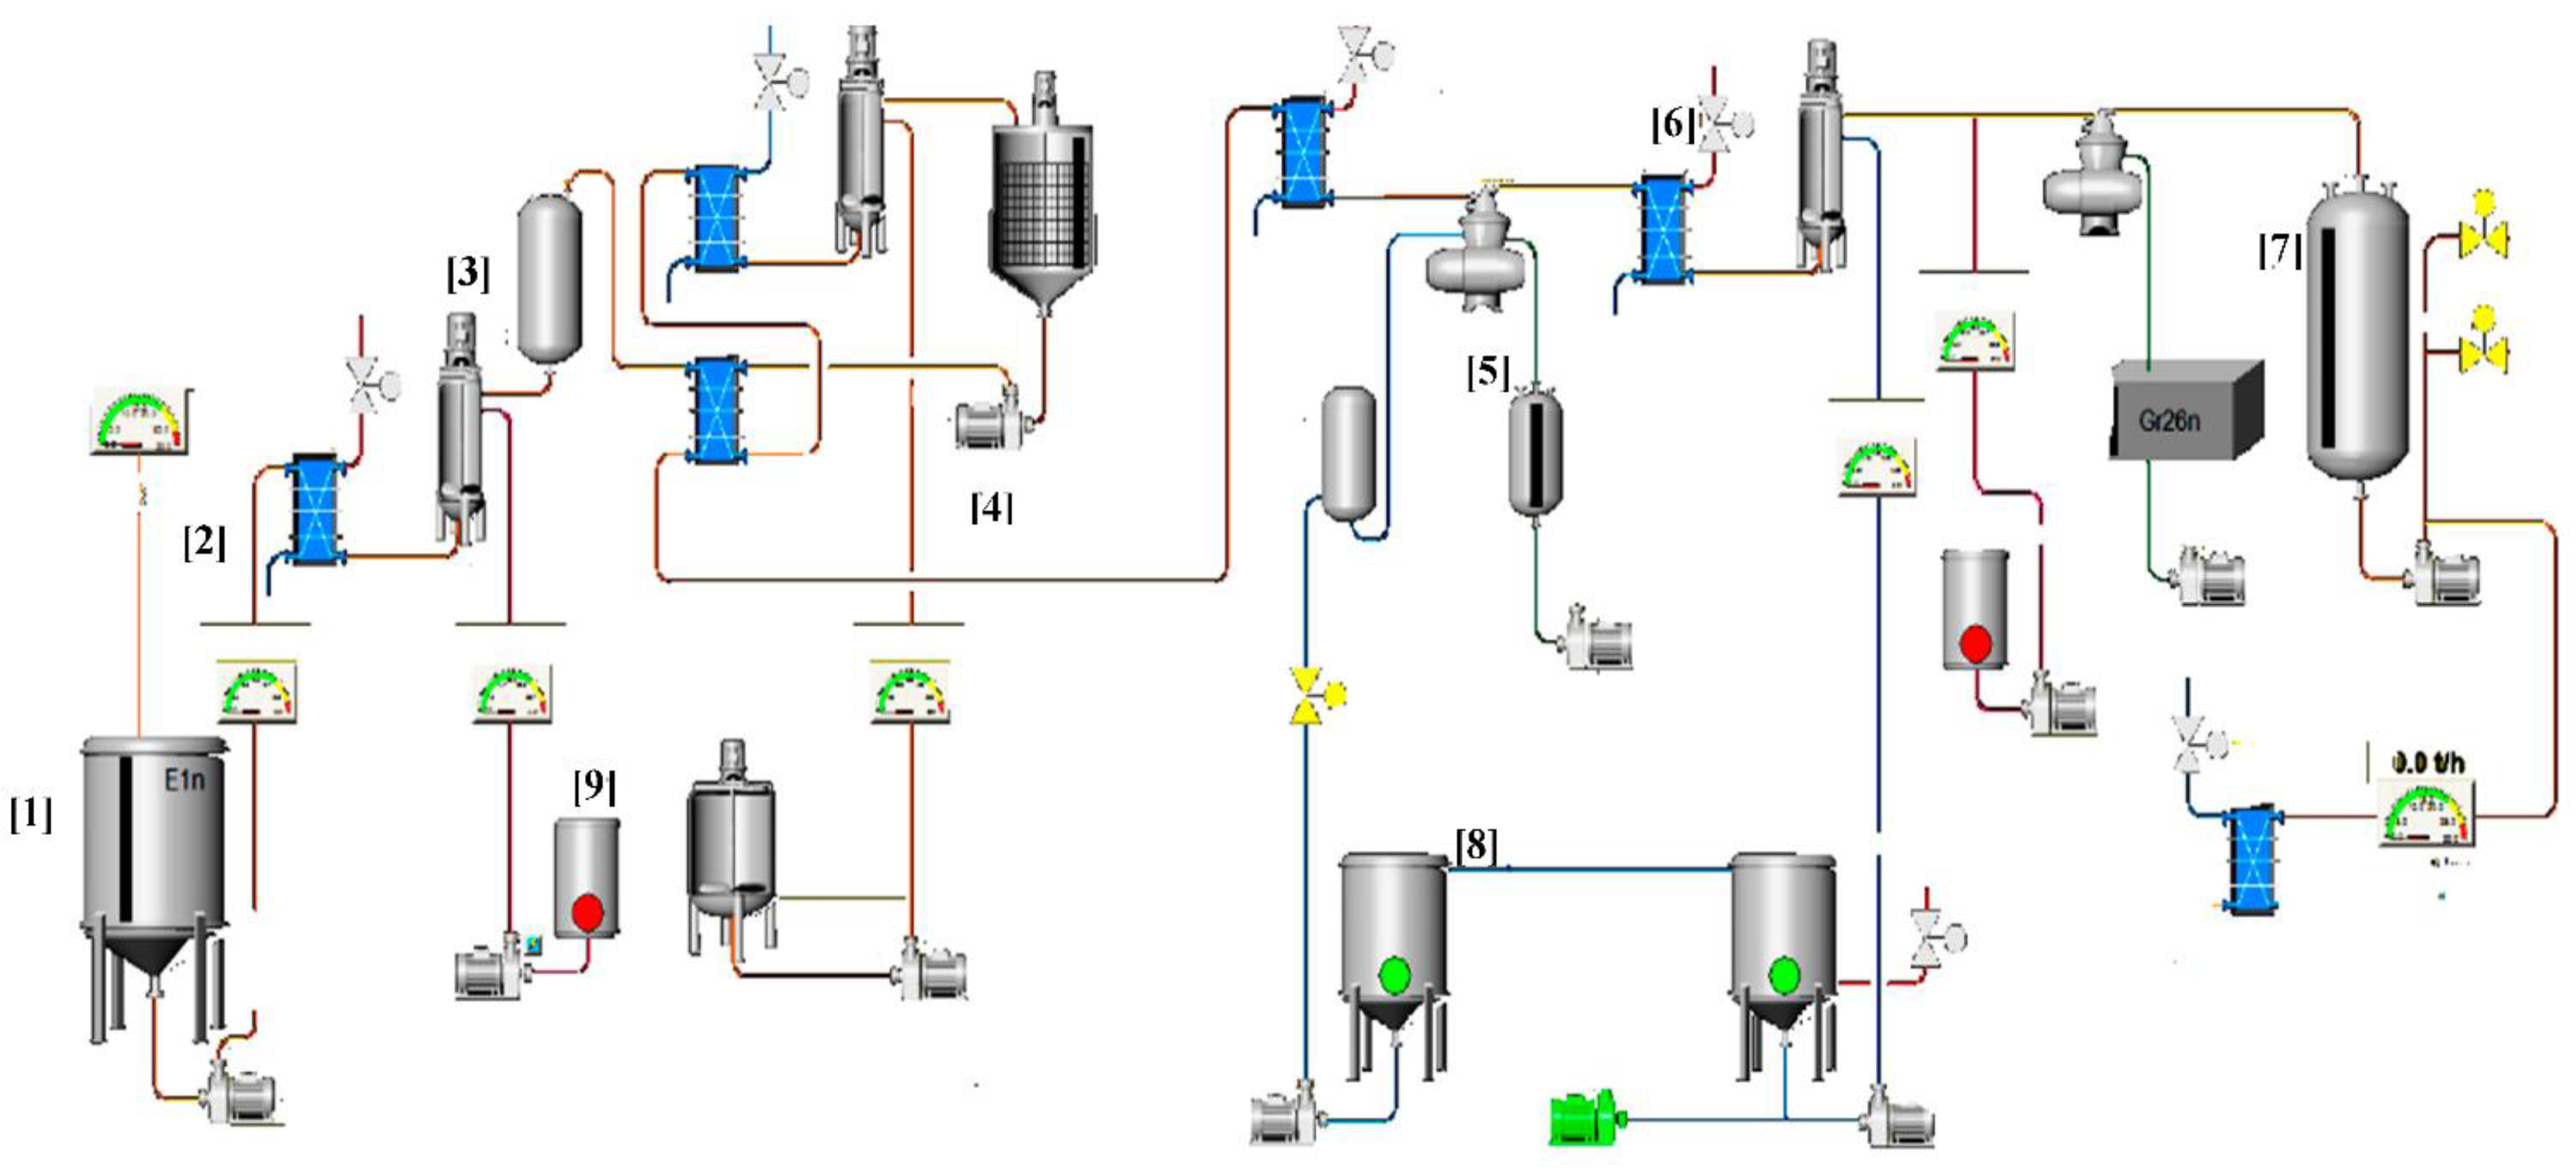
3.1. First Step: Process Description

This study focuses on an edible oil purification facility and its processes in Iran to apply the proposed intelligent framework. Investigating the operational risk of such a process would provide a great opportunity to achieve higher reliability and safety guarantee. Figure 2 depicts the fundamental procedure for purifying the following two types of edible oils: liquid and solid. The basic stages of edible oil purification are neutralization, decolorization, winterization, deodorization, hydrogenation, and bleaching, as illustrated in Figure 2.

3.1.1. Neutralization Process

A process of neutralization or alkaline purification is shown in Figure 3 in which sodium hydroxide is used to react with free fatty acid to produce soap. To ensure the removal of soap and liquids, the outlet oil enters into the exchanger and is heated to 80 °C and then enters into a mixer where water is added to allow the soap to be completely discharged. Finally, the oil is inserted into a dryer to completely remove its moisture contents. The most important equipment for neutralization operations include separators, centrifugal pumps, heaters, mixers, hydraulic-pneumatic valves, vacuum dryers, and their attached pipes and fittings. So, the importance of their proper maintenance program for safe operation and high reliability is inevitable.

3.1.2. Discoloration Process

According to Figure 4, the color of the oil is reduced through decolorized soil and some particles of oil-based paint are removed. The decolorized soil is dissolved in oil or colloidal, and attractive colored particles are separated from the oil by a press. In general, decolorization is a physical absorption activity that removes pigments and impurities from the oil by absorption. The non-continuous [batch] system is used to decolorize the liquid oil, which has a larger volume and stronger stirrers than the solid oil tank, and the shelf life of the oil is much longer. After this step, the oil is transferred into the winterization process. The most important equipment in this phase includes hydraulic-pneumatic valves, pumps, mixing tanks, electrical systems, etc.

3.1.3. Winterize Process

During the winterizing process, the discolored oil is stored for 24 h at a relatively low temperature, usually, 9 °C, to remove all possible solids that freeze the oil. These solids include high-melting glycerides and waxes. Thereafter, the high-pressure oil is pressed into the crystallized tanks with the help of air pressure to remove all solids from the oil, after which the pure oil is transferred into the deodorizing process of oil by filtrate operation Figure 5.

3.1.4. Deodorizing Process

Figure 6 shows a deodorizing process of oil in which the undesirable odor of oil is caused by ketones, lactones as well as free fatty acids. For removing these, first, the high-pressure oil is sprayed from the bottom into the odorless tower, which is used simultaneously to heat, steam, and vacuum to prevent oxidation and hydrolysis of the oil. The main purpose is to decrease the oil acid content to the standard level. After that, the oil enters to exchanger until it reaches a temperature of 30 to 40 °C. Then, turns into another exchanger until the oil temperature finally reaches 14 or 12 °C.

3.1.5. Potential Failures and Their Effects

In an edible oil purification plant in Iran, functional failures, causes, and their effects were discovered. To survey such items, a group of FMEA experts totally between 4 to 6 members is needed [21,56,57]. In this study, we have received the knowledge and experiences of four experts [two process engineers and two mechanical and electrical engineers], who were related and engaged in the whole process in edible oil-producing. So, based on the expert’s knowledge and experiences, 67 failure modes of the process were derived. These failures are mainly caused by pumps, separators, chillers, boilers, dryers, compressors, valves, converters, mixers, electronic circuits, pipes, filters, tanks, and vacuum systems. Ultimately, this obtained information was used for estimating risk factors and RPN value.

3.2. Second Step: Knowledge-Based Approach

In this step, first, the risk parameters, e.g., S, O, and D are defined by the FMEA expert team and then the FIS structure, ANFIS, and SVM models based on FMEA models for risk analysis were programmed by MATLAB vR2020b (Math works Inc., Natick, MA, USA).

3.2.1. Risk Parameters Definition

The FMEA is a well-known risk analysis tool that is frequently used by RPN to assess the risk level of a process, rate failures, and prioritize maintenance actions [20]. To calculate the RPN value, a discrete ordinal scale of 1-10 is used to multiply three crisp values of the risk characteristics, namely occurrence (O), severity (S), and detection (D). Finally, the most critical failures can be found by sorting the RPNs in ascending order [21]. In the classical-FMEA, the risk parameters can be divided into five-linguistic terms including remote (R), low (L), moderate (M), high (H), and very high (VH). This attitude will help the FMEA team to prioritize the failure mods and their effects [58,59,60]. The linguistic scale of the risk characteristics and their fuzzy numbers in three class levels (3,5, and 10) for the present investigation was also provided by Soltanali et al. [17] in the FIS structure. The FMEA expert team also provided the necessary information on the severity of the failure and the inability to detect it. Finally, the failures were prioritized using the fuzzy risk numbers.

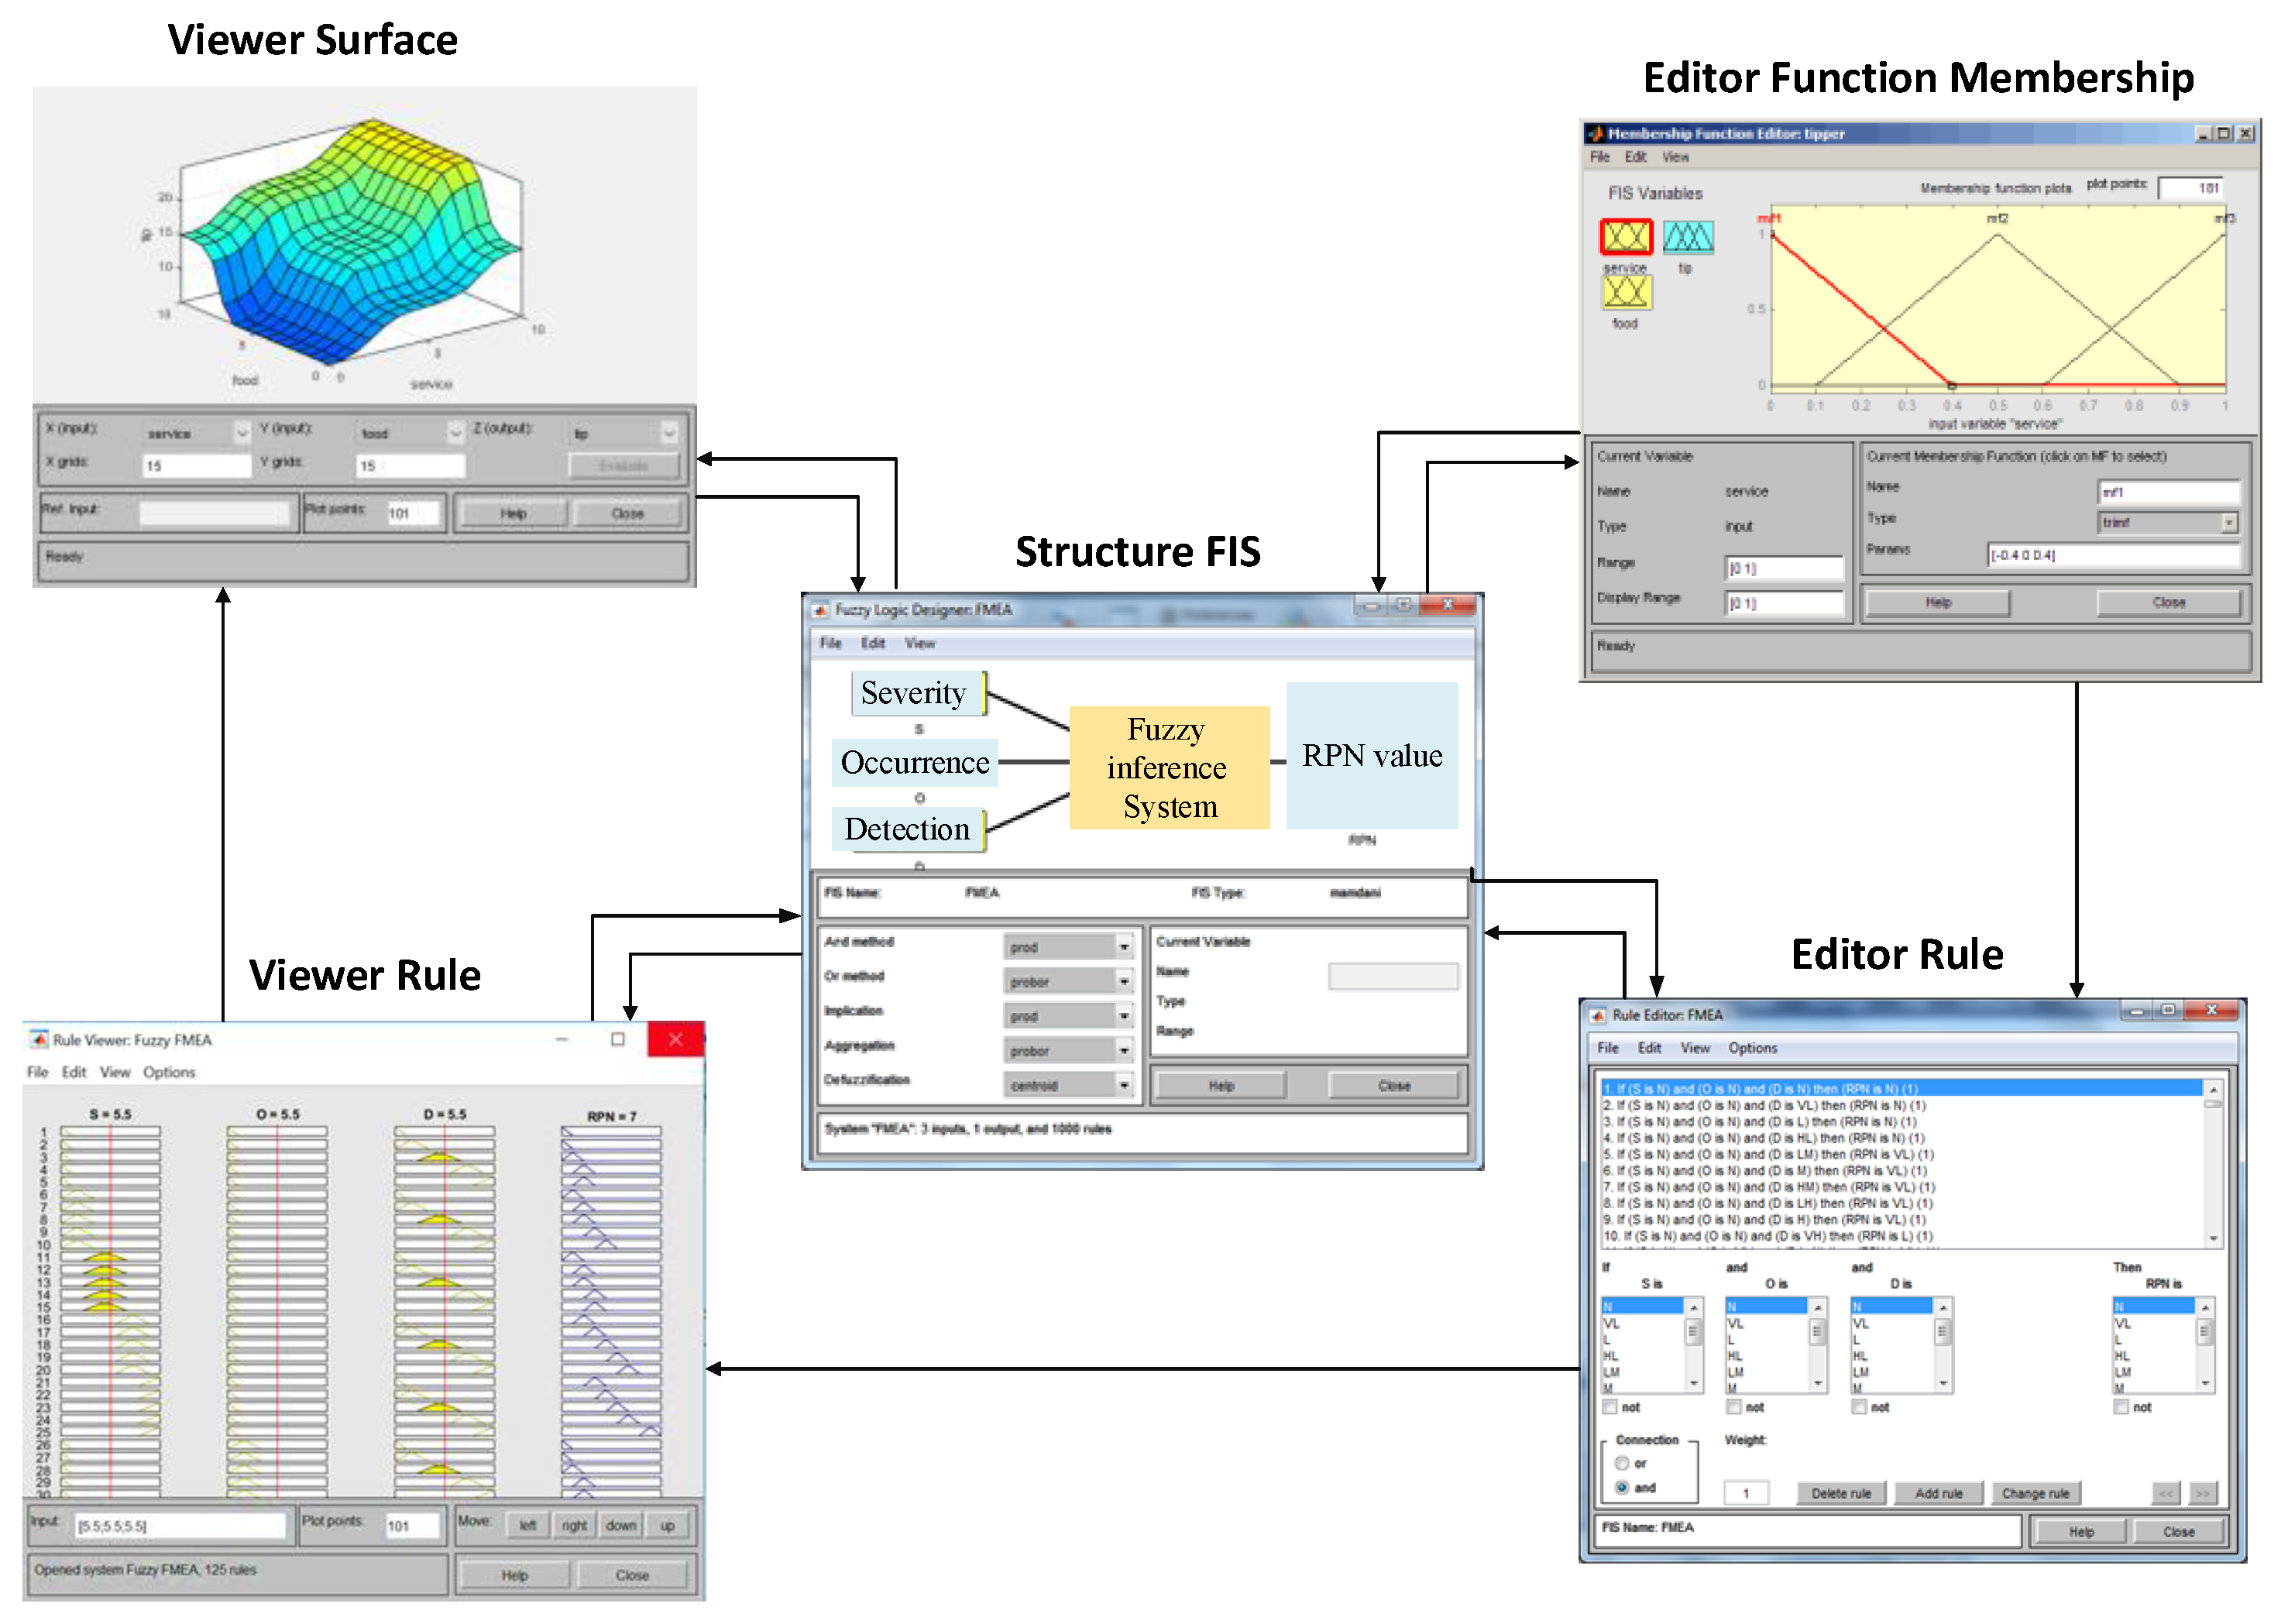
3.2.2. FIS Structure

FIS is a well-known intelligent risk analysis technique. Figure 7 depicts the FIS structure. The FIS environment is built in the first step using key elements including “and method,” “or method,” “implication method,” and “aggregate method.” The membership function of the input variables “risk parameters” was constructed in the second stage. The third step is to create the membership function for the output variable “FIS-RPN.” Finally, the output control rules were defined. The Mamdani approach, which has been frequently utilized by others to build FIS boundaries which is used to evaluate the rules in the rule base [61]. The fuzzy logic system theory can be stated formally as Dağsuyu et al. [19] and Kumru and Kumru [37]. X be a nonempty set. A fuzzy set A in X is characterized by its membership function, i.e., µ A : X [ 0 ,   1 ] and µ A   ( x ) is interpreted as the degree of membership of element x in the fuzzy set A for each x X. It is clear that A is completely determined by a set of tuples A = ( [ u ,   µ A   [ u ] ) / u X ) . Frequently, A (x) is used instead of µ A   ( x ) . The family of all fuzzy sets in X is denoted by F ( x ) . If X = (   x 1 ,   x 2 ,   ,   x n   ) is a finite set and A is a fuzzy set in X, the following notation can be used:
A = µ 1   x 1   + µ 2   x 2   + + µ n   x n  
where the term µi/xi, i = 1,.., n signifies that µi is the grade of membership of xi in A and the plus sign represents the union.
In this work, we looked at many types of membership functions such as Trim, Trapmf, Pimf, and Gaussmf, Gauss2mf, Gbellmf, Psigmf, and Dsigmf to produce fuzzy numbers using linguistic terms and fuzzy numbers for the risk parameters in the 10-class. Experts in the edible oil purification process determined the required rules such as 3, 5, and 10-class, appropriately, 27, 125, and 1000 rules. We used five defuzzification algorithms in the FIS environment’s last stage to analyze the aggregating process and calculate the explicit RPN values.

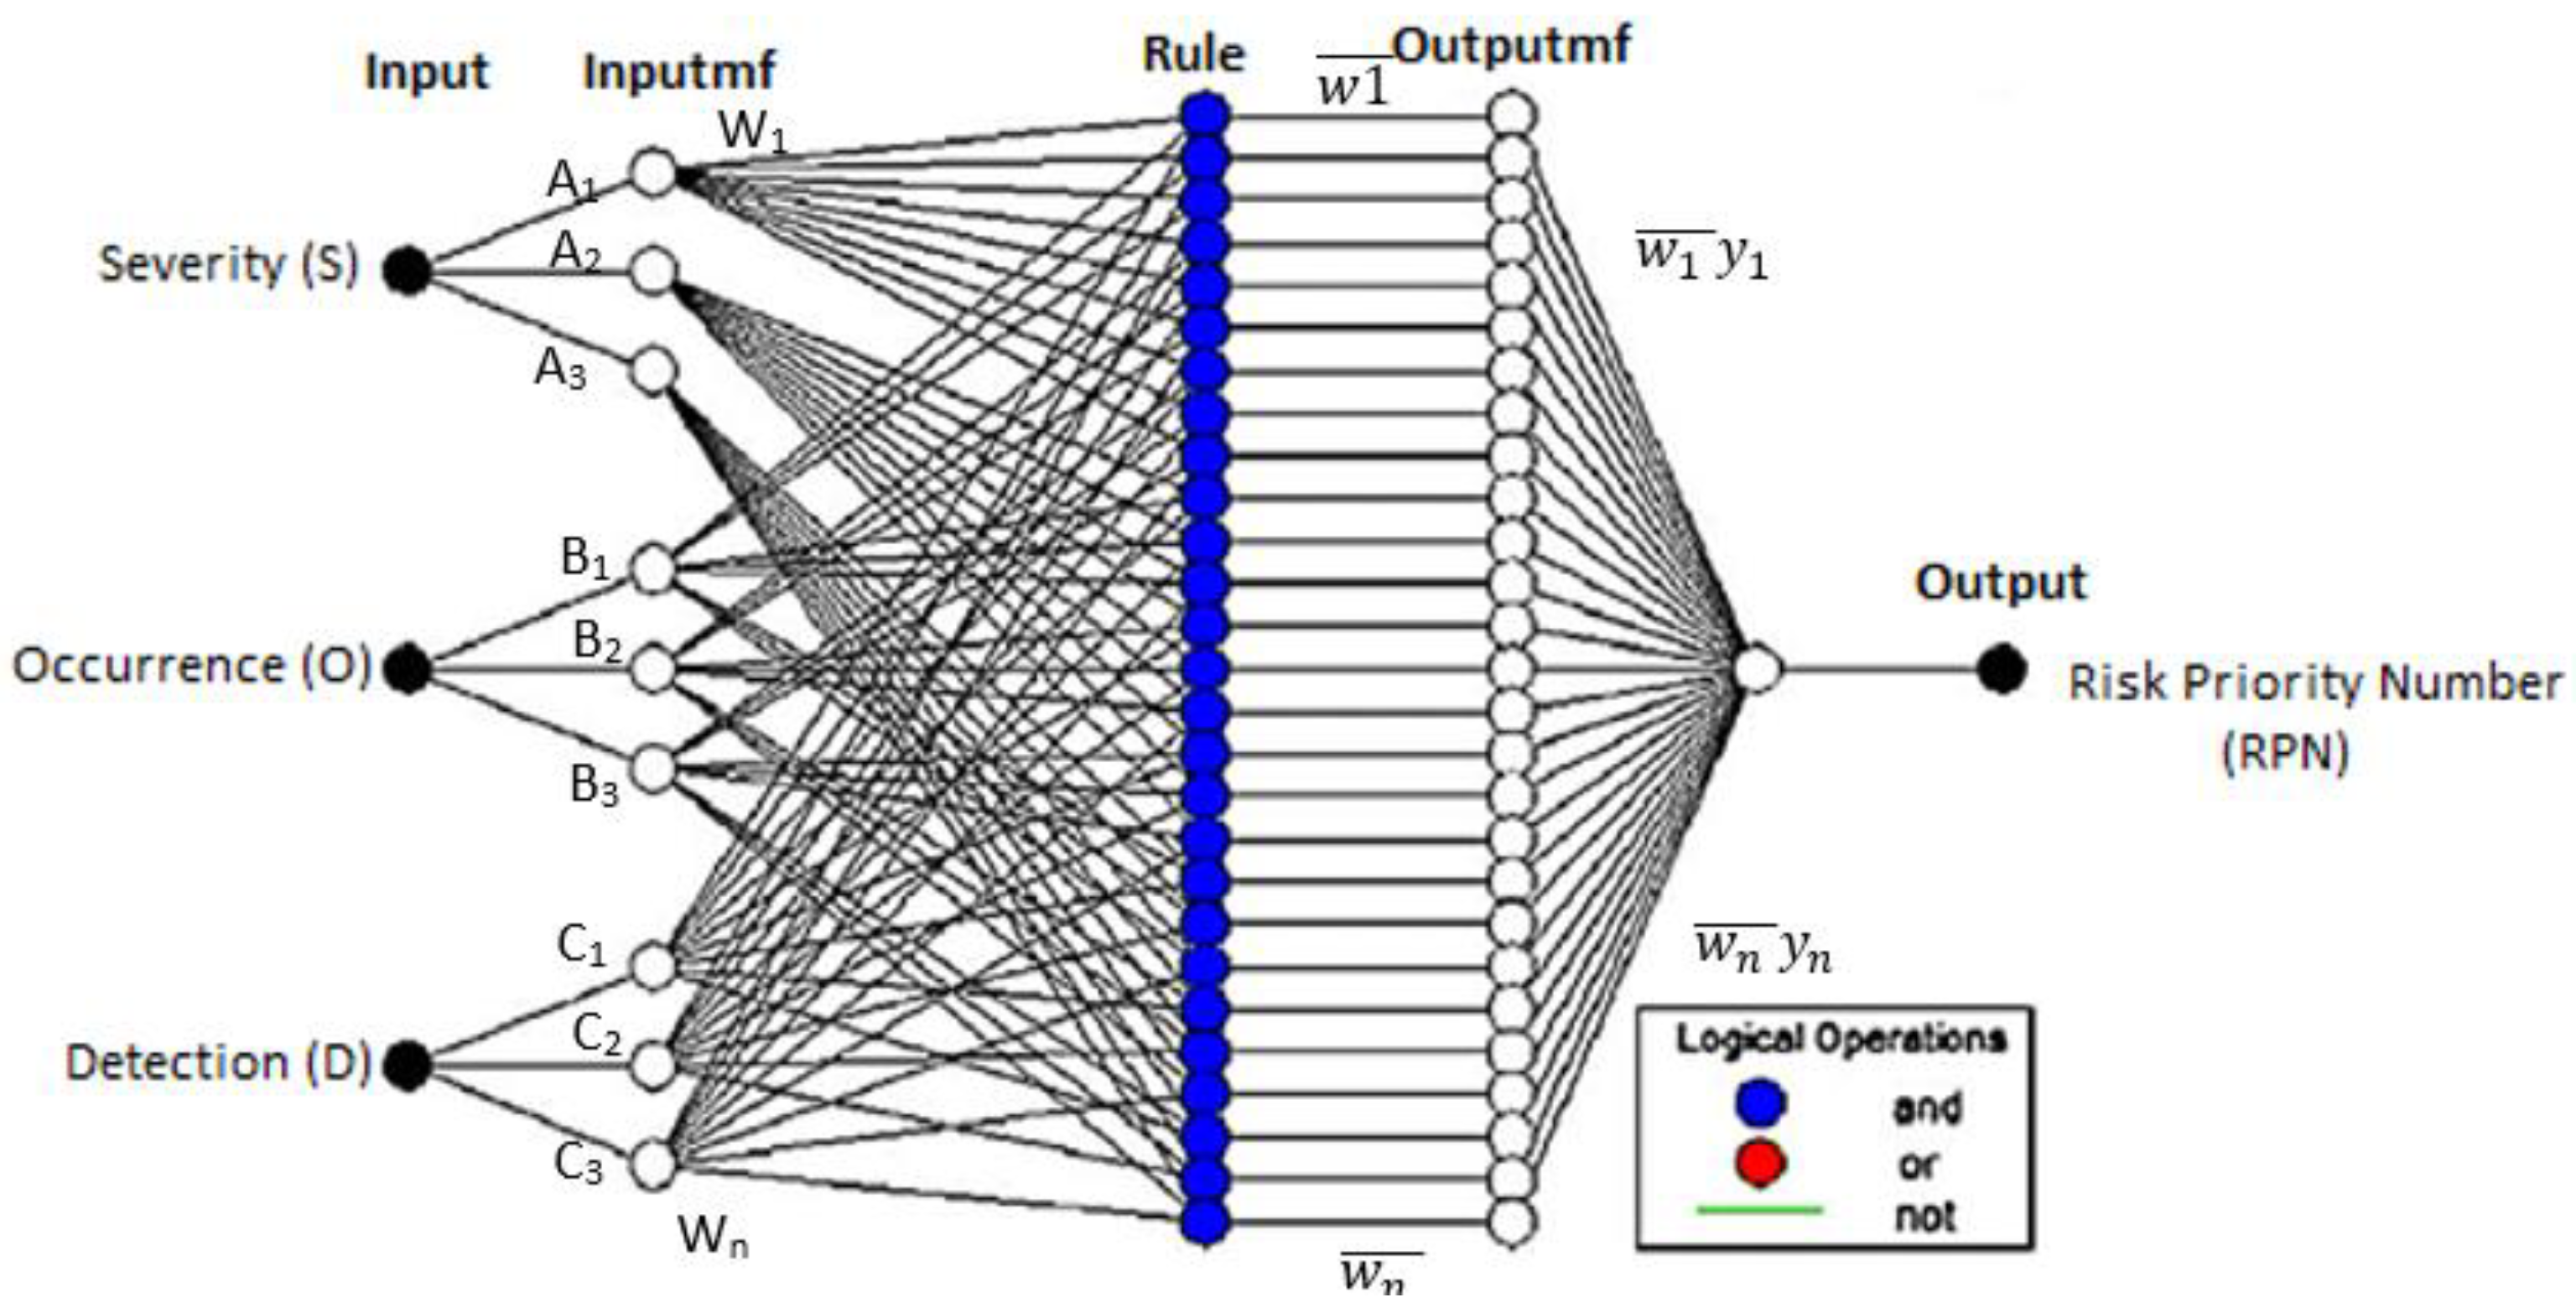
3.2.3. ANFIS Network

Another intelligent approach used for risk analysis was the ANFIS network. During the training phase, it corrects the settings of each node to find the rules regulating the interactions between the input and output [62]. A fuzzify layer (first layer), a product layer (second layer), a normalized layer (third layer), a defuzzifier layer (fourth layer), and a total output layer (fifth layer) make up AN-FIS, as shown in Figure 8.
If three membership functions are assumed for three risk inputs S, O and D then the ANFIS is called first-order TSK. The ith rule is given as:
Rule   i :   If   ( S   is   A i ) ,   ( O   is   B i ) and   ( D   is   C i )   then   ( y i = p i S + p i O + p i D + r i ) , i = 1 , 2 , 3 , , n
where n is the number of rules and ri, qi, and pi are parameters whose optimum values are determined in the training phase. In the first layer, the membership degree of membership function (μ) is calculated for the linguistic variables Ai, Bi, and Ci ( μ A i ( S ) , μ B i ( O ) , μ C i ( D ) ). In the present study, the Gaussian membership function for the variables Ai, Bi, and Ci was used. For example, for Ai we have:
μ A i ( S ) = exp ( 1 2 ( S c i a i ) 2 )
where ai and ci are the membership function’s form-determining parameters. During the training phase, their optimum levels were adjusted. The product layer is the second layer, and its output can be calculated as follows:
c w i = μ A i ( S ) μ B i ( O ) μ C i ( D )
The normalized layer is the third layer, and it calculates the ratio of each weight to the total weight as follows:
w ¯ i = w i i = 1 n w i
The fourth layer contains adaptive nodes, whose output may be calculated using following equation, where w ¯ i is the ith rule’s normalized firing strength.
w ¯ i y i = w ¯ i ( p i S + p i O + p i D + r i )
The output layer (fifth layer) adds up all received signals and outputs them as the output compared to their corresponding input:
y = i = 1 n w ¯ i y i

3.2.4. SVM Algorithm

In addition, the feasibility of using an SVM algorithm for risk analysis was investigated in this work (Figure 9). This model is founded on statistical learning theory and employs supervised learning techniques such as neural networks. The model’s suppression of the over-learning problem is one of its features. It seeks to find a function, f(x), for the training set with the largest allowable bias, so that higher biases are made undesirable [63]:
f ( x ) = i = 1 N ( α i α i ) K ( x i , x ) + b
where α i and α i are the Lagrange multipliers, and K ( x i , x ) is the kernel function. In this work, we evaluated the Gaussian kernel function as follows:
K ( x i , x ) = x i x
K ( x i , x ) = ( 1 + x i x ) p , p = 2 , 3
K ( x i , x ) = exp ( γ | x i x | 2 )
Two essential parameters in the SVM algorithm are the regularization parameter and the size of the error-insensitive zone ( ε ), both of which are typically determined using tri-al-and-error techniques.

3.2.5. Performance Criteria

Some metrics, such as mean absolute percentage error (MAPE), root mean square error (RMSE), efficiency (EF), and coefficient of variation (CV), are used in the literature to evaluate the performance of intelligent models for risk analysis [64,65]. These are their definitions:
MAPE = 1 n j = 1 n | d j p j d j | × 100
RMSE = j = 1 n ( d j p j ) 2 n
EF = j = 1 n ( d j d ¯ ) 2 j = 1 n ( p j d j ) 2 j = 1 n ( d j d ¯ ) 2
CV = σ μ × 100
where dj is the ith value of the desired (actual) output for the jth pattern; pj is the predicted (fitted) output for the jth pattern, μ is the mean value and σ is the standard deviation.

4. Results

4.1. Classical FMEA Result

The results of the classical-FMEA model for three risk parameters and RPN values, based on experts’ judgment, for an edible oil purification process, are addressed in Table 2. One of the model’s drawbacks is its inability to rank the failure types in a unique and non-repetitive manner, as shown in Table 3. As a result, detecting high-risk failure modes and assigning appropriate maintenance duties is challenging. For example, (1st and 2nd), (5th and 10th) failure modes, and so on, all have the same RPNs and ranks, according to the first expert’s assessment. According to the second expert, the failure modes are ranked in the same order for the (6th, 8th, and 9th), (4th and 25th), and so on. This issue can also be seen by third and fourth experts, resulting in a fundamental flaw in the risk analysis process.
Using the geometric average method (GAM) to prioritize high-risk failures is one of the most common strategies to solve this issue in traditional FMEA. Figure 10 shows the results of the conventional RPN based on GAM-FMEA from the expert’s assessment. Although this method has been able to address some of the shortcomings of the classical-FMEA (67 failure modes categorized into 59 classes), several of the failure modes still have the same RPN and rank values. The 4th and 33rd, 32nd and 60th, 1st and 44h failure modes, etc. are in the same classes. Therefore, to solve this outcome of classical and GAM- FMEAs, we have examined the potential of the intelligent models based on FMEA for classifying the failure modes during the risk analysis process.

4.2. Intelligent- FMEA Results

In this subsection, the ability of three intelligent models such as FIS, ANFIS, and SVM-based FMEA to create a maximum class of risks for the edible oil purification process are examined. The results of the FIS-FMEA model based on three fuzzy scale classes are provided in Table 4. First, among the several defuzzification strategies, the centroid method was chosen as having the most potential for producing a maximum fuzzy number class. Various MFs combinations for the three-risk metrics and FIS-RPN (FRPN) of three classes were investigated as a result of this. The CV factor was used as the primary performance criterion to select the optimal combined MFs from 4096 combinations. The average CVs in all MFs for the three, five, and ten classes were 60.70, 53.64, and 50.76, respectively. It means that the 3-class with a high CV can provide maximum risk class numbers while avoiding repetitive clustering. As highlighted, two combinations of MFs in 3-class (27-rule) have greater potential to create 67 class numbers for 67 failure modes than other classes.
In the next step, the ability of the ANFIS-FMEA model for risk clustering of failure modes in the oil purification process was investigated in Table 5. For this purpose, the default values of the ANFIS network such as influential radius (IR), squash factor (SF), accept ratio (AR), and reject ratio (RR) in ANFIS are assumed as 0.5, 1.25, 0.5, and 0.15, respectively. Additionally, in this study, two optimization methods such as hybrid and backpropagation were used for parameter training of membership functions. Following this, the performance of the ANFIS-FMEA model for risk clustering, under some well-known performance criteria, was evaluated. As seen, although most of the ANFIS optimization methods can create maximum risk clusters (67 failure modes in 67 clusters) in different fuzzy number classes, the hybrid model considering 5-class (125-rule) and 30 number epochs has been very successful in predicting the actual valves with the lowest errors (RMSE = 4.01 and MAPE = 4.25). To get better insight, Figure 11 shows that the total values of RMSE and MAPE (%) for the hybrid model with 5-class are lower than other fuzzy number classes and ANFIS models.
Furthermore, the results of the SVM-FMEA algorithm as another intelligent model for risk analysis and to create the maximum risk clustering are presented in Table 6. As observed, the SVM algorithms such as sequential minimal optimization (SMO) and iterative single data algorithm (ISDA) can classify the 67 failure modes into 67 risk clusters. However, the ISDA algorithm using the polynomial-kernel function has higher accuracy to predict the actual values. In other words, this algorithm has been very effective in classifying the failure modes with the lowest errors (RMSE = 7.30 and MAPE = 13.19) and the highest performance (EF: 99%).

4.3. Comparison Results

Figure 12 shows a comparison between the intelligent models such as FIS (Figure 12a), ANFIS (Figure 12b) and SVM (Figure 12c), and classical-FMEAs to identify the best model for raking the failures in an edible oil purification plant. As shown, the rank value of the SVM algorithm overlaps fairly well with the rank value of the classic model for most failure modes with that of other intelligent models. The error indices such as MAPE for FIS, ANFIS, and SVM were obtained as 21%, 4.64%, and 3.02%, respectively, and the values for RMSE were equal to 5.73, 2.85, and 1.12, respectively, to predict the classical rank value. Hence, it can be concluded that the SVM-FMEA model has a great potential for ranking all failure modes accurately with the lowest errors compared to other intelligent models. In the following, through the feedback of such model, a sensitivity analysis of risk parameters and alternatively the appropriate maintenance tasks were surveyed.

4.4. Sensitivity Analysis

To study the impact of risk parameters (S, O, D) on SVM-RPN in the edible oil purification process, a sensitivity analysis was performed. For example, in risk parameters, the S index represents the severity of the failure on the equipment or its impact on the entire process. The O index represents the chance of failure occurrence, and the D index represents how likely it is to identify the occurred failures. Figure 13 depicts the findings of the sensitivity analysis as surface plots. As shown in Figure 13a, the S index has a higher impact on the risk parameter than the O index because the slope change of SVM-RPN due to changes in the S (46°) index is greater than that due to changes in the O (18°) index. It means that the D index is the meaningful factor on the risk changes in the edible oil purification process. As a consequence, to improve the possibility of detecting the failures and to reduce the probability of failures, fault diagnosis tools and warning signs could be suggested for the edible oil purification process.

4.5. Maintenance Activity

In this section, based on the best intelligent-FMEA model, the appropriate maintenance activities for the edible oil purification process were provided. Based on the results, the failure of bearings in separators and the failure of vanes and shafts in pumps were identified with the highest RPN values, e.g., 421, 409 and 391 as well as primary ranks, e.g., 1, 2 and 3, respectively. Because bearings are critical to achieving high operational dependability in separators, adopting robust inspection procedures and non-destructive tests weekly could be recommended. Furthermore, the majority of the operations in the purification process are associated with centrifugal pumps for moving fluids such as water and oils. As a result, appropriate maintenance chores such as monthly services such as checking lubricant levels and bearing operating temperature, vibration analysis of shafts, and changing the vanes and axis of shafts could be performed from quarterly to monthly. The failure of hydro-pneumatic valves and sensors in chillers, as well as the failure of programmable logic controller (PLC) circuits, were ranked as the second class and RPNs, respectively. The failure of O-rings and seals in hydro-pneumatic systems is the main cause of leakages due to the high pressure in the process. As a result, the key maintenance tasks may include increasing the frequency of O-ring and seal replacements from monthly to twice-weekly, utilizing higher-quality materials. The majority of sensors’ failures in chillers are caused by excessive usage or function. As a result, a monthly replacement could be appointed. Meanwhile, different capability tests and well-timed inspections for PLCs, and timely replacement of the cables and wires could be taken before an irreparable fault occurs. As a result, the aforementioned maintenance operations would assist engineers in detecting and preventing unforeseen problems, resulting in increased safety and dependability in the edible oil purification process.

5. Conclusions

This paper aimed to improve an intelligent-FMEA model for analyzing the risk and comparing the outcomes with the classical-FMEA, in the edible oil industries. To overcome the classical FMEA drawbacks, some well-known intelligent models such as FIS structure, ANFIS, and SVM models were carried out for risk analysis. To evaluate the accuracy prediction, the CV (%) factor for FIS structure, and some performance criteria such as RMSE, MAPE (%), and EF (%) for ANFIS and SVM models, were performed. Additionally, to determine the risk parameters and RPNs for the failure modes in the edible oil purification process, a knowledge-based approach was adapted. The results revealed that the 3-class (27-rule) in the FIS structure, and the 5-class (125-rule) in the hybrid-ANFIS network have high potential to create maximum risk number cluster of failure modes. Moreover, the results of the SVM algorithm indicated the ISDA algorithm using polynomial-kernel function has higher accuracy to predict the actual values and classify the failure modes. Based on the performance indicators, the SVM-FMEA algorithm has a great potential for ranking all failure modes accurately with the lowest errors compared to other intelligent models. According to the results of the 3-D sensitivity study, the detection index is more successful on SVM-RPN variation than on occurrence and severity. Finally, the authoritative control for the equipment with the highest risk within the edible oil purification was recommended through maintenance and inspection activities. In this study, knowledge-based methods for diagnosing failures and risk assessment were proposed due to a lack of sufficient and reliable operational data. As a result, future research can be expanded to evaluate and improve the accuracy of the proposed approach by establishing a trustworthy database in edible oil purification plants. Furthermore, the use of other hybrid models with data-driven based methods to automate risk monitoring within food processing systems can be recommended.

Author Contributions

Conceptualization, H.S., M.K.; methodology, H.S., M.K., J.T.F. and J.E.d.A.e.P.; software, H.S., M.K., J.T.F. and J.E.d.A.e.P.; validation, H.S., M.K., J.T.F. and J.E.d.A.e.P.; formal analysis, H.S., M.K., J.T.F. and J.E.d.A.e.P.; investigation, H.S., M.K., J.T.F. and J.E.d.A.e.P.; resources, H.S., M.K., J.T.F. and J.E.d.A.e.P.; data curation, H.S., M.K., J.T.F. and J.E.d.A.e.P.; writing—original draft preparation, H.S., M.K., J.T.F. and J.E.d.A.e.P.; writing—review and editing, H.S., M.K., J.T.F. and J.E.d.A.e.P.; visualization, H.S., M.K., J.T.F. and J.E.d.A.e.P.; supervision, H.S., M.K., J.T.F. and J.E.d.A.e.P.; project administration, H.S., M.K., J.T.F. and J.E.d.A.e.P.; funding acquisition, H.S., M.K., J.T.F. and J.E.d.A.e.P. All authors have read and agreed to the published version of the manuscript.

Funding

This research project was supported and funded by the Ferdowsi University of Mashhad, Iran (No.FUM-52316). Additionally, the research leading to these results has received funding from the European Union’s Horizon 2020 research and innovation program, under the Marie Sklodowvska-Curie grant agreement 871284 project SSHARE, the European Regional Development Fund (ERDF) through the Operational Programme for Competitiveness and Internationalization (COMPETE 2020), under Project POCI-01-0145-FEDER-029494, and by National Funds through the FCT—Portuguese Foundation for Science and Technology, under Projects PTDC/EEI-EEE/29494/2017, UIDB/04131/2020, and UIDP/04131/2020.

Institutional Review Board Statement

Not applicable.

Informed Consent Statement

Not applicable.

Data Availability Statement

The data that support the findings of this study are available from the corresponding author, upon reasonable request.

Acknowledgments

The authors gratefully acknowledge the financial support from the Ferdowsi University of Mashhad, Iran (No.FUM-52316). Additionally, the research leading to these results has received funding from the European Union’s Horizon 2020 research and innovation program, under the Marie Sklodowvska-Curie grant agreement 871284 project SSHARE, the European Regional Development Fund (ERDF) through the Operational Programme for Competitiveness and Internationalization (COMPETE 2020), under Project POCI-01-0145-FEDER-029494, and by National Funds through the FCT—Portuguese Foundation for Science and Technology, under Projects PTDC/EEI-EEE/29494/2017, UIDB/04131/2020, and UIDP/04131/2020.

Conflicts of Interest

The authors declare no conflict of interest for this article.

References

  1. Chen, R.Y. Autonomous tracing system for backward design in the food supply chain. Food Control 2015, 51, 70–84. [Google Scholar] [CrossRef]
  2. Papadopoulos, A.I.; Seferlis, P. Automation for the sustainable food industry: Computer-aided analysis and control engineering methods. In Robotics and Automation in the Food Industry; Woodhead Publishing: Cambridge, UK, 2013; pp. 441–485. [Google Scholar]
  3. Rahimifard, S.; Woolley, E.; Webb, D.P.; Garcia-Garcia, G.; Stone, J.; Jellil, A.; Gimenez-Escalante, P.; Jagtap, S.; Trollman, H. Forging new frontiers in sustainable food manufacturing. In International Conference on Sustainable Design and Manufacturing; Springer: Berlin/Heidelberg, Germany, 2017; pp. 13–24. [Google Scholar]
  4. Yi, Y.; Ke, Z.; Yi, C. An implementation of intelligent monitoring system for food processing. In Proceedings of the 2010 8th World Congress on Intelligent Control and Automation, Jinan, China, 7–9 July 2010; pp. 4225–4230. [Google Scholar]
  5. Khan, Z.H.; Khalid, A.; Iqbal, J. Towards realizing robotic potential in future intelligent food manufacturing systems. Innov. Food Sci. Emerg. Technol. 2018, 48, 11–24. [Google Scholar] [CrossRef] [Green Version]
  6. Abbas, H.; Maennel, O.; Assar, S. Security and Privacy Issues in Cloud Computing; Springer: Berlin/Heidelberg, Germany, 2017. [Google Scholar]
  7. Iqbal, W.; Abbas, H.; Daneshmand, M.; Rauf, B.; Abbas, Y. An In-Depth Analysis of IoT Security Requirements, Challenges and their Countermeasures via Software Defined Security. IEEE Internet Things J. 2020, 7, 10250–10276. [Google Scholar] [CrossRef]
  8. Carbone, T.A.; Tippett, D.D. Project risk management using the project risk FMEA. Eng. Manag. J. 2004, 16, 28–35. [Google Scholar] [CrossRef]
  9. Bahill, A.T.; Smith, E.D. An industry standard risk analysis technique. Eng. Manag. J. 2009, 21, 16–29. [Google Scholar] [CrossRef] [Green Version]
  10. Chemweno, P.; Pintelon, L.; Muchiri, P.N.; Van Horenbeek, A. Risk assessment methodologies in maintenance decision making: A review of dependability modelling approaches. Reliab. Eng. Syst. Saf. 2018, 173, 64–77. [Google Scholar] [CrossRef]
  11. Alzghoul, A.; Backe, B.; Löfstrand, M.; Byström, A.; Liljedahl, B. Comparing a knowledge-based and a data-driven method in querying data streams for system fault detection: A hydraulic drive system application. Comput. Ind. 2014, 65, 1126–1135. [Google Scholar] [CrossRef]
  12. Soltanali, H.; Garmabaki, A.H.; Thaduri, A.; Parida, A.; Kumar, U.; Rohani, A. Sustainable production process: An application of reliability, availability, and maintainability methodologies in automotive manufacturing. Proc. Inst. Mech. Eng. Part O J. Risk Reliab. 2019, 233, 682–697. [Google Scholar] [CrossRef] [Green Version]
  13. Soltanali, H.; Rohani, A.; Abbaspour-Fard, M.H.; Farinha, J.T. A comparative study of statistical and soft computing techniques for reliability prediction of automotive manufacturing. Appl. Soft Comput. 2020, 98, 106738. [Google Scholar] [CrossRef]
  14. Cho, W.I.; Lee, S.J. Fault tree analysis as a quantitative hazard analysis with a novel method for estimating the fault probability of microbial contamination: A model food case study. Food Control 2020, 110, 107019. [Google Scholar]
  15. Song, Y.H.; Yu, H.Q.; Lv, W. Risk analysis of dairy safety incidents in China. Food Control 2018, 92, 63–71. [Google Scholar] [CrossRef]
  16. Venkatasubramanian, V.; Rengaswamy, R.; Kavuri, S.N. A review of process fault detection and diagnosis: Part II: Qualitative models and search strategies. Comput. Chem. Eng. 2003, 27, 313–326. [Google Scholar] [CrossRef]
  17. Soltanali, H.; Rohani, A.; Tabasizadeh, M.; Abbaspour-Fard, M.H.; Parida, A. An improved fuzzy inference system-based risk analysis approach with application to automotive production line. Neural Comput. Appl. 2019, 32, 10573–10591. [Google Scholar] [CrossRef]
  18. Huang, J.; Xu, D.H.; Liu, H.C.; Song, M.S. A new model for failure mode and effect analysis integrating linguistic Z-numbers and projection method. IEEE Trans. Fuzzy Syst. 2019, 29, 530–538. [Google Scholar] [CrossRef]
  19. Dağsuyu, C.; Göçmen, E.; Narlı, M.; Kokangül, A. Classical and fuzzy FMEA risk analysis in a sterilization unit. Comput. Ind. Eng. 2016, 101, 286–294. [Google Scholar] [CrossRef]
  20. Silva, M.M.; de Gusmão, A.P.; Poleto, T.; e Silva, L.C.; Costa, A.P. A multidimensional approach to information security risk management using FMEA and fuzzy theory. Int. J. Inf. Manag. 2014, 34, 733–740. [Google Scholar] [CrossRef]
  21. Soltanali, H.; Rohani, A.; Abbaspour-Fard, M.H.; Parida, A.; Farinha, J.T. Development of a risk-based maintenance decision making approach for automotive production line. Int. J. Syst. Assur. Eng. Manag. 2020, 11, 236–251. [Google Scholar] [CrossRef]
  22. Ozilgen, S. Failure Mode and Effect Analysis [FMEA] for confectionery manufacturing in developing countries: Turkish delight production as a case study. Food Sci. Technol. 2012, 32, 505–514. [Google Scholar] [CrossRef] [Green Version]
  23. Arvanitoyannis, I.S.; Varzakas, T.H. Application of failure mode and effect analysis [FMEA], cause and effect analysis and Pareto diagram in conjunction with HACCP to a potato chips manufacturing plant. Int. J. Food Sci. Technol. 2007, 42, 1424–1442. [Google Scholar] [CrossRef]
  24. Varzakas, T.H.; Arvanitoyannis, I.S. Application of ISO22000 and Failure Mode and Effect Analysis [fmea] for Industrial Processing of Poultry Products. In International Conference on Computer and Computing Technologies in Agriculture; Springer: Boston, MA, USA, 2008; pp. 1783–1795. [Google Scholar]
  25. Arvanitoyannis, I.S.; Varzakas, T.H. Application of ISO 22000 and failure mode and effect analysis [FMEA] for industrial processing of salmon: A case study. Crit. Rev. Food Sci. Nutr. 2008, 48, 411–429. [Google Scholar] [CrossRef] [PubMed]
  26. Ebenezer, I.A.; Devadasan, S.R.; Sreenivasa, C.G.; Murugesh, R. Total failure mode and effects analysis in tea industry: A theoretical treatise. Total Qual. Manag. Bus. Excell. 2011, 22, 1353–1369. [Google Scholar] [CrossRef]
  27. Kurt, L.; Ozilgen, S. Failure mode and effect analysis for dairy product manufacturing: Practical safety improvement action plan with cases from Turkey. Saf. Sci. 2013, 55, 195–206. [Google Scholar] [CrossRef]
  28. Trafialek, J.; Kolanowski, W. Application of failure mode and effect analysis [FMEA] for audit of HACCP system. Food Control 2014, 44, 35–44. [Google Scholar] [CrossRef]
  29. Özilgen, S.; Özilgen, M. General Template for the FMEA Applications in Primary Food Processing. In Measurement, Modeling and Automation in Advanced Food Processing; Springer: Berlin/Heidelberg, Germany, 2016; pp. 29–69. [Google Scholar]
  30. Varzakas, T.H.; Arvanitoyannis, I.S. Application of Failure Mode and Effect Analysis [FMEA], cause and effect analysis, and Pareto diagram in conjunction with HACCP to a corn curl manufacturing plant. Crit. Rev. Food Sci. Nutr. 2007, 47, 363–387. [Google Scholar] [CrossRef] [PubMed]
  31. Varzakas, T.; Manolopoulou, E. Comparison of HACCP and ISO 22000 in the ready-to-eat fruit and vegetable industry in conjunction with application of failure mode and effect analysis [FMEA] and Ishikawa diagrams. In Minimally Processed Refrigerated Fruits and Vegetables; Springer: Boston, MA, USA, 2017; pp. 685–721. [Google Scholar]
  32. Rezaee, M.J.; Yousefi, S.; Valipour, M.; Dehdar, M.M. Risk analysis of sequential processes in food industry integrating multi-stage fuzzy cognitive map and process failure mode and effects analysis. Comput. Ind. Eng. 2018, 123, 325–337. [Google Scholar] [CrossRef]
  33. Przystupa, K. The methods analysis of hazards and product defects in food processing. Czech J. Food Sci. 2019, 37, 44–50. [Google Scholar] [CrossRef]
  34. Joshi, A.V. Machine Learning and Artificial Intelligence; Springer: Berlin/Heidelberg, Germany, 2020. [Google Scholar]
  35. Mello, R.F.; Ponti, M.A. Machine Learning: A Practical Approach on the Statistical Learning Theory; Springer: Berlin/Heidelberg, Germany, 2018. [Google Scholar]
  36. Kanimozhi, U.; Ganapathy, S.; Manjula, D.; Kannan, A. An intelligent risk prediction system for breast cancer using fuzzy temporal rules. Natl. Acad. Sci. Lett. 2019, 42, 227–232. [Google Scholar] [CrossRef]
  37. Kumru, M.; Kumru, P.Y. Fuzzy FMEA application to improve purchasing process in a public hospital. Appl. Soft Comput. 2013, 13, 721–733. [Google Scholar] [CrossRef]
  38. Şimşek, B.; Ic, Y.T. Fuzzy failure mode and effect analysis application to reduce risk level in a ready-mixed concrete plant: A fuzzy rule based system modelling approach. Math. Comput. Simul. 2020, 178, 549–587. [Google Scholar] [CrossRef]
  39. Yucesan, M.; Gul, M.; Celik, E. A holistic FMEA approach by fuzzy-based Bayesian network and best–worst method. Complex Intell. Syst. 2021, 7, 1547–1564. [Google Scholar] [CrossRef]
  40. Yousefi, S.; Valipour, M.; Gul, M. Systems failure analysis using Z-number theory-based combined compromise solution and full consistency method. Appl. Soft Comput. 2021, 113, 107902. [Google Scholar] [CrossRef]
  41. Rezaee, M.J.; Yousefi, S.; Eshkevari, M.; Valipour, M.; Saberi, M. Risk analysis of health, safety and environment in chemical industry integrating linguistic FMEA, fuzzy inference system and fuzzy DEA. Stoch. Environ. Res. Risk Assess. 2020, 34, 201–218. [Google Scholar] [CrossRef]
  42. Hassan, S.; Wang, J.; Kontovas, C.; Bashir, M. Modified FMEA hazard identification for cross-country petroleum pipeline using Fuzzy Rule Base and approximate reasoning. J. Loss Prev. Process Ind. 2022, 74, 104616. [Google Scholar] [CrossRef]
  43. Araichi, S.; Almulhim, T. Vine copulas and fuzzy inference to evaluate the solvency capital requirement of multivariate dependent risks. Appl. Econ. 2021, 53, 6058–6074. [Google Scholar] [CrossRef]
  44. Ivančan, J.; Lisjak, D. New FMEA Risks Ranking Approach Utilizing Four Fuzzy Logic Systems. Machines 2021, 9, 292. [Google Scholar] [CrossRef]
  45. Sethukkarasi, R.; Ganapathy, S.; Yogesh, P.; Kannan, A. An intelligent neuro fuzzy temporal knowledge representation model for mining temporal patterns. J. Intell. Fuzzy Syst. 2014, 26, 1167–1178. [Google Scholar] [CrossRef]
  46. Priya, P.I.; Ghosh, D.K.; Kannan, A.; Ganapathy, S. Behaviour analysis model for social networks using genetic weighted fuzzy c-means clustering and neuro-fuzzy classifier. Int. J. Soft Comput. 2014, 9, 138–142. [Google Scholar]
  47. Boran, S.; Gökler, S.H. A Novel FMEA Model Using Hybrid ANFIS–Taguchi Method. Arabian J. Sci. Eng. 2020, 45, 2131–2144. [Google Scholar] [CrossRef]
  48. Alawad, H.; An, M.; Kaewunruen, S. Utilizing an Adaptive Neuro-Fuzzy Inference System [ANFIS] for overcrowding level risk assessment in railway stations. Appl. Sci. 2020, 10, 5156. [Google Scholar] [CrossRef]
  49. Ganapathy, S.; Yogesh, P.; Kannan, A. Intelligent agent-based intrusion detection system using enhanced multiclass SVM. Comput. Intell. Neurosci. 2012, 2012, 9. [Google Scholar] [CrossRef] [Green Version]
  50. Vijilious, M.L.; Ganapathy, S.; Bharathi, V.S.; Kannan, A. A Novel Biometric Authentication using Contourlet Transform and Enhanced MSVM. Eur. J. Sci. Res. 2011, 65, 370–376. [Google Scholar]
  51. Efe, M.O. A comparison of ANFIS, MLP and SVM in identification of chemical processes. In Proceedings of the 2009 IEEE Control Applications, (CCA) & Intelligent Control, (ISIC), St. Petersburg, Russia, 8–10 July 2009; pp. 689–694. [Google Scholar]
  52. Okabe, T.; Otsuka, Y. Proposal of a Validation Method of Failure Mode Analyses based on the Stress-Strength Model with a Support Vector Machine. Reliab. Eng. Syst. Saf. 2021, 205, 107247. [Google Scholar] [CrossRef]
  53. Yin, G.; Zhang, Y.T.; Li, Z.N.; Ren, G.Q.; Fan, H.B. Online fault diagnosis method based on incremental support vector data description and extreme learning machine with incremental output structure. Neurocomputing 2014, 128, 224–231. [Google Scholar] [CrossRef]
  54. Mangeli, M.; Shahraki, A.; Saljooghi, F.H. Improvement of risk assessment in the FMEA using nonlinear model, revised fuzzy TOPSIS, and support vector machine. Int. J. Ind. Ergon. 2019, 69, 209–216. [Google Scholar] [CrossRef]
  55. Ayodeji, A.; Liu, Y.K. Support vector ensemble for incipient fault diagnosis in nuclear plant components. Nucl. Eng. Technol. 2018, 50, 1306–1313. [Google Scholar] [CrossRef]
  56. Soltanali, H.; Khojastehpour, M.; Farinha, J.T.; de Almeida e Pais, J.E. An Integrated Fuzzy Fault Tree Model with Bayesian Network-Based Maintenance Optimization of Complex Equipment in Automotive Manufacturing. Energies 2021, 14, 7758. [Google Scholar] [CrossRef]
  57. Farinha, J.M.T. Asset Maintenance Engineering Methodologies; CRC Press: Boca Raton, FL, USA, 2018. [Google Scholar]
  58. Guimarães, A.C.; Lapa, C.M. Fuzzy inference to risk assessment on nuclear engineering systems. Appl. Soft Comput. 2007, 7, 17–28. [Google Scholar] [CrossRef]
  59. Preyssl, C. Safety risk assessment and management—The ESA approach. Reliab. Eng. Syst. Saf. 1995, 49, 303–309. [Google Scholar] [CrossRef]
  60. Yazdi, M.; Soltanali, H. Knowledge acquisition development in failure diagnosis analysis as an interactive approach. Int. J. Interact. Des. Manuf. (IJIDeM) 2019, 13, 193–210. [Google Scholar] [CrossRef] [Green Version]
  61. Chanamool, N.; Naenna, T. Fuzzy FMEA application to improve decision-making process in an emergency department. Appl. Soft Comput. 2016, 43, 441–453. [Google Scholar] [CrossRef]
  62. Gerek, I.H. House selling price assessment using two different adaptive neuro-fuzzy techniques. Autom. Constr. 2014, 41, 33–39. [Google Scholar] [CrossRef]
  63. Benkedjouh, T.; Medjaher, K.; Zerhouni, N.; Rechak, S. Remaining useful life estimation based on nonlinear feature reduction and support vector regression. Eng. Appl. Artif. Intell. 2013, 26, 1751–1760. [Google Scholar] [CrossRef]
  64. Soltanali, H.; Nikkhah, A.; Rohani, A. Energy audit of Iranian kiwifruit production using intelligent systems. Energy 2017, 139, 646–654. [Google Scholar] [CrossRef]
  65. Kutyłowska, M. Neural network approach for failure rate prediction. Eng. Fail. Anal. 2015, 47, 41–48. [Google Scholar] [CrossRef]
Figure 1. The proposed framework of the FMEA model.
Sustainability 14 01083 g001
Figure 2. Production and processing of edible solid and liquid oils.
Sustainability 14 01083 g002
Figure 3. A schematic of the neutralization process: storage oil tank (1), exchanger (2), mixer (3), pump (4), separator (5), valve (6), dryer (7), water tank (8), sulfuric acid tank (9).
Sustainability 14 01083 g003
Figure 4. A schematic of the discoloration process: storage oil tank (1), exchanger (2), mixer (3), pulverizing tank (4), filtering tank (5), discoloration oil tank (6).
Sustainability 14 01083 g004
Figure 5. A schematic of the winterizing process: storage oil tank (1), exchanger (2), crystallization (3), exchanger tube shell (4), filtering tank (5), heater (6), keratinization (7), winterize oil (8).
Sustainability 14 01083 g005
Figure 6. A schematic of the deodorizing process: exchanger (1), deaerator (2), deodorizing bridge (3), scrubber (4), a vacuum system (5), CIP tank (6), antioxidant tank (7), deodorized oil tank (8).
Sustainability 14 01083 g006
Figure 7. The structure of the FIS environment was adapted from MATLAB Software vR2020b.
Sustainability 14 01083 g007
Figure 8. ANFIS network structure.
Sustainability 14 01083 g008
Figure 9. SVM algorithm structure.
Sustainability 14 01083 g009
Figure 10. The results of RPN value based on GAM- FMEA.
Sustainability 14 01083 g010
Figure 11. Total values of RMSE and MAPE (%) for two ANFIS models in three fuzzy classes.
Sustainability 14 01083 g011
Figure 12. The comparison of failure mode ranking values between (a) classical-FMEA and Fuzzy model, (b) classical-FMEA and ANFIS model, and (c) classical-FMEA and SVM model.
Sustainability 14 01083 g012
Figure 13. Risk parameters surface plots vs. SVM-RPN: (a) SVM-RPN slope change due to S parameter variations, (b) SVM-RPN slope change due to O parameter variations, and (c) SVM-RPN slope change due to D parameter variations.
Sustainability 14 01083 g013
Table 1. A summary of literature review for FMEA applications in food industries.
Ref.YearPlant/
Process
Fault Diagnosis-Based ModelMaintenance
Activity
FMEA ModelComputational/
Intelligent Model
Sensitivity Analysis
[23]2007Chips manufacturing plantClassical PFMEA- - -
[30]2007Corn curl manufacturingClassical PFMEA- - -
[25]2008Salmon processing and packingClassical PFMEA- - -
[24]2009Poultry product processingClassical PFMEA- - -
[26]2011Tea processing plantClassical TFMEA- - -
[22]2012Confectionery manufacturingClassical PFMEA- - -
[27]2013Dairy products manufacturingClassical PFMEA- - -
[28]2014Bakery critical equipmentClassical PFMEA- - -
[29]2016General study PFMEAFuzzy set theory - -
[31]2017Vegetable processingPFMEAFuzzy set theory - -
[32]2018Meat production and processingPFMEAFuzzy inference system - -
[33]2019General studyClassical PFMEA- - -
Current studyEdible oil industryPFMEAFuzzy inference system, ANFIS & SVM
Table 2. The classical FMEA result of S, O, D, RPN values.
SystemFMExpert 1Expert 2Expert 3Expert 4
SODRPNSODRPNSODRPNSODRPN
Tanks142432315153242443448
242432515253444852440
38673361078560657210756210
42241653230222832530
Pumps510684801048320878448968432
610483201058400878448968432
7101055001082160882128893216
810521001085400864192972126
Separators91058400105840010584001069540
10106848010663601046240854160
1110382407153510166082580
12105525010832401045200965270
1310584009382161048320847224
Filters14103412010351501063180973189
15107535010552501053150962108
1610212010414094310893254
Chillers17103260845160838192937189
181037210957315857280938216
1910695409510450938216848256
2084412810753501084320944144
Mixers2119545104728010573501066360
222745684722473363872112
23365905173551735876336
244941441042801053150865240
Dryers25731211031308234882232
2673363831248234892236
277351059552256437273242
28732421031305412082116
2953115531156211253115
306335410531506222474256
31621121011106211282116
325334551156424853230
Boilers33411410313010326082116
3441145311510326051315
35103130103130103260102480
36722281035150103260854160
3772456512107336383372
38943108525507348442432
39834961045200834961045200
40105315010753508541601074280
4122142112532302136
4210621201071701071701072140
43104280103130103130105150
Compressors44102120931279312792236
451028160103824010361801035150
468312410341209338182232
47623368531208614876284
4861212811864124753105
498349685416084264934108
507662521058400946216856240
Vacuum system5164248105210097163663108
527531051074280982144773147
5361318521106323662112
541033901054200882128863144
5510414010515098214494272
56864192105315098214486296
578552001055250984288864192
Exchangers581010110010717098172972126
591065300105735074384865240
Pipes603319351152834826448
6133195741402846426448
PLCs62977441986432958360955225
638572809663241068480976378
Valves64852801051508439653224
65854160854160854160547140
66582805828058312083372
6784264842648439643224
Table 3. The same RPN value issue of classical FMEA.
FMRPN
Expert 1
FMRPN
Expert 2
FMRPN
Expert 3
FMRPN
Expert 4
(6, 8, 9, 50)400(6, 8, 9, 50)400(5, 6)448(5, 6)432
(20, 50, 40, 59)350(20, 40, 59)350(13, 20)320(24, 50, 59)240
(21, 52, 15, 57)280(52, 21)280(19, 50)216(7, 18)216
(15, 57)250(15, 57)250(8, 17)192(14, 17)189
(12, 45)240(12, 45)240(14, 45)180(10, 36)160
(39, 45)200(39, 54)200(40, 65)160(20, 54)144
(7, 17, 49, 65)160(17, 49, 56)160(15, 24)150(42, 65)140
(38, 55, 64)50(14, 30, 36, 56)150(52, 55, 56)144(15, 49, 51)108
(11, 23)35(46, 47)120(7, 54)128(11, 35)80
(4, 25, 28, 33, 35, 43)30(24, 66)80(39, 64)96(37, 55, 66)72
(42, 58)70(38, 59)84(1, 60, 61)48
(1, 29, 34, 60)15(27, 58)72(26, 44)36
(31, 37, 53)10(49, 61)64(25, 38, 46)32
(22, 37, 51)63(4, 32)30
(11, 33, 34, 35, 36)60(28, 31, 33)16
(2, 25, 26, 32, 47, 60)48(29, 34)15
(41, 43)30
(1, 30, 48)24
(29, 31)12
Table 4. The optimal MFs combination for risk clustering based on the FIS-FMEA model.
Number of ClassesNumber of RulesSODFRPNCV (%)Number of
Cluster
3-class(27)PsigmfGauss2mfDsigmfTrimf58.3067
DsigmfGauss2mfDsigmfTrimf58.3067
TrapmfDsigmfGaussmfDsigmf56.9466
5-class (125)TrimfGauss2mfPsigmfTrimf56.7766
TrimfGauss2mfPsigmfTrapmf56.7766
TrimfGauss2mfPsigmfGaussmf56.7766
10-class(1000)TrimfGbellmfGaussmfGbellmf56.4264
TrapmfGbellmfGaussmfGbellmf56.4264
Gauss2mfGaussmfGaussmfTrapmf57.4464
Table 5. The optimal performance criteria for risk clustering based on the ANFIS-FMEA model.
Optimization
Method
Number
of Class
Number
of Rule
Number
of Epoch
RMSEMAPE (%)EF (%)Number of
Cluster
TrainTestTotalTrainTestTotalTrainTestTotal
Hybrid model3-class(27)105.845.757.0811.8512.1513.0999.0099.0099.0067
(27)204.794.576.2710.6010.0111.8899.0099.0099.0067
(27)303.843.235.198.436.929.3099.0099.0099.0067
5-class(125)103.924.316.036.087.196.1999.0099.0099.0067
(125)203.143.695.084.608.275.3099.0099.0099.0067
(125)302.113.024.011.817.784.2599.0099.0099.0067
10-class(1000)101.353.806.332.628.166.4999.0099.0099.0067
(1000)201.083.616.571.988.056.1399.0099.0099.0067
(1000)300.913.295.511.617.754.8199.0099.0099.0067
Back propagation3-class(27)107.507.138.958.8019.4616.2999.0099.0099.0067
(27)206.458.619.037.7120.2515.1999.0099.0099.0067
(27)306.039.219.207.2321.0915.1099.0099.0099.0067
5-class(125)107.397.407.569.5316.239.7199.0099.0099.0067
(125)205.326.616.487.1115.018.0099.0099.0099.0067
(125)304.726.806.376.2014.927.4299.0099.0099.0067
10-class(1000)102.662.554.916.762.996.1599.0099.0099.0067
(1000)202.572.694.886.493.135.9799.0099.0099.0067
(1000)302.492.824.866.223.245.8099.0099.0099.0067
Table 6. The optimal performance criteria for risk clustering based on the SVM-FMEA model.
Solver AlgorithmKernel
Function
RMSEMAPE (%)EF (%)Number of
Cluster
TrainTestTotalTrainTestTotalTrainTestTotal
SMO algorithmGaussian9.6123.4415.1315.9154.0327.2999.0095.0098.0067
Linear28.2541.3732.7241.9112466.420.940.850.9267
Rbf9.6523.7015.2615.9455.5227.6799.0095.0098.0067
Polynomial9.4318.1812.6914.0568.9130.4399.0097.0099.0067
ISDA algorithmGaussian8.3621.0013.4417.0830.7321.1699.0096.0099.0067
Linear98.8399.9599.16167.3161.0165.40.260.120.2267
Rbf7.7719.4812.4715.3726.1818.6099.0099.0099.0067
Polynomial7.307.317.3014.0411.1713.1999.0099.0099.0067
Publisher’s Note: MDPI stays neutral with regard to jurisdictional claims in published maps and institutional affiliations.

