Article

Leadership in Romanian Small to Medium Enterprises

1
Department of Economics and Economic Policies, Bucharest University of Economic Studies, Calea Dorobantilor 15-17, Bucharest 010552, Romania
2
Department of Management, Bucharest University of Economic Studies, Calea Dorobantilor 15-17, Bucharest 010552, Romania
3
Department of Business Administration, Bucharest University of Economic Studies, Calea Dorobantilor 15-17, Bucharest 010552, Romania
4
Institute of Space Science (ISS), 409 Atomistilor Street, Bucharest-Magurele 077125, Romania
*
Author to whom correspondence should be addressed.
Sustainability 2015, 7(4), 4183-4198; https://0-doi-org.brum.beds.ac.uk/10.3390/su7044183
Submission received: 28 November 2014 / Revised: 11 March 2015 / Accepted: 20 March 2015 / Published: 10 April 2015

Abstract

:
We have conducted a broad statistical research on Romanian small to medium enterprises (SMEs), with the goal of better understanding: (1) the incipient organizational culture of a recently-opened East European market; and (2) the role of leadership in increasing the competitiveness of SMEs. The paper studies the perceived characteristics of a leader and their influence on the organization’s results (as seen by employees), and it tries to reveal the subliminal inter-correlations among these characteristics. The method is factor analysis (implemented in SPSS), for a questionnaire with 23 items, answered by 930 subjects on a five-point Likert scale. The six factors identified by our analysis were: adaptability; cooperation; authority; charisma; confidence; motivation. By highlighting these basic components, our study aims both at increasing competitiveness in Romanian enterprises and at designing better training programs for managers and entrepreneurs acting on East European markets, adapted to the real characteristics of these young economic environments.

1. Introduction

The competitiveness of small to medium enterprises (SMEs) is a key indicator of the health of an economy, and the young open markets of East European countries make no exception. A rigorous analysis of management and leadership could bring significant insight into the development of SMEs, explaining the positive or negative change from a competitive level to another [1].
According to [2], there are seven C’s of leadership, meaning seven important topics to be addressed by any knowledge management study, namely: context, competence, culture, communities, conversations and common language, communications, coaching. The 23-item questionnaire used for our analysis covers all of these areas, while the factor analysis presented below reveals interesting correlations between variables apparently belonging to different topics.
The research in [3] has focused on motives, personal traits, knowledge and skills, behavior, habits, style and competence. Without any doubt, these are general attributes of leadership, allowing for increased performance and success, e.g., credibility is an essential ingredient for successful leadership, an attribute that requires permanent nourishment [4,5].
The rapidly changing economic environment in the aftermath of the financial crisis requires new management practices, an increased competition and shorter life cycles, moving the accent towards organizational knowledge [6]. A new concept has emerged in the literature, “knowledge leadership”. According to this new concept, both managers’ and leaders’ qualities are merged into the so-called knowledge leaders, able to integrate knowledge management systems into economic environments [7].
Knowledge leadership and knowledge management systems could not exist without quantitative methods and particularly without statistical techniques for analyzing large amounts of data. Our paper presents an application of such a quantitative method to leadership development in SMEs, the case study being Romania, a young open East European market.
There is a multitude of similar experimental studies in the literature discussing the attributes of a leader within a community. The human perception of charismatic leaders is analyzed in [8], also through questionnaires. In particular, the study shows that “charisma” relies on different attributes within a civil society, compared to a military organization. Taking the analysis a step further, [9] has found a positive correlation between charismatic leaders and the need for leadership, in the way that subordinates become more dependent in the presence of a charismatic leader. The surprising evolution of the relationship between leadership and “authority” is analyzed in depth by Heifetz in his well-acclaimed book [10], while in [11], other features of a leader are taken into account, like “vision” and “adaptability”, under the greater aim of filling the gap between leadership research and practice. Finally, the essential relationship between culture and leadership received an extensive analysis (both quantitative and qualitative) within the GLOBE (Global Leadership and Organizational Behavior Effectiveness) Project, the most comprehensive study on cross-cultural leadership, using a database of almost 1000 companies ranging over 62 countries and 25 cultures [12,13,14].
A new trend in the literature initiated in [15,16] argues for a change of accent from leader’s personal qualities to the process of leadership. According to the authors, an insurmountable flow of classical leadership theory is the following: “Just as the heroic notion of leadership leads us to relate success and prosperity to individual top managers, it also leads us to explain abuse, deception and oppression with reference to Enron managers, dictators and cold-hearted bureaucrats. With its focus on the positive, the competent and the successful, mainstream leadership literature has left us in the dark where the dark sides of leadership are concerned [15] (p. 84).” Connecting the results of our quantitative analysis to this new paradigm is the goal of our future research.
Factor analysis (FA) is a statistical technique for clustering. Based on covariance and correlation analysis, FA is used to find coherent subsets within a large set of variables, subsets that are relatively independent of one another. Such a subset, comprising strongly correlated variables, is called a factor. FA is not intended for hypotheses testing, nor for deciding whether a group of variables differs significantly from another; we refer the reader to the monograph [17] for a thorough introduction to data analysis using multivariate statistics. We also notice that FA is implemented in every major statistical software package, like SPSS, S-Plus, etc. In SPSS, FA is included as a data reduction technique, with the practical use of cutting a large number of interconnected variables down to a smaller number, prior to the application of a regression technique, e.g., [18]. That is not our intention, for the present study uses FA as a clustering technique for the variables included in a questionnaire concerning the leadership in private companies from an emergent market, the case of Romania. The main goal of the paper is achieved next by interpreting the clusters (factors) in order to draw pertinent conclusions on leadership in Romanian private companies.
Our work is inspired by the so-called Corporate Entrepreneurship Assessment Instrument (CEAI), which represents the state-of-the-art in entrepreneurial psychometric techniques within the North American continent introduced by Hornsby et al. [19,20,21,22,23], also exported with good results to other economical environments [24]. We aim to apply in our research the very core idea of CEAI, which is grouping an exhaustive set of questions concerning the employees’ perspective on leadership into a few clusters, in order to distinguish what is essential and what is redundant in the organizational behavior of Romanian economic entities.
We distributed questionnaires to a large sample of employees of Romanian small and medium enterprises (SMEs), either with national, mixed or foreign capital. The questionnaire was split into several sub-questionnaires corresponding to what the authors consider to be important characteristics of leadership: personality, intelligence, motivation, etc. The questions in each sub-questionnaire are the so-called variables, to be clustered into factors subject to FA. To that end, in-between correlations are calculated for all possible pairs of variables (questions) within a sub-questionnaire and further gathered in a symmetric correlation matrix. Through several iterative steps of threshold reduction and elimination of the variables that load significantly for different factors, the correlation matrix of the variables is transformed into an asymmetric factor-variable correlation matrix, with each factor loading only the variables relevant to that factor.

2. Experimental Section

2.1. Data

For the definition of SME, we have used [25] the European Union (EU) definition based on the number of employees and either turnover or balance sheet total, as presented in Table 1.
Table 1. EU definition of SME.
Company CategoryEmployeesTurnoverBalance Sheet Total
Medium-sized<250≤€ 50 m≤€ 43 m
Small<50≤€ 10 m≤€ 10 m
Micro<10≤€ 2 m≤€ 2 m
We distributed our questionnaire to managers, owners and employees in SMEs activated in Romania, selected from two national official databases [26,27]. Only active companies (with an official income statement and balance sheet) have been considered. The initial sample consisted of 1003 participants that were invited to complete a questionnaire with 23 questions on a Likert scale with answers ranging from “strongly disagree” (1) to “strongly agree” (5). After removing incomplete and improperly completed questionnaires, the sample was cut down to 930; this was the actual sample size used for our FA.
The initial sample included participants from either micro, small or medium enterprises, distributed as in Table 2.
Table 2. Distribution of the sample with respect to company size.
Company sizeRespondents%
Micro (1–9 employees)35635.49
Small (10–49 employees)44744.57
Medium (50–250 employees)2009.94
TOTAL1003100
Participants were sampled from a variety of economic sectors: agriculture, commerce, construction, industry, services and transportation. With respect to ownership of the capital, 829 participants were from private Romanian companies, 144 from private companies with foreign capital acting on the Romanian market, 9 from state-owned companies and 21 from mixed private-state companies; see Table 3.
Table 3. Distribution of the sample with respect to capital and activity field.
Activity FieldCapital
State (0.90%)Mixed (2.09%)Private Romanian (82.65%)Private foreign (14.36%)Total (100%)
Agriculture (2.59%) 25126
Commerce (32.80%) 826853329
Construction (9.37%)2 91194
Industry (8.08%) 5492781
Services (41.18%)7834454413
Transportation (5.98%) 52860
Total (100%)9218291441003
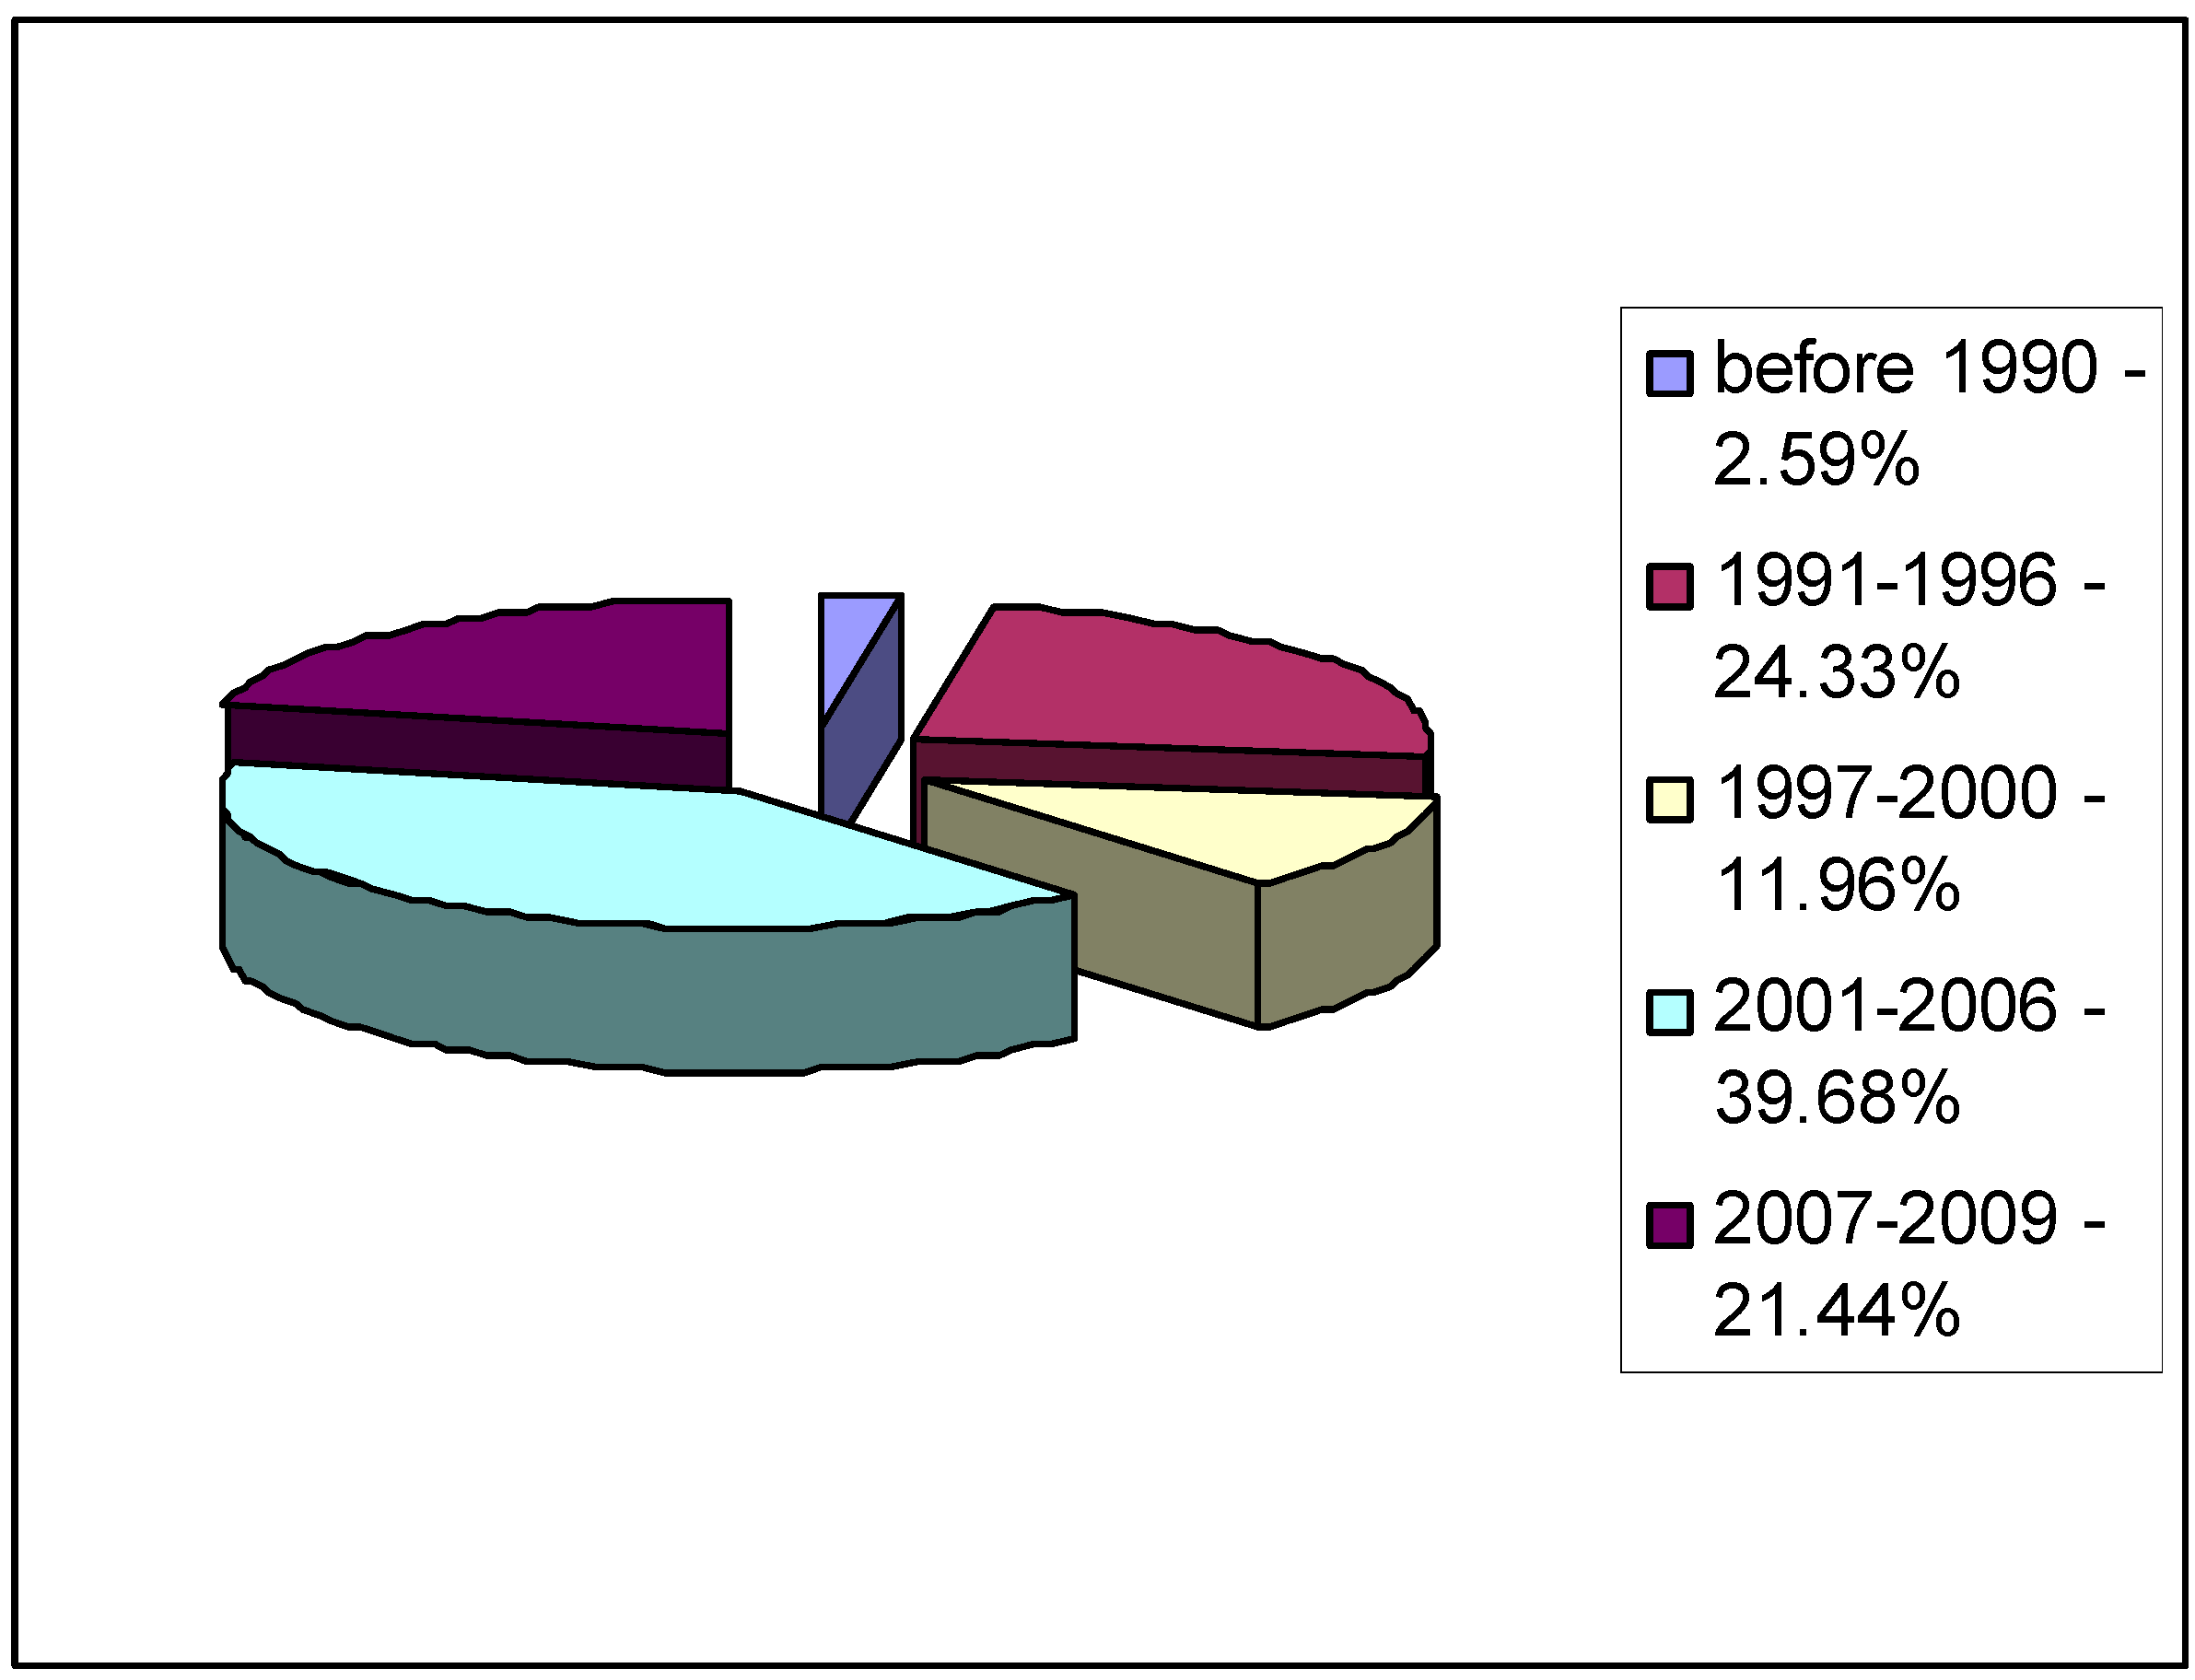
It is also interesting to observe the distribution of the sample with respect to the establishment year of the respondent’s SME, depicted in Figure 1. Notice that 1990 indicates a dramatic turning point for the Romanian economy, which evolved gradually (and sometimes erratically) from the state-owned sector to an open market economy.
Figure 1. Distribution of the sample with respect to the company’s establishment year.
Sustainability 07 04183 g001
More than 50% of participants were between 30 and 45 years of age. The proportions of men and women were almost the same, while more than 50% of respondents were married.

2.2. Method

As already mentioned, FA, with slightly noticeable differences, also referred to in the literature as principal component analysis (PCA), is a statistical technique intensively used for clustering large sets of variables, each cluster being centered on a pivotal element called a factor. As described in [17] (p. 607), “Factors are thought to reflect underlying processes that have created the correlations among variables.” We notice that a somehow similar idea occurs also in finite Markov chains (stochastic processes), namely the method of lumping states of the chain that communicate only within a particular group or cluster [28]. Mathematically, the model is described by the following set of equations [29].
{ X 1 = a 11 F 1 + ... + a 1 m F m + e 1 X 2 = a 21 F 1 + ... + a 2 m F m + e 2 X p = a p 1 F 1 + ... + a p m F m + e p
In Equation (1), the Xi represent the p observed random variables (in our case, p = 23), that are measured for each of the n subjects (in our case n = 930). We assume that each Xi has been standardized, such that Var(Xi) = 1, for all i. The Fi are the m factors to be revealed by the analysis; the aij are the factor loadings, while the ei are the specific errors associated with each variable, respectively.
Assuming that the Fi are random variables with zero mean and variance of one and also that they are independent (nota bene, this is true for varimax, but not for oblique rotation, see below), as well as also assuming the mutual independence of the ei, as well as the independence between Fi and ej for all indices i and j, (1) leads to the following
V a r ( X i ) = k = 1 m a i k 2 + V a r ( e i ) C o v ( X i , X j ) = k = 1 m a i k a j k
which in matrix form reads:
R = A A T + cov ( e )
where R is the so-called correlation matrix. The sum of squared factor loadings in the first relation (2) is called communality, and it represents the variance that a particular variable Xi has in common with all other variables, through the set of common factors Fj. The method of computing communalities will be depicted below.
A major problem for any factor analysis concerns the number of factors that are going to be extracted. A reasonable expectation is to have a (much) smaller number of factors than variables, that is m substantially less than p. In most popular statistical and econometric software (e.g., SPSS [18]), one can either start with a fixed number of factors (a program option to be set by the analyst) or leave the option open, so the number of factors will be determined by the program during the run. In [29], a brief review of the decision criteria on the number of factors is provided:
Eigenvalue: An important indication of the number of factors is given by the number of eigenvalues of matrix R that are larger than one. It is a very simple explanation to support such reasoning, based on the actual meaning of eigenvalues. Namely, eigenvalues of the correlation matrix represent variance; as noticed above, all variables come in standardized form, and thus, each variable contributes to the factor extraction with a variance of one. Thus, a factor associated with an eigenvalue of less than one would mean less than an observed variable, which would be meaningless. In [30] (p. 103), the criterion is validated for a number of variables ranging between 20 and 50, while according to [31] (p. 389), the eigenvalue criterion tends to take too many factors if the number of observed variables is larger than 40.
Scree plot: This is a rather visual criterion, based on a subjective judgment of the graph obtained by plotting the eigenvalues against the factors. Arrange factors in descending order of their eigenvalues, then look for the particular point (factor) where an imaginary line drawn through the points changes its slope, and consider only the factors prior to the slope change. According to [32], a scree test is reliable when the sample size n is large, communality values are high and several variables with high loadings charge to each factor.
Fixed % of variance explained: According to what is commonly used in a specific field, keep as many factors as are required in order to explain 60%, 70%, 80% or 90% of the total variance in the variables.
A priori: If there is an a priori hypothesis concerning the number of factors underlying the data, it is a good idea to start with that number as the initial option of the program. In our case, prior studies on the same 48-variable CEAI provided five factors for the USA [21], respectively eight factors for South Africa [24].
Needless to say, there are also other alternative decision criteria for the number of factors, most of which are included in dedicated software, like SPSS.
Once the factors are extracted, the next step in factor analysis is rotation. In short, this operation provides a kind of centrifugal refinement of the values in the factor loading matrix A. The effect of rotation is to make high correlations larger and low correlations even lower. We exemplify in the following the most commonly-used rotation technique, namely varimax. Denote the factor loading matrix after rotation by A+ and the transformation matrix that is used to perform the rotation by W. According to [17] (p. 620), the elements of W have a geometrical interpretation, being the sines and cosines of some fixed angle w.
W = ( cos ( w ) sin ( w ) sin ( w ) cos ( w ) )
The value of angle w is determined by some heuristic—an optimization algorithm intrinsic to the statistical software. For instance, if the algorithm converges to a value of w = 20°, that means a rotation of 20° of the factor axes around the origin. Rigorously,
A+ = AW
Varimax is an orthogonal rotation technique, in the way that after rotation, the coordinate axes are still perpendicular to each other. If orthogonal rotation does not help, there is also the alternative of oblique rotation (like oblimin), which has the same centrifugal effect on correlations, but at the expense of losing independence (that is, orthogonality) among factors. Nota bene, if the correlations among factors obtained by oblique rotation are high, it is difficult to distinguish the factors from one another, making the choice for the number of factors cumbersome.
Once the rotated matrix A+ is obtained, one can compute the communalities associated with each variable. Communality represents the squared multiple correlation (SMC) of the variable, predicted from the factors. Precisely, “communality is the sum of squared loadings (SSL) for a variable across factors” [17] (p. 621).
In the case of orthogonal rotation, communalities are also used in computing the proportion of variance in the set of variables, respectively the proportion of variance in the solution, accounted for by a factor. For example, the latter one is the SSL for that particular factor, divided by the sum of communalities. The difference between the two is that the proportions of variance in the solution sum to 100%, while the proportions of variance in the set of variables do not usually sum to 100%.
Last, but not least, we mention that each question addressed to the 930 subjects was on a 5-point Likert scale, ranging from “strongly disagree” to “strongly agree”. In order to understand whether the items in the questionnaire are reliably, that is if all of the 23 questions measure the same latent variable, the qualities of a leader in a Romanian economic enterprise (so a Likert scale could be constructed), a Cronbach’s alpha procedure is to be performed in the first place.
Next, after the identification of factors via FA, a similar Cronbach’s alpha procedure could be applied for each factor, in order to confirm its internal consistency.

2.3. Numerical Results

The practical question we address is the following: What is the factor structure of a 23-item questionnaire, concerning leadership attributes in Romanian companies?
To this end, an exploratory factor analysis in SPSS has been carried out, with the principal component extraction method and orthogonal varimax rotation with Kaiser normalization, on the 23-item questionnaire, on a large sample of size n = 930. The participants have responded to a 23-item questionnaire using a 5-point Likert scale with answers ranging from “strongly disagree” (1) to “strongly agree” (5).
Out of the initial 23 variables (items), six exhibited eigenvalues larger than one (see Table 4), so we considered a number of six factors (principal components) for our analysis. The cumulative total variance explained by the six factors is 56.5%. Compared to classical textbook examples [17], this may look not so high. Yet, it is comparable to the total variance explained, as found in Hornsby’s seminal papers: 46% in [21], respectively 57.1% in [20].
Table 4. Total variance explained.
VariableInitial EigenvaluesExtraction Sums of Squared LoadingsRotation Sums of Squared Loadings
Total% of VarianceCumulative %Total% of VarianceCumulative %Total% of VarianceCumulative %
V17.09330.84130.8417.09330.84130.8412.55211.09411.094
V21.4756.41237.2531.4756.41237.2532.32710.11521.209
V31.2335.35942.6131.2335.35942.6132.31710.07631.285
V41.1024.79247.4041.1024.79247.4042.0719.00440.290
V51.0734.66552.0701.0734.66552.0701.9838.62048.910
V61.0214.43856.5071.0214.43856.5071.7477.59856.507
V70.9043.92960.436
V80.8443.67164.107
V90.7833.40367.510
V100.7443.23370.743
V110.6953.02073.764
V120.6572.85676.620
V130.6002.61079.230
V140.5902.56681.796
V150.5772.51084.307
V160.5312.31086.616
V170.5232.27488.890
V180.5012.17791.067
V190.4431.92792.994
V200.4281.86194.855
V210.4101.78196.635
V220.3981.73298.367
V230.3761.633100.000
Extraction method: principal component analysis.
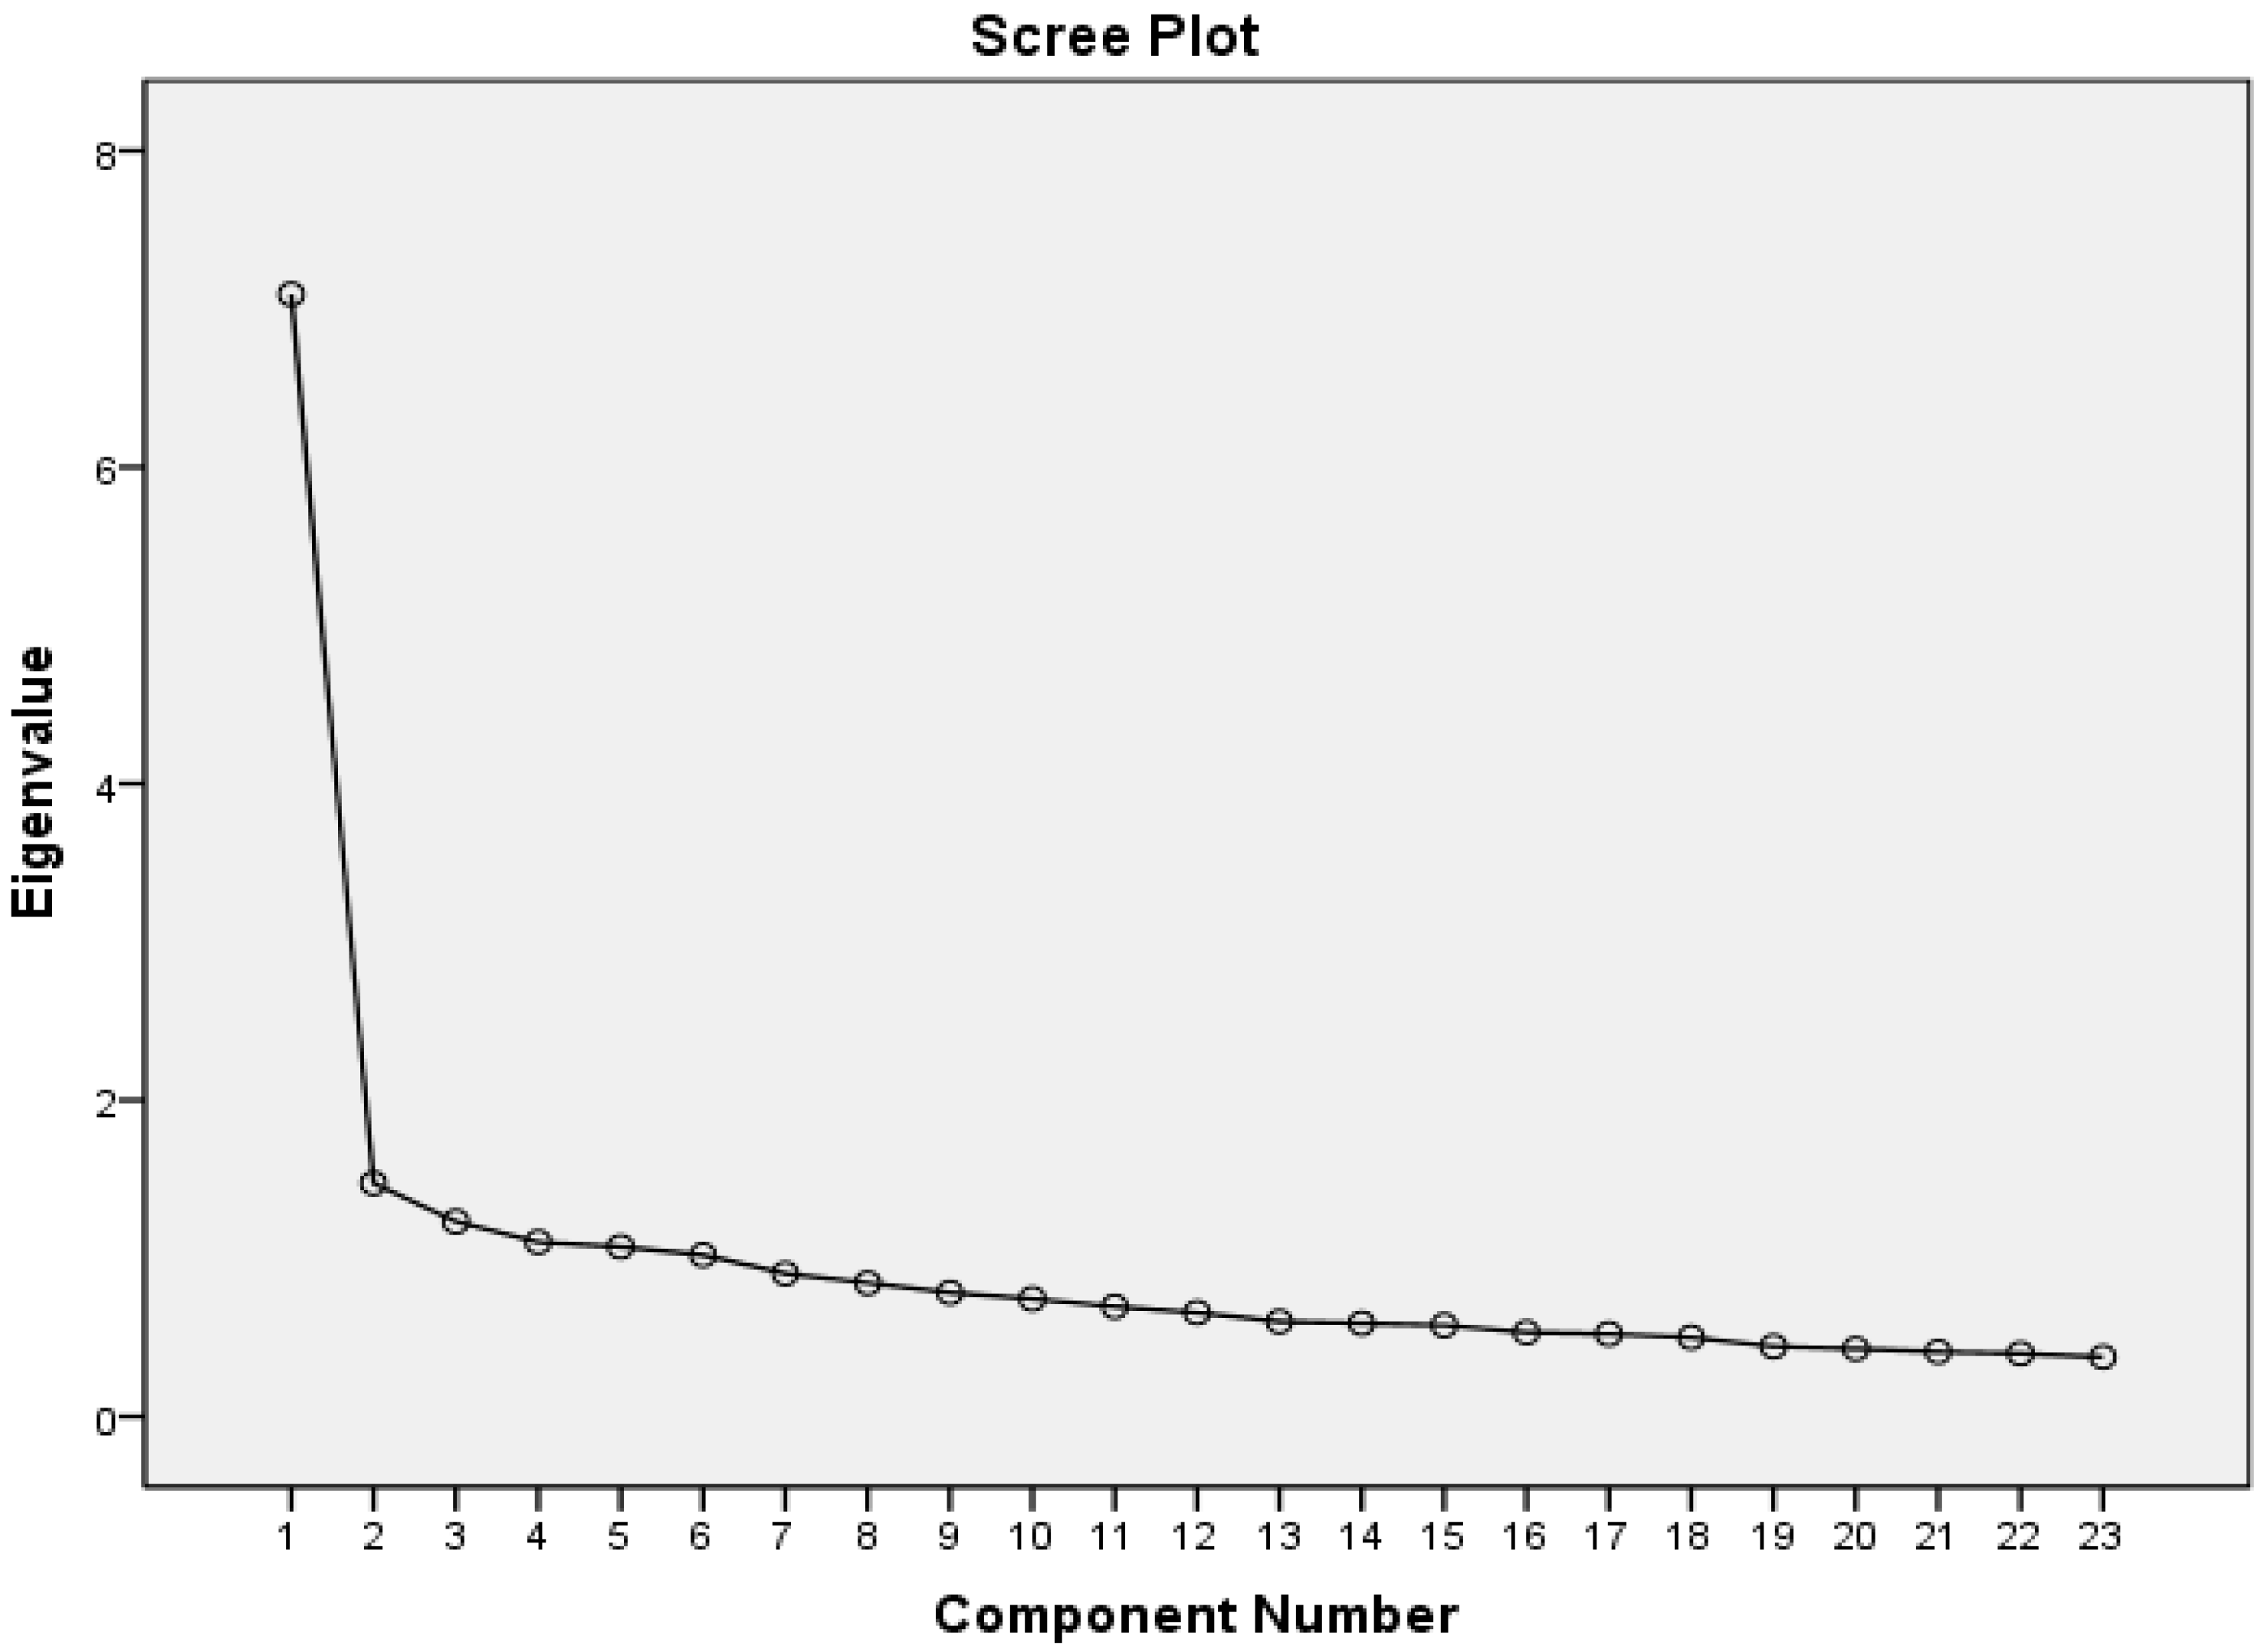
The scree plot, represented in Figure 2, graphs the eigenvalues against the factor numbers, namely the first two columns of Table 4 above. From the sixth factor on, one can notice that the line in the graph is almost flat, meaning that subsequent factors are accounting for smaller and smaller amounts of the total variance. That confirms the six-factor model identified by the eigenvalue analysis.
Normally, while performing FA, one would drop the items that loaded significantly on more than one factor and also the items that did not load significantly on any of the factors (rule of thumb). Fortunately, that was not the case with our analysis: none of the 23 original items has been dropped. In order to gain consistency for the factor structure, one would also omit factors carrying only one item. That was not the case with our analysis: every factor loads at least two items. A threshold of 0.512 was imposed for the factor loadings depicted in Table 5, associated with the 23 variables [30].
Figure 2. Results of the scree test. Eigenvalues vs. factors (components).
Sustainability 07 04183 g002
The six extracted factors and the corresponding variables associated with each of them are represented (after varimax rotation) in the matrix form of Table 4.
The fact that variables V13 and V14 belong to the same factor (Factor 6) has the following straightforward interpretation: the two variables are (highly) positively correlated with one another and only poorly (that is, close to zero) correlated with the variables belonging to other factors. In other words, a person who scores a four or a five on Question 13 is very likely to score a four or a five on Question 14, as well, and so on.
The six factors were interpreted as: (1) adaptability; (2) cooperation; (3) authority; (4) charisma; (5) confidence; (6) motivation. The questions corresponding to each of the six factors are presented in Table 6.
Table 5. Rotated variable-factor matrix.
Factor
123456
V1 0.654
V2 0.729
V3 0.550
V40.600
V5 0.612
V6 0.730
V7 0.544
V8 0.673
V9 0.629
V10
V110.556
V120.608
V13 0.758
V14 0.775
V15 0.523
V16 0.740
V17
V180.611
V19
V200.532
V21 0.551
V22 0.602
V23 0.703
Extraction method: principal component analysis. Rotation method: varimax with Kaiser normalization.
Regarding the analysis of Cronbach’s alpha coefficients, we have checked first the whole set of 23 questions for internal consistency, and we obtained a coefficient of 0.895, indicating a very high level of consistency for the 5-point Likert scale with our particular sample. That was done also in SPSS, by running the procedure called “Reliability Analysis”.
The last column in Table 7 depicts the value that Cronbach’s alpha would be if that particular variable (question) were deleted from the scale. Compared to the 0.895 value computed above as a measure of consistency for the whole set of 23 variables (that is, neither variable deleted), one can see that removal of any variable would result in a (slightly) lower Cronbach’s alpha. Consequently, one would not want to remove any of the questions. In other words, removal of any question would lead to increasing Cronbach’s alpha coefficients; therefore, the set of 23 questions is highly consistent. That is confirmed also by the observation of the “corrected item-total correlation” column, where all values are relatively high—within the range of 0.4–0.6.
Finally, after identifying the six factors via FA, we have run again the procedure for Cronbach’s alpha on each of the six clusters of variables corresponding to a specific factor. The values computed were as follows: 0.734 (Factor 1), 0.651 (Factor 2), 0.686 (Factor 3), 0.650 (Factor 4), 0.626 (Factor 5), 0.664 (Factor 6). One can notice that all six Cronbach’s alpha coefficients are above the minimal acceptance threshold of 0.5, so none should be discarded [18].
Table 6. Identification of factors.
Factor 1: Adaptability
V4. Inducing effective and permanent workplace communication
V11. Fast decision making
V12. Ability to make changes
V18. Ability to read a situation and learn from it
V20. Setting clear objectives
Factor 2: Cooperation
V21. Intercultural skills
V22. Interest in the career development of employees
V23. Avoiding conflicts
Factor 3: Authority
V8. Authority
V9. Boldness
V15. Independence
V16. Ambition
Factor 4: Charisma
V5. Vision
V6. Good sense of humor
V7. Ability to inspire people
Factor 5: Confidence
V1. Exhibiting self-confidence
V2. Building confidence in the workplace
V3. Highly-trained professional
Factor 6: Motivation
V13. Permanent stimulation in a group
V14. Providing incentives to motivate employees
Table 7. Cronbach’s alpha coefficients.
Scale Mean if Item DeletedScale Variance if Item DeletedCorrected Item Total CorrelationSquared Multiple CorrelationCronbach’s Alpha if Item Deleted
V195.5697.6700.5110.3680.890
V295.8797.2610.4600.3290.891
V395.4799.6190.4340.2770.892
V495.5698.7100.4840.3220.891
V595.8697.0580.4690.3200.891
V696.2195.4200.4660.3270.892
V795.9595.8620.5540.3990.889
V896.0396.8660.4230.2850.892
V995.7996.5110.5320.3690.890
V1095.8196.3290.5490.3720.889
V1195.7696.8540.4990.3500.890
V1295.7796.2370.5590.4120.889
V1395.6998.1510.4900.3700.891
V1495.6798.1470.4350.3630.892
V1596.1795.1620.4690.3250.892
V1695.9196.2110.4700.3380.891
V1796.0494.7390.5180.3500.890
V1895.6796.9480.5350.3750.890
V1995.6098.1230.4950.3760.891
V2095.6497.5900.4970.3320.890
V2196.2292.8580.5630.3920.889
V2295.7896.2970.5420.3850.889
V2395.6098.2680.4340.2780.892

3. Discussion and Conclusions

There are two types of quantitative analyses: confirmatory, which aims at endorsing some previously established theory, and exploratory, which starts from raw data, runs some statistical procedure and, only afterwards, tries to emulate a theory. Both paradigms are worthwhile, yet we have taken the second path in our study concerning leadership in SMEs from young East European markets, with the case of Romania. We find this second path more challenging, as it usually provides results that are apparently counter-intuitive, forcing our understanding to move forward, to find new interpretations and to explain unexpected correlations among variables.
One could find it instructive to compare the six factors identified by the statistical analysis performed in this paper (adaptability, cooperation in the workplace, initiative, leadership qualities, building confidence at work, providing incentives and motivation) against the topics of knowledge leadership known as the 7 C’s [2]: context, competence, culture, communities, conversations and common language, communications, coaching. Even if we could find some partial overlapping between, e.g., adaptability and context or cooperation in the workplace and communications, the similarities are only apparent. It could be no other way, since we are comparing apples to oranges: the quoted paper is a theoretical one, with qualitative results, whereas our study is strictly quantitative. After we run the statistical procedure in SPSS, a great deal of time was spent on figuring out appropriate names for the six factors revealed by the program. That was the most difficult task, and there is still room for improvement in this regard. Let us discuss the six factors in more detail.
Factor 1. Adaptability 
It seems natural that the variables, fast decision making, ability to make changes, ability to read a situation and learn from it, or even setting clear objectives, belong to adaptability, while inducing effective and permanent workplace communication would normally belong to Factor 2, cooperation. Still, covariance analysis says otherwise. We cannot change the structure of a factor, but only look for a better name.
Factor 2. Cooperation 
Intercultural skills and avoiding conflicts surely belong to the same factor, while interest in the career development of employees would look more natural along with the variables in Factor 6, motivation.
Factor 3. Authority 
This factor is a very good fit to our intuition, since all subordinated variables—authority, boldness, independence and ambition—are clear characteristics of what we normally associate with the personality of a classical (heroic)-type of leader.
Factor 4: Charisma 
The same with this factor, we can hardly imagine a modern leader without these basic qualities: vision, good sense of humor and ability to inspire people. Good sense of humor might seem unnecessary, yet it is always a good idea to make someone laugh before you seduce them.
Factor 5: Confidence 
There is no surprise that exhibiting self-confidence and building confidence in workplace belong together: one cannot build confidence in others as long as she/he does not possess the quality in the first place. One would not be so sure about a highly-trained professional, which one would rather associate with authority (Factor 3) or even adaptability (Factor 1).
Factor 6: Motivation 
As with Factors 3 and 4, the structure of this factor goes with common intuition: permanent stimulation in a group and providing incentives to motivate employees are intrinsically connected.
Summing up, our analysis produced six important factors that are considered representative for leaders by a wide category of personnel from the Romanian SME sector. As none of the initial 23 features has been discarded by our analysis, one can comment only on the distribution of features within factors. In our interpretation, the above feature distribution suggests a need for leaders that are able to direct the energy and the potential of the employees toward high organizational performances. This goes along with the conclusions of [33], where Goleman states that emotional intelligence is more important for leaders than IQ in their activity and interactions with different stakeholders. The author develops an original competency model where twenty-five behavioral features are grouped (intuitively, not via quantitative analysis) into five factors: self-awareness, motivation, self-regulation, empathy and social skills.
A similar (yet still not overlapping) clustering of leadership attributes is to be found in [11], where the four factors found are: personal will, self-confidence, personal character and communication skills. The first factor—personal will—includes features, such as initiative, enthusiasm, accountability and passion for the results. Self-confidence focuses on self-awareness and impact on others. Personal character brings together personal ability, integrity, transparency and consistency, while communication skills group together empathy, listening skills and strength to surface sentiments.
By comparing our factor structure against the factor structures of [11,33], the main limitation of such an analysis is revealed: its rather low portability. We doubt that the same factor structure would be yielded, even if the same research were conducted in another East European country. As with the original CEAI introduced by Hornsby et al. [19,20,21,22,23], we expect the number of extracted factors to vary (both qualitatively and quantitatively), if the same 23-variable factor analysis is applied to different countries. This has been noticed with respect to CEAI in [34] and for a more general scale by the results of the GLOBE Project [12,13,14]. The explanation for this low portability of factor analysis is simple: the perception of leaders within a socio-economic community is a cultural attribute, which cannot be separated from the other frames of mind that build up the culture of a nation.
As further research directions, we intend to search for a different interpretation of the six factors obtained, in light of the brand new paradigm of leadership seen as a process, not as a sum of personal qualities [15,16].

Acknowledgments

The work of Cristian Vizitiu was co-financed by the European Social Fund through the Sectorial Operational Programme Human Resources Development 2007–2013, Project Number POSDRU/159/1.5/S/142115 “Performance and excellence in doctoral and postdoctoral research in Romanian economics science domain”.

Author Contributions

Marian Nastase designed the research and chose the original sample. Liliana Craciun and Cristian Vizitiu distributed the questionnaires. Tanase Stamule filtered the original database. Marian Nastase and Cristian Vizitiu performed the factor analysis procedures in SPSS. Marian Nastase and Tanase Stamule analyzed and interpreted the results. Marian Nastase and Liliana Craciun wrote the paper. All authors read and approved the final manuscript.

Conflicts of Interest

The authors declare no conflict of interest.

References

  1. Radu, C. The Influence of Leadership on Organization’s Level of Competitiveness. Rev. Int. Comp. Manag. 2009, 10, 959–967. [Google Scholar]
  2. Amidon, D.M.; Macnamara, D. The 7 C’s of Knowledge Leadership: Innovating our Future. In Handbook of Knowledge Management; Holsapple, C.W., Ed.; Springer: Berlin, Germany, 2004; Volume 1, pp. 539–551. [Google Scholar]
  3. Tseng, S.M. A Study on Customer, Supplier and Competitor Knowledge Using the Knowledge Chain Model. Int. J. Inf. Manag. 2009, 29, 488–496. [Google Scholar] [CrossRef]
  4. Nastase, M. Importance of Trust in the Knowledge Based Leadership. Rev. Int. Comp. Manag. 2009, 10, 518–526. [Google Scholar]
  5. Nastase, M. Developing a Strategic Leadership Approach within the Organizations. Rev. Int. Comp. Manag. 2010, 11, 454–460. [Google Scholar]
  6. Ulrich, D.; Zenger, J.; Smallwood, N. Results Based Leadership; Harvard Business Press: Boston, MA, USA, 1999. [Google Scholar]
  7. Cavaleri, S.; Seivert, S.; Lee, L. Knowledge Leadership: The Art and Science of the Knowledge-Based Organization; Elsevier Butterworth-Heinemann: Amsterdam, The Netherlands, 2005. [Google Scholar]
  8. Atwater, L.; Penn, R.; Rucker, L. Personal Qualities of Charismatic Leaders. Leadersh. Organ. Dev. J. 1991, 12, 7–10. [Google Scholar] [CrossRef]
  9. De Vries, R.E.; Roe, R.A.; Tailleau, T.C.B. On Charisma and Need for Leadership. Eur. J. Work Organ. Psychol. 1999, 8, 109–133. [Google Scholar]
  10. Heifetz, R.A. Leadership without Easy Answers; Harvard University Press: Cambridge, MA, USA, 1998. [Google Scholar]
  11. Ward, K.; Bowman, C.; Kakabadse, A. Extraordinary Performance from Ordinary People. Value Creating Corporate Leadership; Elsevier: Oxford, UK, 2007. [Google Scholar]
  12. Chhokar, J.S.; Brodbeck, F.C.; House, R.J. Culture and Leadership across the World the GLOBE Book of In-Depth Studies of 25 Cultures; Lawrence Erlbaum Associates: NJ, USA, 2007. [Google Scholar]
  13. House, R.J.; Dorfman, P.W.; Javidan, M.; Hanges, P.J.; de Luque, M.F.S. Strategic Leadership across Cultures: GLOBE Study of CEO Leadership Behavior and Effectiveness in 24 Countries; Sage: Thousand Oaks, CA, USA, 2013. [Google Scholar]
  14. House, R.J.; Hanges, P.J.; Javidan, M.; Dorfman, P.W.; Gupta, V. Culture, Leadership, and Organizations: The GLOBE Study of 62 Societies; Sage: Thousand Oaks, CA, USA, 2004. [Google Scholar]
  15. Crevani, L.; Lindgren, M.; Packendorff, J. Leadership, not leaders: On the study of leadership as practices and interactions. Scand. J. Manag. 2010, 26, 77–86. [Google Scholar] [CrossRef]
  16. Crevani, L.; Lindgren, M.; Packendorff, J. Shared leadership: A post-heroic perspective on leadership as a collective construction. Int. J. Leadersh. Stud. 2007, 3, 40–67. [Google Scholar]
  17. Tabachnick, B.G.; Fidell, L.S. Using Multivariate Statistics, 5th ed.; Pearson: Boston, MA, USA, 2007. [Google Scholar]
  18. George, D.; Mallery, P. SPSS for Windows Step by Step: A Simple Guide and Reference. 11.0 Update, 4th ed.; Allyn & Bacon: Boston, MA, USA, 2003. [Google Scholar]
  19. Hornsby, J.S.; Kuratko, D.F.; Shepherd, D.A.; Bott, J.P. Managers’ corporate entrepreneurial actions: Examining perception and position. J. Bus. Ventur. 2009, 34, 236–247. [Google Scholar] [CrossRef]
  20. Hornsby, J.S.; Holt, D.T.; Kuratko, D.F. The dynamic nature of corporate entrepreneurship: Assessing the CEAI. Acad. Manag. Proc. 2008, 2008, 1–6. [Google Scholar] [CrossRef]
  21. Hornsby, J.S.; Kuratko, D.F.; Zahra, S.A. Middle managers’ perception of the internal environment for corporate entrepreneurship: Assessing a measurement scale. J. Bus. Ventur. 2002, 17, 253–273. [Google Scholar] [CrossRef]
  22. Kuratko, D.F.; Covin, J.G.; Garrett, R.P. Corporate venturing: Insights from actual performance. Bus. Horiz. 2009, 52, 459–467. [Google Scholar] [CrossRef]
  23. Kuratko, D.F.; Montagno, R.V.; Hornsby, J.S. Developing an intrapreneurial assessment instrument for an effective corporate entrepreneurial environment. Strateg. Manag. J. 1990, 11, 49–58. [Google Scholar]
  24. Van Wyck, R.; Adonisi, M. An eight-factor solution for the Corporate Entrepreneurship Assessment Instrument. Afr. J. Bus. Manag. 2015, 5, 3047–3055. [Google Scholar]
  25. European Commission. Enterprise and Industry. SME Definition. Available online: http://ec.europa.eu/enterprise/policies/sme/facts-figures-analysis/sme-definition/index_en.htm (accessed on 1 October 2013).
  26. Romanian National Office of Commerce Registry (Oficiul National al Registrului Comertului). Available online: http://portal.onrc.ro/ (accessed on 14 October 2013).
  27. Romanian Ministry of Public Finance (Ministerul Finantelor Publice). Available online: http://www.mfinante.ro/pjuridice.html?pagina=domenii (accessed on 5 November 2013).
  28. Agapie, A.; Höns, R.; Mühlenbein, H. Markov chain analysis for one-dimensional asynchronous cellular automata. Methodol. Comput. Appl. Probab. 2004, 6, 181–201. [Google Scholar] [CrossRef]
  29. Habing, B. Exploratory factor analysis. Personal Communication; University of South Carolina: Columbia, SC, USA, 2003. Available online: http://www.stat.sc.edu/~habing/courses/530EFA.pdf (accessed on 10 May 2014).
  30. Hair, J.F., Jr.; Anderson, R.E.; Tatham, R.L.; Black, W.C. Multivariate Data Analysis, 5th ed.; Prentice Hall: Upper Saddle River, NJ, USA, 1998. [Google Scholar]
  31. Stevens, J. Applied Multivariate Statistics for the Social Sciences, 4th ed.; Lawrence Erlbaum: Mahwah, NJ, USA, 2002. [Google Scholar]
  32. Gorsuch, R.L. Factor Analysis; Lawrence Erlbaum: Hillsdale, NJ, USA, 1983. [Google Scholar]
  33. Goleman, D. Working with Emotional Intelligence; Bantam Books: New York, NY, USA, 1998. [Google Scholar]
  34. De Klerk, M.; Boshoff, A.; van Wyk, R. Measuring meaning in life in South Africa: Validation of an instrument developed in the USA. S. Afr. J. Psychol. 2009, 39, 314–325. [Google Scholar]

