Quantitative Assessment of Desertification in an Arid Oasis Using Remote Sensing Data and Spectral Index Techniques


1
Laboratory of Geodynamic and Geomatic, Department of Geology, Faculty of Sciences, Chouaïb Doukkali University, Ben Maachou Street, El Jadida 24000, Morocco
2
The Centre for Advanced Modelling and Geospatial Information Systems (CAMGIS), Faculty of Engineering and Information Technology, University of Technology Sydney, Ultimo, New South Wales 2007, Australia
3
Department of Energy and Mineral Resources Engineering, Choongmu-gwan, Sejong University, 209, Neungdong-roGwangin-gu, Seoul 05006, Korea
*
Author to whom correspondence should be addressed.
Remote Sens. 2018, 10(12), 1862; https://0-doi-org.brum.beds.ac.uk/10.3390/rs10121862
Submission received: 18 September 2018
/
Revised: 8 November 2018
/
Accepted: 17 November 2018
/
Published: 22 November 2018
(This article belongs to the Special Issue Mass Movement and Soil Erosion Monitoring Using Remote Sensing)
Abstract
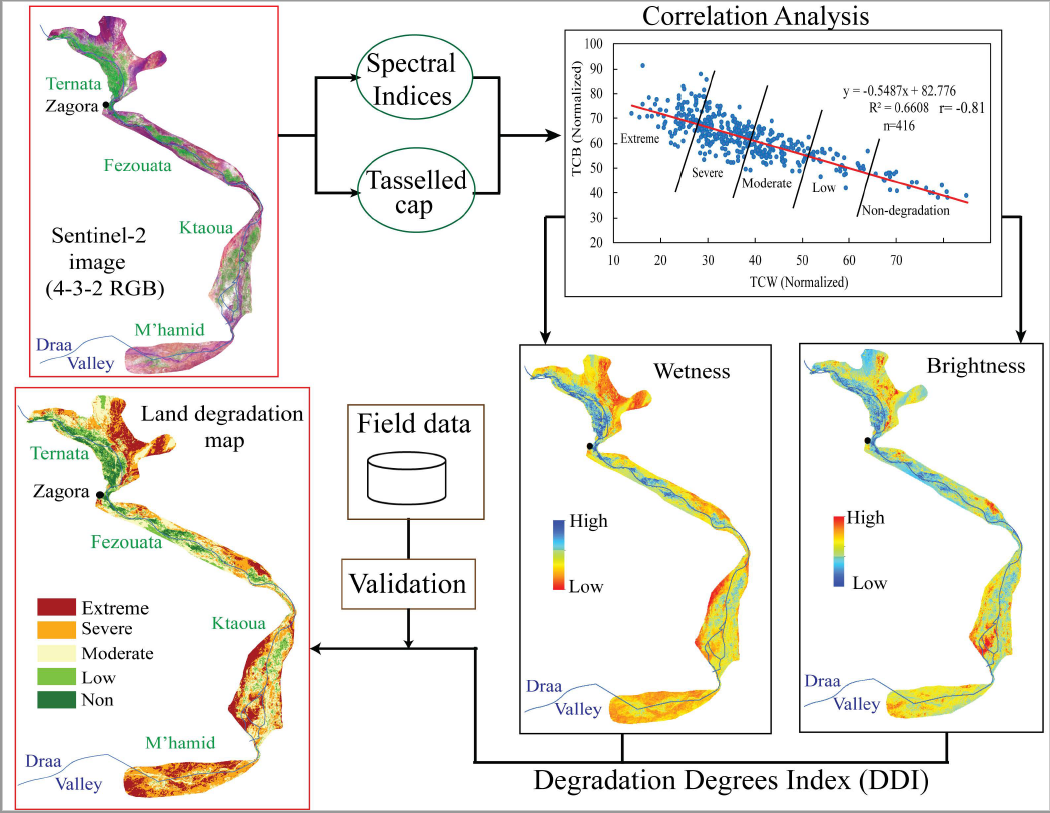
:Desertification is an environmental problem worldwide. Remote sensing data and technique offer substantial information for mapping and assessment of desertification. Desertification is one of the most serious forms of environmental threat in Morocco, especially in the oases in the south-eastern part of the country. This study aims to map the degree of desertification in middle Draa Valley in 2017 using a Sentinel-2 MSI (multispectral instrument) image. Firstly, three indices, namely, tasselled cap brightness (TCB), greenness (TCG) and wetness (TCW) were extracted using the tasselled cap transformation method. Secondly, other indices, such as normalized difference vegetation index (NDVI) and albedo, were retrieved. Thirdly, a linear regression analysis was performed on NDVI–albedo, TCG–TCB and TCW–TCB combinations. Results showed a higher correlation between TCW and TCB (r = −0.812) than with that of the NDVI–albedo (r = −0.50). On the basis of this analysis, a desertification degree index was developed using the TCW–TCB feature space classification. A map of desertification grades was elaborated and divided into five classes, namely, nondesertification, low, moderate, severe and extreme levels. Results indicated that only 6.20% of the study area falls under the nondesertification grade, whereas 26.92% and 32.85% fall under the severe and extreme grades, respectively. The employed method was useful for the quantitative assessment of desertification with an overall accuracy of 93.07%. This method is simple, robust, powerful, and easy to use for the management and protection of the fragile arid and semiarid lands.
Keywords:
Sentinel-2; GIS; tasselled cap transformation; NDVI; albedo; remote sensing; middle Draa valley
1. Introduction
Desertification is a form of land degradation in arid, semiarid and dry sub-humid regions caused by a combination of various factors, such as climatic variations and human activities [1]. Over 3.6 million hectares of world surfaces are affected by this phenomenon [2]. One of the manifestations of desertification is the loss of total or partial agricultural and grazing lands. Moreover, desertification negatively influences biophysical and socioeconomic processes in various spatial and temporal scales [3].
Desertification is a common environmental threat that affects a large part of Morocco. About 93% of Moroccan surface is classified as arid, semi-arid and Saharan, wherein 90% is affected by the phenomenon [4]. The aridity of climate, vulnerability to soil erosion, human pressure and overexploitation of natural resources in rural areas are the main driving forces of desertification in Morocco [5]. The Tafilalet and Draa Valleys, which are located in the south-eastern part of Morocco, are mostly affected by desertification caused by soil and water salinities, sand dune encroachment, water erosion, migration and severe climate conditions [6]. The main characteristics of the Draa Valley include water and soil salinities, scarcity and variability of precipitation, intense evaporation and inadequate human activities. These characteristics result in low vegetation coverage, thereby contributing to the deterioration of an already fragile ecosystem.
For the past three decades, remote sensing data were popularly used for the monitoring and assessment of ecosystems and natural hazards, such as desertification [7,8,9]. Remote sensing offers precise data, quick update and abundant information [10] that can be exploited to combat and mitigate the effect of desertification in arid and semiarid areas. Several remote sensing satellites, such as Landsat and a satellite for the observation of the earth, were used to map and understand the origins of the desertification process at local or regional scales [11,12,13].
On the basis of surveys and experimental data, specific indices have been developed to monitor and assess desertification in the arid and the semiarid regions. Desertification hazards can be mapped based on remotely sensed images using traditional classification methods [14], spectral mixture analysis (SMA) [15] or spectral indices [2]. Some studies proposed that the normalized difference vegetation index (NDVI)–albedo feature space can be used to extract desertification on the basis of the negative relationship between vegetation coverage and surface albedo [16] or the hybrid method combined with the SMA and spectral indices through the use of vegetation fraction and albedo feature space [15].
The tasselled cap transformation (TCT) tool is used for landscaping, environmental threat mapping, estimating biomass, agricultural studies and identifying areas that exhibit desertification [17,18]. Tasselled cap is an orthogonal transformation for the reduction of interpretability of the multispectral image to return three thematic indices: (1) Brightness, which is sensitive to soil backgrounds and bright soils; (2) greenness, which is used to discriminate vegetation coverage; and (3) wetness, which provides information about water and soil moisture and vegetation conditions [19].
Some researchers established a relationship between desertification and the increase in bright soil or surface albedo [20]. Soils with sand and bright soil texture dry rapidly compared with soils with clay texture that conserve surface moisture [2]. Decrease in soil moisture reduces the water availability of vegetation, thereby leading to the desertification of landscapes.
However, some studies monitored desertification by establishing a quantitative relationship between biophysical indices and the degrees of desertification (albedo, vegetation, soil) [15,16,21]. These models cannot affine the extraction of the low and high desertification grades of lands. This deficiency encourages us to develop a new quantitative relationship to extract different degrees of desertification in the context of arid oasis areas with a high discrimination among different land cover classes with a risk of desertification.
The objectives of this study are: (1) To map the desertification degrees in the Middle Draa Valley (MDV) and (2) to identify a pixel-based relationship among the different biophysical indices (NDVI, greenness, wetness, surface albedo, brightness) that contribute to the desertification process. The applied methodology is based on the comparison of the regression analyses of three index combinations (NDVI–albedo, Tasselled Cap brightness [TCB], greenness [TCG] and wetness [TCW]). A desertification degree index (DDI) is calculated based on the results of regression analysis and is further used to extract the desertification degrees. The final desertification degree map is classified into five grades. The results are validated based on ground data and high-resolution images. The present study is one of the first studies that adopted a remote sensing-based approach for the desertification in the oases of Morocco. The developed model can be easily reproduced and applied to other arid lands using multispectral images and can easily achieve the automatic identification of desertification.
2. Study Area
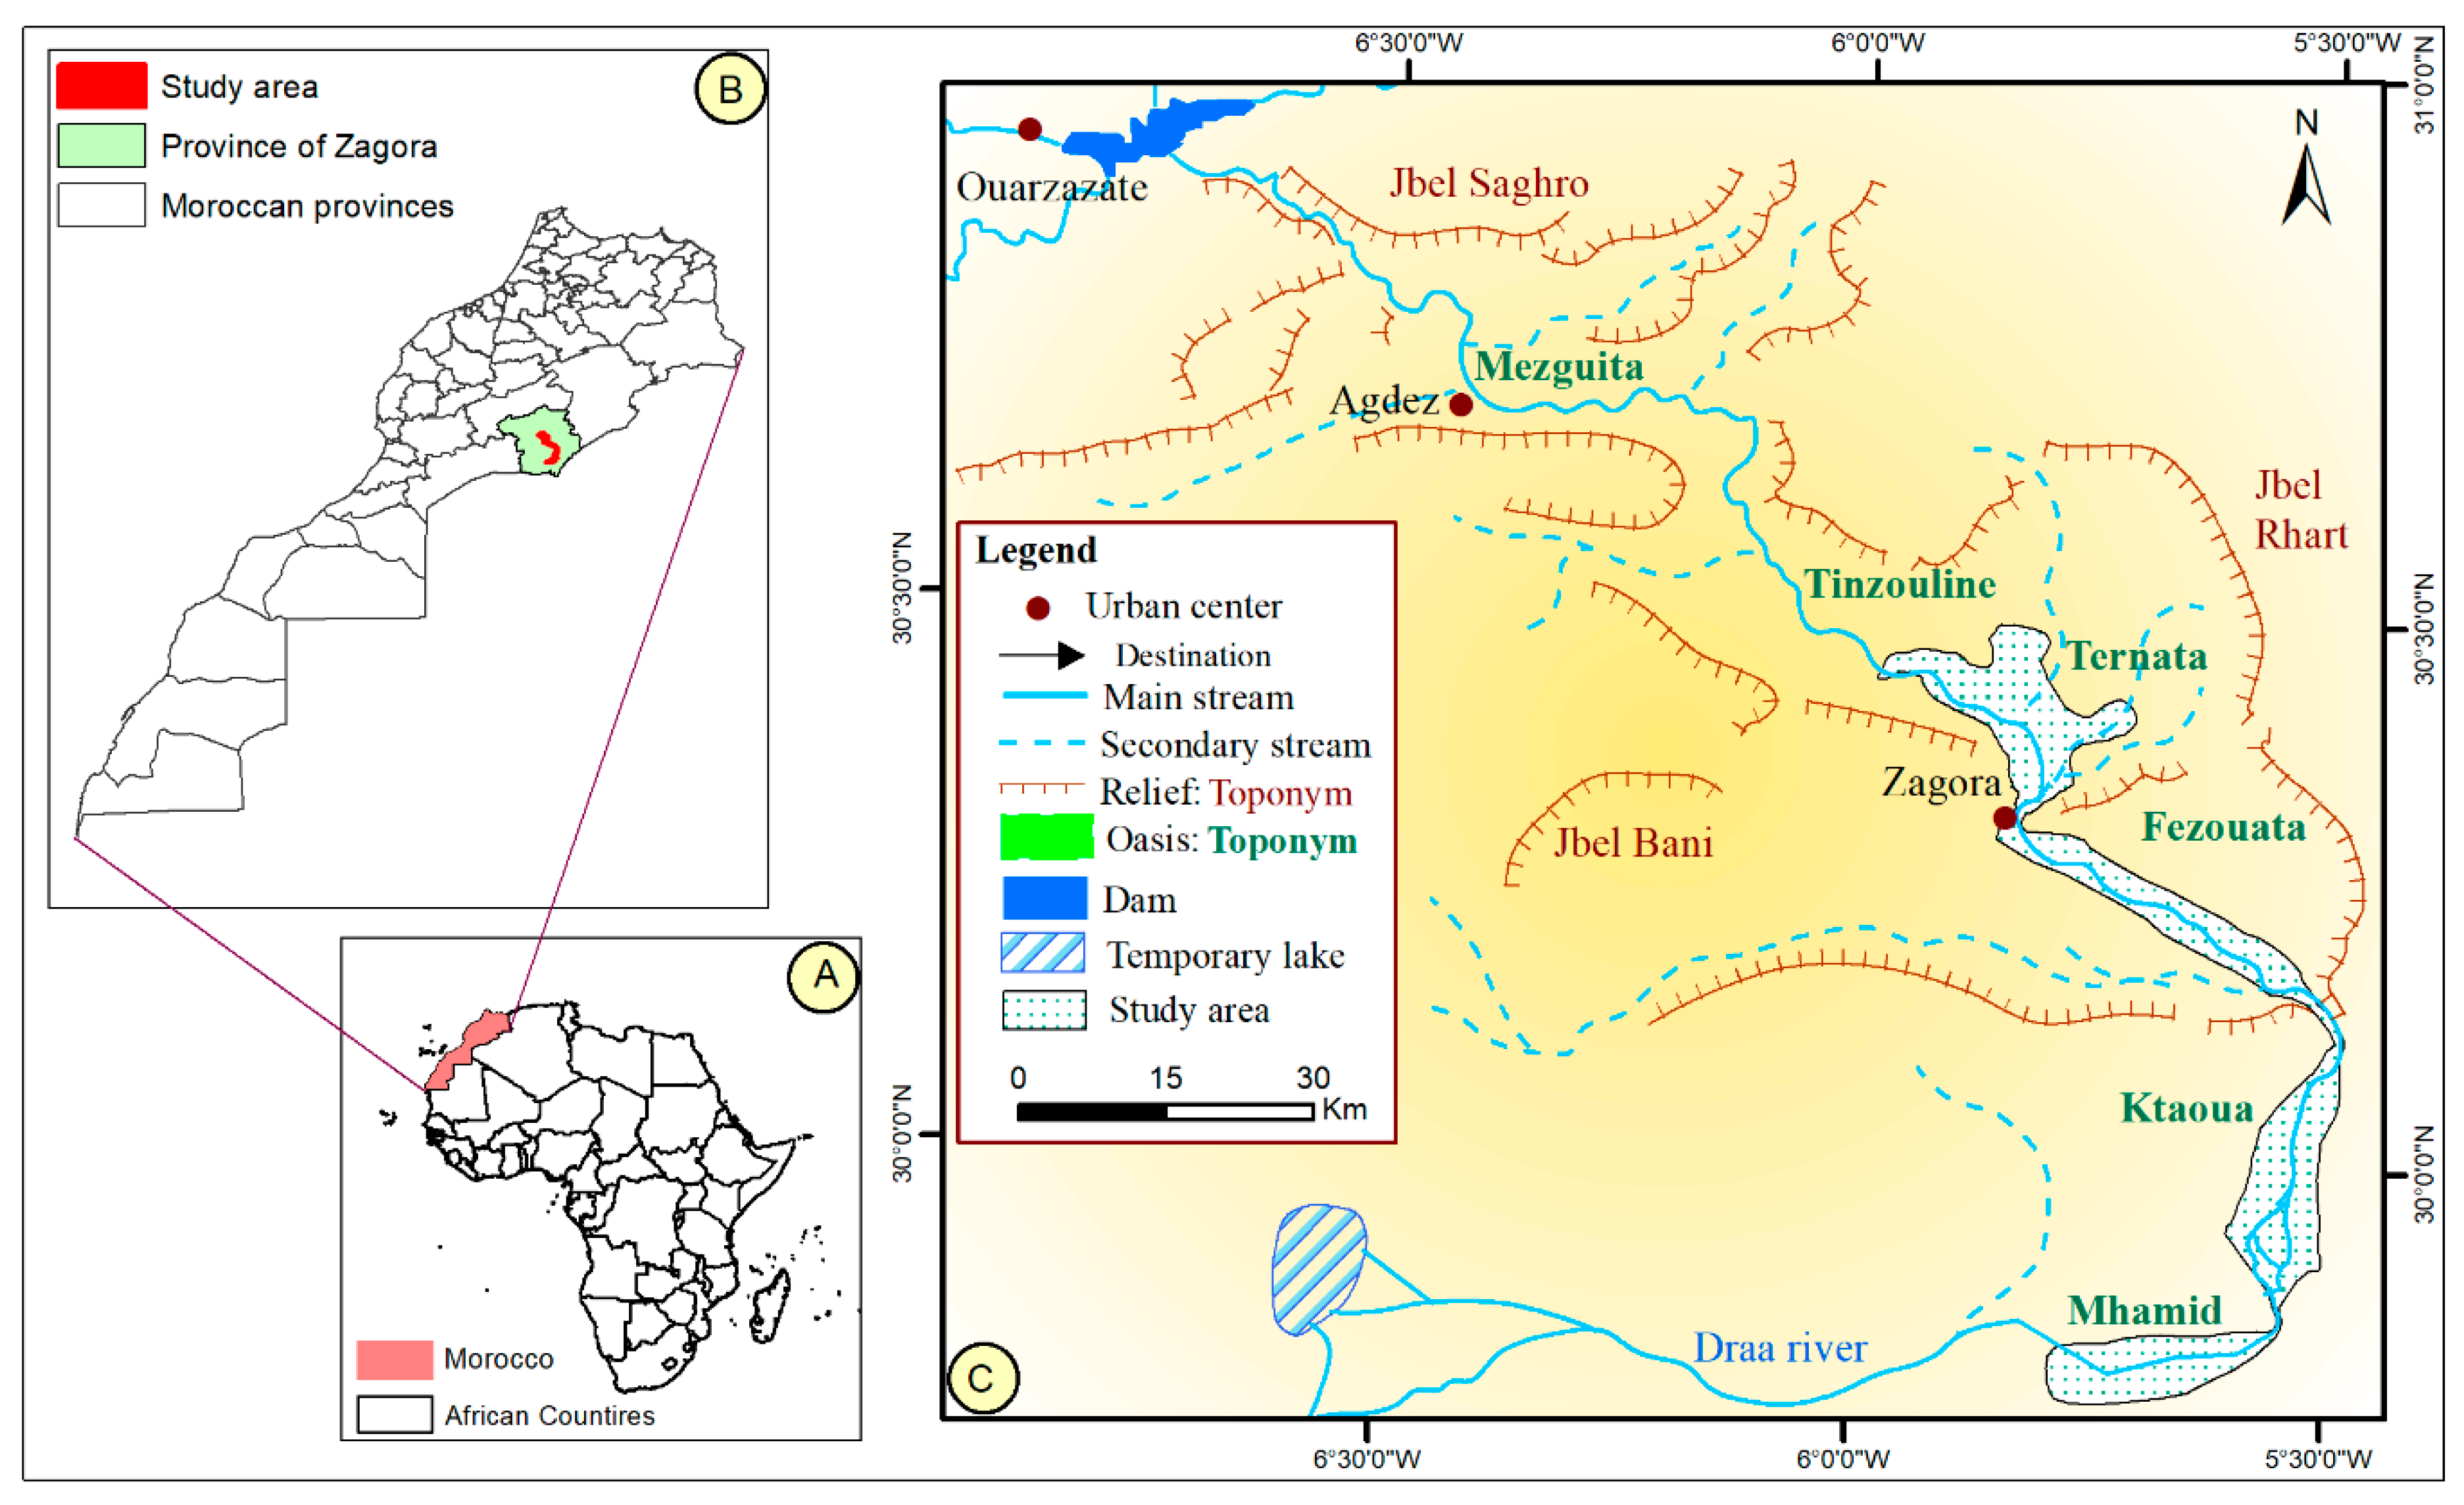
The study area is a part of the MDV situated in the central-southern part of Morocco. The study area is located in the middle of the 6° west meridian and below the 30° north parallel. The Draa Wadi (typical ephemeral river), which feeds from the Mansour Eddahbi dam, crosses the MDV. The study site includes four successive oases from Ternata to M’Hamid (Figure 1). The MDV is characterized by an arid climate, whereas the oases are marked by hot and humid microclimates promoted by the stratified management favouring diversified cultivation. The MDV is characterized by an arid climate with annual precipitation varying between 54 mm (in the Ktaoua oasis) and 64 mm (in the Ternata oasis). The precipitation pattern is irregular and has long periods of droughts. Temperatures range from −1 °C to 7 °C in winter and more than 48 °C in summer [22], whereas evaporation is high and reaches 3000 mm/year.
The hydrological system depends on the extent of water runoff in the High Atlas mountain chain, which is located north of Ouarzazate City [23]. However, the scarce surface water supply in the MDV results in high dependence on groundwater pumping, which increased from 2000 pumps in 1977 in the six oases to 10,000 in 2011 [24]. The Mansour Eddahbi Dam, which was constructed in 1972, is at risk from severe siltation. This area has a higher level of limited stocks than the increase rate of demand, especially for unsustainable crops, such as watermelon cultivation that expanded from a little over 100 ha in 2010 to more than 2400 ha in 2014 in the MDV. Of the total amount of exploitable water resources, 96.66% is allocated to agriculture, 2.70% to domestic use, 0.28% to tourism and 0.36% to economic activities [24]. Farms practice traditional production methods, including three levels of vegetation management: Palm trees (Phoenix dactylifera), fruit trees and crops. Major crops in the oases include barley, wheat, date palms, alfalfa, maize and henna.
From 1994 to 2014, the number of residents in the study area increased from 12,800 to 15,395 [25]. In terms of socioeconomic factors, the Draa area is plagued by poverty, which has caused a migration of young people to the northern part of the country. The main economic sectors are agriculture and tourism.
Precipitation in the MDV is characterized by a binary pattern, either a succession of years of drought or exceptional rainy years. This acute variability of precipitation resulted in the desertification of the oasis palm in the early years of the last century, including the death of 780,783 palm trees in 1975. Major activities, such as overgrazing in pastoral lands and the endorsement of new inadequate cultivation in the context of the arid area that needs high quantities of water, contributed to desertification.
In recent years, the study area encountered several environmental problems, such as water shortage, water and soil salinities, sand dune encroachments, overgrazing and overexploitation of groundwater for agricultural activities [25]. The climate pattern is characterized by a high temperature that encourages evaporation; low precipitation affects water availability and desertification of the ecosystem [6,26,27]. Only a few studies were conducted in the study area, which inspired us to conduct this study.
3. Materials and Methods
To achieve the objectives of this study, the SNAP tool was used for the preprocessing and processing of remote sensing images. SPSS 24.0 and ArcGIS 10.3 were used for statistical regression analysis and presentation of results, respectively.
3.1. Sentinel-2 Data
Sentinel-2 (S2) image was used to map the desertification degrees (DD) in the MDV. The image was acquired on 18 July 2017. The cloud-free cloud scene in summer (July) was selected because it is the period when natural and annual vegetation is minimal and crops are harvested. Desertification in the study area is best assessed during this period to avoid confusion with seasonal vegetation. The Sentinel-2 satellite image (Level-1C) was downloaded from the Copernicus Open Access Hub (https://scihub.copernicus.eu). The S2 MSI sensor (multispectral instrument) has 13 reflective spectral channels defined at 10 m, 20 m and 60 m in an approximately 290-km swath with global coverage every 10 days [28]. The 13 spectral bands cover a wide range of wavelengths from 440 nm to 2200 nm (Table 1).
3.2. Methods
Several remote sensing methods and techniques were developed to map and assess desertification in arid and semiarid areas, which can be classified into: Visual interpretation [7], SMA [29,30], classification algorithms [14,31,32] and spectral indices (NDVI, albedo) [2] and image transformation, such as TCT [33].
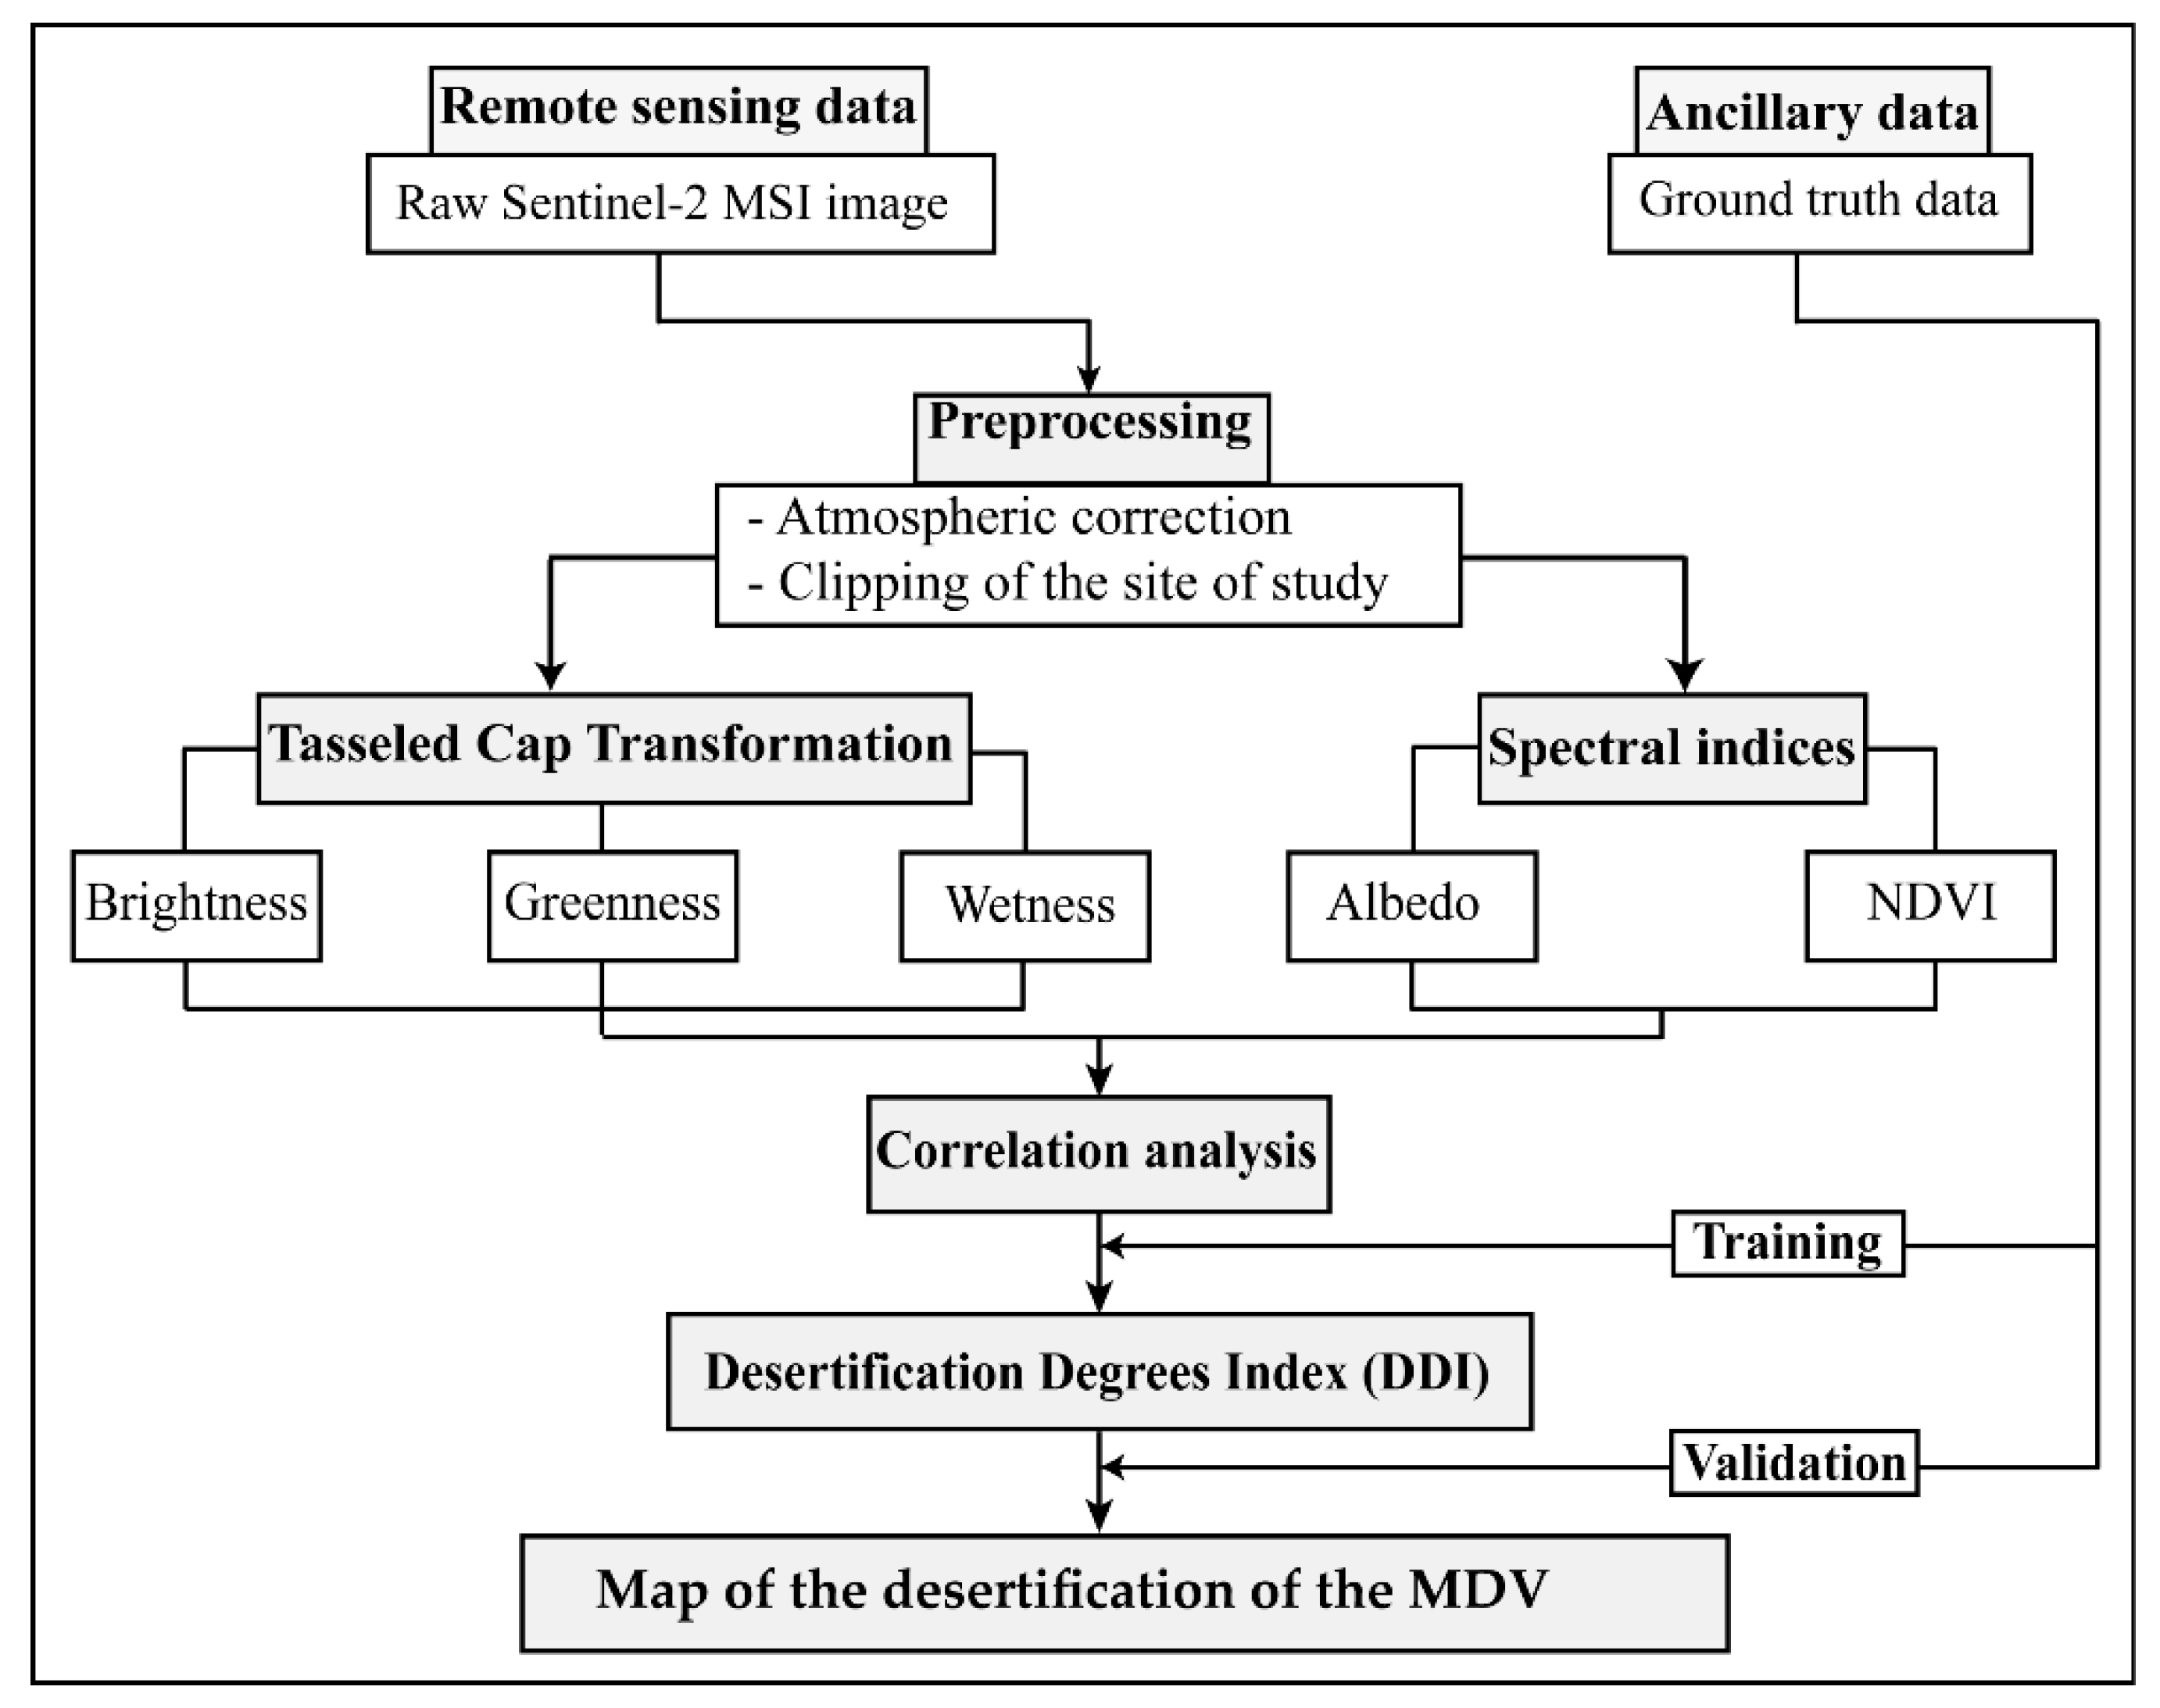
The proposed method is based on the analysis of the relationship between biophysical spectral indices and desertification risk. The aim of this method is to select the best combination of spectral indices that present a high negative correlation. The adopted methodology (Figure 2) can be divided into three main stages: (1) Pre-processing and derivation of spectral indices and TCT, (2) training and correlation analysis and (3) development and implementation of an indicator to extract different grades of desertification in the study site.
3.2.1. Preprocessing of Remote Sensing Data
Level-1C of the S2 satellite provides the orthorectified top-of-atmosphere reflectance in UTM projection with the World Geodetic System.
Sentinel-2 L1C is the standard product of top of atmosphere reflectance and requires pre-processing to obtain and format bottom of atmosphere Level 2A [34]. The atmospheric correction of the Sentinel-2 images was also performed using the Sen2cor atmospheric correction toolbox, which is a built-in algorithm within the Sentinel Application Platform (SNAP) tool version 5.0 [34]. The SNAP tool was primarily developed by the European Space Agency (ESA) for sentinel images. Sen2Cor was also used to produce the resampled version of the higher resolution bands (10 m). The preprocessing stage includes also layer staking and the clipping of the study area.
3.2.2. Derivation of Spectral Indices
Normalized Difference Vegetation Index (NDVI) (Equation (1)): is one of the most commonly used methods for extraction of vegetation coverage. NDVI is based on the red and NIR reflectance of soil. NDVI is calculated by taking the ratio of red and NIR bands from remote sensing data. The values of NDVI varies between −1 (water body and snow) and +1 (full vegetation coverage). NDVI was used in several studies as an indicator of desertification tracking in arid areas [35]:
where R and NIR are the red and near-infrared bands of the Sentinel-2 image, respectively.
Albedo (α): is a narrow-to-broadband conversion based on multispectral optical satellite data, essentially related to a shortwave broadband ranging from 0.38 µm to 2.5 µm [36]. Land surface albedo is an important indicator for the determination of energy budget and change in micrometeorological conditions, such as the temperature and aridity/humidity of the land that can cause desertification in arid and semiarid areas [2,20,37]. Broadband albedo was retrieved from Sentinel-2 MSI using Liang’s formula [39] (Equation (2)), which was also applied to the Sentinel-2 MSI sensor in previous studies to retrieve the surface albedo [36].
where albedo is the broadband albedo of Sentinel-2 MSI image, and b2–b12 are the narrowband albedos.
3.2.3. Tasselled Cap Transformation (TCT)
TCT, which is also known by KT transform, is a linear transformation of the values of pixels of a remote sensing image, developed by Kauth and Thomas using Landsat-5 MSS in 1976 [19]. TCT transforms the original image into correlated bands using NIR and visible domain. The TC transform information of land covers a multispectral image, which comprises three thematic indicators or features: Brightness (TCB), greenness (TCG) and wetness (TCW). TCB reveals the bright soil with bare land and the absence of the vegetation; TCG represents the different types and densities of vegetation coverage; and TCW corresponds to soil moisture [33]. TC requires a set of coefficients that weigh the bands of multispectral image, and the sum gives an output with a new value. TCT is not an image dependent; it requires a set of coefficients. Table 2 presents the coefficients of transformation used in this study for the multispectral Sentinel-2 MSI to perform the TCT [39].
3.2.4. Construction of the Desertification Degree Assessment
The desertification grades in the MDV was analysed and classified into five degrees: Nondesertification, low, moderate, severe and extreme levels. The aim of this classification was to separate each desertification degree using the differences among the indicators and the combinations of desertification. Feature space classification is a technique adapted to map and assess desertification in some arid areas [15,16].
Some researchers analysed the relationship between vegetation coverage and surface albedo (α) [21,40]. Surface albedo increases correspondingly with the reduction of vegetation coverage and the changes in albedo will affect the surface radiation balance, thereby affecting land surface temperature [16]. Furthermore, TCT was applied in some arid regions to quantify desertification grades via the analysis of the relationship between TCB and TCG [41].
Correlation analysis was conducted among NDVI–α (first combination), TCG–TCB (second combination) and TCW–TCB (third combination) to find the combination that gives the best negative correlation.
Pearson’s correlation analysis was exploited for the correlation analysis among the five different indices (NDVI, α, TCB, TCG and TCW). Linear regression analysis can be performed using the equation with one variable in a feature space; x is the independent variable and y is the dependent. In this study, α and TCB are independent variables. NDVI, TCG and TCW are the dependent variables for the first, second and third combinations, respectively.
A total of 416 points were randomly extracted using GIS tools. Point spacing was 1000 m between the points of the random grid. The grid covers the entire study area with different types of land cover (i.e., full and sparse vegetation, sand, rocks, bright soil and river). The pixel values for each band (NDVI, α, TCB, TCG and TCW) were extracted. Linear correlation was then calculated for each desertification class.
3.2.5. Accuracy Assessment
To assess the accuracy of the desertification degree map, a field campaign was conducted in June 2017 to collect in situ data. The representative pixels were selected randomly, and their coordinates were recorded using GPS according to a strict protocol. A total of 130 points were collected from the four oases (Ternata, Fezouata, Ktaoua and M’Hamid) with attached attributes and photographs of each point. The ground truth points were collected from different desertification classes (i.e., full vegetation coverage, partial vegetation coverage, sparse vegetation, bright soil, dark soil, water). The Jenks natural break classification algorithm (ArcGis 10.3) was used to classify the DDI into five classes.
The algorithm was successfully used to classify the desertification phenomenon in the arid area [15,16,21]. The Jenks natural breaks is a data clustering method designed to determine the best arrangement of values into different classes [21]. The method seeks to reduce the variance within classes and maximize the variance between classes [42]. The classification method identified the cut-off points between categories using the Jenks optimization algorithm; this algorithm groups data according to the inherent breaks in the data, which means that this classification does not require training data as input, it needs only to identify the number of classes. The points where the difference is maximized are identified and used as the thresholds for each natural category (the I value in our case) [42]. After the extraction of the desertification degrees using the DDI and the Jenks classification, an accuracy assessment was performed using a confusion matrix [25]. All 130 points were used for validation. Jenks natural break algorithm is a dependent classification method and does not require ground points as input for the training.
4. Results
4.1. TCT, NDVI and Albedo
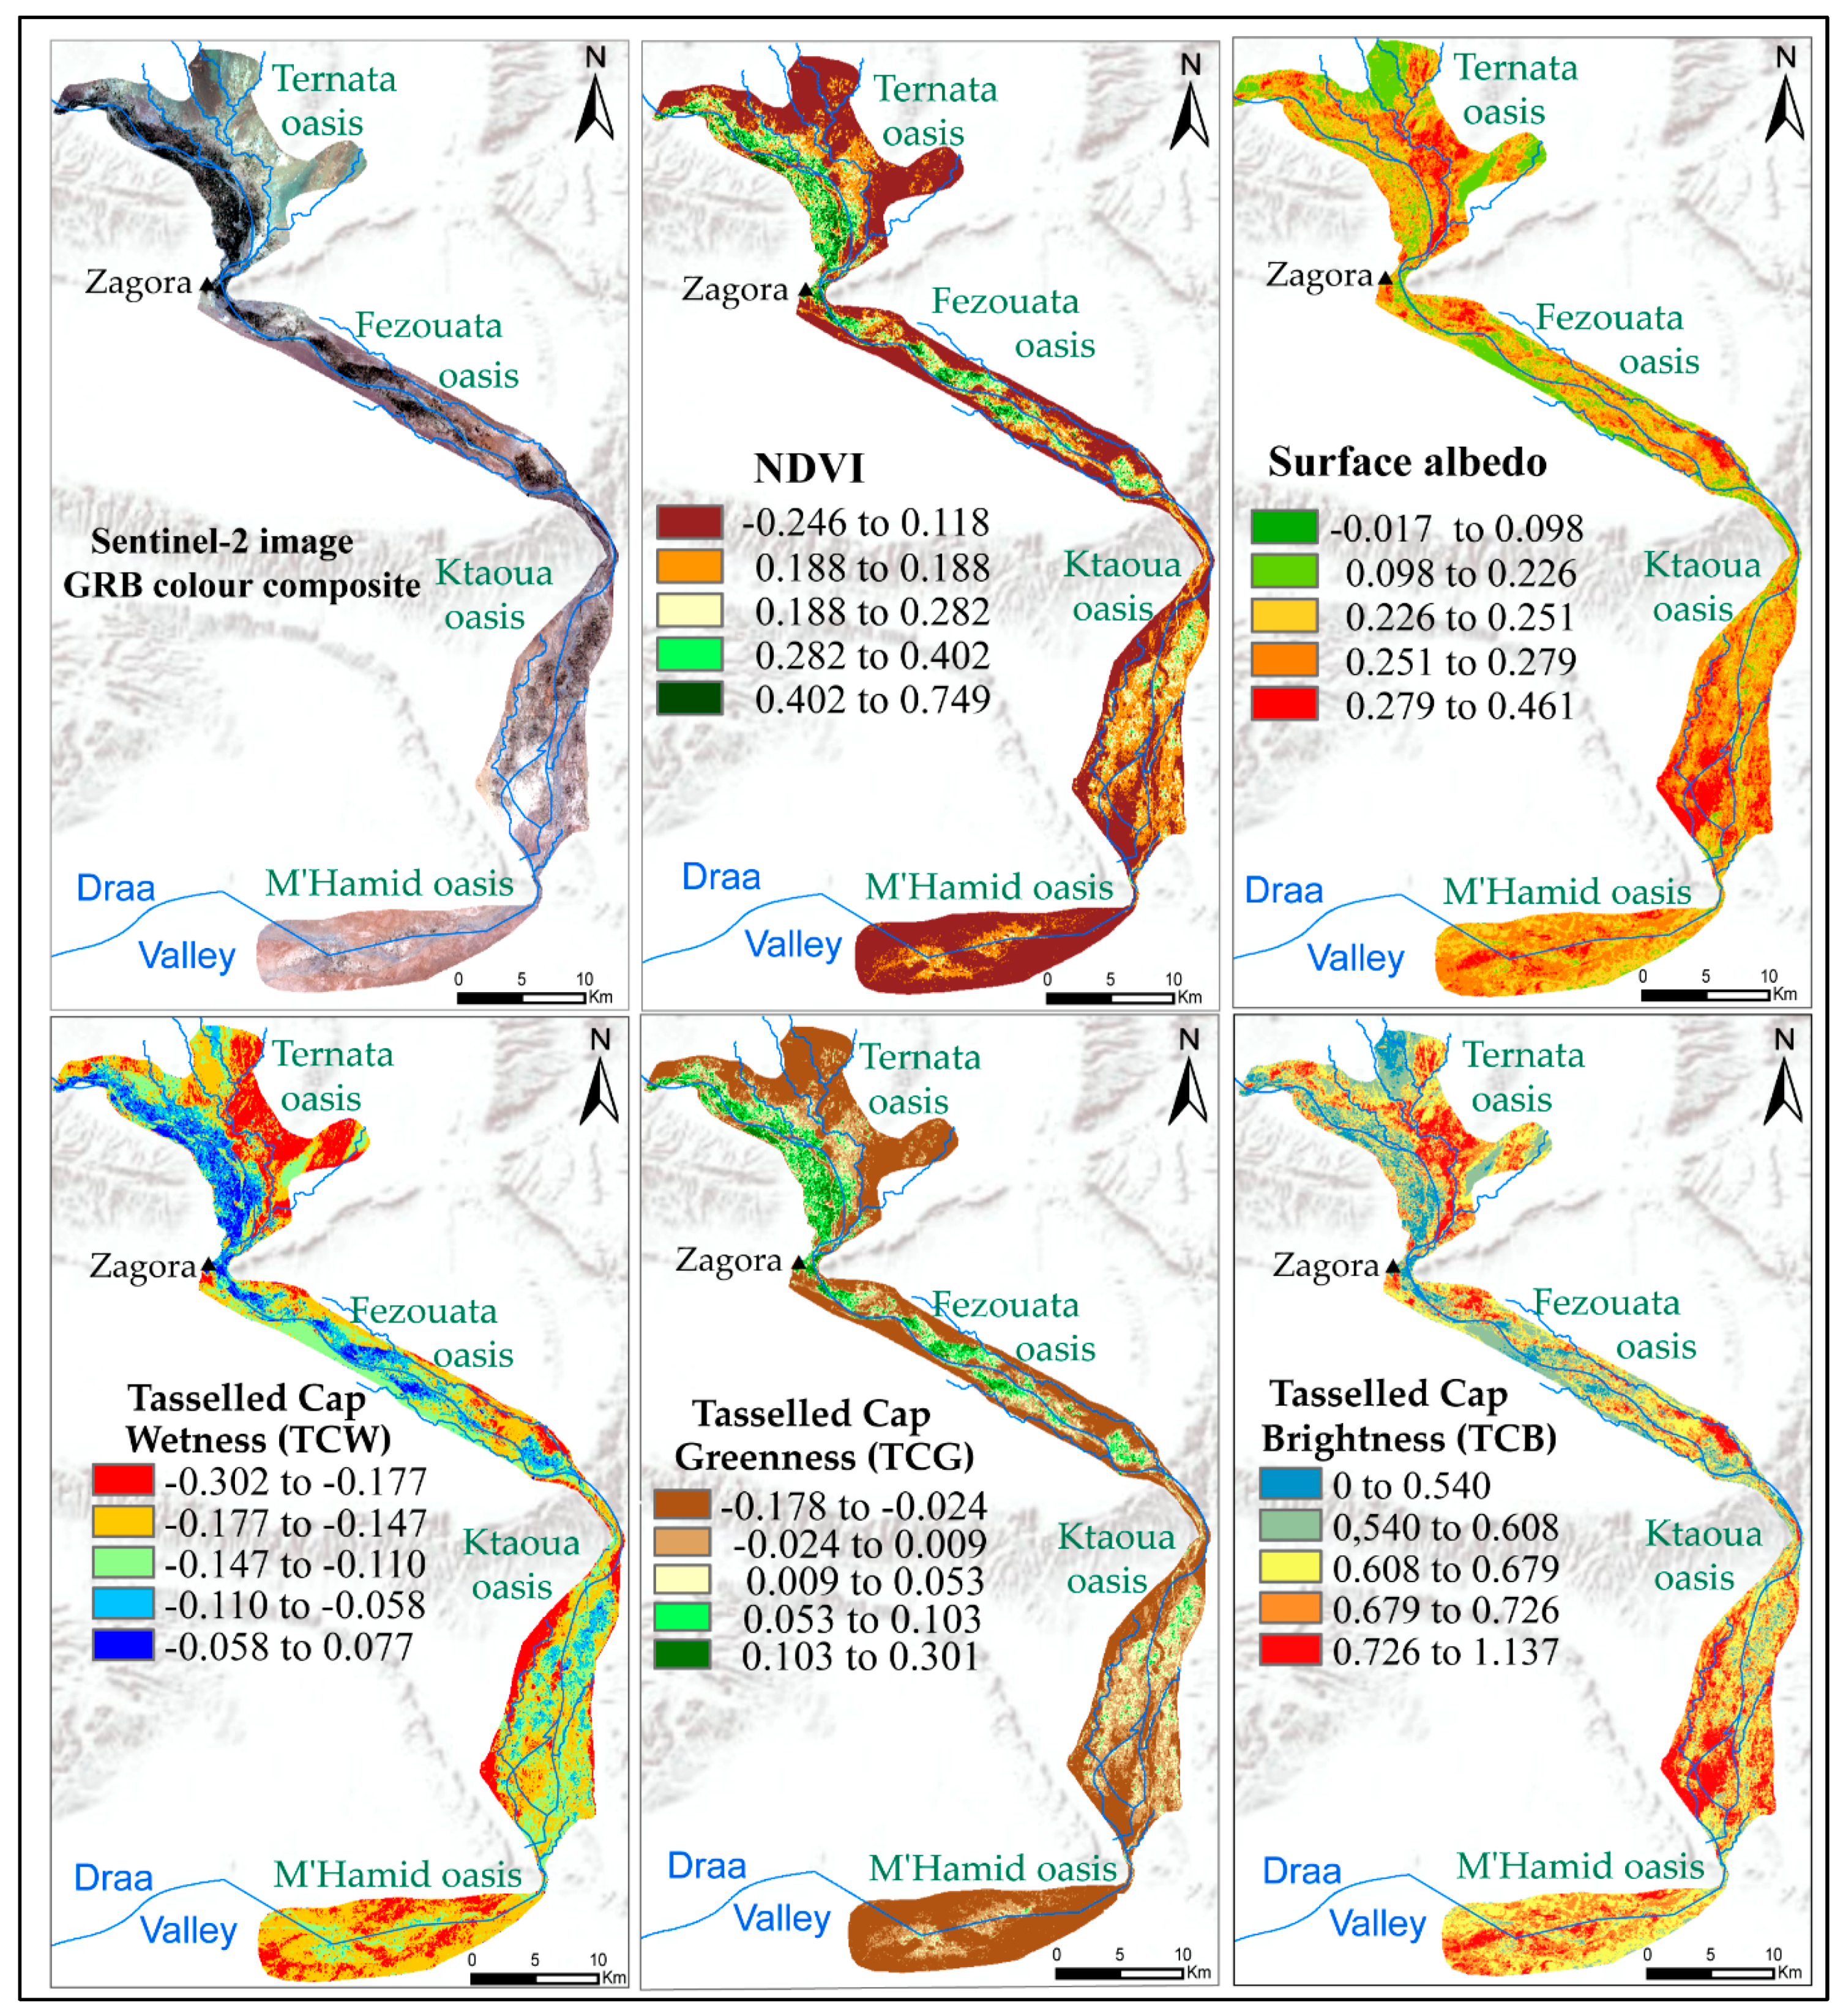
Depth analysis was performed for each band after performing the spectral indices and the derivation of the three features of TCT (Figure 3). The high values of the NDVI and TCG bands (0.74 and 0.30, respectively) correspond to the date palm oasis in the study area, whereas the low values (−0.24 and −0.17, respectively) represent the water bodies that are located in the Draa Wadi. The range values of the surface albedo vary between −0.07 and 0.46; the low values correspond to the vegetation coverage and water bodies; and the high values of albedo and TCB present the bright soils with the whitish colour. The TCW indicator provides information about soil moisture, and the values vary between −0.30 and 0.07. The high values of the TCW correspond to the water bodies, vegetation and wetlands, whereas the low values represent the dry areas, including sand dunes and bright soils, with the absence of vegetation and the presence of poor soils of organic matter.
4.2. Linear Regression Analysis
The aim of the linear correlation is to select the best combination that presents a highly negative correlation and good visualization of different land cover types. Analysis showed a strong negative correlation between TCW and TCB (r = −0.812). TCW is highly correlated to the soil moisture and texture, which can give more information about the different types of soil [43]. This result indicates that TCW decreases gradually with the increase in the desertification process, whereas TCB increases. A low correlation is found between TCG and TCB (r = −0.50). NDVI–α showed a lower correlation for all the extracted 416 points (r = −0.36). The correlation analysis for each grade of desertification is illustrated in Table 3, which shows a high correlation for all the grades of desertification for the TCW–TCB relationship. The correlation between NDVI and surface albedo showed a high negative correlation for the non-desertification and extreme desertification grades and a high positive correlation for other classes. This result means that the values of NDVI and surface albedo are low for the low and moderate grades of desertification, whereas the TCW–TCB combination gives a negative correlation for all grades of desertification types.
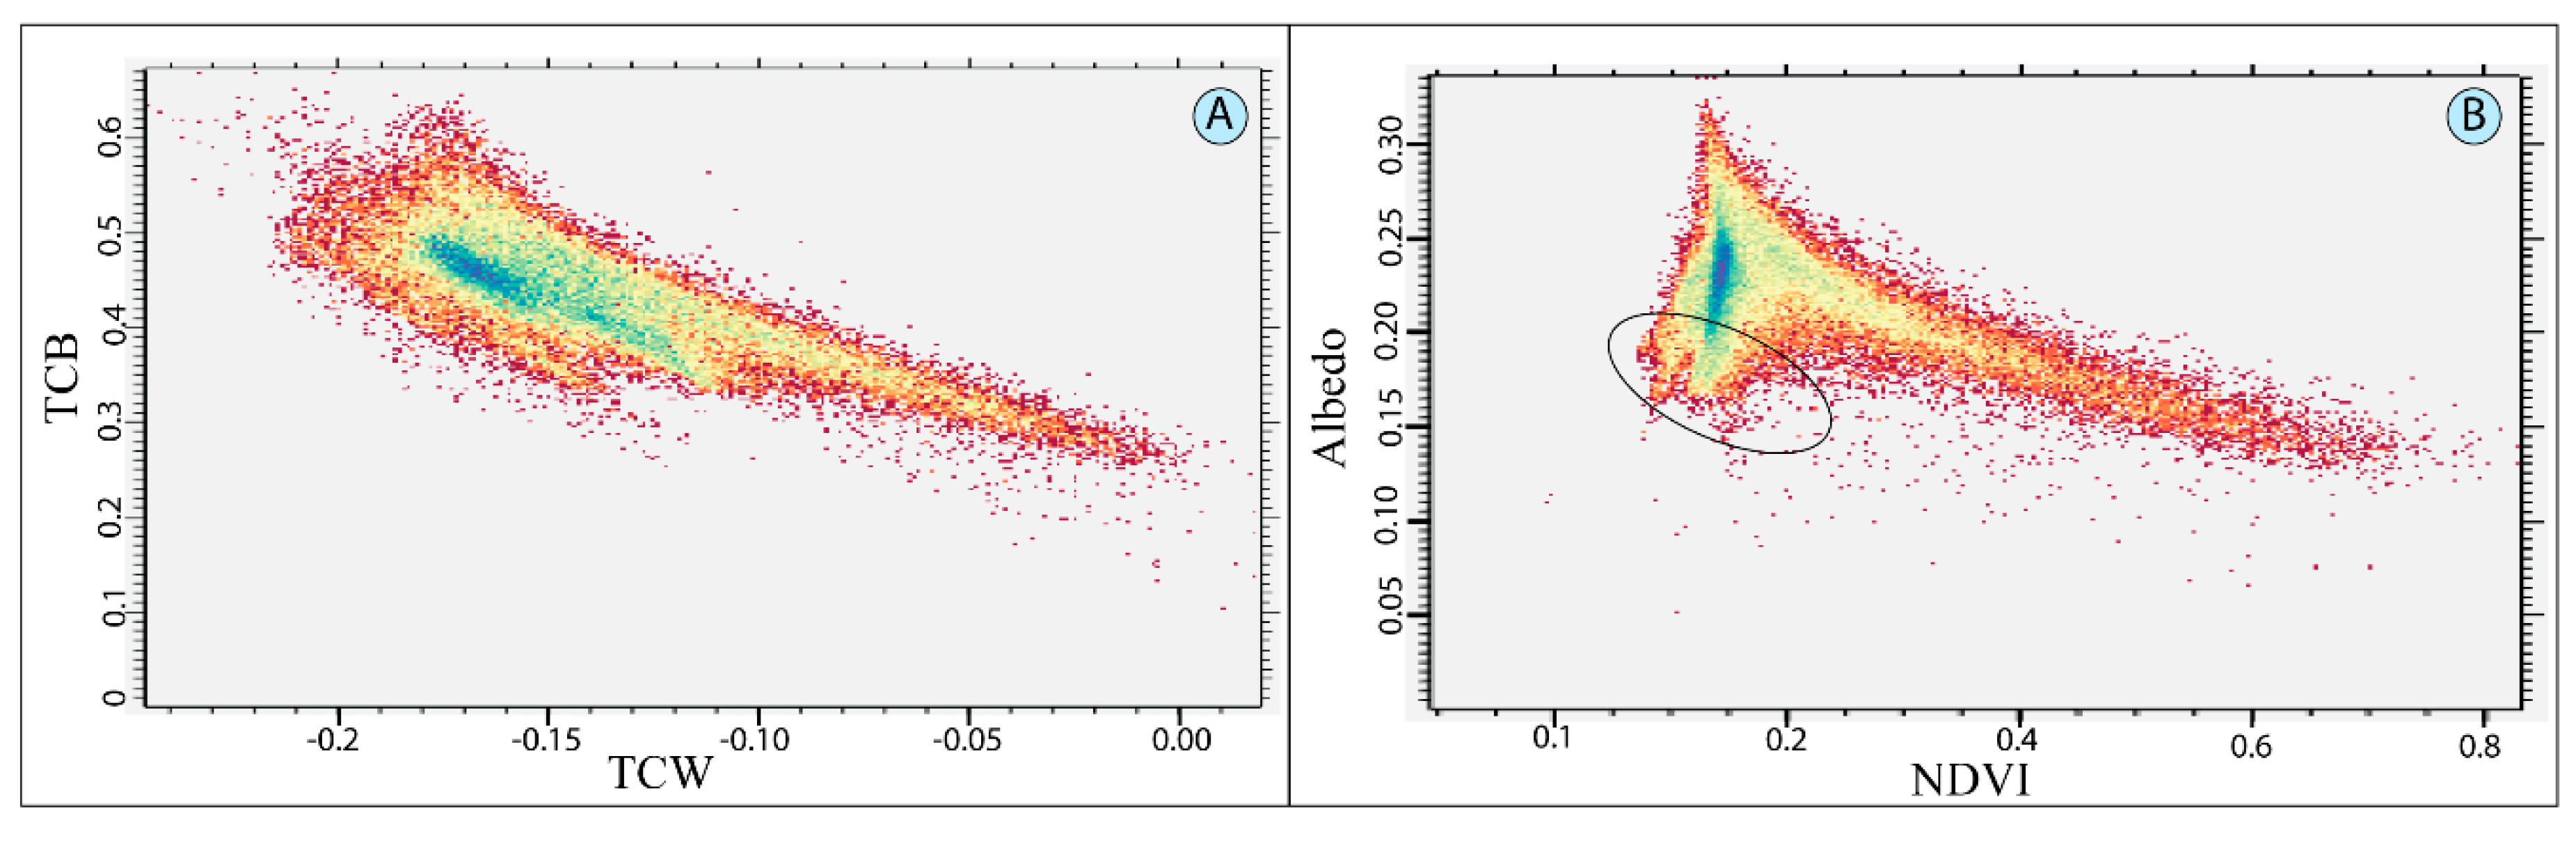
After linear correlation, two 2D feature spaces were realized and compared with the NDVI–α and TCW–TCB relationships. Based on visual interpretation and field data, the areas with high values of brightness corresponds to the soils with low organic matter, low or absence of vegetation and low soil moisture. These areas can be classified in the high risk of land desertification (Figure 4A). Zones with high values of soil moisture, that is, water and vegetation, belong to the low and nondesertification grades in the study site. Dry soil, which is characterized by high brightness and evaporation, is linked to the severe desertification class.
Figure 4B presents the feature space of NDVI–α; the no-correlation zone in the feature space corresponds to the moderate desertification grade and the water bodies (low pixel values of NDVI and α). The NDVI–α feature space does not support the areas of low (Black circle in the Figure 4B) and high land desertification grades.
4.3. Construction of the Desertification Degree Index (DDI)
The first step to extract the desertification degrees in the study area based on the feature space between TCW and TCB was to normalize the two indicators by considering the maximum (max) and minimum (min) values for each one (Equations (3) and (4)). The normalization of the biophysical indices was adopted by previous studies on desertification with feature space classification [16,21].
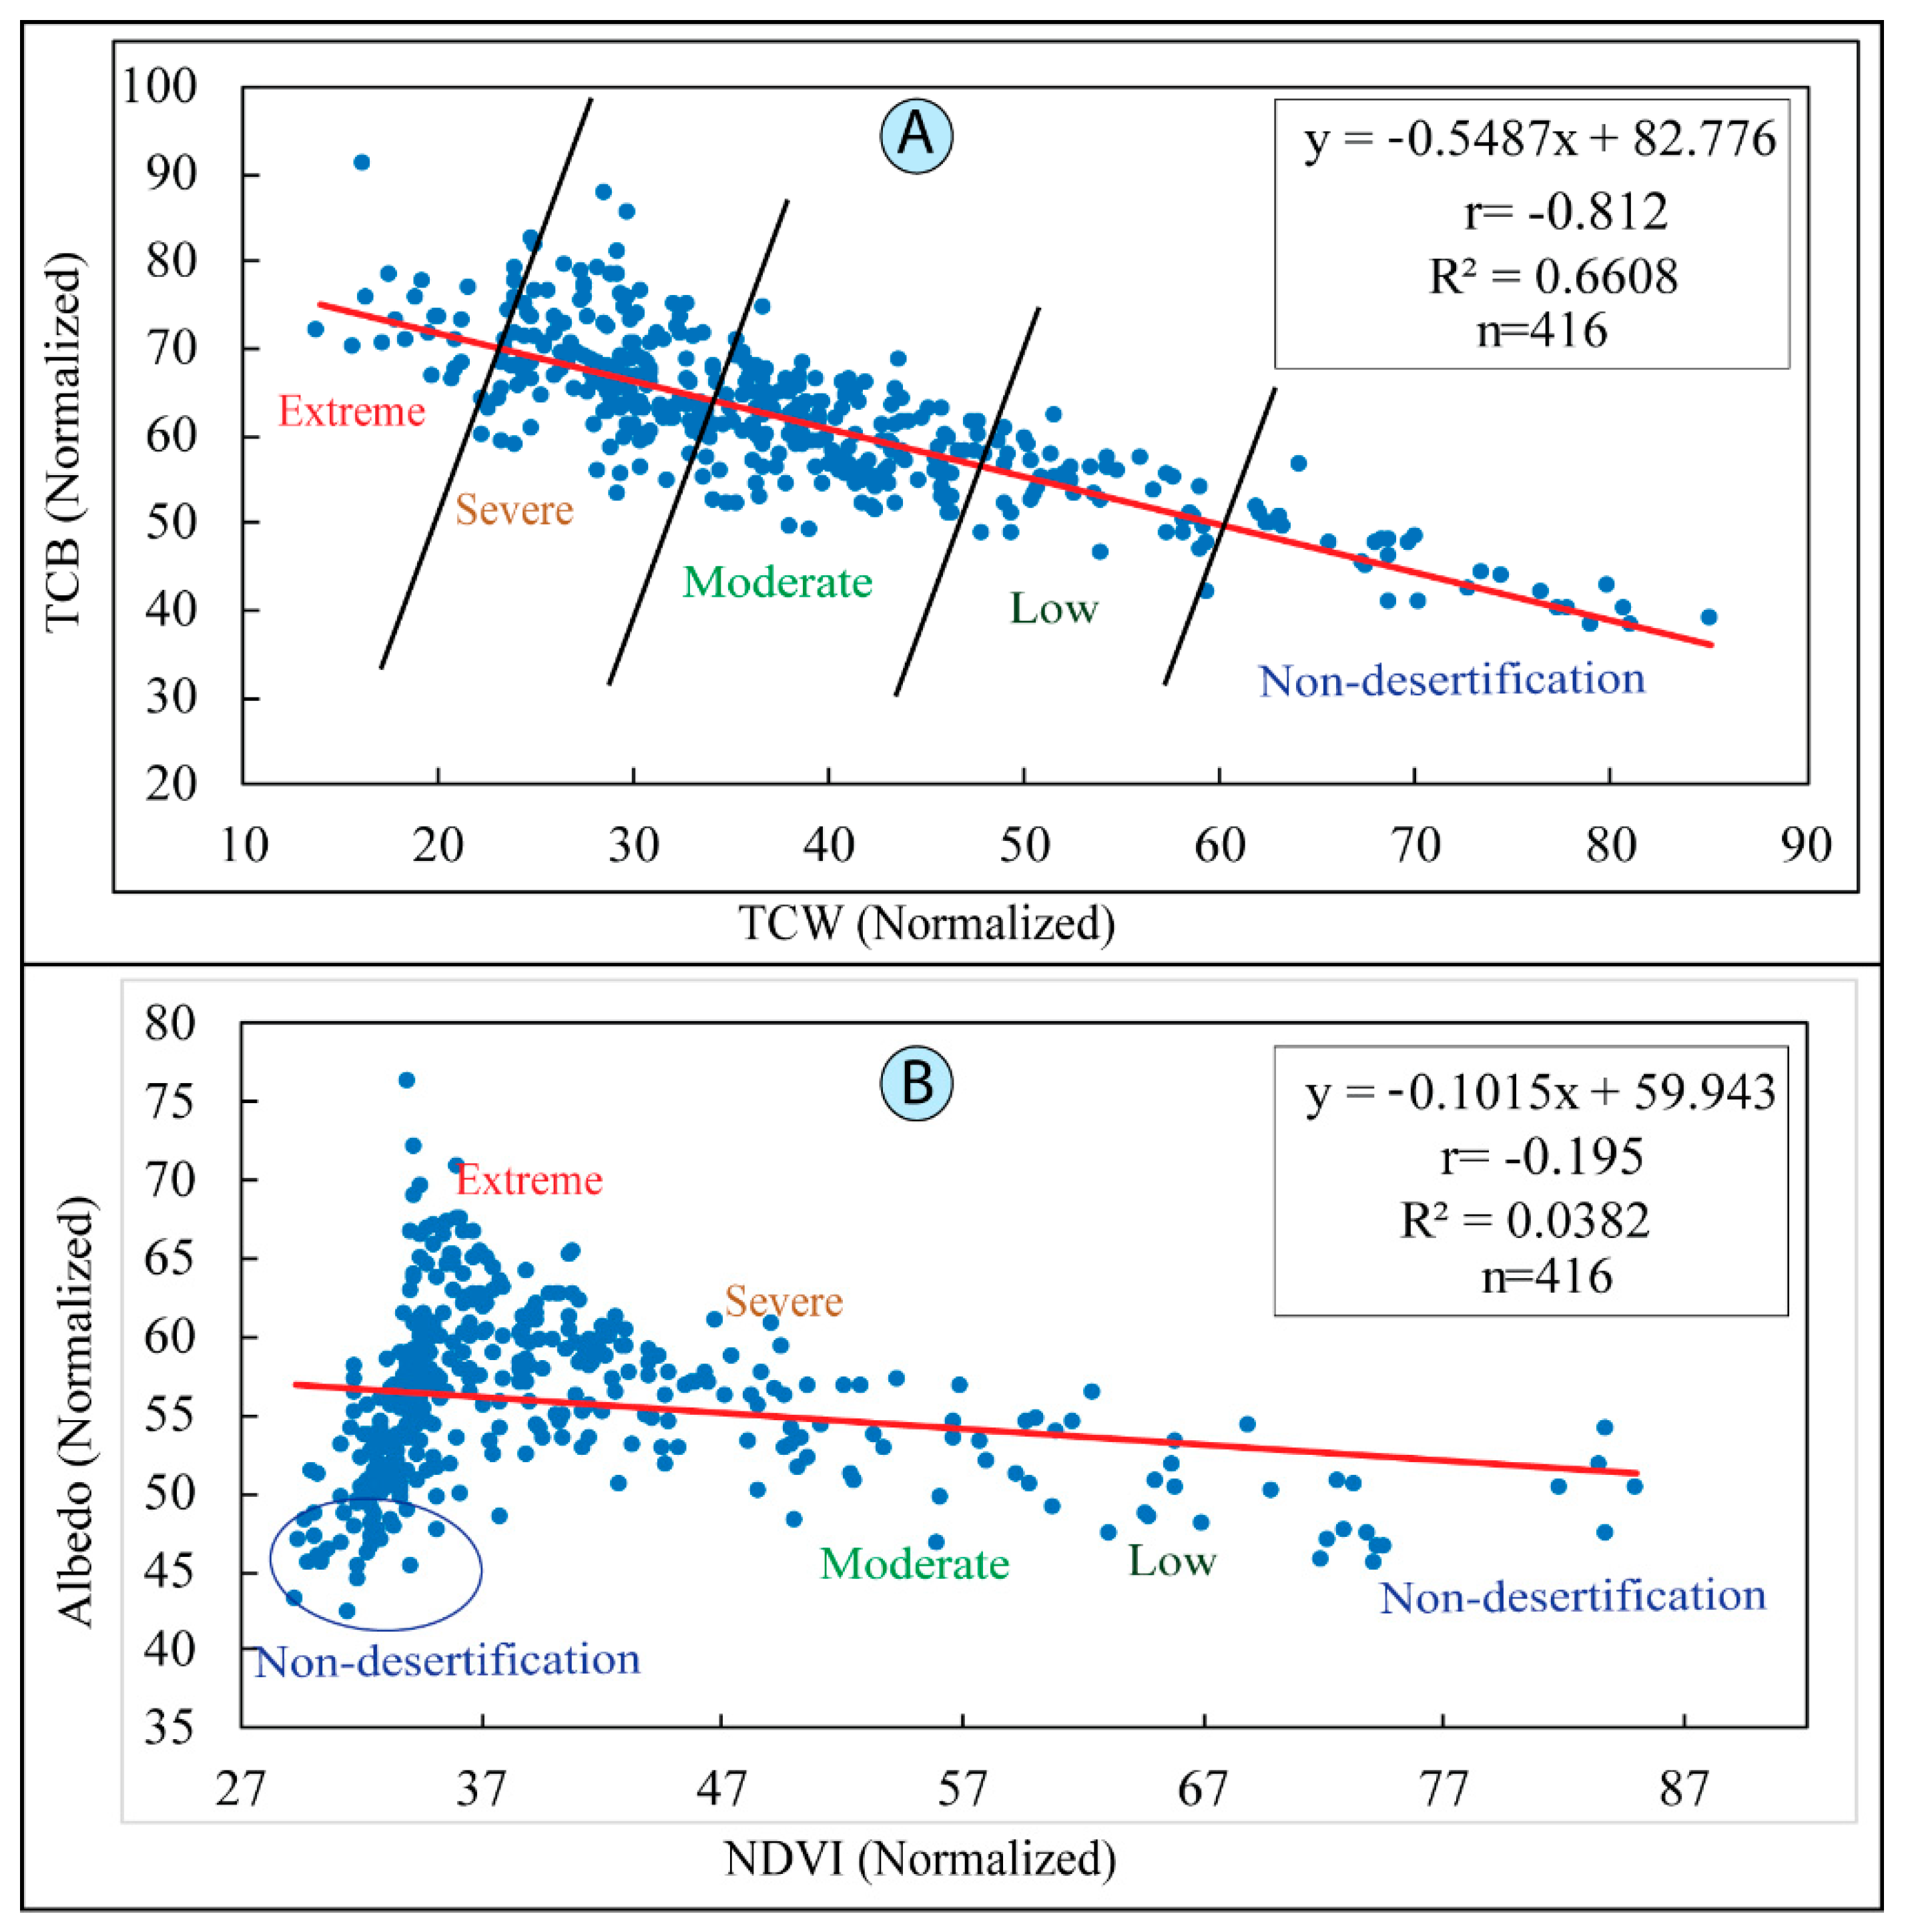
To analyse and extract different desertification grades in the TCW–TCB 2D feature space, a chart was drawn for different desertification classes based on the correlation analysis (Figure 5A). The 2D feature space of the NDVI-Albedo showed a low correlation for the extracted points from different land cover features (Figure 5B). Statistical regression analysis was performed on the raster graphics of TCW and TCB with the help of the grid regression function in ArcGIS. Results show that a significant negative linear correlation exists between TCW and TCB, which corresponds to different desertification grades in the MDV. The regression equation between the TCB and TCW, and NDVI-Albedo indices can be expressed in Equations (5) and (6):
DDI was performed in previous studies using the feature space between NDVI and albedo [15,16,21]. Ma et al. used a model to map the desertification threat based on the NDVI-albedo feature space classification [16]. By the comparison of the TCW-TCB relationship and the NDVI-albedo showed that the first relationship gives a high correlation, consequently, a better discrimination of the different feature classes. The model developed by [16] have a weakness to discriminate different grades of desertification, especially in the areas of water and moderate desertification.
A new method was proposed in this study to extract land desertification degrees based on the feature classification between the TCW–TCB performed using TCT. In this study, DDI is expressed as follows:
where a represents the slope of Equation (5). In this study, the value of a is (1/0.5487 = 1.82). By applying DDI, desertification degrees were classified into five grades: Nondesertification, low, moderate, severe extreme, using the Jenks natural break algorithm [42]. This algorithm was applied in several studies to extract the desertification grades in the arid areas with higher accuracy than the training sample or statistical data [15,16,21,44].
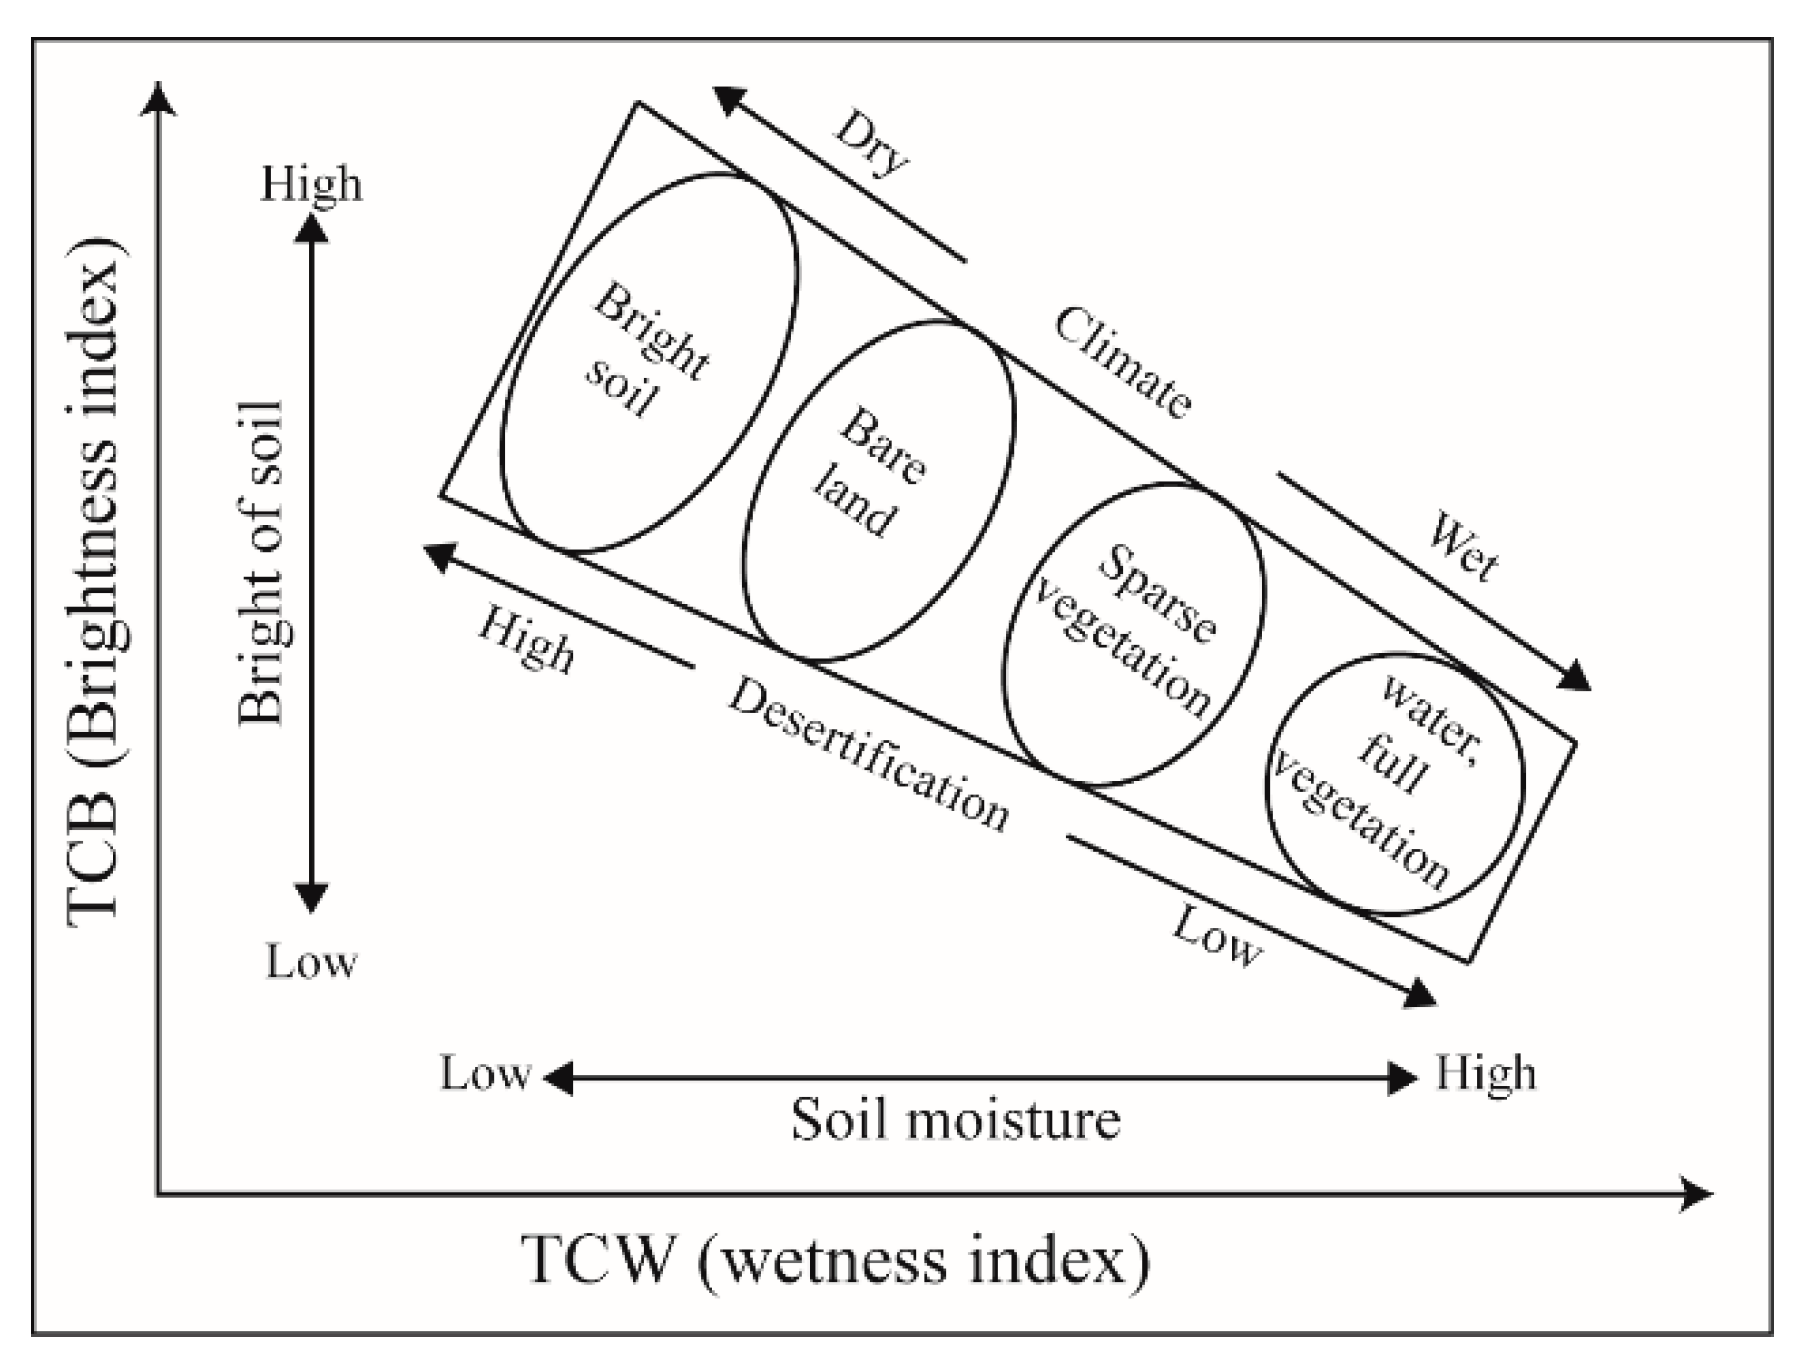
Correlation analysis and field data suggest that regions with high, bright soil corresponded to the poor soil of organic matter with high dryness. Zones of vegetation and water are characterized by soil moisture and low brightness of soil, due to the existence of vegetation and developed soils that are characterized by organic matter (dark colour). Desertification hazard in the study area can be modelled as presented in Figure 6.
4.4. Desertification Degree Assessment
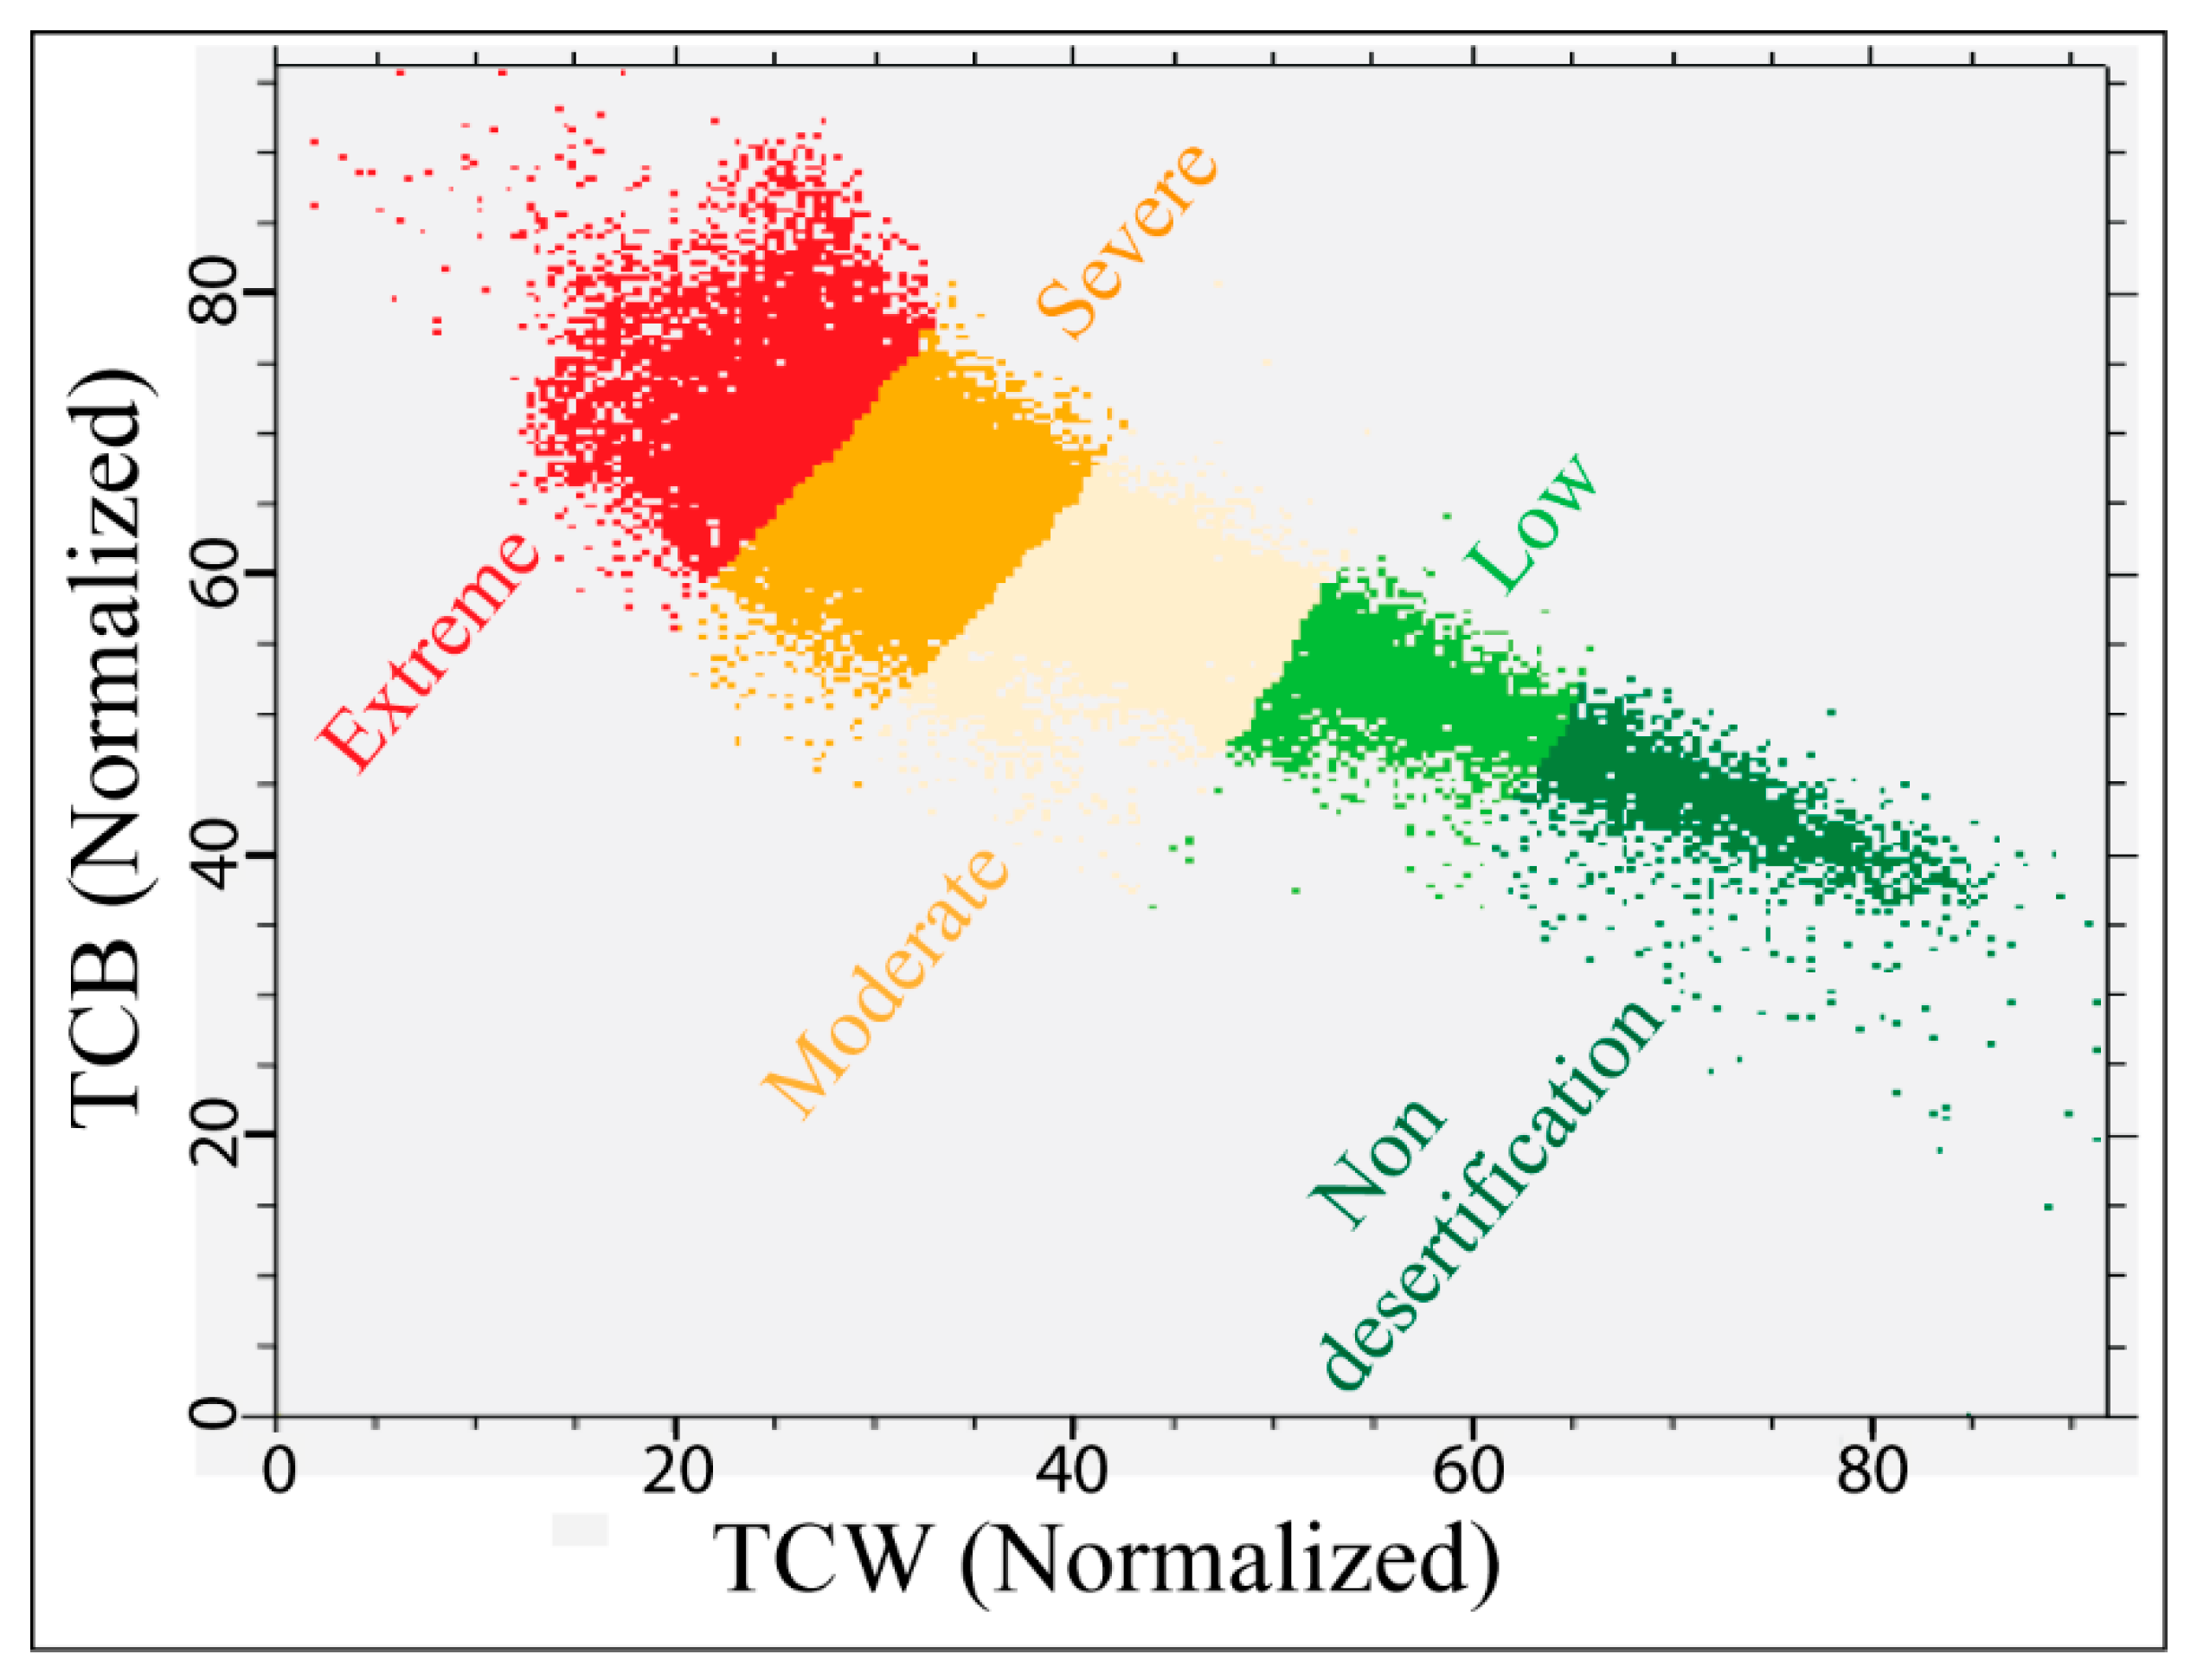
Figure 7 shows the graphical classification of different grades of desertification based on the TCW–TCB feature space.
More than 60% of the study area is classified in the severe and extreme desertification levels after the application of DDI. Only 6.20% is classified in the non-desertification level, which corresponds to the dense palm date zones (Table 4). Therefore, desertification in the MDV was serious in 2017.
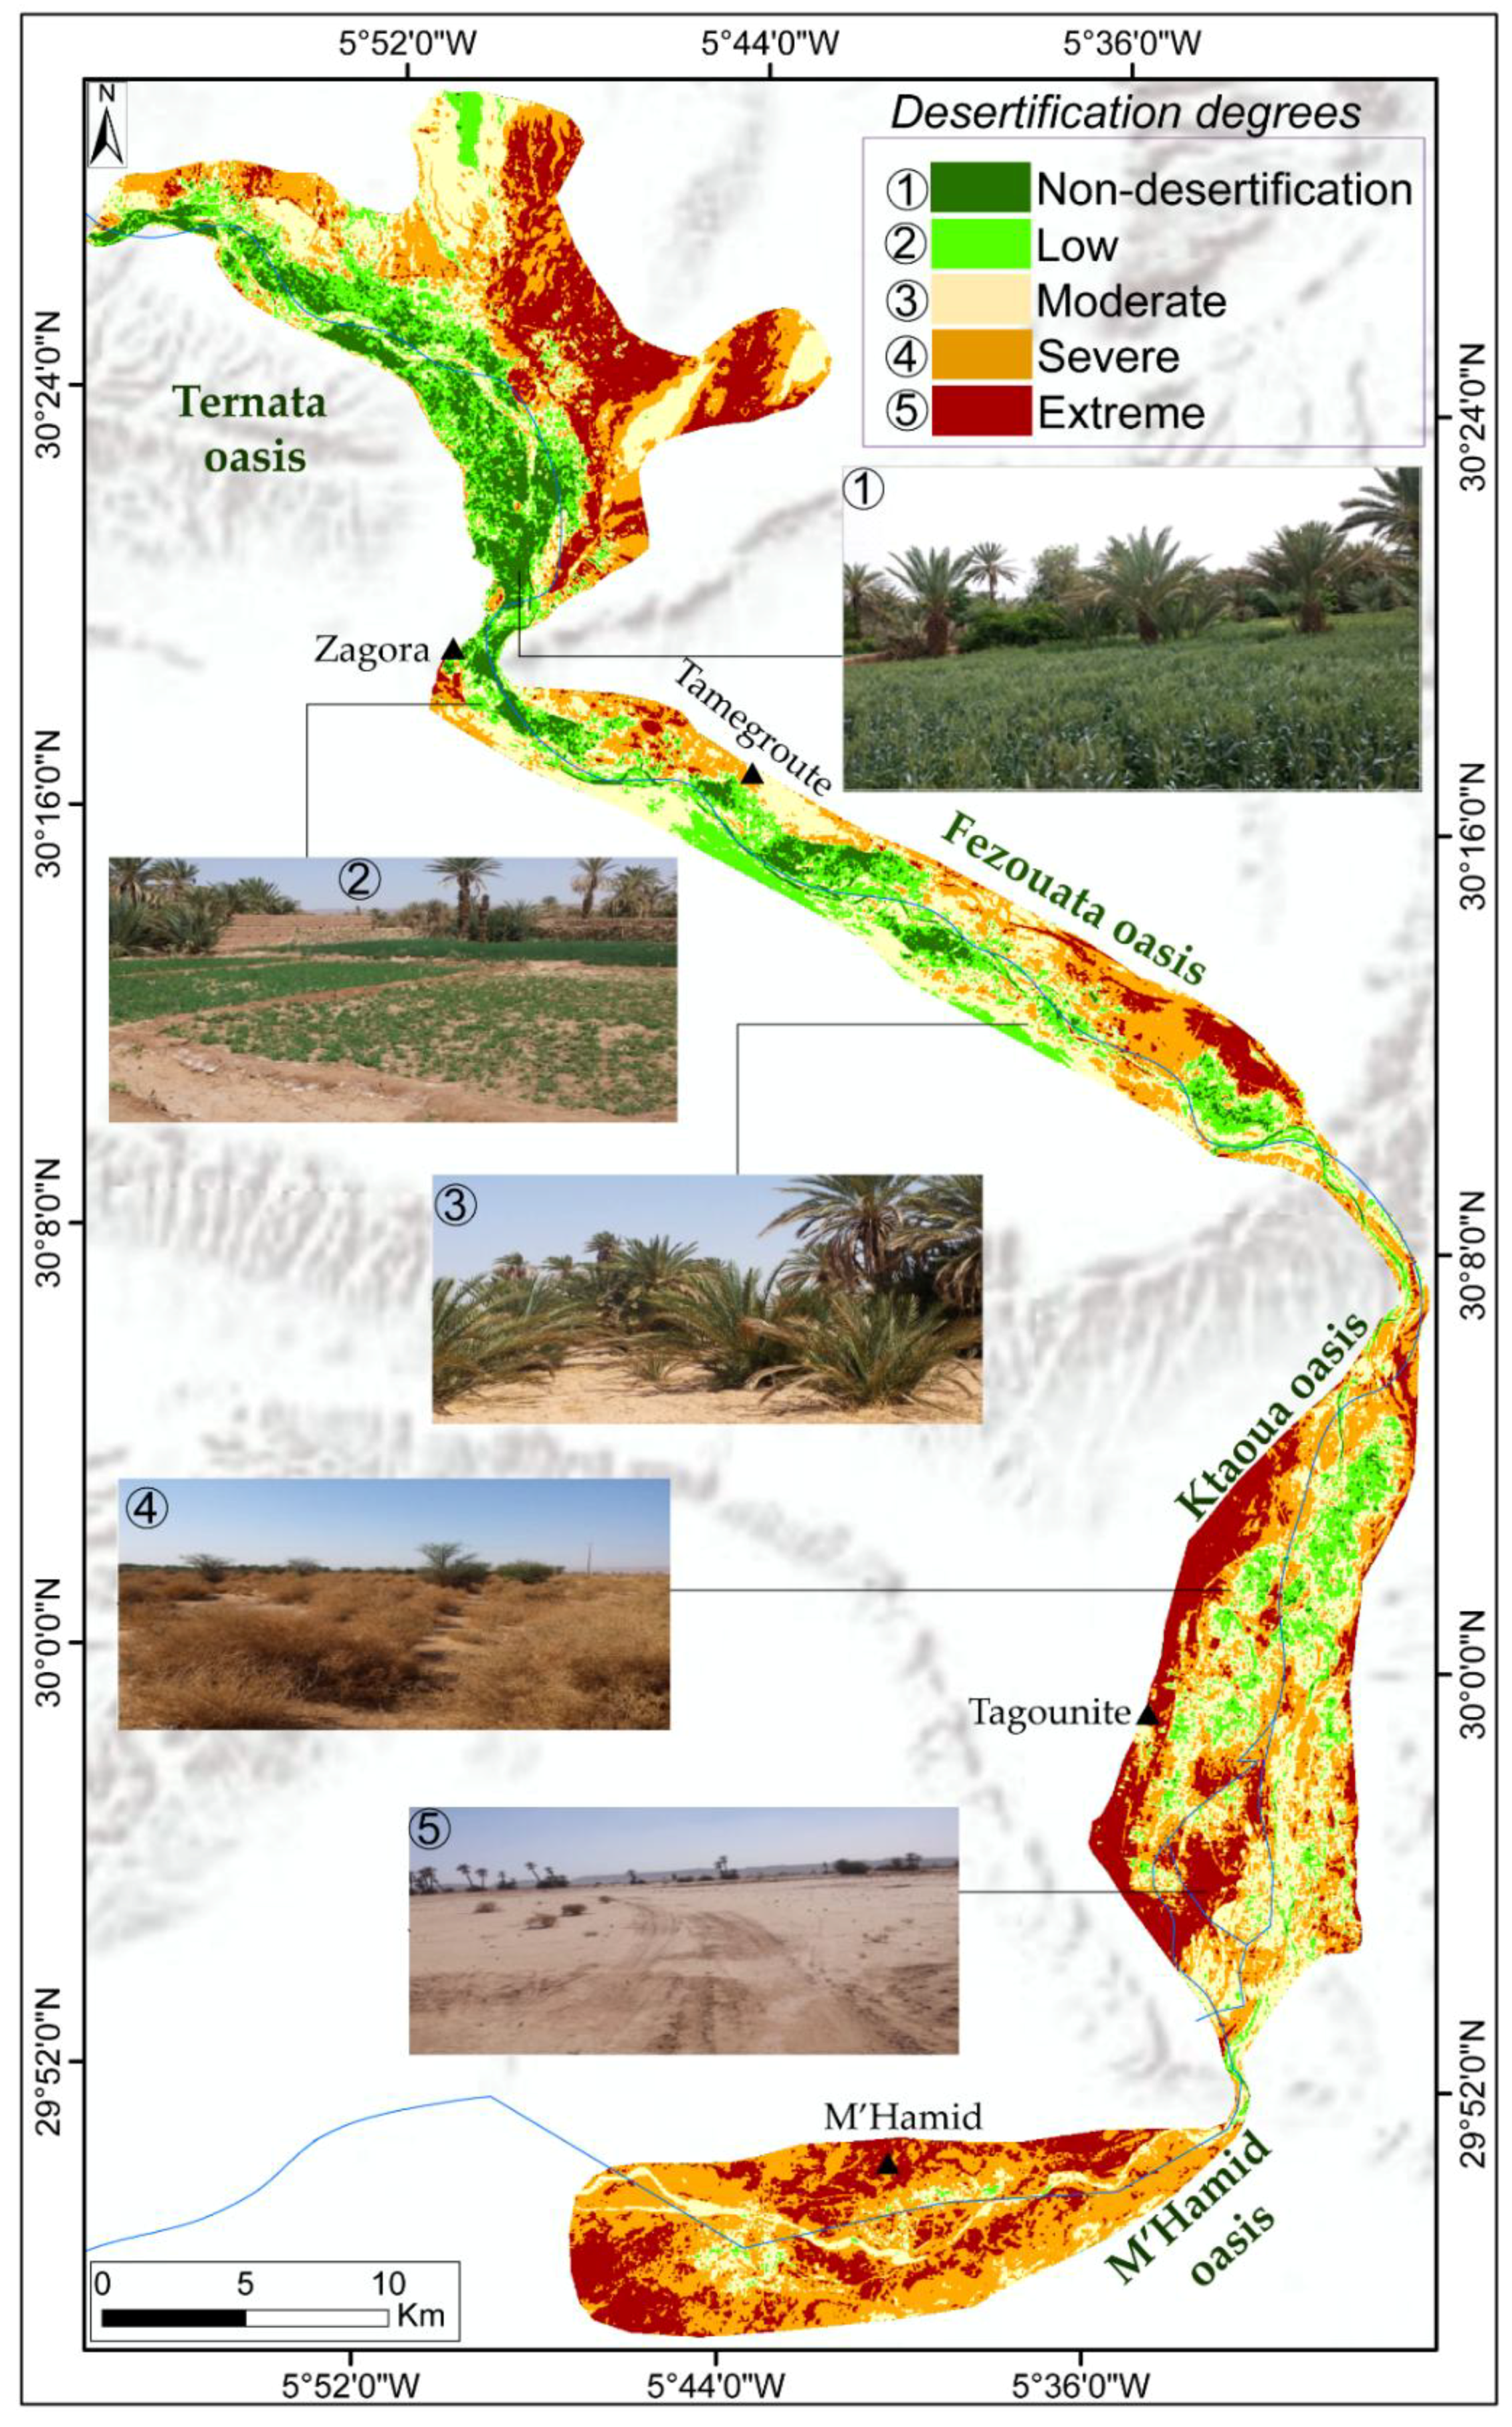
Figure 8 illustrates the spatial distribution of desertification degrees in the four oases of the MDV. The map presents five degrees: Non-desertification, low, moderate, severe and extreme, which further indicates a gradient of desertification from north to south. Desertification risk in the oases increases from north to south. The non-desertification and low classes are situated in the Ternata oasis. The most affected oases are Ktaoua and M’Hamid. Generally, desertified lands, which are caused by sand dune movements and wind erosion, are found around the oases.
The different local desertification classes are described in Table 5. Numbers 1 to 5 represent the desertification degrees from none to extreme, respectively. The second column of the table presents Google Earth images that correspond to each class, whereas the description column shows the main land cover component found in each degree.
4.5. Accuracy Assessment of the Results of the Desertification Degrees
Field sampling was conducted in June 2017 for accuracy assessment of the final map of desertification. In summary, 130 ground points were collected from five desertification degrees to validate the experiment. The selection of points was based on the accessibility and the homogeneity of the samples. The accuracy of the map was obtained through the confusion matrix using all the 130 points (Table 6). Overall accuracy reached 93.07%, with a Kappa coefficient of 0.91. The accuracy of non-desertification reached 95%, whereas extreme desertification reached 100%. Results indicate that the implication of bright soil and vegetation coverage fractions in a feature space can be a feasible and useful tool for the quantitative assessment of desertification threat (Table 7). The errors of omission represent pixels that belong to the ground truth class. However, the classification technique failed to classify them into the proper class. The errors of commission represent pixels that belong to another class, which are labelled as belonging to the class of interest.
5. Discussion
5.1. The Cap Tasselled Transformation Features and the Desertification Asessment
TCT was adopted to retrieve the indicators of TCW and TCB related to the soil witness and brightness and acquire the relative relationship of vegetation, water bodies and bright soils with the desertification process. On the basis of the correlation analysis of the indicators of soil moisture and other indicators, a desertification degree model was constructed in a TCW–TCW feature space to construct a map of different desertification grades of lands in the Middle Draa Valley. Based on the TCT, the proposed method and feature space classification take full benefit for the monitoring of the status in an arid ecosystem. The index, which is an easy, powerful, simple, quick, and efficient method, can be implemented using different satellites and sensors and different scales of study (local, regional) to facilitate quantitative assessment and monitoring of desertification grades in arid and semiarid areas.
Crist et al. (1986) reported similar result, which was a highly negative correlation between TCW and TCB, and made a comment that the TCW can have a more relevant datum for soil and vegetation management purpose [43]. The finding of this research also corroborated that the TCW can be used as a valuable indicator of the vegetation and environment assessment in arid and semi-arid areas.
Similar to previous studies [15,16,21], the NDVI–α model could not present a good discrimination between water bodies, dark bare soil and other features of land cover. The NDVI and surface albedo values are low for water and dark bare soil. The relationship between NDVI and surface albedo does not meet Equation (7); this finding means that the ‘I’ values of water bodies (corresponding to the non-desertification class) and dark soil are distributed more widely [16]. The dark soils, which represent the soils rich in organic matter, can be classified as low desertified lands. Furthermore, the integration of the wetness instead of the NDVI index in the 2D feature space provides a high discrimination of the different grades of land desertification.
5.2. Driving Forces of Desertification in the Middle Draa Valley
The causes of desertification of the oases in the MDV are natural and human factors. Analysis of the climatic data shows a climate characterized by a high intra-annual and intra-seasonal variability with high temperatures, especially in August. Precipitation is characterized by a binary pattern, either a succession of years of drought (1945–1947, 1979–1984, 1987, 1993–1995, 2015) or exceptional rainy years (1991, 1996, 2008 and 2014). This acute variability of precipitation generates a desertification of oasis palm and fruit trees in the early years of the last century.
The Middle Draa Valley is characterized by water salinity that causes soil salinity and the loss of soil productivity [25]. In addition, the oases, especially the M’Hamid, are exposed to the sand dune encroachment that affects the palm trees and causes desertification [22]. In recent years, watermelon farms have been cultivated in this area. The overexploitation of groundwater has caused the water shortage, and consequently leading to degradation and desertification of lands. Regarding the climatic conditions, the site is characterized by a low rainfall, high temperatures, and evaporation [26]. Those severe climate conditions influence the availability of water for the vegetation growth. With the absence of vegetation coverage, the lands are exposed to water and wind erosion [25].
The study site is also characterized by the shortage and the salinity of water, which affect the soil and contribute to desertification. The number of water motopumps increased rapidly in recent years, especially after the construction of the Mansour Eddahbi dam. This overexploitation of the groundwater implies the water level decline, which results in the desertification of lands in those regions.
The authors conducted a field study to collect water samples from the well of the study area. The measurement indicates that the average of water salinity was 2.7 g/L in Ternata, 4.36 g/L in Fezouata, 4.36 g/L in Ktaoua and 5.33 g/L in M’Hamid. These results show that water salinity increases from north to south of the MDV. This finding confirms the result of the final map of the desertification. The most desertified lands are located in the Ktaoua and M’Hamid oases.
The socioeconomic factors can contribute to the deterioration of the ecosystems in the study area. The local people cut wood in pastoral lands for domestic purposes or pottery, especially in the Fezouata oasis, due to poverty [25]. Furthermore, anthropogenic pressure and overgrazing affect the pastoral lands, especially in the southern part of the MDV. According to the census of the Regional Centre of Agricultural Development of Ouarzazate, the number of camels in M’Hamid and Ternata oases was more than 8400 [25]. Grazing in the pastoral lands makes vegetation sparse or absent in those areas, thereby resulting in short-term desertification through water or soil erosion.
The only choice for local residents is mass migration, because of desertification and severe climatic conditions. In the M’Hamid oasis, the number of inhabitants decreased from 8671 in 1982 to 6781 in 2014 [22].
6. Conclusions
In this study, a desertification monitoring index was proposed based on the relationship between desertification and two indexes, such as soil moisture (TCT) and soil brightness (TCB). Then the proposed index was applied, using the Sentinel-2 image, to assess quantitively the desertification in the Middle Drâa Valley. The analysis revealed the combination TCT-TCB gives better results compared to the NDVI-albedo combination. However, the calculated index (DDI) makes full use of easy accessed of desertification using other multi-spectral remote sensing images, and it is robust, easy to achieve, accurate, efficient for desertification monitoring, and only depend on the remote sensing image itself to extract desertification grades. The DDI was applied to map quantitatively the desertification grades. The applied method produced higher accuracy (overall accuracy = 93.07 %). Moreover, the employed methodology is fast and easy to implement and efficient for the quantitative assessment of land degradation. The results of the map of the desertification revealed that over 26.92% (195.28 Km2) and 32.85% (123.62 km2) are classified under severe and extreme grades of desertification, respectively. Only 6.20% (36.94 km2) of the Middle Draa Valley are classified in the non-desertification degree class.
The most affected zones by the desertification threat are located in south of the study area especially in the Ktaoua and M’Hamid oases. Those areas are characterized by sand dune movements, soil and water salinities, and low precipitations.
The desertification map preliminarily supports local and national authorities who work for the protection of fragile landscapes. This map will facilitate the protection of valuable land resource and will also determine the region that needs intervention.
The proposed approach can be replicated and transferable in other arid and semi-arid regions, especially in North Africa, the Middle East, and Asia. These areas are generally characterized by a high desertification risk with a low vegetation coverage density. Different multi-spectral remote sensing data, such as Landsat and Sentinel-2, can be used to apply the developed index.
Author Contributions
A.A.L. conceptualised the study. A.A.L. and H.S. collected and analysed the data. A.A.L., H.S. and B.P. performed analysis and validation and wrote the manuscript. A.A.L., H.S. and B.P. contributed to the restructuring and editing of the manuscript. A.A.L. and B.P. optimised the manuscript professionally.
Funding
This research was funded by the UTS under grant number 321740.2232335 and 321740.2232357.
Acknowledgments
We thank the National Centre of the Scientific and Technique Research for the scholarship of PhD. student A.A.L. (Scholarship N° 1UCD2016). We also thank Chouaïb Doukkali University for the logistical support during the field work of this study.
Conflicts of Interest
The authors declare no conflict of interest.
References
- UNCCD. United Nations Convention to Combat Desertification in those Countries Experiencing Serious Drought and/or Desertification, Particularly in Africa; United Nations Convention to Combat Desertification: Paris, France, 19 June 1994. [Google Scholar]
- Lamchin, M.; Lee, J.Y.; Lee, W.K.; Lee, E.J.; Kim, M.; Lim, C.H.; Choi, H.A.; Kim, S.R. Assessment of land cover change and desertification using remote sensing technology in a local region of Mongolia. Adv. Space Res. 2016, 57, 64–77. [Google Scholar] [CrossRef]
- Guo, Q.; Fu, B.; Shi, P.; Cudahy, T.; Zhang, J.; Xu, H. Satellite Monitoring the Spatial-Temporal Dynamics of Desertification in Response to Climate Change and Human Activities across the Ordos Plateau, China. Remote Sens. 2017, 9, 525. [Google Scholar] [CrossRef]
- Hammouzaki, Y. Desertification and Its Control in Morocco. In Combating Desertification in Asia, Africa and the Middle East; Heshmati, G.A., Squires, V.R., Eds.; Springer: Dordrecht, The Netherlands, 2013; pp. 91–111. [Google Scholar]
- Benbrahim, K.F.; Ismaili, M.; Benbrahim, S.F.; Tribak, A. Problèmes de dégradation de l’environnement par la désertification et la déforestation: impact du phénomène au Maroc. Sci. Chang. Planét. Sécher. 2004, 15, 307–320. [Google Scholar]
- Benmohammadi, A.; Benmohammadi, L.; Ballais, J.-L.; Riser, J. Analyse des inter-relations anthropiques et naturelles: leur impact sur la recrudescence des phénomènes d’ensablement et de désertification au sud-est du Maroc (vallée de Drâa et vallée de Ziz). Sécheresse 2000, 11, 297–308. [Google Scholar]
- Huang, S.; Siegert, F. Land cover classification optimized to detect areas at risk of desertification in North China based on SPOT VEGETATION imagery. J. Arid Environ. 2006, 67, 308–327. [Google Scholar] [CrossRef]
- Meng, D.; Zhang, Z.; Yang, T.; Gong, H.; Zhao, W.; Li, X.; Gong, Z.; Wang, Y.; Hu, Z.; Sun, Y. Research on dynamic evolvement of desertification in Beijing and its neighboring areas by remote sensing. Int. Geosci. Remote Sens. Symp. 2007, 699–701. [Google Scholar] [CrossRef]
- Guang, Y.; Dong, C.; Xinlin, H.; Aihua, L.; Mingjie, Y.; Xiaolong, L. Land use change characteristics affected by water saving practices in Manas River Basin, China using Landsat satellite images. Int. J. Agric. Biol. Eng. 2017, 10, 123–133. [Google Scholar] [CrossRef]
- Wang, X.; Hua, T.; Lang, L.; Ma, W. Spatial differences of aeolian desertification responses to climate in arid Asia. Glob. Planet. Chang. 2017, 148, 22–28. [Google Scholar] [CrossRef]
- Xiao, J.; Shen, Y.; Ryutaro, T.; Bayaer, W. Detection of land desertification and topsoil grain size using remote sensing. Int. Geosci. Remote Sens. Symp. 2005, 1, 198–201. [Google Scholar] [CrossRef]
- Wang, Y.; Zhang, J.; Tong, S.; Guo, E. Monitoring the trends of aeolian desertified lands based on time-series remote sensing data in the Horqin Sandy Land, China. Catena 2017, 157, 286–298. [Google Scholar] [CrossRef]
- Hill, J.; Stellmes, M.; Udelhoven, T.; Röder, A.; Sommer, S. Mediterranean desertification and land degradation: Mapping related land use change syndromes based on satellite observations. Glob. Planet. Chang. 2008, 64, 146–157. [Google Scholar] [CrossRef]
- Afrasinei, G.M.; Melis, M.T.; Buttau, C.; Arras, C.; Zerrim, A.; Guied, M.; Ouessar, M.; Essifi, B.; Zaied, M.B.; Jlali, A.; et al. Classification Methods for Detecting and Evaluating Changes in Desertification-Related Features in Arid and Semi-arid Environments. Euro-Mediterr. J. Environ. Integr. 2017, 21. [Google Scholar] [CrossRef]
- Pan, J.; Li, T. Extracting desertification from Landsat TM imagery based on spectral mixture analysis and Albedo-Vegetation feature space. Nat. Hazards 2013, 68, 915–927. [Google Scholar] [CrossRef]
- Ma, Z.; Xie, Y.; Jiao, J.; li, L.; Wang, X. The Construction and Application of an Aledo-NDVI Based Desertification Monitoring Model. Procedia Environ. Sci. 2011, 10, 2029–2035. [Google Scholar] [CrossRef]
- Jin, S.; Sader, S.A. Comparison of time series tasseled cap wetness and the normalized difference moisture index in detecting forest disturbances. Remote Sens. Environ. 2005, 94, 364–372. [Google Scholar] [CrossRef]
- Liu, Q.; Liu, G.; Huang, C.; Xie, C. Comparison of tasselled cap transformations based on the selective bands of Landsat 8 OLI TOA reflectance images. Int. J. Remote Sens. 2015, 36, 417–441. [Google Scholar] [CrossRef]
- Kauth, R.J.; Thomas, G.S. The Tasselled Cap—A Graphic Description of the Spectral-Temporal Development of Agricultural Crops as Seen by LANDSAT. In Proceedings of the Symposium on Machine Processing of Remotely Sensed Data, West Lafayette, IN, USA, 29 June–1 July 1976; Swain, P.H., Ed.; Institute of Electrical and Electronics Engineers, Purdue University Press: West Lafayette, IN, USA, 1976; pp. 41–51. [Google Scholar]
- Jackson, R.D.; Idso, S.B.; Otterman, J. Surface Albedo and Desertification. Science 1975, 189, 1012–1015. [Google Scholar] [CrossRef] [PubMed] [Green Version]
- Becerril-Piña, R.; Díaz-Delgado, C.; Mastachi-Loza, C.A.; González-Sosa, E. Integration of remote sensing techniques for monitoring desertification in Mexico. Hum. Ecol. Risk Assess. Int. J. 2016, 22, 1323–1340. [Google Scholar] [CrossRef]
- Ait Lamqadem, A.; Saber, H.; Rahimi, A. Spatiotemporal Changes of Vegetation in the Middle Draa Valley Oasis: A Study Case o f M’hamid El Ghizlane Oasis (Morocco). Eur. Sci. J. 2017, 13, 115–132. [Google Scholar] [CrossRef]
- Schmidt, M.; Thamm, H.P.; Menz, G. Long term vegetation change detection in an and environment using LANDSAT data. In Geoinformation for European-wide Integration; Benes, T., Ed.; Millpress: Rotterdam, The Netherlands, 2003; pp. 145–154. ISBN 90-77017-71-2. [Google Scholar]
- Karmaoui, A.; Ifaadassan, I.; Babqiqi, A.; Messouli, M.; Khebiza, M.Y. Analysis of the Water Supply-demand Relationship in the Middle Draa Valley, Morocco, under Climate Change and Socio-economic Scenarios. J. Sci. Res. Rep. 2016, 9, 1–10. [Google Scholar] [CrossRef]
- Ait Lamqadem, A.; Pradhan, B.; Saber, H.; Rahimi, A. Desertification Sensitivity Analysis Using MEDALUS Model and GIS: A Case Study of the Oases of Middle Draa Valley, Morocco. Sensors 2018, 18, 2230. [Google Scholar] [CrossRef] [PubMed]
- Bentaleb, A. Dynamique de Désertification dans les Oasis du Draa Moyen, 1st ed.; Éditions universitaires européennes: Quebec City, QC, Canada, 2015; ISBN 3841664431. [Google Scholar]
- Aït Hamza, M.; El Faskaoui, B.; Fermin, A. Les oasis du Drâa au Maroc: Rupture des équilibres environnementaux et stratégies migratoires. Hommes Migr. 2010, 1284, 56–69. [Google Scholar] [CrossRef]
- Wulder, M.A.; Hilker, T.; White, J.C.; Coops, N.C.; Masek, J.G.; Pflugmacher, D.; Crevier, Y. Virtual constellations for global terrestrial monitoring. Remote Sens. Environ. 2015, 170, 62–76. [Google Scholar] [CrossRef]
- Tromp, M.; Epema, G.F. Spectral mixture analysis for mapping land degradation in semi-arid areas. Geol. Mijnb. 1998, 77, 153–160. [Google Scholar] [CrossRef]
- Vorovencii, I. Assessing and monitoring the risk of land degradation in Baragan Plain, Romania, using spectral mixture analysis and Landsat imagery. Environ. Monit. Assess. 2016, 188, 439. [Google Scholar] [CrossRef] [PubMed]
- Afrasinei, G.M.; Melis, M.T.; Buttau, C.; Bradd, J.M.; Arras, C.; Ghiglieri, G. Assessment of remote sensing-based classification methods for change detection of salt-affected areas (Biskra area, Algeria). J. Appl. Remote Sens. 2017, 11, 016025. [Google Scholar] [CrossRef] [Green Version]
- Afrasinei, G.M.; Melis, M.T.; Arras, C.; Pistis, M.; Buttau, C.; Ghiglieri, G. Spatiotemporal and spectral analysis of sand encroachment dynamics in southern Tunisia. Eur. J. Remote Sens. 2018, 51, 352–374. [Google Scholar] [CrossRef]
- Zanchetta, A.; Bitelli, G.; Karnieli, A. Monitoring desertification by remote sensing using the Tasselled Cap transform for long-term change detection. Nat. Hazards 2016, 83, 223–237. [Google Scholar] [CrossRef]
- Ouwehand, L. (Ed.) Sentinel-2 Sen2Cor: L2A Processor for Users. In Proceedings of the Living Planet Symposium, Prague, Czech Republic, 9–13 May 2016; ESA Communications: Noordwijk, The Netherlands, 2016; pp. 1–8. [Google Scholar]
- Gillespie, T.W.; Ostermann-Kelm, S.; Dong, C.; Willis, K.S.; Okin, G.S.; MacDonald, G.M. Monitoring changes of NDVI in protected areas of southern California. Ecol. Indic. 2018, 88, 485–494. [Google Scholar] [CrossRef]
- Naegeli, K.; Damm, A.; Huss, M.; Wulf, H.; Schaepman, M.; Hoelzle, M. Cross-comparison of albedo products for glacier surfaces derived from airborne and satellite (Sentinel-2 and Landsat 8) optical data. Remote Sens. 2017, 9, 110. [Google Scholar] [CrossRef]
- Li, S.G.; Harazono, Y.; Oikawa, T.; Zhao, H.L.; He, Z.Y.; Chang, X.L. Grassland desertification by grazing and the resulting micrometeorological changes in Inner Mongolia. Agric. For. Meteorol. 2000, 102, 125–137. [Google Scholar] [CrossRef]
- Liang, S. Narrowband to broadband conversions of land surface albedo I: Algorithms. Remote Sens. Environ. 2001, 76, 213–238. [Google Scholar] [CrossRef]
- Nedkov, R. Orthogonal transformation of segmented images from the satellite sentinel-2. Comptes rendus l’Academie bulgare des Sciences 2017, 70, 687–692. [Google Scholar]
- Pan, J.; Quin, X. Extracting desertification from landsat imagery using a feature space composed of vegetation index and albedo a case study of Zhangye oasis and its adjacent areas. Sci. Surv. Mapp. 2010, 3, 193–195. [Google Scholar]
- Liu, Q.; Liu, G.; Huang, C. Monitoring desertification processes in Mongolian Plateau using MODIS tasseled cap transformation and TGSI time series. J. Arid Land 2018, 10, 12–26. [Google Scholar] [CrossRef]
- Jenks, G.F. Generalization in statistical mapping. Ann. Assoc. Am. Geogr. 1963, 53, 15–26. [Google Scholar] [CrossRef]
- Crist, E.P.; Laurin, R.; Cicone, R.C. Vegetation and Soils Information Contained in Transformed Thematic Mapper Data. Proceedings of International Geoscience and Remote Sensing 86 Symposium, Zurich, Switzerland, 8–11 September 1986; pp. 1465–1470. [Google Scholar]
- Zeng, Y.-N.; Xiang, N.-P.; Feng, Z.-D. Albedo-NDVI Space and Remote Sensing Synthesis Index Models for Desertification Monitoring. Sci. Geogr. Sin. 2006, 26, 75–81. [Google Scholar]
Figure 1.
(A) Morocco in Africa; (B) Zagora Province in Morocco; (C) study area.

Figure 2.
Methodological flowchart. NDVI, normalized difference vegetation index; MDV, Middle Draa Valley.
Figure 2.
Methodological flowchart. NDVI, normalized difference vegetation index; MDV, Middle Draa Valley.

Figure 3.
(A) A Red-Green-Blue colour composite of the Sentinel-2 MSI image; (B) NDVI; (C) Albedo; (D) Tasselled Cap wetness; (E) Tasselled Cap greenness; and (F) Tasselled Cap brightness map.
Figure 3.
(A) A Red-Green-Blue colour composite of the Sentinel-2 MSI image; (B) NDVI; (C) Albedo; (D) Tasselled Cap wetness; (E) Tasselled Cap greenness; and (F) Tasselled Cap brightness map.

Figure 4.
Scatterplot diagrams of: (A) TCW–TCB and (B) NDVI–albedo.

Figure 5.
Correlation analysis of the relationship of: (A) TCW–TCB reflectivity; (B) NDVI-Albedo reflectivity.
Figure 5.
Correlation analysis of the relationship of: (A) TCW–TCB reflectivity; (B) NDVI-Albedo reflectivity.

Figure 6.
Soil brightness and wetness indicators in relation with desertification degrees.

Figure 7.
TCW–TCB values and their classification into categories of the desertification degrees in the study site.
Figure 7.
TCW–TCB values and their classification into categories of the desertification degrees in the study site.

Figure 8.
Desertification degree map corresponding to the oases of the MDV.


Table 1.
Spectral and spatial resolution of the Sentinel-2 MSI bands.
| Sentinel-2 Bands | Resolution | Central Wavelengths (nm) | Bandwidth (nm) |
|---|---|---|---|
| Band 1: Coastal/aerosols | 60 m | 443 | 20 |
| Band 2: Visible Blue | 10 m | 490 | 65 |
| Band 3: Visible Green | 10 m | 560 | 35 |
| Band 4: Visible Red | 10 m | 665 | 30 |
| Band 5: Vegetation Red Edge | 20 m | 705 | 15 |
| Band 6: Vegetation Red Edge | 20 m | 740 | 15 |
| Band 7: Vegetation Red Edge | 20 m | 783 | 20 |
| Band 8: Near-Infrared | 10 m | 842 | 115 |
| Band 8A: Narrow NIR | 20 m | 865 | 20 |
| Band 9: water vapour | 60 m | 945 | 20 |
| Band 11: Cirrus | 60 m | 1375 | 30 |
| Band 11: SWIR 1 | 20 m | 1610 | 90 |
| Band 12: WRIR 2 | 20 m | 2190 | 180 |
Table 2.
Coefficients of the transformation of Sentinel-2 MSI image to tasselled cap transformation (TCT).
Table 2.
Coefficients of the transformation of Sentinel-2 MSI image to tasselled cap transformation (TCT).
| Features | Band 1 | Band 2 | Band 3 | Band 4 | Band 5 | Band 6 | Band 7 |
| Brightness | 0.0356 | 0.0822 | 0.1360 | 0.2611 | 0.2964 | 0.3338 | 0.3877 |
| Greenness | −0.0635 | −0.1128 | −0.1680 | −0.3480 | −0.3303 | 0.0852 | 0.3302 |
| Wetness | 0.0649 | 0.1363 | 0.2802 | 0.3072 | 0.5288 | 0.1379 | −0.0001 |
| Features | Band 8 | Band 9 | Band 10 | Band 11 | Band 12 | Band 8A | |
| Brightness | 0.3895 | 0.949 | 0.0009 | 0.3882 | 0.1366 | 0.4750 | |
| Greenness | 0.3165 | 0.0467 | −0.0009 | −0.4578 | −0.4064 | 0.3625 | |
| Wetness | −0.0807 | −0.0302 | 0.0003 | −0.4064 | −0.5602 | −0.1389 |
B1 to B12 are bands 1 to 12 of the B2 MSI image, respectively.
Table 3.
Linear correlations of the three combinations for 2017.
| Classes | NDVI-α | TCW-TCB | TCG-TCB |
|---|---|---|---|
| Nondesertification | −0.428 | −0.879 | −0.318 |
| Low | 0.749 | −0.038 | 0.285 |
| Moderate | 0.243 | −0.592 | 0.208 |
| Severe | −0.077 | −0.775 | 0.0412 |
| Extreme | −0.434 | −0.467 | 0.018 |
Table 4.
The I values of different desertification classes.
| Desertification Class | I Value | Area (km²) | Coverage (%) |
|---|---|---|---|
| Non-desertification | >64.94 | 36.88 | 6.20 |
| Low | 29.70 to 64.94 | 78.74 | 13.24 |
| Moderate | 3.78 to 29.70 | 160.02 | 20.79 |
| Severe | −17.98 to 3.78 | 195.28 | 26.92 |
| Extreme | <−97.80 | 123.62 | 32.85 |
Table 5.
Description of different desertification degrees in the Middle Draa Valley.
| N°/Class | Image | Description |
|---|---|---|
| 1—Non-desertification |  | This category corresponds to the dense palm grove, located generally in Ternata oasis. The oasis contains three stages of vegetation (palm tree, fruits trees and seasonal agriculture). In these areas, water is directly taken from wells due to the low concentration of salts in water. |
| 2—Low |  | These areas mainly refer to moderate palm grove density. Seasonal agriculture is practiced with the use of groundwater that is characterized by moderate salts. This category also refers to new farms without palm trees. |
| 3—High |  | Moderate desertification contains sparse palm trees. Cultivation activities depend on water availability in the Draa river. |
| 4—Severe |  | This category refers to zones with degraded palm trees, pastoral lands located outside oases and sand dunes. This grade of desertification includes reg surfaces with small dark stones. The concentration of salt in water is very high, and the only source of water is the Draa river. |
| 5—Extreme |  | The severely desertified lands are generally located surrounding the oases. All three stages are not present. The grade of extreme desertification in the study area includes bright soil transformed from agricultural into sterile lands and some urban zones. This category is generally located south of MDV, especially in the M’Hamid and Ktaoua oases. |
Table 6.
The confusion matrix.
| Ground Truth (Pixels) | ||||||
| Classes | Non | Low | Moderate | Severe | Extreme | Total |
| Non | 19 | 3 | 0 | 0 | 0 | 22 |
| Low | 1 | 21 | 0 | 0 | 0 | 22 |
| Moderate | 0 | 0 | 30 | 0 | 0 | 30 |
| Severe | 0 | 0 | 3 | 17 | 0 | 20 |
| Extreme | 0 | 0 | 1 | 1 | 34 | 36 |
| Total | 20 | 24 | 34 | 18 | 34 | 130 |
| Ground Truth (%) | ||||||
| Classes | Non | Low | Moderate | Severe | Extreme | % |
| Non | 95 | 12 | 0 | 0 | 0 | 16.92 |
| Low | 5 | 87.50 | 0 | 0 | 0 | 16.92 |
| Moderate | 0 | 0 | 88.24 | 0 | 0 | 23.08 |
| Severe | 0 | 0 | 8.82 | 94.44 | 0 | 15.38 |
| Extreme | 0 | 0 | 2.94 | 5.56 | 100 | 27.69 |
| Total | 100 | 100 | 100 | 100 | 100 | 100 |
Table 7.
Classification accuracy of the map of desertification degrees.
| Prod. Acc. (%) | User Acc. (%) | Prod. Acc. (Pixels) | User Acc. (Pixels) | |
| Non | 95 | 86.36 | 19/20 | 19/22 |
| Low | 87.5 | 95.45 | 21/24 | 21/22 |
| Moderate | 88.24 | 100 | 30/34 | 30/30 |
| Severe | 94.44 | 85 | 17/18 | 17/20 |
| Extreme | 100 | 94.44 | 34/34 | 34/36 |
| Commission (%) | Omission (%) | Commission (Pixels) | User Acc. (Pixels) | |
| Non | 13.64 | 5 | 3/22 | 1/20 |
| Low | 4.55 | 12.5 | 1/22 | 3/24 |
| Moderate | 0 | 11.76 | 0/30 | 4/34 |
| Severe | 15 | 5.56 | 3/20 | 1/18 |
| Extreme | 5.56 | 0 | 2/36 | 0/34 |
© 2018 by the authors. Licensee MDPI, Basel, Switzerland. This article is an open access article distributed under the terms and conditions of the Creative Commons Attribution (CC BY) license (http://creativecommons.org/licenses/by/4.0/).
Share and Cite
MDPI and ACS Style
Lamqadem, A.A.; Saber, H.; Pradhan, B. Quantitative Assessment of Desertification in an Arid Oasis Using Remote Sensing Data and Spectral Index Techniques. Remote Sens. 2018, 10, 1862. https://0-doi-org.brum.beds.ac.uk/10.3390/rs10121862
AMA Style
Lamqadem AA, Saber H, Pradhan B. Quantitative Assessment of Desertification in an Arid Oasis Using Remote Sensing Data and Spectral Index Techniques. Remote Sensing. 2018; 10(12):1862. https://0-doi-org.brum.beds.ac.uk/10.3390/rs10121862
Chicago/Turabian StyleLamqadem, Atman Ait, Hafid Saber, and Biswajeet Pradhan. 2018. "Quantitative Assessment of Desertification in an Arid Oasis Using Remote Sensing Data and Spectral Index Techniques" Remote Sensing 10, no. 12: 1862. https://0-doi-org.brum.beds.ac.uk/10.3390/rs10121862
Note that from the first issue of 2016, this journal uses article numbers instead of page numbers. See further details here.