Dynamic Inversion of Global Surface Microwave Emissivity Using a 1DVAR Approach

1
NOAA/NESDIS Center for Satellite Applications and Research, College Park, MD 20740, USA
2
University of Maryland Earth Science System Interdisciplinary Center, College Park, MD 20740, USA
*
Author to whom correspondence should be addressed.
Remote Sens. 2018, 10(5), 679; https://0-doi-org.brum.beds.ac.uk/10.3390/rs10050679
Submission received: 1 March 2018
/
Revised: 15 April 2018
/
Accepted: 23 April 2018
/
Published: 27 April 2018
(This article belongs to the Special Issue Advancing Earth Surface Representation via Enhanced Use of Earth Observations in Monitoring and Forecasting Applications)
Abstract
:A variational inversion scheme is used to extract microwave emissivity spectra from brightness temperatures over a multitude of surface types. The scheme is called the Microwave Integrated Retrieval System and has been implemented operationally since 2007 at NOAA. This study focuses on the Advance Microwave Sounding Unit (AMSU)/MHS pair onboard the NOAA-18 platform, but the algorithm is applied routinely to multiple microwave sensors, including the Advanced Technology Microwave Sounder (ATMS) on Suomi-National Polar-orbiting Partnership (SNPP), Special Sensor Microwave Imager/Sounder (SSMI/S) on the Defense Meteorological Satellite Program (DMSP) flight units, as well as to the Global Precipitation Mission (GPM) Microwave Imager (GMI), to name a few. The emissivity spectrum retrieval is entirely based on a physical approach. To optimize the use of information content from the measurements, the emissivity is extracted simultaneously with other parameters impacting the measurements, namely, the vertical profiles of temperature, moisture and cloud, as well as the skin temperature and hydrometeor parameters when rain or ice are present. The final solution is therefore a consistent set of parameters that fit the measured brightness temperatures within the instrument noise level. No ancillary data are needed to perform this dynamic emissivity inversion. By allowing the emissivity to be part of the retrieved state vector, it becomes easy to handle the pixel-to-pixel variation in the emissivity over non-oceanic surfaces. This is particularly important in highly variable surface backgrounds. The retrieved emissivity spectrum by itself is of value (as a wetness index for instance), but it is also post-processed to determine surface geophysical parameters. Among the parameters retrieved from the emissivity using this approach are snow cover, snow water equivalent and effective grain size over snow-covered surfaces, sea-ice concentration and age from ice-covered ocean surfaces and wind speed over ocean surfaces. It could also be used to retrieve soil moisture and vegetation information from land surfaces. Accounting for the surface emissivity in the state vector has the added advantage of allowing an extension of the retrieval of some parameters over non-ocean surfaces. An example shown here relates to extending the total precipitable water over non-ocean surfaces and to a certain extent, the amount of suspended cloud. The study presents the methodology and performance of the emissivity retrieval and highlights a few examples of some of the emissivity-based products.
1. Introduction
Passive microwave measurements have been used extensively in the past to monitor surface parameters such as the Sea-Ice Concentration (SIC) and ice age over ice-covered surfaces [1,2], the snow depth or Snow-Water Equivalent (SWE) over snow-covered land [3,4], the soil moisture over snow-free land surfaces [5], and the wind speed over the ocean [6], to list just a few examples. These inversions usually rely on brightness temperature measurements with, sometimes ad-hoc, corrections to account for the atmospheric and cloud contamination. The methods generally make use of a limited number of channels, mostly pure window channels, in order to avoid atmospheric impacts as much as possible. However, the measurement, even if properly cleared from the atmospheric effects, is still radiometrically a mixture of the emissivity and the skin temperature. These two parameters are indeed intertwined from the radiometric point of view. Notably though, the signal of the surface properties is most directly contained in the radiometric emissivity. An alternative approach to retrieving surface properties is suggested in this study, in which the surface parameters, such as SIC and SWE, are directly inverted from the emissivity spectrum of the surface in question, not from the brightness temperatures or their combinations. The emphasis is on the use of the term spectrum in this case, since the intent is to truly use not only the absolute values of the emissivities, but also the whole spectral shape, in order to retrieve the surface parameters.
Many approaches for deriving surface emissivity rely on the simplified microwave radiative transfer (RT) equation inverted to solve the emissivity term analytically:
where the emissivity (ε) is a function of the observed brightness temperature at the satellite, Tb, taking into account the skin temperature, Ts, the upwelling and downwelling brightness temperatures (Tu and Td, respectively), and the atmospheric transmittance, Γ. In this case, as for brightness temperature-based retrieval of geophysical parameters, methodologies must be adopted to remove observations contaminated by clouds and precipitation [7,8,9]. The derived emissivity depends on radiative transfer calculations to compute the transmittance, and therefore, is sensitive to errors from the input temperature and water vapor profiles as well as the skin temperature and can be large, especially if a forecast is used. Additionally, the accuracy of the emissivity depends on other factors unaccounted for, including the surface roughness.
The usage of a restricted number of channels, the removal of observations affected by clouds and precipitation, and the lack of consideration of errors in a priori information when deriving emissivity and other surface parameters are argued to be limiting factors. In this study, we adopt the use of all channels in order to have a better picture of the spectral shape of the emissivity. One of the key factors for the success of the proposed approach is the ability to distinguish the different signals impacting the brightness temperatures, in order to accurately isolate the emissivity signal from which the surface parameters will be derived. In order to distinguish all of the parameters impacting radiances, one logical approach is to use all channels available that have the potential to inform us about the state of these parameters.
In this study, the main objective is to focus on the retrieved emissivity quality assessment and to highlight some applications derived from it. In Section 2, we give an overview of the Microwave Integrated Retrieval System (MiRS) emissivity retrieval approach (the overall approach is described in [10]), and in Section 3 and Section 4, we thoroughly assess the performance of the emissivity retrieval (qualitatively and quantitatively). In Section 5, we highlight a few examples of parameters derived using these emissivities. This constitutes an indirect assessment of the emissivity product itself. For brevity, this study will not present details about the assessment of the emissivity-based products which may be found in other publications ([11] for example, for sea-ice).
2. Overview of the Retrieval Approach
The MiRS-based retrieval of surface parameters consists of two distinct steps. The first step aims to isolate the emissivity signal in the brightness temperatures from the rest of the signals impacting them, such as those from skin temperature or from the atmosphere. This is performed using a one-dimensional, variational-based physical approach (1DVAR) where the simulated radiances and their Jacobians are computed using the Community Radiative Transfer Model (CRTM) [12]. The goal of the iterative 1DVAR is to find a solution that, when fed to a forward model, will produce simulated radiances that closely match the measurements within a level of uncertainty (e.g., radiative transfer error plus instrument noise).
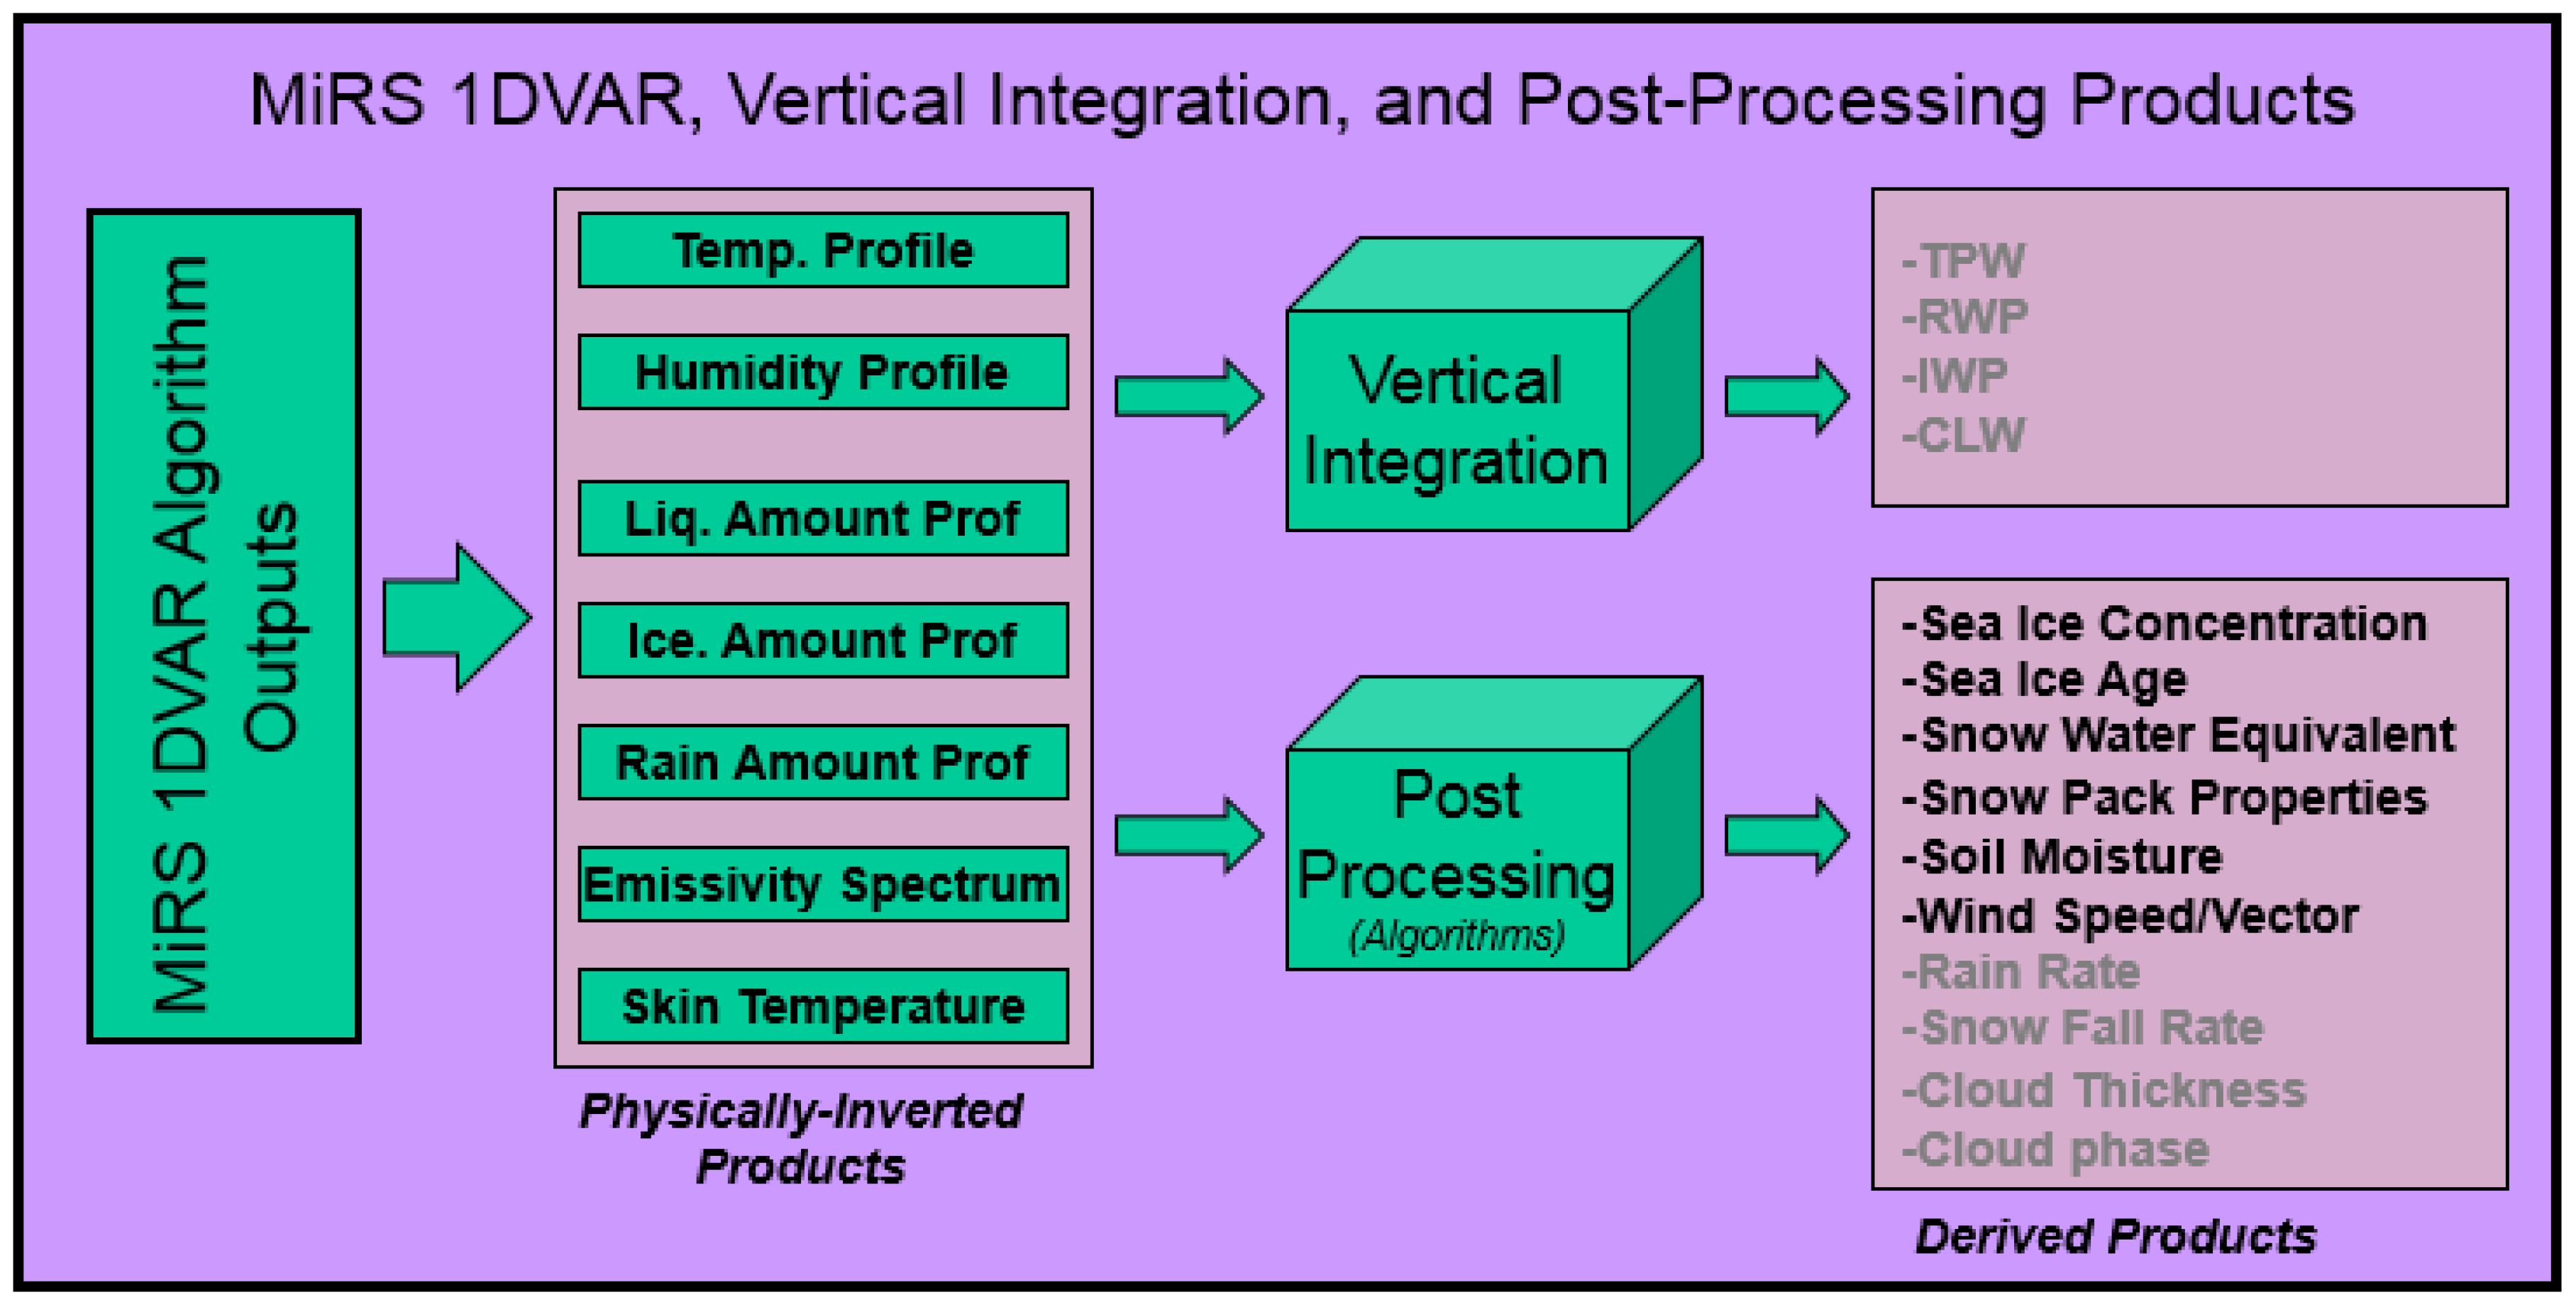
The iterative solution is initiated from a climatological first guess. Figure 1 illustrates this approach where, during this first step the system retrieves the state vector including the emissivity spectrum and the skin temperature (representing the surface), along with the atmospheric parameters represented by temperature, moisture, cloud, rain and ice profiles. A solution is found by minimizing the cost function, and the retrieved state vector when input to the forward operator, fits the radiometric observations (e.g., convergence). Further mathematical basis of the MiRS 1DVAR may be found in [10].
The retrieved state vector is then used in the second step of MiRS, which is called the Vertical Integration and Post-Processing (VIPP) step, also illustrated in Figure 1. Here, some products are simply generated by vertical integration of the atmospheric profiles, such as the moisture profile, to derive the Total Precipitable Water (TPW) or the ice profile to derive the Ice Water Path (IWP). Other parameters are generated by using a more sophisticated mechanism. In the case of SIC and SWE, the post-processing stage utilizes a procedure to search a catalog of pre-computed emissivity spectra to closely match the retrieved one. Along with the search of SIC, the ice age (FYI/MYI for First-Year and Multi-Year Ice, respectively) is also catalogued and searched for, given its impact on the emissivity spectrum. Similarly, along with the search of SWE, the effective grain size is also catalogued and searched for. These two byproducts (sea-ice age and effective grain size) are also operational products from MiRS.
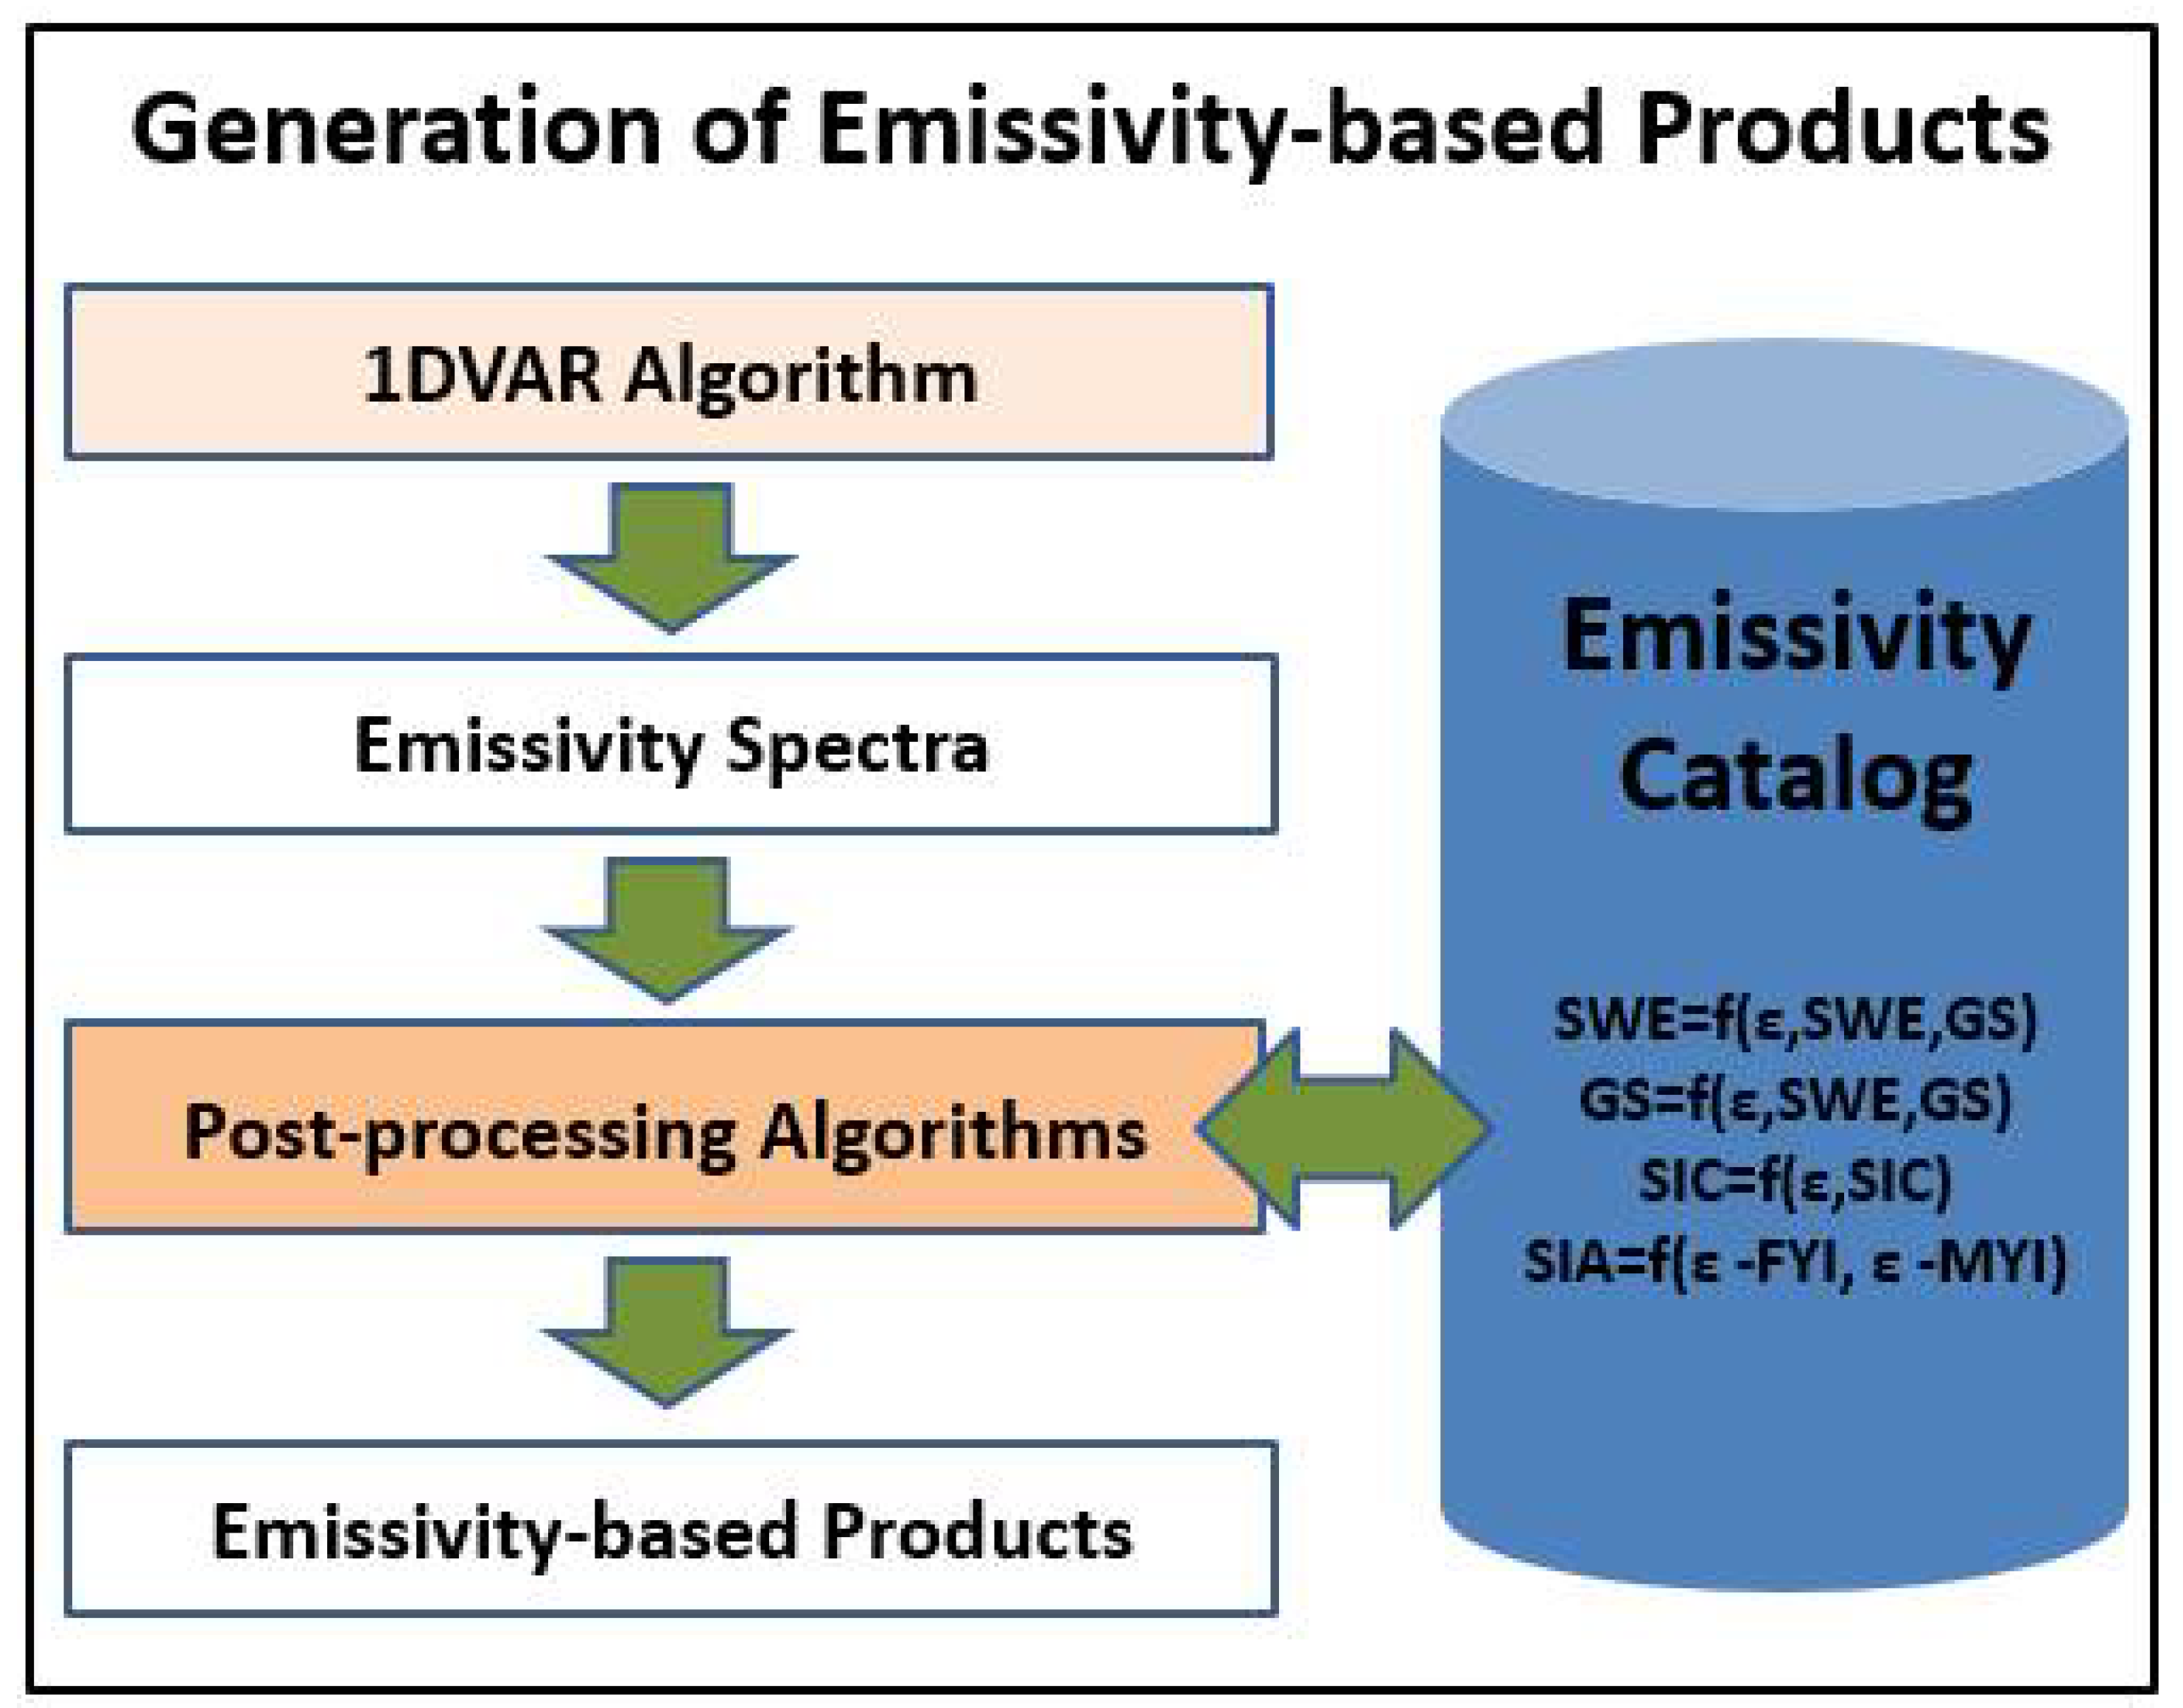
It is worth noting that the emissivity could be used directly as a proxy parameter to determine the degree of wetness over land, for instance. In MiRS, however, as mentioned earlier, the emissivity is further processed to produce more readily usable surface parameters, such as SIC and SWE. Figure 2 details this post-processing of the emissivity. It shows that the emissivity spectra as retrieved in the first step are compared to an offline-computed catalog of emissivity spectra for a range of values of the parameters to be derived.
The MiRS algorithm is an enterprise algorithm that applies to a multitude of satellites and sensors, provided that the forward operator (CRTM) is applicable to those sensors. Currently, the MiRS algorithm is routinely applied to microwave sensors but efforts are ongoing to validate it for infrared (IR) sensors as well, given that CRTM is applicable to IR sensors. Currently MiRS is applied operationally or routinely to the NOAA and Metop series sounders (AMSU/MHS) as well as the SNPP/ATMS and DMSP SSMI/S series, and research satellites (NASA GPM/GMI, NASA/JAXA AMSR-2, CNES/ISRO Megha-Tropiques SAPHIR). It has recently been extended to process ATMS data from the newly launched NOAA-20 satellite. In this study, we show a variety of emissivity highlights from a number of sensors, but for the performance assessment, we focus on NOAA AMSU/MHS for cross-track type sensors and DMSP SSMI/S for conical type sensors.
3. Emissivity Qualitative Assessment
3.1. Methods
The initial assessment of retrieved surface emissivity was qualitative and focused on assessing the response of the emissivity magnitude to changes in surface type, and the responses of the magnitude and spectral shape to changes in the land surface moisture content. This is an important first assessment since the emissivity-based surface products from MiRS are only as good as the emissivity they are derived from. The main difficulty with the direct validation of emissivity is the lack of a ground-based reference to compare it to. Even if there was a ground-based sensor taking measurements of emissivity, it would have to be made at exactly the same frequency, with similar sensor characteristics (bandwidths for instance) and at the same viewing angle, and it would need to represent the same satellite footprint size and not just a single point. The emissivity variability is simply too high within the footprint size of a polar-based sensor to rely on single point measurements for assessment. This is particularly true over non-ocean surfaces. We are therefore left, for the purpose of assessing our emissivities, with two methods: a qualitative assessment, and a quantitative assessment based on analytical emissivities, which will be explained in the next section.
3.2. Examples
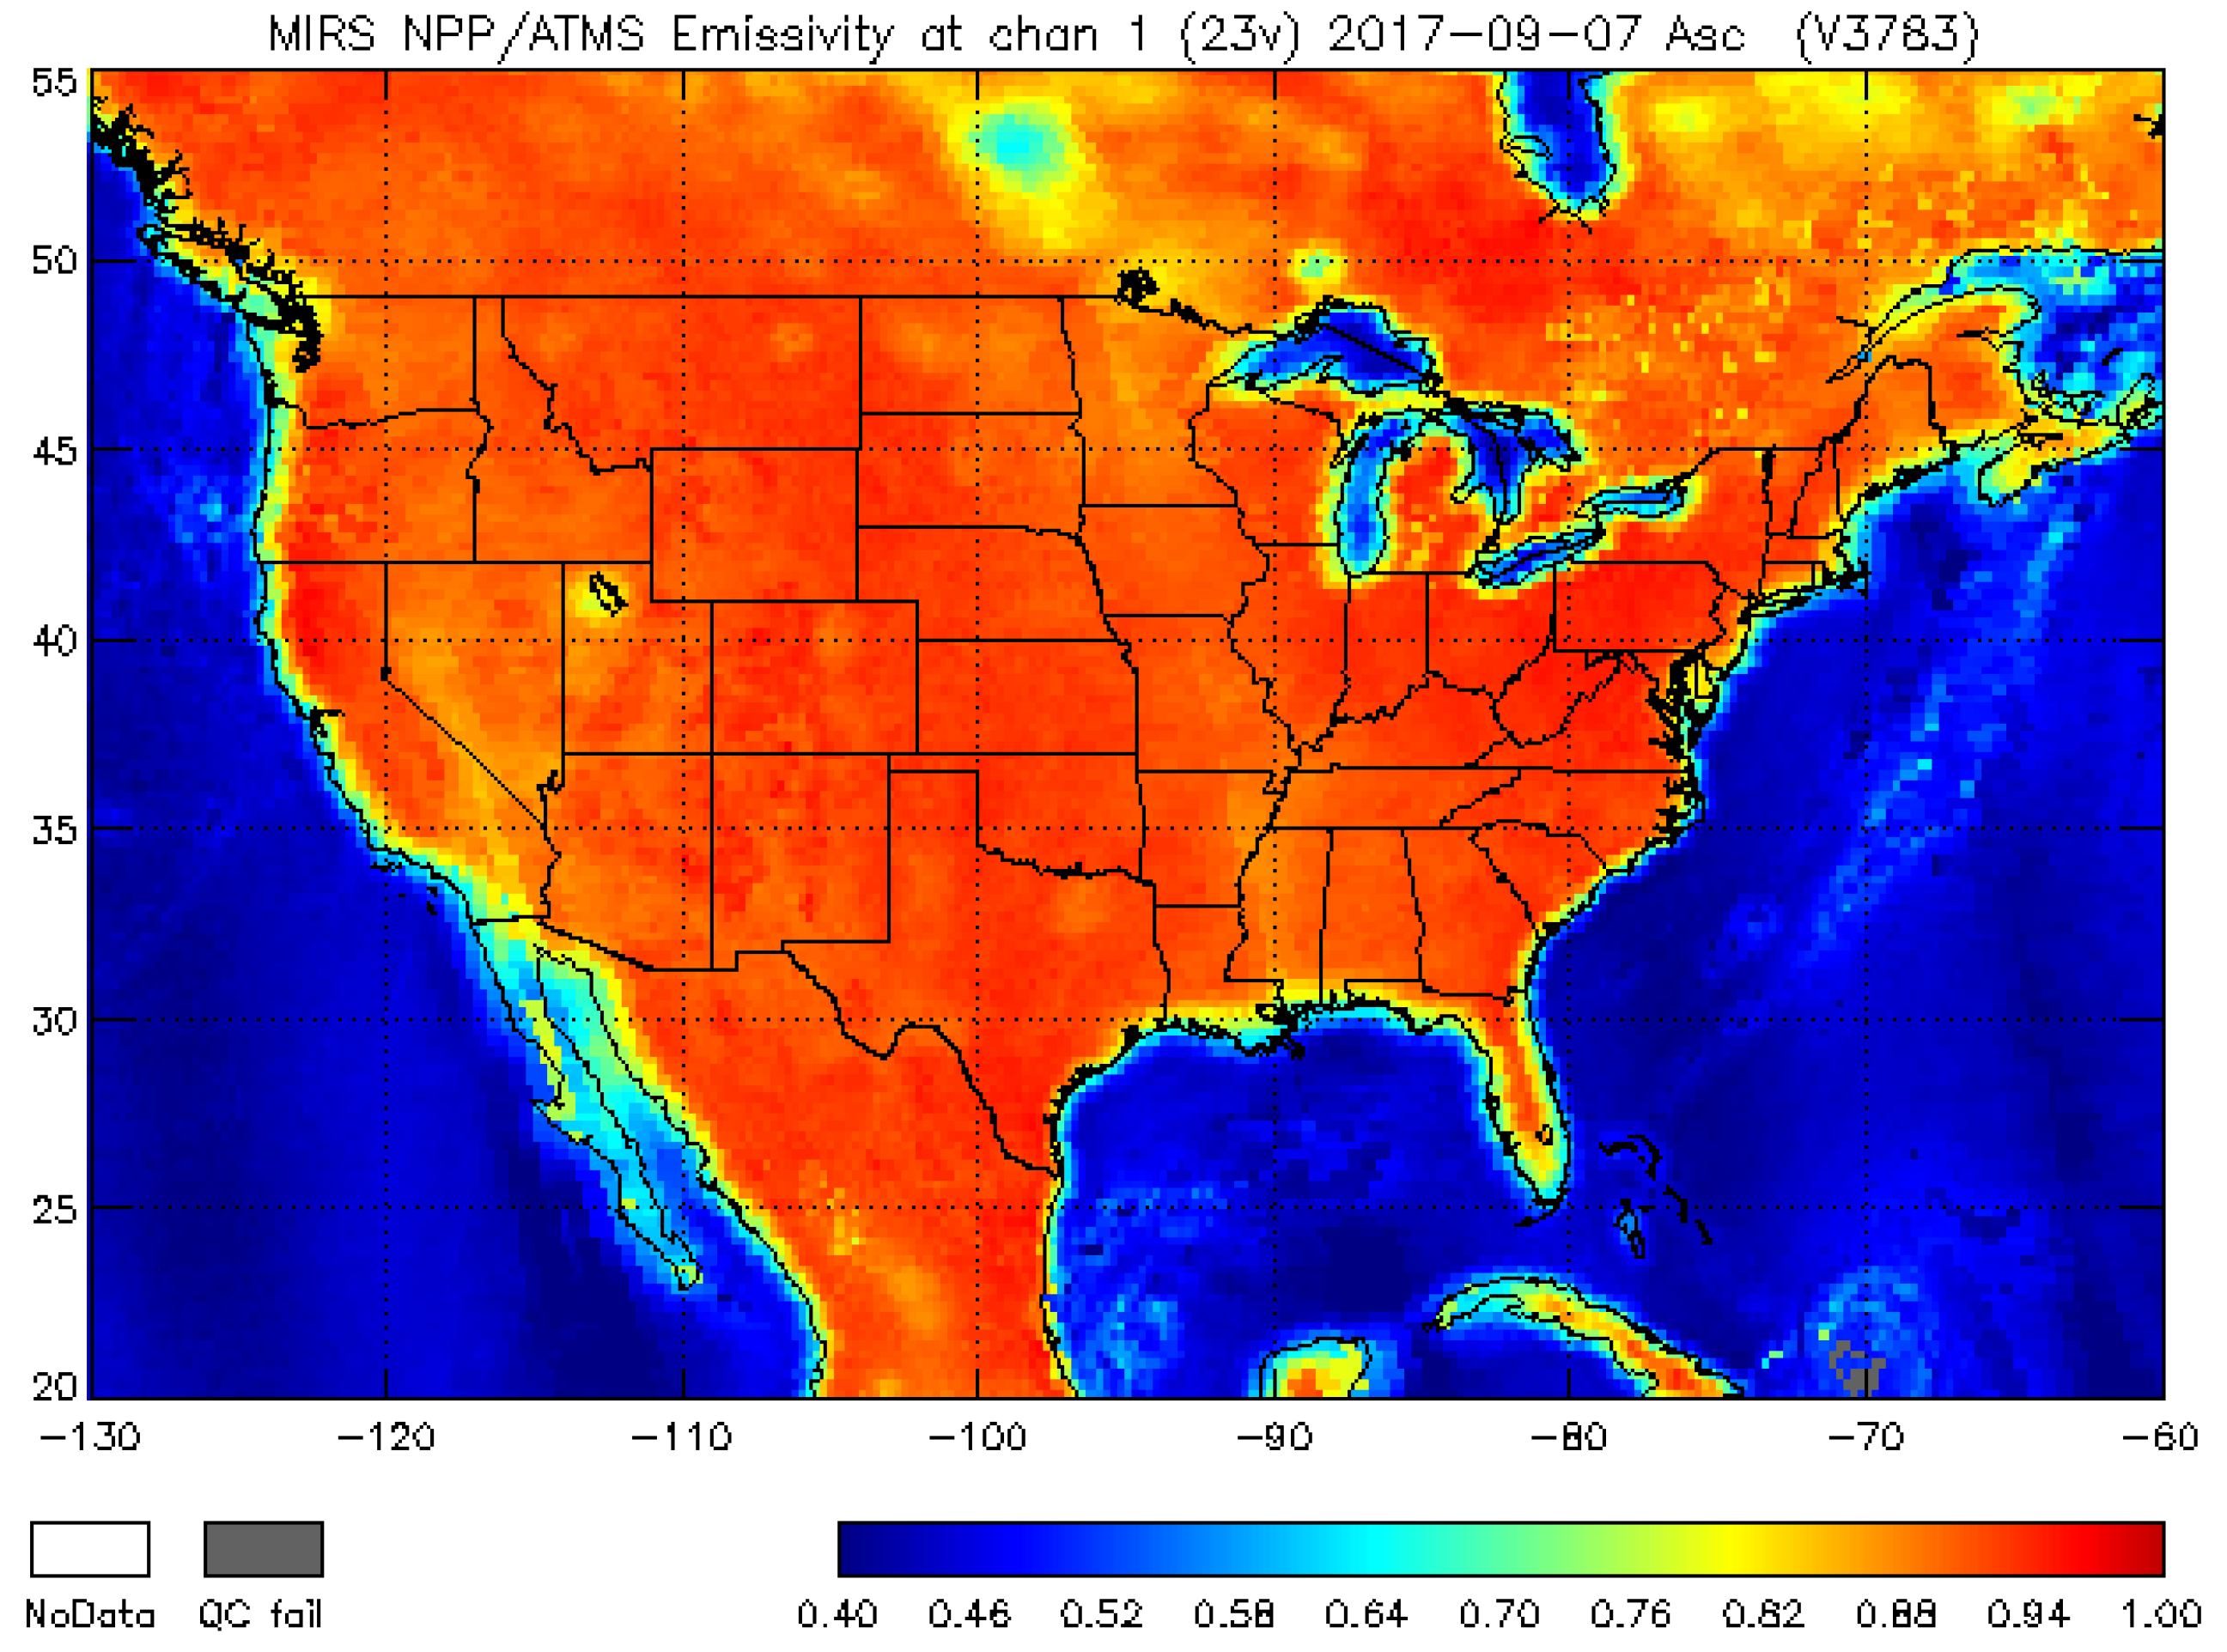
The first qualitative assessment of the dynamic emissivity from MiRS is presented in Figure 3 where satellite data from SNPP/ATMS were used to generate global fields of microwave emissivities. The Continental United States (CONUS) region is highlighted in this figure. The emissivity was found to act as expected—ocean-like emissivity (lower values) over water surfaces and land-like emissivity (higher values) over land surfaces. What is important to note is that these retrievals (with emissivity and other parameters inverted simultaneously) have permitted full convergence or fitting of the measurements, giving us confidence that these parameters belong to the space of possible solutions, including over coastal areas. The system is therefore flexible enough to retrieve intermediate-values (or mixed-signal value) of the emissivity when the brightness temperatures are measured over mixed surface types. This is an important point as we will see later, because this allows the dynamic emissivity retrieval to absorb the mixed signal present in the measurement, and it allows the other parameters (like TPW, cloud, rain, etc.) to be retrieved seamlessly over ocean and land interfaces. If there was no emissivity in the retrieval state vector to absorb this mixed-type signal, the atmospheric parameters would exhibit discontinuities at these coastal regions. The same applies to other surface type transitions (sea–ice edges, snow and snow-free land, river–land, lake–forest, etc.). We have shown, for example, that rain retrieval over land and over coastal transitions is improved due to this approach. The emissivity, retrieved simultaneously with all other parameters, absorbs the coastal signal and therefore, reduces the number of false alarms in the rain retrievals over land and coastal areas significantly [13]. We argue that over these types of highly variable surfaces, it is critical to allow the emissivity to vary dynamically as part of the retrieval, as we did here, in order to provide seamless atmospheric products. This is especially true because the degree of mixing (of the different surface types) depends, to a significant degree, on the shape and size of the measurement footprint; this is highly uncertain a priori, making attempts to account for these dynamic backgrounds through precomputed atlases sub-optimal at best.
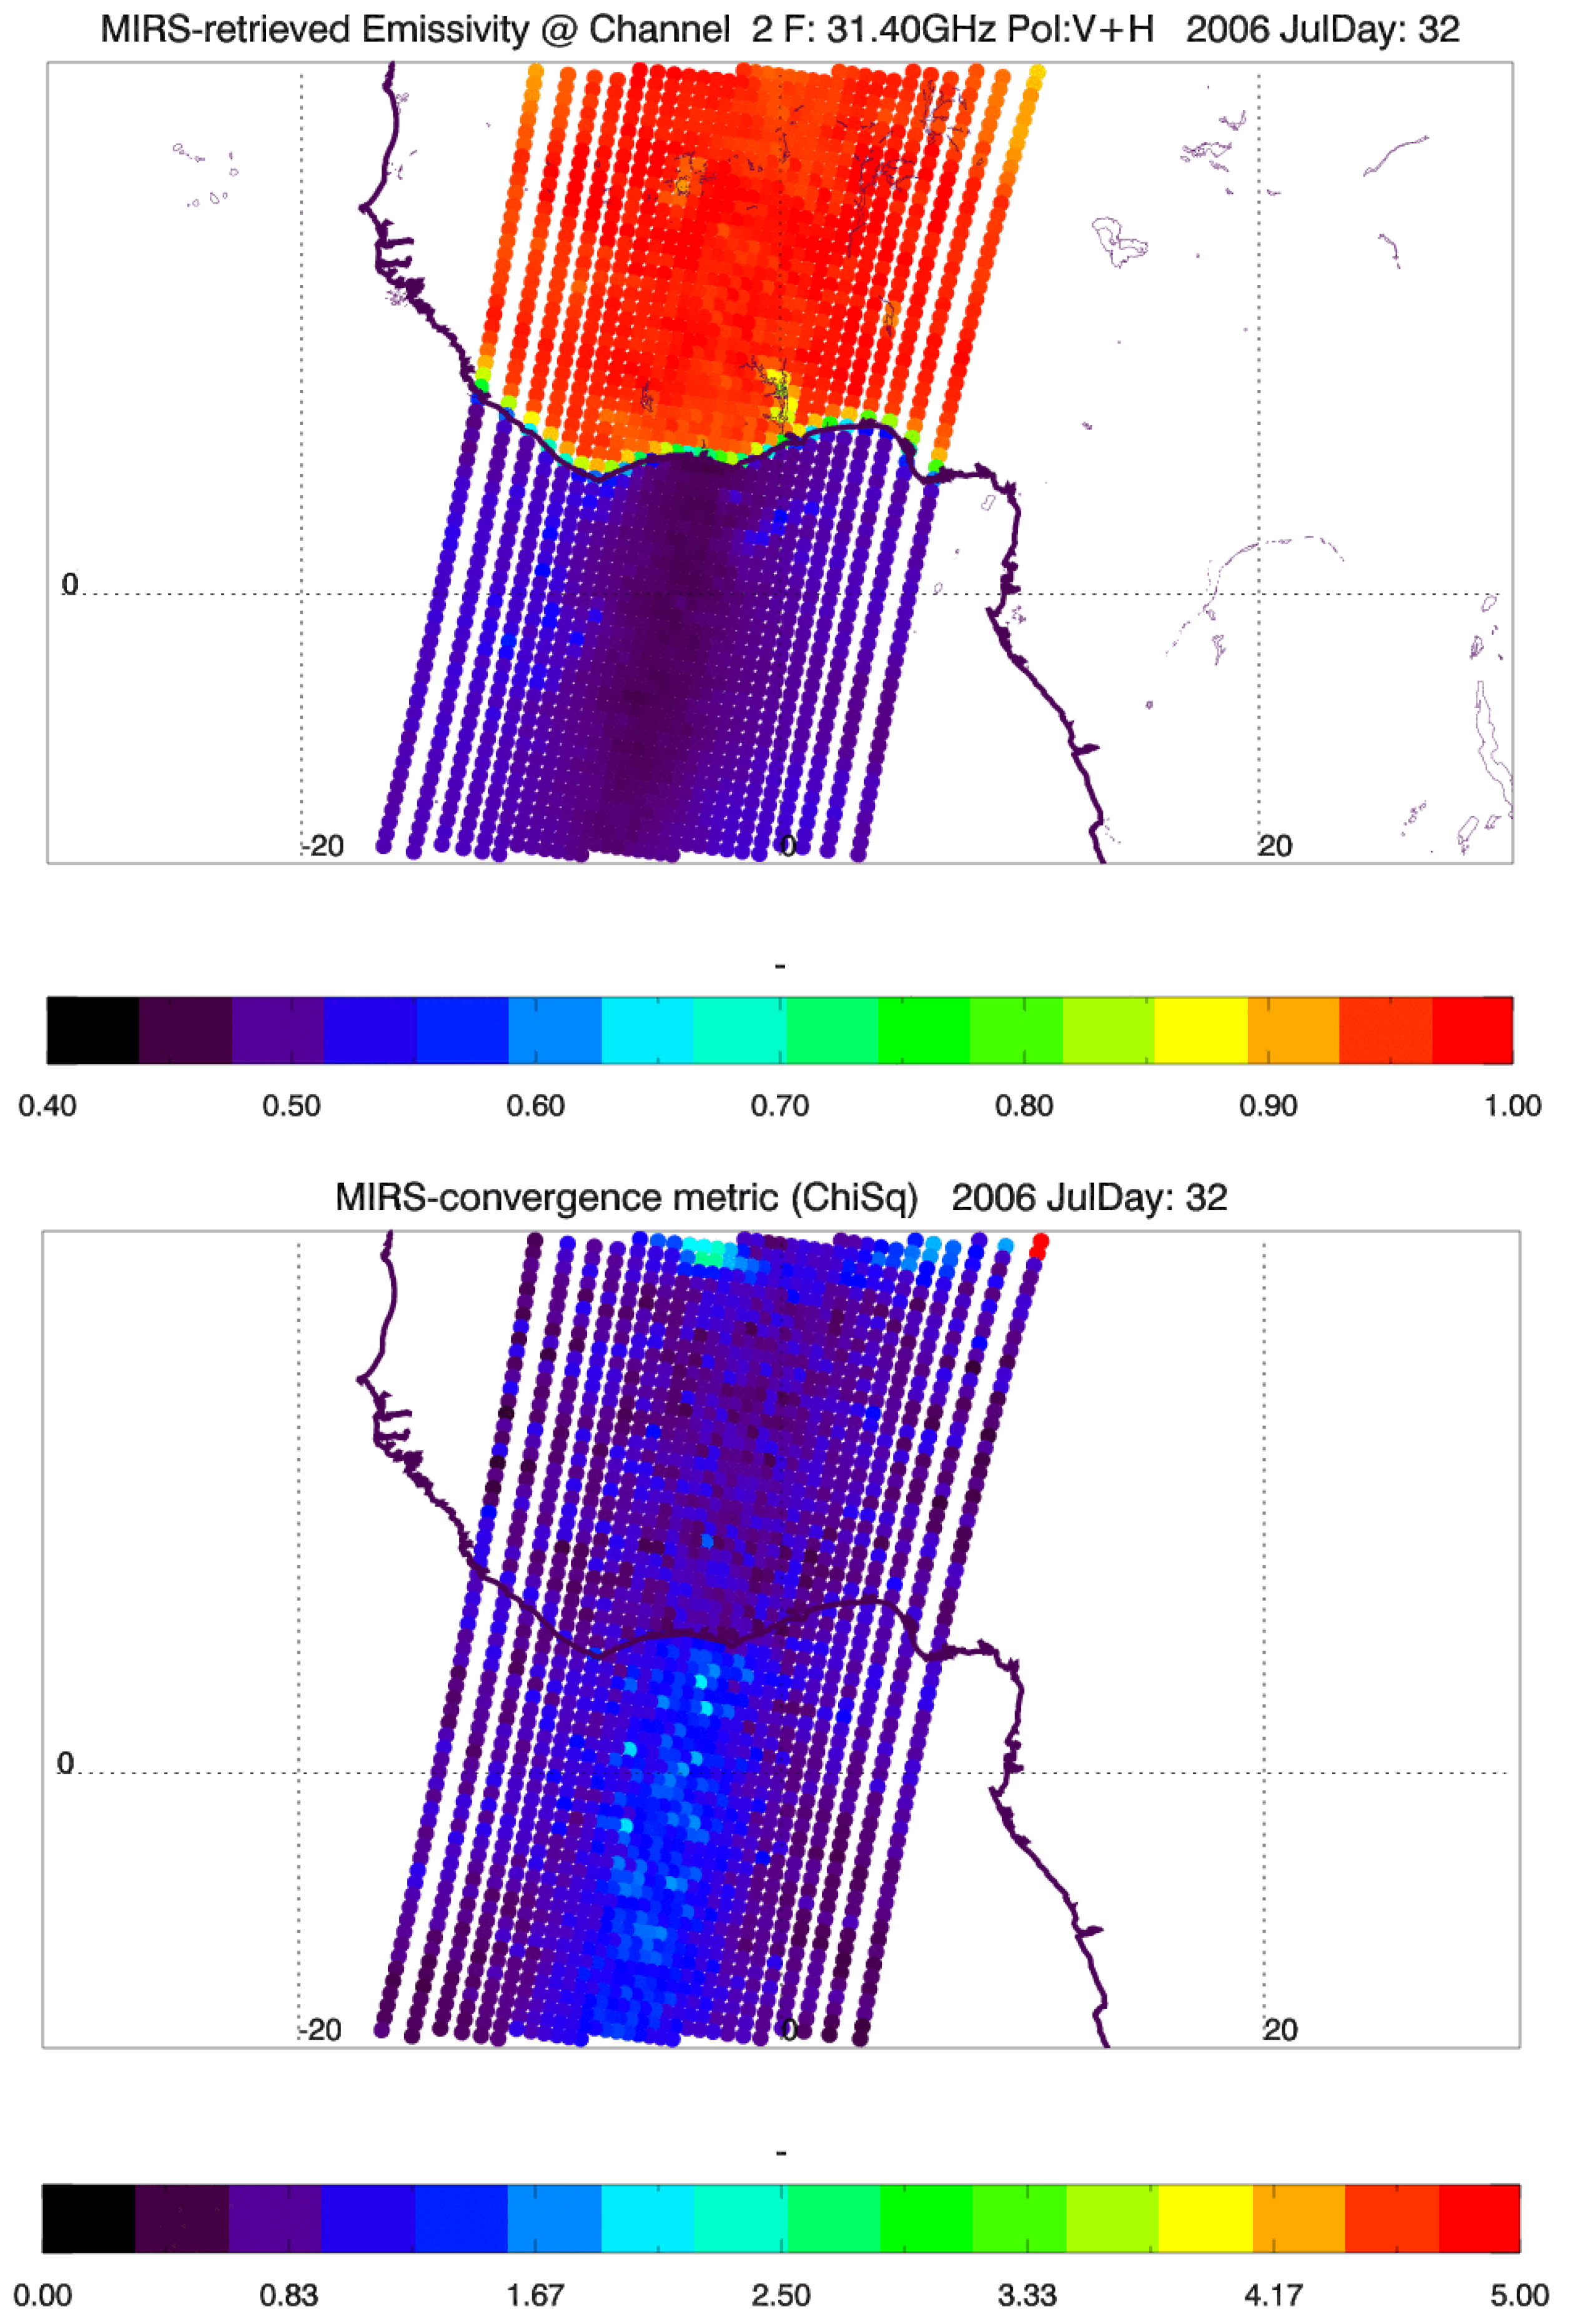
Another qualitative example to emphasize the previous point is given in Figure 4. It represents the emissivity at the 31.4 GHz channel on the Advance Microwave Sensor Unit (AMSU) onboard the NOAA-18 satellite. It shows that the emissivity retrieved from MiRS transitions has low value over oceans and high values over land, as expected, with in-between transitional values on the coast and along water bodies, in this case the Volta Lake in West African Ghana. At the same time, the bottom panel in the same figure shows that convergence (fit to observations) was reached over land, ocean, and mixed-surface areas. The convergence metric shown there is indeed under unity, signaling that the solution found is within noise levels that are consistent with the radiometric measurements.
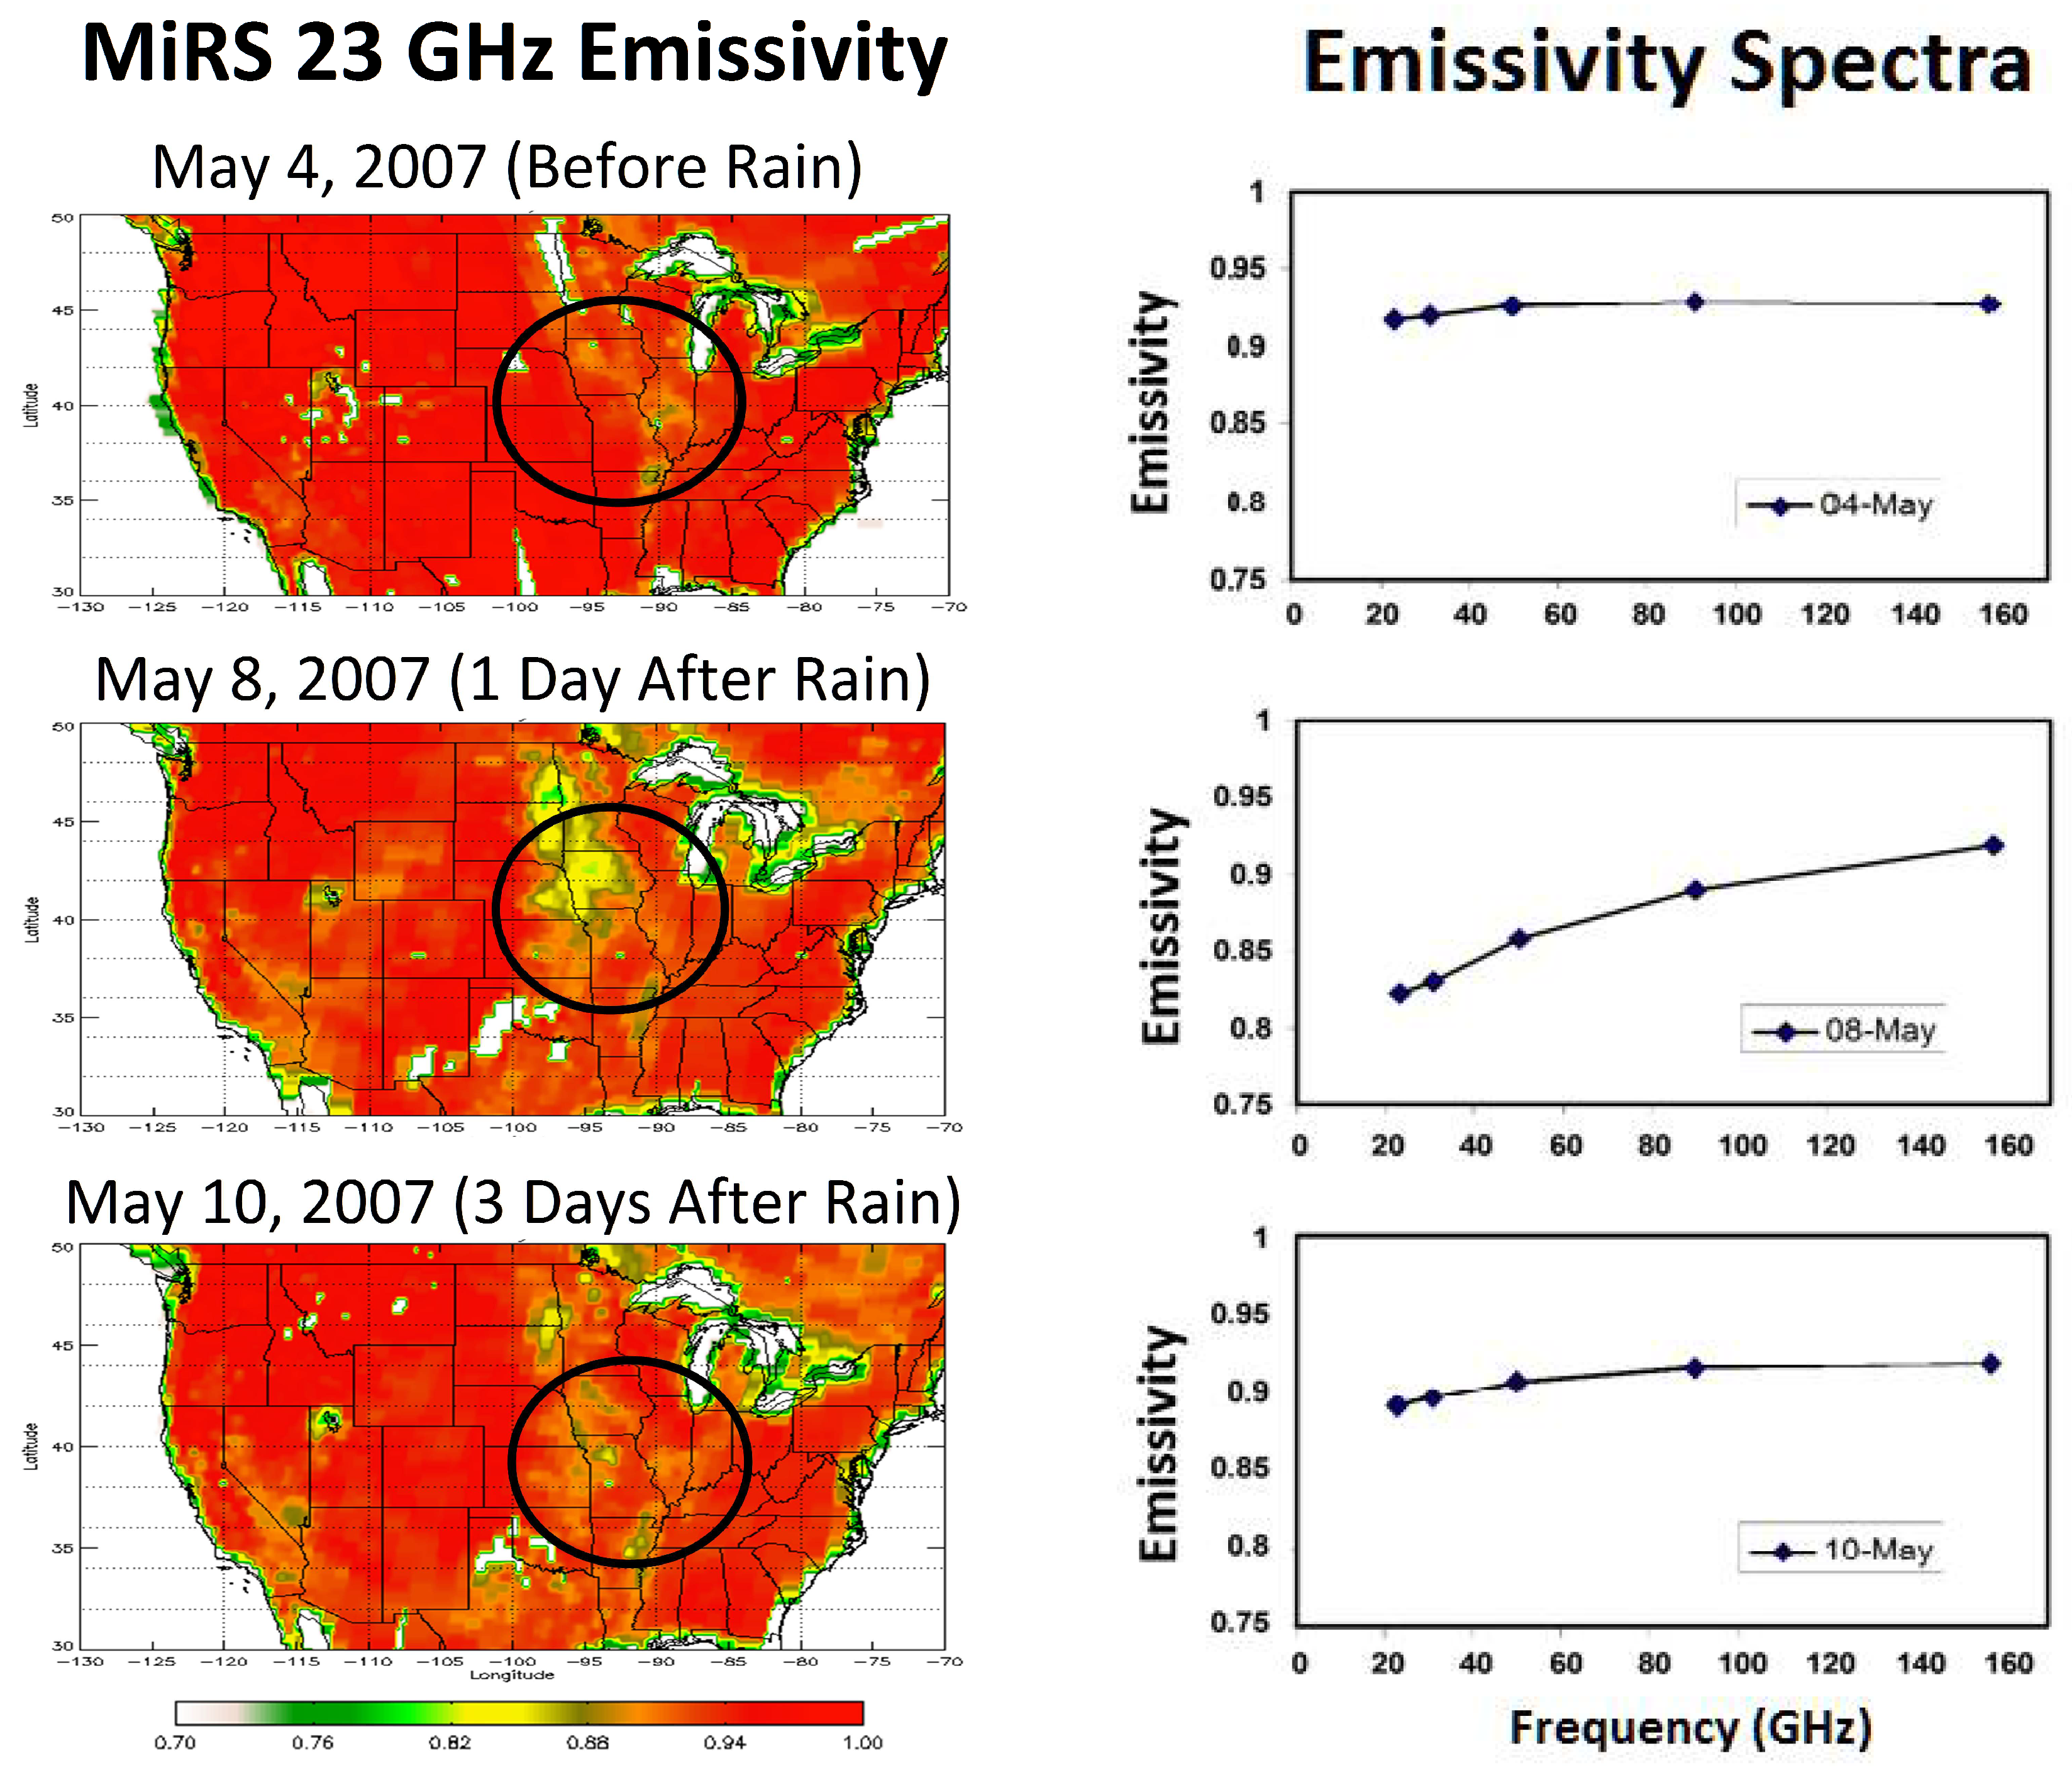
A third qualitative assessment of the emissivity performed is illustrated in Figure 5 and Figure 6. It demonstrates the evolution of emissivity (amplitude and spectral shape) over time when a major rain event occurs. One intuitively expects that when such an event occurs over a dry land surface, the rain will wet the surface instantly, altering the emissivity spectrum significantly. After the rain stops and the surface begins to dry out, one would expect that the emissivity would gradually go back to its pre-rain spectral shape. The speed of this cycle depends on many parameters, including the pre-existing soil moisture, the surface type, and atmospheric conditions.
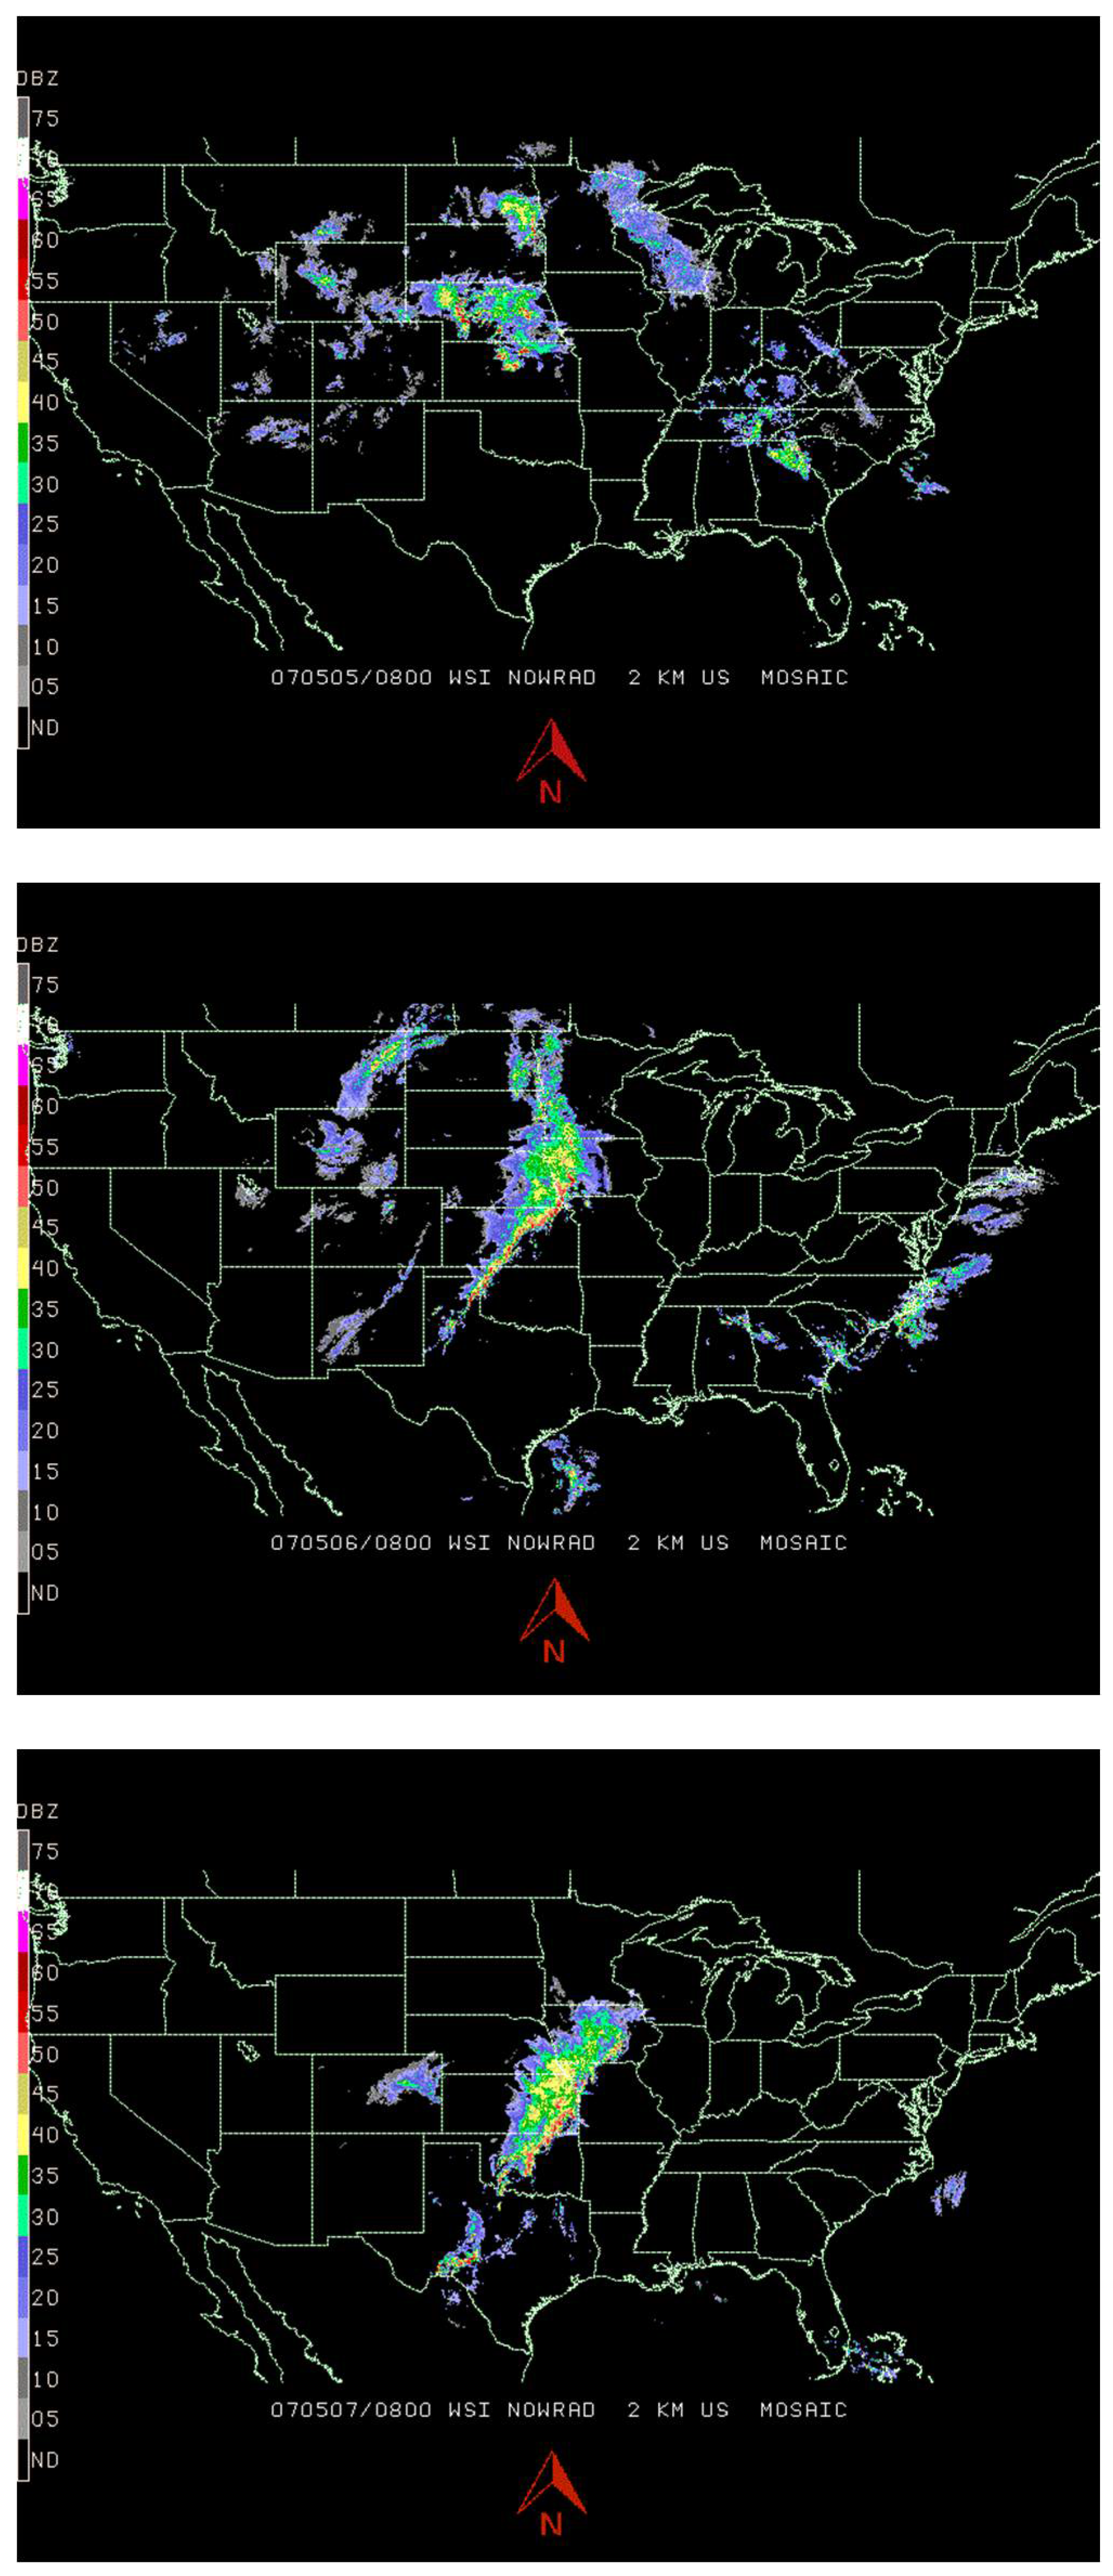
A significant storm system was recorded due to its wide-spread nature. These storms hit Midwestern US during 5–7 May 2007, as seen from NEXRAD Radar images in Figure 5. The MiRS retrieved emissivity spectra were qualitatively assessed for their behavior before, during, and after these rain storms. This is illustrated in Figure 6. In this figure, both a spatial map and a full spectrum are shown. The emissivity map relates to channel 1 (23.8 GHz) of the NOAA-18 AMSU. It was chosen for its higher sensitivity to the surface. The days of the measurements that were assessed are 4 May 2007 (a day before the rain event hit that area; dry surface); 8 May 2007 (a day after the storm had passed, where the surface was presumably still wet); and 10 May 2007 (three days after the event, where presumably, the surface had dried out). One can see clearly in Figure 6 that both the emissivity values and the spectral shape from the MiRS-retrievals behaved as expected. Indeed, the dry surface emissivity spectrum is almost flat with high values (4 May). This transforms into an almost water-like spectrum on 8 May, when the surface is wet in terms of both the absolute values and the shape of the emissivity spectrum. When the surface returns to its dry state, the emissivity spectrum again resembles the shape and magnitude from before the rain event (10 May).
This physical behavior is quite encouraging, demonstrating that high variability in the emissivity could be well captured, at least qualitatively, in cases of rain events. Note that only convergent points were shown in this case. In these maps, areas of non-convergence can be observed, corresponding to cases where precipitation is occurring far from the area of consideration (circled).
One cannot stress enough the high degree of variability of microwave emissivity over land, not only where rain is involved, but also because of other temporally dynamic phenomena, such as morning dew or snow fall/melt and run off. This is in addition to the temporally-static/semi-static spatial variability of the surface emittance (such as from rocks, mountains, forests, and rivers). For these reasons, it is suggested that the use of atlases, databases or composite averaging of emissivity, should be used with a high degree of caution. Using emissivity from precomputed atlases when performing instantaneous inversions could, in many cases, harm the other parameters. Indeed, this atlas-based emissivity is almost always different from the actual emissivity because of the reasons listed above and because of the dynamic nature of the surface type mixture covered by the sensor footprint. This is true no matter how high of a resolution (spatially or temporally) the atlas is. We argue in this study that emissivity is a highly dynamic variable (and footprint dependent) and should therefore be handled in a dynamic fashion, such as part of the 1DVAR system, especially during and after rainy conditions or other emissivity-altering events, as illustrated above
4. Emissivity Quantitative Assessment
4.1. Methods
Along with the qualitative assessment that we described in the previous section, we performed a more rigorous, quantitative assessment of the MiRS emissivity performances. This assessment was done on a daily basis. Over ocean, the MiRS emissivity is simply compared to fields of emissivities computed using the wind speed from the Numerical Weather Prediction (NWP) analyses, input to an emissivity model (FASTEM) [14]. In this review, however, the quantitative assessment will focus on non-ocean surfaces.
Over non-ocean surfaces (snow, ice and land), the assessment relies on NWP global analyses as input to the CRTM for the computation of a reference emissivity which is computed analytically, as shown by Equation (1). This approach to computing the analytic emissivity was introduced and fully validated by [7,8]. Assuming that NWP analyses can provide accurate temperature and moisture profiles as well as a relatively accurate estimate of skin temperature, the CRTM may be used to compute the total transmittance of the up- and downwelling brightness temperatures. This gives a relatively accurate estimate of the emissivity which can be compared to the MiRS-retrieved emissivity. As mentioned in Section 1, restrictions exist on the observations that can be compared. There are four criteria which need to be satisfied for this analytical emissivity to be valid: (1) Γ≠ 0 (the equation is not usable for opaque channels); (2) Ts ≠ Td (the solution could be unstable if this condition is not satisfied); (3) the surface is assumed to be specular (for the validity of the simplified RT equation); (4) the atmosphere is assumed to have clear sky and be free of hydrometeors.
Another quantitative assessment methodology relies on inter-comparisons with other independently developed emissivities. This has been the subject of efforts led by others and has been reported in a number of publications [15,16,17] and therefore, will not be addressed here. Suffice to say that these comparisons highlight that MiRS emissivities are consistent with independently-generated emissivities.
4.2. Examples
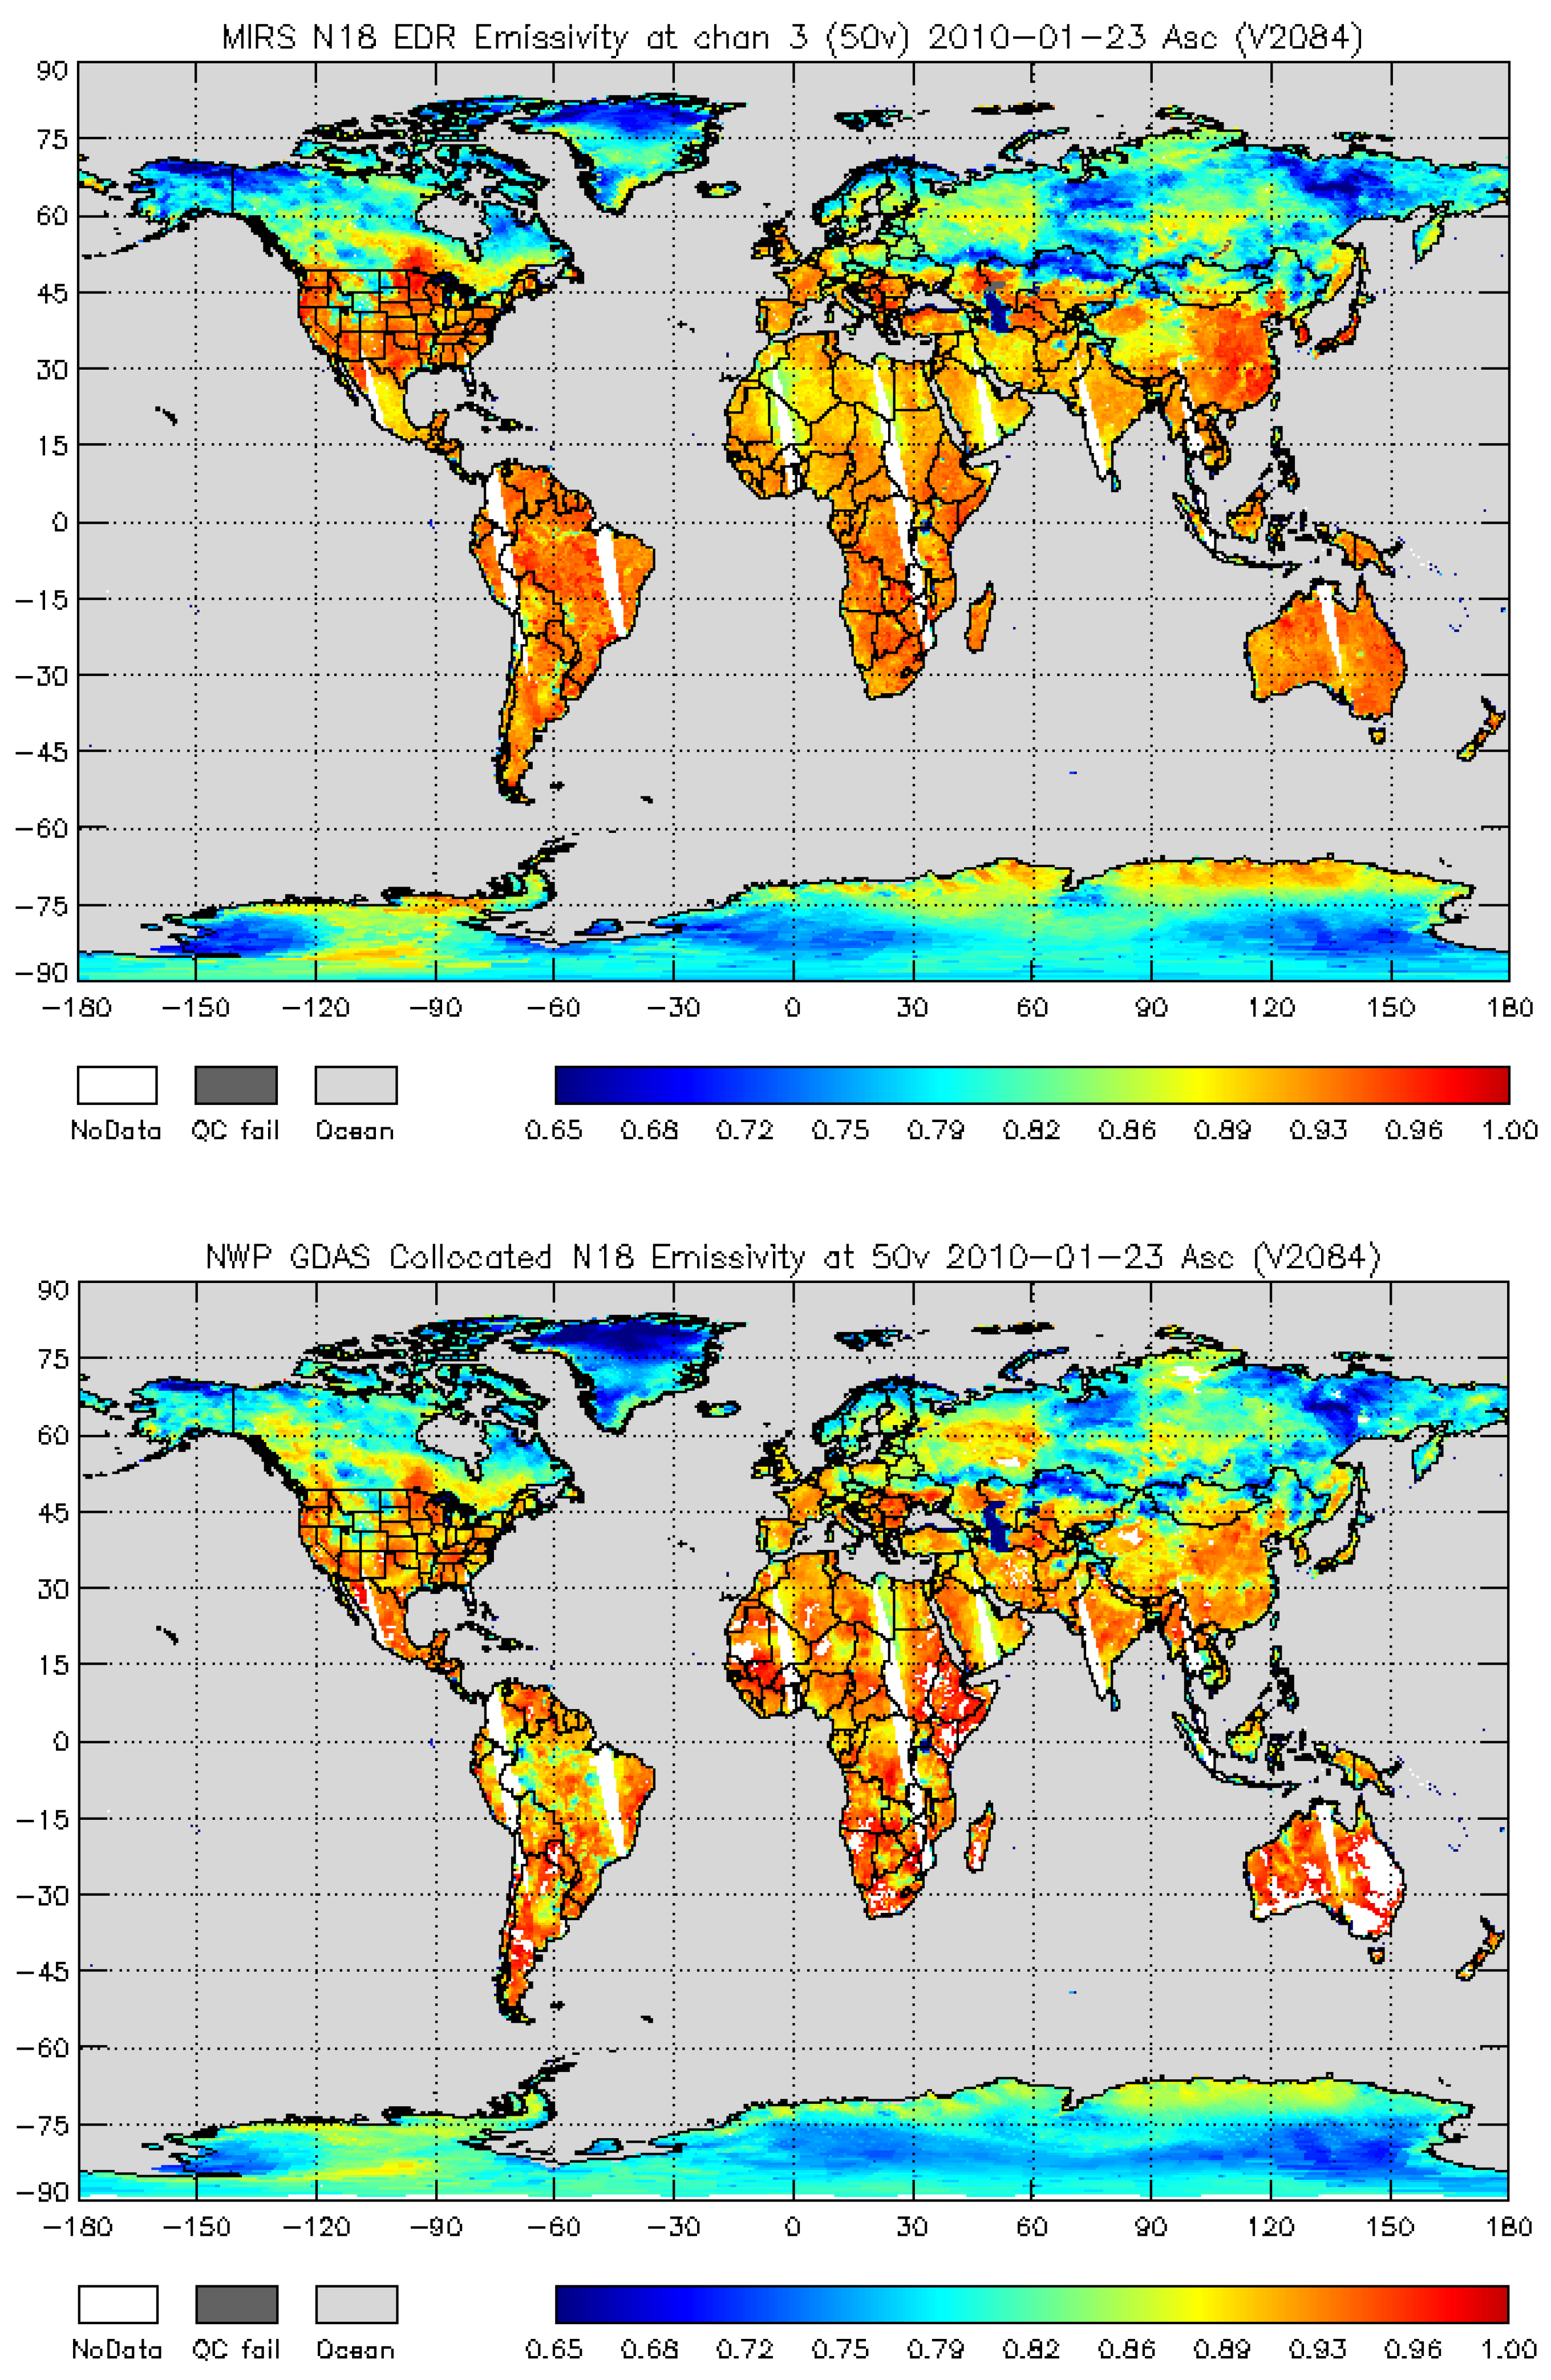
An example of the routine monitoring of MiRS retrievals is given in Figure 7, where the emissivity product is shown (the example shown is for emissivity over land). This figure shows two maps corresponding to MiRS retrieval at 50.3 GHz channel (top panel) and NOAA Global Data Assimilation System (GDAS)-based analytic emissivity (bottom). This shows that globally, MiRS-based emissivity retrievals are very similar to analytic emissivity, even if the two methods are different and computed entirely independently. It is worth mentioning that the analytic emissivity computed here obviously cannot be applied in real-time since it depends on NWP analyses. It can only be used as a source of verification and validation.
We can see in Figure 7 that the two estimates of emissivities differ in some areas, which could be attributed to (1) the poor accuracy of the skin temperature estimate from GDAS, such as over the high-latitude regions, where snow and ice cover the surface and it is known that skin temperature from NWP is not very accurate, and (2) the non-validity of the assumptions made to compute the analytical emissivity; over rough mountainous regions or over the Amazon forest, the surface is significantly non-specular for instance, leading to large uncertainties in the analytic emissivity estimation over those regions.
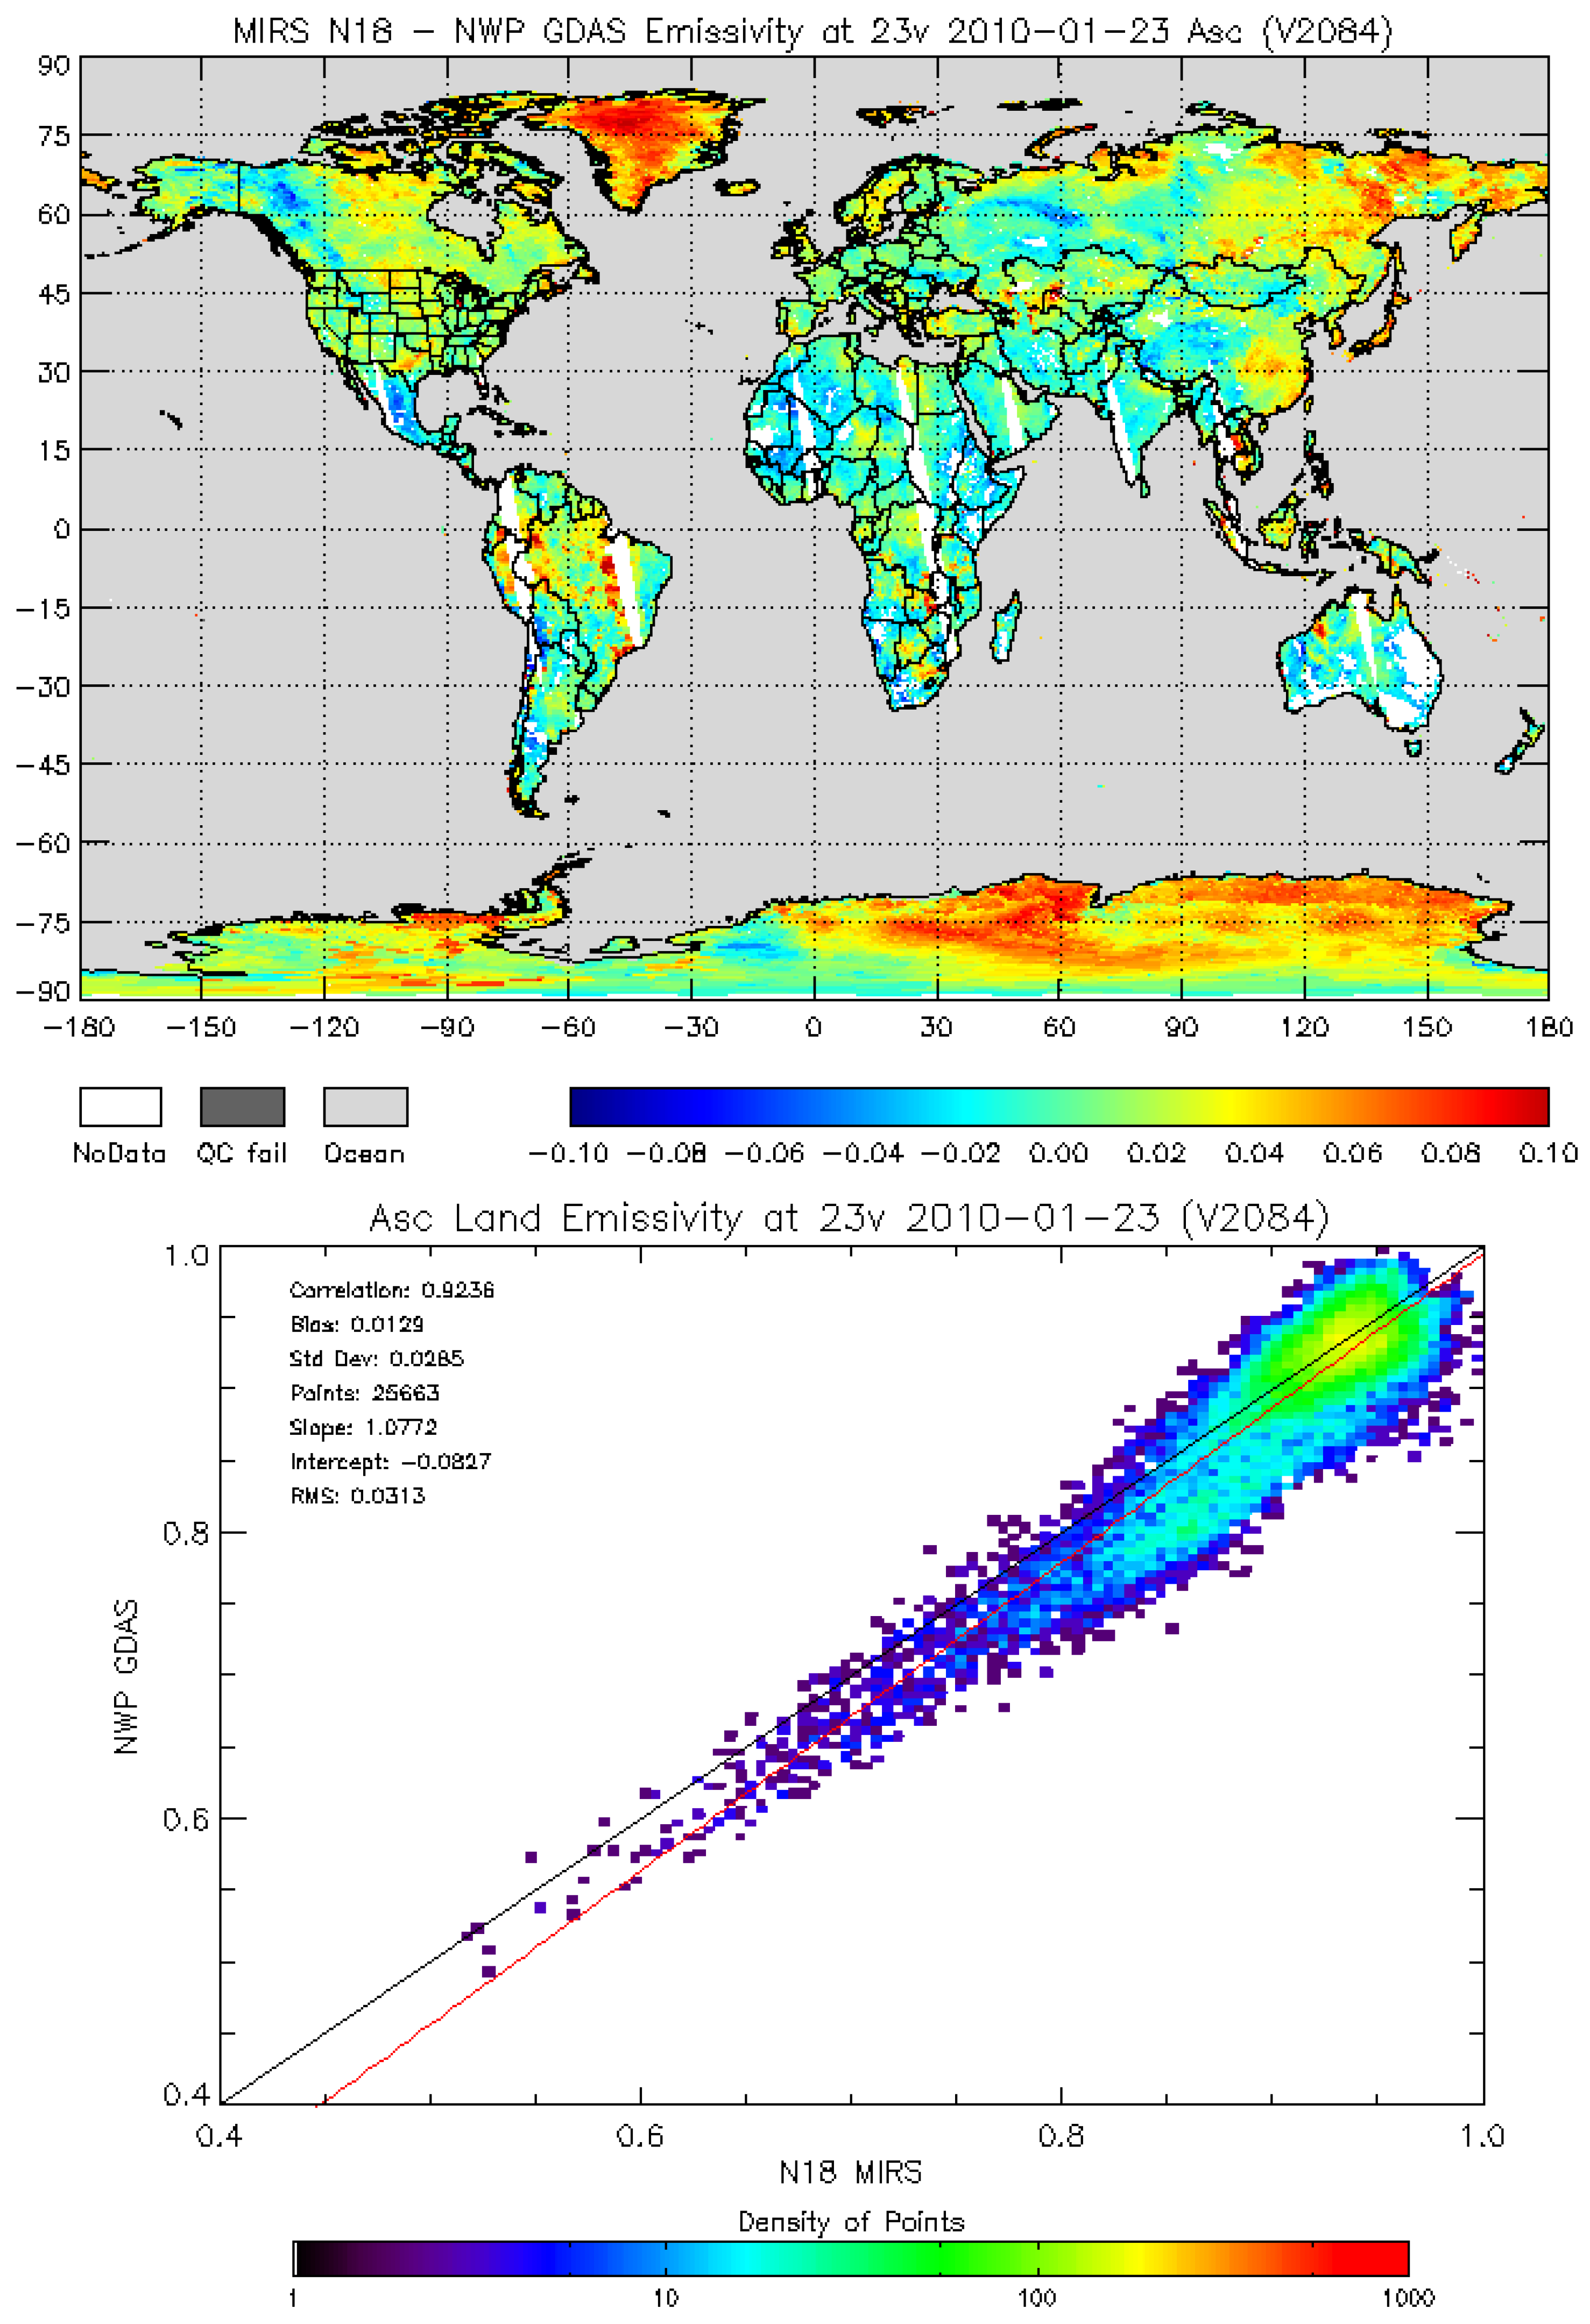
These differences are further highlighted in Figure 8, which shows the map of the difference between MiRS NOAA-18 retrieved emissivity at 23 GHz and the analytically computed emissivity from GDAS over land surfaces. The scatter plots in same figure provide a snapshot of the emissivity performances using the analytically computed emissivity as a reference, over both land and snow-covered land, separately. They reveal that there is good correlation between the two.
Table 1 and Table 2 compare the MiRS-retrieved emissivities from NOAA-18/AMSU (cross-track scanning geometry) and DMSP-F16 SSMI/S (conical scanning geometry), respectively, using the analytic emissivities as a reference. Recall that emissivities from all channels are retrieved by MiRS, but emissivities for some high-frequency channels are not analytically inverted given the opacity of the atmosphere for those channels. Therefore, only channels in the range from 19 to 50 GHz are compared.
The analytical emissivities were generated using both GDAS and the European Centre for Medium-Range Weather Forecasts (ECMWF), with the statistics for biases and standard deviations computed and shown separately for each. For emissivities at AMSU frequencies, the biases and standard deviations had very similar magnitudes compared to both ECMWF and GDAS analytical emissivities, ranging from ~0.015 to ~0.03. This gives us confidence that the statistics are not sensitive to the source of reference used. For emissivity at the SSMI/S frequencies, the same conclusion can be made, with one exception: the 19 GHz channel. At 19 GHz, the standard deviation in emissivity was 0.039 over snow and 0.041 over sea-ice when ECMWF was used as a reference; these values were slightly higher than the values of 0.023 for snow and 0.017 for sea-ice obtained when GDAS was used. This points to some potential discrepancy between ECMWF and GDAS analysis when computing the analytical emissivity over those regions.
An additional important assessment was made to verify the expected angle dependence of the emissivity retrieved by MiRS over surfaces known to have specular features that cause the dependence of emissivity on the viewing angle (from cross-tracking sensors). Figure 9 shows the angle dependence of the emissivity retrieved with MiRS by comparing its scan dependence with those computed from both GDAS and ECMWF analytical emissivities with the AMSU 23.8 GHz channel. The top plot presents the mean emissivities over snow-free land as a function of the scan angle. The MiRS retrieved emissivity appears to compare more favorably to the GDAS emissivity, while the ECMWF-based emissivity demonstrates a negative bias of about 0.01. The bottom figure shows the mean emissivities over snow-covered land as a function of the scan angle. Here, the MiRS-retrieved emissivity contains about a 0.015–0.020 bias relative to both GDAS and ECMWF, which have almost identical means. It is important to note that in MiRS, no bias corrections were applied over land (all non-ocean surfaces) to the brightness temperatures used in this retrieval, which could explain some of the biases found in the emissivity (of either MiRS or analytic emissivities). Angle dependence is also likely a mixture of natural emissivity variation over partially specular surfaces, but also sensor calibration that is not uniform across all angles. This explains, at least partially, the lower emissivities at the scanline edges. The main conclusion that can be drawn from this assessment is that MiRS captures, within reason, the angle dependence, through the analytical emissivity. Keep in mind that these emissivities are not instantaneous—they are averaged over large areas and therefore combine different surface sub-types. For example, over land, forest, desert, bare land, rivers, and urban surface types are included.
5. Examples of Emissivity-Based Products
In this section, we highlight some products that benefit from the emissivity retrieved from MiRS, either directly or indirectly. Some products are indeed generated directly from the emissivity signal (SIC, for instance) based on the post-processing step, as explained above. Other products are generated as part of the 1DVAR system (first step in MiRS), but thanks to the emissivity being part of the same retrieval, these parameters have been expanded to a multitude of other surfaces. Examples of such cases include TPW, which has been extended to land, sea-ice, and snow-covered surfaces. The accuracy of these parameters (those benefiting directly or indirectly from the emissivity dynamic retrieval) presents a tool for the indirect assessment of the emissivity product itself. This is due to direct linkage and simultaneous retrieval; in the context of dynamic simultaneous retrieval such as that employed by MiRS, if an error is found in one parameter, it likely means that a corresponding (or compensating) error exists in the emissivity. In other words, the obtainment of accurate atmospheric parameters retrieved as part of the same retrieval that generates emissivity likely means that the emissivity is also accurate. Similarly, if the SIC generated directly from the emissivity is accurate, it likely suggests that the emissivity is reasonably accurate as well. Note that this section is not aimed at providing a thorough validation of the emissivity-derived parameters, but simply to highlight some of them and point the reader, when appropriate, to publications that contain more thorough validation of specific parameters.
Figure 10 highlights some of the MiRS-based operational cryospheric products, including the SIC and the sea-ice age (FYI or MYI). These are products derived directly from emissivity. These products have been thoroughly validated [11] by intercomparison with established algorithms as well as with ground-truth data from the National Ice Center. They are also routinely generated and monitored for a multitude of sensors (https://www.star.nesdis.noaa.gov/mirs). The fact that SIC, derived from the emissivity, has been found to be valid is an indirect validation of the emissivity itself.
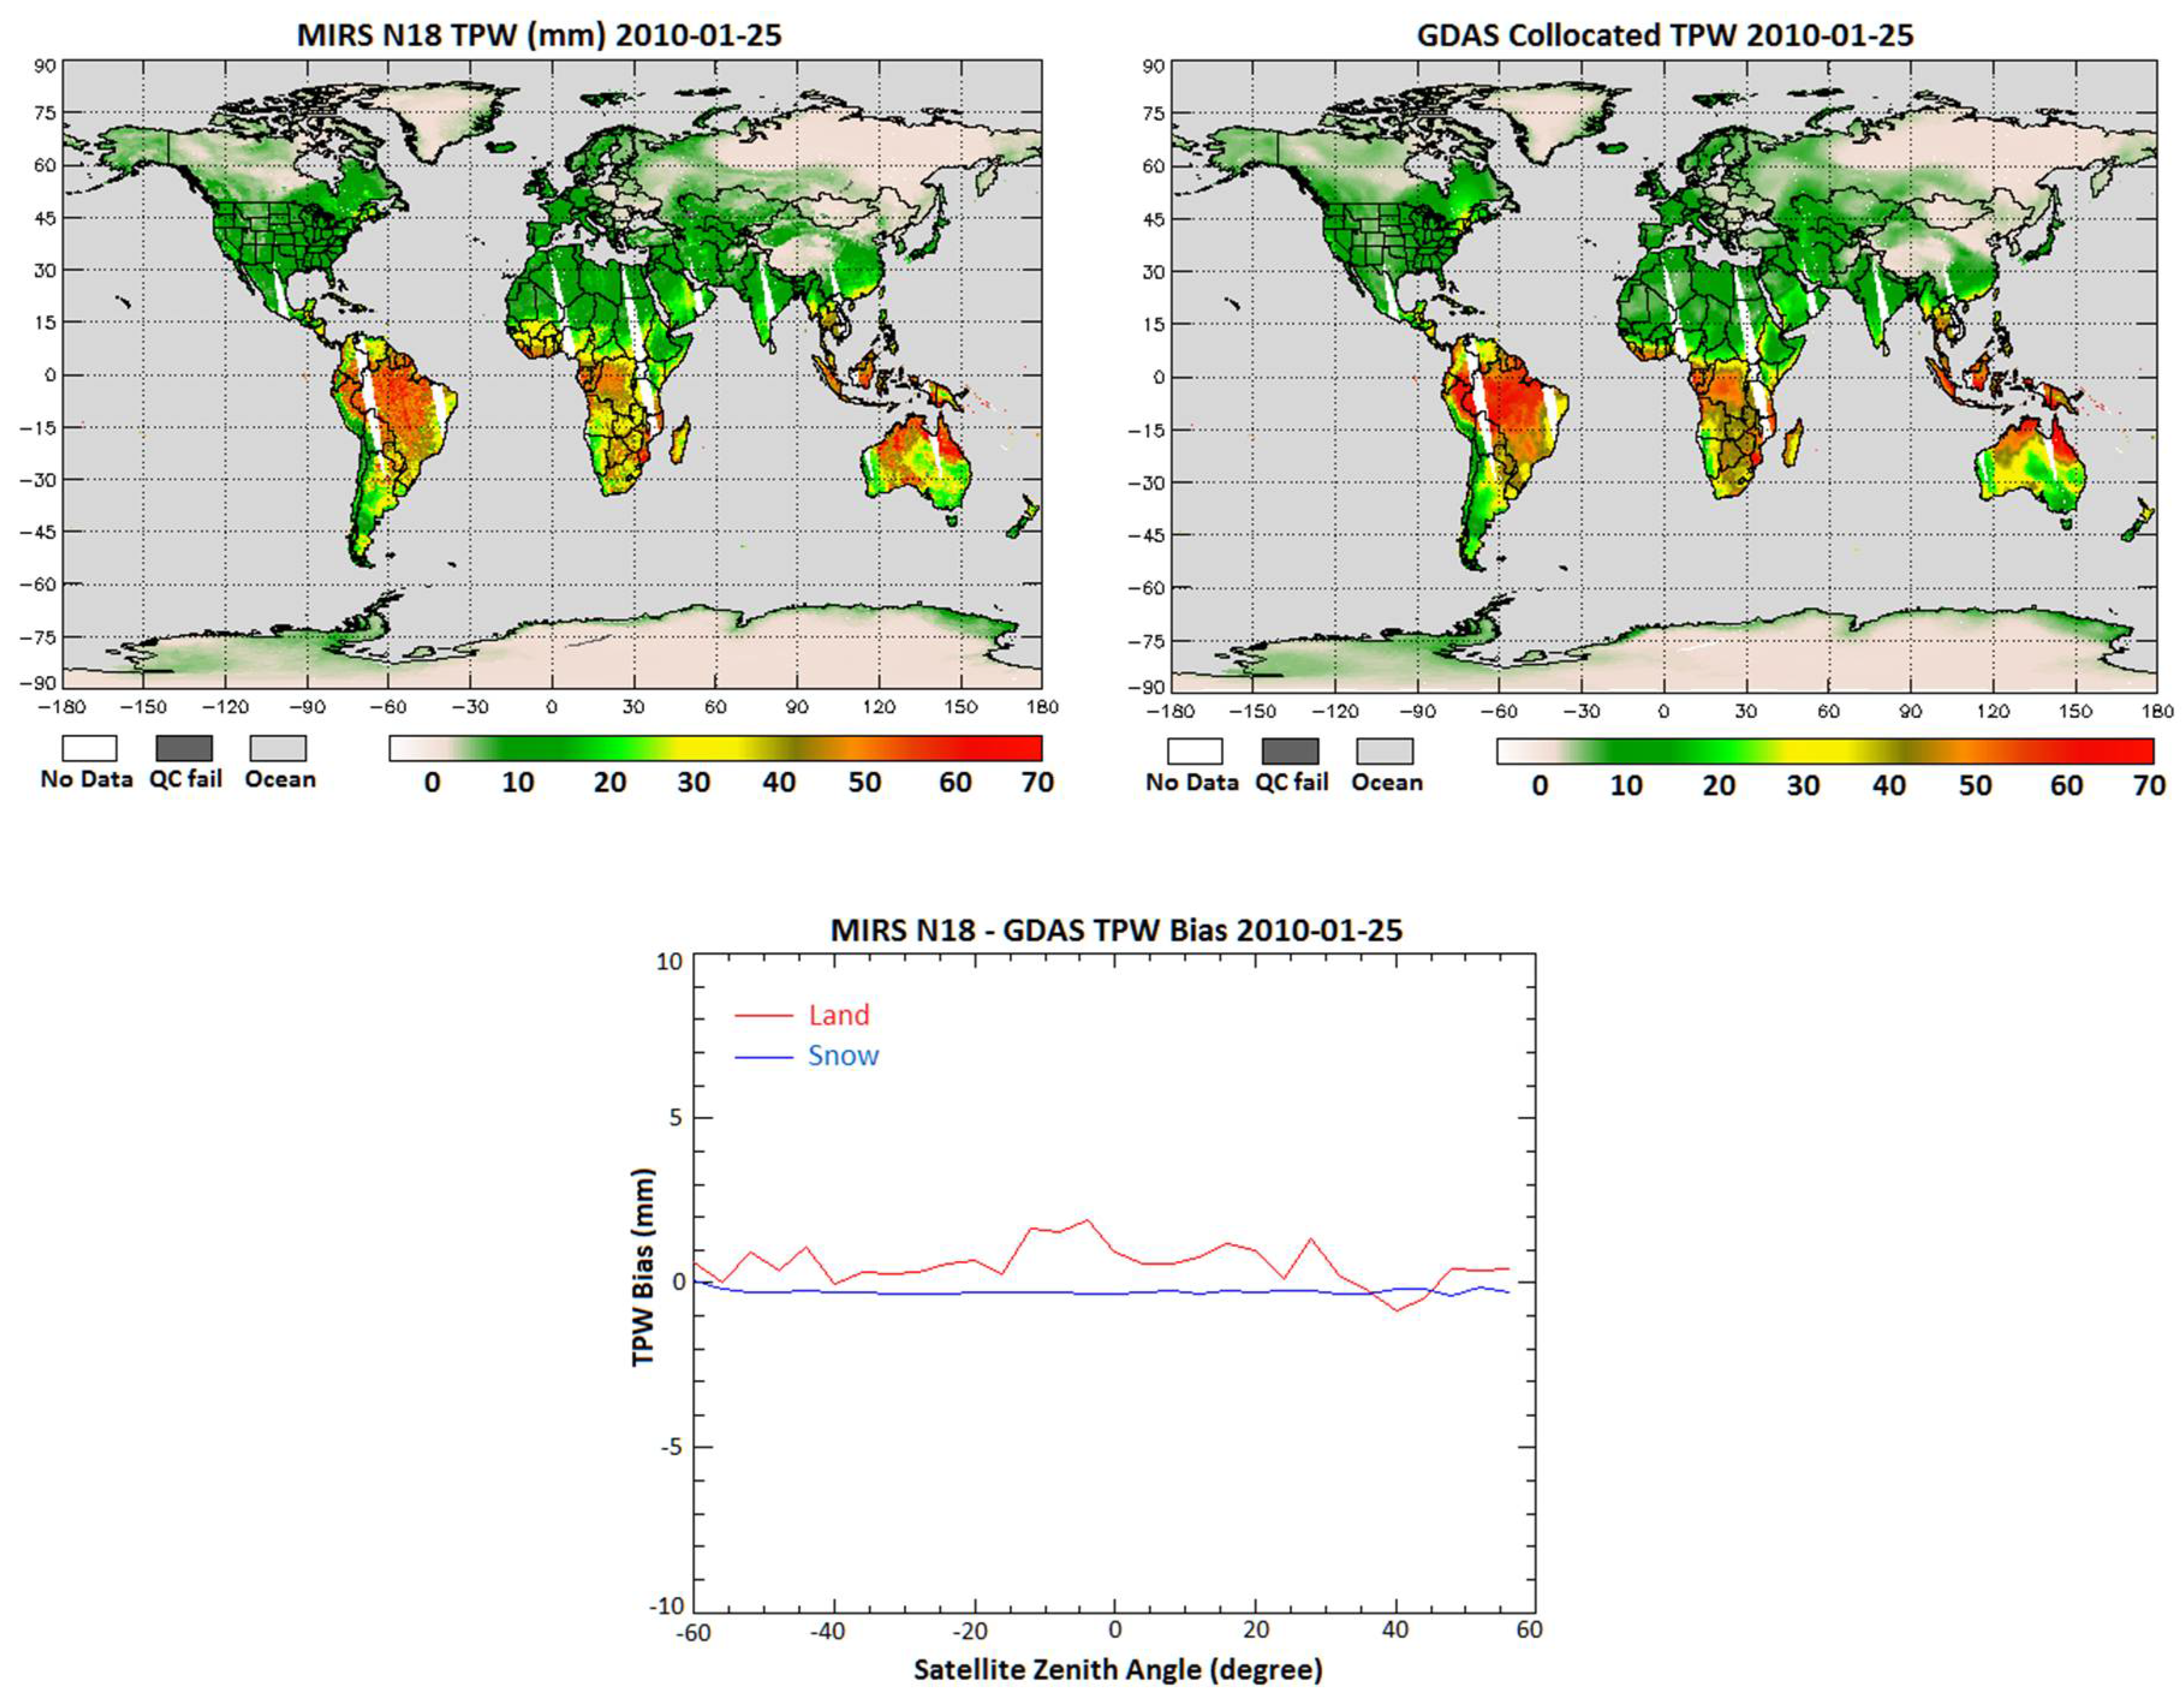
Another example is shown in Figure 11, which highlights TPW as one of the parameters that benefit indirectly from the simultaneous retrieval of emissivity. Indeed, because the emissivity is dynamically retrieved in the same 1DVAR algorithm as the atmospheric parameters, it is possible to extend the retrieval of TPW over non-ocean surfaces with microwave sensors. The methodology and extensive validation of this process was done in [18]. Figure 11 compares MiRS-based TPW over land to that from the GDAS, and their differences are stratified by zenith angle for snow-free and snow-covered surface types.
These assessments of MiRS products, for both the cryospheric and total moisture products, benefiting directly or indirectly from the dynamic emissivity, point to the fact that these products have good performances when compared to independent estimates, which indicates that the emissivity that is underlying or allowing their retrieval is also reasonably accurate.
6. Summary and Conclusions
In this study we presented the methodology and validated the performances of a dynamically retrieved emissivity based on a 1DVAR approach called MiRS. We also highlighted the benefit of this dynamic emissivity retrieval for other applications, such as the extension of atmospheric and hydrometeor parameter inversion over difficult (highly variable) backgrounds. This approach can be applied to a multitude of microwave sensors including imagers and sounders, of both cross-track and conical geometries. Previous intercomparison studies have already highlighted that this approach leads to similar results as other independent algorithms, including physical models that simulate emissivities using surface parameters as inputs. The present study attempted to thoroughly validate the performances of MiRS emissivity, using both qualitative and quantitative approaches. The main conclusion from the study is that the emissivity behaves fairly consistently with expectations—spatially, spectrally and temporally—based on current knowledge of emissivity dependencies. Comparisons with analytical emissivities allowed us to quantify the actual uncertainty and precision of retrieved emissivities over a number of surface types and for a number of frequencies. These performances were deemed fairly reasonable (less than 3%). These uncertainties/precisions almost certainly also include errors in the reference data itself, representativeness errors, and collocation errors, so one could argue that the actual emissivity errors (from MiRS and the measurements alone) are more likely within a 1% error margin for the window channels and surface types measured. While the analytical emissivity was found to be a good reference for this assessment, it is worth noting its sensitivity to the accuracy of inputs from numerical models (for skin temperature estimate for instance) and the non-universality of its assumptions (such as the assumed specularity of the surface) which limits both its accuracy and scope of validity. We emphasize that this dynamically-inverted emissivity from MiRS is inverted as part of the impact of all parameters on measurements, including the surface temperature, atmospheric, and hydrometeor parameters. These other parameters have also been extensively validated (not shown here and not within the scope of this study), which gives even more credence to the validity of the emissivity measures. If a systematic bias or high random error did exist in the emissivity because of its simultaneous inversion with other parameters, it is likely that it would also cause a systematic or higher random error in one or multiple other parameters. This is because for the inversion to be deemed successful, the inversion is constrained by a strict convergence criterion to fit the observations. No such systematic or high random errors were found when validating these atmospheric products.
Perhaps more importantly than the inversion of the emissivity itself, the inclusion of the emissivity in a dynamic inversion system made it possible to extend the retrieval of atmospheric and hydrometeor parameters from microwave sensors to non-traditional surfaces (such as retrieving TPW over land and ice surfaces). It also allowed us to extend the retrieval to mixed-pixel situations (such as coastlines and other surface type boundaries) in a very seamless fashion. This is an important application for those concerned with capturing the evolution of atmospheric rivers, for instance, which usually bring heavy precipitation to coastal and inland regions.
Another natural extension of this effort is the satellite data assimilation of surface sensitive channels, both in microwave and infrared sensors. Indeed, the same variational dynamic approach could be exploited in variational data assimilation systems by extending the data’s assimilation state vector to include the emissivity in the analysis process; or by using the MiRS emissivity as a parameter constraint when assimilating surface sensitive channels. This could potentially lead to an increased assimilation acceptance rate, more accurate lower tropospheric sounding, as well as more cloud- and rain-impacted data assimilation. Regarding this last point, we found that proper rain inversion (or assimilating rain-impacted data) from microwave passive data also accounts for the highly variable emissivity in the same process that extracts the rain information (or atmospheric information in general). The same channels that are sensitive to the rain are also sensitive to the surface, and in these situations (either during or after the rain), the surface emissivity’s changes are dramatic due to rain impact and are highly dependent on footprint coverage. Accounting for dynamic emissivity as part of the rain retrieval (or rain-impacted data assimilation) is crucial.
Author Contributions
Sid-Ahmed Boukabara conceived and designed the experiments; Kevin Garrett and Chris Grassotti performed the experiments; Sid-Ahmed Boukabara, Kevin Garrett, and Chris Grassotti analyzed the data and results; Sid-Ahmed Boukabara and Kevin Garrett wrote the paper.
Acknowledgments
The authors gratefully acknowledge many present and past contributors to the MiRS project especially Flavio Iturbide-Sanchez, Cezar Kongoli, Quanhua Liu and Banghua Yan for their particular contribution to the emissivity part, as well as past and current sponsors and in particular the NOAA transition-to-operations PSDI program and the JPSS cal/val program.
Conflicts of Interest
The authors declare no conflict of interest.
References
- Comiso, J.; Zwally, H.J. Temperature corrected bootstrap algorithm. Proc. IEEE IGARS Dig. 1997, 3, 857–861. [Google Scholar]
- Svendsen, E.; Mätzler, C.; Grenfell, T.C. A model for retrieving total sea ice concentration from a spaceborne dual-polarized passive microwave instrument operating near 90 GHz. Int. J. Remote. Sens. 1987, 8, 1479–1487. [Google Scholar] [CrossRef]
- Derksen, C. The contribution of AMSR-E 18.7 and 10.7 GHz measurements to improved boreal forest snow water equivalent retrievals. Remote Sens. Environ. 2008, 112, 2701–2710. [Google Scholar] [CrossRef]
- Tedesco, M.; Narvekar, P.S. Assessment of the NASA AMSR-E SWE Product. IEEE J.-STARS. 2010, 3, 141–159. [Google Scholar] [CrossRef]
- Owe, M.; de Jeu, R.; Holmes, T. Multisensor historical climatology of satellite-derived global land surface moisture. J. Geophys. Res. 2008, 113, F01002. [Google Scholar] [CrossRef]
- Grody, N.C. Satellite-based microwave retrievals of temperature and thermal winds: Effects of channel selection and a priori mean on retrieval accuracy. In Remote Sensing of Atmospheres and Oceans; Deepak, A., Ed.; Academic Press: Cambridge, CA, USA, 1980; pp. 381–410. ISBN 0-12-208460-8. [Google Scholar]
- Prigent, C.; Rossow, W.B.; Matthews, E. Microwave land surface emissivities estimated from SSM/I observations. J. Geophys. Res. 1997, 102, 21867–21890. [Google Scholar] [CrossRef]
- Karbou, F.; Prigent, C.; Eymard, L.; Pardo, J. Microwave land emissivity calculations using AMSU-A and AMSU-B measurements. IEEE Trans. Geosci. Remote Sens. 2005, 43, 948–959. [Google Scholar] [CrossRef]
- Yan, B.; Weng, F.; Meng, H. Retrieval of snow surface emissivity from the advanced microwave sounding unit. J. Geophys. Res. 2008, 113, D19206. [Google Scholar] [CrossRef]
- Boukabara, S.-A.; Garrett, K.; Chen, W.; Grassotti, C.; Kongoli, C.; Chen, R.; Liu, Q.; Yan, B.; Weng, F.; Ferraro, R.; et al. MiRS: An All-Weather 1DVAR Satellite Data Assimilation and Retrieval System. IEEE Trans. Geosci. Remote Sens. 2011, 49, 1–24. [Google Scholar] [CrossRef]
- Kongoli, C.; Boukabara, S.-A.; Yan, B.; Weng, F.; Ferraro, R. New Sea-Ice Concentration Algorithm Based on Microwave Surface Emissivities. IEEE Trans. Geosci. Remote Sens. 2011, 49, 175–189. [Google Scholar] [CrossRef]
- Han, Y.; Van Delst, P.; Liu, Q.; Weng, F.; Yan, B.; Treadon, R.; Derber, J. JCSDA Community Radiative Transfer Model (CRTM)—Version 1; NOAA Technical Report NESDIS 122; NOAA: Silver Spring, MD, USA, 2006; 33p.
- Iturbide-Sanchez, F.; Boukabara, S.-A.; Chen, R.; Garrett, K.; Grassotti, C.; Chen, W.; Weng, F. Assessment of a Variational Inversion System for Rainfall Rate over Land and Water Surfaces. IEEE Trans. Geosci. Remote Sens. 2011, 49, 1–24. [Google Scholar] [CrossRef]
- Liu, Q.; Weng, F.; English, S.J. An Improved Fast Microwave Water Emissivity Model. IEEE Trans. Geosci. Remote Sens. 2011, 49, 1238–1250. [Google Scholar] [CrossRef]
- Ferraro, R.R.; Peters-Lidard, C.D.; Hernandez, C.; Turk, F.J.; Aires, F.; Prigent, C.; Lin, X.; Boukabara, S.-A.; Furuzawa, F.A.; Gopalan, K.; et al. An evaluation of microwave land surface emissivities over the continental United States to benefit the GPM-era Precipitation Algorithms. IEEE Trans. Geosci. Remote Sens. 2013, 51, 378–398. [Google Scholar] [CrossRef]
- Norouzi, H.; Temimi, M.; Prigent, C.; Turk, J.; Khanbilvardi, R.; Tian, Y.; Furuzawa, F.A.; Masunaga, H. Assessment of the consistency among global microwave land surface emissivity products. Atmos. Meas. Tech. 2015, 8, 1197–1205. [Google Scholar] [CrossRef]
- Tian, Y.; Peters-Lidard, C.D.; Harrison, K.W.; Prigent, C.; Norouzi, H.; Aires, F.; Boukabara, S.-A.; Furuzawa, F.A.; Masunaga, H. Quantifying Uncertainties in Land-Surface Microwave Emissivity Retrievals. IEEE Trans. Geosci. Remote Sens. 2014, 52. [Google Scholar] [CrossRef]
- Boukabara, S.-A.; Garrett, K.; Chen, W.; Liu, Q.; Yan, B.; Weng, F. Global Coverage of Total Precipitable Water Using a Microwave Variational Algorithm. IEEE Trans. Geosci. Remote Sens. 2010, 48, 3608–3621. [Google Scholar] [CrossRef]
Figure 1.
Products from the Microwave Integrated Retrieval System (MiRS) two-steps retrieval process. Products listed in bold under “Derived Products” are generated from the emissivity spectrum. Soil moisture and wind speed/vector are not current operational products. 1DVAR: one-dimensional, variational-based physical approach.

Figure 2.
Illustration of MiRS emissivity-based products. The surface characteristics (Sea-Ice Concentration, SIC; Snow-Water Equivalent, SWE) are retrieved along with corresponding secondary parameters (age, grain size respectively), by matching the 1DVAR-retrieved emissivity with pre-computed emissivity spectra stored in a catalog.

Figure 3.
MiRS-based emissivity retrieved using SNPP/ATMS data from 7 September 2017. The emissivity of channel 1 (23 GHz) is shown. The emissivity is behaving as expected, with low values over the ocean, higher values over land, and intermediate values over coastal areas. Over land, lower values are also retrieved over water bodies and rivers. All cases have converged during the retrieval (not shown).

Figure 4.
Qualitative assessment of the MiRS-based emissivity retrieval from NOAA-18 Advance Microwave Sensor Unit (AMSU) measurements at the transition of the Sub-Saharan African coast. (The actual emissivity retrieved from MiRS highlighting the low-to-high transition from ocean emissivities to land emissivities, as expected (top), all while perfectly converging (bottom). Note also the angle dependence of the emissivity over the ocean, as expected, is captured by MiRS emissivities.

Figure 5.
Rain storms in Midwestern US, as captured by NEXRAD radars during the period between 5 May (top), 6 May (middle) and 7 May (bottom), 2007.
Figure 5.
Rain storms in Midwestern US, as captured by NEXRAD radars during the period between 5 May (top), 6 May (middle) and 7 May (bottom), 2007.

Figure 6.
MiRS-based emissivity maps and spectra, before (top), shortly after (middle) and three days after (bottom) the rain events in Midwestern US, shown in previous figure. Circles highlight the areas where the spectra were computed from, corresponding to rain events. The emissivity absolute values and spectra behave as expected, going from their dry land emissivity values and almost flat spectrum before the rain, to much lower values (and water-like spectrum) right after the rain. After a few days of drying, the emissivities go back (although not fully) to their higher values and dry-like flat spectrum.

Figure 7.
Global fields of non-ocean emissivity for the 50.3 GHz channel, as retrieved by the MiRS algorithm (top) and as provided by the analytical emissivity based on the Global Data Assimilation System (GDAS) analysis (bottom). The field corresponds to January 23, 2010. See text for more detail and for a discussion on the similarities and differences between the two.

Figure 8.
Difference between MiRS-retrieved 23 GHz emissivity over land surfaces from NOAA-18 and analytically computed emissivity from the collocated GDAS analysis on 23 January 2010 (top), along with scatter plots and statistics for points over snow-free land (middle) and snow-covered land (bottom).These results indicate that the MiRS emissivities over land are reasonably accurate with a standard deviation between 2% and 3%, including errors due to collocation, time matching and due to the reference emissivity used.


Figure 9.
Mean emissivity at 23.8 GHz as a function of scan angle averaged over snow-free land (top) and snow-covered land (bottom). These correspond to the MiRS NOAA-18 retrieved emissivity, the analytically computed GDAS emissivity, and the analytically computed ECMWF emissivity for 23 January 2010.

Figure 10.
Polar-stereographic image of MiRS NOAA-18 derived Sea-Ice Concentration (top-left), First-Year Ice (top-right) and Multi-Year Ice (bottom) over the Arctic on 25 January 2010, based on MiRS dynamic emissivities. These products were validated extensively in [11].
Figure 10.
Polar-stereographic image of MiRS NOAA-18 derived Sea-Ice Concentration (top-left), First-Year Ice (top-right) and Multi-Year Ice (bottom) over the Arctic on 25 January 2010, based on MiRS dynamic emissivities. These products were validated extensively in [11].

Figure 11.
MiRS derived TPW (top left) and GDAS TPW (top right) for January 23, 2010. The TPW difference as a function of scan angle is shown for land and snow-free land surfaces (bottom).
Figure 11.
MiRS derived TPW (top left) and GDAS TPW (top right) for January 23, 2010. The TPW difference as a function of scan angle is shown for land and snow-free land surfaces (bottom).


Table 1.
Performance of MiRS-based emissivities for three channels from NOAA-18 AMSU, when considering European Centre for Medium-Range Weather Forecasts (ECMWF)-based and GDAS-based analytically computed emissivities as references. Performance is shown in terms of bias (standard deviation) for land, snow and sea-ice surfaces.
| Emissivity Reference | Channel 23.8 GHz | Channel 31.4 GHz | Channel 50.3 GHz | |
|---|---|---|---|---|
| Reference: ECMWF-based analytical emissivity | Land | 0.015 (0.023) | 0.015 (0.023) | 0.015 (0.033) |
| Snow | 0.015 (0.025) | 0.003 (0.025) | −0.006 (0.032) | |
| Sea-Ice | 0.0001 (0.026) | −0.010 (0.026) | −0.025 (0.036) | |
| Reference: GDAS-based analytical emissivity | Land | 0.013 (0.029) | 0.012 (0.026) | 0.011 (0.035) |
| Snow | 0.021 (0.025) | 0.008 (0.025) | 0.0006 (0.029) | |
| Sea-Ice | 0.0004 (0.026) | −0.012 (0.025) | −0.026 (0.034) | |
Table 2.
Performances of MiRS-based emissivities for three channels (vertical polarization) from DMSP-F16 SSMI/S, when considering ECMWF-based and GDAS-based analytically computed emissivities as references. Performances are shown in terms of bias and (standard deviation) for land, snow and water surfaces.
| Emissivity Reference | Channel 19 GHz V | Channel 22 GHz V | Channel 37 GHz V | |
|---|---|---|---|---|
| Reference: ECMWF-based analytical emissivity | Land | 0.008 (0.029) | 0.009 (0.028) | 0.002 (0.027) |
| Snow | 0.003 (0.039) | −0.002 (0.022) | −0.005 (0.023) | |
| Sea-Ice | 0.001 (0.041) | 0.002 (0.019) | −0.001 (0.022) | |
| Reference: GDAS-based analytical emissivity | Land | 0.004 (0.026) | 0.011 (0.031) | 0.002 (0.029) |
| Snow | 0.002 (0.023) | 0.003 (0.025) | −0.002 (0.025) | |
| Sea-Ice | 0.002 (0.017) | 0.004 (0.018) | −0.002 (0.018) | |
© 2018 by the authors. Licensee MDPI, Basel, Switzerland. This article is an open access article distributed under the terms and conditions of the Creative Commons Attribution (CC BY) license (http://creativecommons.org/licenses/by/4.0/).
Share and Cite
MDPI and ACS Style
Boukabara, S.-A.; Garrett, K.; Grassotti, C. Dynamic Inversion of Global Surface Microwave Emissivity Using a 1DVAR Approach. Remote Sens. 2018, 10, 679. https://0-doi-org.brum.beds.ac.uk/10.3390/rs10050679
AMA Style
Boukabara S-A, Garrett K, Grassotti C. Dynamic Inversion of Global Surface Microwave Emissivity Using a 1DVAR Approach. Remote Sensing. 2018; 10(5):679. https://0-doi-org.brum.beds.ac.uk/10.3390/rs10050679
Chicago/Turabian StyleBoukabara, Sid-Ahmed, Kevin Garrett, and Christopher Grassotti. 2018. "Dynamic Inversion of Global Surface Microwave Emissivity Using a 1DVAR Approach" Remote Sensing 10, no. 5: 679. https://0-doi-org.brum.beds.ac.uk/10.3390/rs10050679
Note that from the first issue of 2016, this journal uses article numbers instead of page numbers. See further details here.