An Omnidirectional Morphological Method for Aerial Point Target Detection Based on Infrared Dual-Band Model

1
Key Laboratory of Airborne Optical Imaging and Measurement, Changchun Institute of Optics, Fine Mechanics and Physics, Chinese Academy of Sciences, Changchun 130033, China
2
University of Chinese Academy of Sciences, Beijing 100049, China
*
Author to whom correspondence should be addressed.
Remote Sens. 2018, 10(7), 1054; https://0-doi-org.brum.beds.ac.uk/10.3390/rs10071054
Submission received: 24 May 2018
/
Revised: 22 June 2018
/
Accepted: 29 June 2018
/
Published: 4 July 2018
(This article belongs to the Section Remote Sensing Image Processing)
Abstract
:Aerial infrared point target detection under nonstationary background clutter is a crucial yet challenging issue in the field of remote sensing. This paper presents a novel omnidirectional multiscale morphological method for aerial point target detection based on a dual-band model. Considering that the clutter noise conforms to the Gaussian distribution, the single-band detection model under the Neyman-Pearson (NP) criterion is established first, and then the optimal fused probability of detection under the dual-band model is deduced according to the And fusion rule. Next, the omnidirectional multiscale morphological Top-hat algorithm is proposed to extract all the possible targets distributing in every direction, and the local difference criterion is employed to eliminate the residual background edges further. The dynamic threshold-to-noise ratio (TNR) is adjusted to obtain the optimal probability of detection under the constant false alarm rate (CFAR) criterion. Finally, the dim point target is extracted after dual-band data correlation. The experimental result demonstrates that the proposed method achieves a high probability of detection and performs well with respect to suppressing complex background when compared with common algorithms. In addition, it also has the advantage of low complexity and easy implementation in real-time systems.

1. Introduction
Dim point target detection under complex background is a key technology in numerous fields, including infrared search and track (IRST) systems, terminal guidance, external intrusion warnings, and medical monitoring [1,2,3]. When the aerial target is far away from the infrared focal plane array (IRFPA), the signal intensity is very weak, and the minutiae are very small. More seriously, the target image is easily obstructed by bad weather, atmospheric radiation, nonstationary cloud and random noise, which lead to a very low signal-to-noise ratio (SNR) in the image [4]. These difficulties call for additional requirements for the detection system and target detection algorithm. The energy of the point target will be dispersed in the long-distance imaging process because of the diffraction-limited optical system [5], and the actual size of the point target is larger than the ideal imaging size of geometrical optics, typically no more than 3 × 3 pixels.
An infrared point target detection system usually adopts the mid-wave infrared (3~5 μm, MWIR) and the long-wave infrared (8~14 μm, LWIR) channels to capture target images [6]. When the aircraft is flying at a high speed, the envelope is an important infrared radiation source, which has the most significant radiation in the 8~14 μm band. Additionally, the exhaust flow formed by the engine combustion is an important radiation source, and there are two strong emission bands in 4.4 μm and 2.7 μm [7,8]. The single-band detection model cannot produce better results in some cases, as it is limited to the respective small response ranges. The dual-band detection model including MWIR and LWIR benefits from the advantages of both and assures the necessary transparency for long-distance target detection.
Over the past few decades, many researchers have paid much attention to single-band small target detection algorithms, which can be categorized into two approaches: spatial filtering and temporal filtering. The spatial methods commonly employ the template matching or background modeling in single frame or frame by frame detection, such as Max-median filtering [9], frame difference [10], DoG [11], and visual saliency [12]. The energy of the point target is weaker than the small target and has no energy characteristic of a Gaussian distribution, which requires a higher adaptability for the detection algorithm. Also, some scholars introduce the self-adapting filtering technology into spatial target detection, such as two-dimensional least-mean square (TDLMS) filter [13], the least squares support vector machine (LS-SVM) [14], and matched filter detector [15]. Although these methods are simple and fast, the different degrees of background edges are remained in the processing of background clutter suppression. Genin et al. [16] employed the block matching 3D filtering (BM3D) and Gaussian mixture model (GMM) to suppress complex background. It achieves a perfect effect but is time consuming. Niu et al. [17] proposed a higher-order statistics method that can detect point targets with a low SNR, although the probability of false alarm is high. To reduce the complexity and the false alarms, the multi-label generative Markov random field (MRF) model was proposed to realize background suppression and target enhancement [18], which performs a better effect for the point target in a larger size. As for temporal detection methods, an effective approach for moving point target detection is based on track before detect (TBD), which uses a path statistic for each potential object trajectory [19]. Sun et al. [20] proposed a framework for small target real-time visual enhancement based on the energy accumulation in dynamic programming. Huber-Shalem et al. [21] applied parametric temporal compressed coefficients to compress infrared imagery sequence containing slow moving point targets. Foglia et al. [22] proposed the adaptive Rao test and modified generalized likelihood ratio test (GLRT) to detect point-like targets in Gaussian clutter. When the target shows a relatively stable trajectory, TBD algorithms can achieve good results. However, the drawback is that these algorithms are too complex to meet real-time requirements.
In recent years, multisensor data fusion is widely applied in airborne sensing, medical diagnosis, and disaster prediction [23,24,25,26]. Mehmood et al. [27] presented the wavelet and Reed-Xiaoli (RX) algorithm for dual-band forward-looking infrared imagery, but it did not work for very small-sized targets. Wang et al. [28] used simple spatial correlation and spectra correlation to perform dual-band dim target detection, but the number of false alarms was also uncontrollable. Zhou et al. [29] applied joint sparse representation in dual-band dim target detection, which achieves better detection performance, yet is also time consuming. Yang et al. [30] found that dual-band detection can extract the apparent area and equivalent temperature of a small target, while a single-band infrared detector can only get the radiation intensity information. Yu et al. [31] proved that the probability of detection based on dual-band optimization is obviously better than that of any single-band detector relying on the NP criterion, and the traditional morphological Top-hat algorithm was adopted to simulate man-made targets for detection fusion. The Top-hat transform can extract bright image regions corresponding to the structural element, and the effect of background suppression depends greatly on the shape and size of the selected structural element [32,33,34,35]. The conventional Top-hat-based point target detection method only uses a single structural element, which cannot cover various point targets of changing size in real cases. Bai et al. [36,37] presented a multiscale center-surround Top-hat transform through constructing two structural elements and successfully extracted regions of interest (RoIs) which were richer in image details than using single structural element. In our previous research [3], multiscale morphological filtering combining Top-hat and Bottom-hat is proposed to detect all the possible targets, and the energy concentration criterion is adopted to eliminate false alarms, which perform a better background and noise suppression under single-band model. For the dual-band model, multiscale Top-hat transform could be optimized by the omnidirectional structural element to achieve better background suppression.
In this paper, we propose an omnidirectional morphological filtering for point target detection based on an infrared dual-band model. First, the single-band probability of detection and the probability of false alarm are established, and then the fused probability of detection and the probability of false alarm under the dual-band model are deduced according to the And fusion rule. The dynamic TNR is adjusted to obtain the optimal fused probability of detection under the NP criterion, and the relationship between the probability of detection and the two SNRs of targets in two channels is further obtained. Next, the omnidirectional multiscale morphological algorithm is adopted to suppress complex background. To further reduce false alarms, the local difference criterion is set up to eliminate the residual background edges, after which we obtain the RoI of the target, which mainly contains the noise and the target. Finally, the fused TNRs of the two channels are constantly updated according to the CFAR criterion to further eliminate false alarms and judge the true and false of the target.
The remainder of this paper is organized as follows. Section 2 deduces the optimal fused probability of detection under the dual-band CFAR model. Section 3 describes the proposed point target detection method, including omnidirectional multiscale morphological filtering, the local difference criterion and the adaptive CFAR threshold under the dual-band model. Section 4 presents the experiments on real infrared images and the results of the proposed method, and Section 5 evaluates the target detection performance of the proposed method by comparison with the common methods. Section 6 presents the conclusion of the paper.
2. Target Detection Model
2.1. Single-Band Detection Model
In pursuit of a high probability of detection, the corresponding probability of false alarm will also become larger. To obtain a predictable and stable detection performance, system designers tend to design a CFAR target detector [38]. The NP criterion is most effectively and commonly adopted in radar early-warning systems [39], where the probability of false alarm is limited to a constant and very small value, and the probability of detection reaches the maximum after the proper statistical processing. The IRST system can also obtain the CFAR threshold based on the NP criterion.
Random noise and background clutter affect the probability of detection of the target, and the clutter signal usually demonstrates the random distribution. The noise source of an infrared imaging system can be divided into photon noise and electronic noise [40]. Electronic noise, which is the main noise source, includes readout circuit noise, preamplifier noise, and scanning noise, while the photon noise is from the quantum effect in the detection process [41]. Typically, when the bandwidth is chosen properly, the noise intensity of the infrared detector can be described as Gaussian white noise with zero mean, which does not change with the signal.
In real-world scenarios, the amount of background clutter is much larger than that of the targets. If the background suppression algorithm exhibits good performance, the detector output can still be approximated to the spatially independent and stationary Gaussian distribution, whose probability density function is expressed as:
where is the probability density function of the detector output. is the gray mean of the target area, and is the gray mean of the clutter noise. is the standard deviation (STD) of the noise.
The SNR is defined as the ratio of the point target strength to the STD of noise [42], and the TNR is defined as the ratio of the threshold to the STD of noise, whose definitions are as follows:
The complementary error function is defined as:
Based on the CFAR detection model, the system’s probability of detection is defined as the probability that the signal value exceeds the CFAR threshold, while the probability of false alarm is defined as the probability that the noise exceeds the CFAR threshold. The system’s probability of false alarm under the single-band model generated by Gaussian noise can be expressed by the complementary error function:
where represents the single-band probability of false alarm. It can be considered that the probability of false alarm is determined by TNR. The TNR calculated from above is: .
The probability of detection can be obtained from Equations (1)–(5), which is given by the following expression:
where represents the single-band probability of detection.
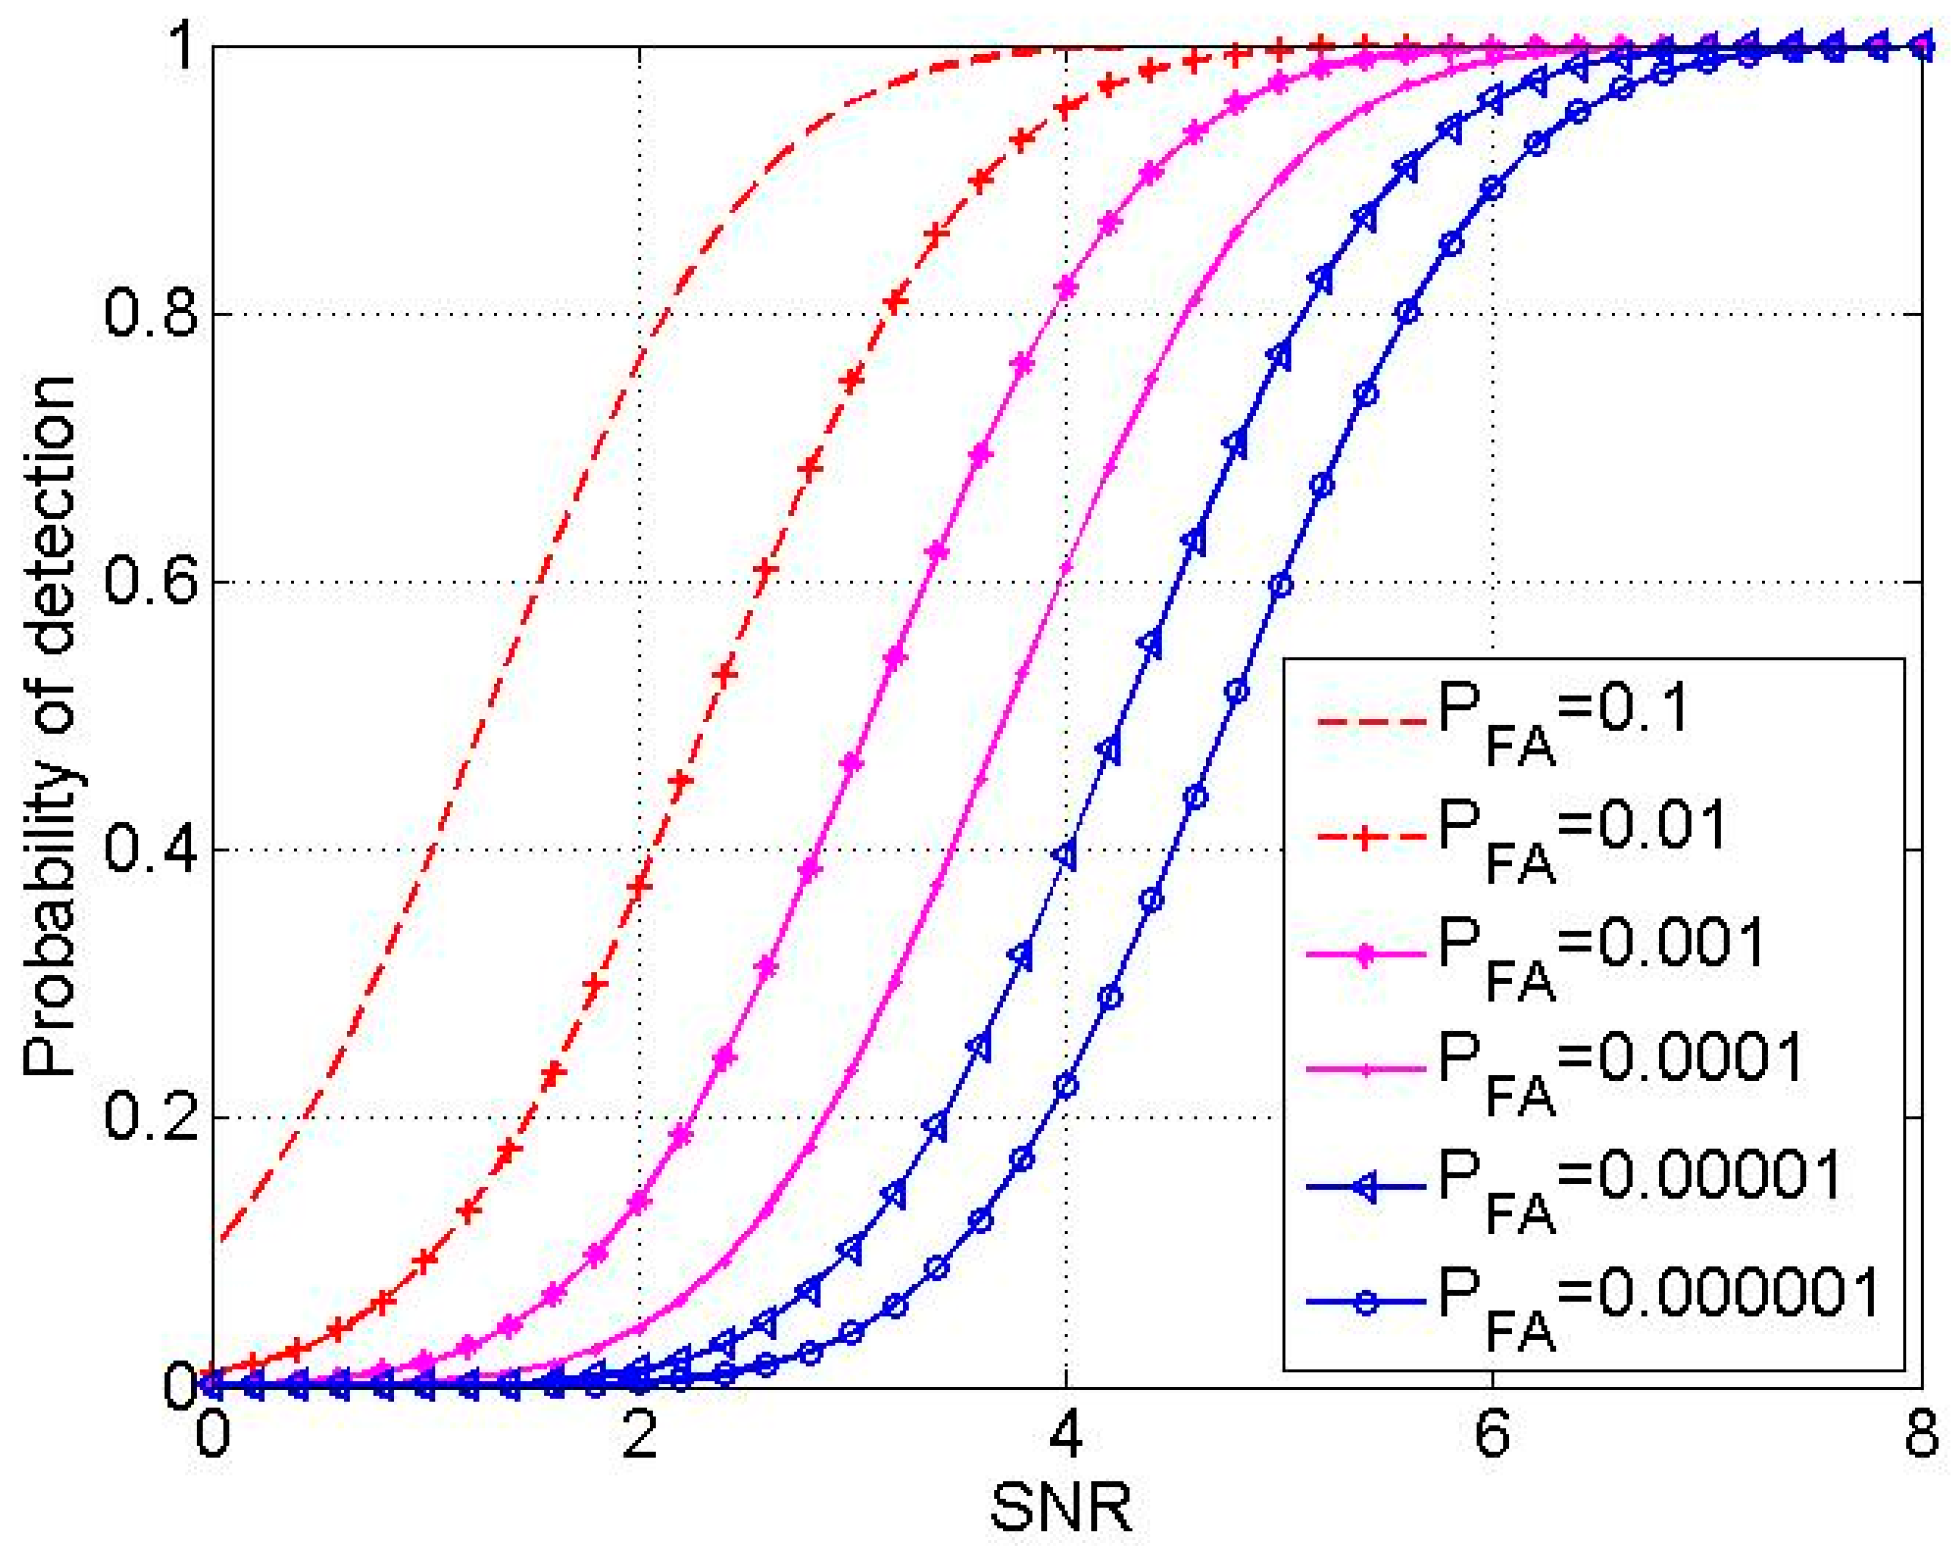
For a single-band detection system, the system’s probability of detection can be solved by Equation (6) when the system’s probability of false alarm and the actual SNR of the point target are given. The relation curve between the probability of detection and SNR of the target is simulated under several common probabilities of false alarm, as shown in Figure 1.
It can be seen clearly that the higher the SNR of the target, the greater the system’s probability of detection will be under the CFAR model. The probability of detection is very close to or as high as 100% when the SNR reaches 8. The SNR of the to-be-detected point target is generally less than 5, and the probability of false alarm required by the system is usually 10−6~10−3, which is difficult to meet using the single-band detection model alone. The probability of detection under the dual-band model is derived in the following.
2.2. Dual-Band Detection Model
The dual-band point target detection model follows the And fusion rule, which can be expressed as follows:
where and are the probability of detection and the probability of false alarm in Channel 1, and , are the probability of detection and the probability of false alarm in Channel 2. and are the fused probability of detection and the fused probability of false alarm under the dual-band detection model. The fused probability of false alarm , and is the acceptable maximum probability of false alarm. It can be seen that , and thus the dual-band target detection system can effectively reduce the probability of false alarm.
We specify the decision rule as follows: When the suspected targets are detected in both channels, they are identified as the real point targets. When both channels fail to detect the suspected targets, they are identified as false alarms. If only one channel detects the suspected targets, we further analyze them.
From the above analysis, the fused probability of false alarm and the fused probability of detection under the dual-band model are expressed as follows:
where , are the fused probability of false alarm and the fused probability of detection, respectively, and TNR1, TNR2 are the threshold-to-noise ratios (TNRs) of the two channels, which are calculated from , . , are the thresholds, and SNR1, SNR2 are the SNRs of the point target in the two channels. and are the STDs, respectively, and , are the gray means of the clutter noise, respectively. is determined by the TNRs and SNRs of the two channels.
On the basis of the NP criterion, assuming that the fused probability of false alarm. is , the maximum of is named the optimal fused probability of detection in this paper. In fact, it is very cumbersome to solve the equations, although unnecessarily, because the SNR of the point target is different in the actual situation. Better yet, the SNRs of the point target in two channels can be assumed. The overall detection level is determined by the TNRs of the two detectors, and the optimal fused probability of detection can be obtained by iterating TNR1 under the dual-band model.
2.3. Simulation and Analysis
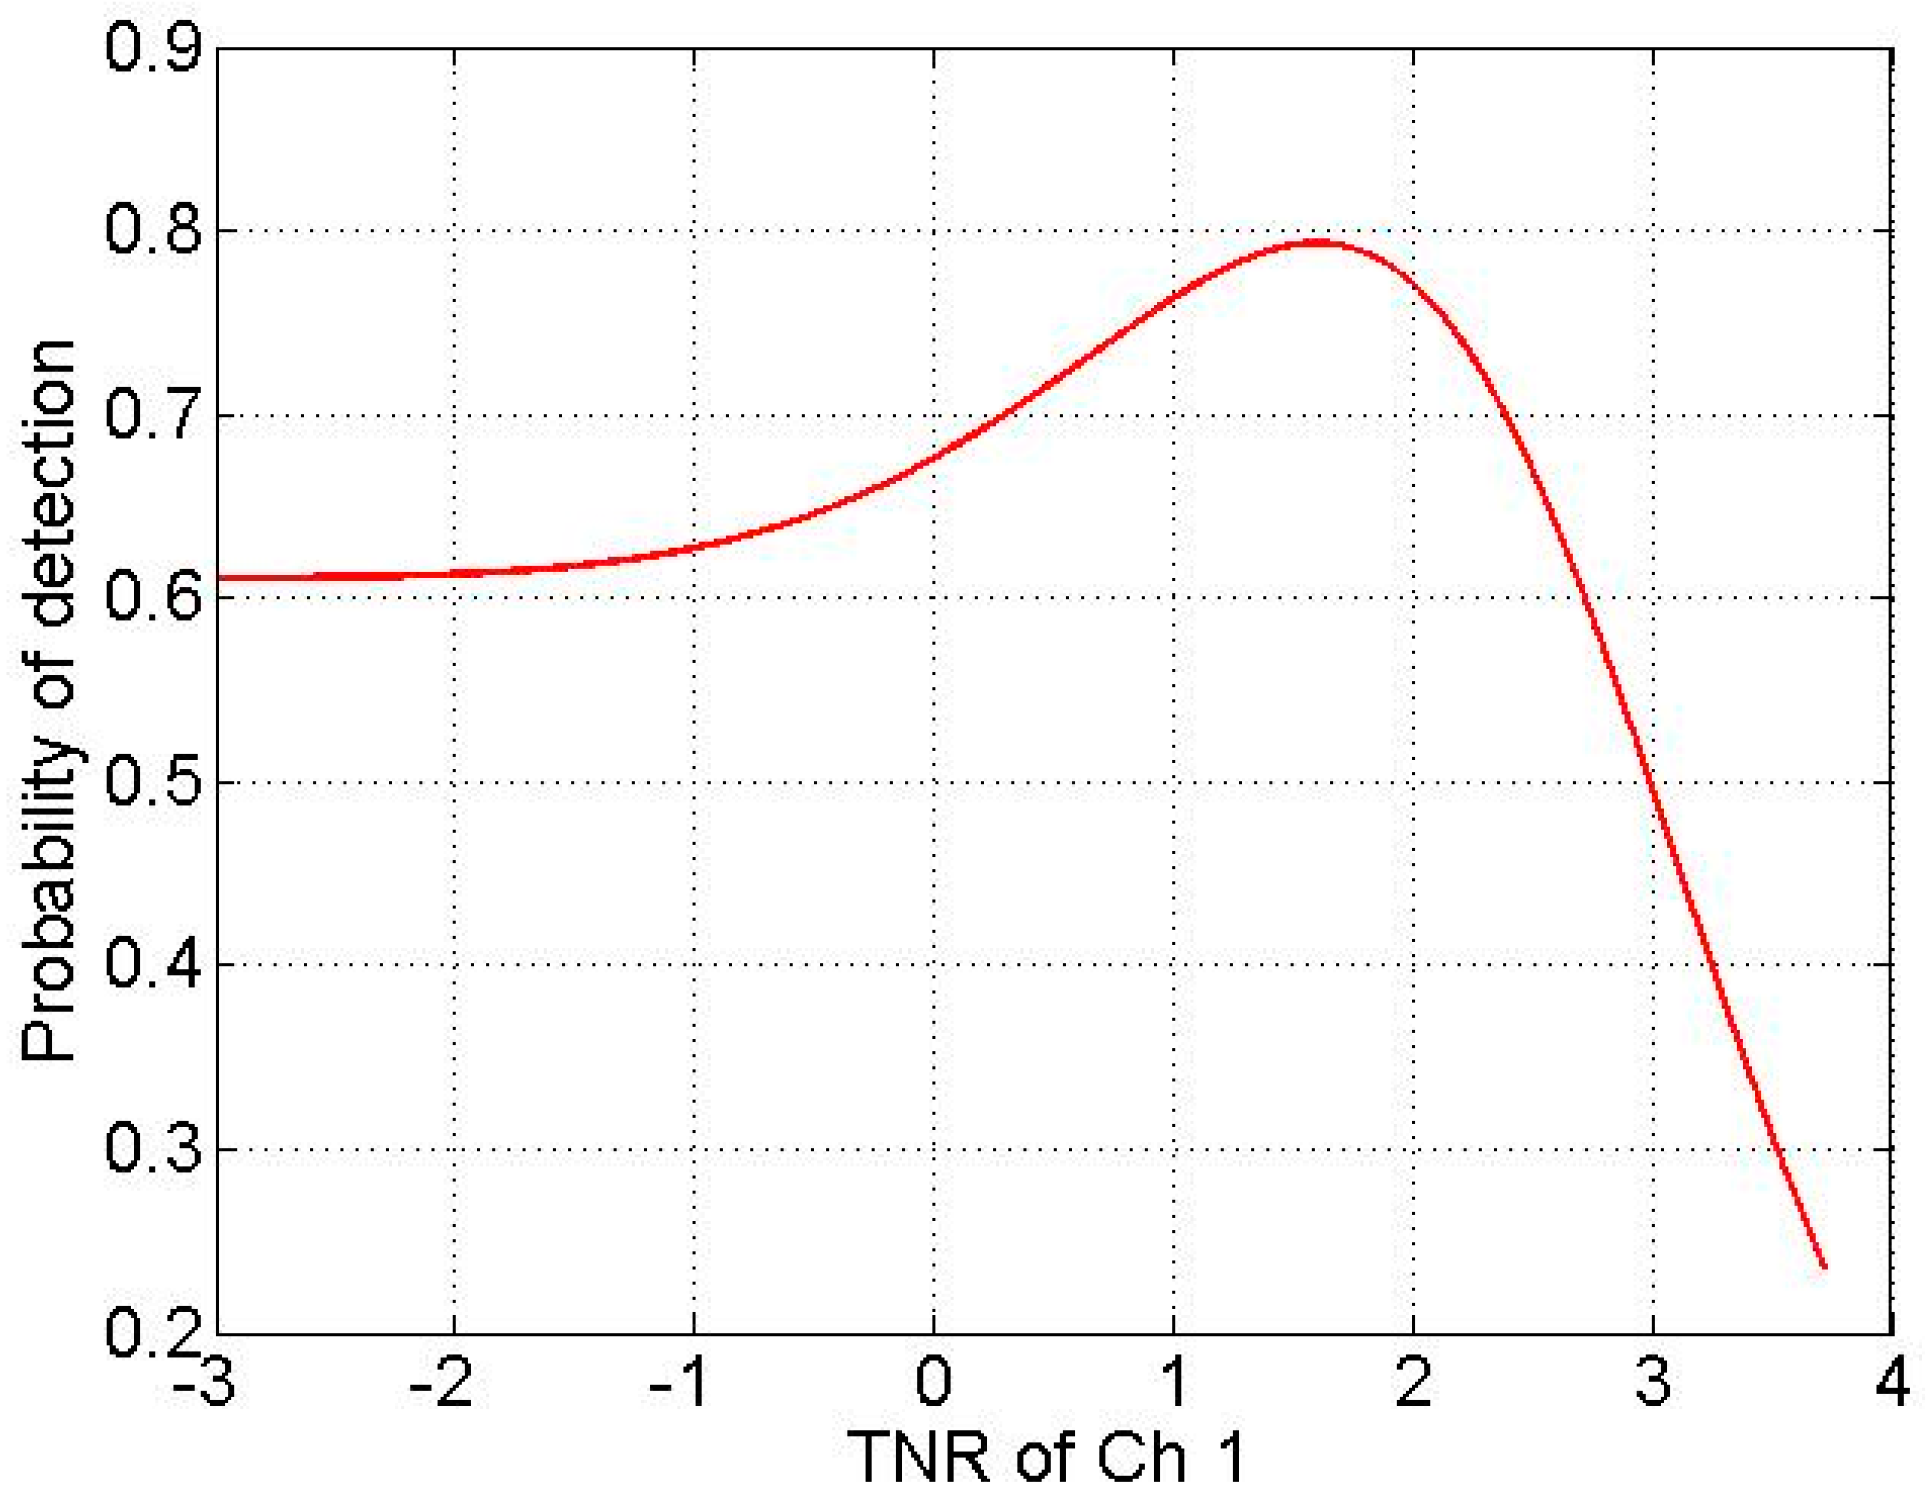
The probability of false alarm required by the system is assumed to be 10−4. According to the SNR of the to-be-detected point target, we assume that the SNR of the point target of IR Channel 1 (SNR1) is 3 and that of IR Channel 2 (SNR2) is 4. By iterating the TNR1 of Channel 1 (from −3 to 4), we obtain the simulation curve of fused probability of detection via TNR1, as shown in Figure 2. The simulation result shows that the optimal fused probability of detection is 0.7931, which is higher than that of any single-band model.
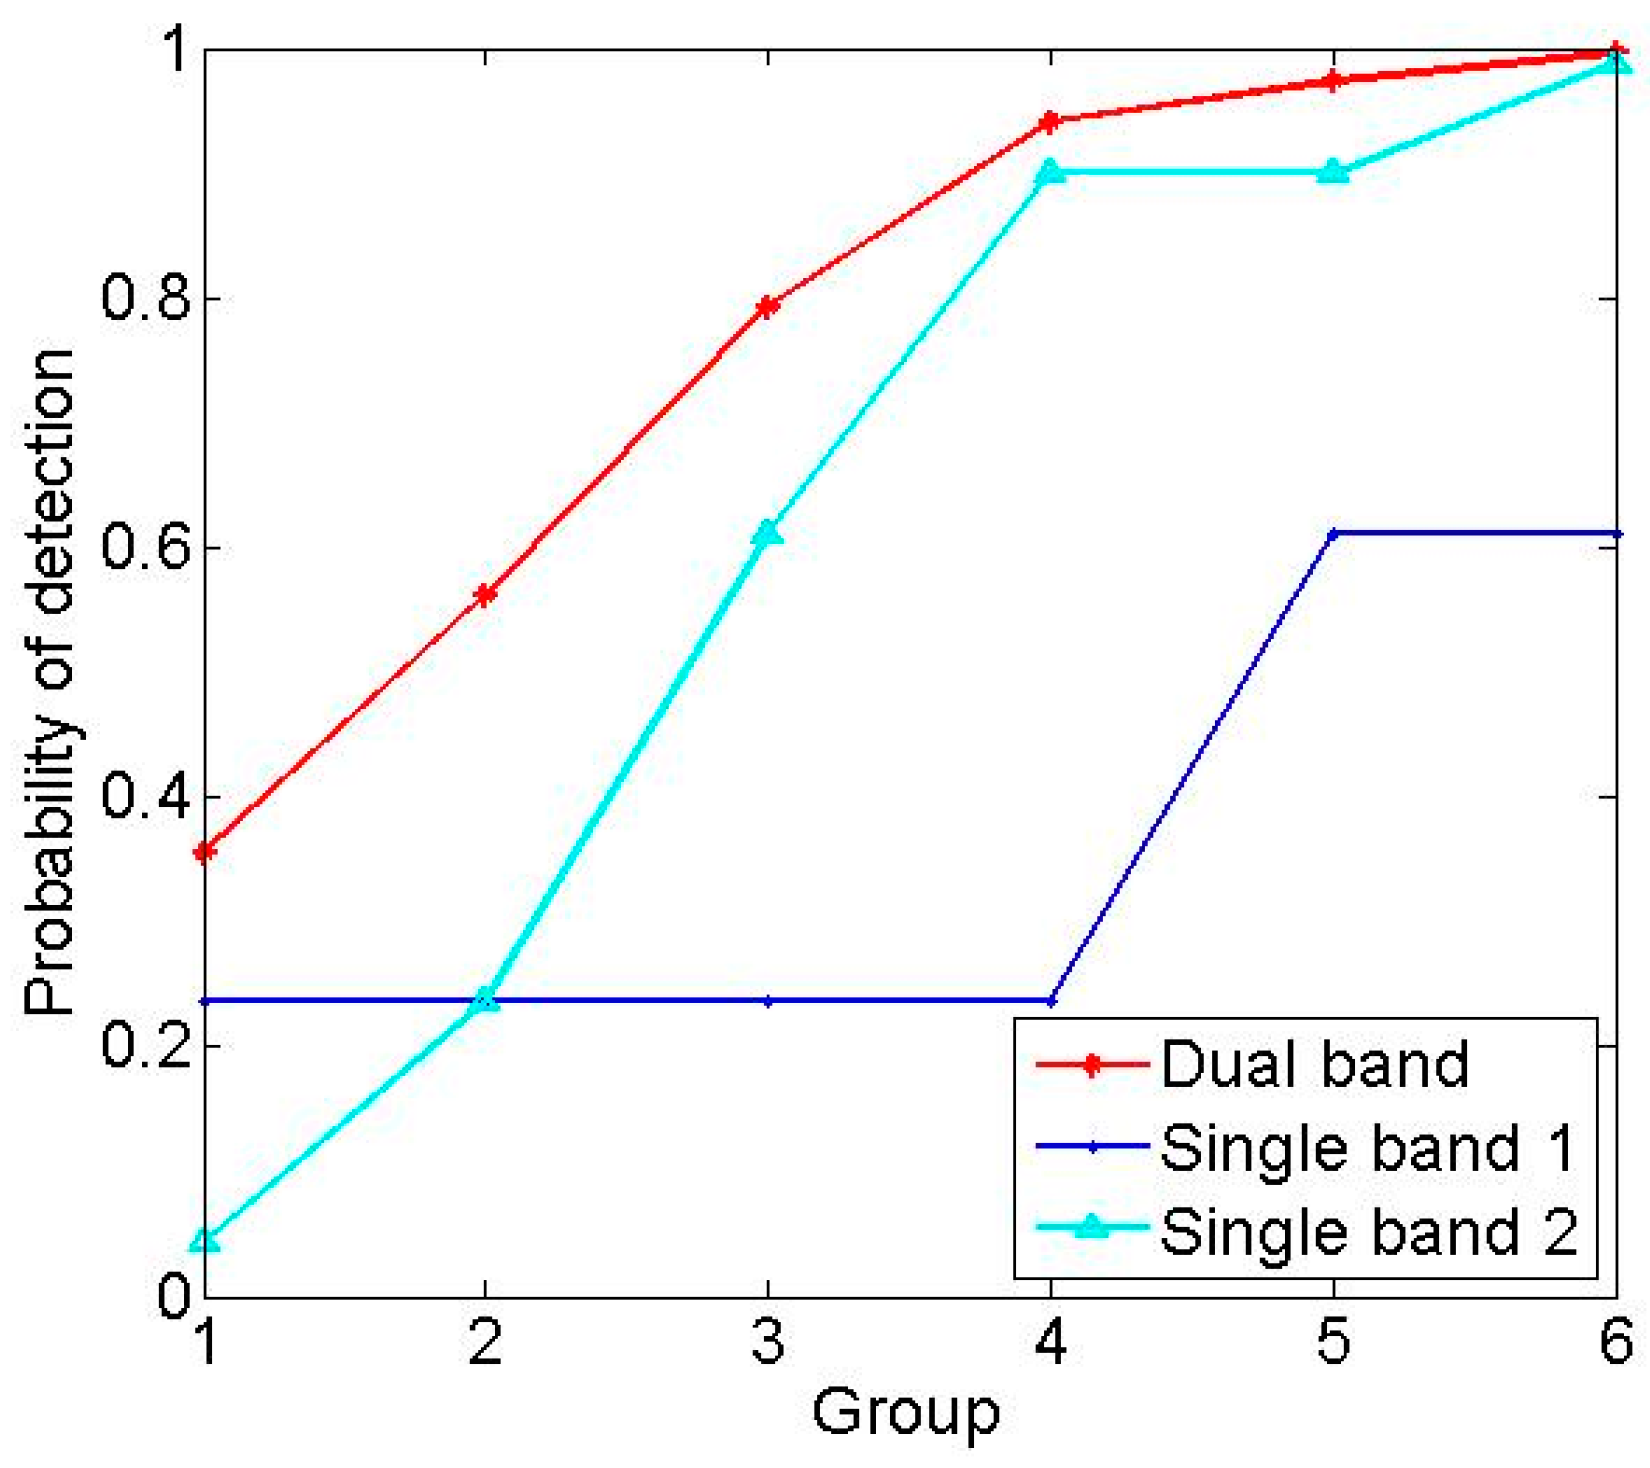
For a more intuitive comparison, we have summed up the comparable results of the single-band and dual-band models, as shown in Table 1, and the comparable curves of probability of detection are also summarized in Figure 3. As seen, the optimal fused probability of detection after And fusion achieves a better result.
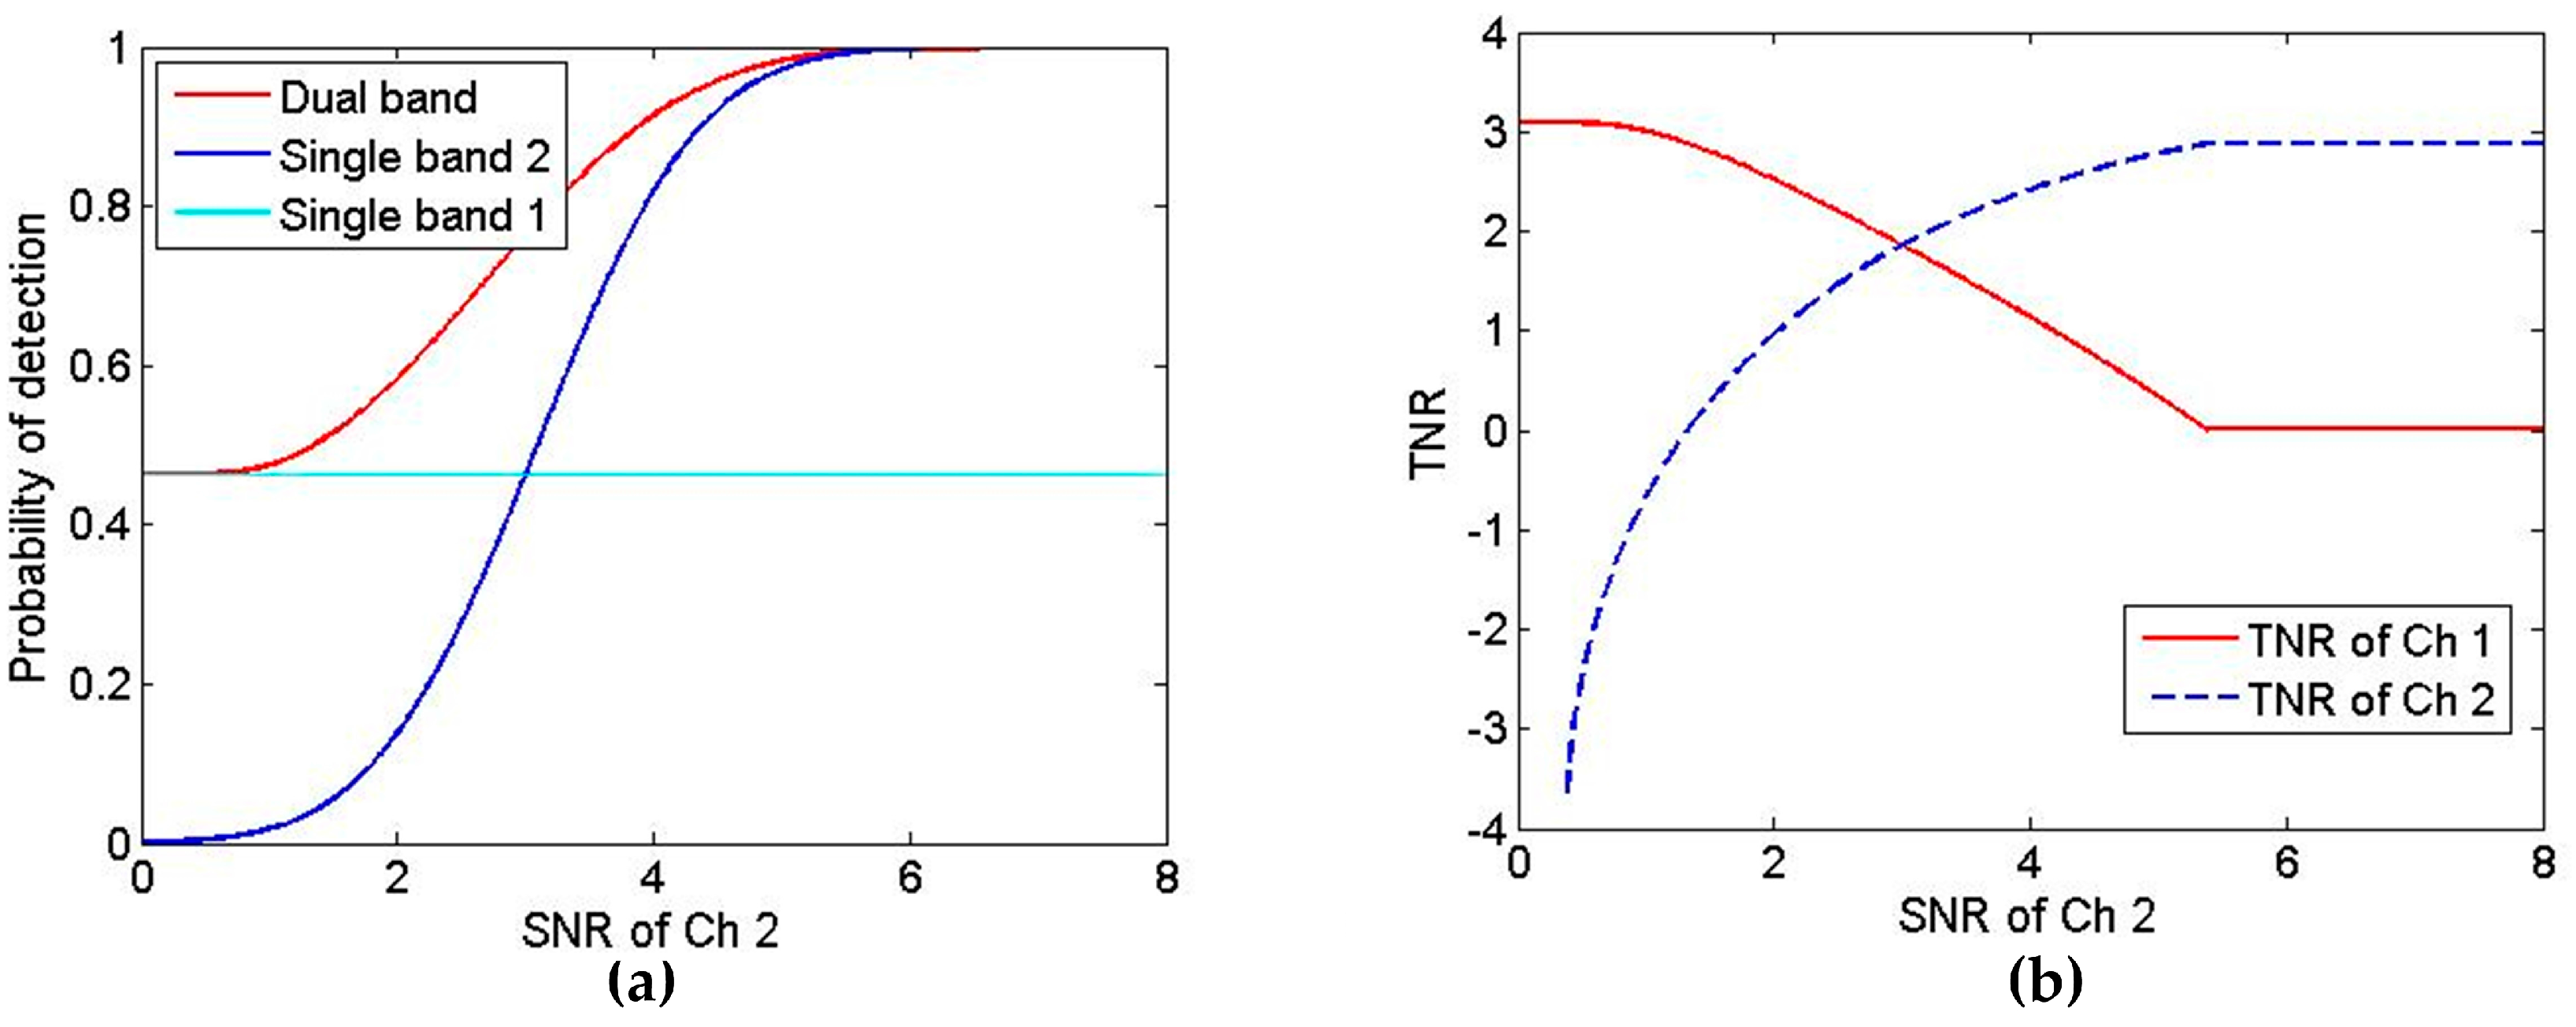
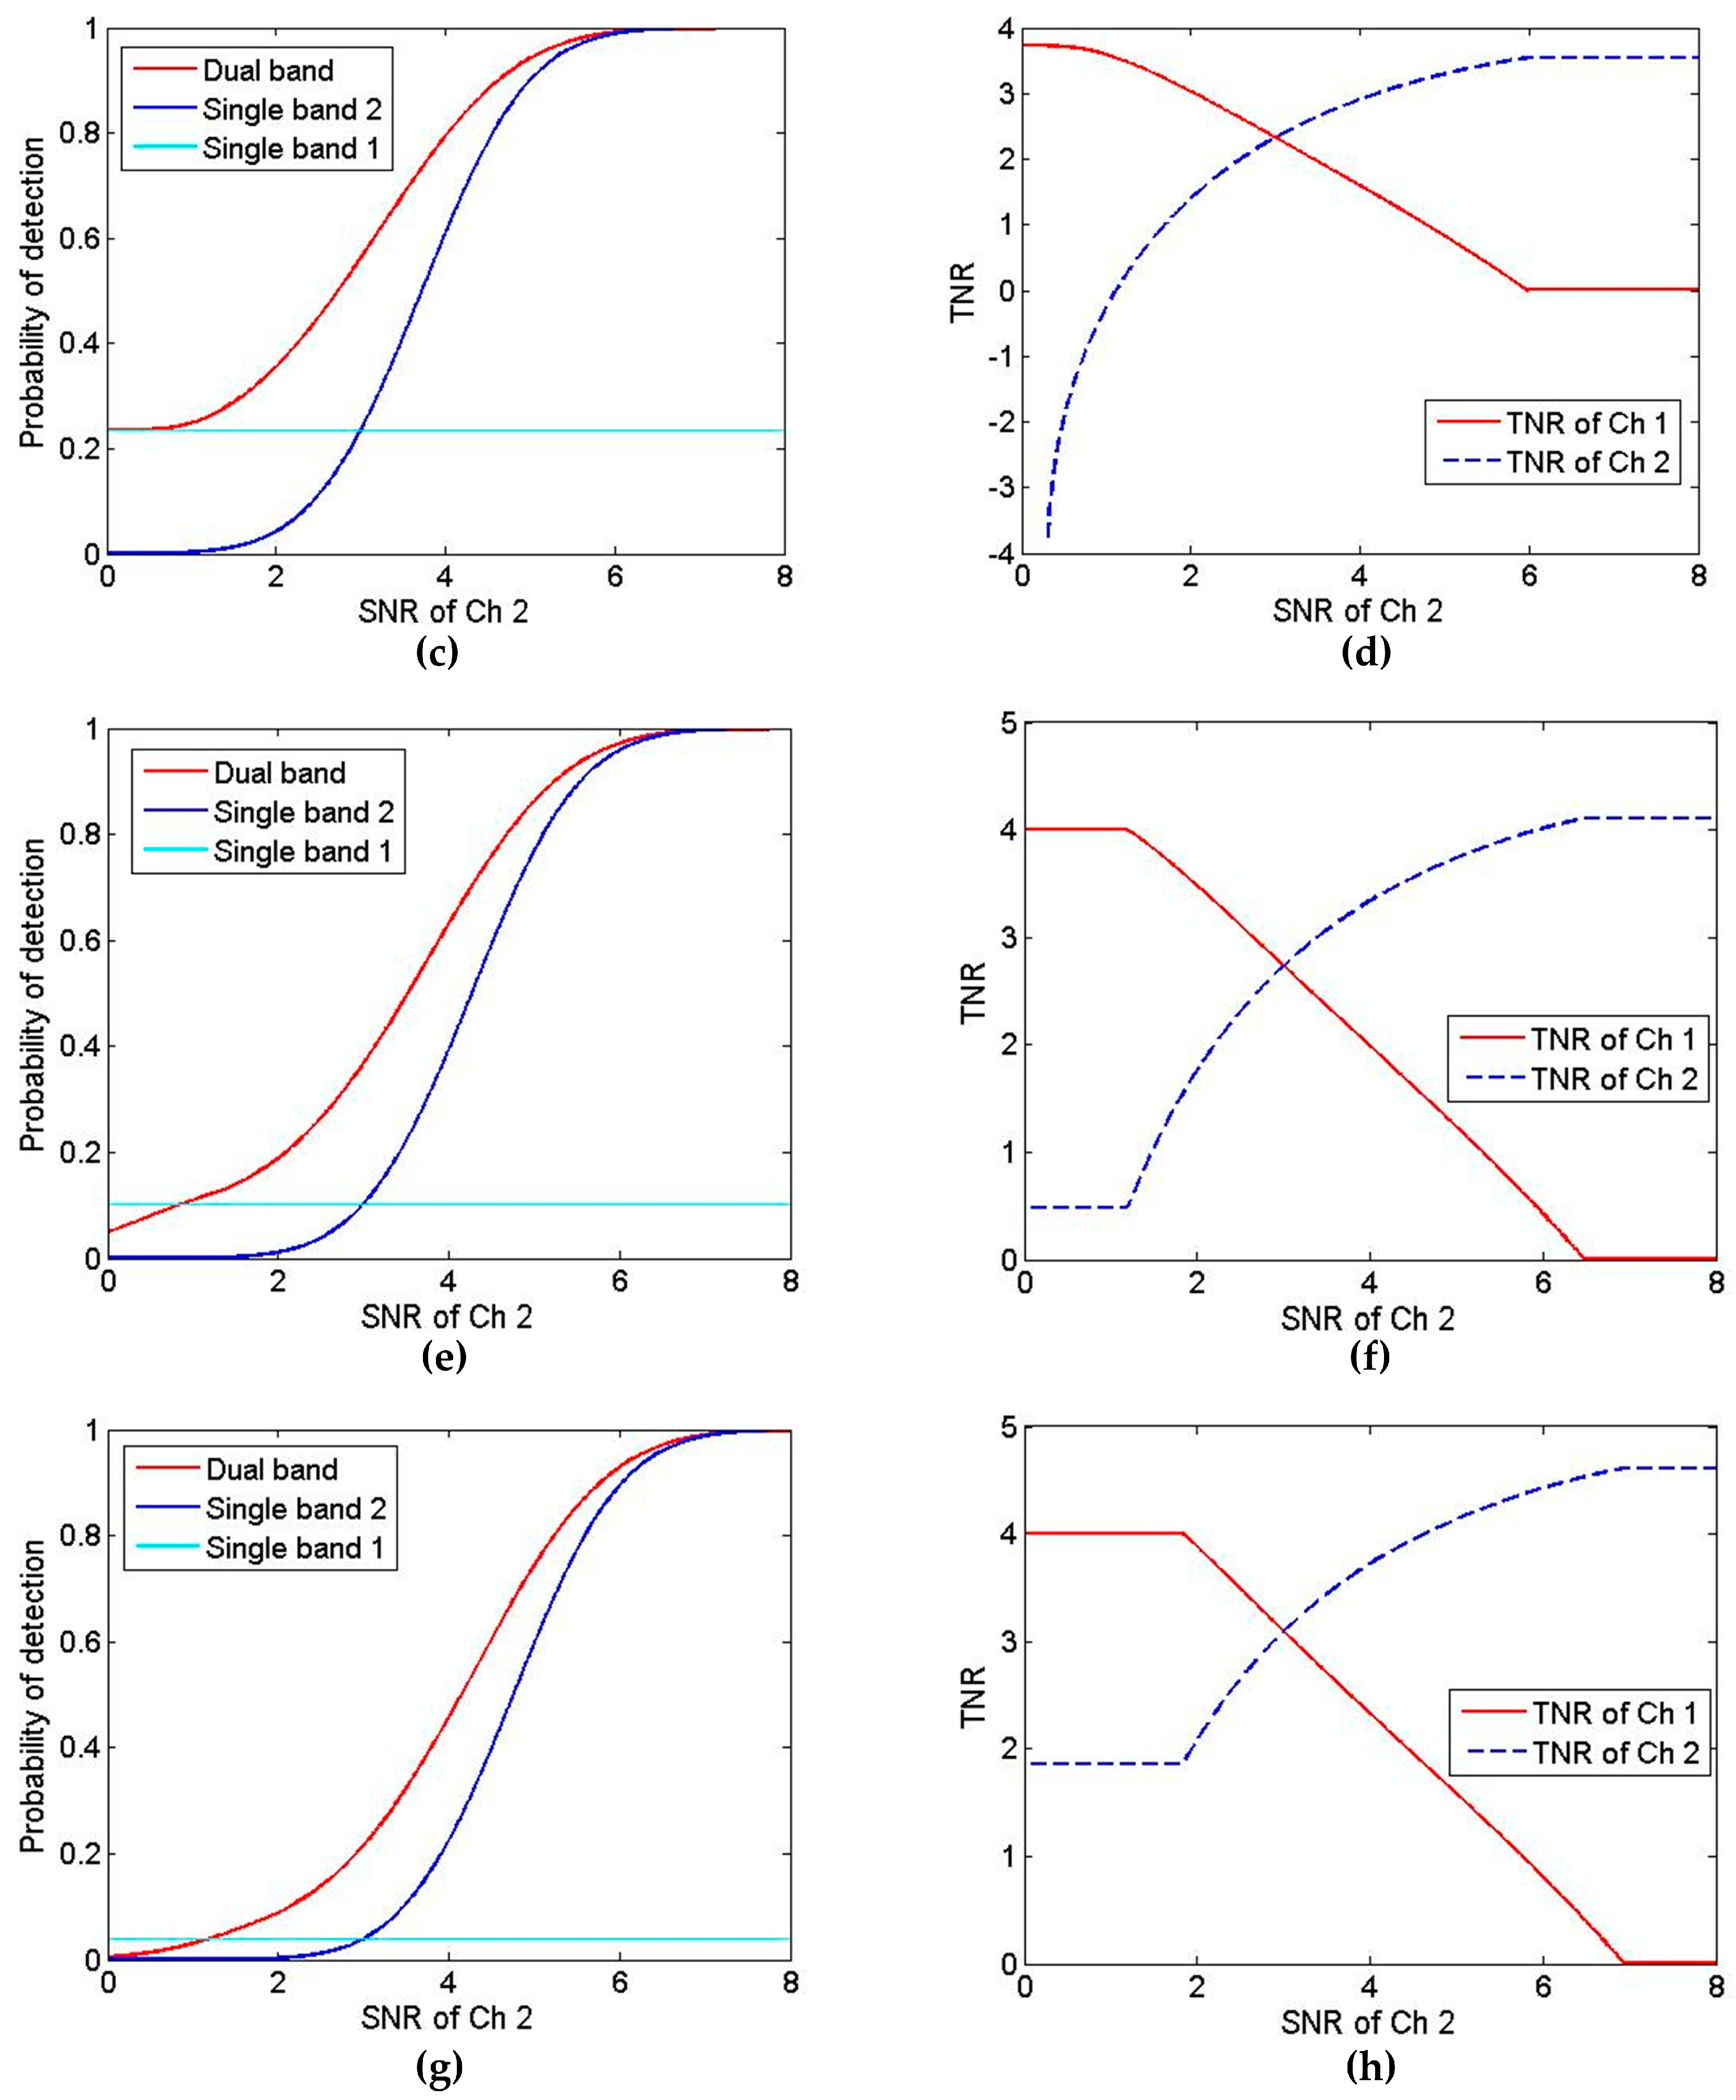
By using the iterative method proposed above, we simulate the general situation, namely, fixing the SNR of one channel, by changing the TNR of the other channel to obtain the curve of the optimal fused probability of detection and compare it with the single-band model further. The specific simulation parameters are as follows: Single-band 1 (SNR = 3); Single-band 2 (SNR = 0~8); Dual-band (Ch 1: SNR1 = 3, Ch 2: SNR2 = 0~8). We have discussed four common situations: the system’s probabilities of false alarm are 10−3, 10−4, 10−5 and 10−6, respectively. A comparison of the probability of detection between single-band and dual-band models and the dynamic adjustment results of TNR1, TNR2 are summarized in Figure 4.
As shown by the single-band and dual-band comparable curves, when the system’s probability of false alarm is 10−3 or 10−4, the dual-band probability of detection is always better than that of the single-band, regardless of what SNR2 is. When the system’s probability of false alarm is 10−5 or 10−6 and if SNR2 reaches a small value, i.e., 0.86, 1.19, respectively, there exists a critical point of probability of detection between the two models. If SNR2 is less than the critical point, the single-band probability of detection is slightly higher than that of the dual-band model. If SNR2 exceeds the critical point, the dual-band model has better performance than the single-band model.
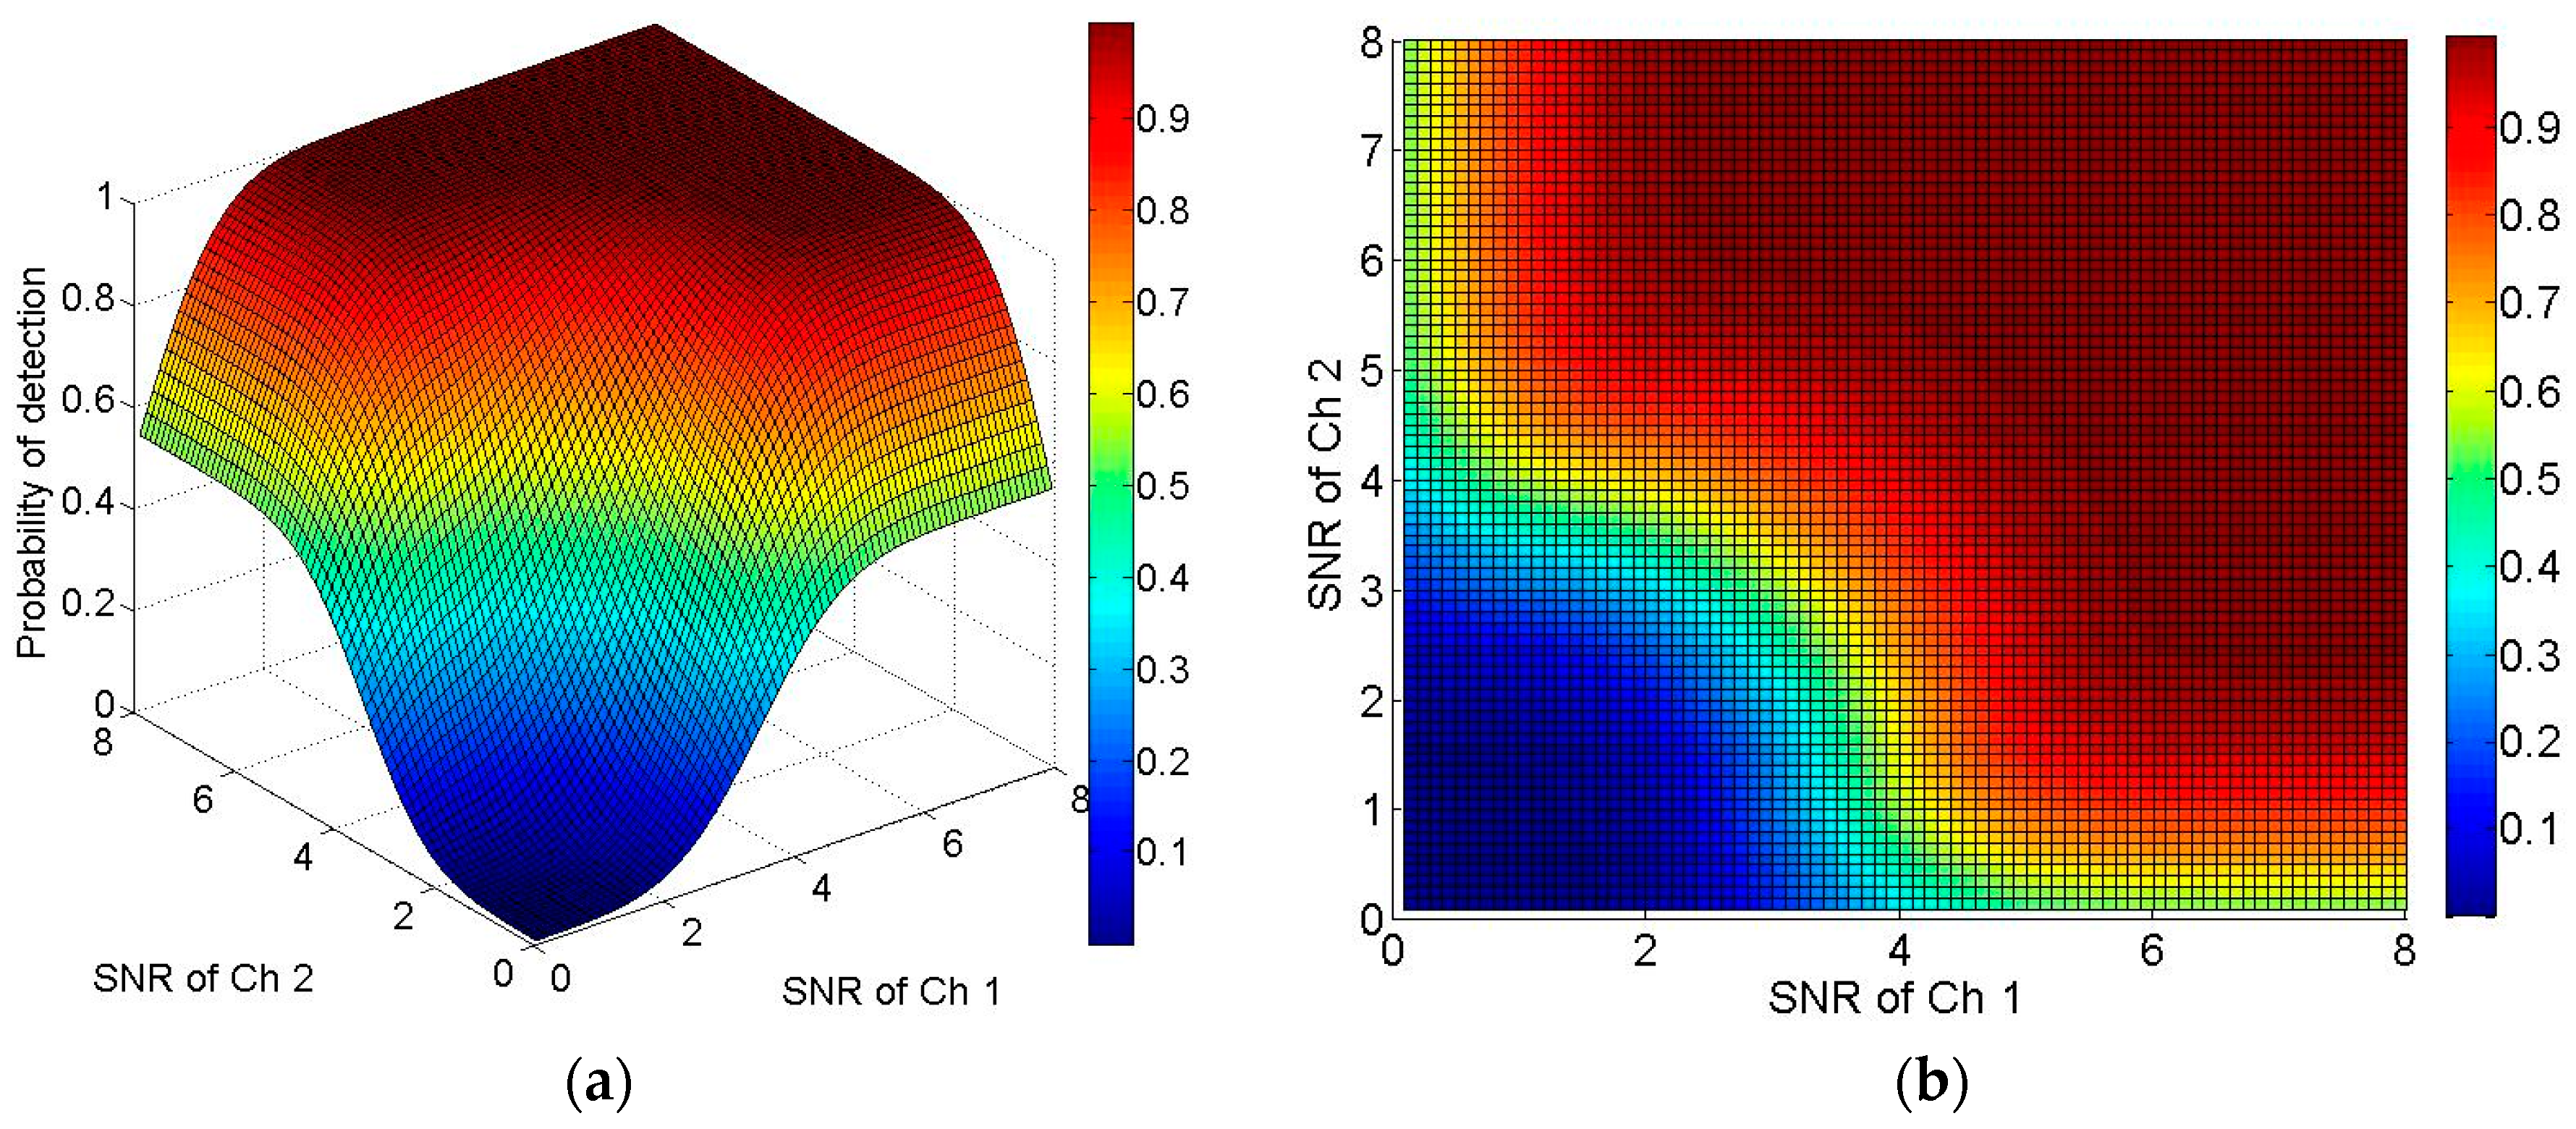
The same iterative method is also employed to simulate a more general and intuitive situation. When the SNRs of the two channels change simultaneously, the relation surfaces of the optimal fused probability of detection are altered, as shown in Figure 5. With the increase in the SNR of any channel, the optimal fused probability of detection becomes larger. The surface shows a symmetric distribution to the SNRs of the two channels, which is conformable to reality.
3. Point Target Detection
3.1. Omnidirectional Multiscale Morphological Filtering
The diffraction phenomenon occurs in the long-distance imaging process, so the point target may be regarded as an Airy spot [43] whose imaging size can be roughly represented as:
where is the imaging size of the Airy spot, and is the optical system parameter that is often set as 2, and is the wavelength of the incident light.
For the LWIR detector, the responsive wavelength is often assumed to be 9 μm, so the imaging size is 43.92 μm after calculation, which is larger than the common element size of the IR detector (common element size: 15 μm, 25 μm and 30 μm). For the MWIR detector, the responsive wavelength is assumed to be 4.4 μm, so the imaging size is approximately 21.47 μm.
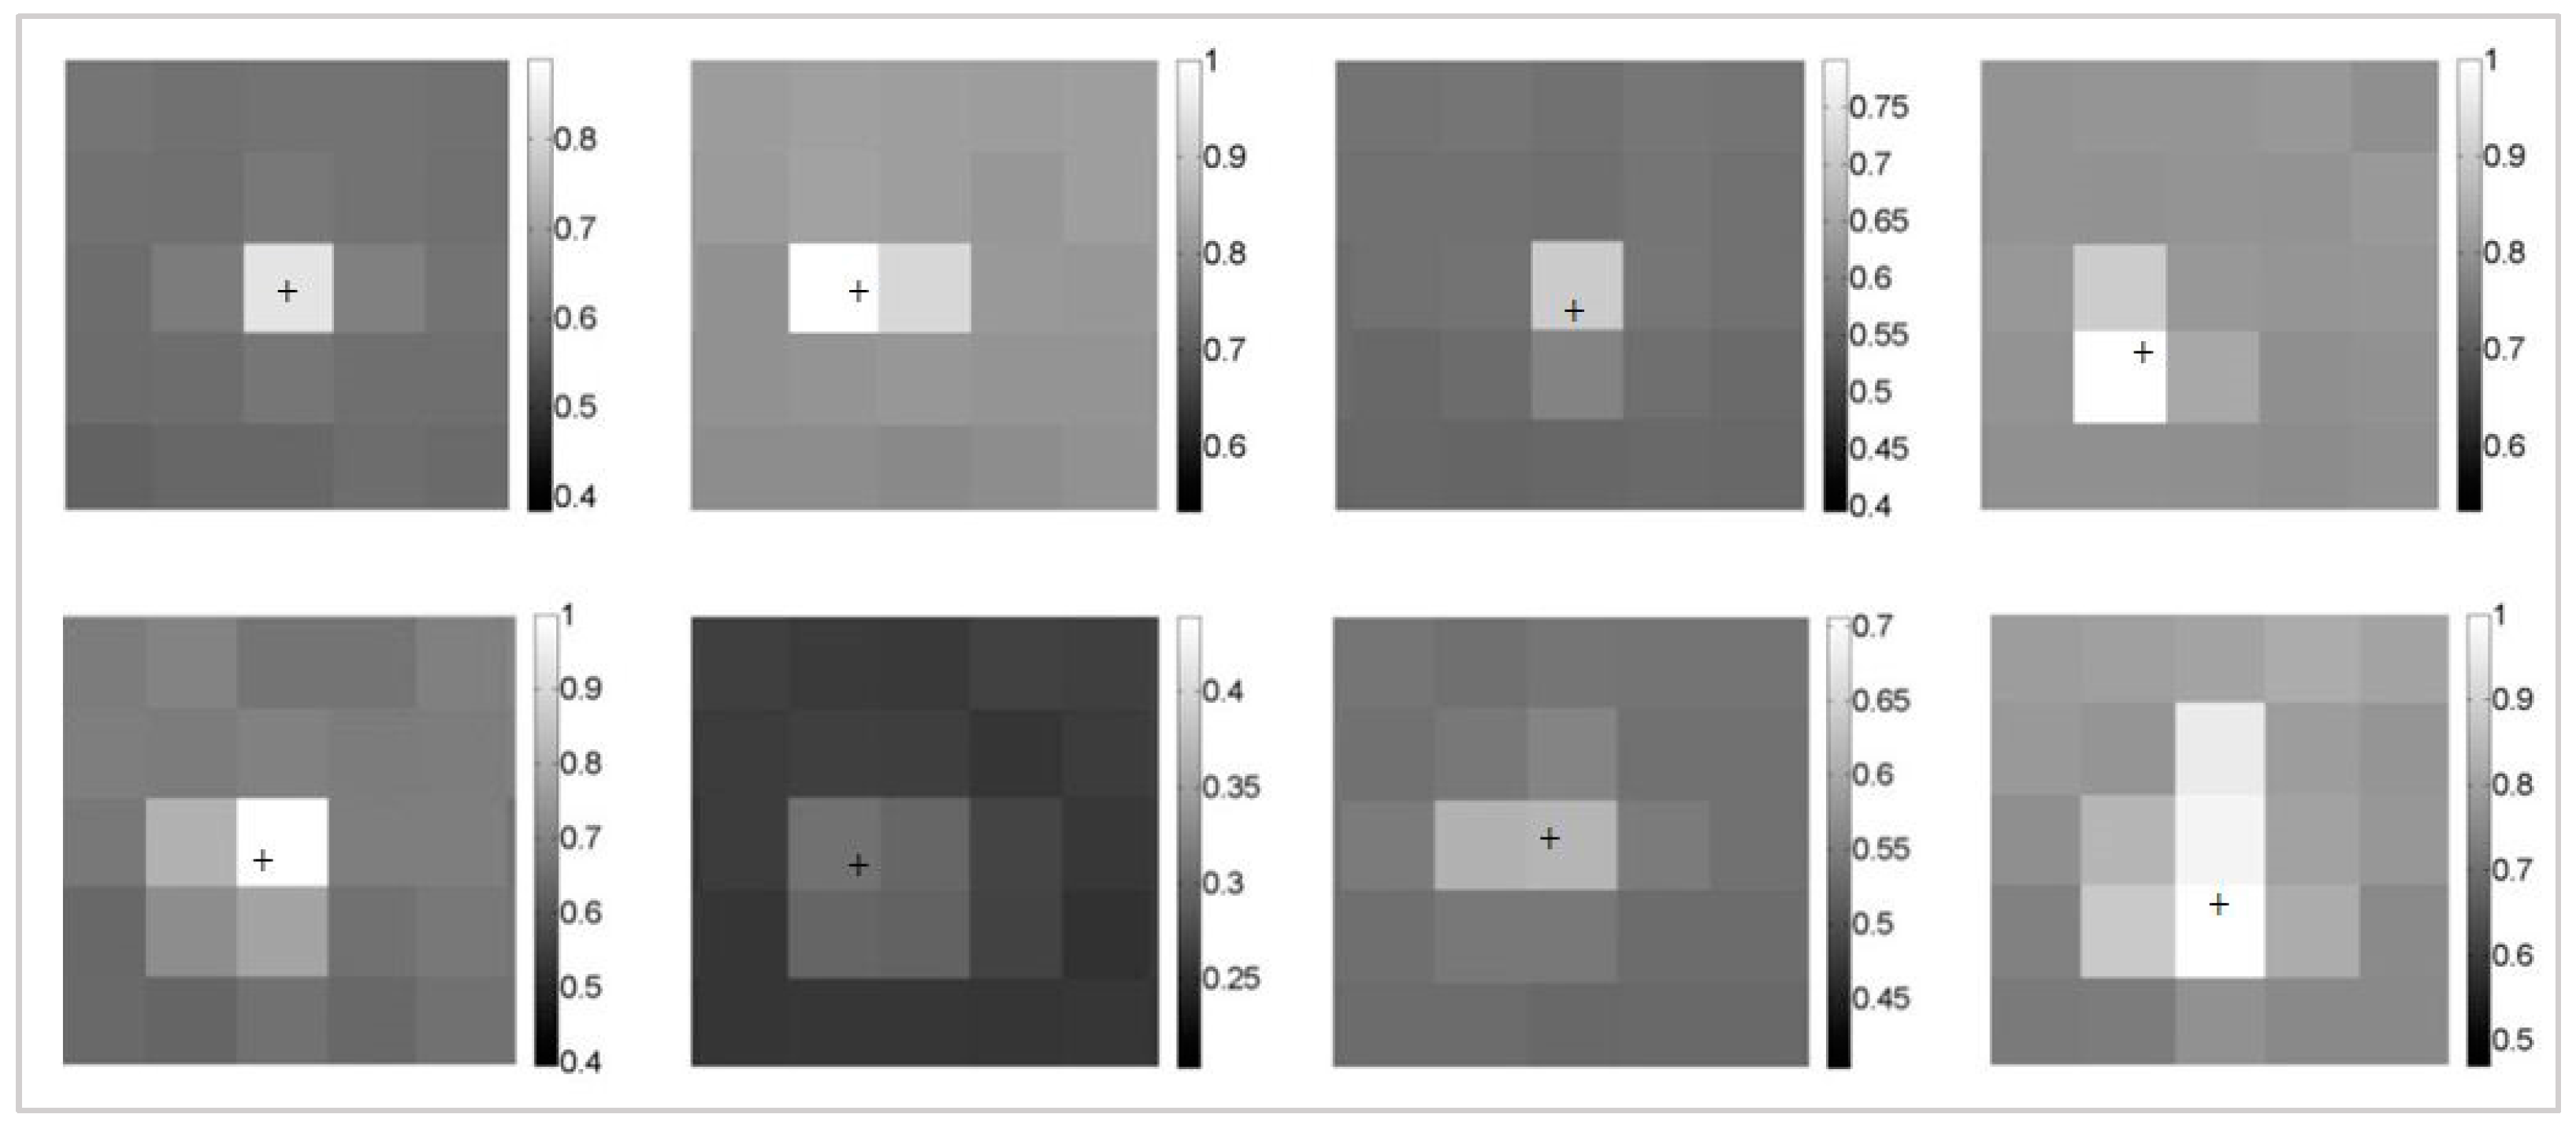
Figure 6 presents some typical point target images (the size of window is 5 × 5 pixels). The imaging size of the point target in motion changes from 1 to 3 × 3 pixels, and the morphological information changes with the imaging distance, attitude angle and imaging position on IRFPA. Also, the point target is more likely to occur in a complex background at various scales. Thus, the energy distribution of the point target is not necessarily isotropic, and the target detection algorithm based on the single and symmetric detection template leads to missed detection.
Morphological filtering has been widely adopted to extract the corresponding form in the image with a certain structural element to accomplish target recognition. The two basic operations in morphological filtering are dilation and erosion [44,45]. Let and represent the original image and structural element. The dilation and erosion of by are respectively defined as:
where represents the dilation operation, and represents the erosion operation.
The opening operation in morphological filtering can eliminate the region that is less than the structural element, and the closing operation can merge two regions that are very close in the distance, which are denoted by and as follows:
We use a structural element larger than the target to achieve an opening operation and obtain the background prediction image. Then, we subtract the background prediction image from the original image, which is referred to as the Top-hat transform [46]. The Top-hat transform can extract bright details from the image, which may contain point targets. The definition of Top-hat is as follows:
where is the resulting image of the Top-hat transform.
The bright details extracted by the Top-hat transform generally show the larger gray values, while the dark details show smaller gray values, most of which are negative values after the Top-hat transform. To avoid this undesirable result, the traditional Top-hat transform is modified as follows:
The traditional Top-hat transform method only adopts a single structural element to estimate the background of the infrared image, which ignores differences in point target distribution in every direction. In this paper, we employ the multiscale Top-hat transform, which is defined as follows:
where represents different structural elements, and represents the resulting image of the Top-hat transform by .
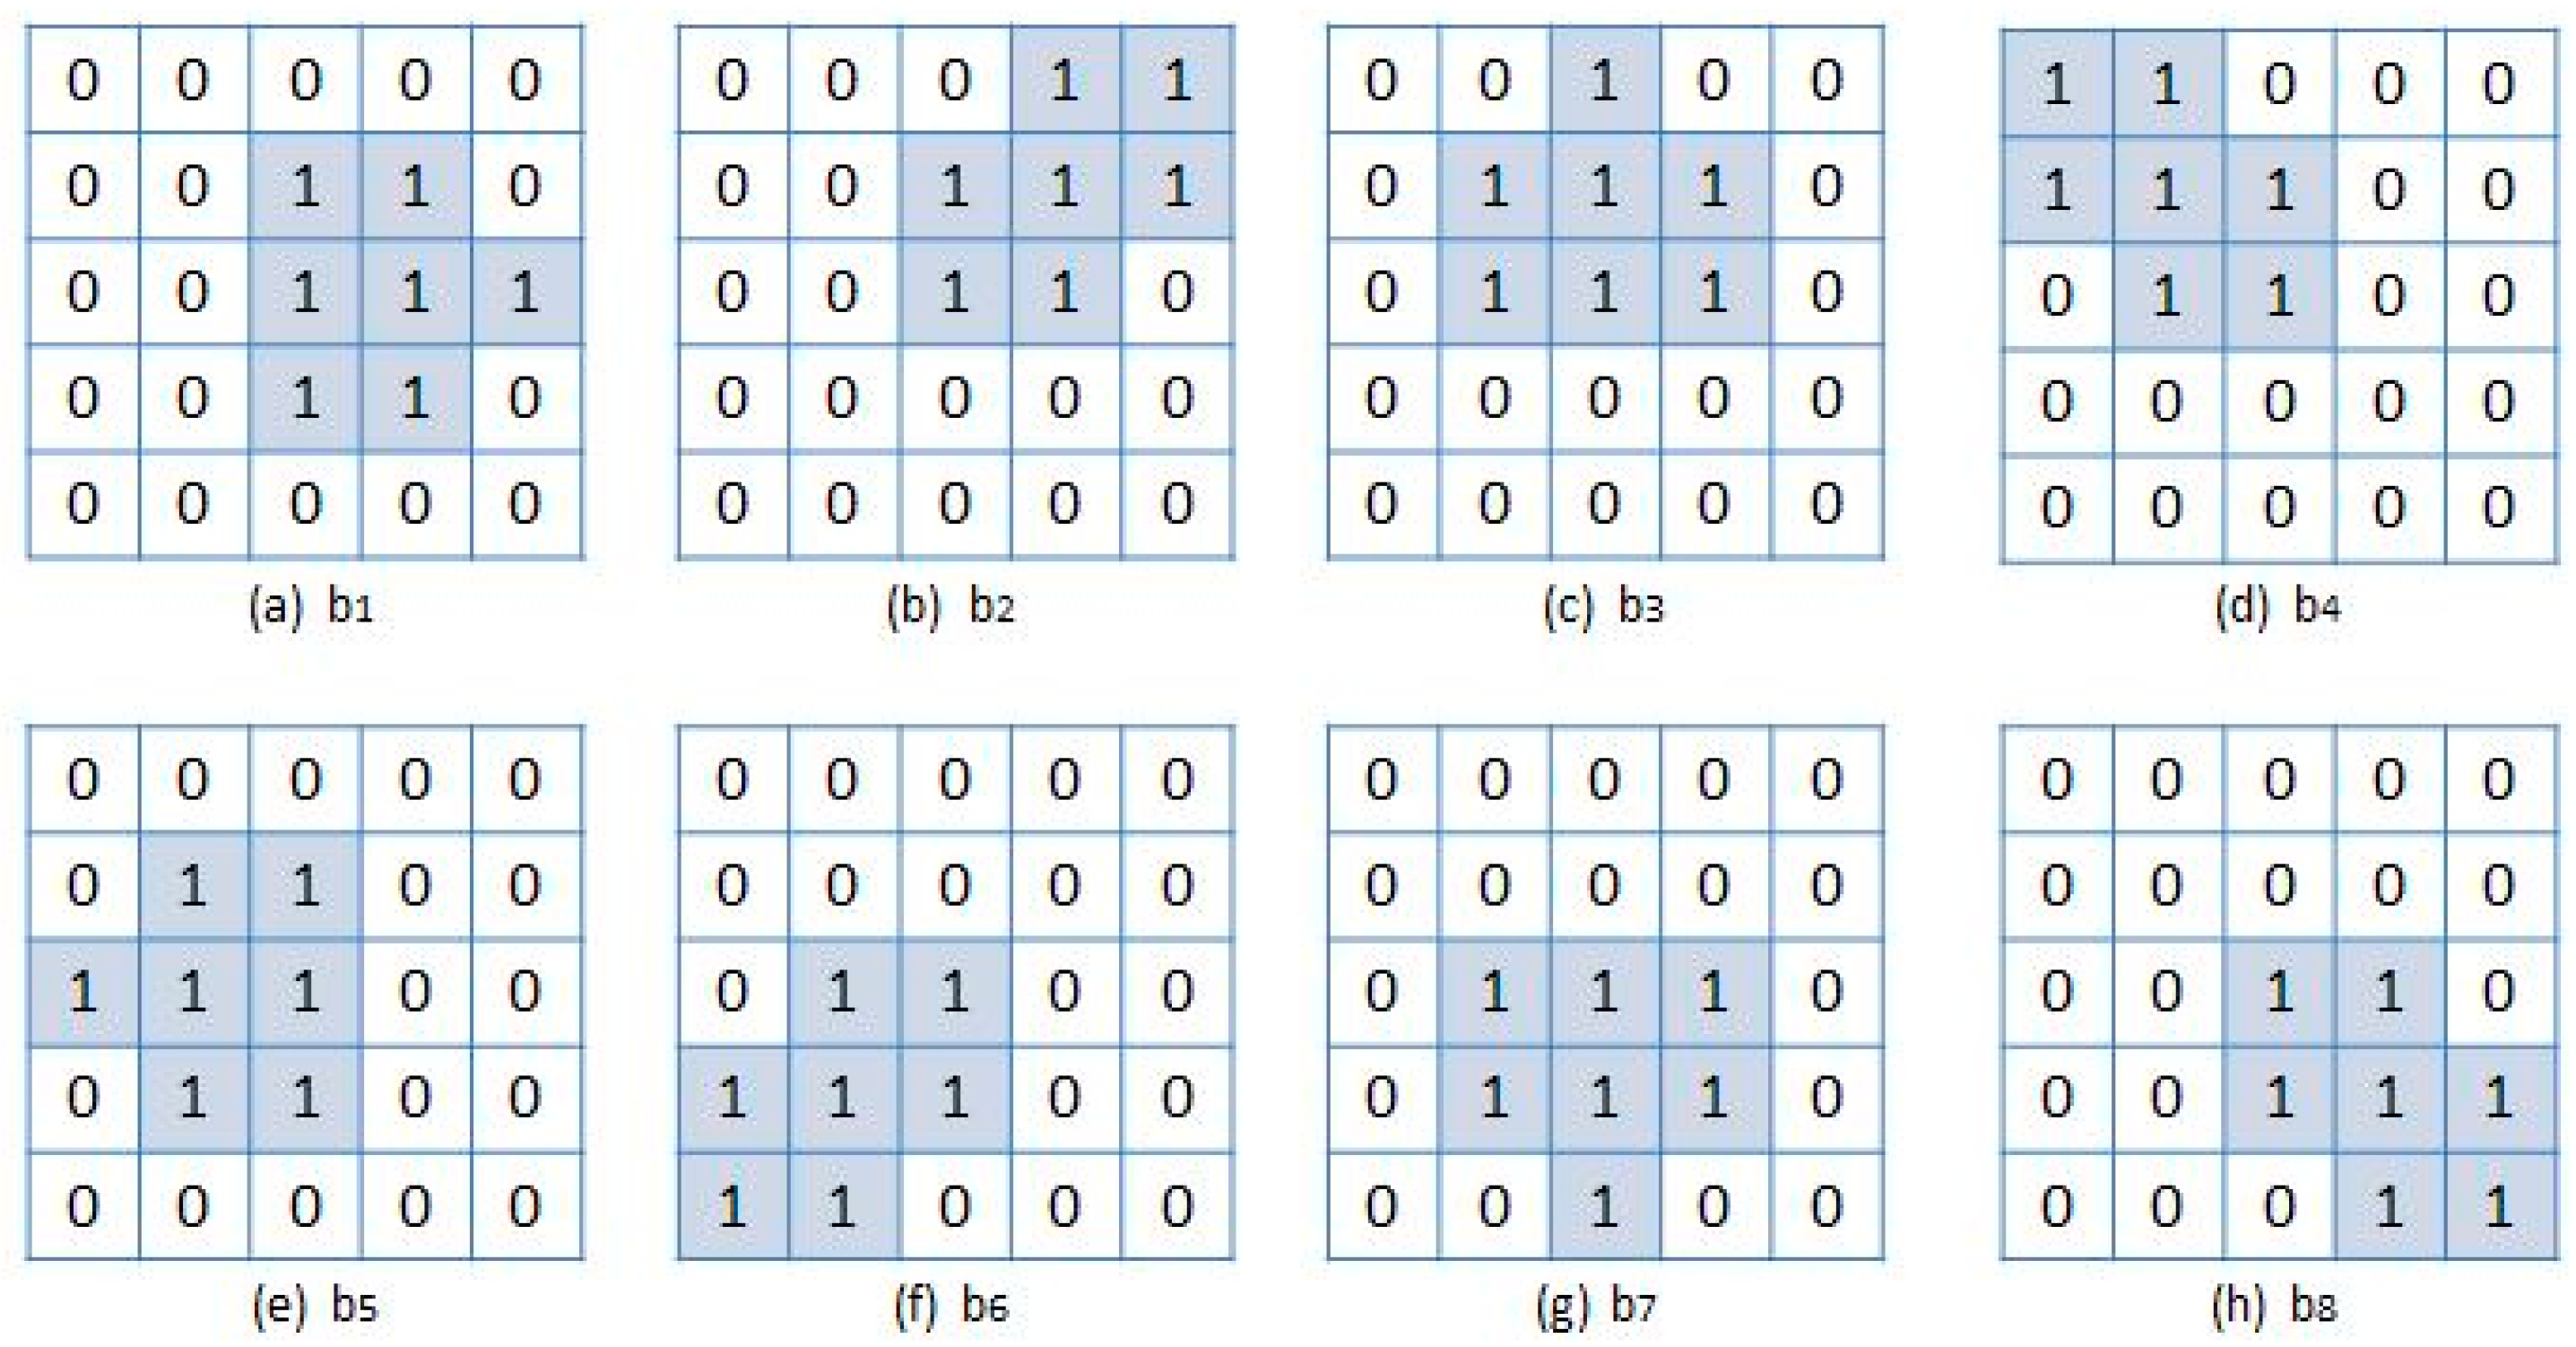
We introduce the eight omnidirectional multiscale structural elements with the size of 5 × 5 dimensions which designed in our previous work [3] to extract the point target distribution in every direction as far as possible. Moreover, the morphological structural elements with specific directions can effectively eliminate non-directional and continuous background. The omnidirectional structural elements (n = 1, 2,…, 8) contain 0° direction, 45° direction, 90° direction, …, and 315° direction as shown in Figure 7.
The operator “1” in each structural element represents that the dilation or erosion operation is performed in its position, and a distribution direction of “1” is similar to the morphological direction of the point target. Each structural element not only can extract the point targets that are distributed in the specified direction but can also highlight the candidate points at smaller scales than the structural element in the image, thus avoiding omission.
The omnidirectional bright suspected target regions to are computed for each element. Any of may contain suspected point targets distributing in the detection direction, so the real ROI should be the combination of the extracted bright suspected target regions in every direction. The gray values of the bright suspected target regions extracted by the Top-hat transform are usually larger than those of other regions. Therefore, the ROI should be the maximum gray value of each pixel extracted in every direction, which is expressed as:
3.2. Local Difference Criterion
Most of the background clutter in the image can be suppressed well by the above omnidirectional Top-hat algorithm, but some strong undulant background edges may remain. The local difference criterion is proposed in the following to remove the residual high-frequency background edges.
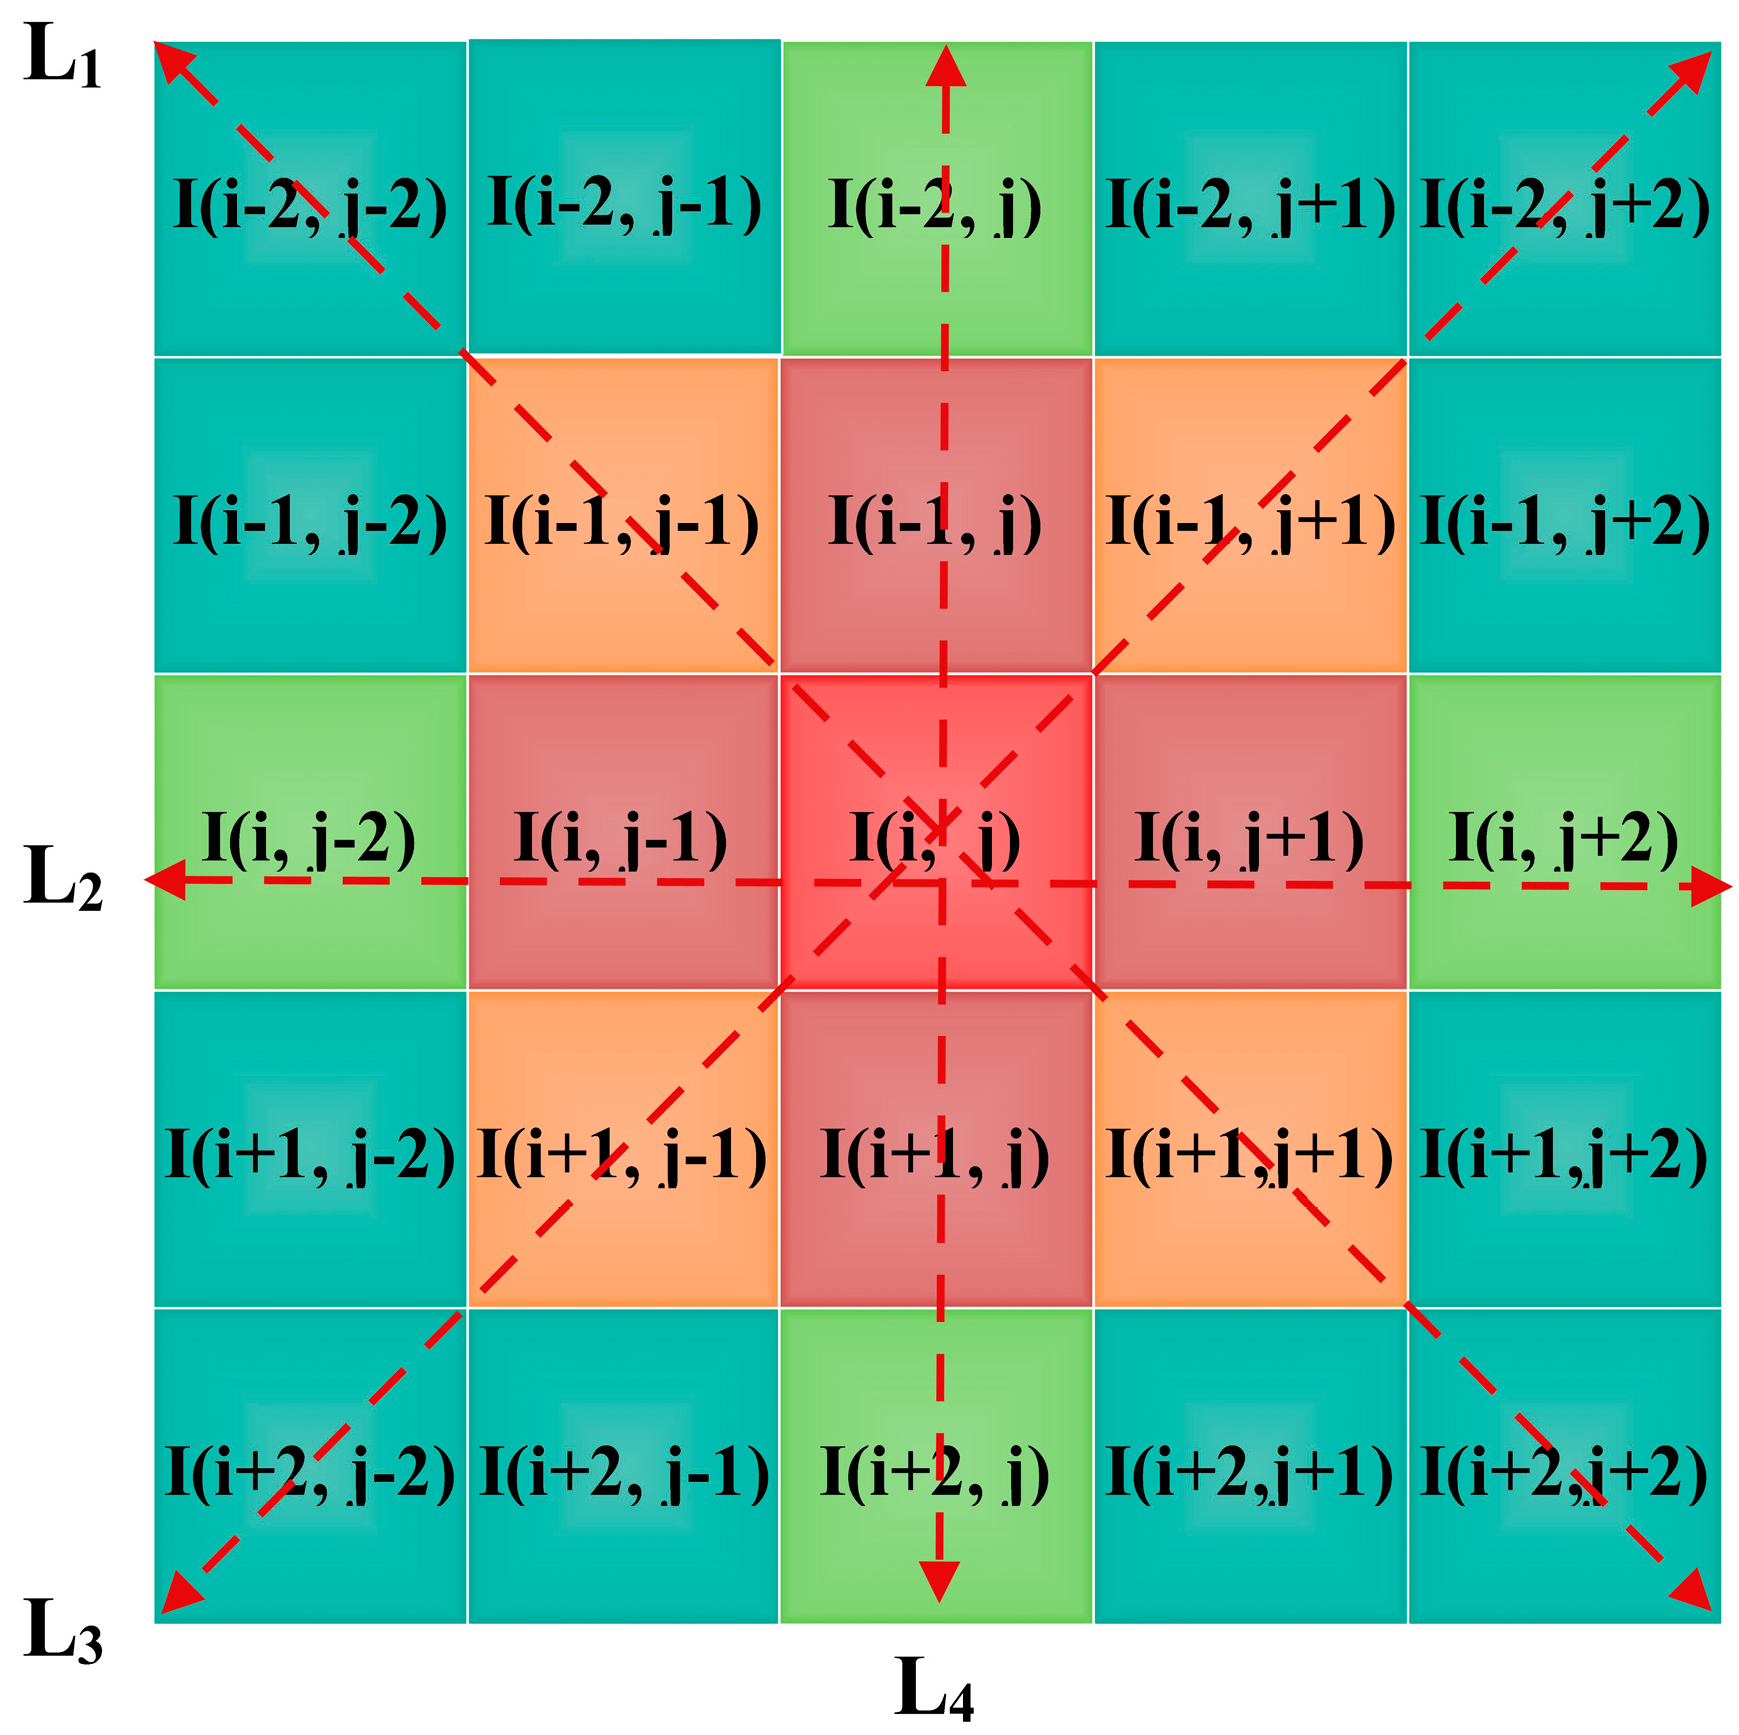
We suppose one of the suspected targets is , and then the four direction vectors (m = 1, 2, 3, 4) are defined in the local neighborhood window centered at as shown in Equation (19). Each direction vector contains four points on both sides of , illustrated in Figure 8. The point target and the residual background edges are further distinguished by the relationship between the four direction vectors.
Then, the sum of the differences in gray values between and is calculated as follows:
where is the weighted kernel to describe the absolute difference between and . is the sum of the differences in gray values of . The smaller of , the closer gray values of is to that of . According to the prior knowledge that the gray values of the four-neighbor pixels are the closest to that of the center pixel, we assign the larger weight 5/2 to them, and we let weight equal 2 with respect to the second closest pixels. In addition, we assign the smallest weight 1 to the four far points whose coordinates and are both ±2. The weights of and are the same, and the weights of and are also the same because of the same position relationship with each other. , , and are combined into a large column vector , and the weighted kernel corresponding to the elements of are obtained as follows:
We introduce a new variable named the Direction Ratio (DR) to distinguish the residual background edges from the point targets, which is calculated as the maximum of divided by its minimum, as shown in the following:
The following two cases regarding DR are discussed:
- When it is a background edge pixel, there exist at least one very small and one very large because of the differences in the four directions of the background edge. Together, they give rise to a large DR.
- When it is a point target, all four direction differences in gray value are similar due to the isolated characteristics of the spatial distribution of the point target. Hence, the DR of a point target is approximately 1.
Considering the difference in the DR value between the background edges and the point targets, we can establish a local difference criterion to eliminate the residual background edges by setting a threshold of DR that is slightly larger than 1. To visually display the experimental results, the threshold of DR is set to 1.5 in this paper. Thus, the local difference criterion is obtained as follows:
3.3. Adaptive CFAR Threshold under Dual-Band Model
The rest of the false alarms are mostly random distributed noise and a small amount of fixed noise, which can be eliminated easily through the interframe relation. For random distributed noise images, the CFAR dual-band model proposed in Section 2.2 can be employed to calculate the TNRs of the two channels. The probability of false alarm is also assumed to be 10−4, and the minimum SNR of the to-be-detected point target is 1.5. The initial values of TNR1, TNR2 are both 2.326 by iterating Equations (8) and (9). From the definitions of TNR1 and TNR2, the thresholds , that acted on the candidate target images of two channels are calculated as follows:
In binary image theory, we address the two candidate target images by and . If the complexity of the background clutter in target image is different, the gray mean and STD of the image are also different. Therefore, and change with the change in background clutter, which have the feature of self-adaptability.
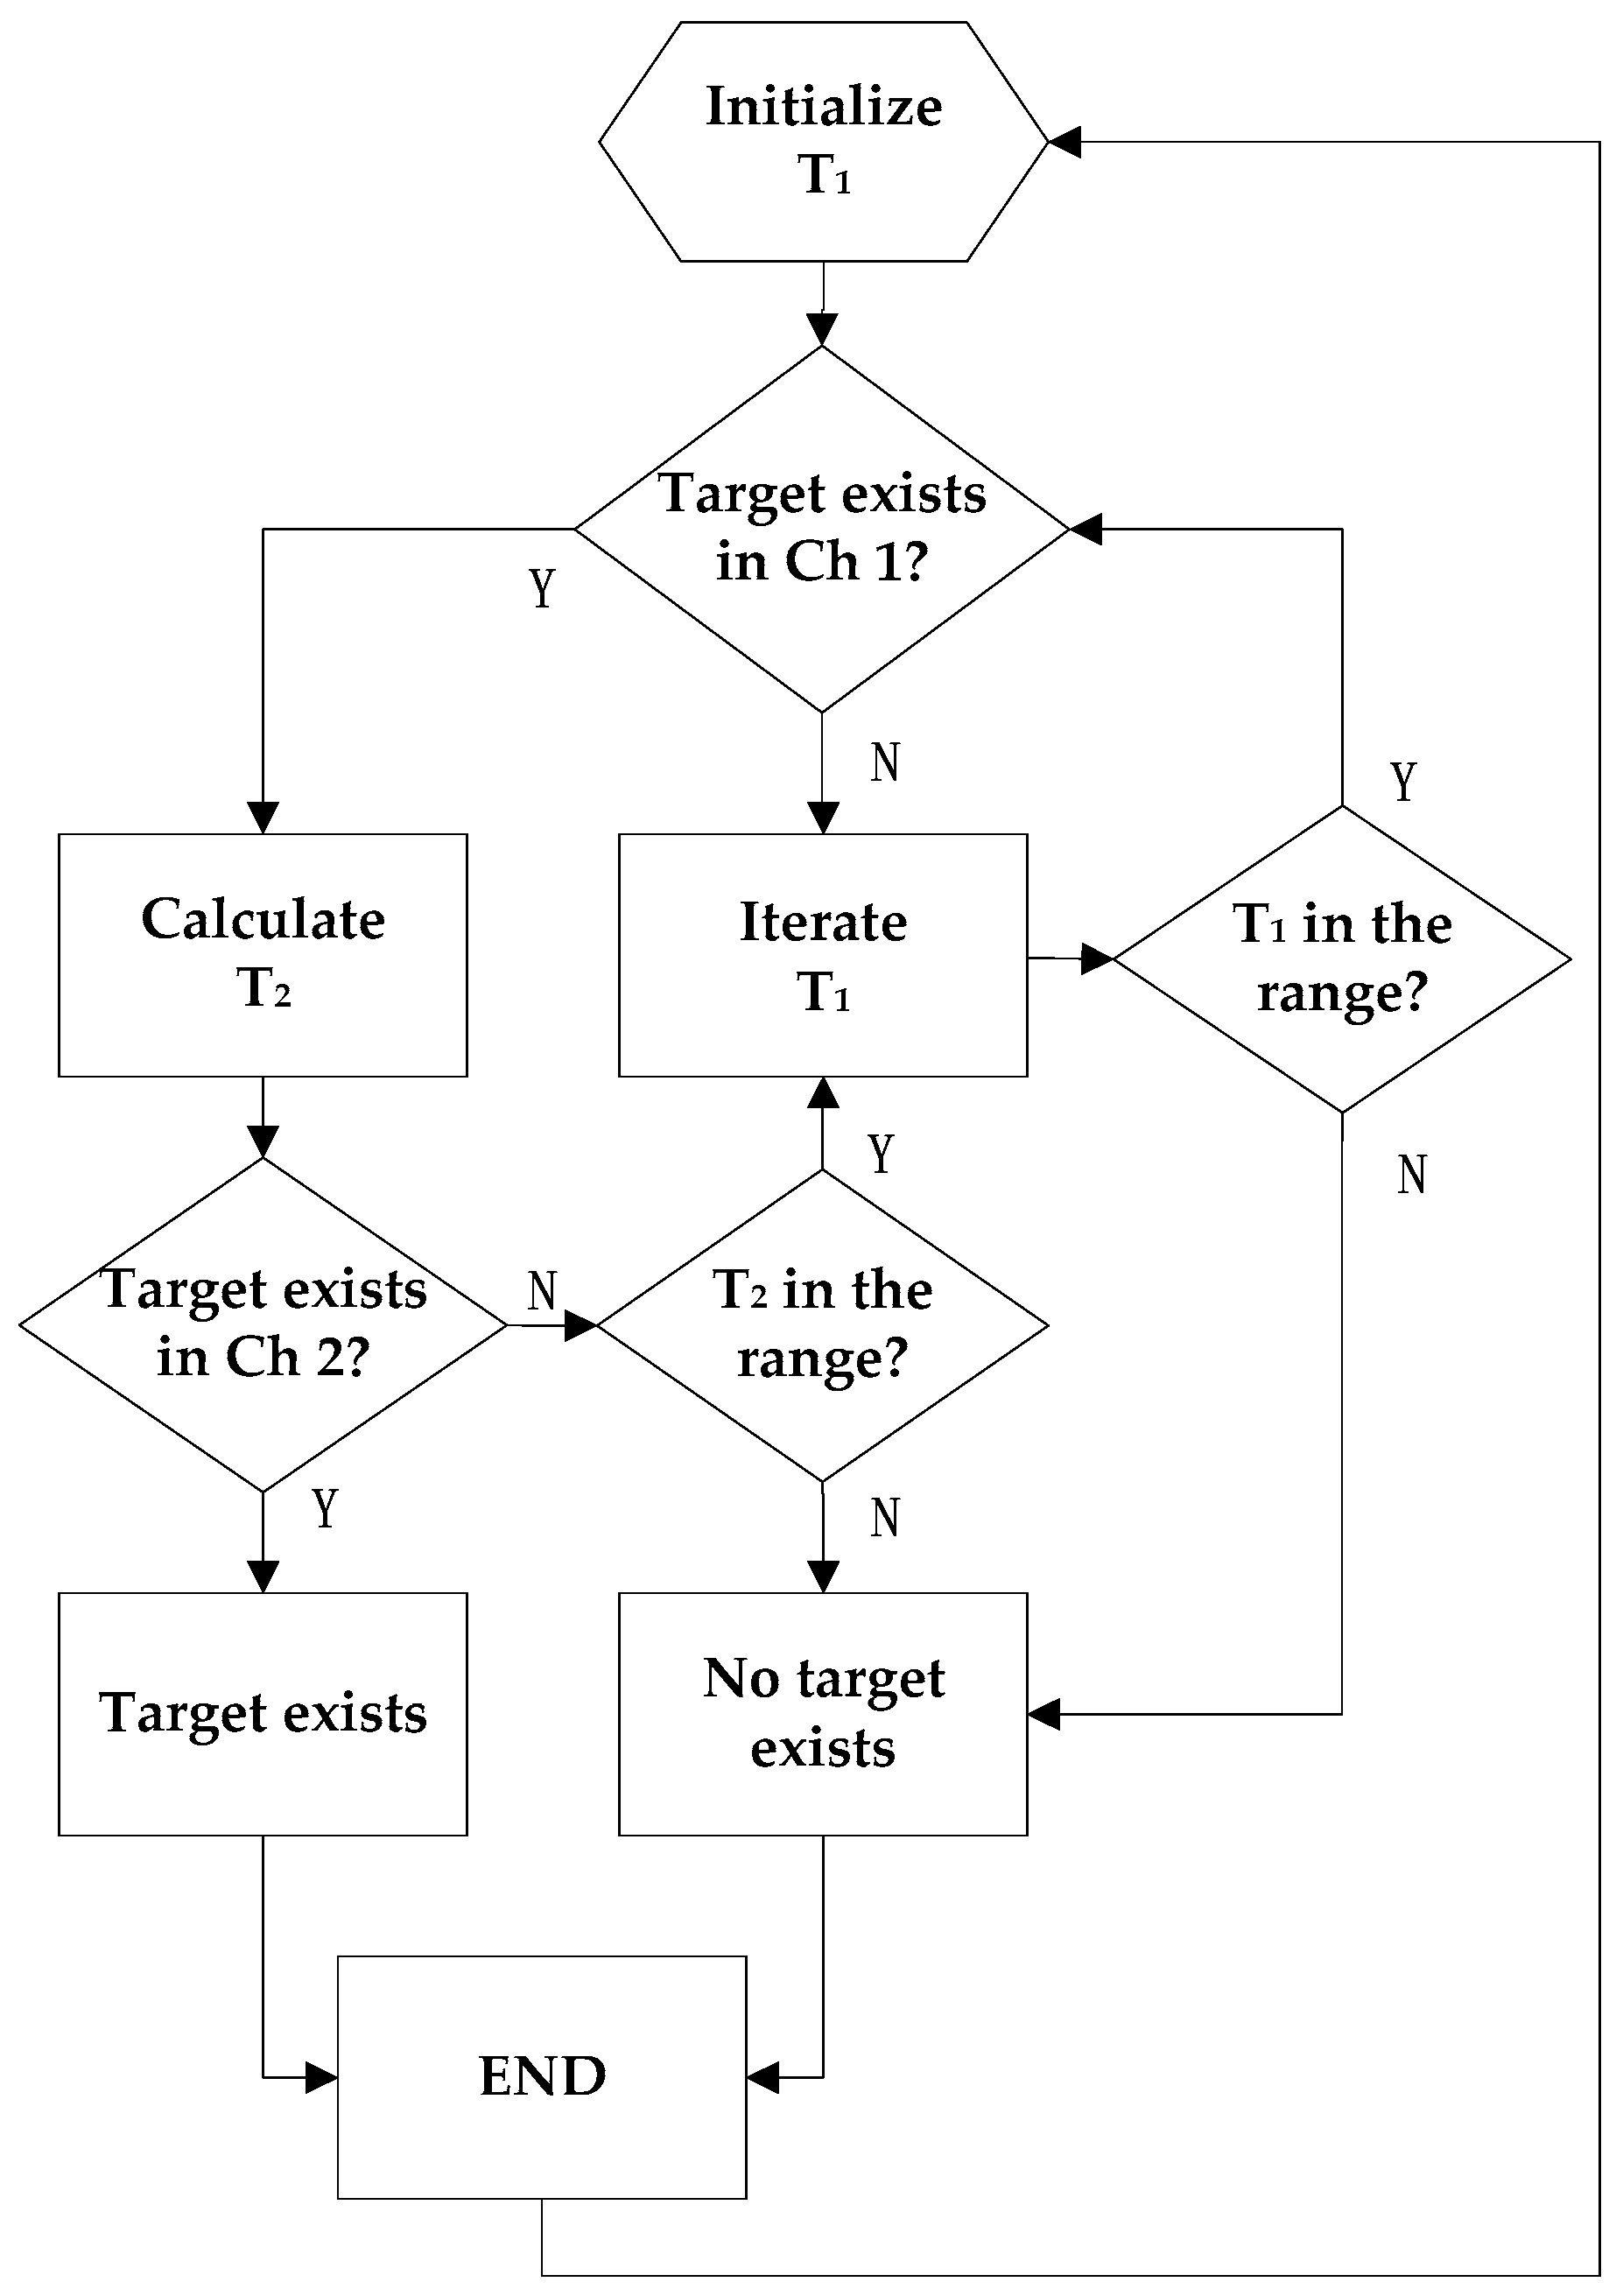
The dual-band point target detection algorithm is summarized as follows:
- (1)
- The omnidirectional morphological filtering and the local difference criterion are employed to suppress the complex background for the original infrared images captured by the dual-band detectors.
- (2)
- Initialize TNR1 of Channel 1 (TNR1 = 2.326) according to the CFAR criterion.
- (3)
- TNR2 of Channel 2 is calculated by Equation (8), and the threshold is obtained from Equation (24).
- (4)
- The threshold calculated by Equation (24) is used to segment the image of the Channel 1 after background suppression.
- (5)
- Judge whether there is a suspected target in Channel 1; if any, perform the following steps; if not, decrease TNR1 (0.2 per time), and return to Step (3) until out of range (assuming 1.5). If TNR1 is out of range, it will announce the end of the iteration, and judge the next frame.
- (6)
- The threshold is employed to segment the image of Channel 2 after background suppression.
- (7)
- Judge whether there is a suspicious target in Channel 2, if any, and if the coordinate position of the target coincides with the suspected target in Channel 1, typically within 5 × 5 pixels, it is declared a point target; if not, increase TNR1 (0.2 per time), and return to Step (3).
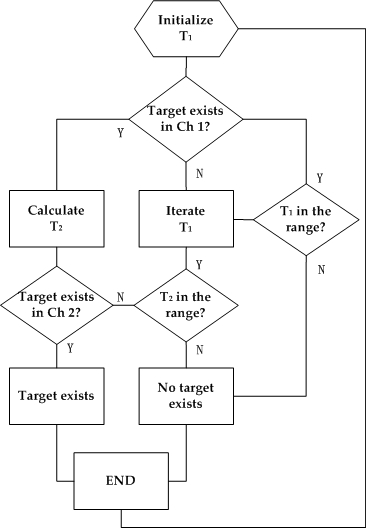
The flow chart of the fusion decision of dual-band thresholds is shown in Figure 9. Since the thresholds , have a one-to-one correspondence with TNR1 and TNR2, only and are used in the figure for simplicity.
4. Experimental Results
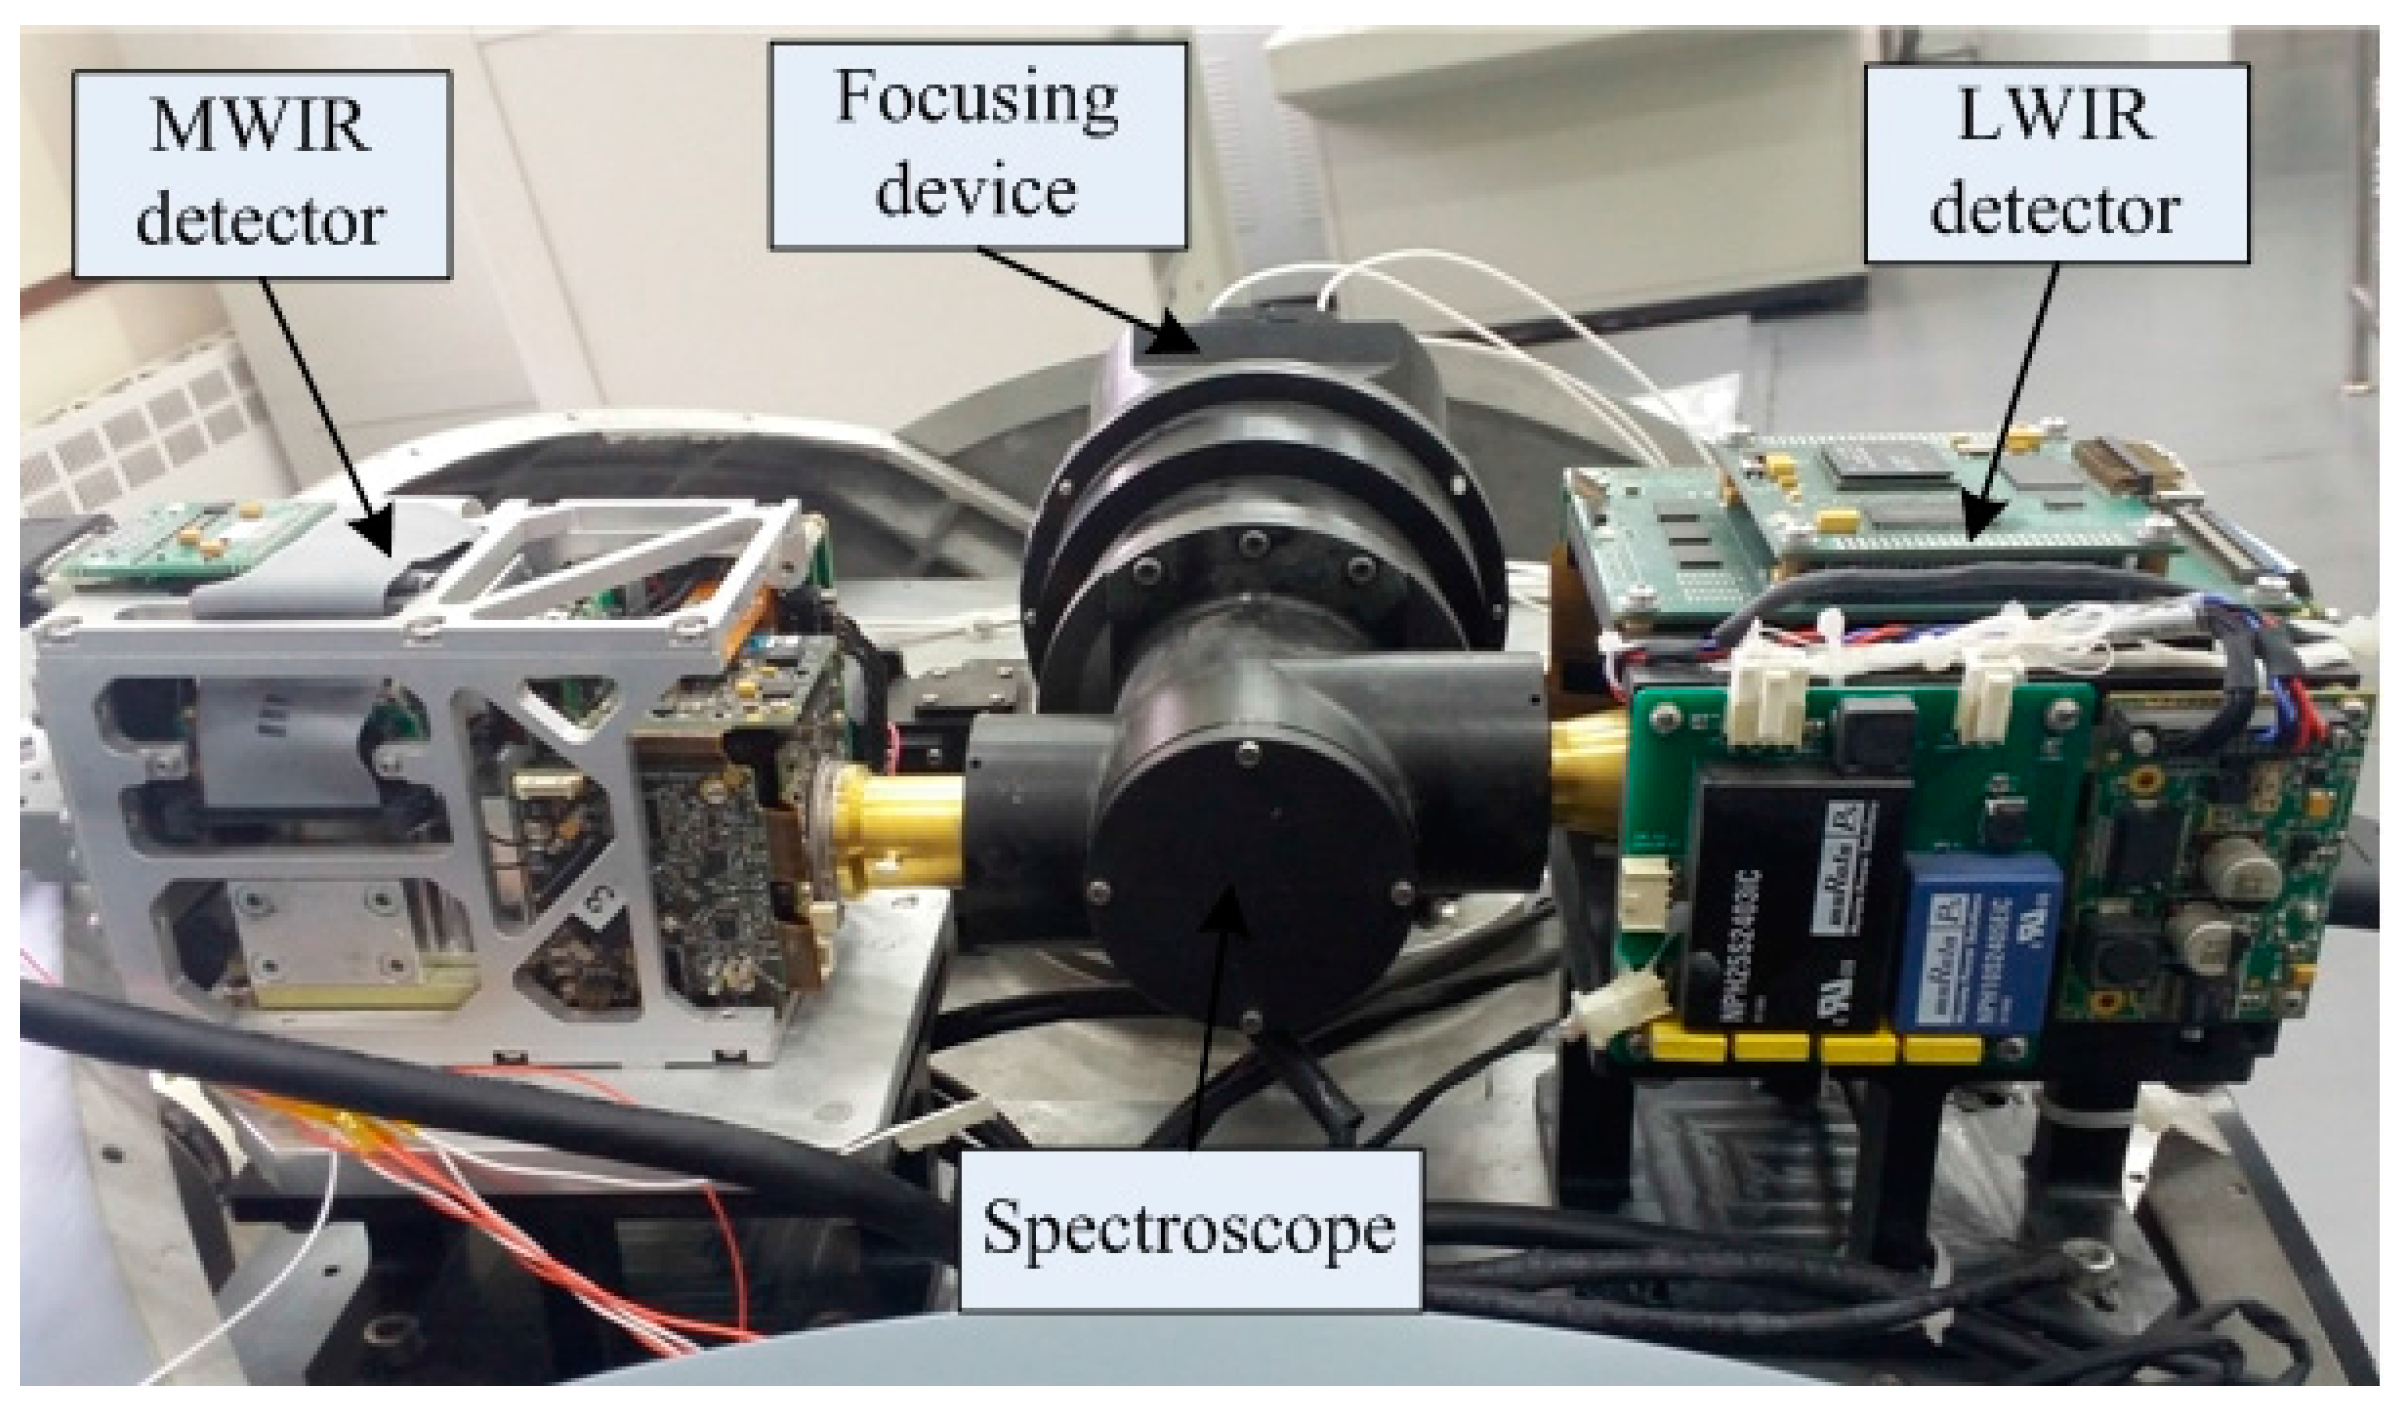
To obtain reliable image resources and verify the effectiveness of the proposed algorithm, Stirling cooled infrared dual-band equipment is set up to capture the aircrafts at long distances, as illustrated in Figure 10. The servo-control system adopts the working mode of horizontal sweep. The light that is focused by the lens is divided into two paths by the spectroscope, which are incident on the infrared dual-band detectors. The ADS-B global navigation system is also employed to monitor civil aviation flight information within 300 km, including the speed, latitude, longitude, and altitude of the aircraft, which are very useful for predicting the trends of the targets.
Many experiments were performed to evaluate the performance of the proposed algorithm. The MWIR and LWIR experimental images captured by the above equipment are 14-bit gray-scale. The full frame frequency is 100 fps, and each image is of size 512 × 640. The typical infrared scenes with the point target including the building and the cloud background are displayed in the following.
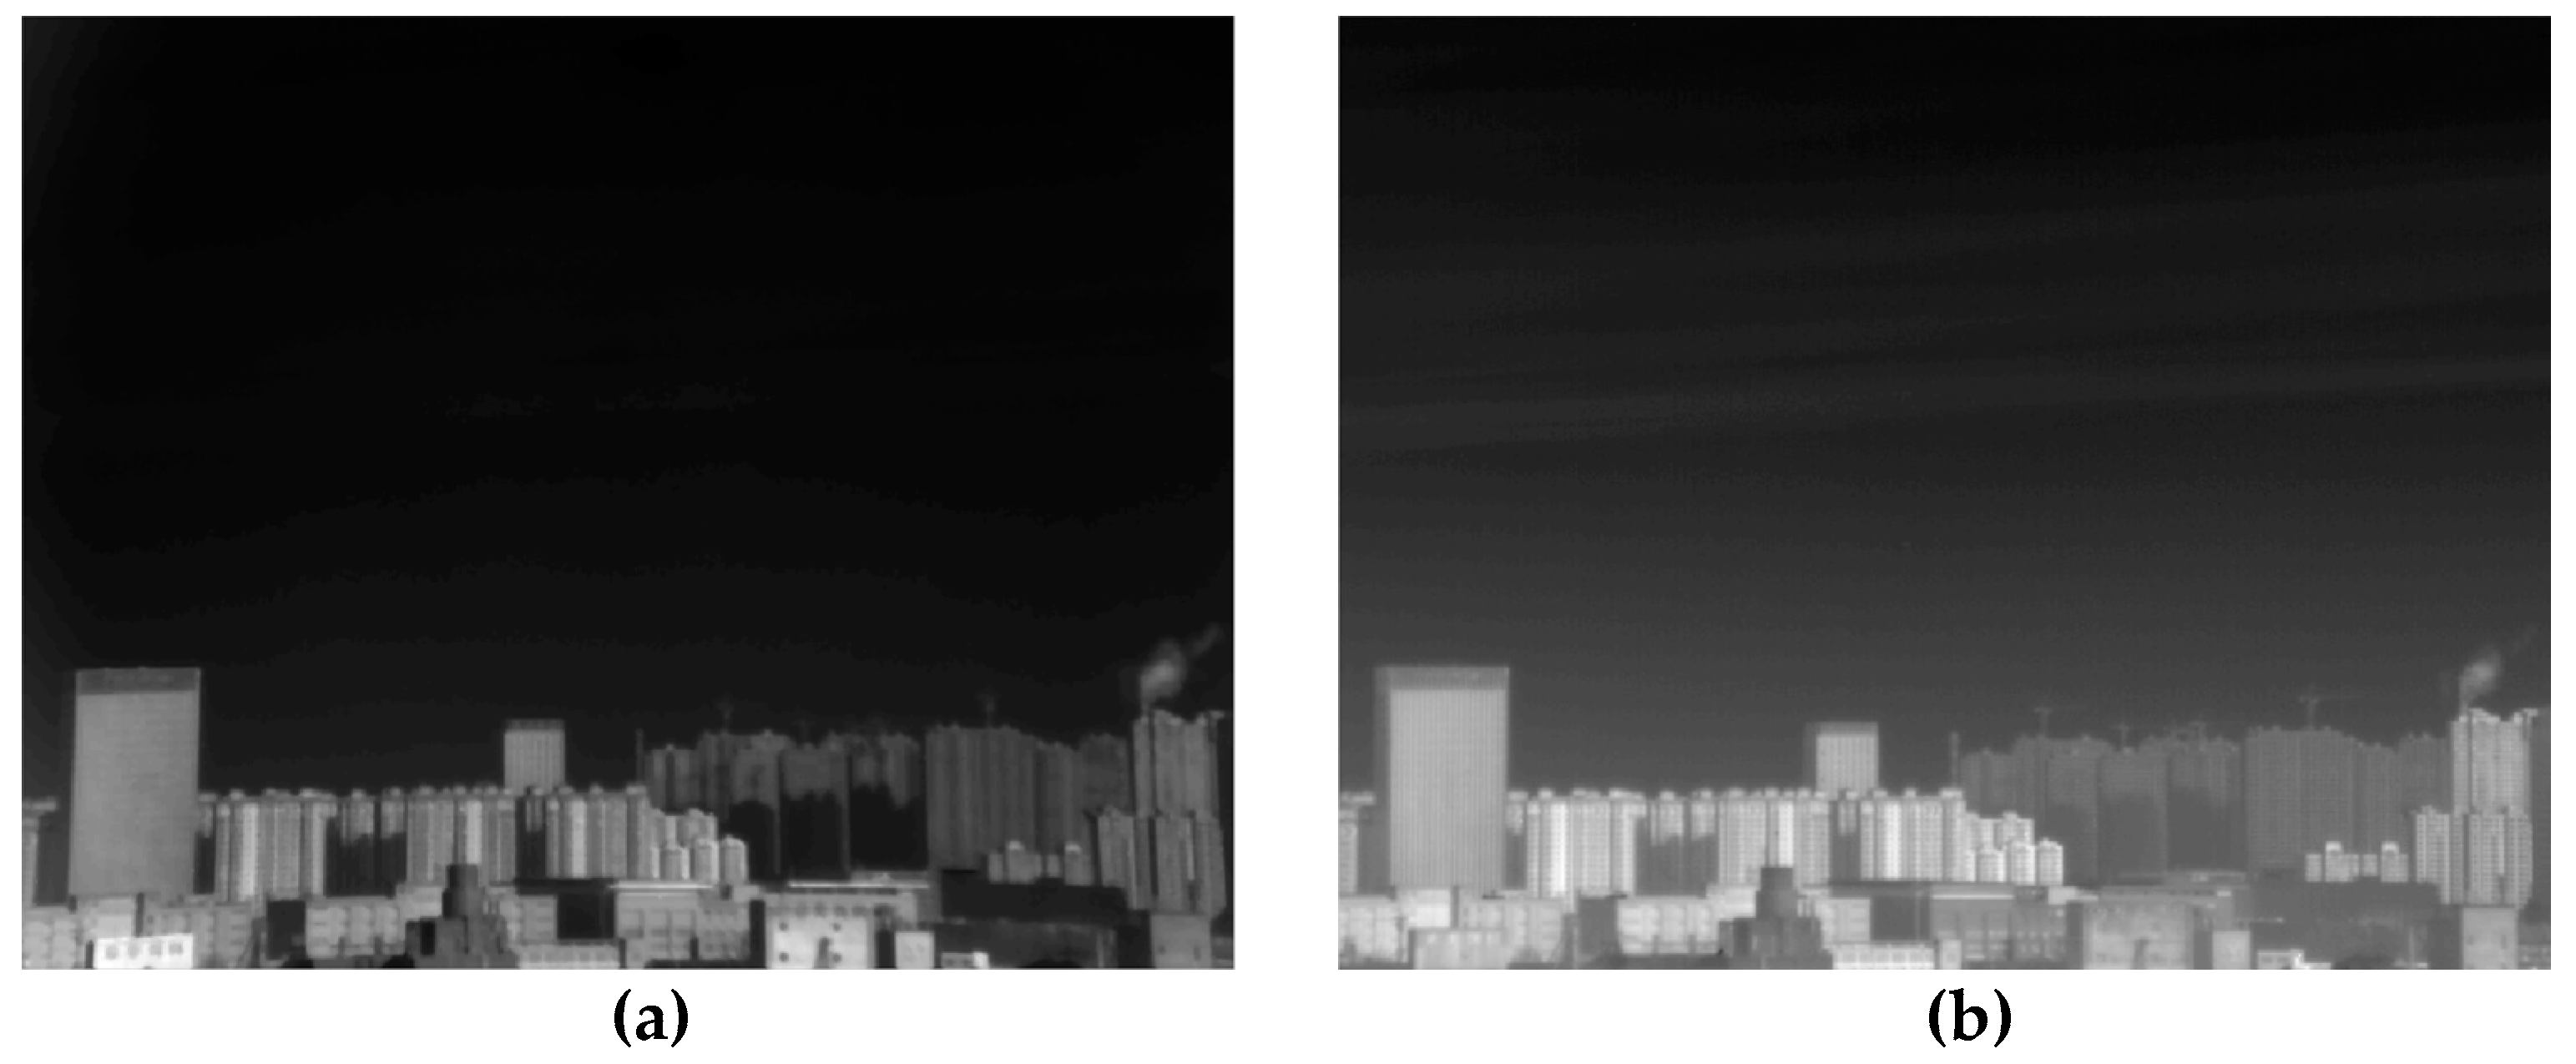
The first common scene is the point target flying against the complex building and sky background, as shown in Figure 11. The proper affine transformation, which can describe rotation, scale, and translation of images, has been performed to register the MW and LW images further. The gray level distributions of the sky background in both two images are inhomogeneous. Additionally, the dim point target is lack of texture and shape information, which is overwhelmed in the background.
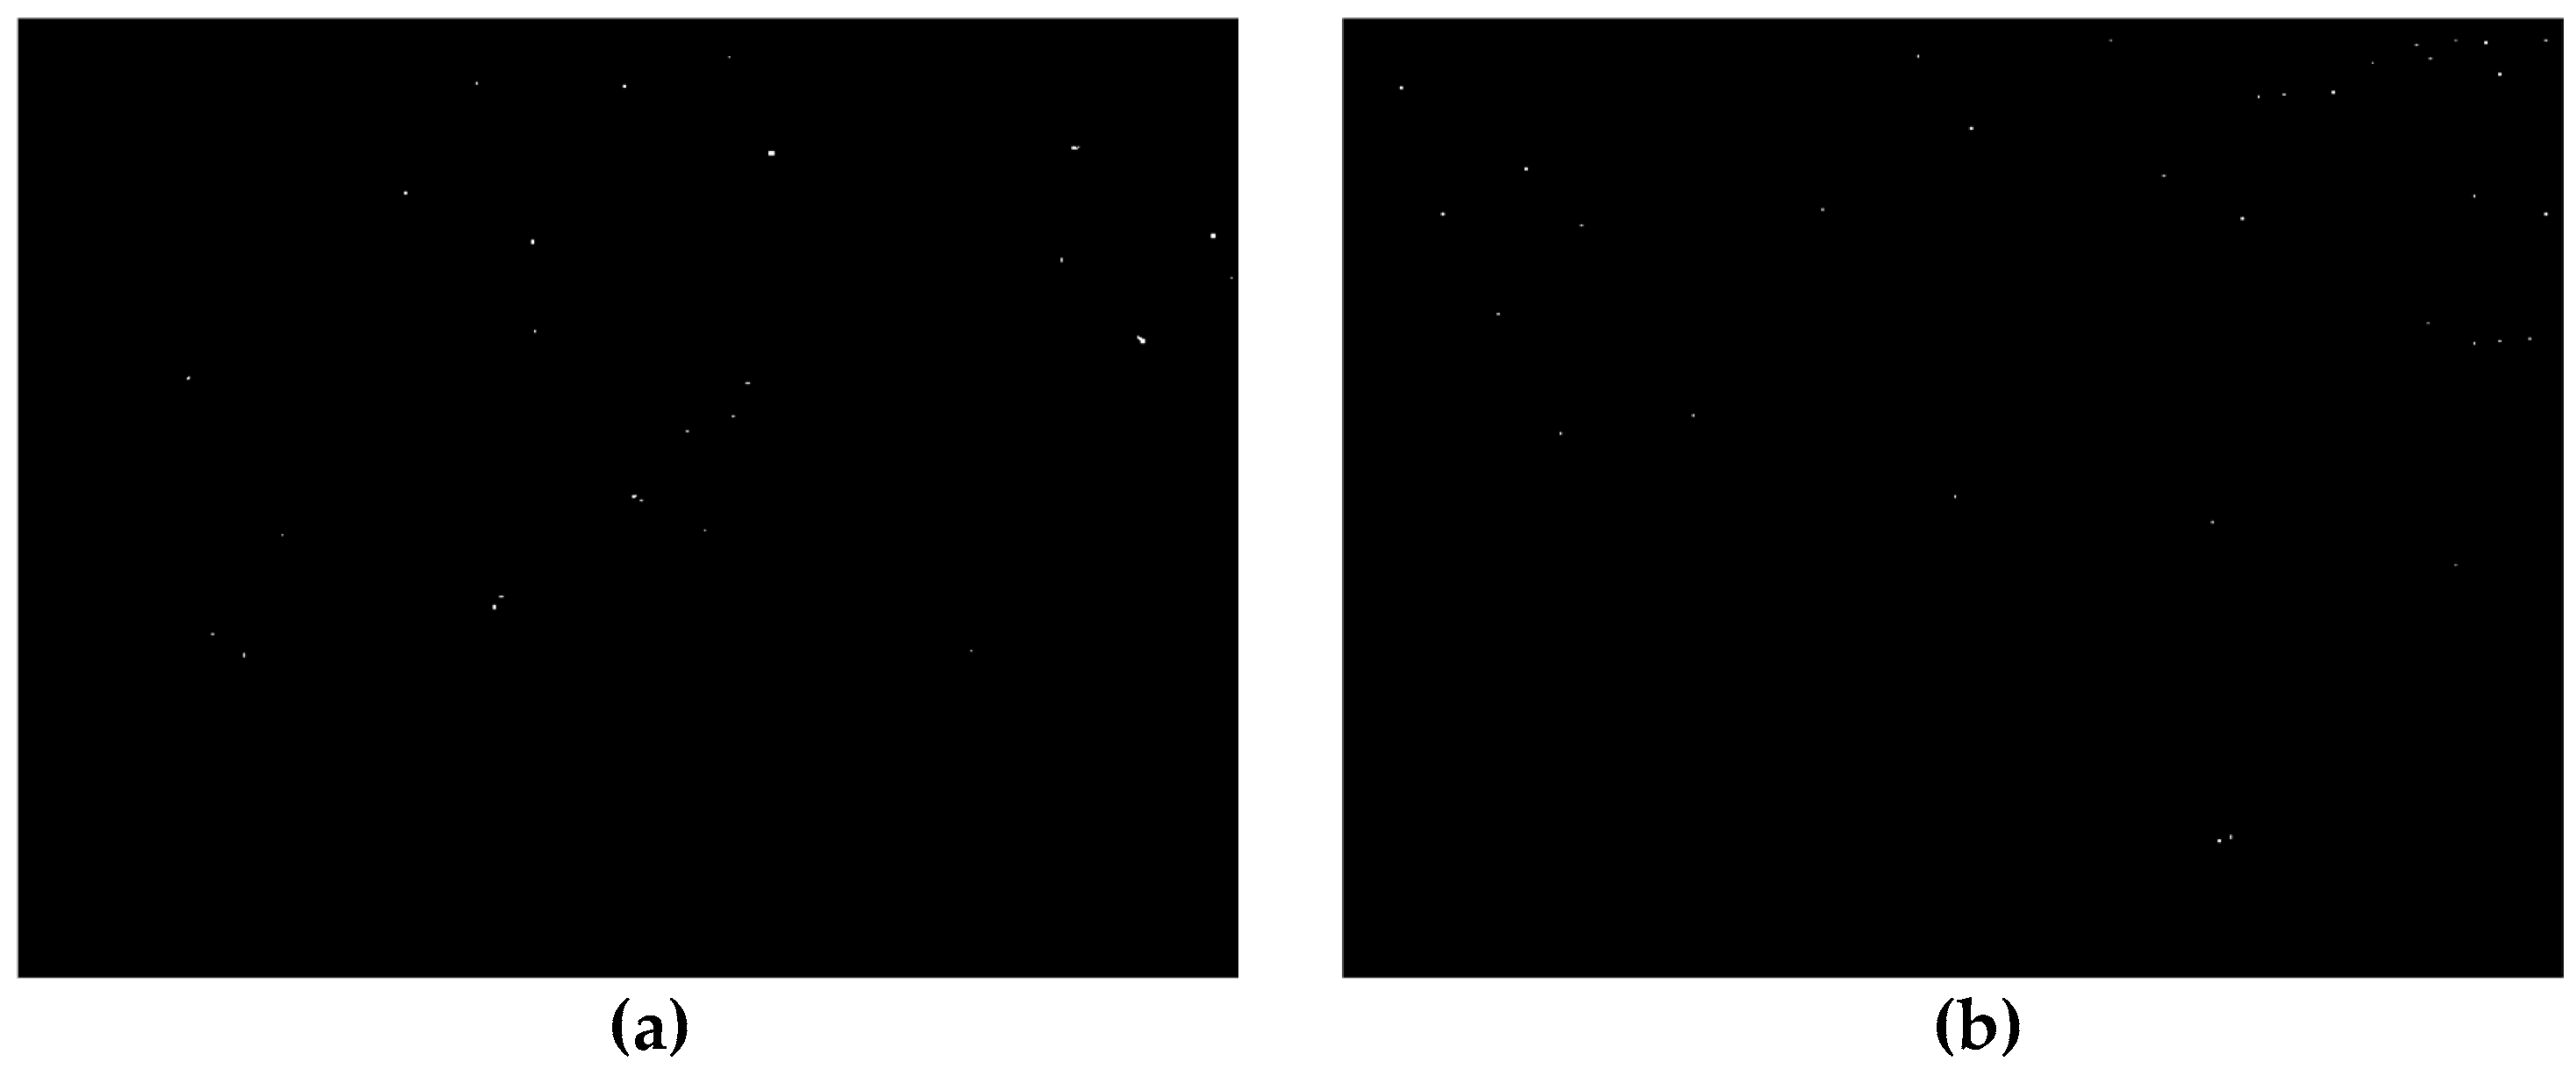
After image registration, the omnidirectional morphological filtering and local difference criterion proposed above are applied to the dual-band images to suppress the complex building background. Figure 12 illustrates the results of the background suppression algorithm of the MWIR and LWIR images, respectively, and binary processing has been performed. As seen, nearly all the building background has been eliminated, but there are still many residual candidate points in each image. In addition, the spatial distributions of most candidate points in two images are different.
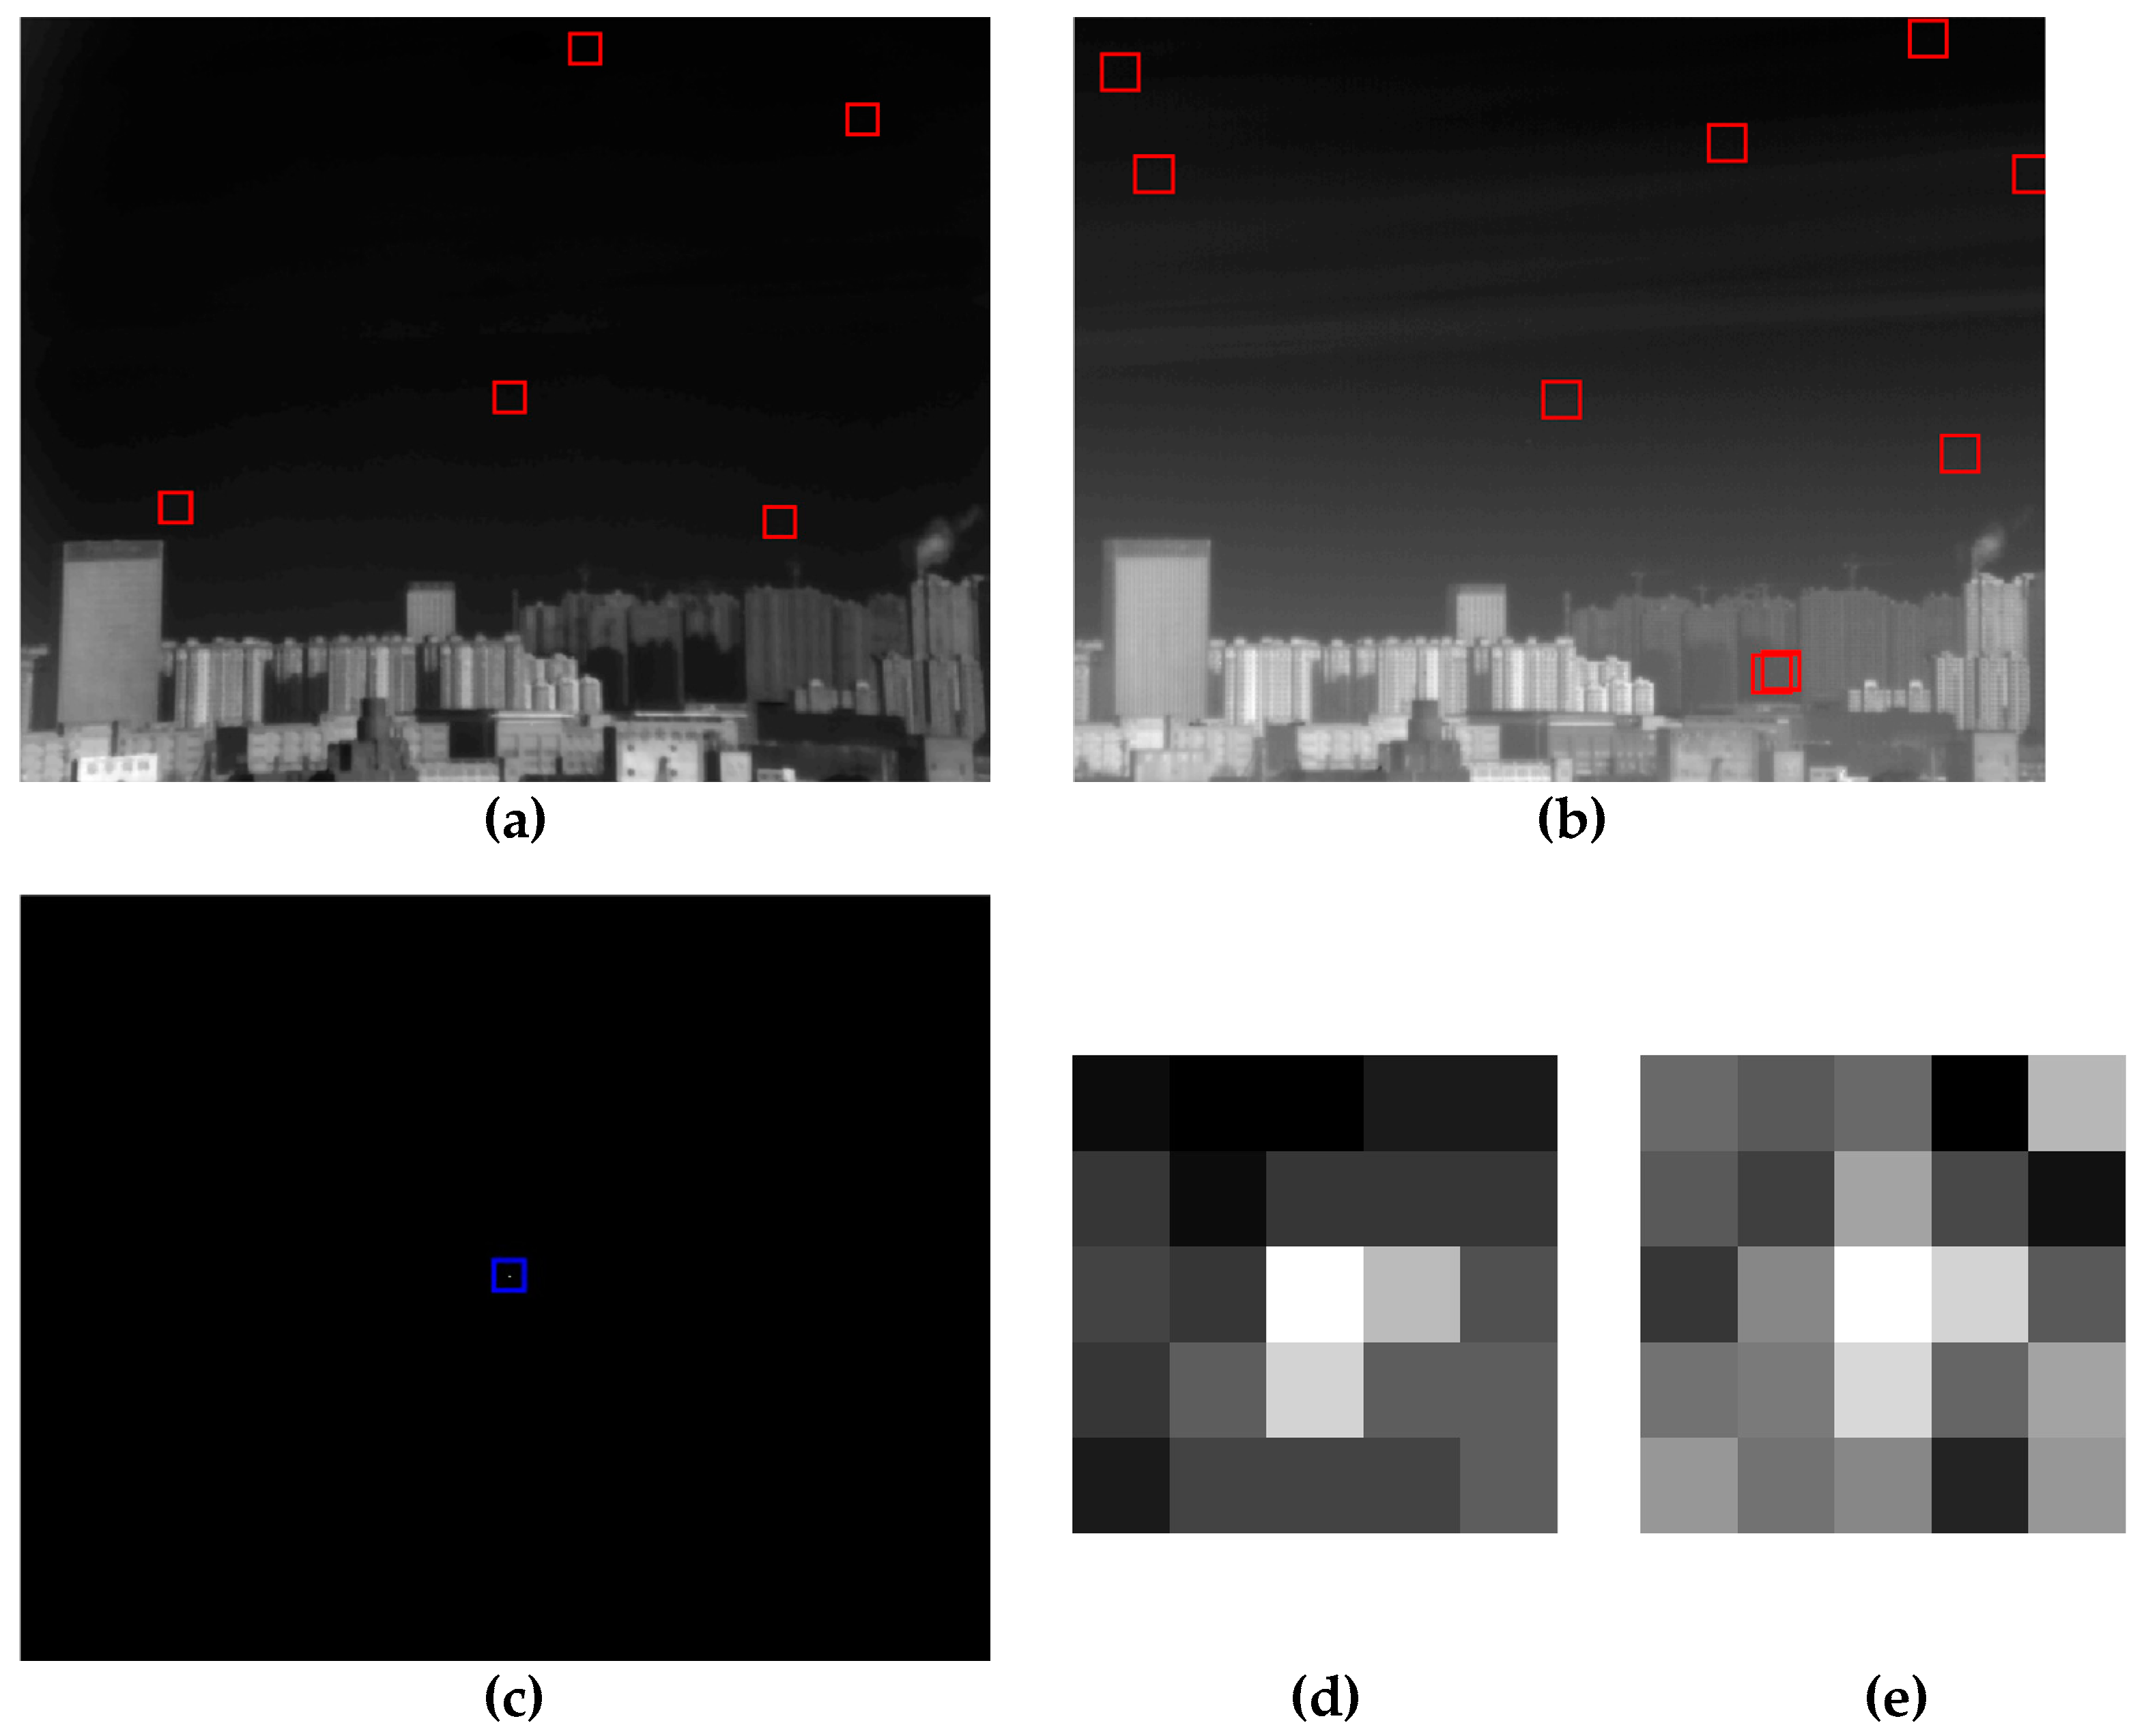
Then, TNR1 and TNR2 are constantly updated based on the CFAR criterion to eliminate false alarms further. The candidate points should be relocated to the original image when we calculate the thresholds and to ensure the accuracy of the result. Figure 13 displays the results of the CFAR threshold iteration and fusion of the dual-band images. The fixed noise has been eliminated through the interframe relation. There remain only several candidate points in each image, which are marked by red squares, as shown in Figure 13a,b. A false alarm in the building is extracted in the LWIR image, fortunately, that is not extracted in the MWIR image. Finally, data fusion correlation within 5 × 5 pixels is adapted to the results of background suppression. The result of the fused point target detection is illustrated in Figure 13c, and the extracted target is marked by a blue square. Figure 13d,e illustrate the enlarged areas of the detected point target in MWIR and LWIR images, which occupies 3 pixels to 4 pixels.
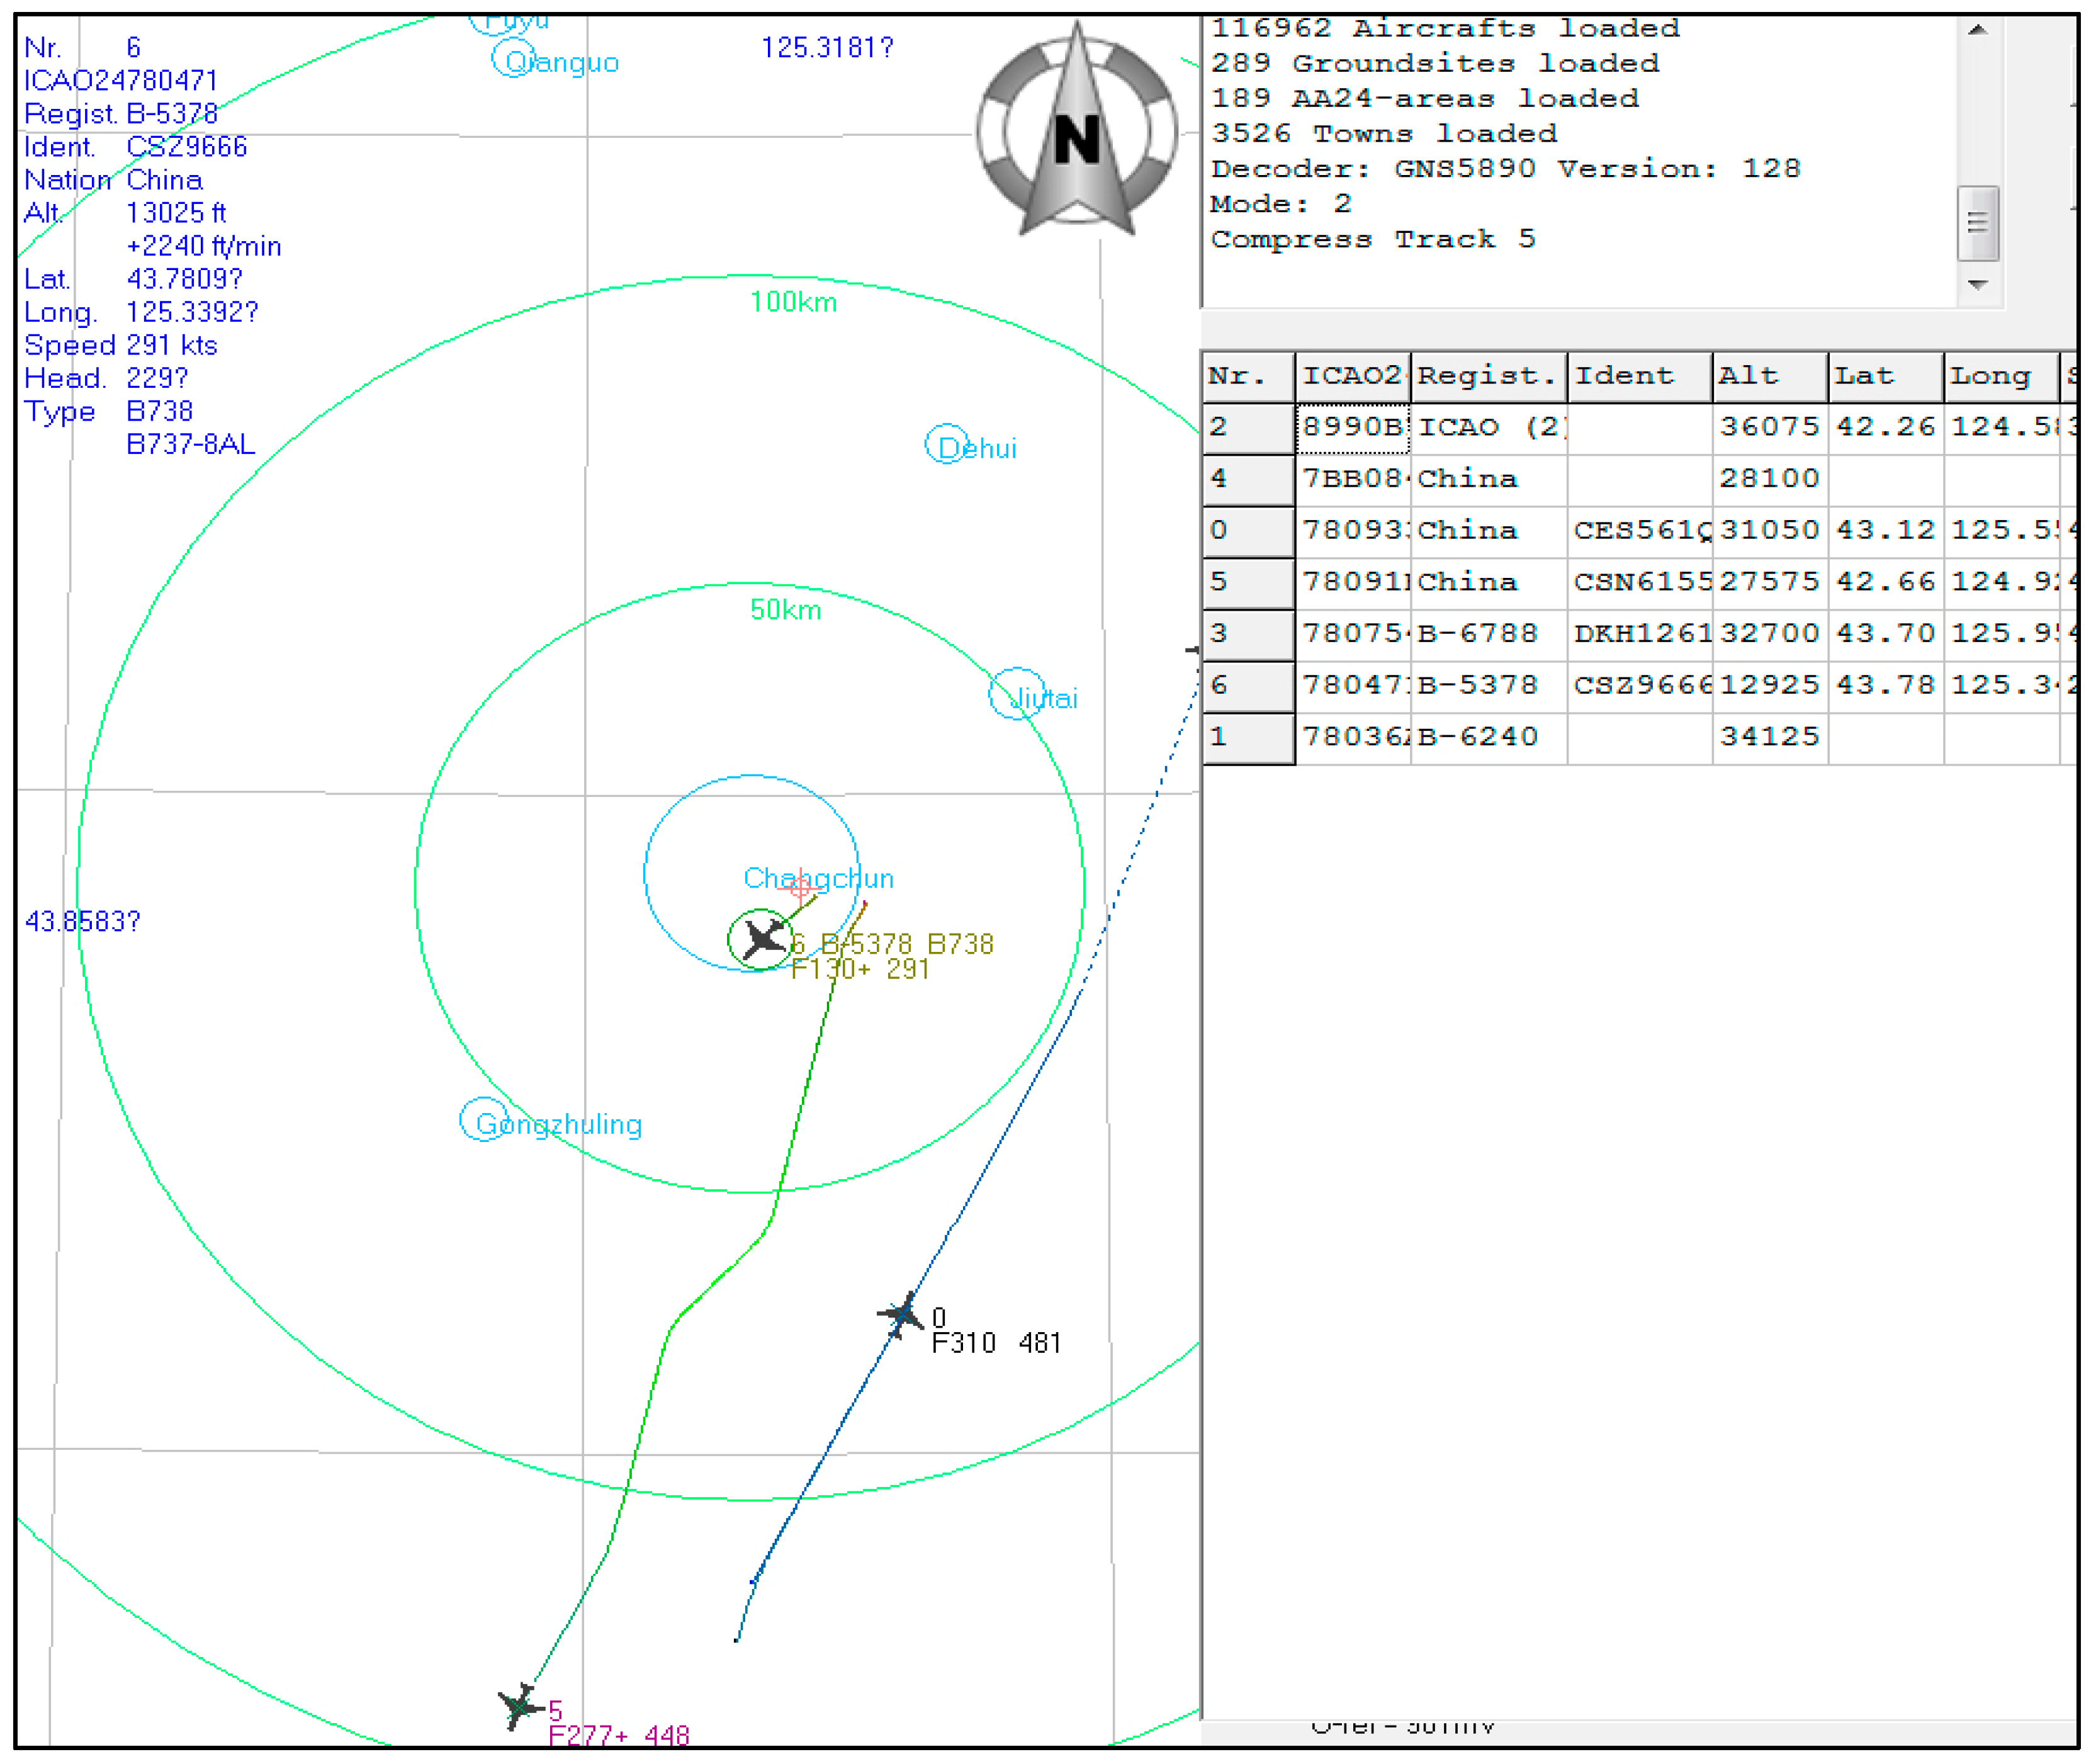
The ADS-B receiver provides the aircraft indicator diagram, which is shown in Figure 14. After observation and analysis, it can be determined that the extracted target is Airline 0 from China. The location information of the aircraft target is 43.12°N, 125.55°E, and the altitude of the flight is 31050 ft. The location information of our acquisition device in Changchun China is 43.85°N, 125.40°E with an altitude of 335 m. The geodetic coordinate system is computed, indicating that the aircraft point target is 82.58 km away from the infrared dual-band equipment.
The specific information of the point target in two channels extracted by the proposed method is summarized in Table 2, including the target coordinate, SNR and local STD of the background. The difference in the SNRs of the point target between the MWIR and LWIR images is small, and there is also a small difference between the two local STDs of the background.
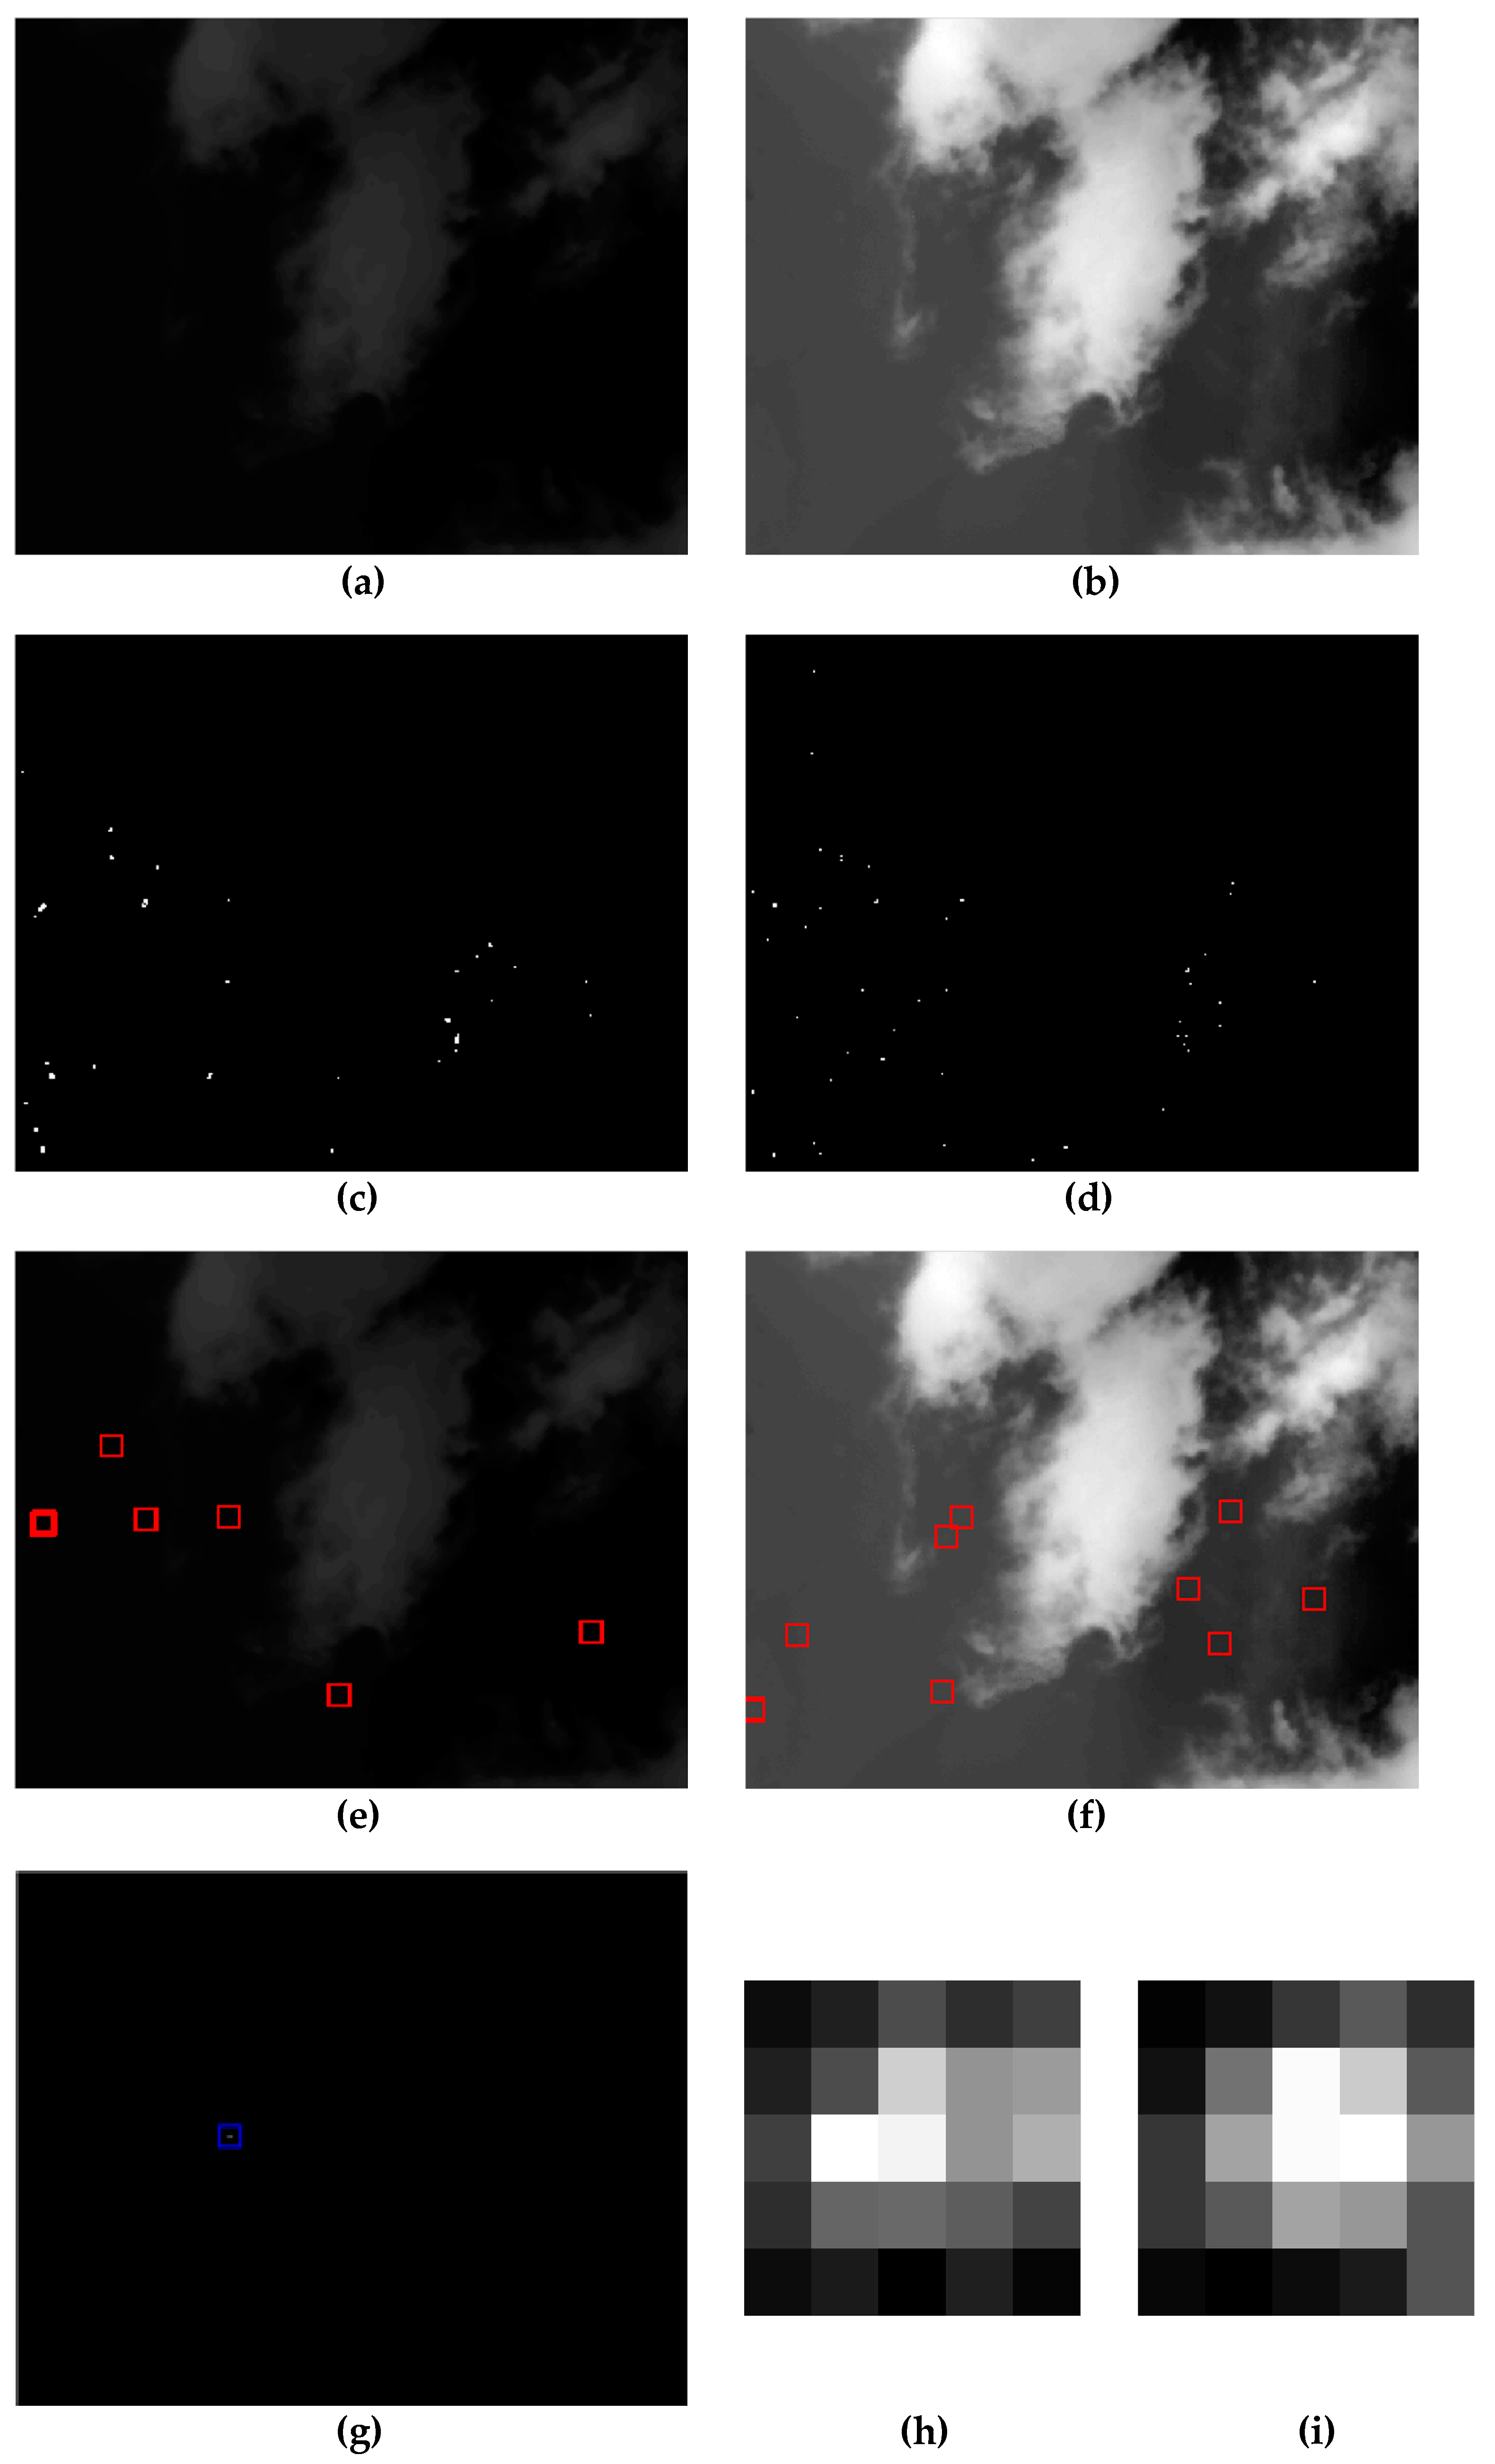
The next common scene is the point target flying against the complex cloud background, as shown in Figure 15 by (a) the MWIR image and (b) the LWIR image, which have been registered by the affine transformation. The results of the background suppression algorithm of the MWIR and LWIR images are presented in Figure 15c,d, respectively. Nearly all the cloud background in each image is suppressed completely, and most residual false alarms are in the sky or the dim point cloud clutter. After the process of CFAR threshold iteration and fixed noise elimination, only a few candidate points remain in each image as shown in Figure 15e,f. The real point target is identified in Figure 15g by data fusion correlation, and the specific information of the point target in dual-band IR images is summarized in Table 3.
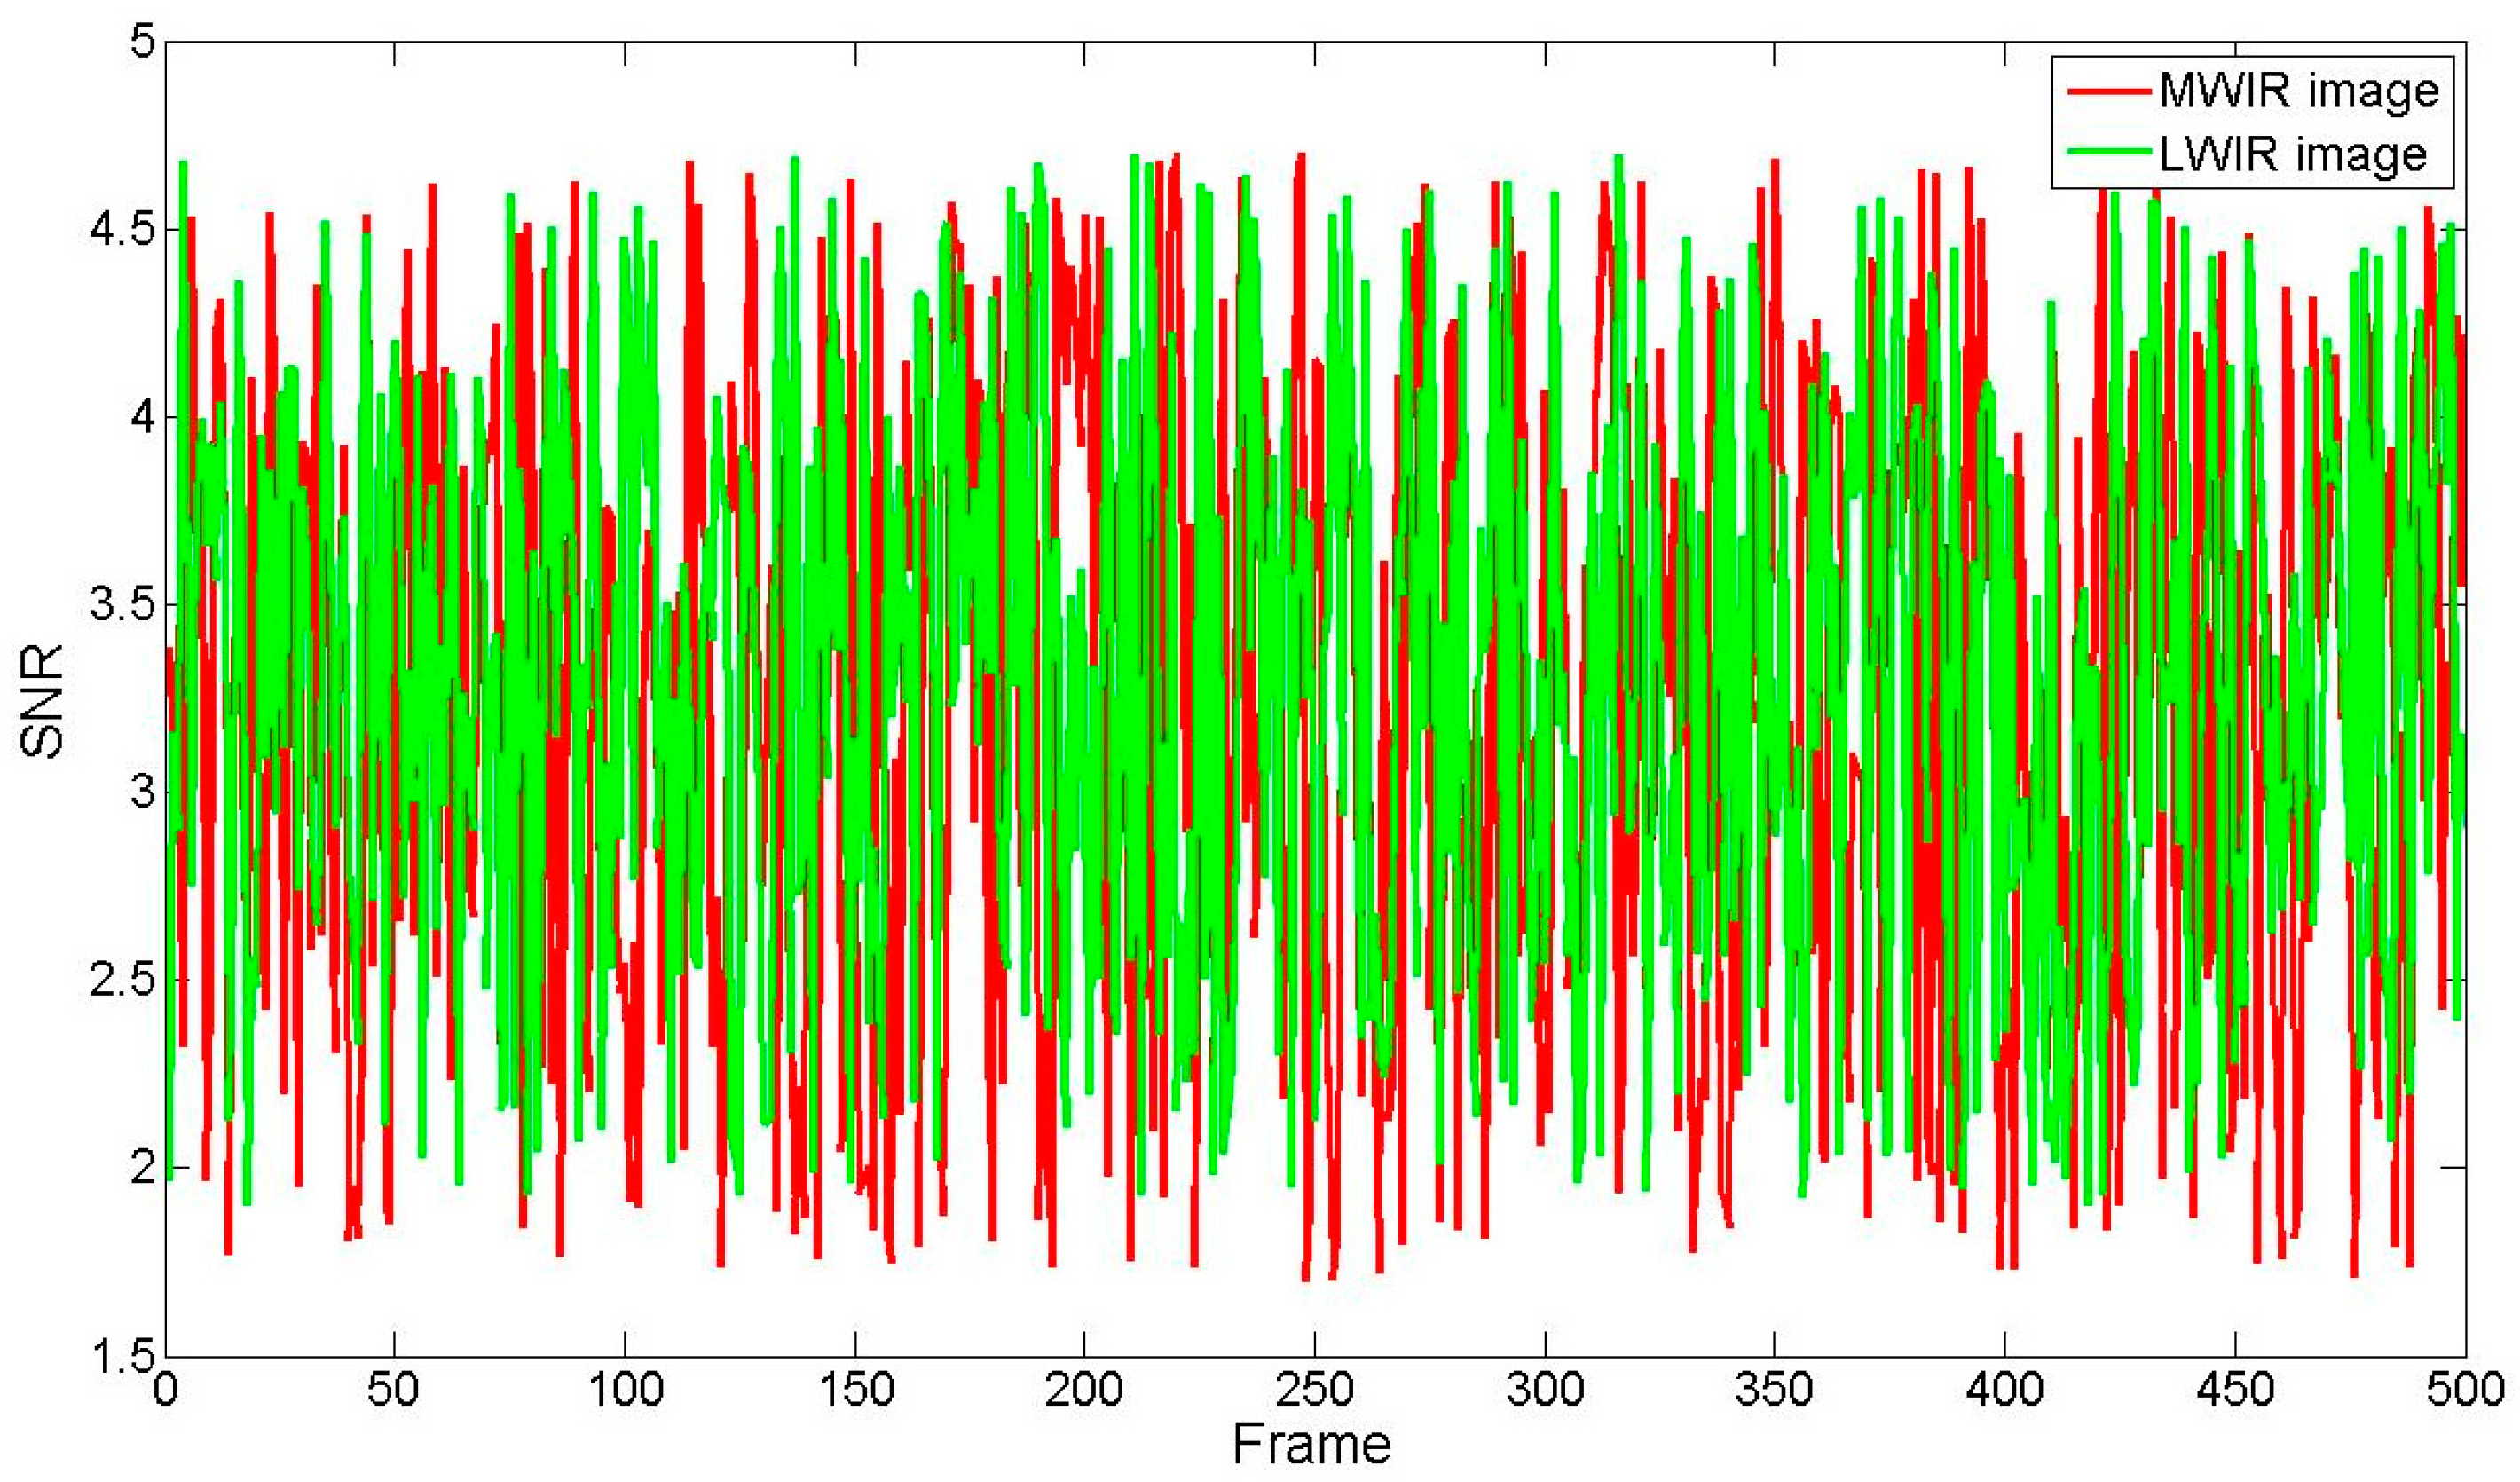
The curve of the SNR of the detected moving dim point target in the above two common scenes is summarized in Figure 16. In the whole moving phase of the point target, the SNR in the MWIR images varies from 1.71 to 4.71, and that in the LWIR images varies from 1.90 to 4.68, both of which are hardly visible to the naked eye.
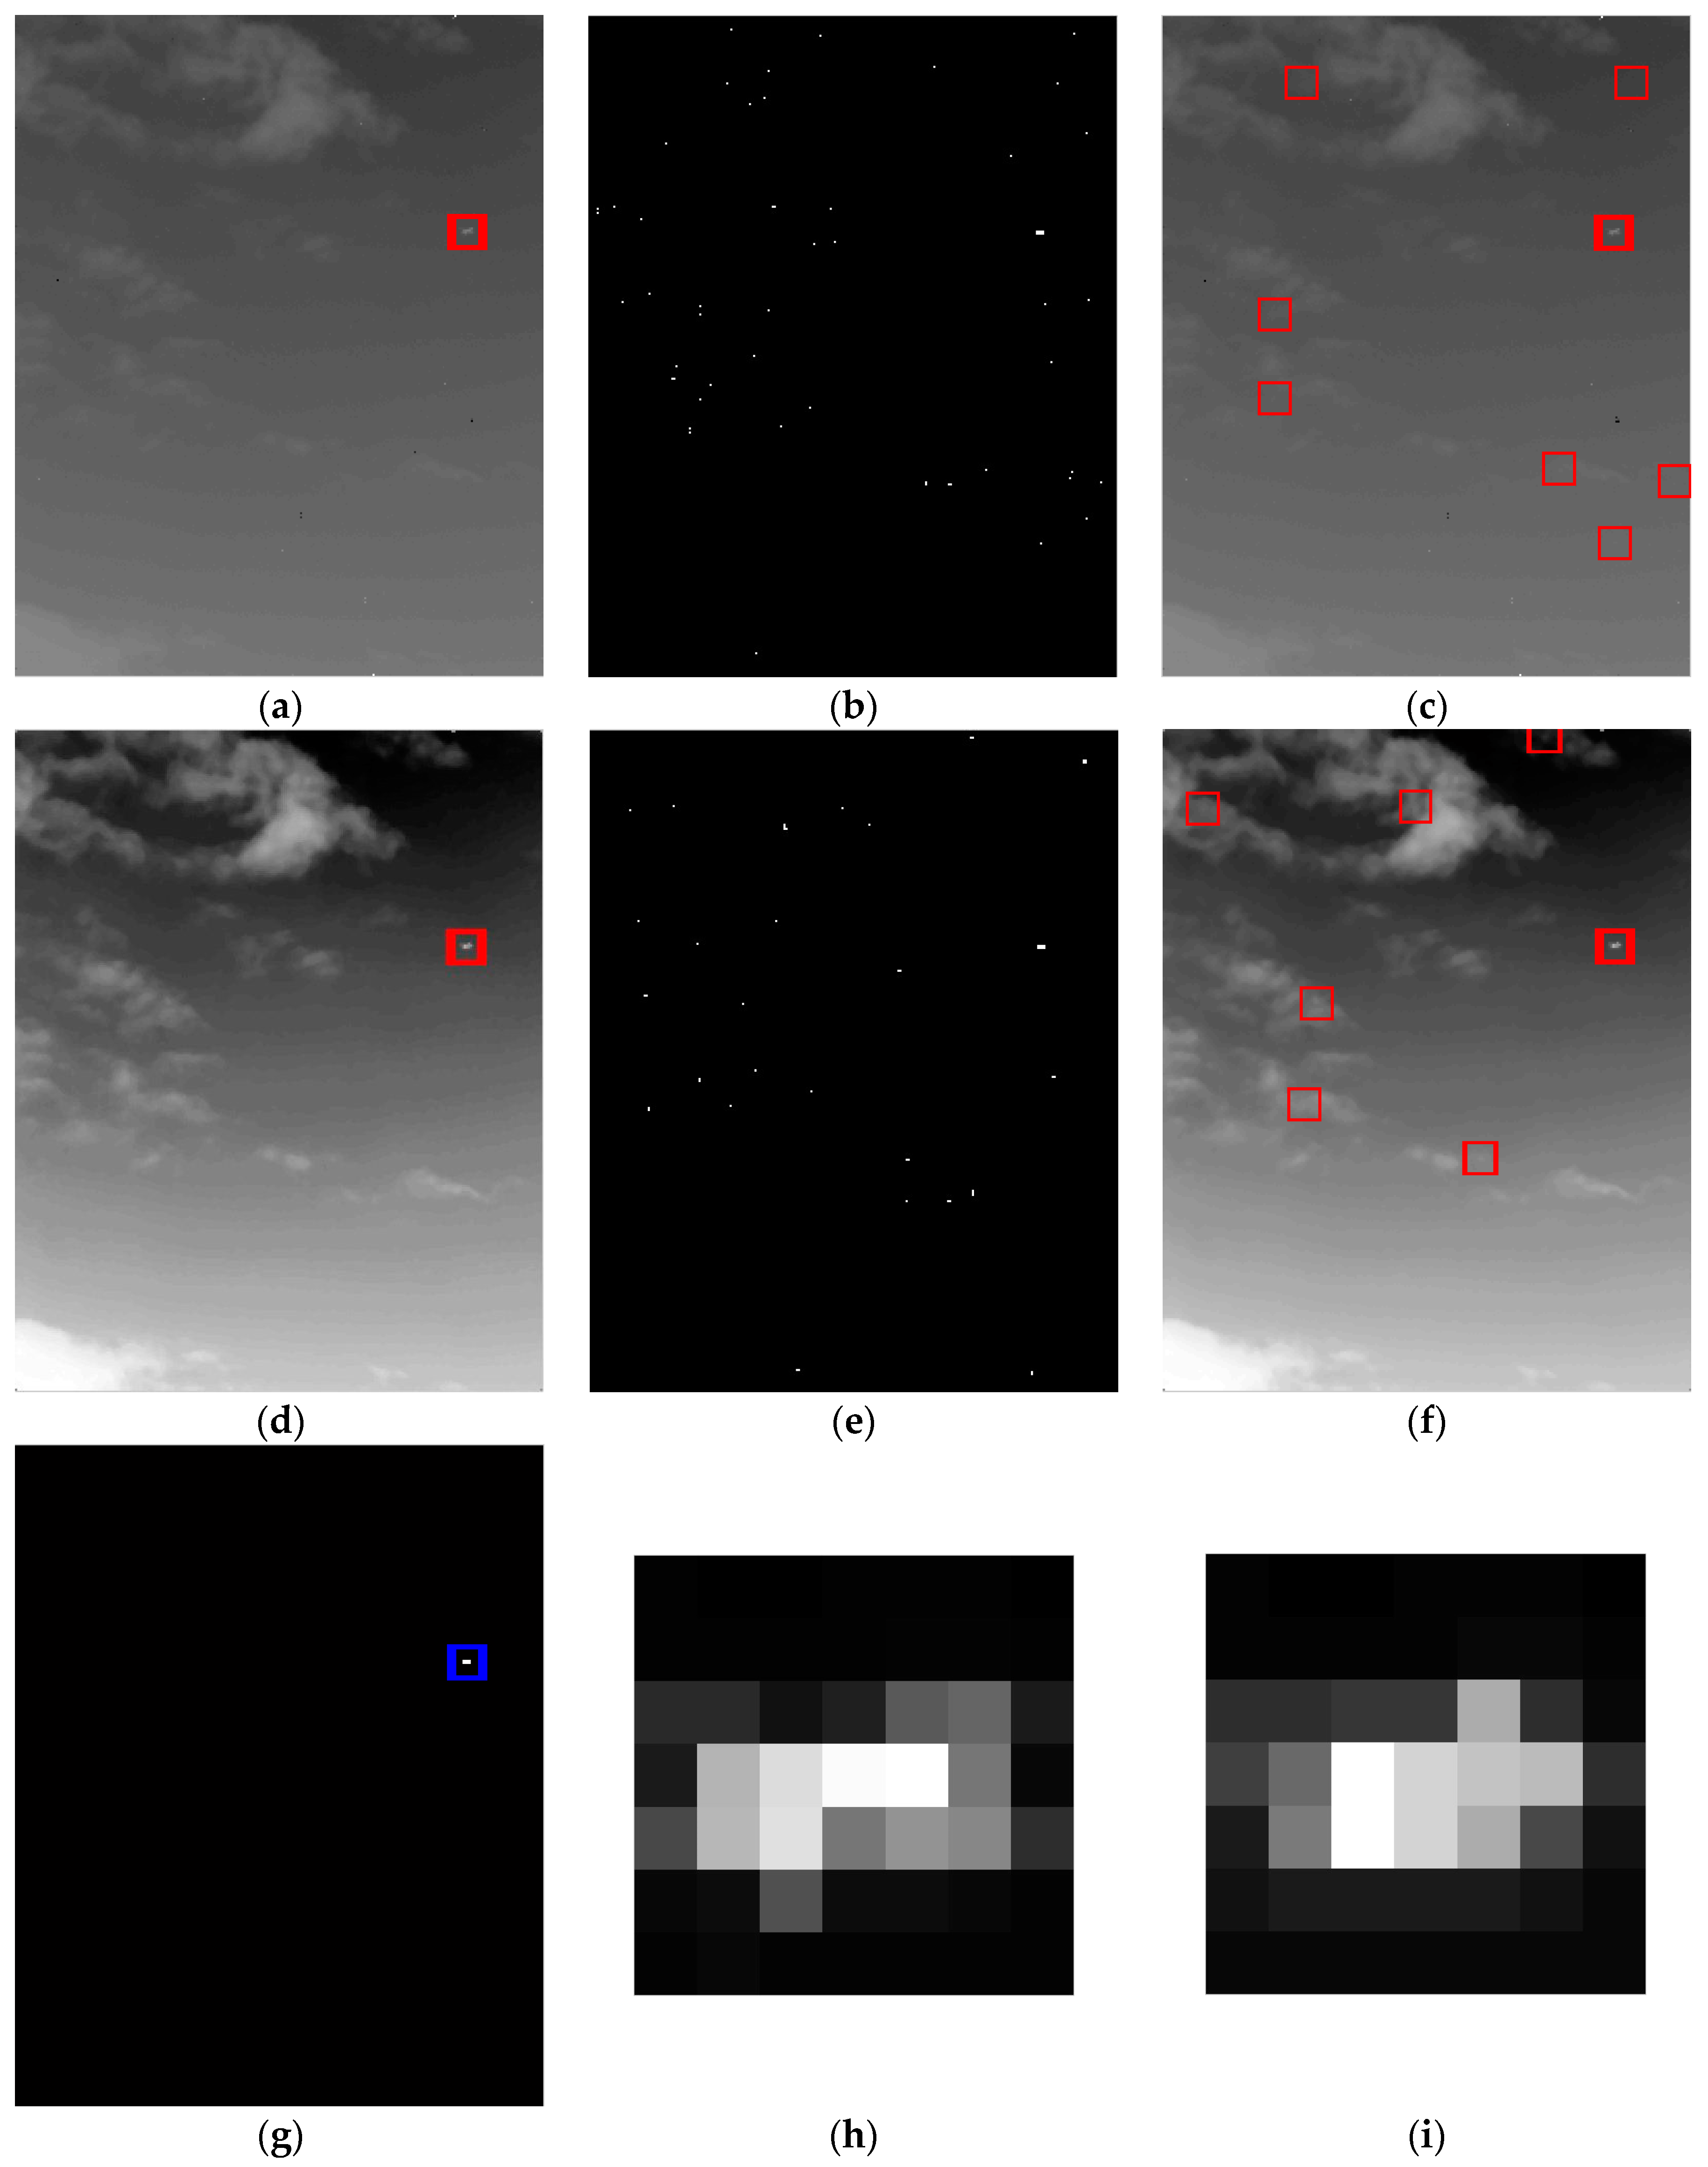
The target images with the larger SNR are also tested by the proposed method, as shown in Figure 17a MWIR target image with the SNR of 14.21, and Figure 17d LWIR target image with the SNR of 15.69, in which the targets are marked by the red squares. Through a series of procedures of background suppression, CFAR threshold and dual-band data fusion correlation, the point target is extracted in Figure 17g. It can be seen from Figure 17h,i that the point target occupies more pixels in dual-band images, and the point target’s central pixels in two images are different. The residual high-frequency candidate points in the MWIR image mainly distribute in the edges of the dim and weak cloud, while the spatial distribution is different from that of the LWIR image. The SNR range of the candidate points in Figure 17b,e is relatively large, approximately ranging from 1.5 to 16. It demonstrates that the proposed algorithm can achieve a robust performance on the point targets with the larger SNR.
The proposed method performs a better target detection effect in the above three sets of test images. The omnidirectional morphological filtering can reduce most of the building and the cloud background, and the residual high-frequency background edges are nearly removed by the local difference criterion. The fusion decision of two TNRs ensures that the proposed algorithm has the CFAR characteristic, regardless of what the background is. The difference of radiation in dual-band images leads to the different spatial distribution of the remained several candidate points, thus the real point target is extracted by the dual-band data correlation. Also, the different radiation mechanism of dual-band images sometimes causes the different central pixels of the point target which has a larger size or SNR. However, there are little differences in SNR and local STD of the point target between the dual-band images.
5. Comparison and Discussion
In the simulation results of the target detection model, we have derived the optimal fused probability of detection under the system’s common probability of false alarm and the common SNR of the point target according to the NP criterion and And fusion rule. The dual-band probability of detection is always better than that of the single-band when the system’s required probability of false alarm is relatively large, such as 10−3 or 10−4. However, when the system’s required probability of false alarm is relatively small, such as 10−5 or 10−6, the single-band probability of detection is slightly higher than that of the dual-band model when SNR2 is less than the small critical point. In fact, the SNR of the common point target that we detected is usually larger than the critical point. In addition, considering the hardware level and the limited performance of the detection algorithm, the actual probability of false alarm is rarely less than 10−4.
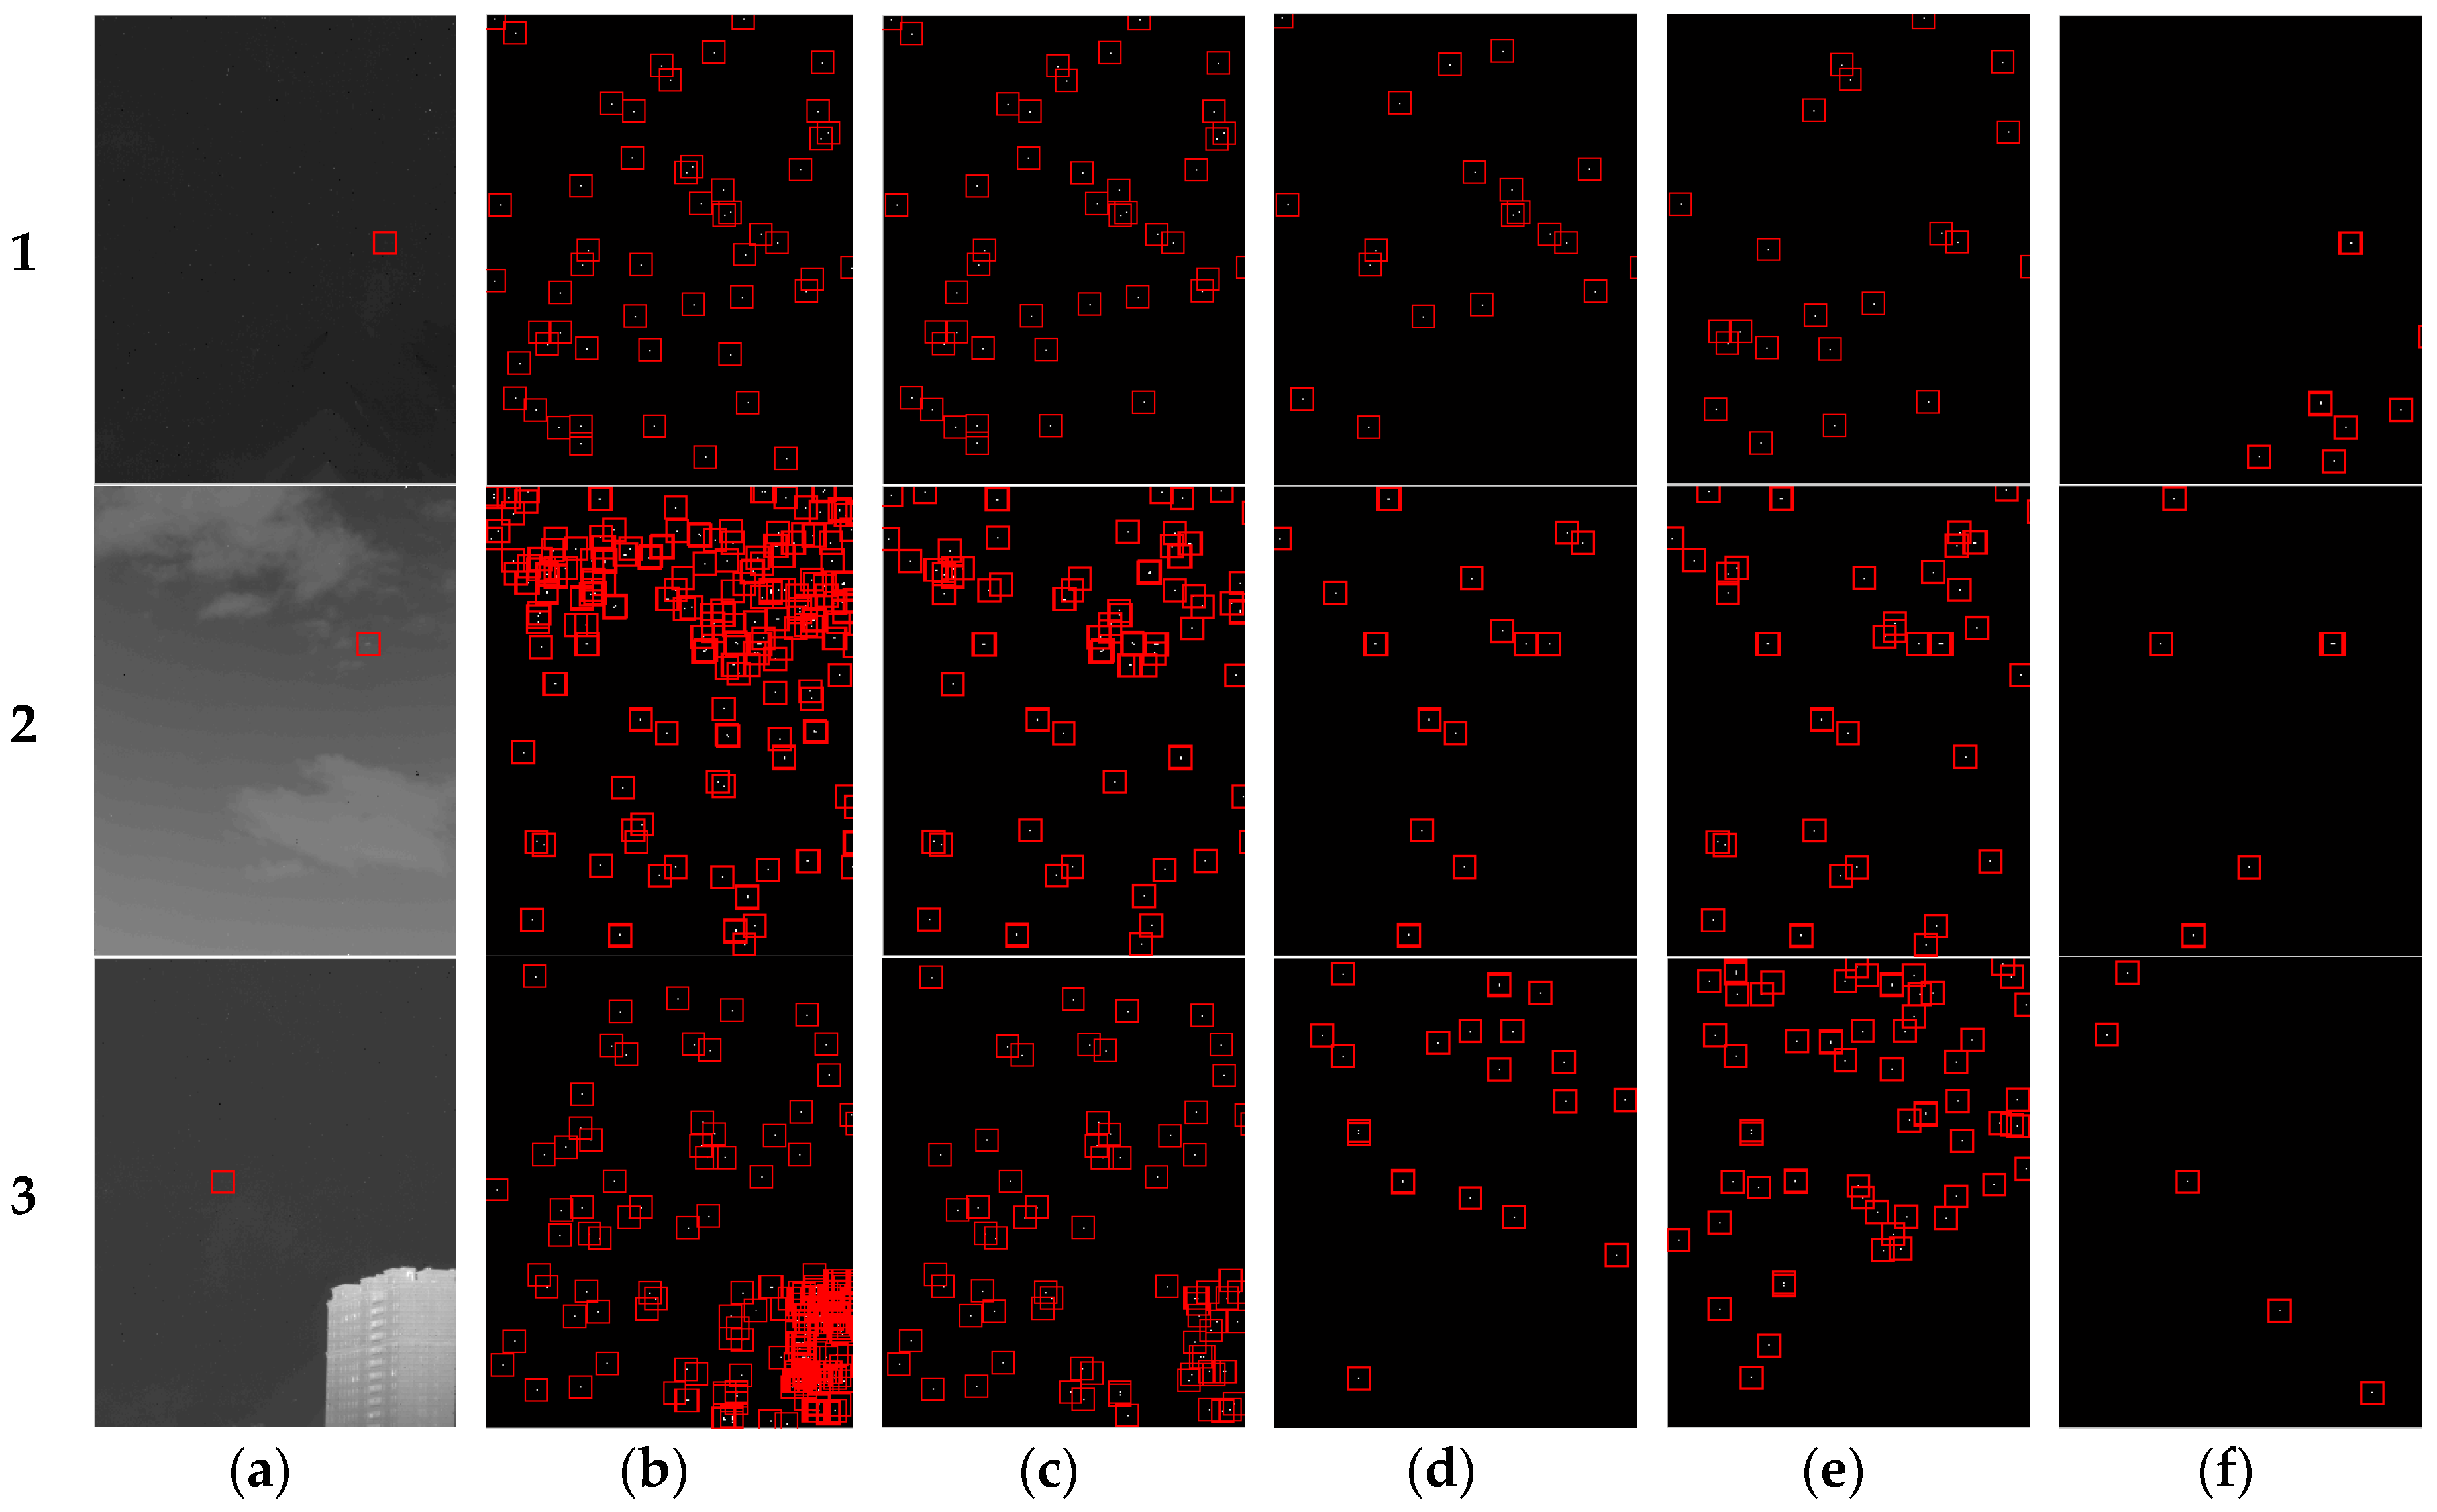
To validate the effectiveness of the proposed algorithm in background suppression, it is compared with the common algorithms including the traditional Top-hat, DoG, BM3D, and GMM. Figure 17 illustrates the comparable results of 3 typical target scenes such as the sky background, cloud background, and buildings, while only the LWIR images are presented here for simplicity. The SNRs of the three point targets located in Figure 18a are 5.14, 9.41 and 7.25. Figure 18b–e show the results of traditional Top-hat, DoG, BM3D and GMM, and Figure 18f displays the result of the proposed background suppression and CFAR threshold algorithm, and only several false alarms remain in each image, which will be eliminated easily by dual-band fusion correlation. The proposed method suppresses background clutter well compared with other methods.
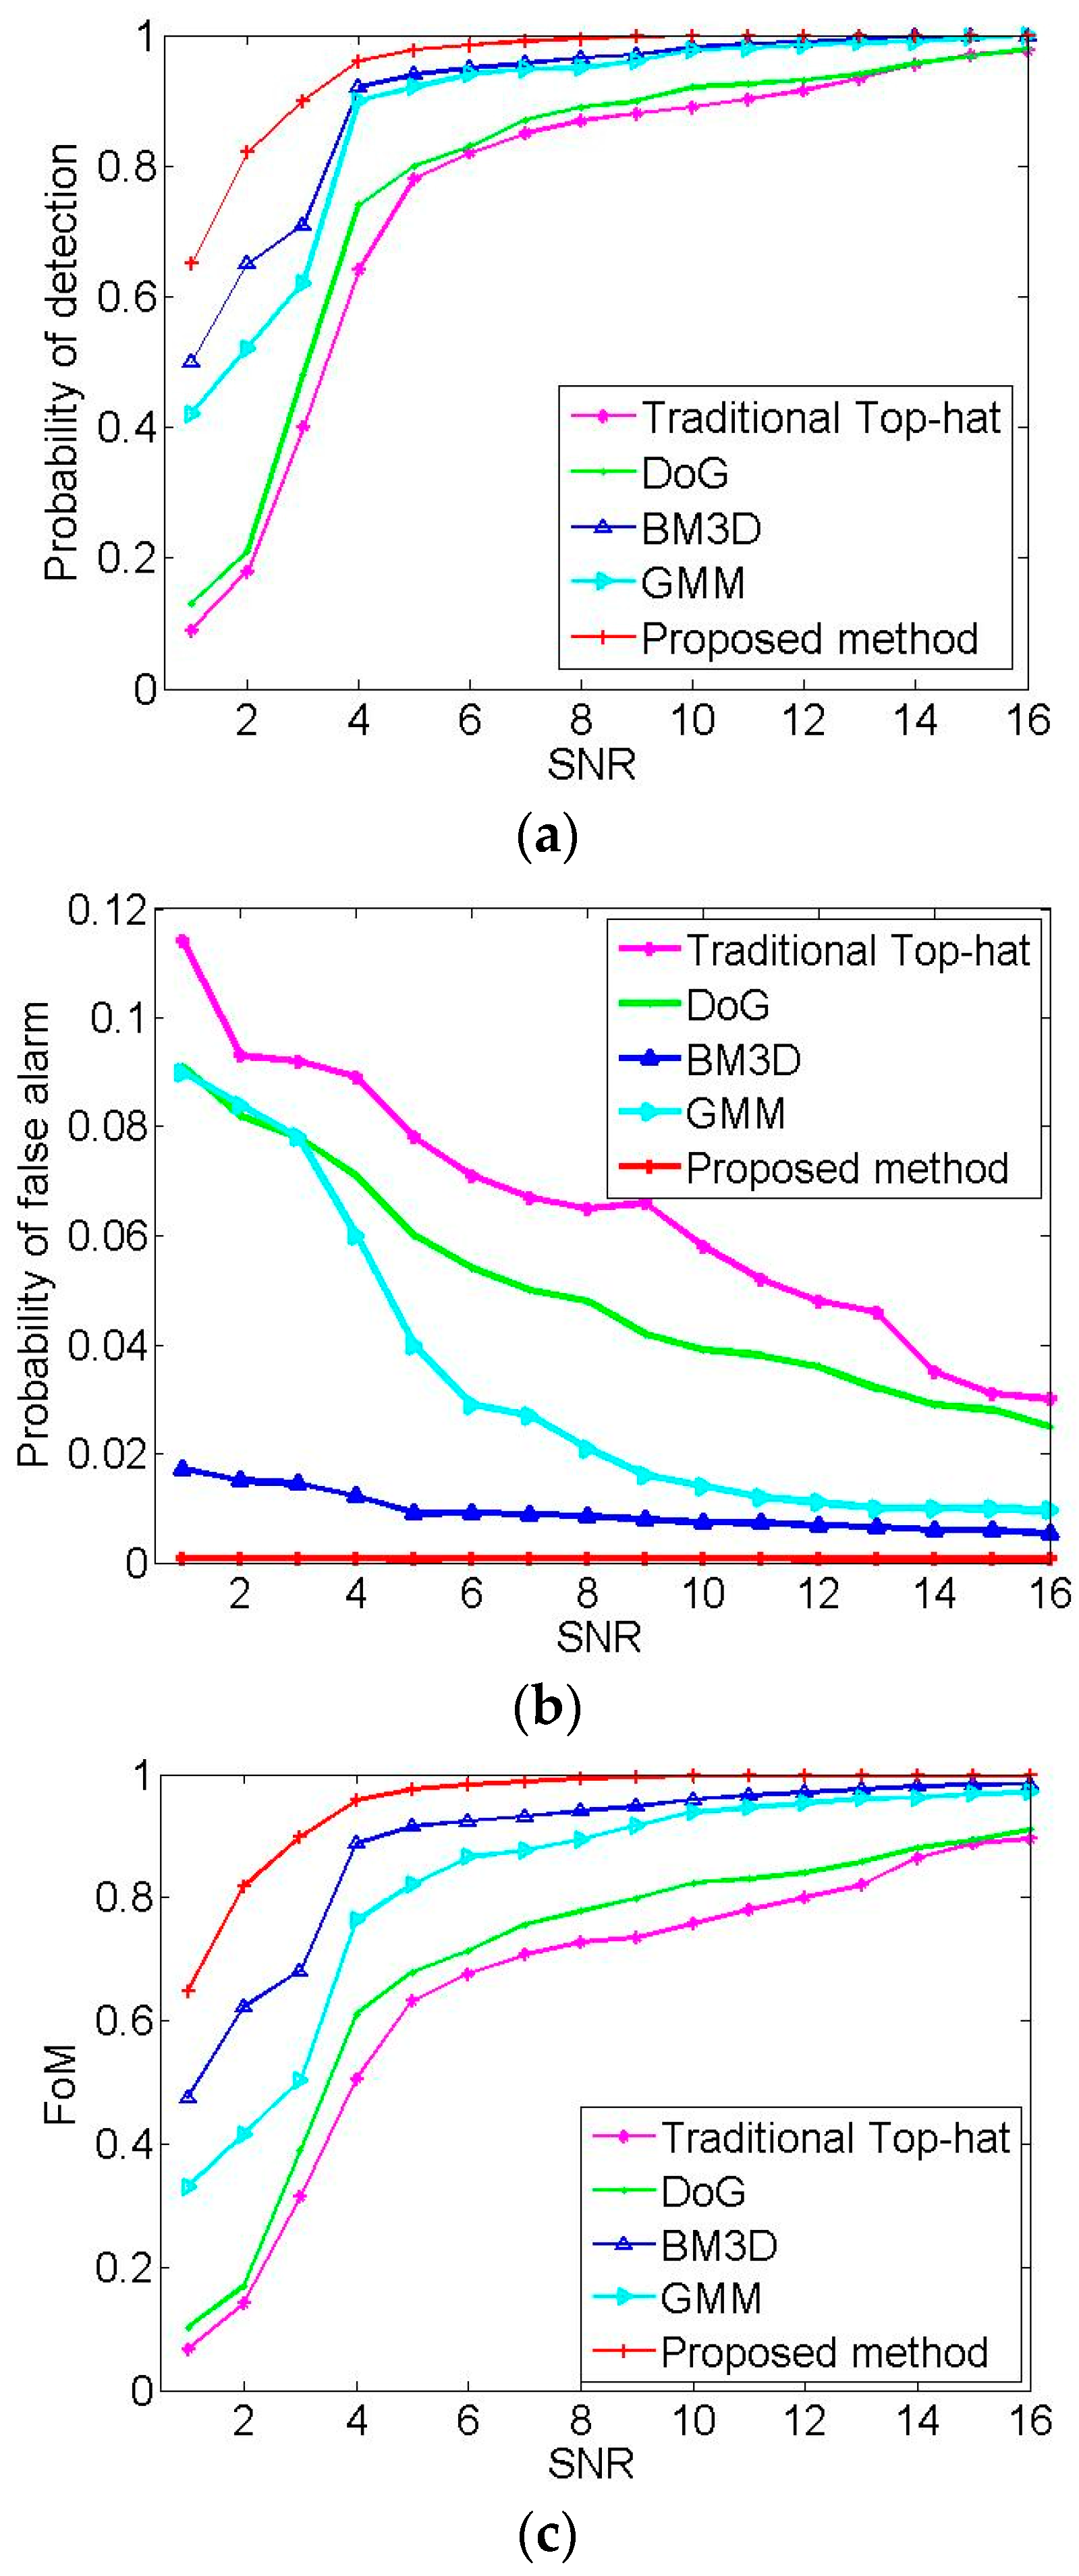
Quantitative comparison is also performed here. Since the probability of detection of the dual-band model is obviously superior to that of the single-band model according to the simulation result in Section 2.3, all the compared algorithms are performed based on the proposed dual-band model. The probability of detection, the probability of false alarm and the running time of the target detection algorithm are selected as the evaluation indexes of the results, which are computed from the following:
where is the number of detected true point targets, is the number of false alarms, and is the total number of point targets.
There are a total of 1500 point targets in the test sequence including the simple sky background, the complex cloud and the building background. The SNR of dual-band images is approximately from 1 to 16. The proposed method successfully extracted 1487 point targets with 1 false alarm. Therefore, the corresponding probability of detection of the proposed method reaches 99.13%, and at the same time, the probability of false alarm is 0.07%. The traditional Top-hat method extracted 1249 point targets with 109 false alarms. The DoG method detected 1309 point targets with 82 false alarms. The BM3D and GMM methods detected more point targets than the traditional Top-hat and DoG methods, 1461 and 1433, respectively.
For an appropriate compromise between and , we introduce an evaluation index named Figure of Merit (FoM). This is defined from [47], calculated as:
FoM is a normalized parameter, such that 0 < FoM < 1. An FoM close to 1 indicates a near perfect performance. The statistical results of the five algorithms are summarized in Table 4.
As seen from the above table, the BM3D and GMM algorithms have a high probability of detection, exceeding 90%, and they are effective at background suppression although time consuming because of the complex background modeling process. Traditional Top-hat and DoG algorithms are simple, but the probability of false alarm is slightly higher, which leads to a lower FoM. The strong advantage of the proposed algorithm is that the probability of false alarm is very low, which is because that the omnidirectional morphological filtering and local difference criterion have excellent background suppression effect. We further calculate the comparable results of the probability of detection, probability of false alarm, and FoM with the SNR, as shown in Figure 19. The proposed algorithm performs the advantage of CFAR, while the false alarms of other algorithms are uncontrollable. Image processing was finished in MATLAB R2014a with the PC configuration of 4 GB main memory and 32-bit system. The proposed algorithm basically meets the real-time requirements when compared with other algorithms. Some modeling methods such as GMM and BM3D will consume a lot of time in background modeling and convergence. Many state-of-the-art TBD algorithms such as dynamic programming, GLRT and particle filter [48] can produce good detection results, but the complexity of these algorithms is too high to meet real-time requirements. Our proposed algorithm is carried out in spatial domain, and the target can be extracted only by one frame. The morphological filtering is very fast and efficient, and the most time is spent in the iteration process of TNR in dual-band model, and the computational complexity and convergence speed of our algorithm are obviously superior to the background modeling and TBD algorithms.
Although the proposed fused target detection algorithm based on the CFAR criterion is designed for infrared dual-band images, in most cases, it also performs well in other multiple channels, such as visible image fusion, visible and infrared image fusion, Synthetic Aperture Radar (SAR) image fusion and other types of gray-scale image fusion, as long as the energy of the point target is larger in its local neighborhood. In addition, the proposed point target detection method is applicable to the point targets in various cases including stationary targets, slow-moving targets and fast-moving targets.
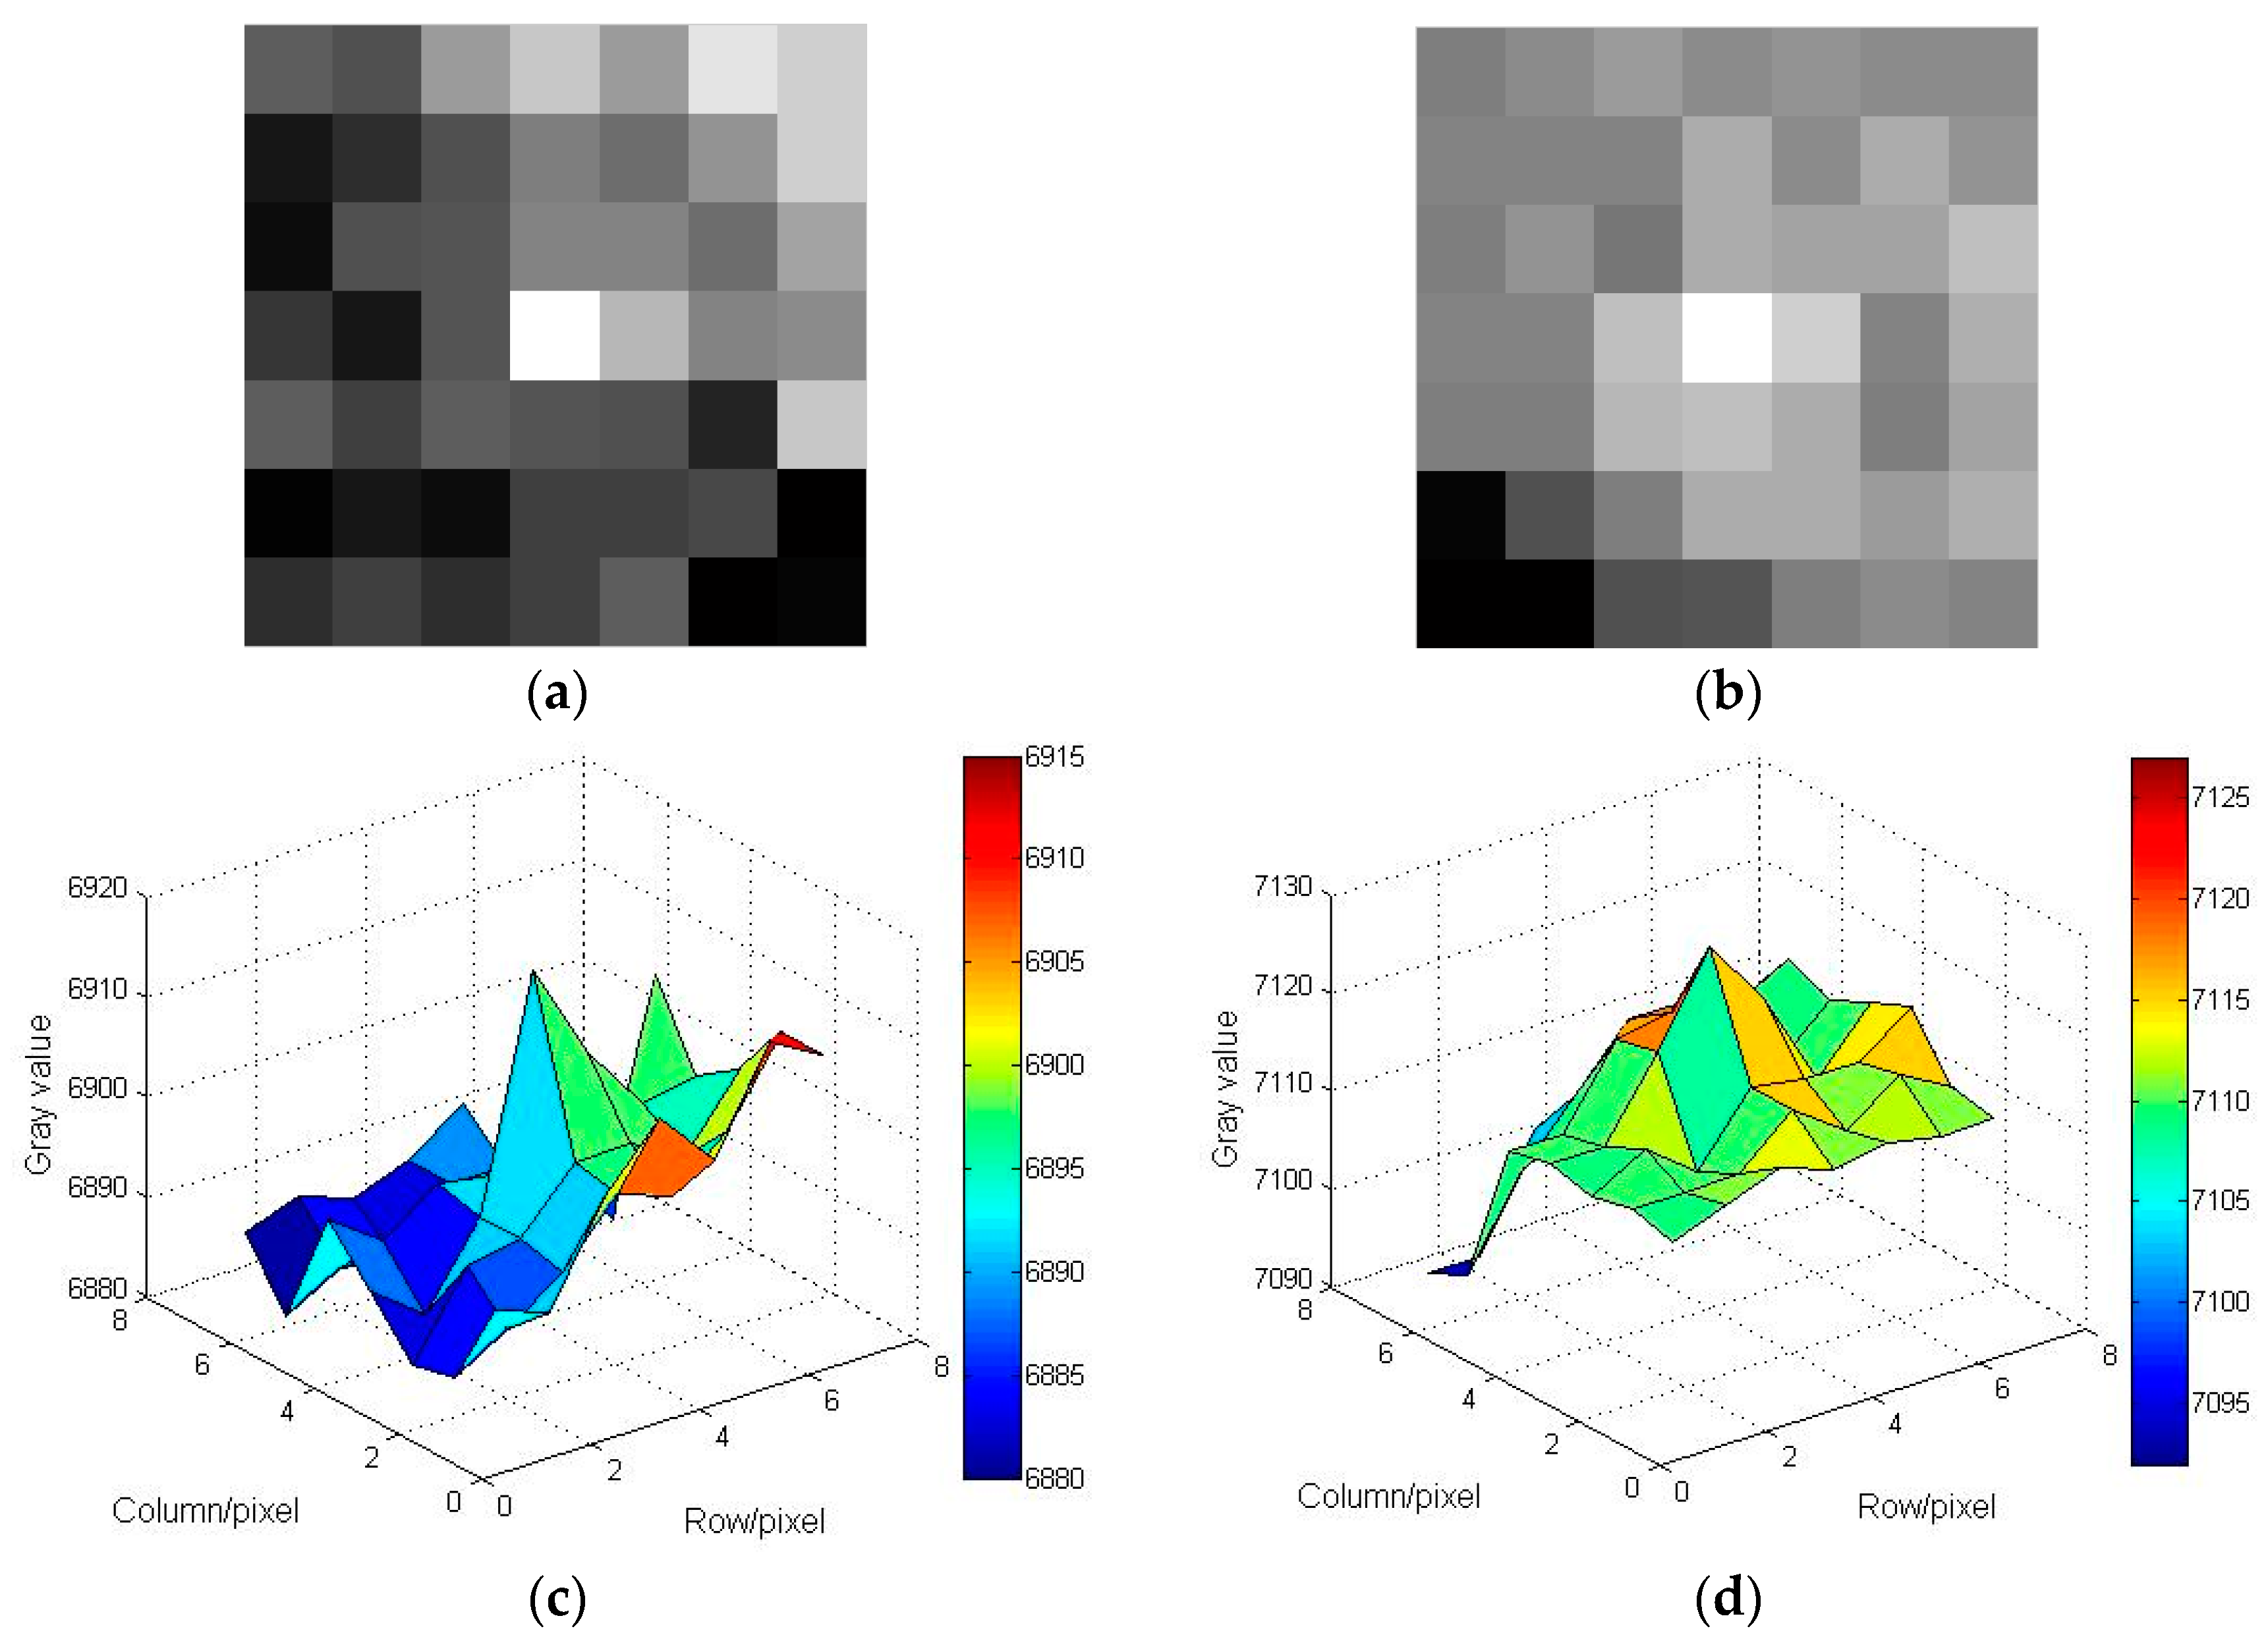
Here, we specifically study the characteristics of the one false alarm extracted by the proposed algorithm. The local neighborhood images of the false alarm are displayed in Figure 20a the MWIR image and Figure 20b the LWIR image, and Figure 20c,d are their corresponding three-dimensional gray-scale maps. Through calculation, the SNR and the local STD of the false alarm in the MWIR image are 3.05 and 6.39, respectively, and those of the false alarm in the LWIR image are 2.98 and 4.80, respectively. The extracted false alarm is more likely to be the real existence of a dim point cloud or weak atmospheric radiation, which is very similar to the point target in terms of its shape and characteristics in each image. Our future research direction is to distinguish between this kind of false alarm and the real point target.
6. Conclusions
Detecting the infrared point target as early as possible can increase response times, thus, it is necessary to improve the robustness and efficiency of the detection algorithms. However, the point target’s imaging size and minutiae are very small due to the long-distance imaging system. Based on the dual-band CFAR model, this paper presented omnidirectional multiscale morphological filtering and the local difference criterion for aerial point target detection. The single-band target detection model under the NP criterion is established first, and then the fused probability of detection and the probability of false alarm under the dual-band model are deduced according to the And fusion rule. The dynamic TNR is adjusted to obtain the optimal fused probability of detection under the NP criterion. Next, an omnidirectional Top-hat algorithm is presented to suppress complex background, and the local difference criterion is also employed to eliminate the residual background edges. The dim point target is finally extracted after the CFAR criterion and data fusion correlation. The infrared dual-band detection equipment is implemented to confirm the effectiveness of the proposed algorithm. The results show that the probability of detection of the proposed method reaches 99.13% with a 0.07% probability of false alarm. It demonstrates that the proposed algorithm outperforms the common algorithms such as the traditional Top-hat, DoG, BM3D, and GMM in terms of background suppression and running time.
The proposed dual-band model has a better detection effect when the SNR of the point target is relatively low but higher than the small critical point, and it can significantly reduce the probability of false alarm. When the SNR is relatively larger, the single-band detection model can also produce good results to distinguishing the real target and the false alarm by the trajectory correlation or energy accumulation. In addition, the dual-band detection method will increase the complexity of the algorithm compared with the single-band model, which is the main limitation of the multichannel fusion methods. A GPU of parallel computing could be employed which can dramatically increase the computing speed. However, for the aerial point targets, the IRST system usually adopts the working mode of horizontal sweep which will cause the jitter of the target in the image. Moreover, the positioning accuracy of the system is limited, and the feature of target trajectory may not be obvious, which sets higher requirements for the point target detection in the single frame. Therefore, the study of stable and efficient dual-band detection algorithms has great prospects.
Author Contributions
R.L. and D.W. conceived and performed the algorithm, designed and completed the experiments; R.L. wrote the paper; P.J. and H.S. provided technical support and modified the language.
Funding
This research was supported by the National Natural Science Foundation of China (61675202).
Conflicts of Interest
The authors declare no conflict of interest.
References
- Cao, Y.; Wang, G.; Yan, D.; Zhao, Z. Two algorithms for the detection and tracking of moving vehicle targets in aerial infrared image sequences. Remote Sens. 2016, 8, 28. [Google Scholar] [CrossRef]
- Leitloff, J.; Rosenbaum, D.; Kurz, F.; Meynberg, O.; Reinartz, P. An operational system for estimating road traffic information from aerial images. Remote Sens. 2014, 6, 11315–11341. [Google Scholar] [CrossRef] [Green Version]
- Liu, R.; Wang, D.J.; Zhou, D.B.; Jia, P. Point target detection based on multiscale morphological filtering and an energy concentration criterion. Appl. Opt. 2017, 56, 6796–6805. [Google Scholar] [CrossRef] [PubMed]
- Gao, J.; Wen, C.; Liu, M. Robust small target co-detection from airborne infrared image sequences. Sensors 2017, 17, 2242. [Google Scholar] [CrossRef] [PubMed]
- Singh, B.K.; Nagar, H.; Roichman, Y.; Arie, A. Particle manipulation beyond the diffraction limit using structured super-oscillating light beams. Light Sci. Appl. 2017, 6, e17050. [Google Scholar] [CrossRef]
- Chan, L.A.; Der, S.Z.; Nasrabadi, N.M. Improved target detection algorithm using dualband infrared imagery. Proc. SPIE 2001, 4379, 187–199. [Google Scholar]
- Jin, M.Z.; Lu, F.; Belkin, M.A. High-sensitivity infrared vibrational nanospectroscopy in water. Light Sci. Appl. 2017, 6, e17096. [Google Scholar] [CrossRef]
- Pering, T.D.; McGonigle, A.J.S.; Tamburello, G.; Aiuppa, A.; Bitetto, M.; Rubino, C.; Wilkes, T.C. A novel and inexpensive method for measuring volcanic plume water fluxes at high temporal resolution. Remote Sens. 2017, 9, 146. [Google Scholar] [CrossRef]
- Burdanowitz, J.; Klepp, C.; Bakan, S.; Buehler, S.A. Simulation of ship-track versus satellite-sensor differences in oceanic precipitation using an island-based radar. Remote Sens. 2017, 9, 593. [Google Scholar] [CrossRef]
- Qiu, G.N.; Quan, H.M. Moving object detection algorithm based on symmetrical-differencing and background subtraction. Comput. Eng. Appl. 2014, 50, 158–162. [Google Scholar]
- Alkandri, A.; Gardezi, A.; Bangalore, N.; Birch, P.; Young, R.; Chatwin, C. Automatic parameter adjustment of difference of Gaussian (DoG) filter to improve OT-MACH filter performance for target recognition applications. Proc. SPIE 2008, 8185, 81850M. [Google Scholar]
- Chen, C.L.P.; Li, H.; Wei, T.Y. A local contrast method for small infrared target detection. IEEE Trans. Geosci. Remote Sens. 2014, 52, 574–581. [Google Scholar] [CrossRef]
- Fan, H.; Wen, C. Two-dimensional adaptive filtering based on projection algorithm. IEEE Trans. Signal Process. 2004, 52, 832–838. [Google Scholar] [CrossRef]
- Wang, P.; Tian, J.W.; Gao, C.Q. Infrared small target detection using directional high pass filters based on LS-SVM. Electron. Lett. 2009, 45, 156–158. [Google Scholar] [CrossRef]
- Newey, M.; Benitz, G.R.; Barrett, D.J.; Mishra, S. Detection and imaging of moving targets with limit SAR data. IEEE Trans. Geosci. Remote Sens. 2018, 56, 3499–3510. [Google Scholar] [CrossRef]
- Genin, L.; Champagnat, F.; Besnerais, G.L. Background first- and second-order modeling for point target detection. Appl. Opt. 2012, 51, 7701–7713. [Google Scholar] [CrossRef] [PubMed]
- Niu, W.; Zheng, W.; Yang, Z.; Wu, Y.; Vagvolgyi, B.; Liu, B. Moving point target detection based on higher order statistics in very low SNR. IEEE Trans. Geosci. Remote Sens. 2018, 15, 217–221. [Google Scholar] [CrossRef]
- Wang, L.G.; Lin, Z.P.; Deng, X.P. Infrared point target detection based on multi-label generative MRF model. Infrared Phys. Technol. 2017, 83, 188–194. [Google Scholar] [CrossRef]
- Succary, R.; Cohen, A.; Yaractzi, P.; Rotman, S.R. Dynamic programming algorithm for point target detection: Practical parameters for DPA. Proc. SPIE 2001, 4473, 96–100. [Google Scholar]
- Sun, X.L.; Long, G.C.; Shang, Y.; Liu, X.L. A framework for small infrared target real-time visual enhancement. Proc. SPIE 2015, 9443, 94430N. [Google Scholar]
- Huber-Shalem, R.; Hadar, O.; Rotman, S.R.; Huber-Lerner, M. Parametric temporal compression of infrared imagery sequences containing a slow-moving point target. Appl. Opt. 2016, 55, 1151–1163. [Google Scholar] [CrossRef] [PubMed]
- Foglia, G.; Hao, C.; Farina, A.; Giunta, G.; Orlando, D.; Hou, C. Adaptive detection of point-like targets in partially homogeneous clutter with symmetric spectrum. IEEE Trans. Aerosp. Electron. Syst. 2017, 53, 2110–2119. [Google Scholar] [CrossRef]
- Abu Bakr, M.; Lee, S. A Framework of Covariance Projection on Constraint Manifold for Data Fusion. Sensors 2018, 18, 1610. [Google Scholar] [CrossRef] [PubMed]
- Bakr, M.A.; Lee, S. Distributed Multisensor Data Fusion under Unknown Correlation and Data Inconsistency. Sensors 2017, 17, 2472. [Google Scholar] [CrossRef] [PubMed]
- Liu, B.; Zhan, X.; Zhu, Z.H. Multisensor Parallel Largest Ellipsoid Distributed Data Fusion with Unknown Cross-Covariances. Sensors 2017, 17, 1526. [Google Scholar] [CrossRef] [PubMed]
- Torbick, N.; Ledoux, L.; Salas, W.; Zhao, M. Regional Mapping of Plantation Extent Using Multisensor Imagery. Remote Sens. 2016, 8, 236. [Google Scholar] [CrossRef]
- Mehmood, A.; Nasrabadi, N.M. Wavelet-RX anomaly detection for dual-band forward-looking infrared imagery. Appl. Opt. 2010, 49, 4621–4632. [Google Scholar] [CrossRef] [PubMed]
- Wang, B.J.; Lu, G.; Bai, L.P.; Li, Q.; Liu, S.Q. A new small and dim targets detection and recognition algorithm based on infrared dual bands imaging system. Proc. SPIE 2011, 8193, 81933U. [Google Scholar]
- Zhou, J.W.; Li, J.C.; Shi, Z.G.; Lu, X.W.; Ren, D.W. Detection of dual-band infrared small target based on joint dynamic sparse representation. Proc. SPIE 2015, 9675, 96751C. [Google Scholar]
- Yang, K.H.; Ma, Y.H.; Guo, J.G.; Liu, Z. The comparison of single-band and dual-band infrared detection of small targets. Proc. SPIE 2016, 10156, 101560N. [Google Scholar]
- Yu, J.C.; Sun, S.L.; Chen, G.L. Automatic target detection in dual band infrared imagery. Proc. SPIE 2008, 6835, 68351L. [Google Scholar]
- Zeng, M.; Li, J.; Peng, Z. The design of top-hat morphological filter and application to infrared target detection. Infrared Phys. Technol. 2006, 48, 67–76. [Google Scholar] [CrossRef]
- Bai, X.Z.; Zhou, F.G.; Xue, B.D. Fusion of infrared and visual images through region extraction by using multi scale center-surround top-hat transform. Opt. Express 2011, 19, 8444–8457. [Google Scholar] [CrossRef] [PubMed]
- Wei, M.S.; Xing, F.; You, Z. A real-time detection and positioning method for small and weak targets using a 1D morphology-based approach in 2D images. Light Sci. Appl. 2018, 7, 18006. [Google Scholar] [CrossRef] [Green Version]
- Das, D.; Mukhopadhyay, S.; Praveen, S.R.S. Multi-scale contrast enhancement of oriented features in 2D images using directional morphology. Opt. Laser Technol. 2017, 87, 51–63. [Google Scholar] [CrossRef]
- Bai, X.Z.; Zhou, F.G.; Xue, B.D. Multiple linear feature detection based on multiple-structuring-element center-surround top-hat transform. Appl. Opt. 2012, 51, 5201–5211. [Google Scholar] [CrossRef] [PubMed]
- Bai, X.Z.; Zhou, F.G.; Xue, B.D. Image enhancement using multi scale image features extracted by top-hat transform. Opt. Laser Technol. 2012, 44, 328–336. [Google Scholar] [CrossRef]
- Ai, J.; Yang, X.; Zhou, F.; Dong, Z.; Jia, L.; Yan, H. A correlation-based joint CFAR detector using adaptively truncated statistics in SAR imagery. Sensors 2017, 17, 686. [Google Scholar] [CrossRef] [PubMed]
- Greidanus, H.; Alvarez, M.; Santamaria, C.; Thoorens, F.-X.; Kourti, N.; Argentieri, P. The SUMO ship detector algorithm for satellite radar images. Remote Sens. 2017, 9, 246. [Google Scholar] [CrossRef]
- Liu, S.T.; Zhou, X.D.; Shen, T.S.; Han, Y.L. Research on infrared-image denoising algorithm based on the noise analysis of the detector. Proc. SPIE 2005, 5640, 440–448. [Google Scholar]
- Li, X.; Ou, X.; Li, Z.; Wei, H.; Zhou, W.; Duan, Z. On-Line Temperature Estimation for Noisy Thermal Sensors Using a Smoothing Filter-Based Kalman Predictor. Sensors 2018, 18, 433. [Google Scholar] [Green Version]
- Cui, Z.; Yang, J.; Jiang, S.; Wei, C. Target detection algorithm based on two layers Human Visual System. Algorithms 2015, 8, 541–551. [Google Scholar] [CrossRef]
- Yuan, G.H.; Rogers, E.T.F.; Zheludev, N.I. Achromatic super-oscillatory lenses with sub-wavelength focusing. Light Sci. Appl. 2017, 6, e17036. [Google Scholar] [CrossRef]
- Li, Y.; Yong, B.; van Oosterom, P.; Lemmens, M.; Wu, H.; Ren, L.; Zheng, M.; Zhou, J. Airborne LiDAR Data Filtering Based on Geodesic Transformations of Mathematical Morphology. Remote Sens. 2017, 9, 1104. [Google Scholar] [CrossRef]
- Hui, Z.; Hu, Y.; Yevenyo, Y.Z.; Yu, X. An Improved Morphological Algorithm for Filtering Airborne LiDAR Point Cloud Based on Multi-Level Kriging Interpolation. Remote Sens. 2016, 8, 35. [Google Scholar] [CrossRef]
- Wang, J.; Cheng, W.; Luo, W.; Zheng, X.; Zhou, C. An Iterative Black Top Hat Transform Algorithm for the Volume Estimation of Lunar Impact Craters. Remote Sens. 2017, 9, 952. [Google Scholar] [CrossRef]
- Page, G.A.; Carroll, B.D.; Prrat, A.; Randall, P.N. Long-range target detection algorithms for infrared search and track. Proc. SPIE 1999, 3698, 48–57. [Google Scholar]
- Zhang, C.; Li, L.; Wang, Y. A Particle Filter Track-Before-Detect Algorithm Based on Hybrid Differential Evolution. Algorithms 2015, 8, 965–981. [Google Scholar] [CrossRef] [Green Version]
Figure 1.
The relation curve of probability of detection and SNR under the common probabilities of false alarm.
Figure 1.
The relation curve of probability of detection and SNR under the common probabilities of false alarm.

Figure 2.
The simulation curve of the fused probability of detection via TNR1 under the assumption of SNR1 = 3, SNR2 = 4.
Figure 2.
The simulation curve of the fused probability of detection via TNR1 under the assumption of SNR1 = 3, SNR2 = 4.

Figure 3.
The comparable curves of probability of detection for single-band and dual-band models.

Figure 4.
Comparison of the probability of detection between single-band and dual-band models. When the probability of false alarm is 10−3, the curves of probability of detection and TNR via the SNR of Ch2 are shown in (a,b); when the probability of false alarm is 10−4, the curves of probability of detection and TNR via the SNR of Ch2 are shown in (c,d); when the probability of false alarm is 10−5, the curves of probability of detection and TNR via the SNR of Ch2 are shown in (e,f). When the probability of false alarm is 10−6, the curves of probability of detection and TNR via the SNR of Ch2 are shown in (g,h).


Figure 5.
The surfaces of dual-band probability of detection vas the SNRs of two channels. The three-dimensional surface is shown in (a); and (b) is its overlook map.
Figure 5.
The surfaces of dual-band probability of detection vas the SNRs of two channels. The three-dimensional surface is shown in (a); and (b) is its overlook map.

Figure 6.
Typical morphological information of the point target. The gray value has been normalized to [0, 1], and the point target’s central pixel has been marked with a cross.
Figure 6.
Typical morphological information of the point target. The gray value has been normalized to [0, 1], and the point target’s central pixel has been marked with a cross.

Figure 7.
Omnidirectional structural elements, including of 0° direction, of 45° direction, of 90° direction, of 135° direction, of 180° direction, of 225° direction, of 270° direction, and of 315° direction. “1” and “0” are the basic binary morphological operators.
Figure 7.
Omnidirectional structural elements, including of 0° direction, of 45° direction, of 90° direction, of 135° direction, of 180° direction, of 225° direction, of 270° direction, and of 315° direction. “1” and “0” are the basic binary morphological operators.

Figure 8.
Sketch map of four directional vectors (m = 1, 2, 3, 4). Pixels in different locations are distinguished by different colors.
Figure 8.
Sketch map of four directional vectors (m = 1, 2, 3, 4). Pixels in different locations are distinguished by different colors.

Figure 9.
The flow chart of the fusion decision of dual-band thresholds.

Figure 10.
Experimental equipment including MWIR and LWIR detectors, focusing device, and spectroscope.
Figure 10.
Experimental equipment including MWIR and LWIR detectors, focusing device, and spectroscope.

Figure 11.
Original target images under the building background: (a) target image captured by MWIR detector; and (b) target image captured by LWIR detector.
Figure 11.
Original target images under the building background: (a) target image captured by MWIR detector; and (b) target image captured by LWIR detector.

Figure 12.
Results of background suppression containing omnidirectional morphological filtering and local difference criterion: (a) result of MWIR image and (b) result of LWIR image.
Figure 12.
Results of background suppression containing omnidirectional morphological filtering and local difference criterion: (a) result of MWIR image and (b) result of LWIR image.

Figure 13.
Results of the CFAR threshold iteration: (a) result of MWIR image; (b) result of LWIR image; (c) result of point target detection; (d,e) are the enlarged areas of the detected point target in MWIR and LWIR images.
Figure 13.
Results of the CFAR threshold iteration: (a) result of MWIR image; (b) result of LWIR image; (c) result of point target detection; (d,e) are the enlarged areas of the detected point target in MWIR and LWIR images.

Figure 14.
Indicator diagram provided by ADS-B receiver. The location of the acquisition device is Changchun, China, which is marked with a red cross. The infrared equipment faces the South, and there is a South-North course ahead where the aircrafts arriving at and leaving Changchun Longjia International Airport can be detected.

Figure 15.
Detection results of complex cloud background: (a,b) are original MWIR and LWIR images; (c,d) are results of the background suppression of (a,b); (e,f) are results of the CFAR threshold iteration of (c,d); (g) is the result of fused point target detection; (h,i) are the enlarged areas of the detected point target in MWIR and LWIR images.

Figure 16.
The curve of the SNR of point target in MWIR and LWIR images detected by the proposed algorithm.
Figure 16.
The curve of the SNR of point target in MWIR and LWIR images detected by the proposed algorithm.

Figure 17.
Detection results of point target with the larger SNR: (a,d) are original MWIR and LWIR images; (b,e) are results of the background suppression of (a,d); (c,f) are results of the CFAR threshold iteration of (b,e); (g) result of fused point target detection; (h,i) are the enlarged areas of the detected point target in MWIR and LWIR images.

Figure 18.
Three typical frames of a point target, including the sky background, cloud background, and buildings: (a) original image; (b) result of traditional Top-hat; (c) result of DoG; (d) result of BM3D; (e) result of GMM; and (f) result of the proposed algorithm.
Figure 18.
Three typical frames of a point target, including the sky background, cloud background, and buildings: (a) original image; (b) result of traditional Top-hat; (c) result of DoG; (d) result of BM3D; (e) result of GMM; and (f) result of the proposed algorithm.

Figure 19.
Comparable results: (a) the relation curve of probability of detection via SNR; (b) the relation curve of probability of false alarm via SNR; and (c) the relation curve of FoM via SNR.
Figure 19.
Comparable results: (a) the relation curve of probability of detection via SNR; (b) the relation curve of probability of false alarm via SNR; and (c) the relation curve of FoM via SNR.

Figure 20.
The local neighborhood images of the one false alarm extracted by the proposed algorithm: (a,b) are the MWIR and LWIR images; and (c,d) are the corresponding three-dimensional gray-scale maps of (a,b).
Figure 20.
The local neighborhood images of the one false alarm extracted by the proposed algorithm: (a,b) are the MWIR and LWIR images; and (c,d) are the corresponding three-dimensional gray-scale maps of (a,b).


Table 1.
The results of single-band and dual-band contrast.
| Group | Channel | SNR of Channel | Single-Band Probability of Detection | Optimal Fused Probability of Detection | Probability of Detection of Each Channel after Fusion |
|---|---|---|---|---|---|
| 1 | Ch 1 | 3 | 0.2361 | 0.3553 | 0.4882 |
| Ch 2 | 2 | 0.0428 | 0.7278 | ||
| 2 | Ch 1 | 3 | 0.2361 | 0.5621 | 0.7497 |
| Ch 2 | 3 | 0.2361 | 0.7497 | ||
| 3 | Ch 1 | 3 | 0.2361 | 0.7931 | 0.9201 |
| Ch 2 | 4 | 0.6106 | 0.8620 | ||
| 4 | Ch 1 | 3 | 0.2361 | 0.9416 | 0.9851 |
| Ch 2 | 5 | 0.8999 | 0.9558 | ||
| 5 | Ch 1 | 4 | 0.6106 | 0.9740 | 0.9899 |
| Ch 2 | 5 | 0.8999 | 0.9839 | ||
| 6 | Ch 1 | 4 | 0.6106 | 0.9959 | 0.9989 |
| Ch 2 | 6 | 0.9887 | 0.9971 |
Table 2.
Specific information regarding the extracted point target in two channels.
| Channel | Target Coordinate | SNR | Local STD |
|---|---|---|---|
| MWIR | (255, 323) | 3.56 | 2.45 |
| LWIR | (254, 322) | 3.02 | 2.88 |
Table 3.
Specific information regarding the extracted point target in two channels.
| Channel | Target Coordinate | SNR | Local STD |
|---|---|---|---|
| MWIR | (254, 205) | 3.03 | 3.21 |
| LWIR | (255, 207) | 4.12 | 2.88 |
Table 4.
Comparison of the five algorithms based on the proposed dual-band model.
| Method | /% | /% | FoM/% | Running Time/s |
|---|---|---|---|---|
| Traditional Top-hat | 83.27 | 6.77 | 69.21 | 0.39 |
| DoG | 87.27 | 5.18 | 75.53 | 0.83 |
| BM3D | 97.40 | 0.86 | 94.95 | 5.24 |
| GMM | 95.53 | 2.41 | 89.09 | 4.92 |
| Proposed method | 99.13 | 0.07 | 98.92 | 0.46 |
© 2018 by the authors. Licensee MDPI, Basel, Switzerland. This article is an open access article distributed under the terms and conditions of the Creative Commons Attribution (CC BY) license (http://creativecommons.org/licenses/by/4.0/).
Share and Cite
MDPI and ACS Style
Liu, R.; Wang, D.; Jia, P.; Sun, H. An Omnidirectional Morphological Method for Aerial Point Target Detection Based on Infrared Dual-Band Model. Remote Sens. 2018, 10, 1054. https://0-doi-org.brum.beds.ac.uk/10.3390/rs10071054
AMA Style
Liu R, Wang D, Jia P, Sun H. An Omnidirectional Morphological Method for Aerial Point Target Detection Based on Infrared Dual-Band Model. Remote Sensing. 2018; 10(7):1054. https://0-doi-org.brum.beds.ac.uk/10.3390/rs10071054
Chicago/Turabian StyleLiu, Rang, Dejiang Wang, Ping Jia, and He Sun. 2018. "An Omnidirectional Morphological Method for Aerial Point Target Detection Based on Infrared Dual-Band Model" Remote Sensing 10, no. 7: 1054. https://0-doi-org.brum.beds.ac.uk/10.3390/rs10071054
Note that from the first issue of 2016, this journal uses article numbers instead of page numbers. See further details here.