Decision Fusion of D-InSAR and Pixel Offset Tracking for Coal Mining Deformation Monitoring


1
Key Laboratory for Land Environment and Disaster Monitoring of NASG, China University of Mining and Technology, Xuzhou 221116, China
2
Department of Electrical and Computer Engineering, Mississippi State University, Starkville, MS 39762, USA
3
The Second Surveying and Mapping Institute of Hebei, Shijiazhuang 050037, China
*
Authors to whom correspondence should be addressed.
Remote Sens. 2018, 10(7), 1055; https://0-doi-org.brum.beds.ac.uk/10.3390/rs10071055
Submission received: 5 June 2018
/
Revised: 21 June 2018
/
Accepted: 25 June 2018
/
Published: 4 July 2018
(This article belongs to the Special Issue Remote Sensing of Land Subsidence)
Abstract
:Ground surface subsidence is a universal phenomenon in coal mining areas which can cause serious damage to the surrounding environment. In this paper, we consider the use of differential interferometric synthetic aperture radar (D-InSAR), multi-temporal InSAR (MT-InSAR), and the pixel offset tracking technique to monitor the surface deformation of a coal mining area. In this study, we use the two-pass D-InSAR method to generate 19 interferometric image pairs from 20 TerraSAR-X SpotLight images. The results show that D-InSAR can be used to obtain high accuracy surface deformation in the mining areas where there is no high gradient deformation, and the pixel offset tracking method offers advantages in those areas where high gradient deformation is found, but its performance is not stable. This means that the unilateral use of these technologies cannot obtain reliable subsidence information in mining areas. Therefore, it is essential to find a new way to integrate the respective advantages of these different methods. In this paper, a new fusion method combining the D-InSAR result with the offset tracking result based on a spatial decorrelation distribution map is proposed to obtain the subsidence results in a mining area. To ensure the reliability of the results, a decision rule is proposed for the spatial decorrelation distribution map, which is generated manually by union analysis in ArcGIS. In the experiments, the mean absolute error of the fusion result is 0.0748 m, while that of D-InSAR is 0.1890 m, and that of offset tracking is 0.1358 m. It is therefore clear that the proposed fusion method is more reliable and more accurate than the use of individual methods, and it may be able to serve as a reference in mining subsidence monitoring.
1. Introduction
China, one of the largest coal producing and consuming countries, has many coal mines. Land subsidence caused by coal mining activities can lead to surface collapse and water accumulation. It can also result in ground cracking and damage to infrastructures and buildings and can endanger the safety of human life and property [1]. Therefore, it is necessary to monitor the dynamics of the ground surface in coal mining areas in order to provide useful information for mining subsidence management.
At present, the conventional precision leveling, global navigation satellite system (GNSS) measurement and the subsequently developed differential interferometric synthetic aperture radar (D-InSAR) techniques are commonly used in ground surface deformation monitoring [2,3]. Compared with GNSS and leveling, D-InSAR can provide unparalleled resolution and large-scale ground displacements [4,5]. Therefore, it is widely used in topographic mapping [6,7], volcanic hazard monitoring [8,9], seismic activity monitoring [10], landslip monitoring [11], and mining subsidence monitoring [12,13]. In particular, in mining areas, InSAR is commonly applied to monitor both the residual subsidence and the surface subsidence caused during the mining process [12,14]. However, with the rapid development of SAR satellite technology and the expansion of its application field, it is becoming more and more difficult to satisfy the requirements of surface deformation monitoring with conventional D-InSAR techniques. In mining areas, surface deformation is generally characterized by complex nonlinear behavior, with a large amount of subsidence taking place within a short period of time [15]. As a result, it is difficult to obtain a satisfactory result with conventional D-InSAR techniques in the presence of the phase decorrelation caused by the high gradient deformation and vegetation change [16,17]. Multi-temporal InSAR (MT-InSAR) techniques, such as persistent scatterer InSAR (PS-InSAR) [18] and small baseline subset InSAR (SBAS-InSAR) [19], have been developed to overcome the limitation caused by spatio-temporal decorrelation between SAR acquisitions and serious atmospheric artifacts [20] and have rapidly become the most popular approaches for the monitoring of surface deformation. However, the MT-InSAR techniques cannot work when the deformation in the mining area exceeds the limit of the phase measurement [21].
In addition to the interferometric phase, coherence and the SAR image amplitude information can also be used to obtain surface displacements via pixel offset tracking [22,23]. Pixel offset tracking is a useful method which involves calculating the pixel offset at the same position from two images to extract the deformation. There is no need for unwrapping, and it is less affected by decorrelation [19]. Moreover, this technique can extract the deformation information in both the slant-range and flight directions. As a result, it has been widely used in glacier movement studies [24,25,26,27] and landslide monitoring [28,29]. Furthermore, the newly developed SAR amplitude pixel-offset SBAS technique has been applied to large displacements and has obtained a good monitoring accuracy [30,31]. The pixel offset tracking can estimate high gradient deformation, but if slow deformation occurs, its accuracy is much less than that of InSAR [32].
As mentioned above, there are many different methods based on SAR images that can be used to estimate ground deformation in mining areas. We believe that it is necessary to fuse the results obtained by the different methods, since the different methods each have their own respective advantages. Fusion methods, such as the fusion of D-InSAR and GPS [33,34] and the fusion of D-InSAR and sub-pixel image correlation measurements [35], have been applied to surface subsidence monitoring. However, these methods do not consider the spatial distribution of the decorrelation. Therefore, in this paper, we propose a new fusion method that makes full use of the InSAR and offset tracking techniques and the spatial distribution of the decorrelation. The D-InSAR and MT-InSAR techniques are adopted to detect long-term ground deformation, while the pixel offset tracking method is used to map the high gradient deformation. The final results are obtained using decision fusion to obtain the full picture of the ground deformation in the coal mining area. The Cuijiazhai mining area, in which InSAR and offset tracking have been rarely applied, was selected as our study area.
2. Study Area and Datasets
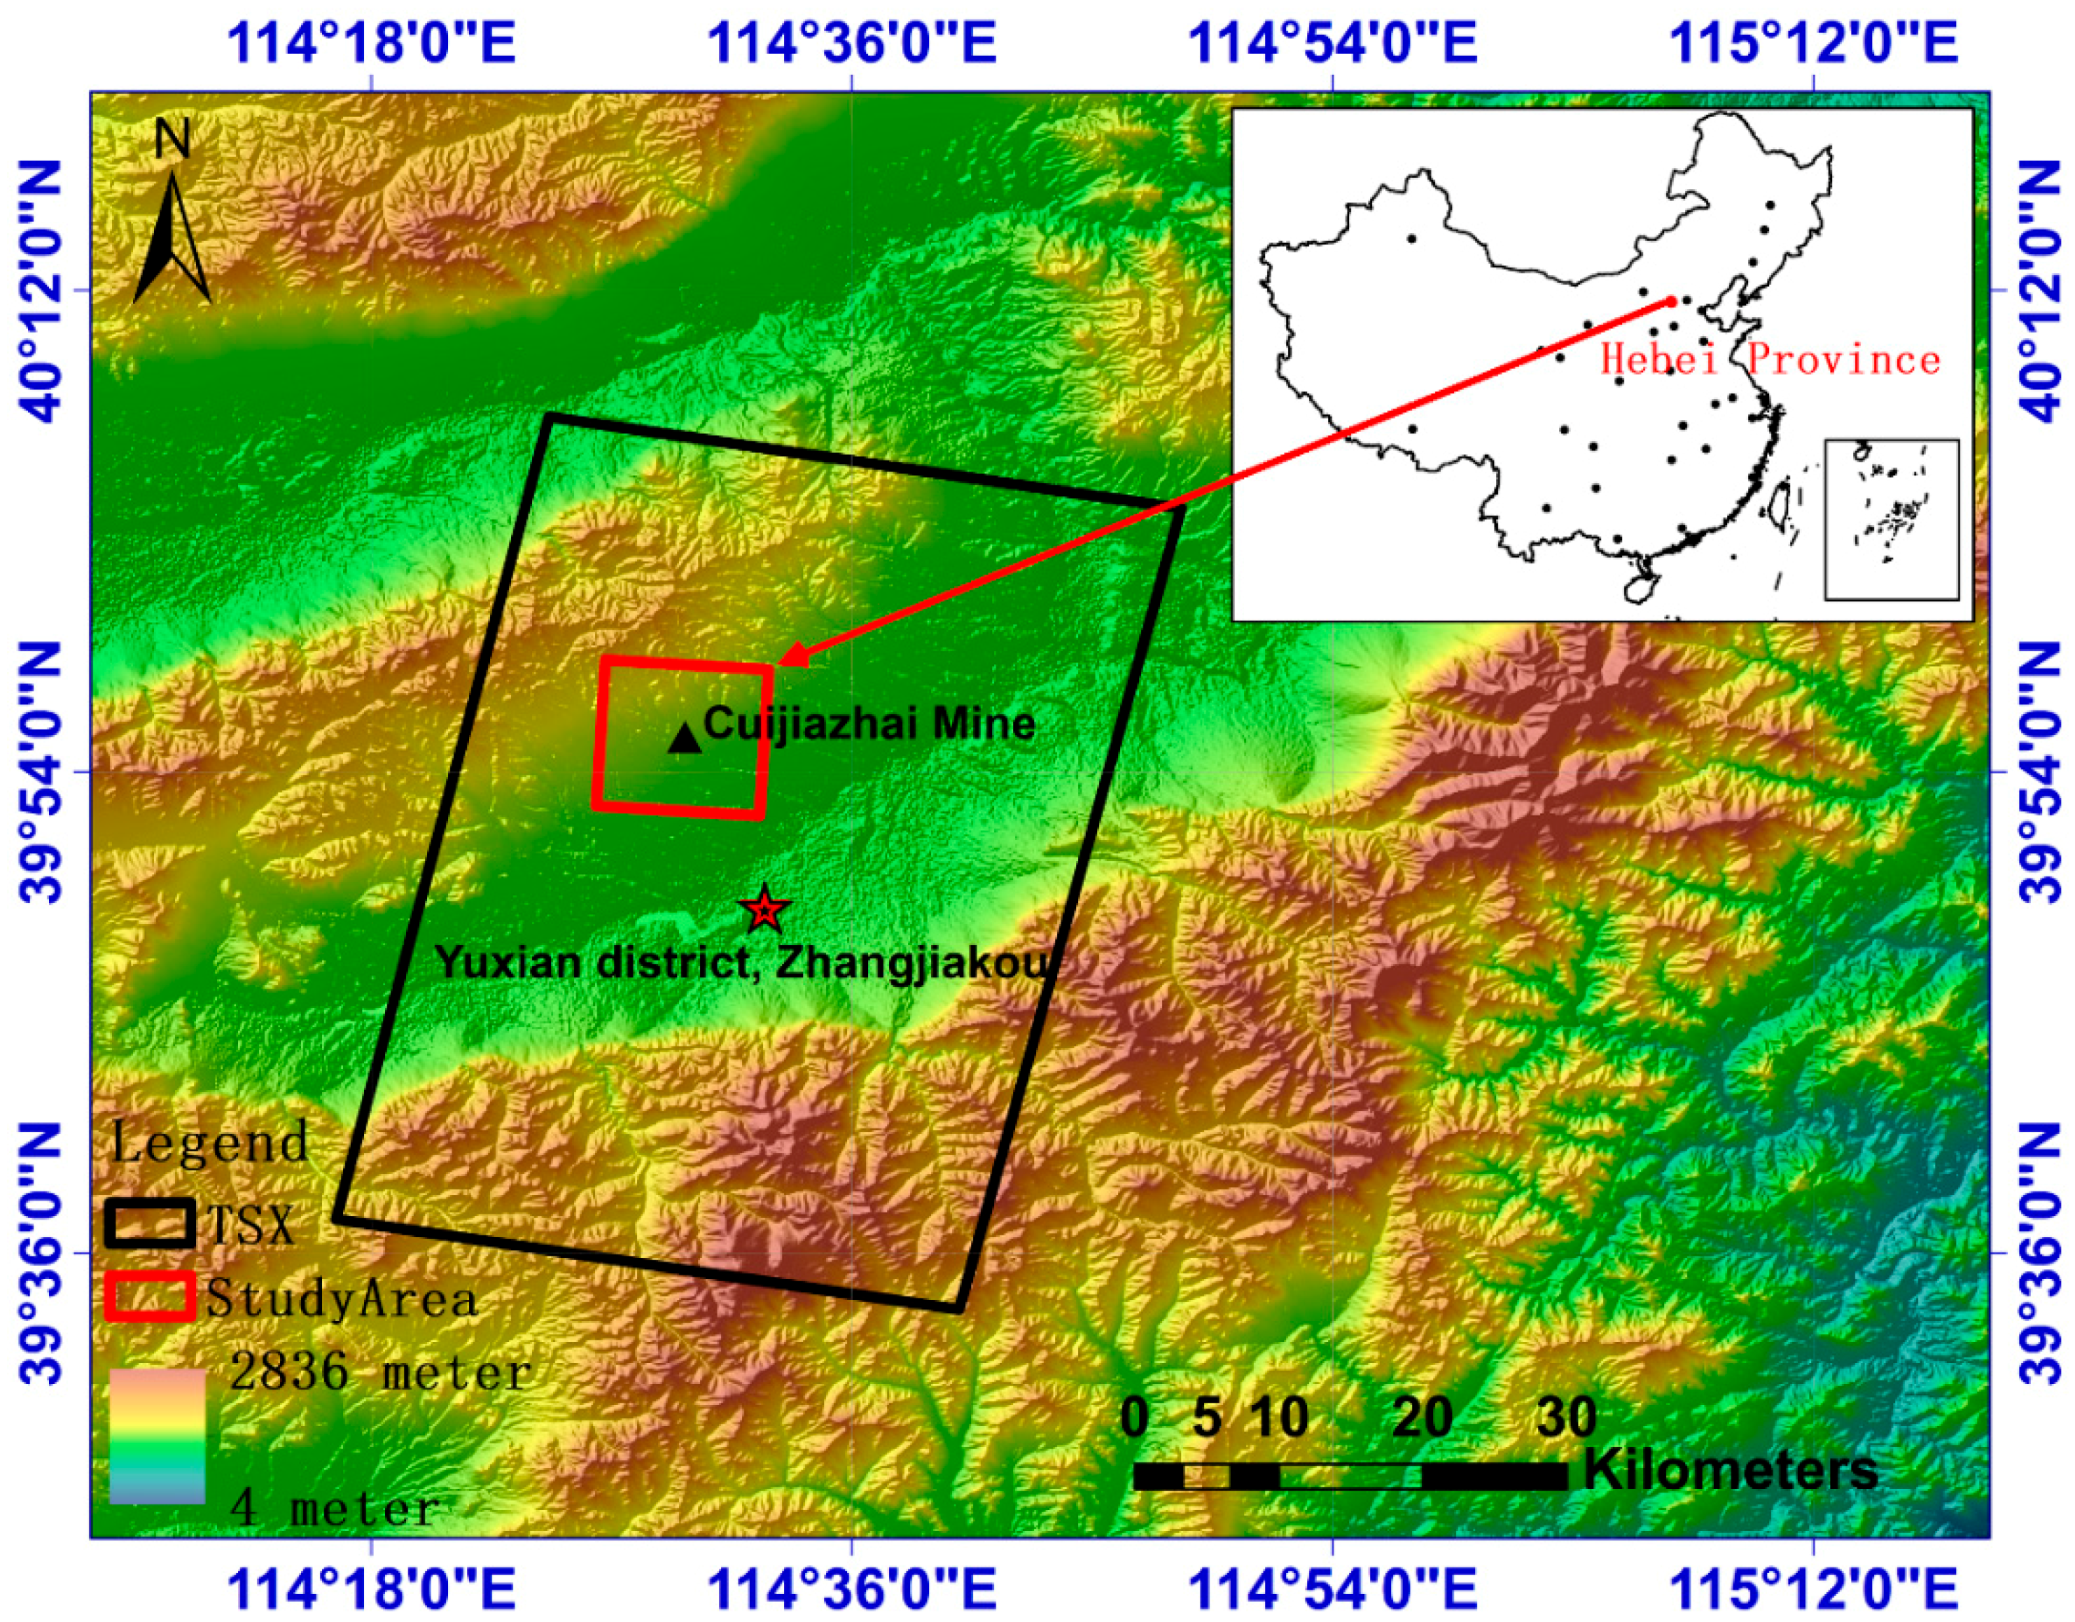
Yuxian district in the city of Zhangjiakou, located in the northwest of Hebei province, China, is one of the largest coal mining areas in Northern China. Cuijiazhai mine was built in October 1996 and covers an area of 34.2 km2. It has an annual production capacity of 1.8 million tons and a predicted 84.3 years of service life. Our study area covers the Cuijiazhai mine. The geographical coordinates of the study area are 114°27′28′′E–114°31′57′′E, 39°53′42′′N–39°57′20′′N, covering about 45 km2 (see Figure 1).
The impact of mining activities on the surface environment is mainly manifested in ground fissures, subsidence, and even, collapse. In our study area, both people and livestock face the risk of falling into ground fissures. In addition, some people are still residents in the area, and only a few of the house walls are built from reinforced concrete. This means that there is a significant risk of wall cracking due to the uneven surface subsidence. To date, the surface subsidence situation in this study area has not been fully investigated. For human life and property safety, there is an urgent need to introduce InSAR technology to monitor the surface subsidence information in this area.
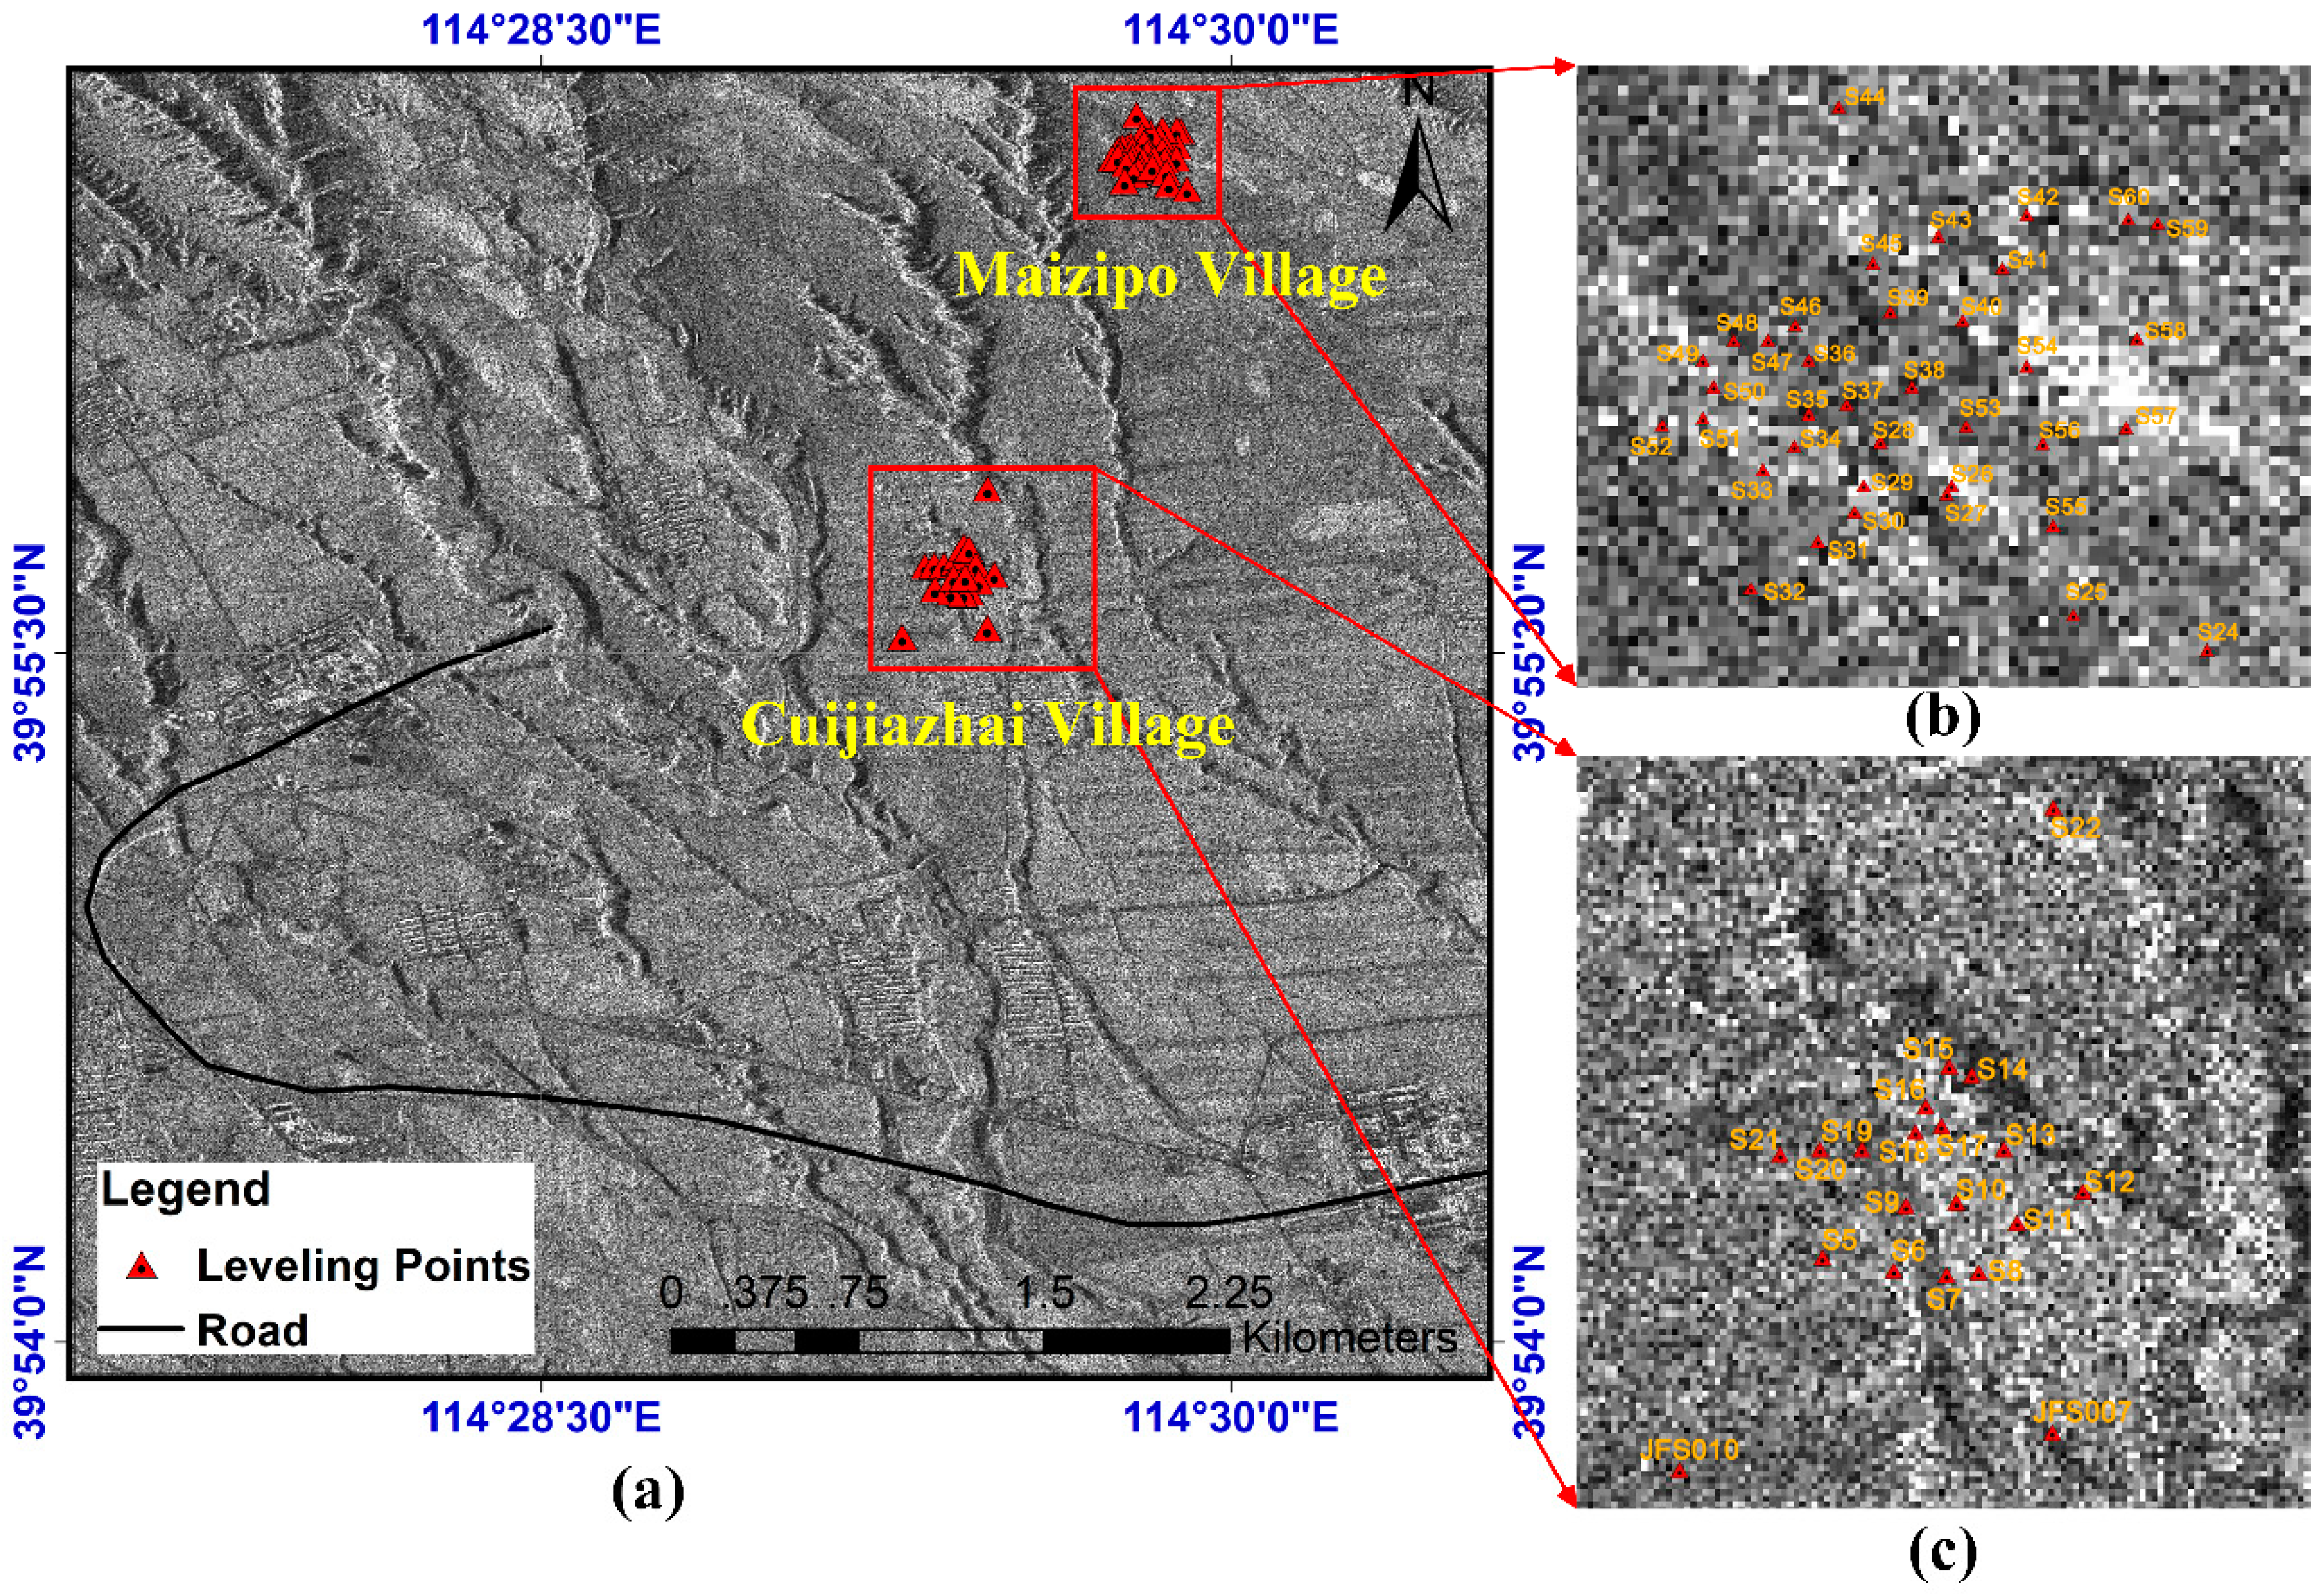
A total of 20 commissioned TerraSAR-X (TSX) SpotLight SAR images acquired from 09 June 2015 to 04 January 2016 were used in this study (see Table 1). Compared to other SAR satellites, TSX has an 11-day revisit period, which can be used to increase the frequency of surface subsidence monitoring. In addition, the high quality and high resolution data acquired by the TSX satellite make it possible to better analyze the spatial and temporal changes of surface subsidence over a short time period. Meanwhile, ground level measurements were also recorded, using a total of 63 ground leveling points (see Figure 2a).
3. Methodology
3.1. Monitoring Surface Deformation Using D-InSAR
The standard two-pass D-InSAR procedure was performed using GAMMA software. Firstly, 19 interferometric imaging pairs were formed from adjacent SAR images with a time interval of 11 days (see Table 2), making it possible to detect more precise information and to reduce the decorrelation caused by vegetation change. More importantly, the subsidence in the study area can reach approximately 20 cm in 11 days, which exceeds the maximum detectable deformation gradient of InSAR [36]. Thus, we selected the minimum possible time interval to reduce the effect of decorrelation. All the perpendicular baselines of the 19 interferometric imaging pairs were less than 250 m (see Table 2). Secondly, due to the high rate of subsidence in local mining areas, which can lower the accuracy, a multi-look operation was not performed. The offset polynomials were calculated for the image co-registration. The terrain phase error was removed using the Shuttle Radar Topography Mission (SRTM) V4 DEM whose resolution is 90 m. The minimum cost flow (MCF) algorithm was then used for phase unwrapping. Finally, the deformation was obtained after having removed the global error caused by the selection of the unwrapping reference points. In total, 19 continuous interferograms were consequently generated from the 20 TSX Spotlight SAR images.
3.2. Monitoring Surface Deformation Using MT-InSAR Methods
The Stanford Method for Persistent Scatterers (StaMPS) software package was used to obtain the ground deformation map for the mining area [37]. StaMPS is based on a spatio-temporal correlation analysis of interferograms to detect the PS points and extract the deformation. The spatio-temporal behaviors of the interferometric phases are different for different components of the signal. For example, the atmospheric effect is spatially correlated, but not temporally, except for the seasonal atmospheric delay. The noise information is found in the high frequency component in both the temporal and spatial distributions. StaMPS uses these features to separate atmospheric errors through temporal and spatial filtering [38]. One of the core methods of StaMPS is three-dimensional phase unwrapping. This involves the application of spatial filtering to the candidate PS points and the calculation of the temporal coherence stability values of the candidate points. The coherent points with extremely low frequencies in the spatial range are finally selected according to the stable probability density function of the temporal phase. This effectively reduces the phase gradient change and the phase unwrapping error [39,40].
In the PS experiment, the image obtained on 27 September 2015 was selected using Next ESA SAR Toolbox (NEST) software to be the optimal master of the 20 TSX SAR images. In the SBAS experiment, the coherence parameter was set to 0.4, since the study area is located in a rural area. The maximum temporal baseline was set to 33 days, and the maximum perpendicular baseline was set to 200 m to avoid decorrelation.
3.3. Monitoring Surface Deformation Using Offset Tracking
In general, high-accuracy slow deformation can, in many cases, be obtained by the InSAR technique. However, for high-gradient deformation areas, such as mining areas, the performance of the InSAR technique is usually affected by the phase decorrelation caused by excessive deformation [41]. Therefore, we adopted the pixel offset tracking technique to obtain the subsidence in the high-gradient deformation areas [42]. The initial offset was first obtained by coarse registration. Fine co-registration was then performed on the basis of the coarse registration by selecting a search window and calculating the normalized cross-correlation coefficient [43]. The exact sub-pixel offset was obtained when the cross-correlation coefficient was at its maximum. An oversampling operation was used to obtain the sub-pixel offset.
Since the study area is relatively flat and there are many farming areas, it was difficult to obtain the desired deformation when using the offset tracking technique based on coherence. Therefore, the pixel offset tracking technique based on intensity was used because the intensity information is more stable than the phase information in SAR images.
Considering the terrain fluctuation error, a small perpendicular baseline imaging pair was first chosen for the pixel offset tracking experiments. We selected the images from 20 June 2015 and 24 December 2015 which had a small baseline. The basic parameters are listed in Table 3. In order to reduce the time consumption, a 3000 × 3000 pixel image of the study area was selected. The optimal parameter settings were established through numerous offset tracking experiments. The search window was set to 128 × 128, the oversampling factor was set to 4, and the step factor was set as 1. Although the image was not large, the processing was time consuming. Deformation values of greater than 2.5 m were replaced with blank values, in accordance with prior information.
3.4. Decision Fusion
As the deformation in mining areas is relatively large, the problem of how to obtain a more reliable result needs to be solved. The measurements derived from the MT-InSAR method lack coherence in high gradient deformation areas, so MT-InSAR was not incorporated into the fusion process. Interferometric fringes were vectored to identify the decorrelation area, which made the fusion of D-InSAR and the pixel offset tracking method a more reliable approach.
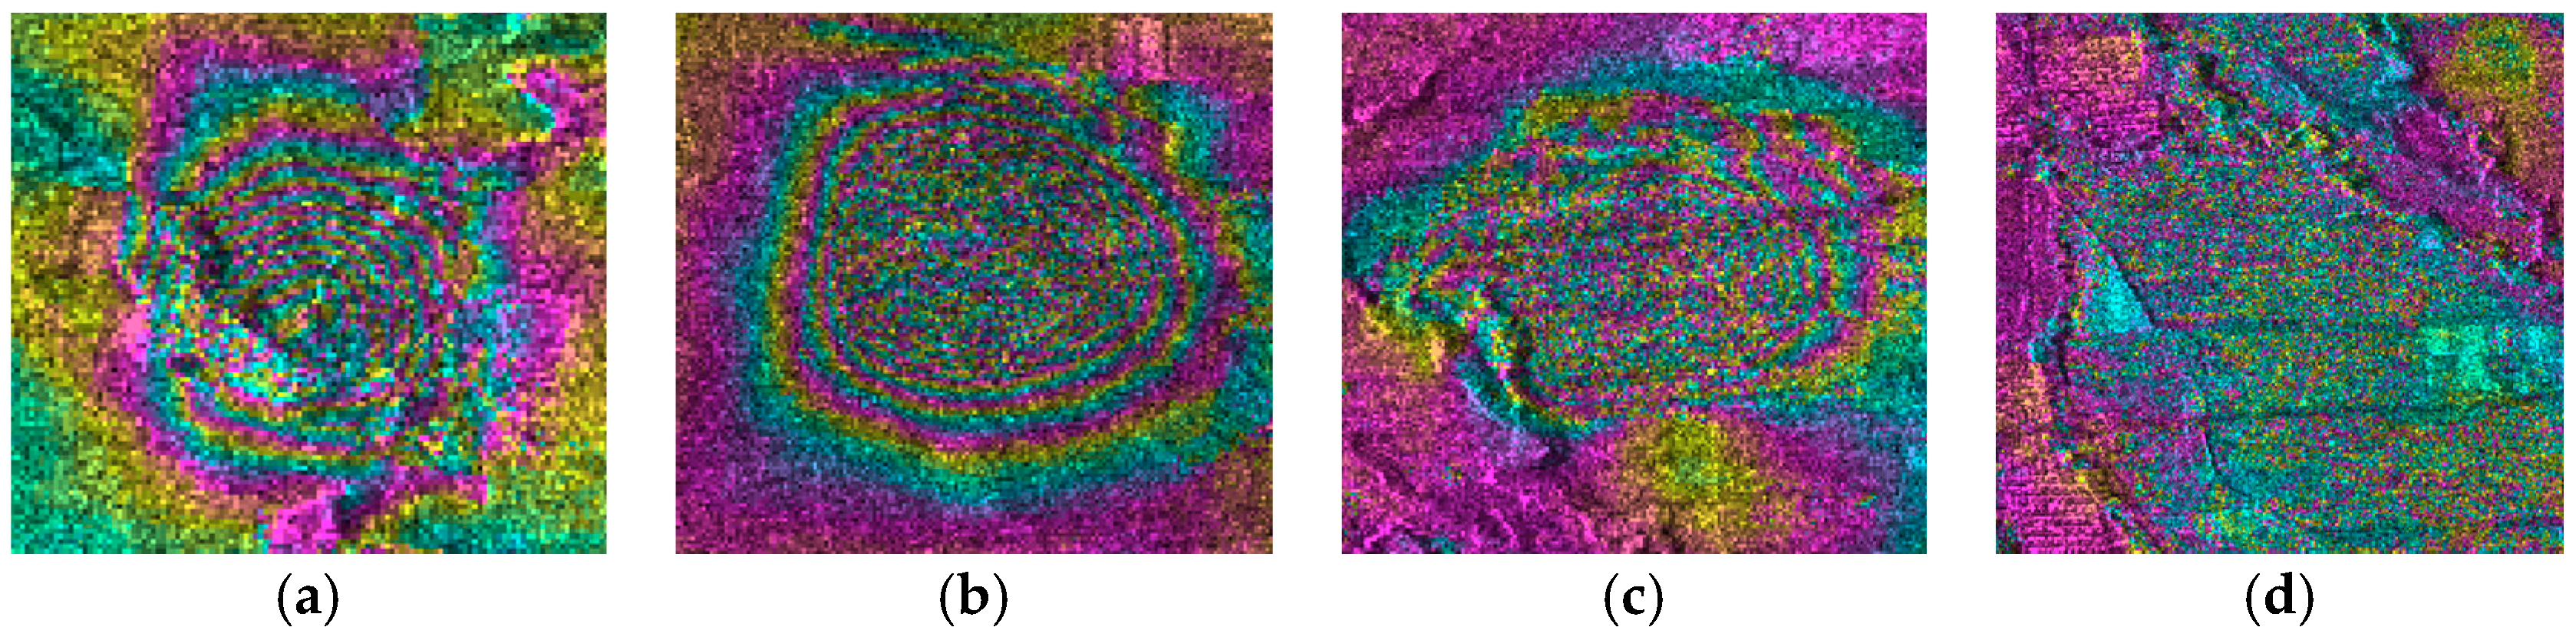
Firstly, the interferograms were vectored into a single spatial decorrelation distribution map, and different values were assigned to the regions of different coherence. A zero value indicated great coherence, a value of one indicated slight decorrelation, a value of two indicated serious decorrelation, a value of three indicated very serious decorrelation, and a value of four indicated total decorrelation (see Figure 3). In practice, the corresponding value can be adjusted according to the situation. For example, when considering the decorrelation due to the atmosphere effect, the value can be reduced. Secondly, union analysis was applied to generate the spatial decorrelation distribution map.
Next, the spatial decorrelation distribution map was combined with the D-InSAR results and the pixel offset tracking results. To ensure the reliability of the results, the decision rule was designed as follows:
where A is the result of the D-InSAR method, B is the result of the offset tracking method, and C is the value of the spatial decorrelation distribution map. Specific cases were as follows:
- (a)
- The pixel offset tracking result was 0 because of low coherence, so we used the D-InSAR result directly.
- (b)
- If the value of was less than or equal to 3, then it was directly assigned to the D-InSAR results because its result has higher accuracy.
- (c)
- If the value of was greater than 8 (in order to ensure reliability, we took the maximum of one-quarter for the breakpoint) and its pixel offset tracking value was less than the minimum subsidence of the D-InSAR result, then the fusion output was the pixel offset tracking result, . In the case of large-scale deformation, the pixel offset tracking method provided better performance.
- (d)
- If the pixel offset tracking result was positive while the D-InSAR result was negative, then the D-InSAR result was used because, in this case, most of the mining area is subsiding. In addition, since the accuracy of the D-InSAR result is higher, when its value was less than the offset tracking result, we used the D-InSAR result.
- (e)
- For the remaining cases, since both the D-InSAR and offset tracking methods produce low accuracies, a proportional combination needed to be calculated.
4. Results
4.1. Results of the D-InSAR Method
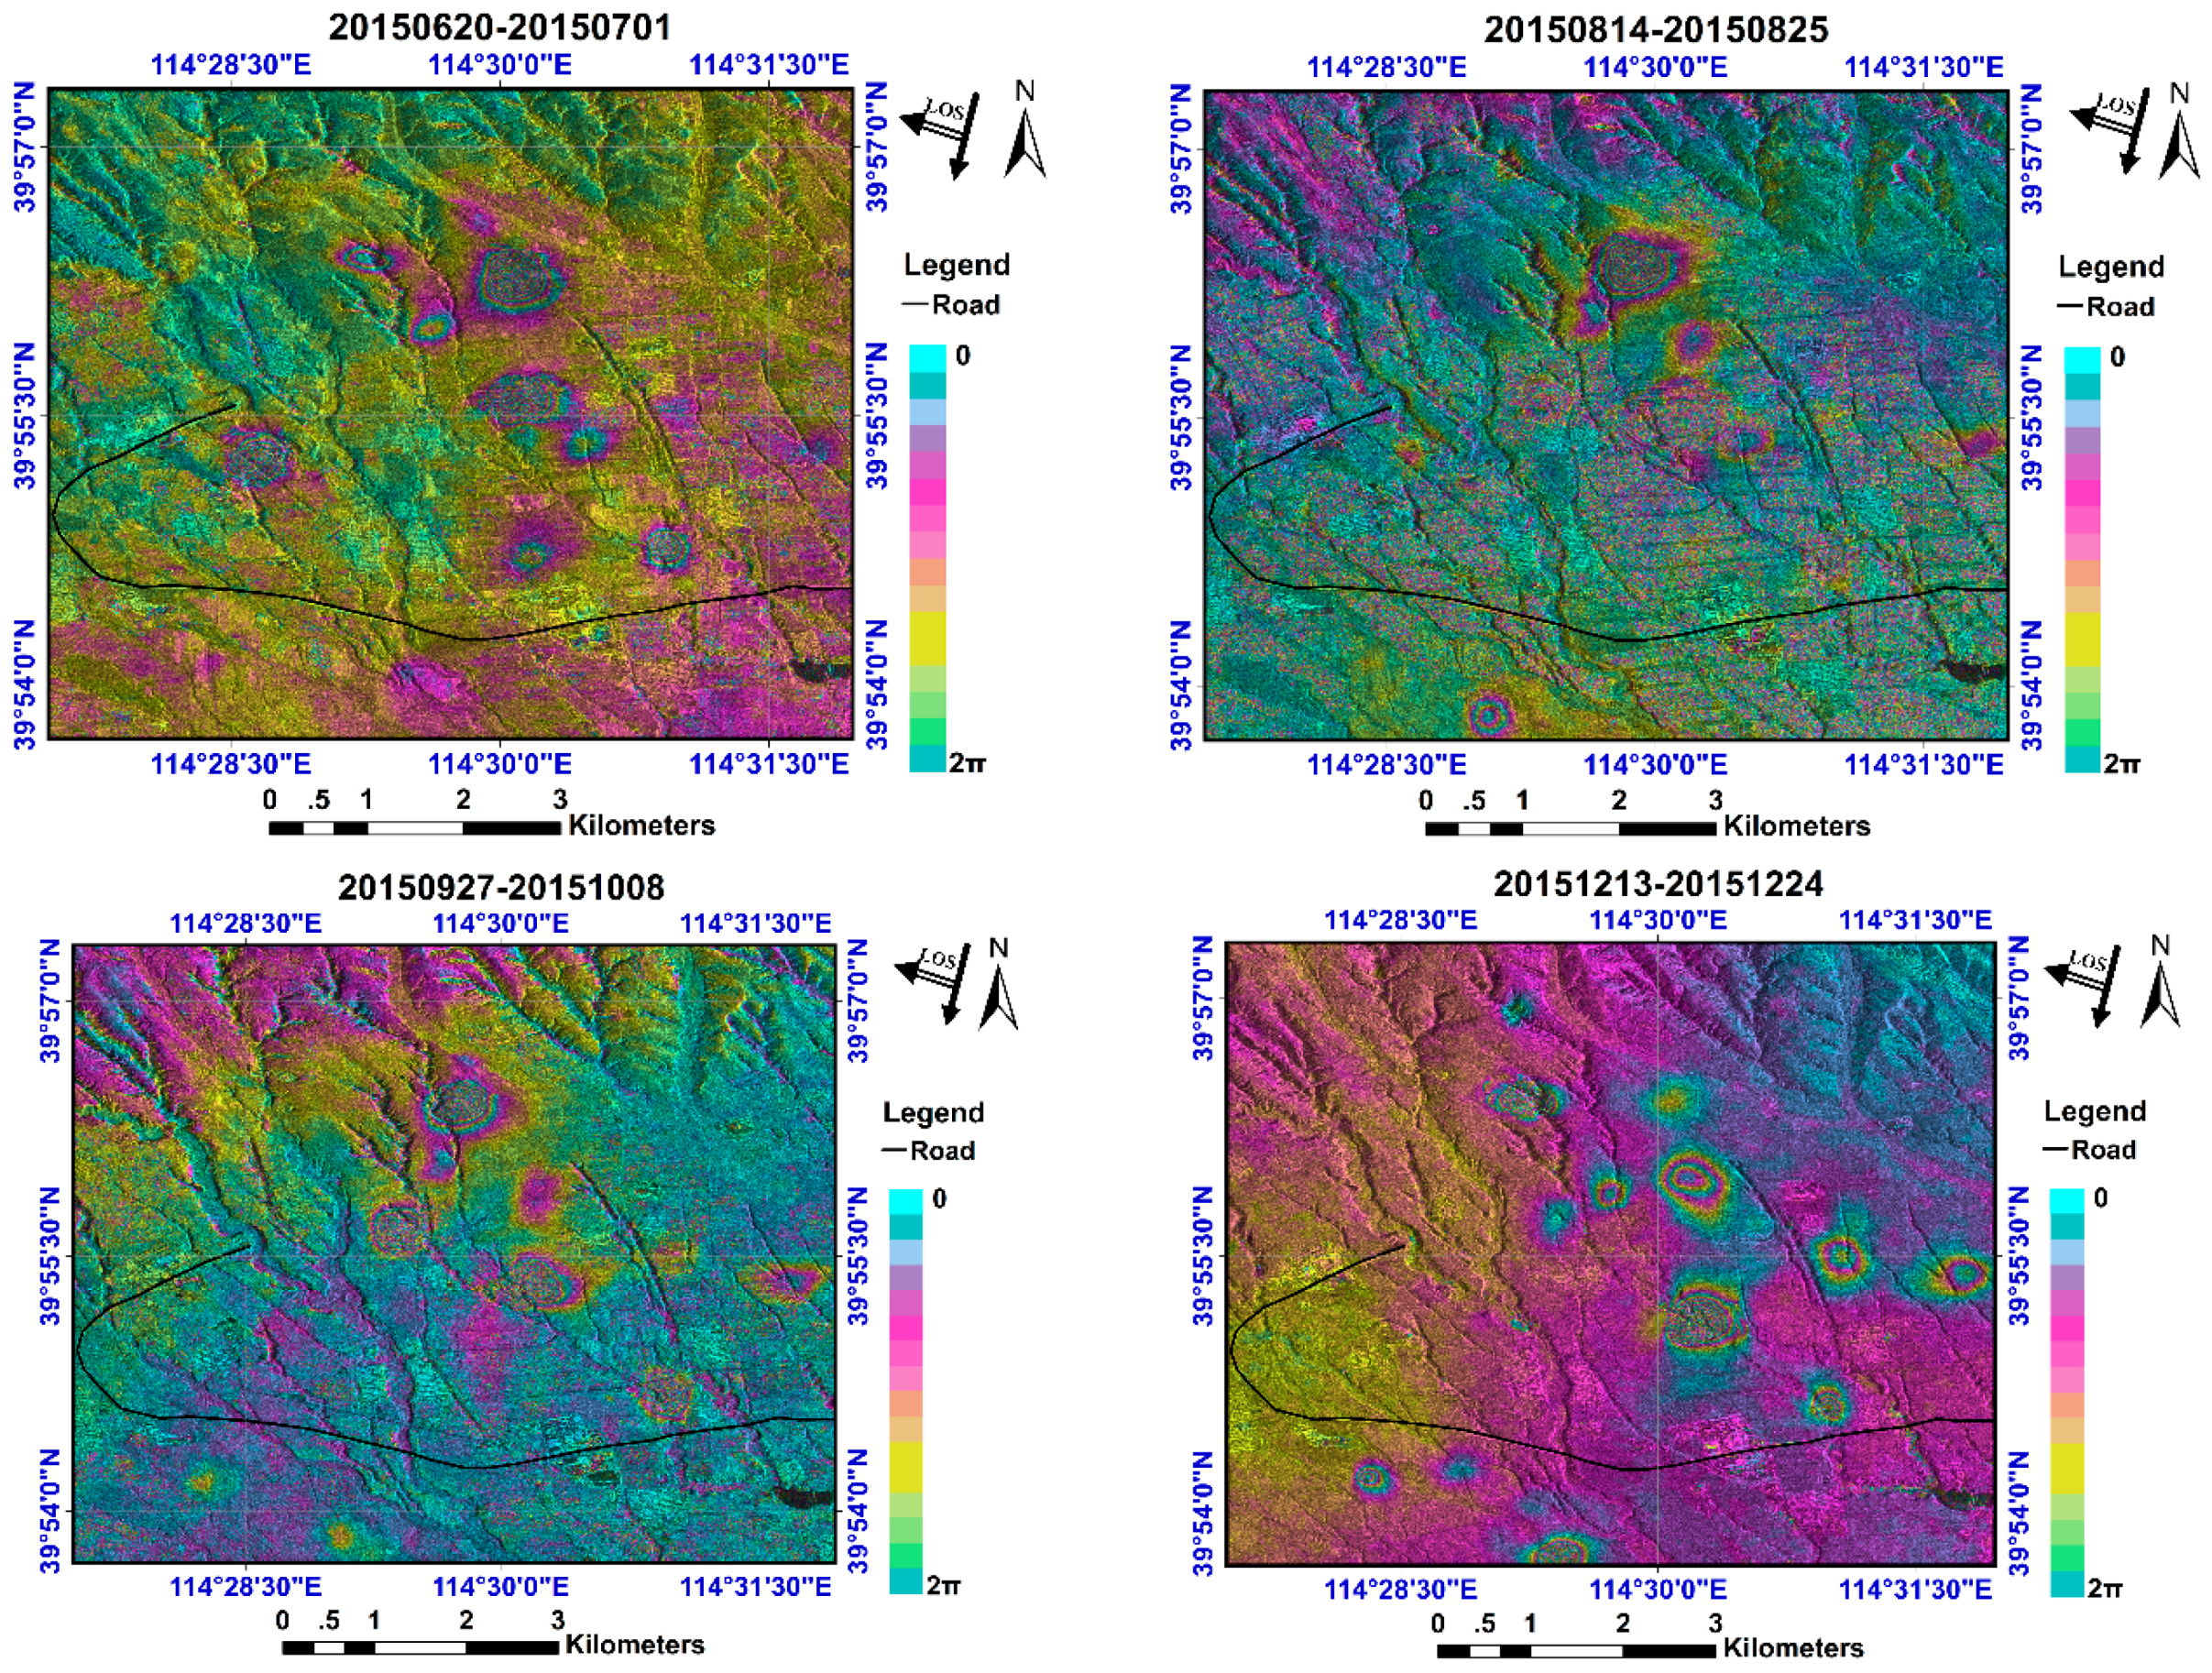
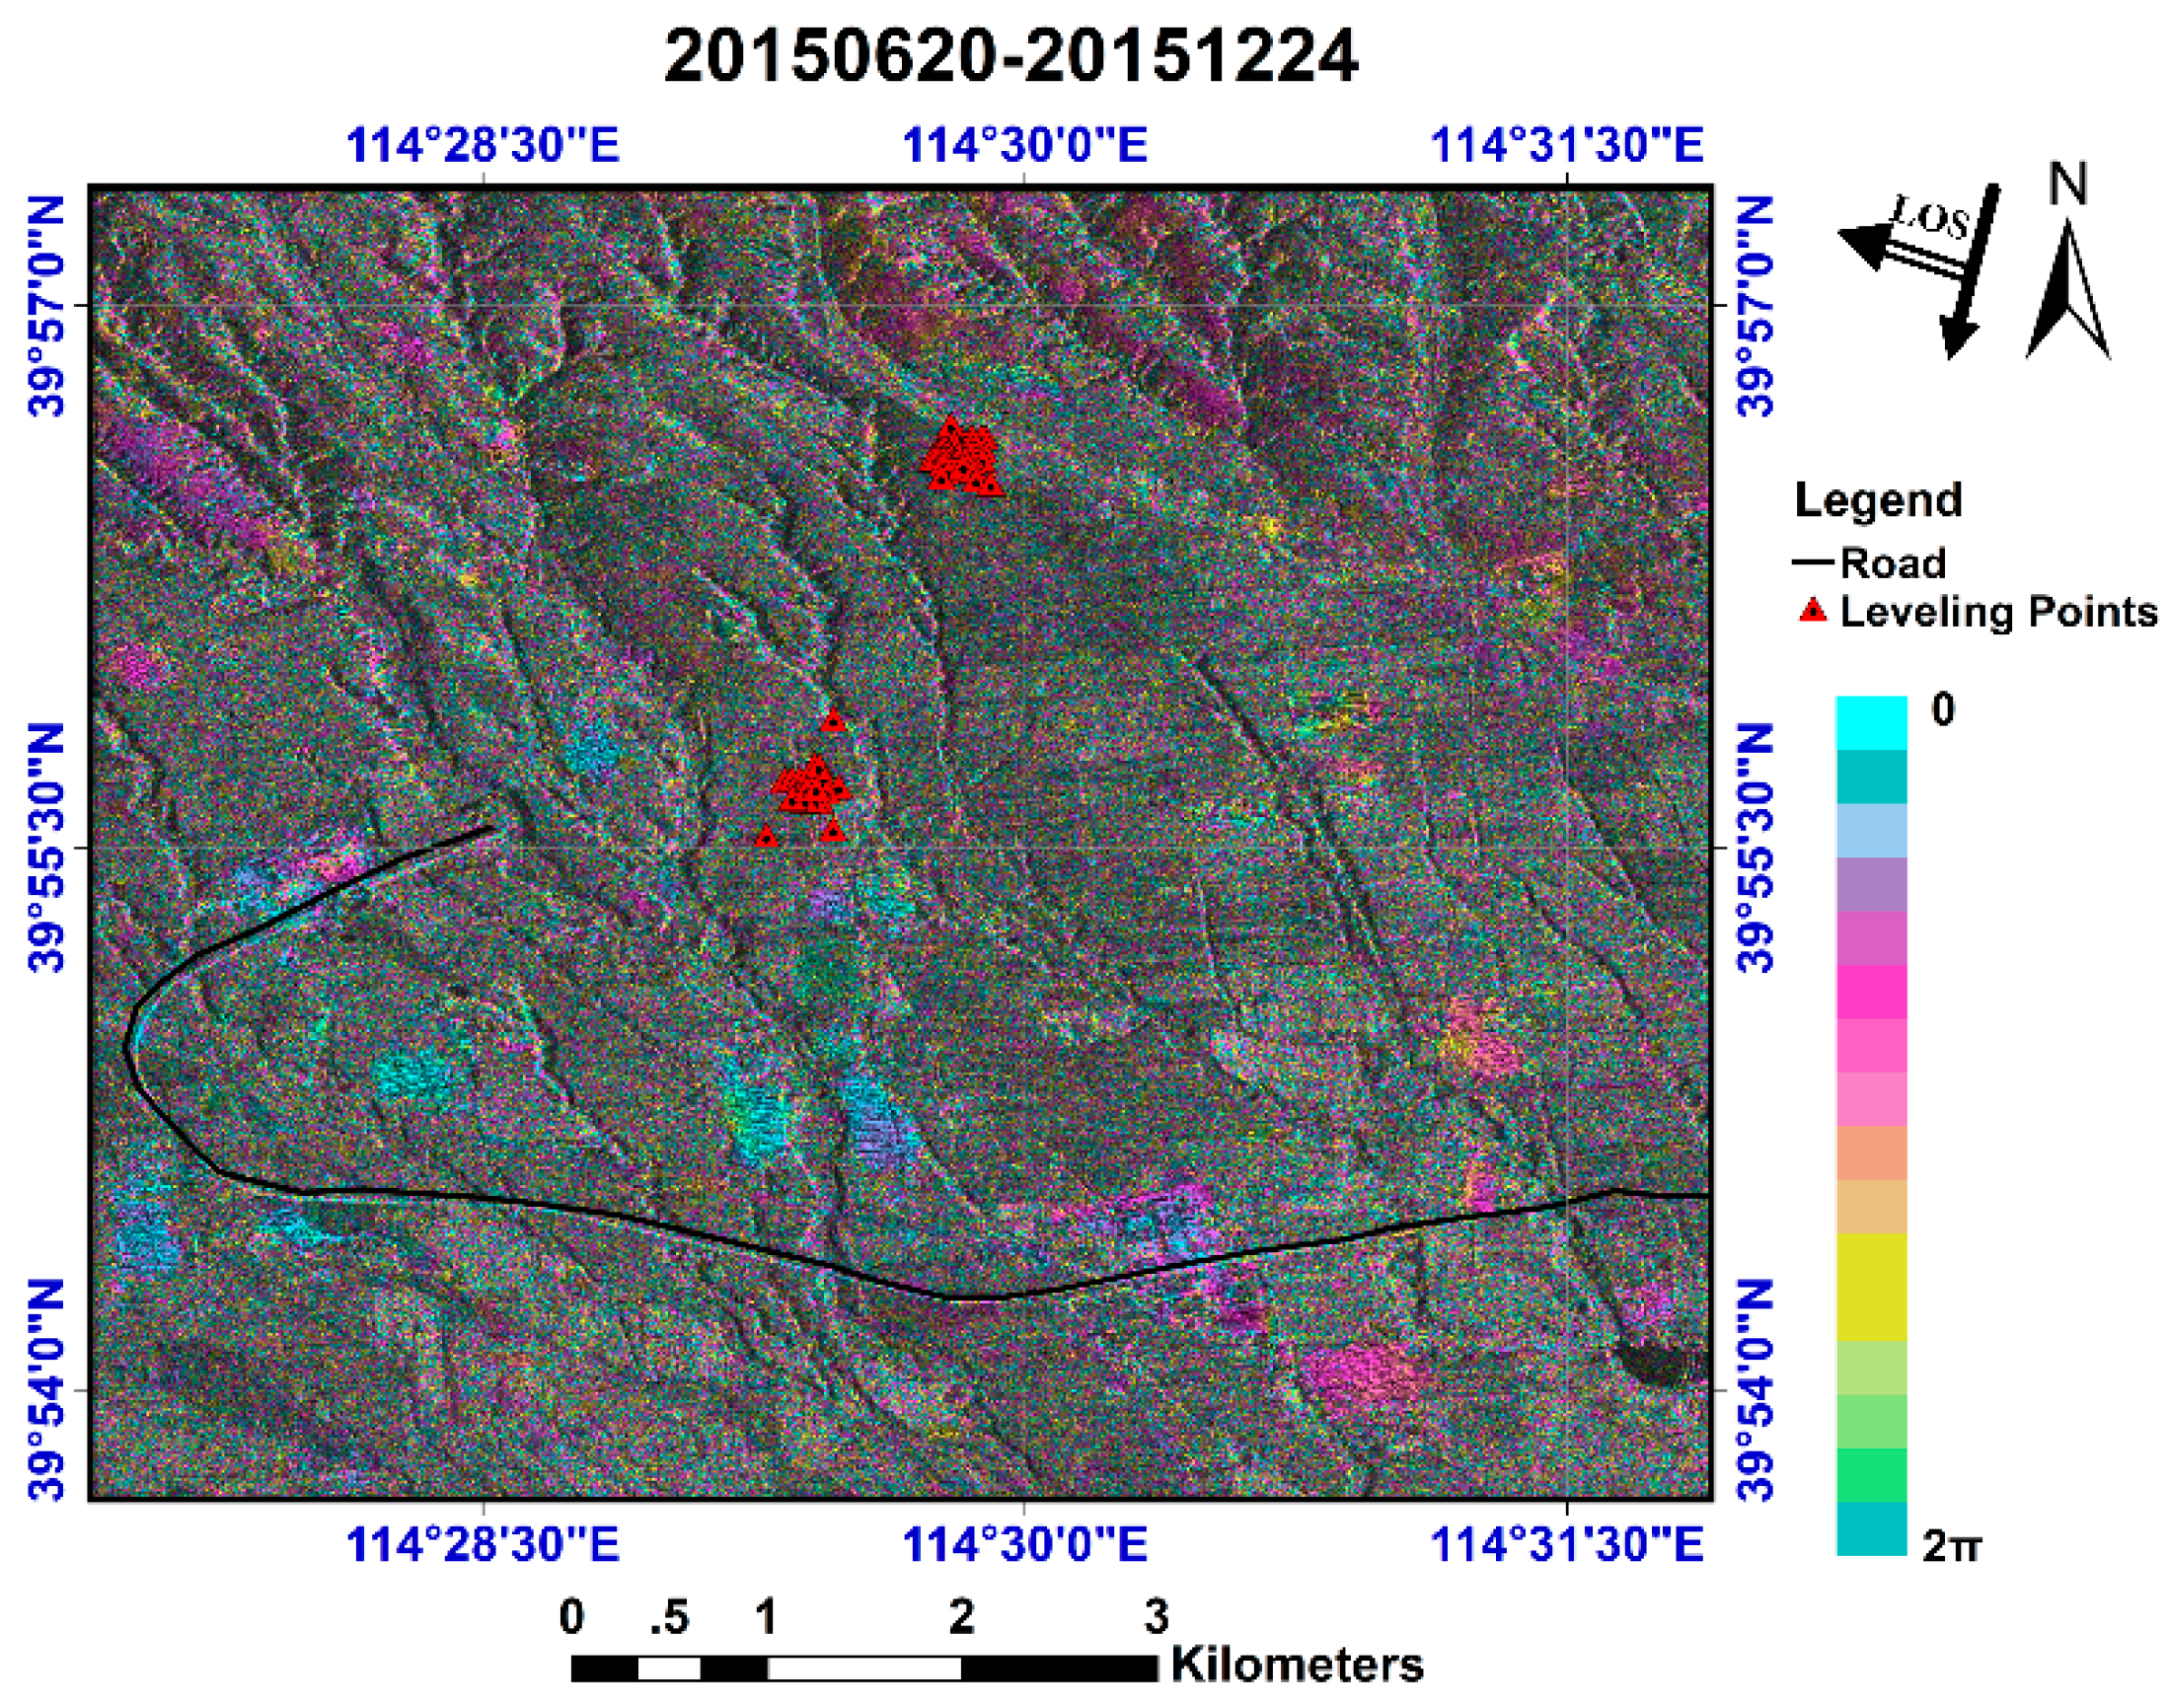
In this experiment, the SAR image covering the study area was cut from the original image. Figure 4 shows a subset of the interferograms generated by the two-pass D-InSAR method, where we can see that the coherence is relatively high. The first reason for this is the small temporal interval. The second reason is the scarcity of vegetation (which generally consists of just shrubs and weeds) in the study area. However, in the main mining area, the interferometric fringes are very dense or even, decorrelated, due to the excessive subsidence.
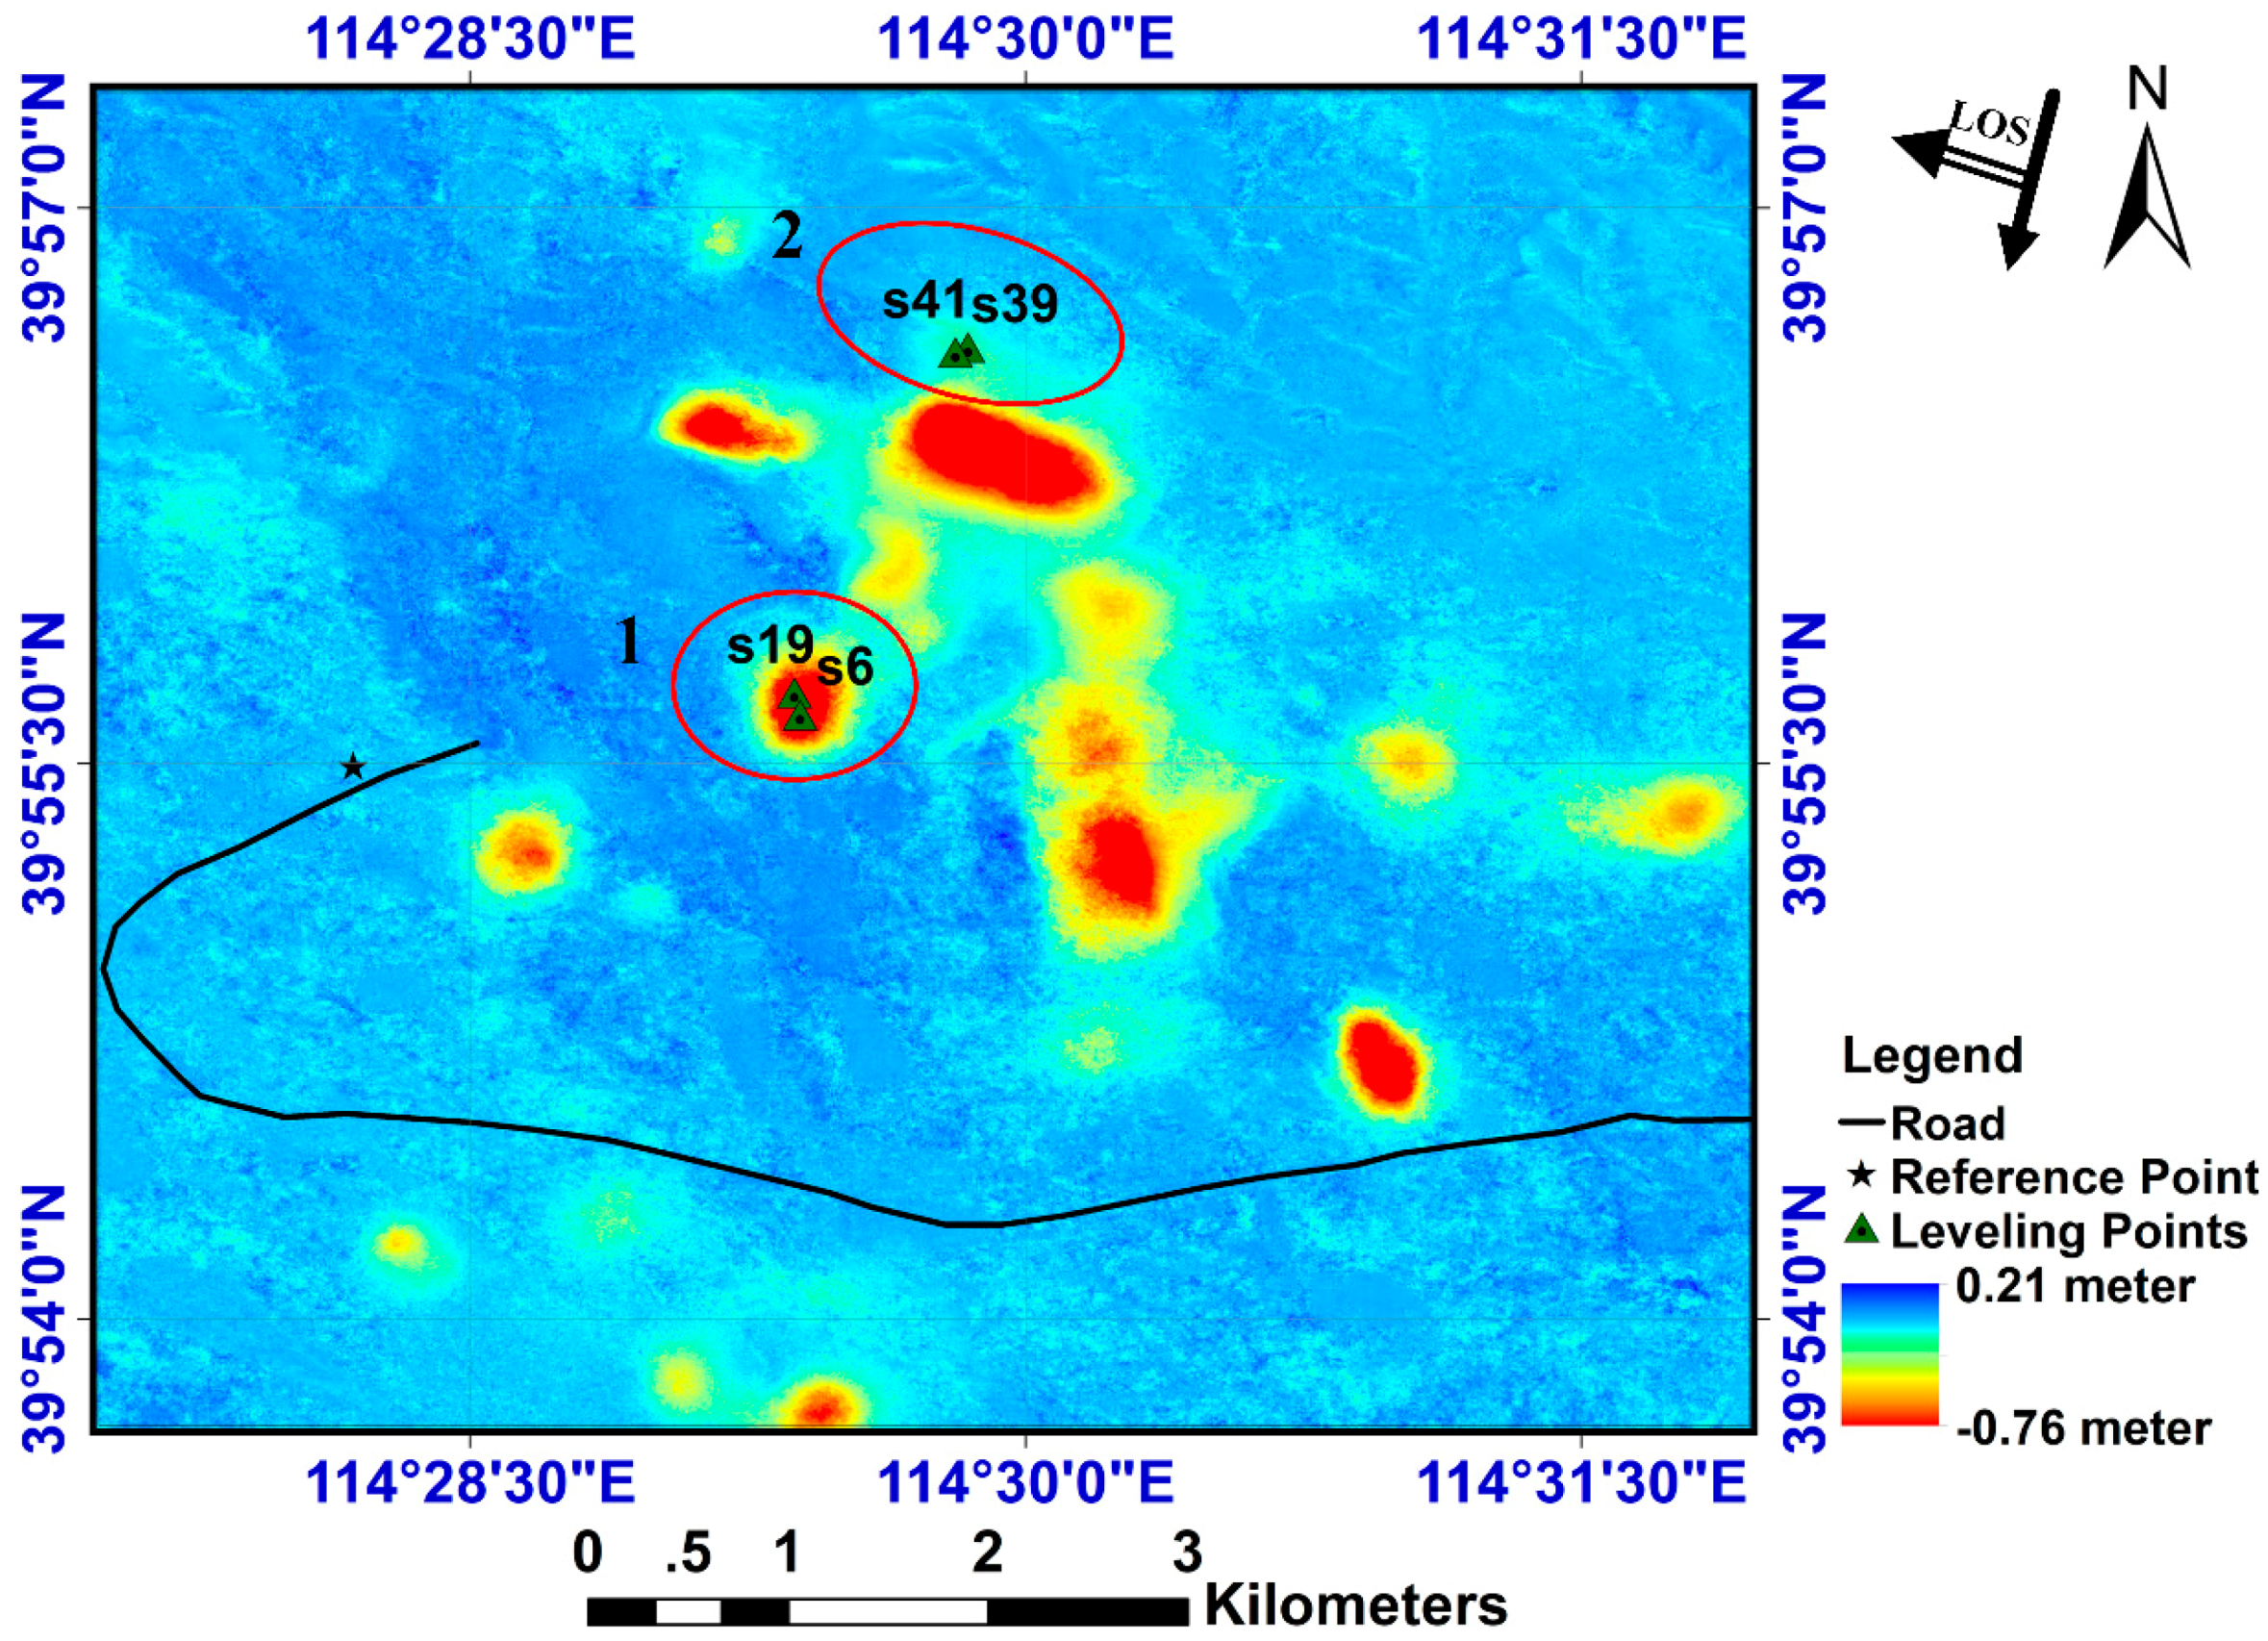
After geocoding, a superposition image, spanning from 09 June 2015 to 24 December 2015, was formed by the 17 ground deformation maps. Two ground deformation maps were removed, the first being 21 November 2015 to 01 December 2015 because of decorrelation and the second being 24 December 2015 to 04 January 2016 because of a lack of leveling data. The final superposition image is shown in Figure 5. Region 1 is Cuijiazhai village and Region 2 is Maizipo village, both of which are covered by a number of leveling points. In Region 1, the maximum subsidence of the D-InSAR result was 0.770 m, while the leveling data reached 1.116 m. In Region 2, the subsidence was small, and the maximum subsidence was only 9 cm. It is therefore clear that the D-InSAR results have a very low accuracy in the large-scale deformation areas compared with the leveling result.
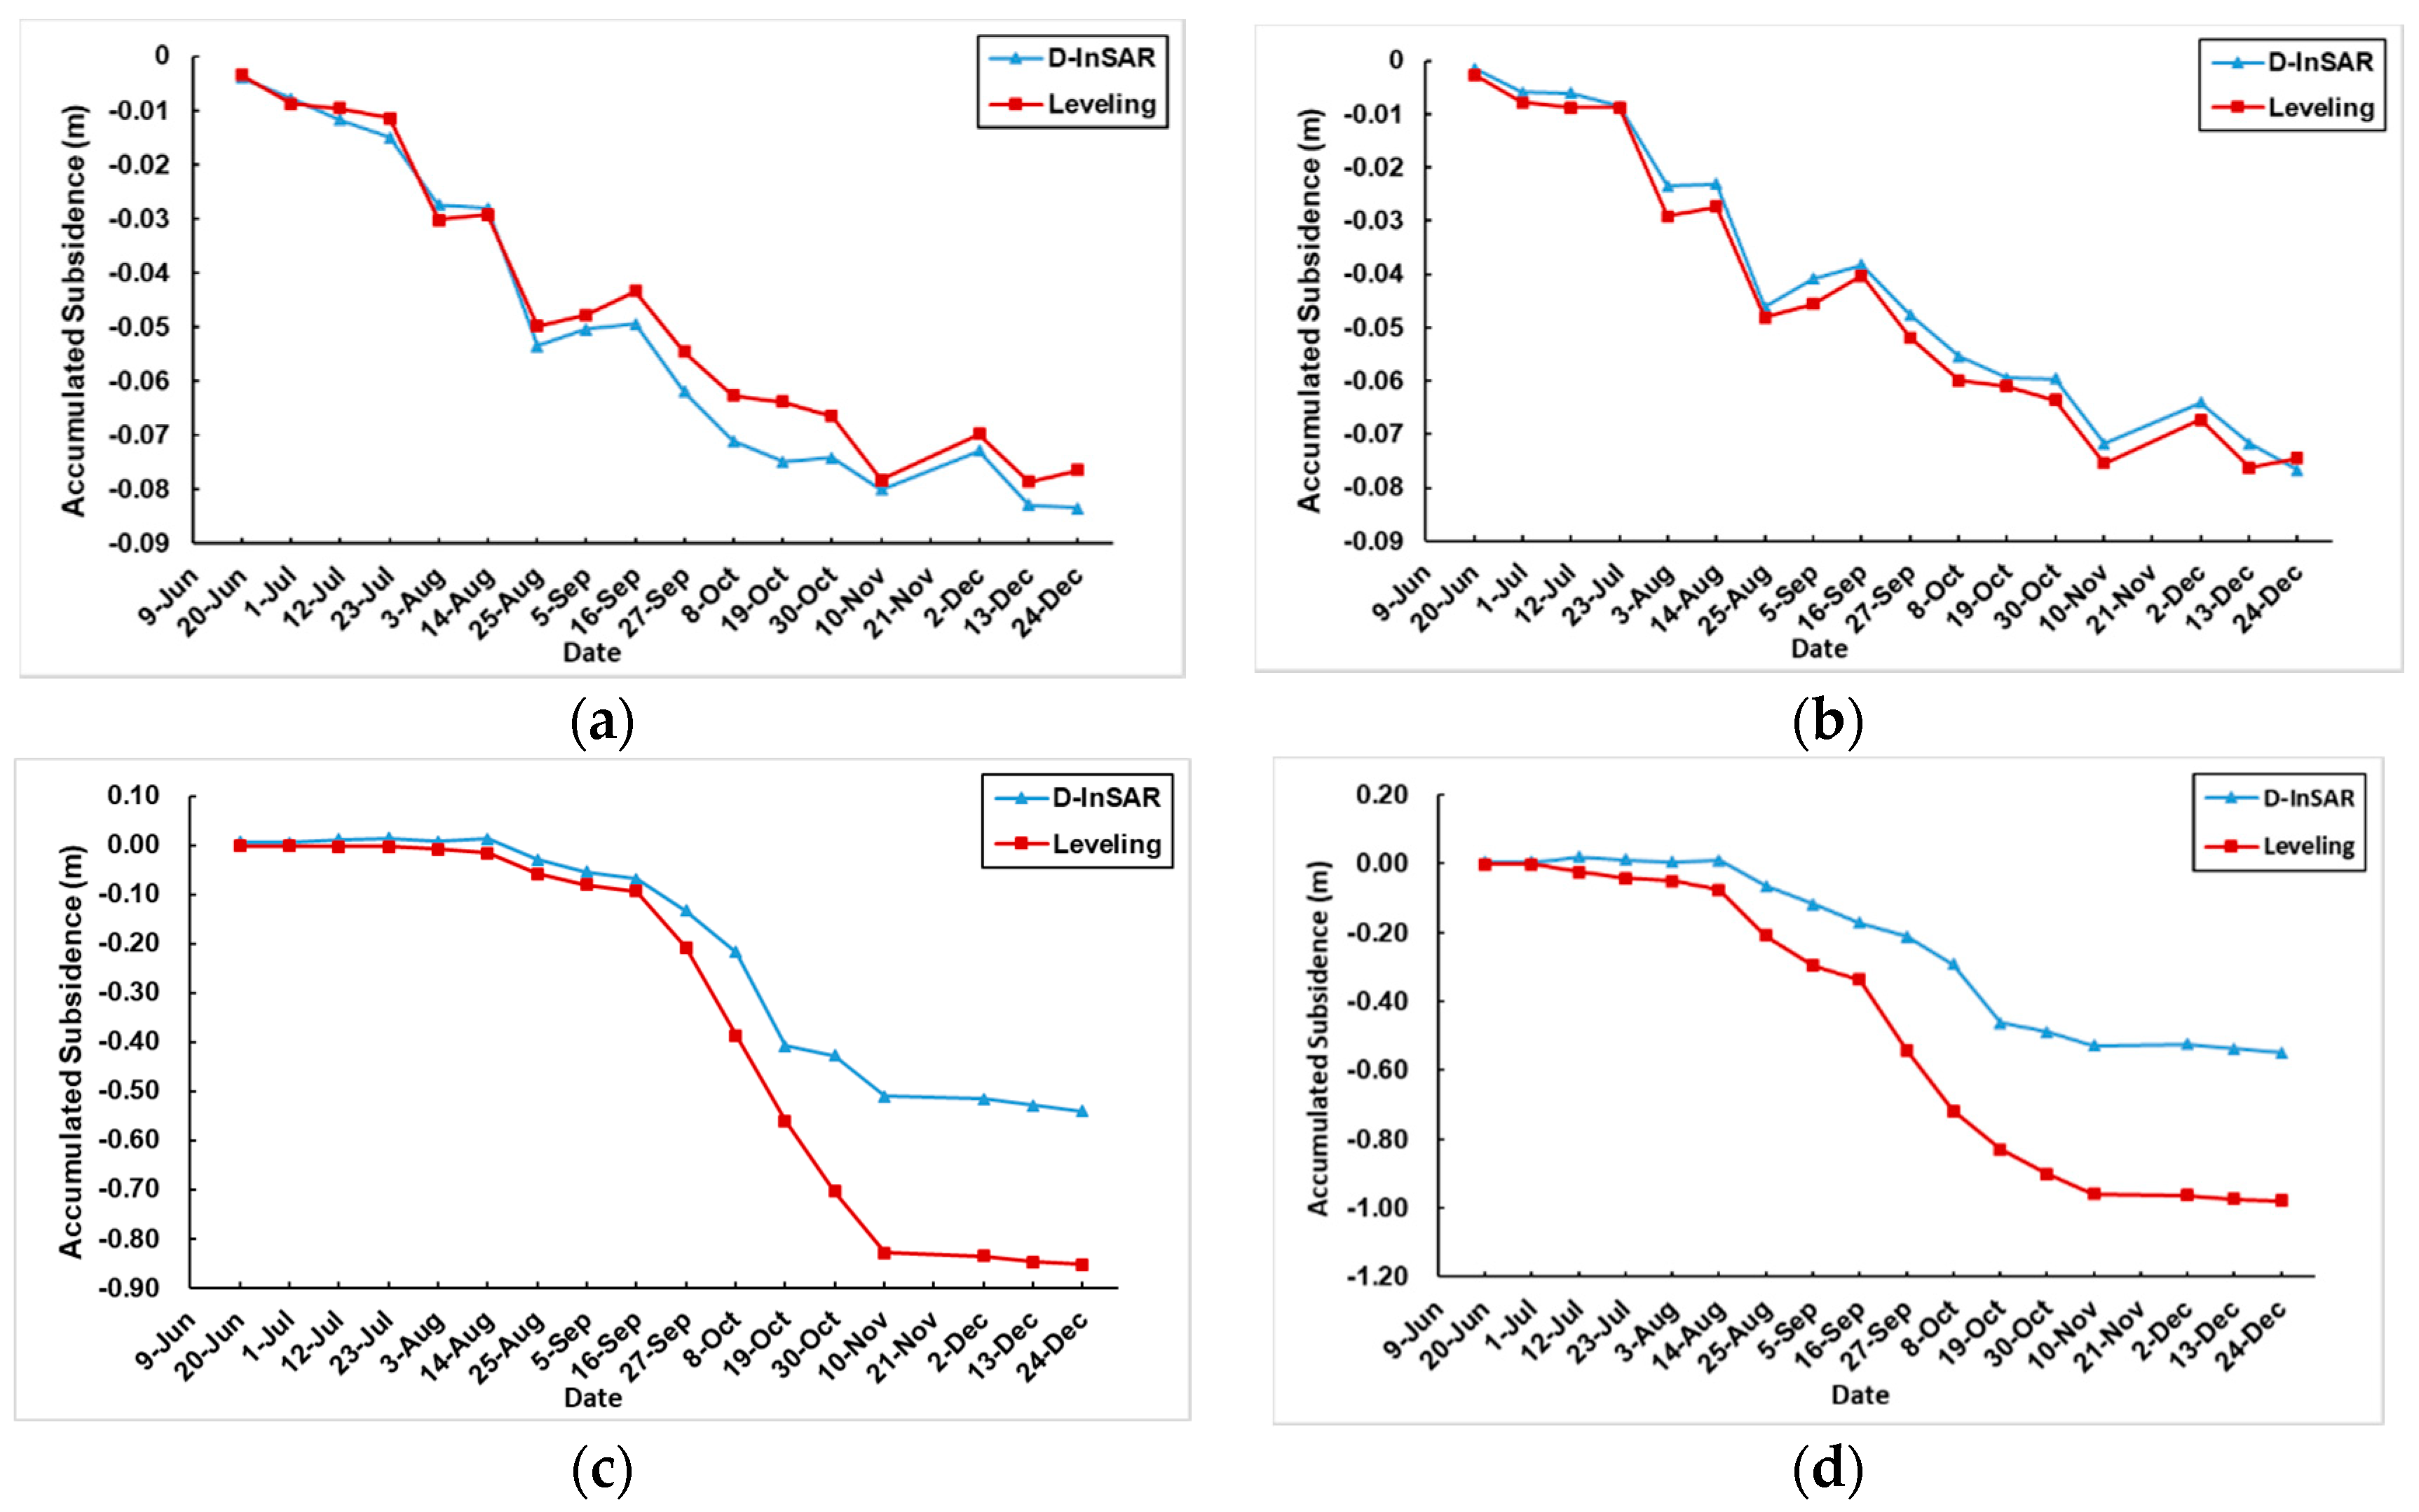
The D-InSAR results were compared with the leveling results in the line-of-sight (LOS) direction (see Figure 6). The S41 and S39 leveling points in Maizipo village and the S29 and S6 leveling points in Cuijiazhai village were selected for the comparison. As shown in Figure 6a,b, D-InSAR performed with a high accuracy in the areas where the subsidence was relatively small. The cumulative subsidence was only about 9 cm, and high consistency with the leveling data was shown during the entire period of monitoring. However, our requirements were not reached in the areas where large ground deformation exists (see Figure 6c,d). For example, from Figure 6d, the final cumulative subsidence obtained by the leveling measurement reached 1.1 m, while D-InSAR was only about 0.5 m. Before September 16th, leveling point S19 (Figure 6c) could be monitored with a high accuracy when using D-InSAR. Subsequently, with the rapid increase of the subsidence rate, it showed a significant error compared with the leveling result. However, after November 10, the subsidence tended to be small and stable, and the D-InSAR and leveling results were consistent. Moreover, we can also see that from leveling point S6 (Figure 6d) that the difference between D-InSAR and leveling was very large from 25 August to 10 November, and D-InSAR could not obtain a high accuracy result in the high gradient subsidence area because of the decorrelation. It is known that D-InSAR cannot detect deformations for which the subsidence is more than half the wavelength of the radar LOS in a resolution cell of a differential interferogram [44]. Hence, the decorrelation of Region 1 in the period from 27 September to 02 December was caused by the high gradient deformation.
4.2. Results of the MT-InSAR Methods
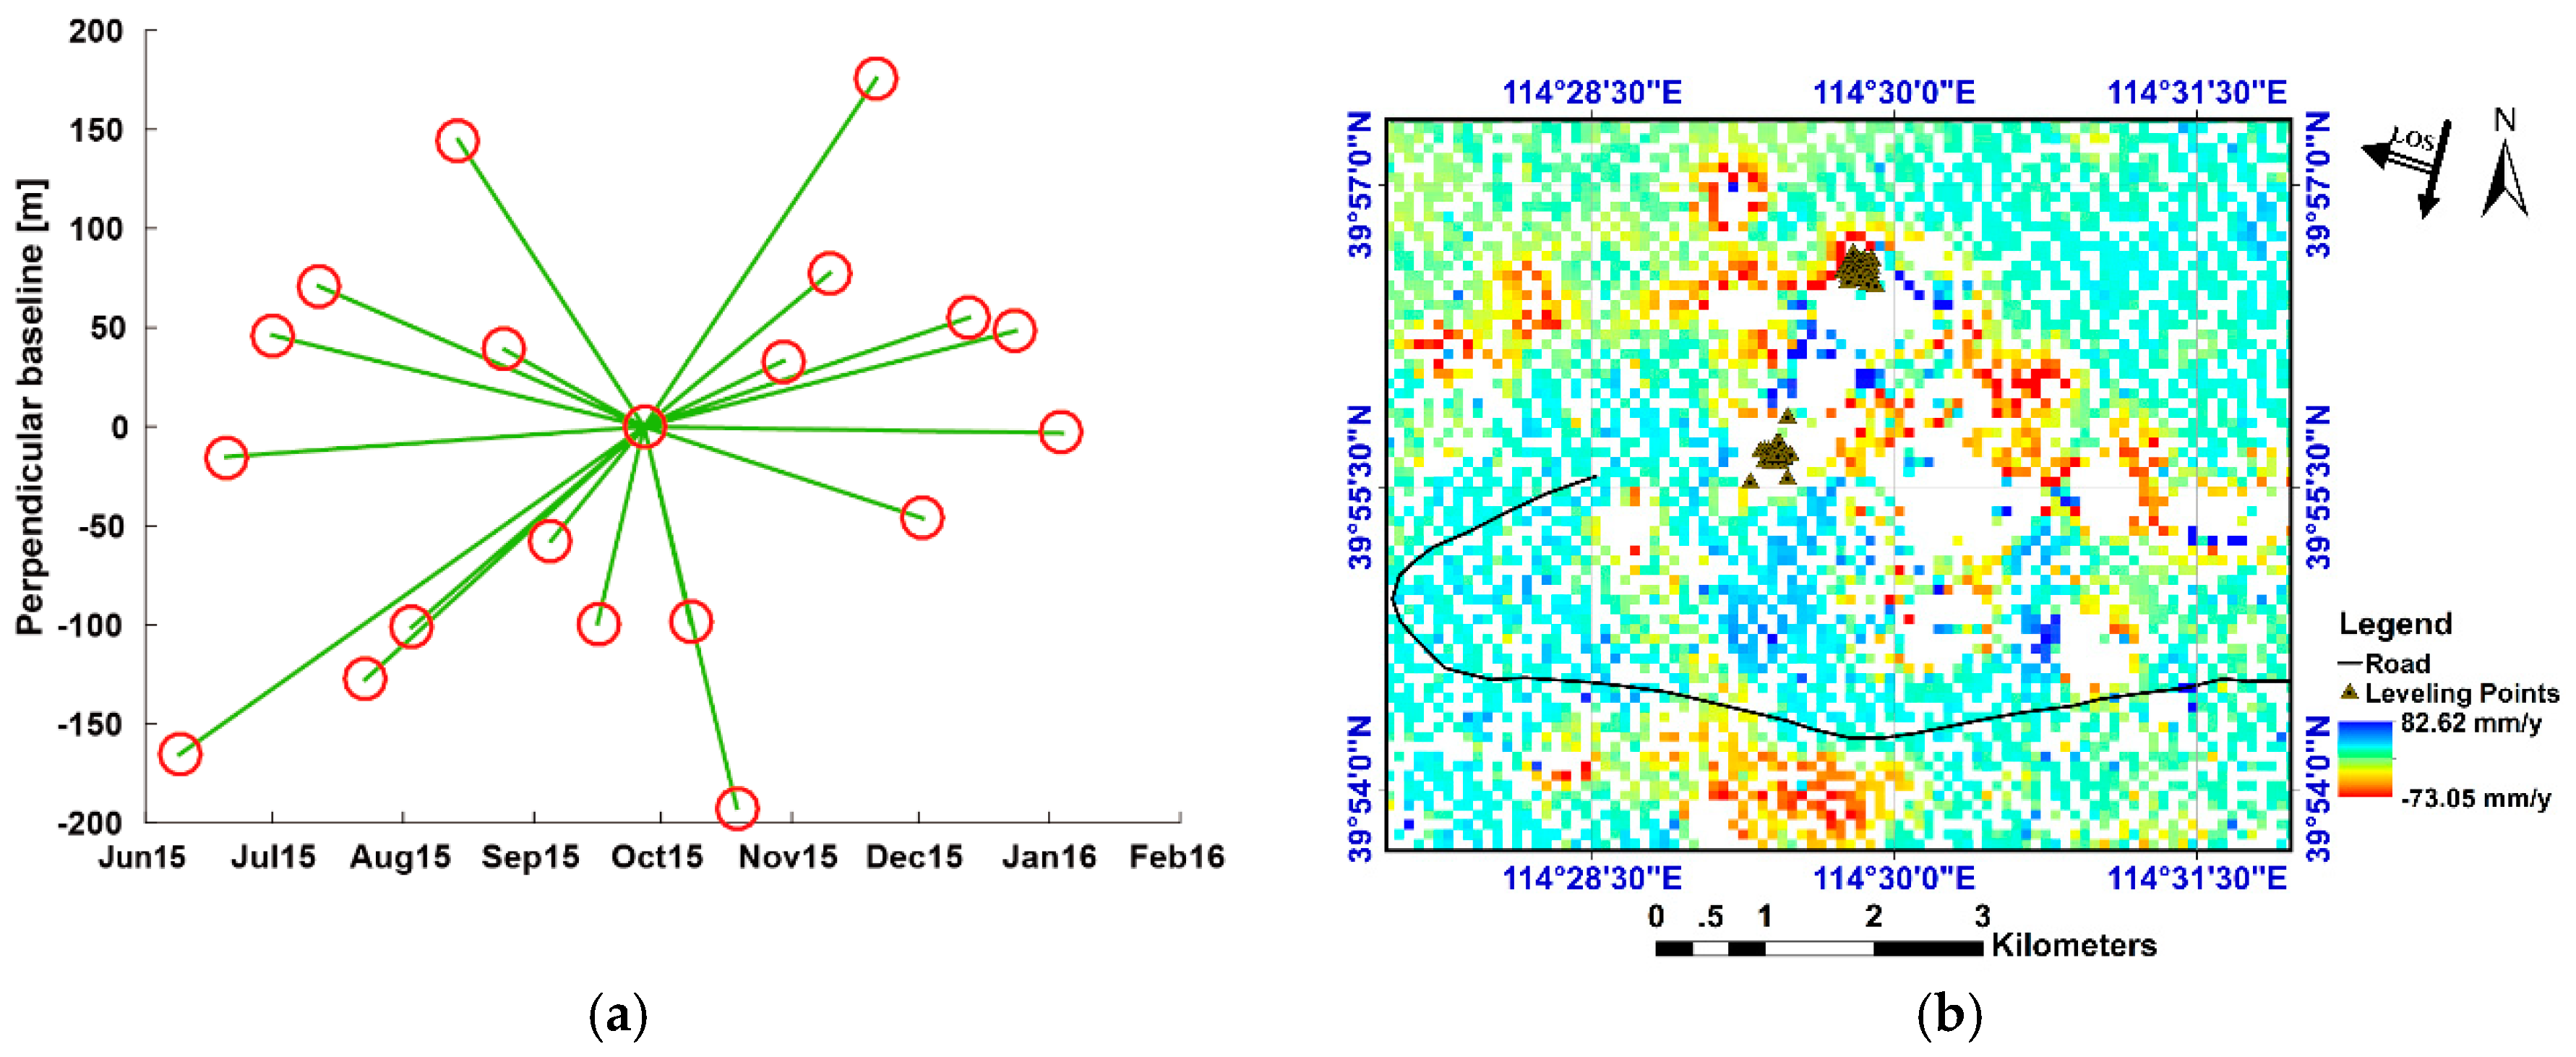
These experiments were completed using both Doris software and StaMPS software. In the conventional PS experiments, the optimal master image, obtained on 27 September 2015, was calculated by computing the spatial perpendicular baseline, the temporal baseline, and the Doppler centroid frequency difference. It can be seen from Figure 7a that the perpendicular baselines for this master image were within 200 m, which is ideal for PS experiments. However, we did not obtain sufficient PS pixels in the main mining area (Figure 7b). One reason for this was temporal decorrelation because of the unique master image strategy. Another reason was the significant subsidence in the mining area.
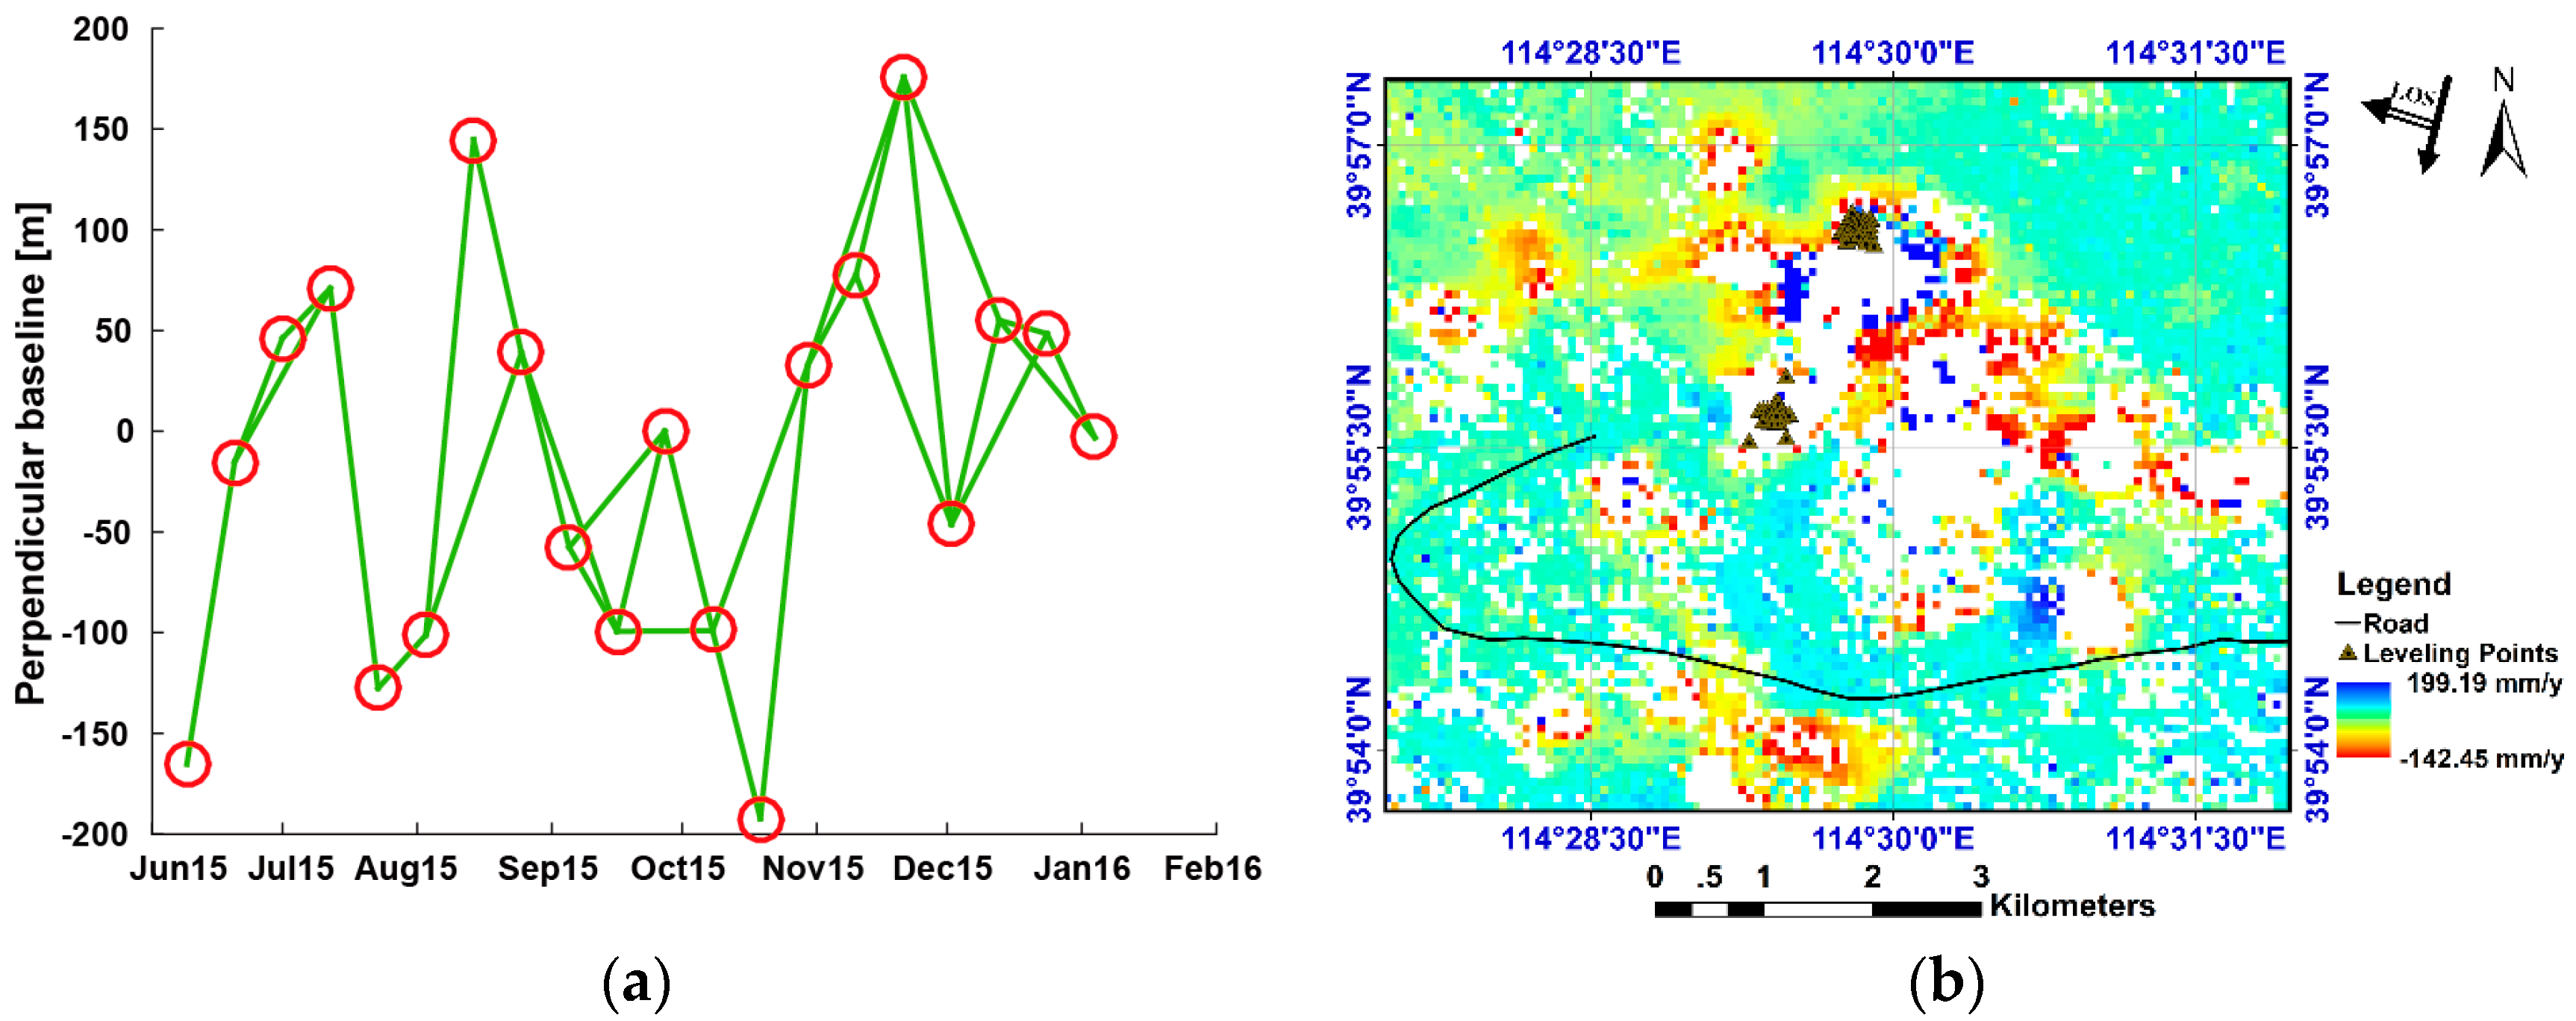
The spatial perpendicular baseline and temporal baseline should both be small, so we attempted to use the SBAS method. In total, 30 interferometric imaging pairs were generated (Figure 8a). We can see that the perpendicular baselines generated by our parameter settings were small, which ensured better coherence. Compared to the PS result (Figure 7b), the SBAS result showed better coherence in the mining area. However, the area we are interested in was incoherent in both the PS and SBAS results, and the results did not meet our requirements.
4.3. Results of the Pixel Offset Tracking
When using the D-InSAR or MT-InSAR methods alone, it is difficult to obtain reliable ground deformation in the areas where large-scale subsidence exists. Furthermore, the coherence from 20 June 2015 to 24 December 2015 was totally decorrelated (Figure 9). Hence, the pixel offset tracking technique based on the intensity information of the SAR images was used to extract the surface deformation.
Figure 10 shows the results of the pixel offset tracking. Surface subsidence was estimated in various places between 09 June 2015 and 24 December 2015. However, the process failed in a number of locations because the estimates larger than 2.5 m were considered to be wrong, and areas with low coherence were pre-removed to ensure accuracy. The Google Earth map shows that most of these areas are farmland, where there are insufficient feature points to estimate the subsidence.
As Maizipo village experienced much less subsidence than Cuijiazhai village, and because the offset tracking technique is inappropriate for small deformation areas, we only compared the results in the LOS direction for some points in the Cuijiazhai research area. The results of the leveling and offset tracking are shown in Table 4. This reveals that the pixel offset tracking was able to provide more accurate deformation information for the large-scale deformation areas, where the mean absolute error was 0.1143 m. Although its accuracy is much lower than that of D-InSAR, it is suitable for use in large-scale deformation areas where D-InSAR cannot always obtain the subsidence. From these results, it can be seen that the damage to the surrounding environment in the mining area has been very significant over the course of just half a year.
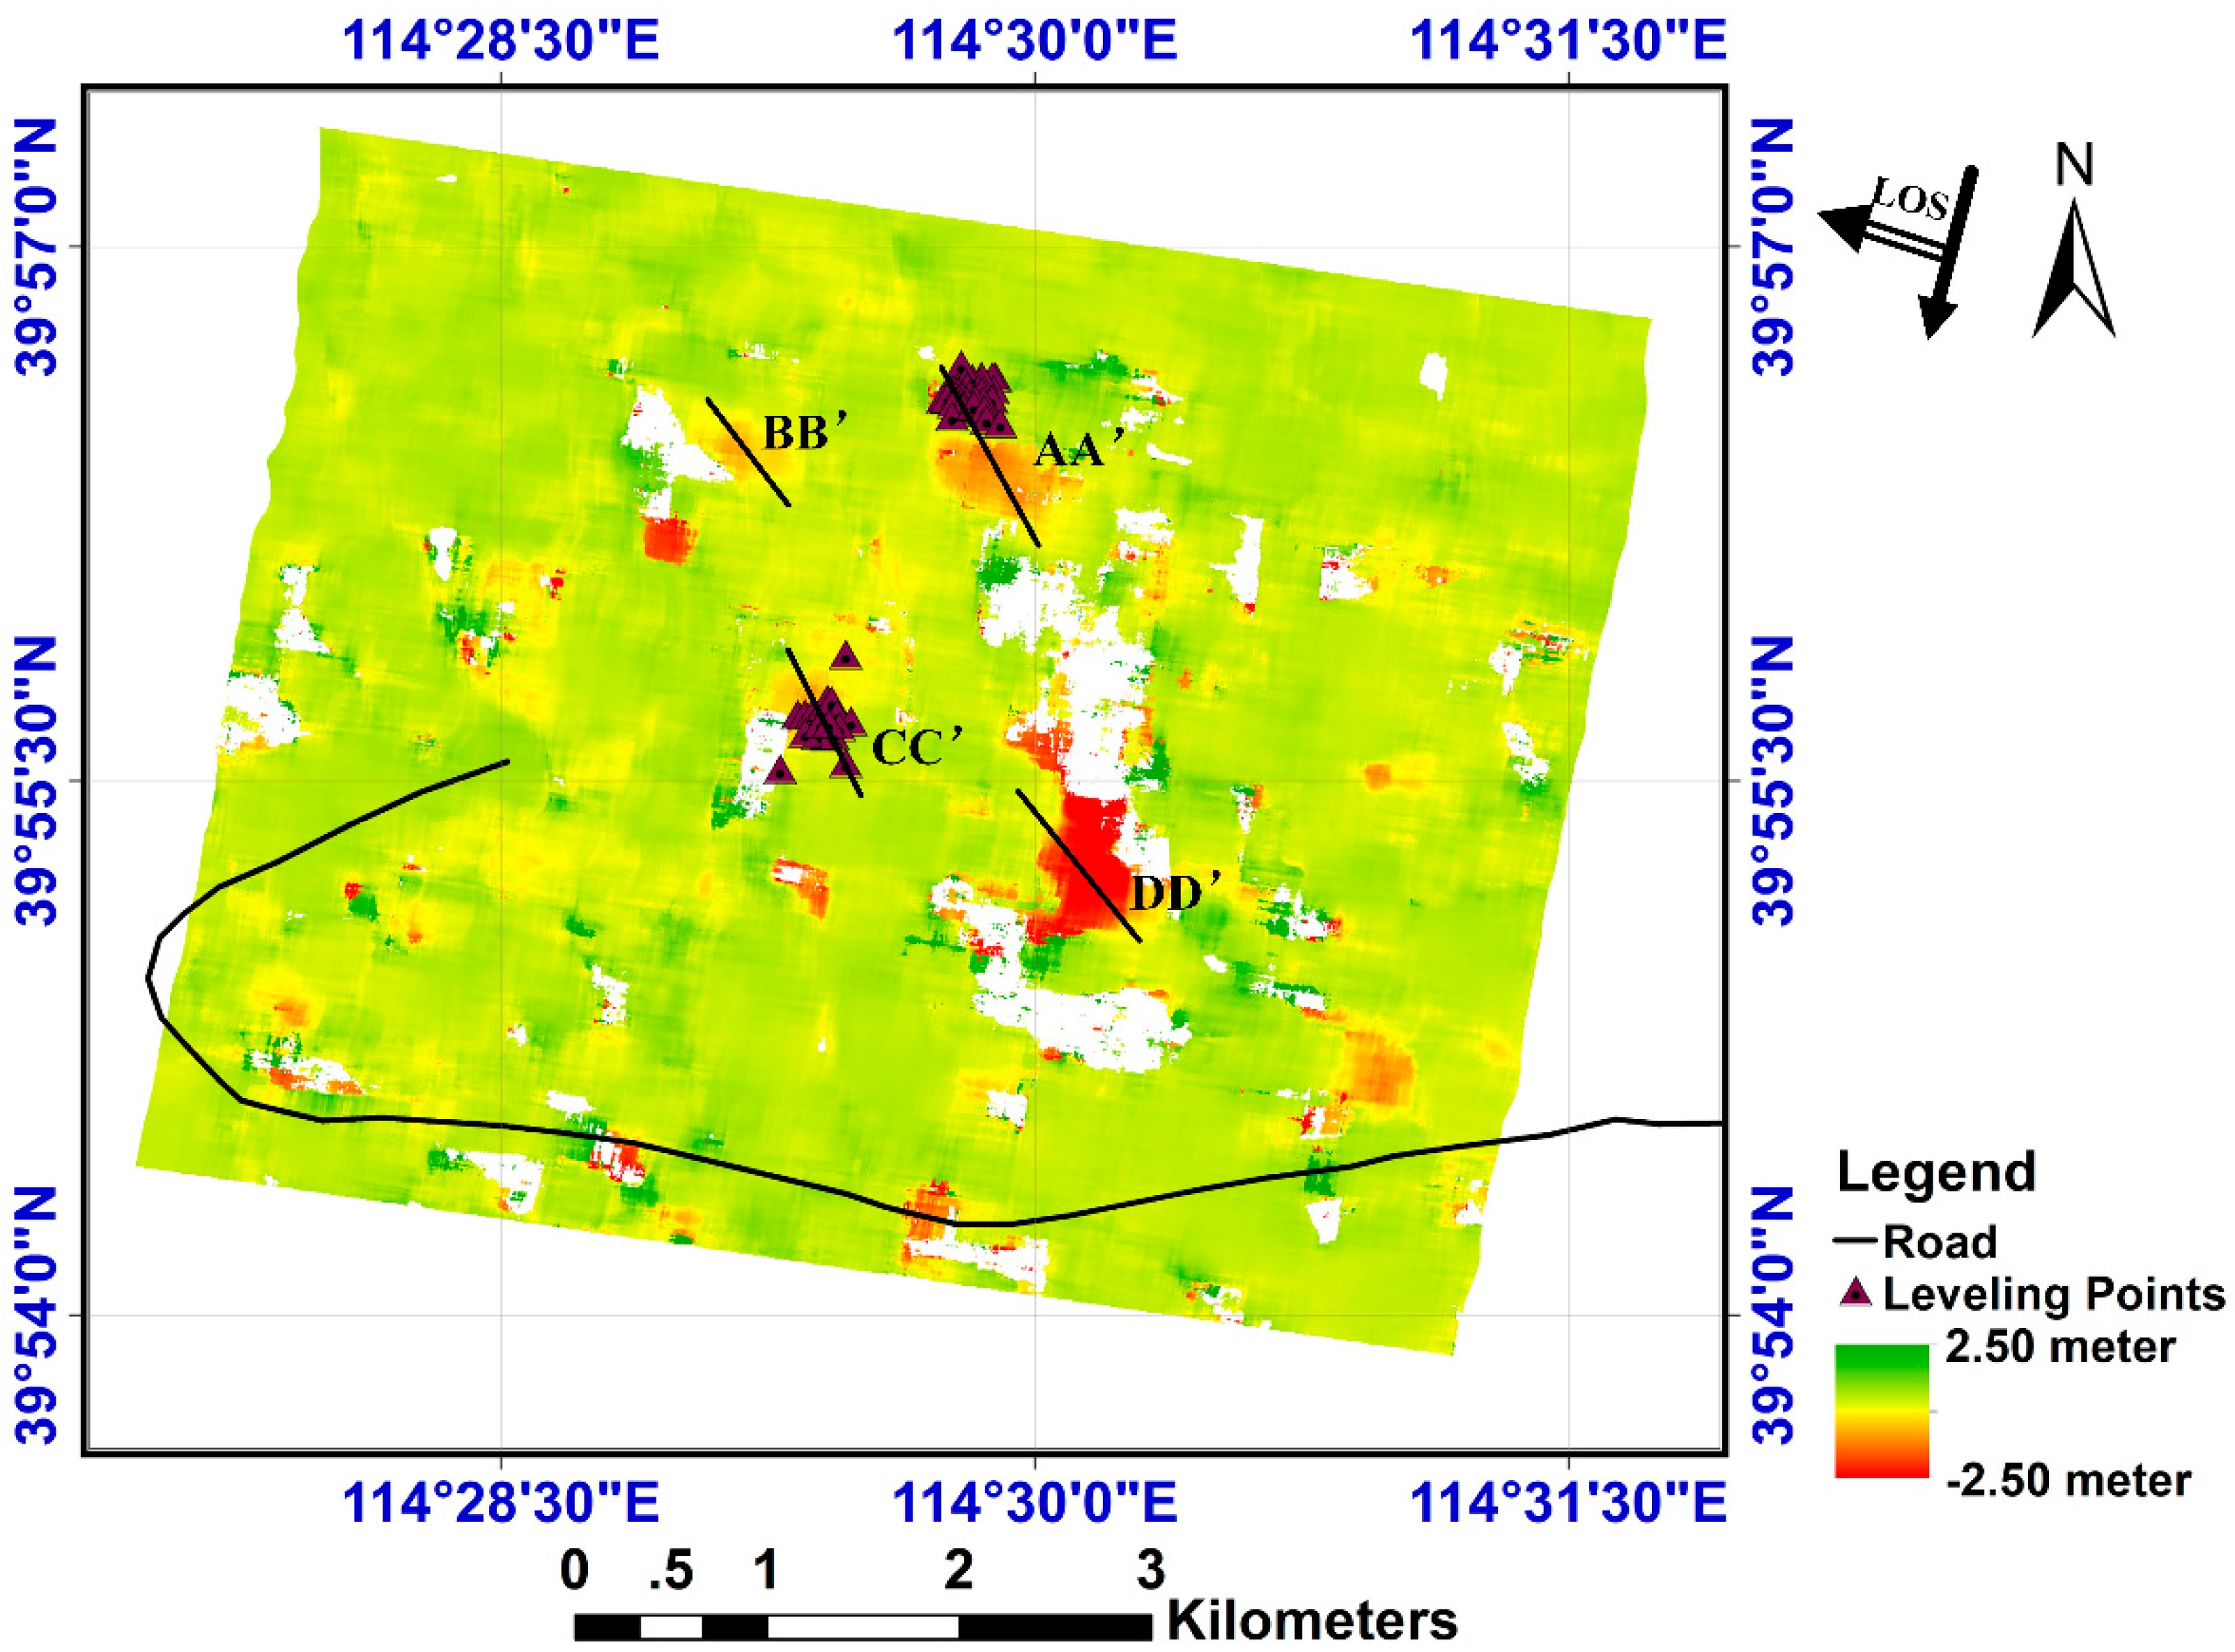
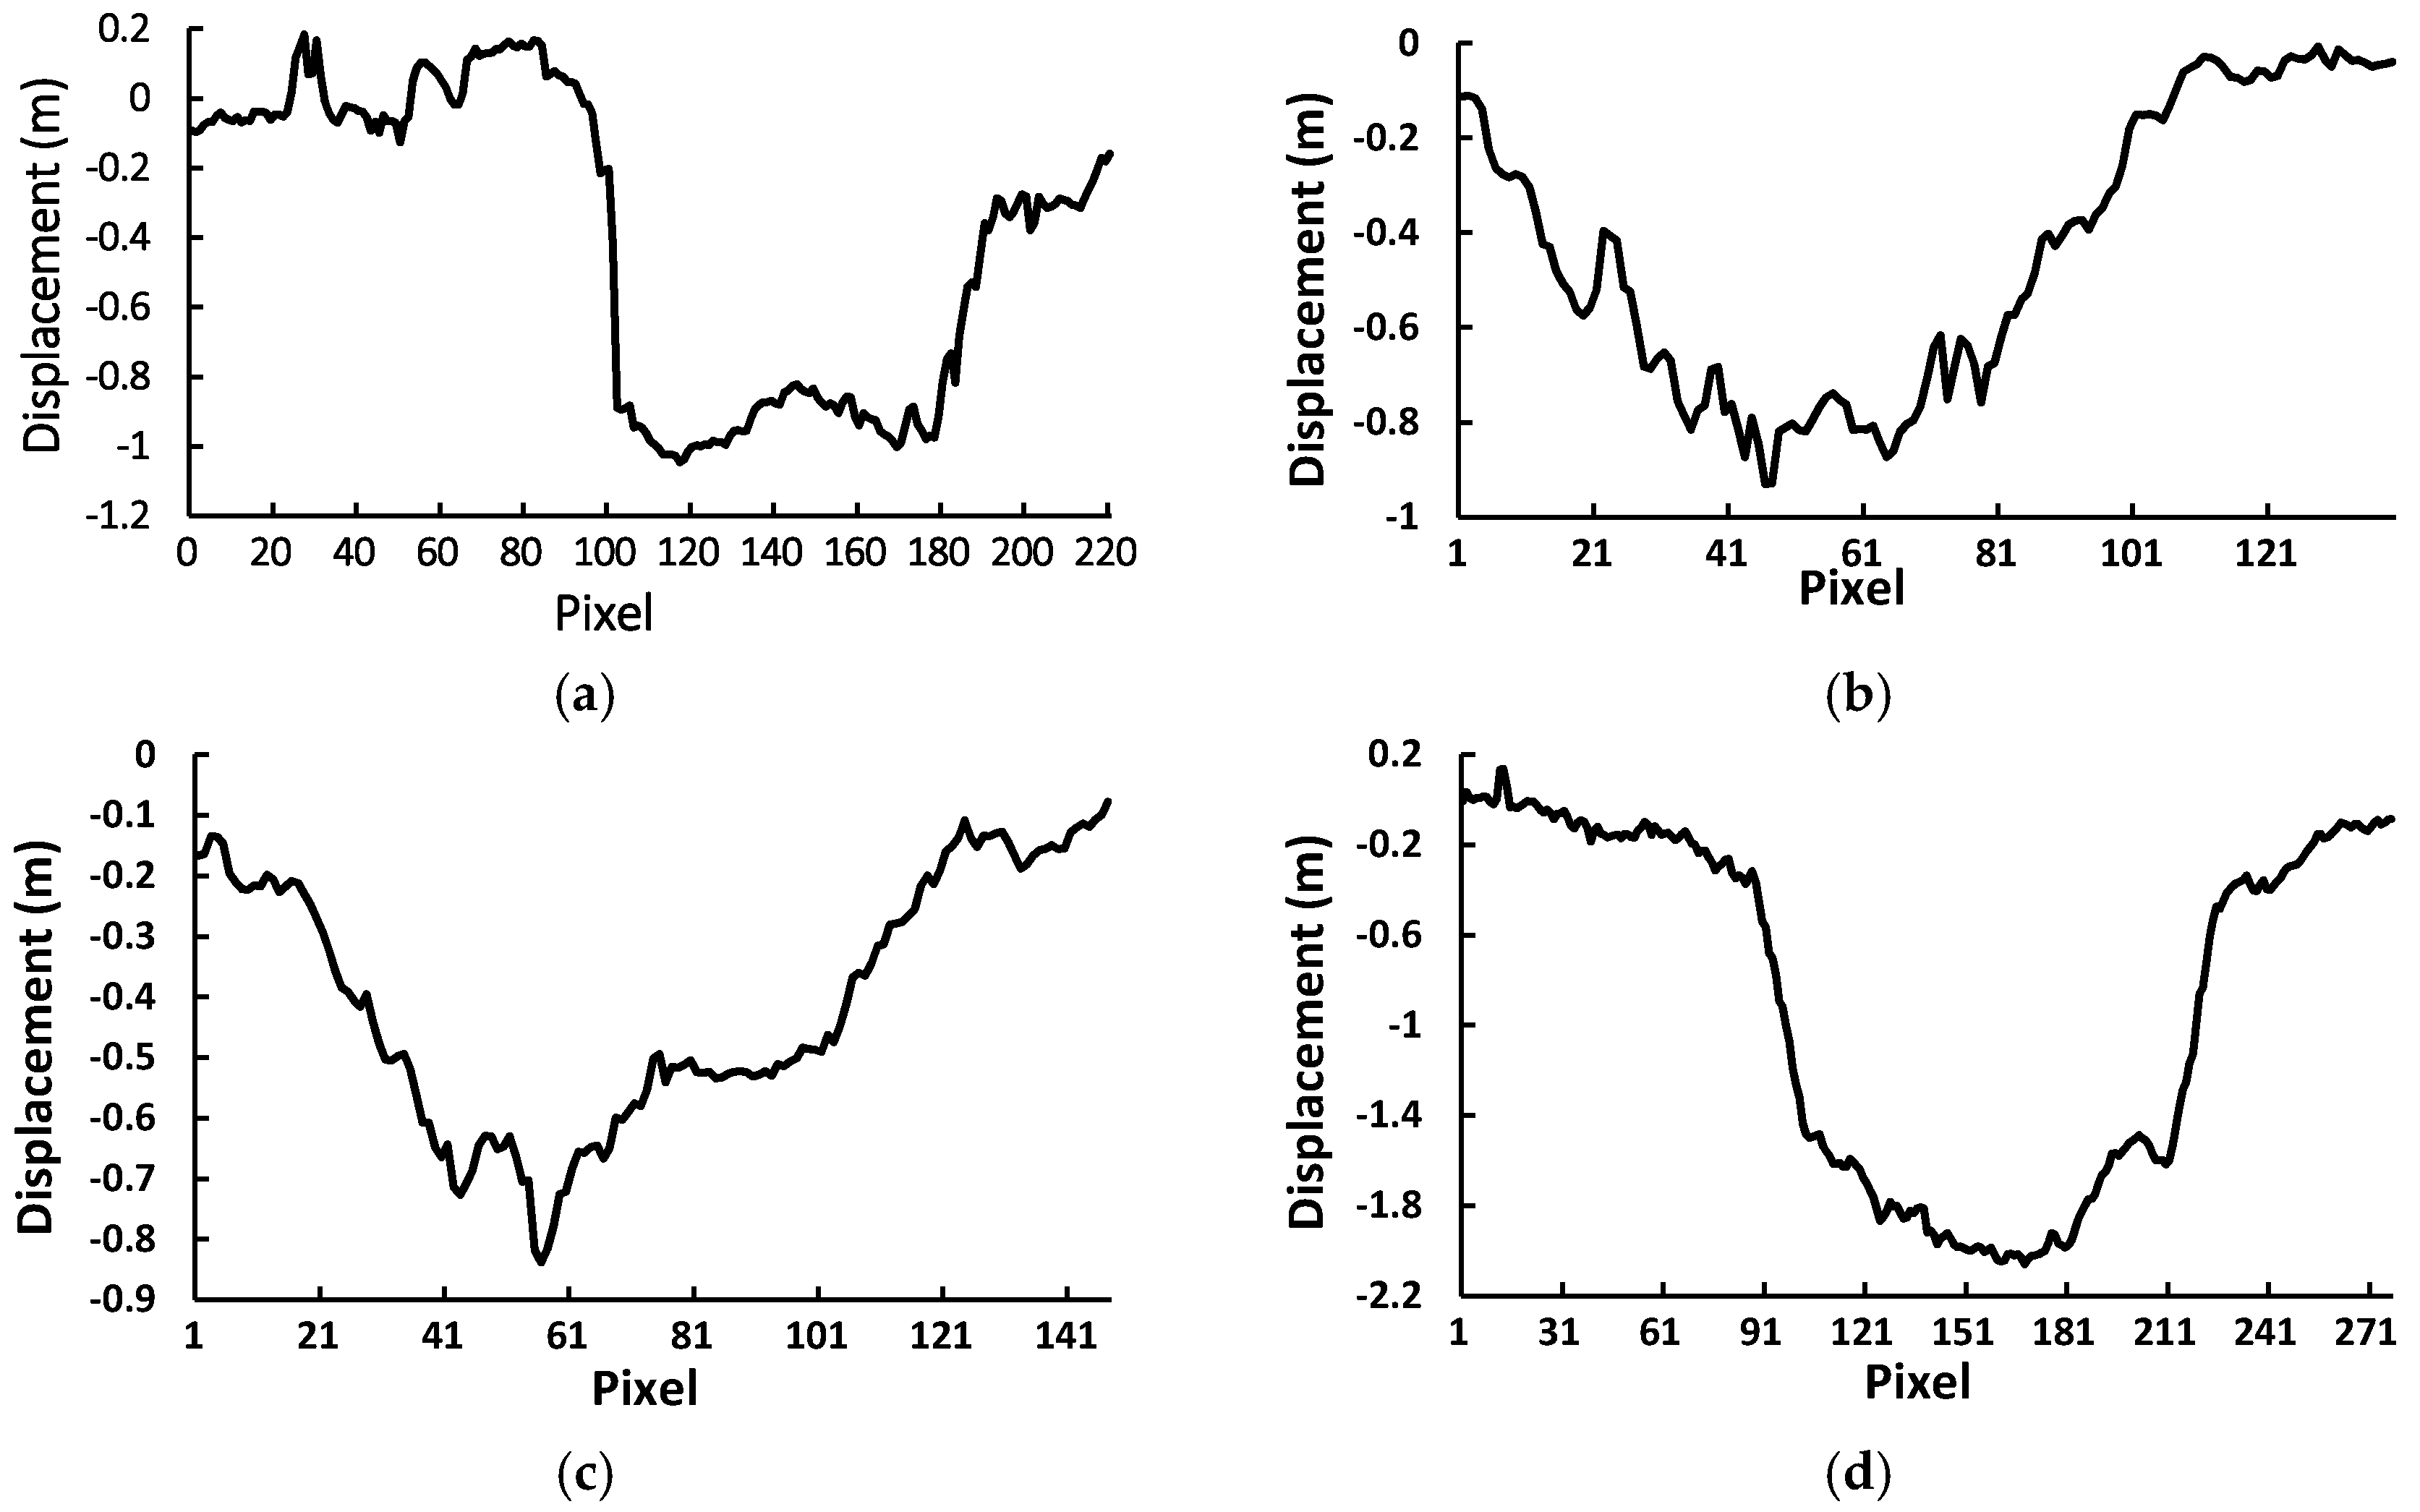
In this experiment, four regions were selected for profile analysis, as shown in Figure 10 and Figure 11. Region A is located in Maizipo Village, where the monitoring locations showed only small subsidence, which can be obtained with a high accuracy using D-InSAR. However, there was decorrelation in the south of Region A. The maximum subsidence in the AA’ profile line reached 1.1 m, and the large-scale subsidence area is due to the large number of coal mines. The BB’ profile line is a typical sink funnel. Region C is located in Cuijiazhai Village, which showed a large amount of subsidence in the late stage of the monitoring. The maximum subsidence in the CC’ profile line reached 0.9 m, and the actual situation was relatively consistent. Region D showed decorrelation and was the largest subsidence area found. The maximum subsidence in the DD’ profile line reached 2 m. Unfortunately, there are no measured leveling data, so this could not be compared quantitatively.
4.4. Results of the Fusion Method
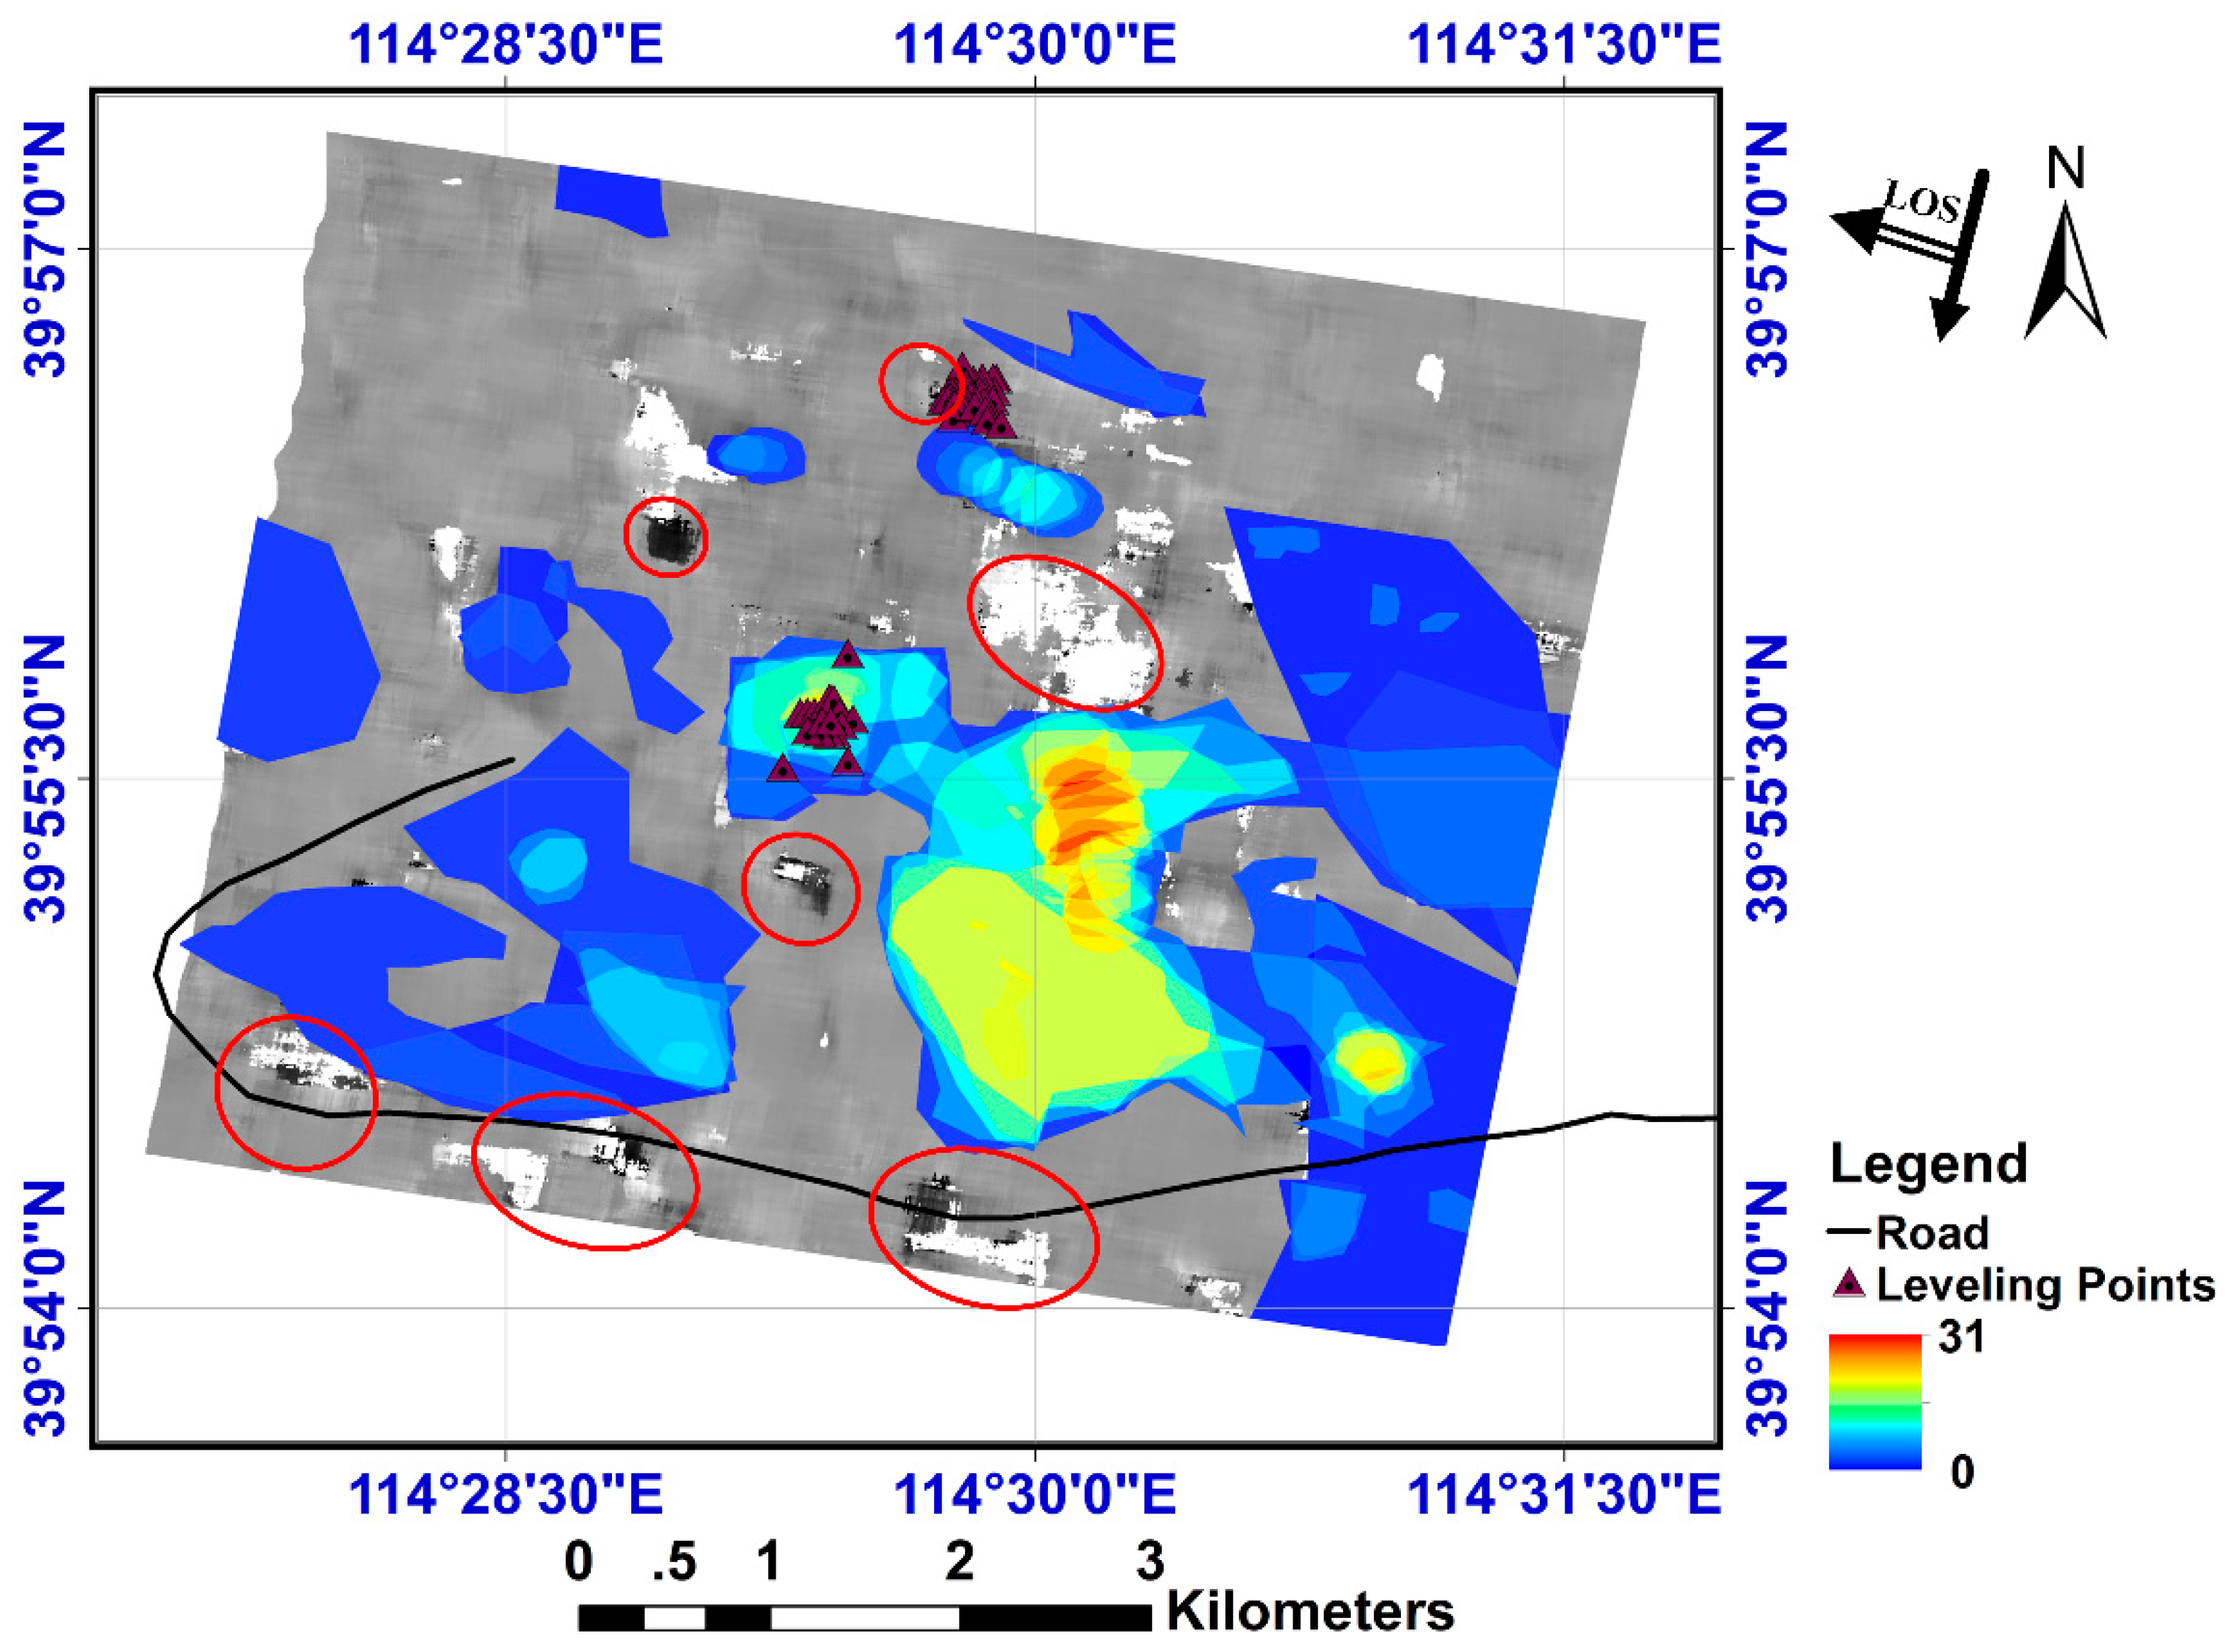
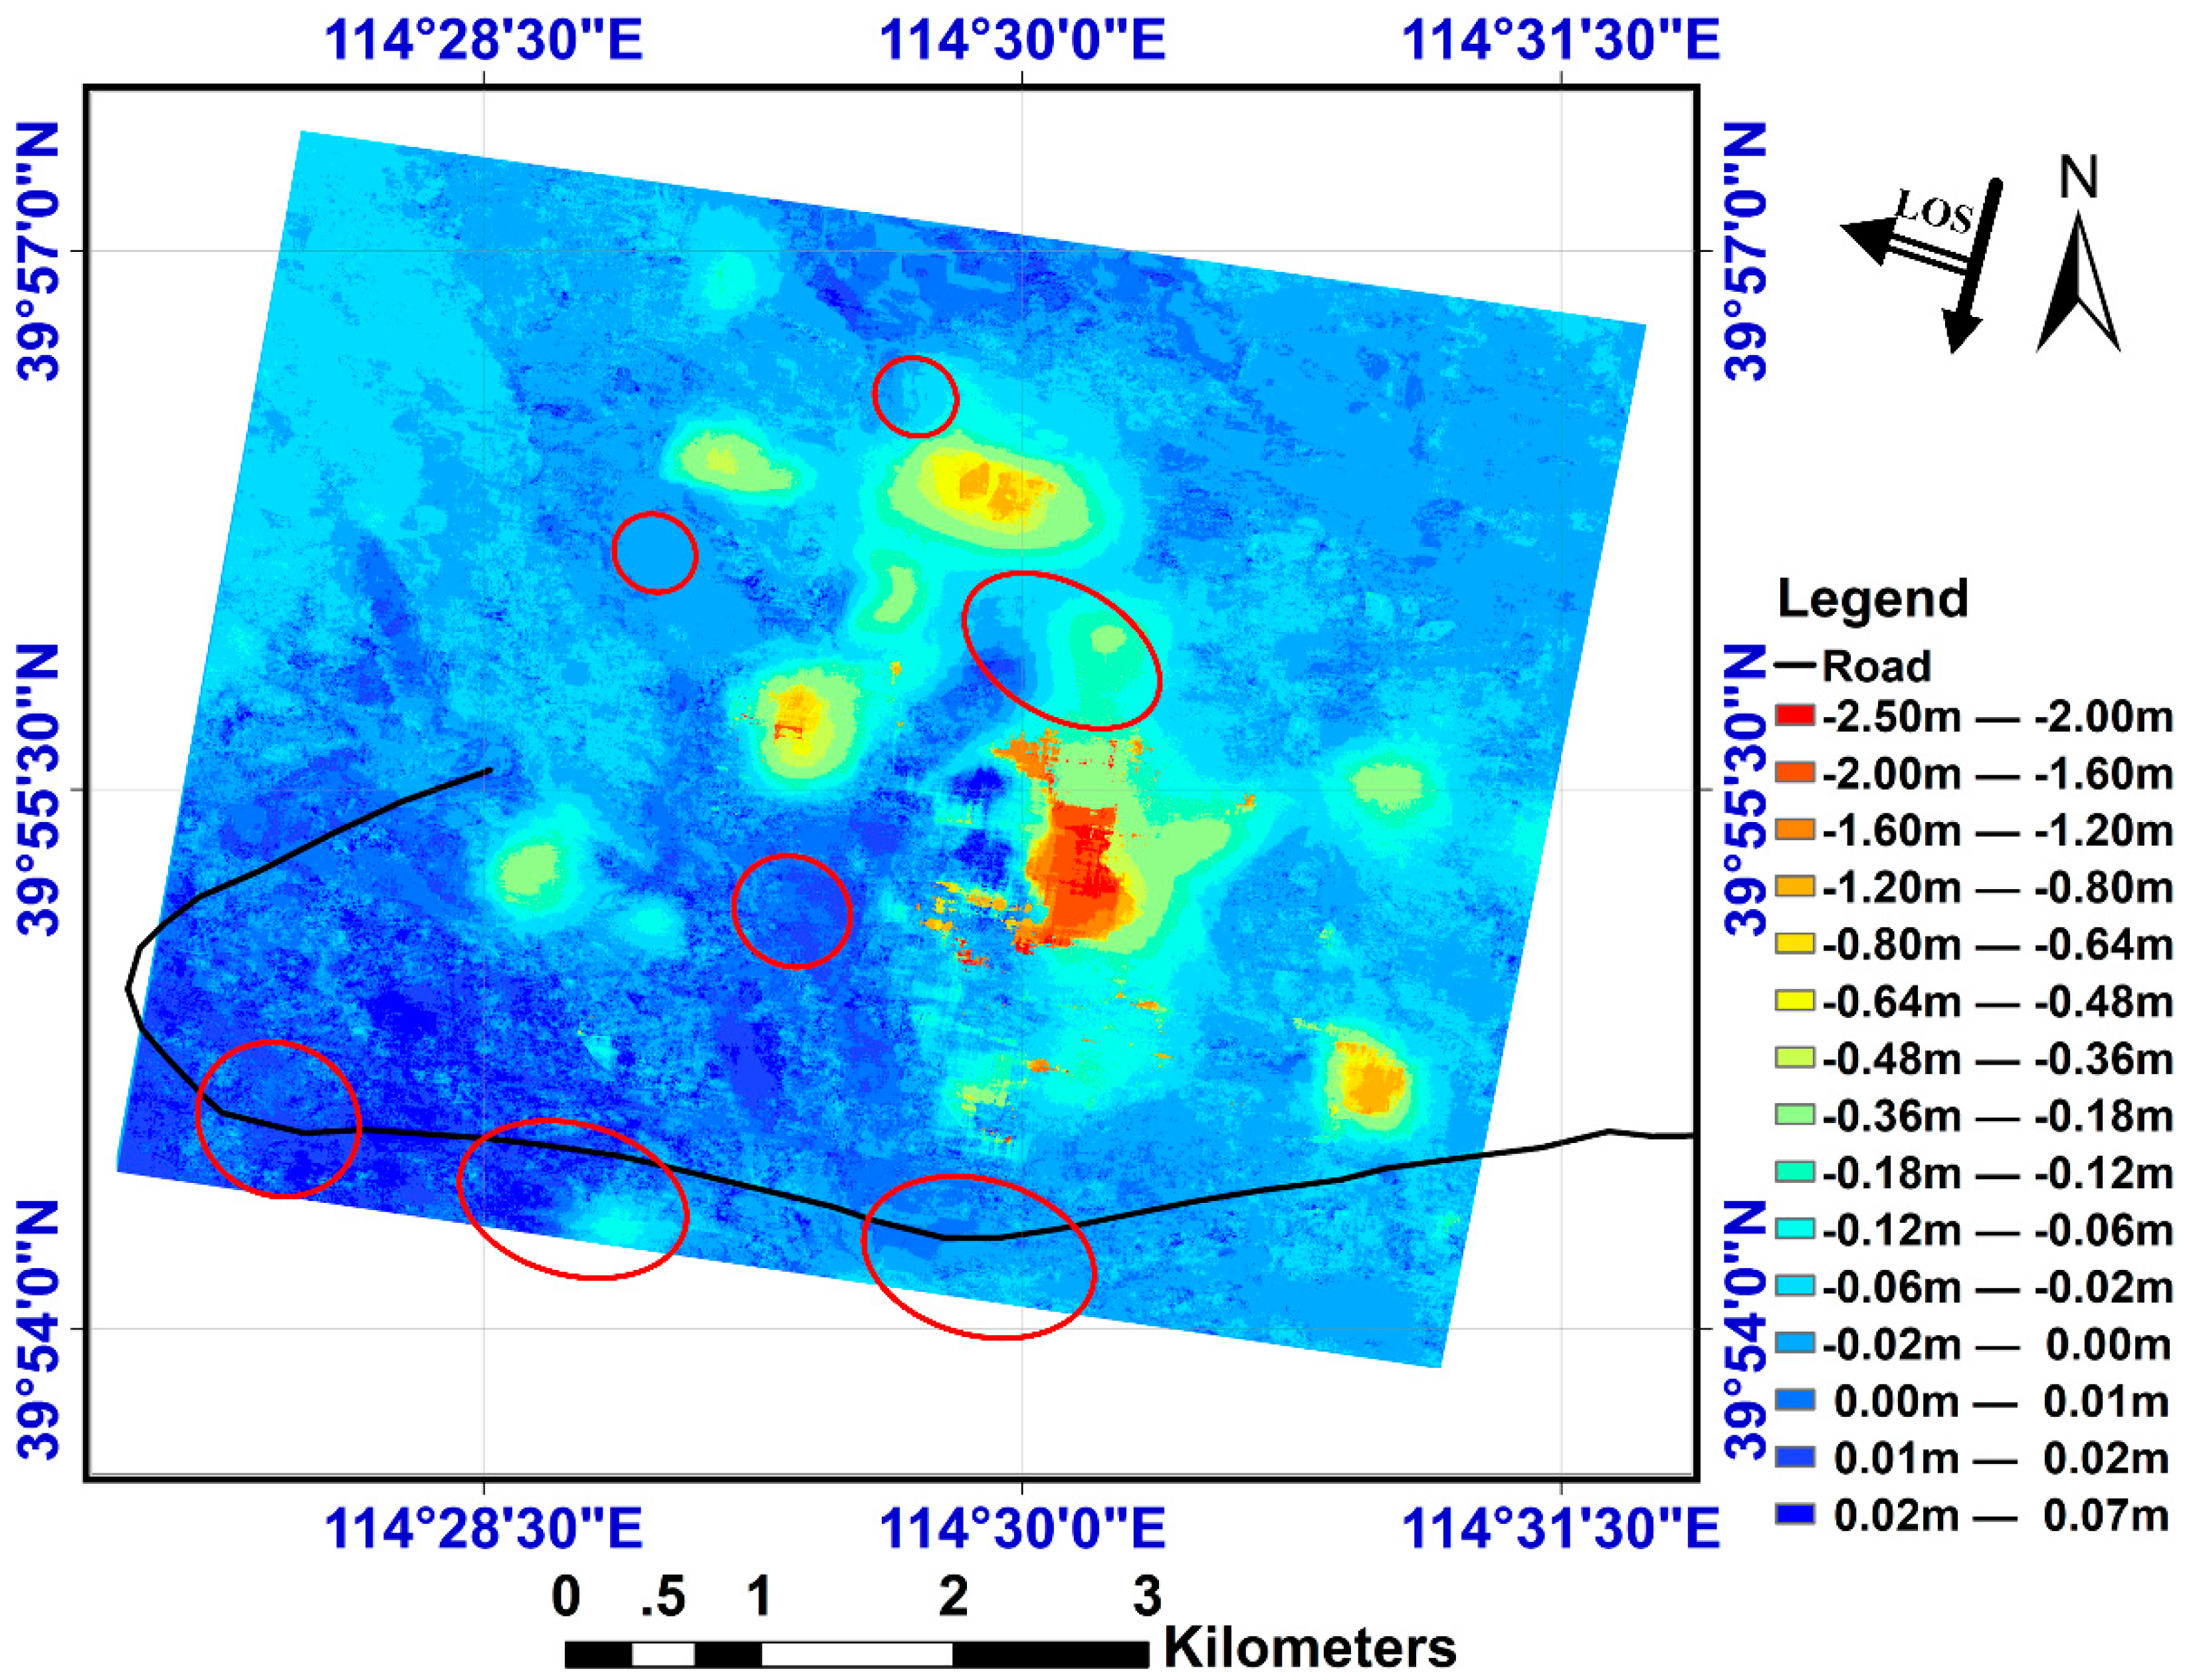
It can be seen that the pixel offset tracking method is suitable for obtaining the results when the ground deformation is large. After vectorizing all of the interferograms, we selected the vector diagrams from 20 June 2015 to 24 December 2015, which is the same as the pixel offset tracking. A union analysis in ArcGIS was then applied to the 17 vector diagrams. Finally, the spatial decorrelation distribution map was generated after summing the values in the vector diagrams, as shown in Figure 12.
The fusion result of D-InSAR and offset tracking achieved by the proposed method is shown in Figure 13, where the large-scale deformation marked in bright red could be detected by the D-InSAR technique. In addition, the study area where severe long-term decorrelation has occurred shows the phenomenon of the spatial decorrelation distribution map being greater than 20. The proposed method avoids the errors introduced by the pixel offset tracking method. The fusion result is consistent with the D-InSAR results, as shown in the red circles in Figure 13, where the pixel offset tracking results have been removed and replaced with the D-InSAR results. The spatial decorrelation distribution map shows high coherence. Unfortunately, we could not reach the largest subsidence area for a field investigation. Table 5 compares the results in the LOS direction between the fusion results, the offset tracking results, and the D-InSAR results with the leveling results. Because there were no leveling points in the area of maximum subsidence, the error calculated in that area was not considered. The mean absolute error of the fusion result was 0.0748 m, while that of D-InSAR was 0.1890 m, and that of offset tracking was 0.13584 m. These results suggest that many areas in the study zone are affected by large deformation. Our fusion method can take full advantage of the higher accuracy of offset tracking, as opposed to D-InSAR, in large deformation areas.
5. Discussion
These results show that the proposed fusion method based on the spatial decorrelation distribution map performs reliably and accurately in mining subsidence monitoring. When compared with the conventional D-InSAR, MT-InSAR, and pixel offset tracking methods, in most cases, the proposed fusion method was more robust. From Table 5, it can be seen that when the leveling results were larger than 0.3 m, the absolute error of D-InSAR was very large. However, D-InSAR presented good results in the low subsidence locations. With regard to the pixel offset tracking method, it shows instability in deformation monitoring. For instance, the absolute error shows irregularity, with both large and small subsidence. From the quantitative analysis in Table 5, we can also see that the proposed fusion method combines the advantages of D-InSAR with the advantages of the pixel offset tracking method. In addition, the proposed fusion method is not like other fusion methods which need additional data, such as GPS data, to improve the monitoring accuracy of large-scale subsidence in mining areas. Instead, the proposed fusion method only uses the spatial decorrelation distribution map generated by the union analysis method in ArcGIS. The error produced by D-InSAR and offset tracking can be reduced when the proposed fusion method is used because the purpose of the spatial decorrelation distribution map is to serve as a criterion for the fusion operation.
The ground deformation reached as high as 2.36 m in a part of the study area. Although the results in this area had no leveling points to validate their accuracy, they can be considered to be consistent with the actual situation since the value of the spatial decorrelation distribution map in this area is greater than 18, which indicates that this area showed serious decorrelation in the D-InSAR result during the monitoring period, and that the subsidence must be large.
Although we can obtain reliable subsidence results in a mining area through the use of the proposed fusion method, there are some limitations to its use. Firstly, the spatial decorrelation distribution map is generated manually so, to a certain extent, the accuracy of the fusion results is empirically affected. Secondly, some parameters of the decision rule are defined empirically. If the study area is very complex, it may be difficult to obtain the optimal parameters. Thirdly, it is also difficult to determine the optimal parameters for obtaining the optimal pixel offset tracking result in a mining area. Lastly, the time consumed to generate the spatial decorrelation distribution map and obtain the pixel offset tracking result is high.
In summary, the proposed fusion method based on a spatial decorrelation distribution map can be considered as an interesting and intuitive alternative for large-scale subsidence monitoring in mining areas. In addition, if an MT-InSAR result is available for the study area, it can be used in the decision fusion method for the advancement of subsidence accuracy, since MT-InSAR can remove the influence of the atmosphere. Alternatively, we could also generate the spatial decorrelation distribution map automatically through computer vision and image processing technology.
6. Conclusions
In this paper, we proposed a new fusion method based on a spatial decorrelation distribution map which is generated by union analysis in ArcGIS. The surface subsidence in the Cuijiazhai mining area between 20 June 2015 to 24 December 2015 was derived using decision fusion with the D-InSAR result and offset tracking result. The results indicated that when using the D-InSAR technique in the mining surface subsidence monitoring, a good performance can be obtained in mining areas where there is linear or low-gradient subsidence. However, because of the interferometric decorrelation caused by the large deformation gradient in the mining area, the result of D-InSAR did not meet the monitoring requirements. In the case of our study area, when using the MT-InSAR technique, the large deformation gradient areas could not be obtained, although the interferometric decorrelation could be mitigated owing to the small baseline strategy. As for the pixel offset tracking technique, it can be used to obtain the corresponding deformation by computing the offset of sub-pixels, which is suitable for a large-scale deformation area and can make up for the regional deformation obtained by D-InSAR and other techniques. In addition, we performed a large number of pixel offset tracking experiments, and we found that the optimal parameter setting was difficult to achieve in this study area because the surface is relatively flat.
The surface subsidence in mining areas caused by mining activities can be a serious threat to the safety of the surroundings. By combining the respective advantages of D-InSAR and pixel offset tracking technology, it is possible to monitor surface deformation in mining areas. The spatial decorrelation distribution map acts as a criterion for the fusion operation. In our experiments, the mean absolute error of the fusion result was 0.0748 m, while that of D-InSAR was 0.1890 m and that of offset tracking was 0.1358 m. This indicates that the proposed fusion method is more reliable than the individual methods in mining subsidence monitoring. Hence, the proposed fusion rule that combines the InSAR result and offset tracking result provides us with the ability to monitor high deformation areas while retaining a higher accuracy in the whole mining area. Overall, we can obtain more comprehensive information about the surface deformation monitoring of a mining area through a combination of D-InSAR, MT-InSAR technology, and the pixel offset tracking technique.
Author Contributions
D.O. and K.T. conceived and designed the experiments; D.O. performed the experiments; D.O., K.T., Y.C. and J. D. analyzed the data; D.O., K.T., Q.D. and Y.C. wrote the paper.
Funding
This research was supported in part by the National Natural Science Foundation of China (No. 41471356), the Xuzhou Scientific Funds (KC16SS092), and the Priority Academic Program Development of Jiangsu Higher Education Institutions.
Acknowledgments
TerraSAR-X SAR data used in this research was obtained courtesy of the German Aerospace Center DLR. SRTM is copyrighted by USGS.
Conflicts of Interest
The authors declare no conflict of interest.
References
- Guo, G. Research on ruptured rock mass deformation characteristics of longwall goafs. Sci. Technol. Eng. 2002, 2, 44–47. [Google Scholar]
- Vanicek, P.; Castle, R.O.; Balazs, E.I. Geodetic leveling and its applications. Rev. Geophys. 1980, 18, 505–524. [Google Scholar] [CrossRef]
- Gabriel, A.K.; Goldstein, R.M.; Zebker, H.A. Mapping small elevation changes over large areas: Differential radar interferometry. J. Geophys. Res. Atmos. 1989, 94, 9183–9191. [Google Scholar] [CrossRef]
- Bamler, R.; Hartl, P. Synthetic aperture radar interferometry. Inverse Probl. 1998, 14, 12–13. [Google Scholar] [CrossRef]
- Rosen, P.A.; Hensley, S.; Joughin, I.R.; Li, F.K.; Madsen, S.N.; Rodriguez, E.; Goldstein, R.M. Synthetic aperture radar interferometry. Proc. IEEE 2002, 88, 333–382. [Google Scholar] [CrossRef]
- Graham, L.C. Synthetic interferometer radar for topographic mapping. Proc. IEEE 1974, 62, 763–768. [Google Scholar] [CrossRef]
- Zebker, H.A.; Goldstein, R.M. Topographic mapping from interferometric synthetic aperture radar observations. J. Geophys. Res. 1986, 91, 4993–4999. [Google Scholar] [CrossRef]
- Zhong, L.; Mann, D.; Freymueller, J.T.; Meyer, D.J. Synthetic aperture radar interferometry of Okmok volcano, Alaska: Radar observations. J. Geophys. Res. Solid Earth 2000, 105, 10791–10806. [Google Scholar] [Green Version]
- Chen, Y.; Peltier, A.; Remy, D.; Perfettini, H.; Froger, J.L.; Darrozes, J.; Villeneuve, N.; Bonvalot, S. Long-term ground displacement observations using InSAR and GNSS at Piton de la Fournaise volcano between 2009 and 2014. Remote Sens. Environ. 2017, 194, 230–247. [Google Scholar] [CrossRef]
- Massonnet, D.; Rossi, M.; Carmona, C.; Adragna, F.; Peltzer, G.; Feigl, K.; Rabaute, T. The displacement field of the Landers earthquake mapped by radar interferometry. Nature 1993, 364, 138–142. [Google Scholar] [CrossRef]
- Ye, X.; Kaufmann, H.; Guo, X.F. Landslide monitoring in the three gorges area using D-InSAR and corner reflectors. Photogramm. Eng. Remote Sens. 2004, 70, 1167–1172. [Google Scholar] [CrossRef]
- Ng, H.M.; Ge, L.; Yan, Y.; Li, X.; Chang, H.C.; Zhang, K.; Rizos, C. Mapping accumulated mine subsidence using small stack of SAR differential interferograms in the Southern coalfield of New South Wales, Australia. Eng. Geol. 2010, 115, 1–15. [Google Scholar] [CrossRef]
- Chang, H.C.; Ge, L.; Rizos, C. DInSAR for mine subsidence monitoring using multi-source satellite SAR images. In Proceedings of the 2005 IEEE International Geoscience and Remote Sensing Symposium (IGARSS ’05), Seoul, South Korea, 29 July 2005; pp. 1742–1745. [Google Scholar]
- Ng, H.M.; Chang, H.C.; Ge, L.; Rizos, C.; Omura, M. Assessment of radar interferometry performance for ground subsidence monitoring due to underground mining. Earth Planets Space 2009, 61, 733–745. [Google Scholar] [CrossRef] [Green Version]
- Zhao, C.; Lu, Z.; Zhang, Q.; Yang, C.; Zhu, W. Mining collapse monitoring with SAR imagery data: A case study of Datong mine, China. J. Appl. Remote Sens. 2014, 8, 083574. [Google Scholar] [CrossRef]
- Michel, R.; Avouac, J.P.; Taboury, J. Measuring ground displacements from SAR amplitude images: Application to the Landers Earthquake. Geophys. Res. Lett. 1999, 26, 875–878. [Google Scholar] [CrossRef] [Green Version]
- Goldstein, R.M.; Zebker, H.A.; Werner, C.L. Satellite radar interferometry: Two-dimensional phase unwrapping. Radio Sci. 1988, 23, 713–720. [Google Scholar] [CrossRef]
- Ferretti, A.; Prati, C.; Rocca, F. Permanent scatterers in SAR interferometry. In Proceedings of the IEEE 1999 International Geoscience and Remote Sensing Symposium (IGARSS ’99), Hamburg, Germany, 28 June–2 July 1999; Volume 3, pp. 1528–1530. [Google Scholar]
- Berardino, P.; Fornaro, G.; Lanari, R.; Sansosti, E. A new algorithm for surface deformation monitoring based on small baseline differential SAR interferograms. IEEE Trans. Geosci. Remote Sens. 2002, 40, 2375–2383. [Google Scholar] [CrossRef]
- Zebker, H.A.; Villasenor, J. Decorrelation in interferometric Radar Echoes. IEEE Trans. Geosci. Remote Sens. 1992, 30, 950–959. [Google Scholar] [CrossRef]
- Hanssen, R.F. Radar Interferometry; Kluwer: Dordrecht, The Netherlands, 2001. [Google Scholar]
- Arciniegas, G.A.; Bijker, W.; Kerle, N.; Tolpekin, V.A. Coherence and amplitude-based analysis of seismogenic damage in Bam, Iran, using Envisat ASAR data. IEEE Trans. Geosci. Remote Sens. 2007, 45, 1571–1581. [Google Scholar] [CrossRef]
- Solari, L.; Raspini, F.; Del Soldato, M.; Bianchini, S.; Ciampalini, A.; Ferrigno, F.; Tucci, S.; Casagli, N. Satellite radar data for back-analyzing a landslide event: The Ponzano (Central Italy) case study. Landslides 2018, 15, 773–782. [Google Scholar] [CrossRef]
- Strozzi, T.; Luckman, A.; Murray, T.; Wegmuller, U.; Werner, C.L. Glacier motion estimation using SAR offset-tracking procedures. IEEE Trans. Geosci. Remote Sens. 2002, 40, 2384–2391. [Google Scholar] [CrossRef] [Green Version]
- Yan, S.; Liu, G.; Wang, Y.; Ruan, Z. Accurate determination of glacier surface velocity fields with a dem-assisted pixel-tracking technique from SAR imagery. Remote Sens. 2015, 7, 10898–10916. [Google Scholar] [CrossRef]
- Leprince, S.; Barbot, S.; Ayoub, F.; Avouac, J.P. Automatic and precise orthorectification, coregistration, and subpixel correlation of satellite images, application to ground deformation measurements. IEEE Trans. Geosci. Remote Sens. 2007, 45, 1529–1558. [Google Scholar] [CrossRef]
- Scambos, T.A.; Dutkiewicz, M.J.; Wilson, J.C.; Bindschadler, R.A. Application of image cross-correlation to the measurement of glacier velocity using satellite image data. Remote Sens. Environ. 1992, 42, 177–186. [Google Scholar] [CrossRef]
- Shi, X.; Zhang, L.; Balz, T.; Liao, M. Landslide deformation monitoring using point-like target offset tracking with multi-mode high-resolution TerraSAR-X data. ISPRS J. Photogramm. Remote Sens. 2015, 105, 128–140. [Google Scholar] [CrossRef]
- Singleton, A.; Li, Z.; Hoey, T.; Muller, J.P. Evaluating sub-pixel offset techniques as an alternative to D-InSAR for monitoring episodic landslide movements in vegetated terrain. Remote Sens. Environ. 2014, 147, 133–144. [Google Scholar] [CrossRef]
- Casu, F.; Manconi, A.; Pepe, A.; Lanari, R. Deformation time-series generation in areas characterized by large displacement dynamics: The SAR amplitude pixel-offset SBAS technique. IEEE Trans. Geosci. Remote Sens. 2011, 49, 2752–2763. [Google Scholar] [CrossRef]
- Andrea, M.; Francesco, C. Joint analysis of displacement time series retrieved from SAR phase and amplitude: Impact on the estimation of volcanic source parameters. Geophys. Res. Lett. 2012, 39, 956–957. [Google Scholar]
- Erten, E.; Reigber, A.; Hellwich, O.; Prats, P. Glacier velocity monitoring by maximum likelihood texture tracking. IEEE Trans. Geosci. Remote Sens. 2009, 47, 394–405. [Google Scholar] [CrossRef] [Green Version]
- Samsonov, S.; Tiampo, K. Analytical optimization of a DInSAR and GPS dataset for derivation of three-dimensional surface motion. IEEE Geosci. Remote Sens. Lett. 2006, 3, 107–111. [Google Scholar] [CrossRef]
- Currenti, G.; Napoli, R.; Negro, C.D. Toward a realistic deformation model of the 2008 magmatic intrusion at etna from combined DInSAR and GPS observations. Earth Planet. Sci. Lett. 2011, 312, 22–27. [Google Scholar] [CrossRef]
- Yan, Y.; Trouvé, E.; Pinel, V.; Mauris, G.; Pathier, E.; Galichet, S. Fusion of D-InSAR and sub-pixel image correlation measurements for coseismic displacement field estimation: Application to the Kashmir earthquake (2005). Int. J. Image Data Fusion 2012, 3, 71–92. [Google Scholar] [CrossRef]
- Baran, I.; Stewart, M.; Claessens, S. A new functional model for determining minimum and maximum detectable deformation gradient resolved by satellite radar interferometry. IEEE Trans. Geosci. Remote Sens. 2005, 43, 675–682. [Google Scholar] [CrossRef]
- Hooper, A.; Bekaert, D.; Spaans, K.; Arıkan, M. Recent advances in SAR interferometry time series analysis for measuring crustal deformation. Tectonophysics 2011, 514, 1–13. [Google Scholar] [CrossRef]
- Hooper, A.; Segall, P.; Zebker, H. Persistent scatterer interferometric synthetic aperture radar for crustal deformation analysis, with application to Volcán Alcedo, Galápagos. J. Geophys. Res. Atmos. 2007, 112, B07407. [Google Scholar] [CrossRef]
- Lanari, R.; Mora, O.; Manunta, M.; Mallorqui, J.J. A small-baseline approach for investigating deformations on full-resolution differential SAR interferograms. IEEE Trans. Geosci. Remote Sens. 2004, 42, 1377–1386. [Google Scholar] [CrossRef]
- Strozzi, T.; Wegmuller, U.; Keusen, H.R.; Graf, K.; Wiesmann, A. Analysis of the terrain displacement along a funicular by SAR interferometry. IEEE Geosci. Remote Sens. Lett. 2006, 3, 15–18. [Google Scholar] [CrossRef]
- Chen, B.; Deng, K.; Fan, H.; Hao, M. Large-scale deformation monitoring in mining area by D-InSAR and 3D laser scanning technology integration. Int. J. Min. Sci. Technol. 2013, 23, 555–561. [Google Scholar] [CrossRef]
- Giles, A.B.; Massom, R.A.; Warner, R.C. A method for sub-pixel scale feature-tracking using RadarSAT images applied to the Mertz Glacier Tongue, East Antarctica. Remote Sens. Environ. 2009, 113, 1691–1699. [Google Scholar] [CrossRef]
- Debella-Gilo, M.; Kääb, A. Sub-pixel precision image matching for measuring surface displacements on mass movements using normalized cross-correlation. Remote Sens. Environ. 2011, 115, 130–142. [Google Scholar] [CrossRef] [Green Version]
- Massonnet, D.; Feigl, K.L. Radar interferometry and its application to changes in the Earth’s surface. Rev. Geophys. 1998, 36, 441–500. [Google Scholar] [CrossRef]
Figure 1.
Shaded relief map of the study area over Yuxian, China. The black frame represents the coverage of the descending TerraSAR-X images used in the study. The red frame indicates the study area. The inset map shows the location of the study area in China.
Figure 1.
Shaded relief map of the study area over Yuxian, China. The black frame represents the coverage of the descending TerraSAR-X images used in the study. The red frame indicates the study area. The inset map shows the location of the study area in China.

Figure 2.
(a) The positions of the ground leveling points located in Cuijiazhai mine. (b) The leveling points located in Maizipo village. (c) The leveling points located in Cuijiazhai village.
Figure 2.
(a) The positions of the ground leveling points located in Cuijiazhai mine. (b) The leveling points located in Maizipo village. (c) The leveling points located in Cuijiazhai village.

Figure 3.
(a) Assignment value of 1. (b) Assignment value of 2. (c) Assignment value of 3. (d) Assignment value of 4.
Figure 3.
(a) Assignment value of 1. (b) Assignment value of 2. (c) Assignment value of 3. (d) Assignment value of 4.

Figure 4.
Subset of the wrapped interferograms generated by the two-pass differential interferometric synthetic aperture radar (D-InSAR) method.
Figure 4.
Subset of the wrapped interferograms generated by the two-pass differential interferometric synthetic aperture radar (D-InSAR) method.

Figure 5.
The overall subsidence (line-of-sight (LOS) direction) from 09 June 2015 to 24 December 2015 derived from D-InSAR. Region 1 is the Cuijiazhai area, and Region 2 is the Maizipo area. The green triangular legends represent the leveling points, and the black star represents the reference point of the unwrapping. The black line represents a road.

Figure 6.
The accumulated subsidence of the D-InSAR result compared with the leveling result. (a) Point S41, located in Maizipo. (b) Point S39, located in Maizipo. (c) Point S19, located in Cuijiazhai. (d) Point S06, located in Cuijiazhai. The locations of the leveling points are shown in Figure 5.
Figure 6.
The accumulated subsidence of the D-InSAR result compared with the leveling result. (a) Point S41, located in Maizipo. (b) Point S39, located in Maizipo. (c) Point S19, located in Cuijiazhai. (d) Point S06, located in Cuijiazhai. The locations of the leveling points are shown in Figure 5.

Figure 7.
(a) Interferogram formation of PS processing. The image obtained on 27 September 2015 was used as the master image. (b) The subsidence rate (mm/year) of the PS result, where the mining areas with large-scale subsidence have no data due to the decorrelation.
Figure 7.
(a) Interferogram formation of PS processing. The image obtained on 27 September 2015 was used as the master image. (b) The subsidence rate (mm/year) of the PS result, where the mining areas with large-scale subsidence have no data due to the decorrelation.

Figure 8.
(a) The baselines of the 30 generated interferometric imaging pairs. (b) The subsidence rate (mm/year) of the SBAS result, where the mining areas with large-scale subsidence have no data.
Figure 8.
(a) The baselines of the 30 generated interferometric imaging pairs. (b) The subsidence rate (mm/year) of the SBAS result, where the mining areas with large-scale subsidence have no data.

Figure 9.
Wrapped interferogram generated from 20 June 2015 to 24 December 2015 by the two-pass D-InSAR method.
Figure 9.
Wrapped interferogram generated from 20 June 2015 to 24 December 2015 by the two-pass D-InSAR method.

Figure 10.
The pixel offset tracking results. The points are the leveling points and the lines are the profile lines.
Figure 10.
The pixel offset tracking results. The points are the leveling points and the lines are the profile lines.

Figure 11.
(a) AA’ profile line, located in Maizipo. (b) BB’ profile line. (c) CC’ profile line, located in Cuijiazhai. (d) DD’ profile line.
Figure 11.
(a) AA’ profile line, located in Maizipo. (b) BB’ profile line. (c) CC’ profile line, located in Cuijiazhai. (d) DD’ profile line.

Figure 12.
Spatial decorrelation distribution map (where the maximum value is 31, and a higher value means more serious decorrelation). The background image shows the pixel offset tracking result. The red circles indicate the areas where the pixel offset tracking method produced wrong values or no values due to high coherence.

Figure 13.
The fusion result of D-InSAR and offset tracking. The red circles indicate the areas where the pixel offset tracking method produced wrong values or no values due to high coherence, as shown in Figure 12.
Figure 13.
The fusion result of D-InSAR and offset tracking. The red circles indicate the areas where the pixel offset tracking method produced wrong values or no values due to high coherence, as shown in Figure 12.


Table 1.
The parameters of the TSX images.
| Mode | Pass/Look Direction | Incidence Angle | Orbit | Polarization | Range of Pixel Spacing | Azimuth Pixel Spacing |
|---|---|---|---|---|---|---|
| SpotLight | Descending/right look | ~28.69° | 28 | HH | ~0.909 m | ~1.896 m |
Table 2.
Basic parameters of the interferometric imaging pairs.
| Master Image | Slave Image | Perpendicular Baseline (m) | Master Image | Slave Image | Perpendicular Baseline (m) |
|---|---|---|---|---|---|
| 09 June 2015 | 20 June 2015 | 150 | 27 September 2015 | 08 October 2015 | −102 |
| 20 June 2015 | 01 July 2015 | 61 | 08 October 2015 | 19 October 2015 | −97 |
| 01 July 2015 | 12 July 2015 | 26 | 19 October 2015 | 30 October 2015 | 233 |
| 12 July 2015 | 23 July 2015 | −198 | 30 October 2015 | 10 November 2015 | 45 |
| 23 July 2015 | 03 August 2015 | 26 | 10 November 2015 | 21 November 2015 | 101 |
| 03 August 2015 | 14 August 2015 | 246 | 21 November 2015 | 02 December 2015 | −230 |
| 14 August 2015 | 25 August 2015 | −106 | 02 December 2015 | 13 December 2015 | 105 |
| 25 August 2015 | 05 September 2015 | −95 | 13 December 2015 | 24 December 2015 | −6 |
| 05 September 2015 | 16 September 2015 | −43 | 24 December 2015 | 04 January 2016 | −53 |
| 16 September 2015 | 27 September 2015 | 100 |
Table 3.
The basic parameters of the two selected synthetic aperture radar (SAR) images.
| Acquisition Time | Polarization | Pixel Spacing (Range) | Pixel Spacing (Azimuth) | Perpendicular Baseline |
|---|---|---|---|---|
| 20 June 2015 | HH | ~0.909 m | ~1.896 m | 63.4537 m |
| 24 December 2015 | HH |
Table 4.
Comparison between the offset tracking result and the leveling result in the LOS direction (m).
Table 4.
Comparison between the offset tracking result and the leveling result in the LOS direction (m).
| No. | Offset Tracking | Leveling (LOS) | Absolute Error |
|---|---|---|---|
| S1 | −0.3186 | −0.6164 | 0.2978 |
| S2 | −0.6400 | −0.7968 | 0.1568 |
| S3 | −0.2725 | −0.5545 | 0.2820 |
| S4 | −0.2056 | −0.3617 | 0.1561 |
| S5 | −0.5175 | −0.6674 | 0.1499 |
| S6 | −0.6422 | −0.7093 | 0.0671 |
| S7 | −0.6543 | −0.7192 | 0.0649 |
| S8 | −0.6854 | −0.8312 | 0.1458 |
| S9 | −0.8026 | −0.8469 | 0.0443 |
| S10 | −0.7132 | −0.8764 | 0.1632 |
| S11 | −0.7608 | −0.8507 | 0.0899 |
| S12 | −0.7654 | −0.7363 | −0.0291 |
| S13 | −0.2910 | −0.1045 | −0.1865 |
| S14 | 0.1116 | −0.0622 | 0.1738 |
| S15 | 0.0869 | −0.0627 | 0.1496 |
| S16 | 0.1277 | −0.0534 | 0.1811 |
| S17 | 0.0798 | −0.0576 | 0.1374 |
| S18 | 0.0138 | −0.0656 | 0.0794 |
| S19 | −0.0336 | −0.0718 | 0.0382 |
| S20 | 0.0567 | −0.0673 | 0.1240 |
Table 5.
Comparison between the fusion results, the D-InSAR results, the offset tracking results, and the leveling results in the LOS direction.
Table 5.
Comparison between the fusion results, the D-InSAR results, the offset tracking results, and the leveling results in the LOS direction.
| No. | Results in the LOS Direction (m) | Absolute Error (m) | |||||
|---|---|---|---|---|---|---|---|
| Leveling | D-InSAR | Offset Tracking | Fusion Result | D-InSAR | Offset Tracking | Fusion | |
| S1 | −0.6164 | −0.4496 | −0.3186 | −0.4496 | 0.1668 | 0.2978 | 0.1668 |
| S2 | −0.7968 | −0.4459 | −0.6400 | −0.6400 | 0.3509 | 0.1568 | 0.1568 |
| S3 | −0.5545 | −0.4235 | −0.2725 | −0.4235 | 0.1311 | 0.2820 | 0.1311 |
| S4 | −0.3617 | −0.3173 | −0.2056 | −0.3173 | 0.0444 | 0.1560 | 0.0444 |
| S5 | −0.6674 | −0.4254 | −0.5175 | −0.4759 | 0.2420 | 0.1500 | 0.1915 |
| S6 | −0.7094 | −0.3720 | −0.6422 | −0.5130 | 0.3373 | 0.0671 | 0.1964 |
| S7 | −0.7192 | −0.3554 | −0.6543 | −0.6543 | 0.3637 | 0.0648 | 0.0648 |
| S8 | −0.8312 | −0.3977 | −0.6854 | −0.6854 | 0.4335 | 0.1458 | 0.1458 |
| S9 | −0.8469 | −0.3995 | −0.8026 | −0.8026 | 0.4474 | 0.0443 | 0.0443 |
| S10 | −0.8764 | −0.4181 | −0.7132 | −0.6848 | 0.4583 | 0.1633 | 0.1917 |
| S11 | −0.8507 | −0.4258 | −0.7608 | −0.7608 | 0.4250 | 0.0899 | 0.0899 |
| S12 | −0.7363 | −0.4159 | −0.7654 | −0.7654 | 0.3204 | −0.0291 | −0.0291 |
| S13 | −0.1045 | −0.0800 | −0.2910 | −0.1140 | 0.0245 | −0.1865 | −0.0096 |
| S14 | −0.0622 | −0.0646 | 0.1116 | −0.0646 | -0.0024 | 0.1738 | −0.0024 |
| S15 | −0.0627 | −0.0660 | 0.0869 | −0.0660 | −0.0033 | 0.1496 | −0.0033 |
| S16 | −0.0534 | −0.0566 | 0.1277 | −0.0566 | −0.0032 | 0.1811 | −0.0032 |
| S17 | −0.0576 | −0.0644 | 0.0798 | −0.0644 | −0.0067 | 0.1374 | −0.0067 |
| S18 | −0.0656 | −0.0619 | 0.0138 | −0.0619 | 0.0037 | 0.0794 | 0.0037 |
| S19 | −0.0718 | −0.0617 | −0.0336 | −0.0617 | 0.0101 | 0.0382 | 0.0101 |
| S20 | −0.0673 | −0.0631 | 0.0567 | −0.0631 | 0.0042 | 0.1240 | 0.0042 |
| Mean | −0.4556 | −0.2682 | −0.3413 | −0.3862 | 0.1874 | 0.1143 | 0.0694 |
| Mean. Abs | 0.4556 | 0.2682 | 0.3890 | 0.3862 | 0.1890 | 0.1358 | 0.0748 |
© 2018 by the authors. Licensee MDPI, Basel, Switzerland. This article is an open access article distributed under the terms and conditions of the Creative Commons Attribution (CC BY) license (http://creativecommons.org/licenses/by/4.0/).
Share and Cite
MDPI and ACS Style
Ou, D.; Tan, K.; Du, Q.; Chen, Y.; Ding, J. Decision Fusion of D-InSAR and Pixel Offset Tracking for Coal Mining Deformation Monitoring. Remote Sens. 2018, 10, 1055. https://0-doi-org.brum.beds.ac.uk/10.3390/rs10071055
AMA Style
Ou D, Tan K, Du Q, Chen Y, Ding J. Decision Fusion of D-InSAR and Pixel Offset Tracking for Coal Mining Deformation Monitoring. Remote Sensing. 2018; 10(7):1055. https://0-doi-org.brum.beds.ac.uk/10.3390/rs10071055
Chicago/Turabian StyleOu, Depin, Kun Tan, Qian Du, Yu Chen, and Jianwei Ding. 2018. "Decision Fusion of D-InSAR and Pixel Offset Tracking for Coal Mining Deformation Monitoring" Remote Sensing 10, no. 7: 1055. https://0-doi-org.brum.beds.ac.uk/10.3390/rs10071055
Note that from the first issue of 2016, this journal uses article numbers instead of page numbers. See further details here.