Next Article in Journal
Panoramic Image and Three-Axis Laser Scanner Integrated Approach for Indoor 3D Mapping
Next Article in Special Issue
Assessing Impacts of Urban Form on Landscape Structure of Urban Green Spaces in China Using Landsat Images Based on Google Earth Engine
Previous Article in Journal
Assessment of Radiometric Resolution Impact on Remote Sensing Data Classification Accuracy
 
 
Erratum published on 11 September 2020, see Remote Sens. 2020, 12(18), 2965.
Article

Linking Heat Source–Sink Landscape Patterns with Analysis of Urban Heat Islands: Study on the Fast-Growing Zhengzhou City in Central China

1
Key Research Institute of Yellow River Civilization and Sustainable Development & Collaborative Innovation Center on Yellow River Civilization of Henan Province, Henan University, Kaifeng 475001, China
2
College of Environment and Planning, Henan University, Kaifeng 475004, China
3
Department of Geography, Kent State University, Kent, OH 44242-0001, USA
4
Department of Environment Science and Engineering, Jiangwang campus, Fudan University, 2005 Songhu Road, Shanghai 200438, China
5
Urban Informatics and Spatial Computing Lab, Department of Informatics, New Jersey Institute of Technology, Newark, New Jersey 07102, USA
6
Nanjing Institute of Geography and Limnology, Chinese Academy of Sciences, Nanjing 210008, China
*
Author to whom correspondence should be addressed.
Submission received: 5 July 2018 / Revised: 8 August 2018 / Accepted: 9 August 2018 / Published: 11 August 2018
(This article belongs to the Special Issue Remote Sensing of Urban Ecology and Sustainability)

Abstract

:
Globally, the urban heat island (UHI) effect is a major problem which leads to urban residents suffering from adverse urban ecological environments and serious health risks. Understanding the impacts of urban landscape features on the thermal environment has been an important focus across various fields of research. The purpose of this study is to analyze the impacts of urban heat source–sink landscape patterns on urban heat islands, using the fast-growing Zhengzhou City in central China as the case study. Landsat data (captured in 1996, 2006, and 2014), various geospatial approaches, and correlation analysis were applied to facilitate the analysis. Based on the contributions of the urban landscape to land surface temperature (LST), we empirically identified the heat sources and heat sinks. Then, the composition and configurations of heat source and sink landscapes were estimated by a series of spatial metrics at the landscape and class levels. The results showed that the overall mean land surface temperature (LST) in the study area increased by 2.72 °C from 1996 to 2014. This observed increasing trend in overall mean LST is consistent with the process of rapid urbanization in the study area, which was evidenced by the dramatic increase in impervious surfaces and the substantial loss in vegetation cover. Generally, as observed, landscape composition has a stronger influence on LST than does landscape configuration. For heat sources, the proportion, size, aggregation, and density of patches have positive effects on LST, while adjusting the spatial distribution and abundance of urban landscape are effective ways to control the UHI effects. In contrast, the percentage, size, density, and aggregation of heat sink patches have negative effects on LST. Additionally, the effects of increasing total patch edges and shape complexity should be considered when mitigating the UHI effect. These findings are beneficial for furthering our understanding of how urban landscape patterns affect UHI, and they can help optimize urban landscape patterns to alleviate the UHI effect and enhance sustainable development in the study area.

Graphical Abstract

1. Introduction

Rapid urbanization changes the features of natural land surfaces into impervious surfaces [1,2], and these landscape changes are a direct consequence of sharp urban development [3,4]. Specifically, the process of increasing urbanization has been accompanied by a series of environmental issues, one of which is the urban heat island (UHI) effect [5]. The UHI is a phenomenon that describes the occurrence of warmer air temperatures in urban areas than those in the surrounding rural areas [6,7,8,9]. The UHI effect can have detrimental impacts on the living environment, human health, and overall urban biosphere [10]; thus, the UHI effect has been a major research theme across various interrelated fields of study [11,12,13]. Research on the UHI effect could contribute to the mitigation of the adverse impacts on the urban living environment and promote sustainable development.
According to previous studies, the UHI effect is classified into three types: the first type is surface UHI (SUHI), which is calculated based on land surface temperature (LST), and the other two types are boundary and atmospheric UHI. In recent years, the importance of SUHI has increasingly been recognized because the methodological advancement of thermal infrared remote sensing indeed provides opportunities to measure LST from space and characterize spatiotemporal structures [14,15]. LST has been one of the most important parameters used in the investigation of UHI effects based on the application of satellite images [10,16,17]. This study focuses on the surface UHI, and remote sensing tools and thermal band images are employed to retrieve LST. Currently, the relationship between landscape pattern and LST has received considerable attention, and many previous studies have extensively presented and estimated the effects of land use/land cover (LULC) characteristics on LST [18,19,20,21,22], especially between LST and the abundance and spatial patterns of vegetation and impervious surfaces [23,24,25]. These studies have found that impervious surface has the largest contribution to LST; in contrast, vegetated landscapes are generally beneficial and decrease LST [2,26]. In addition, multiresolution analyses and spatial metrics are the most popular methods for assessing the impacts of urban landscape patterns on LST [22]. Previous research provides valuable insights into mitigating the UHI effect. However, there are still few surface UHI studies that have investigated the impacts of landscape composition and configuration on LST; additionally, the previous literature based on conventional LULC classification methods failed to consider the effects of other factors of the landscape pattern, such as patch density, patch shape, and patch configuration, which increase the uncertainties in exploring the relationship between landscape pattern and UHI [5]. Hence, one of the most important research topics is to study the impact of landscapes of different sizes, shapes, and configurations on the UHI effect, and a synthetic research method is needed to address how landscape patterns affect UHI; this would provide an effective approach that could be used to reveal regional ecological status and spatial variability.
This study aims to more accurately explore the impacts of landscape compositions and configurations on UHIs using the source–sink theory of landscape ecology. The concepts of sources and sinks are frequently used in studies on the carbon cycle [27], atmospheric pollution [28,29,30], and other ecological topics [14,31]. A source landscape generally refers to a landscape that promotes ecological processes; in contrast, a sink landscape generally refers to a landscape that weakens ecological processes [32]. For the thermal environment, source and sink areas encompass a new type of dual information about landscape patterns and ecological processes that are independent of scale, and the contributions of sink and source landscapes to the UHI determine the intensity of the UHI [33]. The LULC types that can help to mitigate the UHI effect are considered as heat sink landscapes due to their weakening effects. Conversely, the LULC categories that commonly generate UHI effect are defined as heat source landscapes because of their positive contributions to the thermal environment. This LULC classification aims to provide some insights into the advancement of UHI research, and it can distinguish the potential contributions of heat sink and heat source landscapes to the UHI effect and decrease uncertainty when exploring the relationships between landscape patterns and UHI [5]. Hence, it can be assumed that the various compositions, shapes, and spatial configurations of source and sink landscapes may affect the LST distribution. This method has contributed to the strict understanding of ecological processes and spatial variability under the landscape ecology framework [32]. Therefore, analyzing the thermal effects of heat sources and heat sinks and understanding the associations between UHI and landscape patterns can provide valuable information for landscape planning and produce effective measures for mitigating the UHI effect.
Worldwide, different varieties of city types have been analyzed for UHI effect in existing studies, ranging from tropical cities to mountain cities [13,34] and from desert cities to coastal cities [35,36]. However, only a few scholars have paid attention to the thermal environment issues in China’s inland megacities so far [37]. In fact, inland China has experienced unprecedented urbanization over the past several decades and produced a series of environmental problems. Therefore, more urbanization-related research like on the UHI effect has been an issue of concern, as it links healthier and more comfortable urban living environments with modifications of urban climate. This study contributes to the current literature in three ways: First we propose to explore the effects of landscape compositions and configurations on urban thermal environment from a source–sink perspective. The advantage of using the source–sink concepts is that investigating the relationship between landscape pattern and UHI effect can reduce uncertainties and increase accuracy compared with the previous studies. Second, we use the contribution index model to analyze urban landscapes and their thermal effects; this contributes to understanding source–sink landscape patterns and their ecological processes. Additionally, this research was implemented in Zhengzhou City, one of the rapidly urbanizing metropolitan regions in inland China. Using Landsat-5 TM and Landsat-8 OLI image data and various geospatial methods, including profile analysis and landscape metrics, we analyzed the spatiotemporal variations in land surface temperature (LST) and explored the relationship between LST and landscape features using the source–sink theory. A synthetical investigation of the results can provide valuable information in terms of optimizing urban landscape patterns to mitigate UHI effect and promote sustainable urban development. Besides this, this study can serve as a significant reference for other regions experiencing rapid urbanization and for other inland cities around the world. The specific objectives of this paper are as follows: (1) profile spatiotemporal variations in LST using geospatial methods; (2) explore how to identify heat sink and heat source landscapes; (3) analyze how landscape composition and patterns impact LST and how this effect is influenced by heat sink and source patches; and (4) explore the relationship between landscape pattern and LST by statistical analysis.

2. Data and Methodology
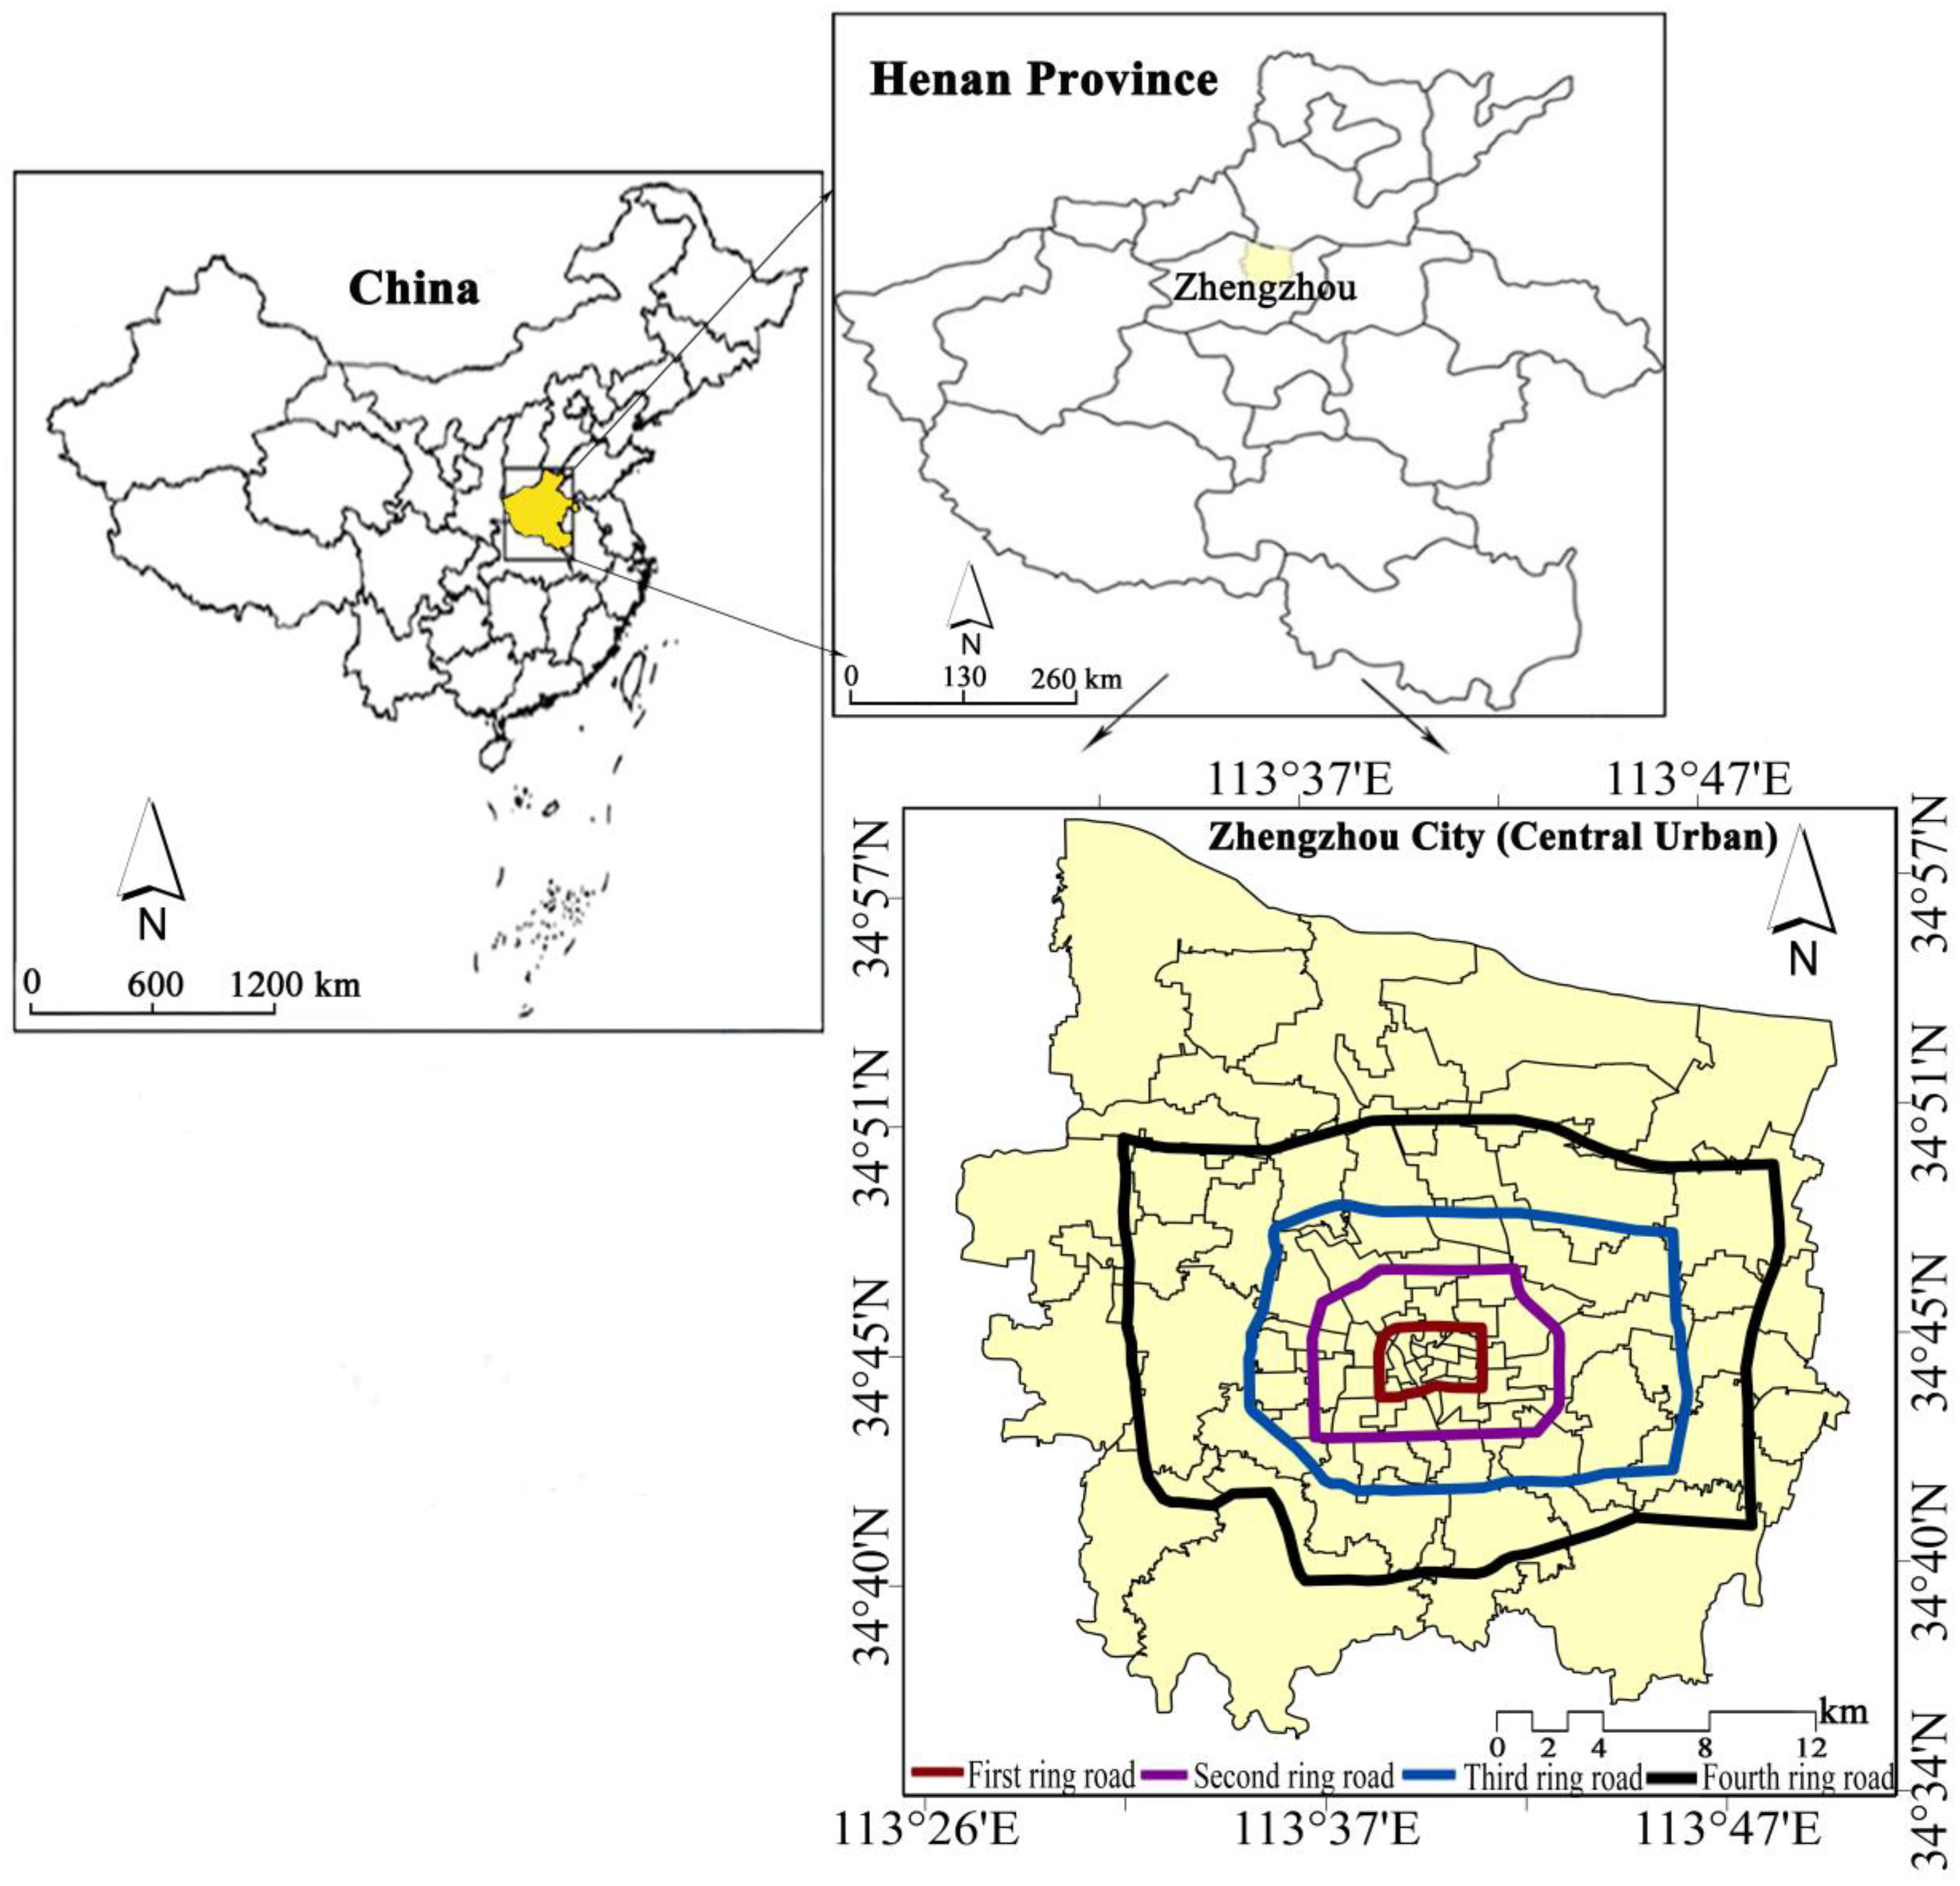
2.1. Study Area

Zhengzhou City well lends itself to assessing the dynamics of the UHI effect because it is a typically fast-growing metropolitan region which is experiencing rapid industrialization and urbanization in China; additionally, it has huge economic growth and a dense population. Zhengzhou is located in central China (112°42′E–114°14′E, 34°16′N–34°58′N) (Figure 1), and the city covers an area of about 7446.2 km2. Zhengzhou is the capital of Henan Province, making it an important central city and transportation hub in central China, and the city has a long history that dates back more than 5300 years. Currently, as the important megacity in the Central Plains Economic Region and one of the eight great capitals of ancient China, Zhengzhou is regarded as an important node-city in the “One Belt, One Road” initiative between China and European countries. Zhengzhou locates within the northern temperate zone with a continental monsoon climate. The annual average temperature is about 14.4 °C. The months with the higher temperatures are July and August, and the colder months are December and January [38]. The area has an annual precipitation of 640.9 mm, and the terrain trends toward higher terrain in the southwest and lower terrain in the northeast. The Yellow River goes through this region and delineates the northern boundary of Zhengzhou City. According to Zhengzhou Statistics (http://www.zzstjj.gov.cn/), the population living in the central urban area of Zhengzhou increased from 2.09 million to 4.78 million, with an average annual growth rate of 7.15%, between 1996 and 2014. Meanwhile, the urbanization rate of Zhengzhou increased from 50.1% to 68.3%, which was continuously higher than the national average. Additionally, the population density increased from 767 persons per km2 to 1259 persons per km2. Such a dramatic LULC process inevitably results in urban environmental degradation and the UHI effect due to the increased density of developed areas and the loss of urban green spaces.

2.2. Satellite Data and Preprocessing

According to this purpose of this study, we found that long time intervals are beneficial to studying changes in landscape patterns. Besides this, Zhengzhou City experienced a large-scale urban construction movement after the implementation of a series of urban development strategies in 2006, which resulted in great changes in the urban landscape. Based on this background, the Landsat images of three typical years (1996, 2006, 2014) could meet the needs of studying the problem of urban landscape patterns’ effect on the urban heat island effect. In this study, two Landsat-5 images and one Landsat-8 OLI/TIRS image were selected and downloaded from the USGS website (Table 1). To minimize bias arising from haze or cloud pollution, only cloud-free image data or image data with minimal cloud cover (i.e., less than 5%) were selected. Based on the overall purpose of this study, all images that contained thermal bands were processed for LST retrieval, and LULC classifications were generated.
In this study, prior to LULC classification mapping and LST retrieval, each satellite image was processed using a set of preprocessing procedures. The preprocessing procedures included radiometric calibration, atmospheric correction, and geometric distortion correction. Subsequently, all the images were resampled to 30m spatial scale to correspond to the resolution of the multispectral bands [39].

2.3. Urban Landscape Classification

The land cover type maps of the study area were produced for 1996, 2006, and 2014 by using supervised classification and man–computer interactive interpretation in ENVI 5.1 software. The final urban landscapes were divided into six classifications, including impervious surface (IS), farmland, bare land, grassland, water, and forest. Subsequently, the overall accuracy assessments of the land cover classifications were carried out with 400 generated reference points employing a stratified random sampling technique [40] for each map that represented different land cover types in the study area. Google Earth images with high spatial scale and other auxiliary data including urban planning maps and soil type data were employed as reference information for the 1996, 2006, and 2014 classified maps. In addition, we depended on our visual interpretation of the Landsat images applying different band combinations to improve the classification accuracy [41]. As a result of that, the accuracy assessments revealed kappa coefficients larger than 86.6% for each classified land use map, which met the analysis requirements proposed by Jassen et al. [42].

2.4. Retrieval and Ranking of Land Surface Temperature (LST)

The LST values were measured from the thermal infrared bands of the Landsat satellite data. In order to retrieve accurate LST values, firstly, the infrared radiation intensity L received by the satellite sensor was estimated using Equation (1) [43,44,45,46]:
L λ = [ ε B ( T S ) + ( 1 ε ) L λ ] τ + L λ
where L λ denotes the at-sensor radiance, ε denotes the surface emissivity, B(Ts) denotes the heat radiation brightness of black body, Ts denotes a value retrievable from Equation (1) by inversion of Planck’s law, L λ denotes the upwelling atmospheric radiance, while L λ denotes the downwelling atmospheric radiance, and τ denotes the atmospheric transmittance. The atmospheric profile parameters were calculated by using National Centers for Environmental Prediction (NCEP) in the NASA web-based tool (http://atmcorr.gsfc.nasa.gov/). Then, the emissivity of surface materials (ε) was calculated by using Equations (2)–(4) [47]:
ε = m P v + n
m = ( ε v ε s ) ( 1 ε s ) F ε v
n = ε s + ( 1 ε s ) F ε v
where ε v denotes vegetation emissivity and ε s denotes soil emissivity. In our study, we draw on the results of Sobrino et al. [47] for m (0.004) and n (0.986). Pv denotes the vegetation proportion, which was expressed as follows (Equation (5)) [48]:
P v = ( N D V I N D V I min N D V I max N D V I min ) 2
where NDVI denotes the normalized difference vegetation index, which is one of the most popular and easy-to-apply approaches used in UHI studies [49,50]. NDVImin denotes the minimum value of NDVI, while NDVImax denotes the maximum value of NDVI. The NDVI can be derived by utilizing the surface reflectance of the Landsat images (Equation (6)):
N D V I = ( ρ N I R ρ R e d ρ N I R + ρ R e d )
where ρNIR and ρRed represent the reflectance of the near-infrared band and the red band, respectively [10,25]. Then, the emissivity-corrected LST values were measured with the following Equations (7) and (8) [51]:
LST = T B 1 + ( λ × T B / ρ ) ln ε
ρ = h × c / σ ( 1.438 × 10 2   mK )
where TB denotes satellite brightness temperature in degrees Kelvin, λ denotes wavelength of emitted radiance (for Landsat TM/ETM+: λ = 11.5 μm [51,52], and for Landsat OLI/TIRS: λ = 10.8 μm [22]), σ denotes the Boltzmann constant ( 1.38 × 10 23   J / K ), h denotes Planck’s constant ( 6.626 × 10 34   J s ), c denotes the velocity of light ( 2.998 × 10 8   m / s ), and ε denotes the land surface emissivity. Finally, the resulting LST values were converted from degrees Kelvin to degrees Celsius (°C) [40].
Based on the abovementioned analysis, it is not suitable to directly compare LST values or analyze the differences in LST values for multiyear periods because of the seasonality and inter-annual uncertainty of the atmospheric conditions. As a result, the LST values were standardized in ArcGIS 10.2 software based on the data range (Equation (9)), and the density slice method was employed to divide LST values into five levels [5,53,54] (Table 2):
T s = T i T min T max T min
where Ts is the standardized LST value of a pixel; Ti is the initial LST of pixel i; and Tmax and Tmin are the maximum and minimum LST values of the whole area, respectively.

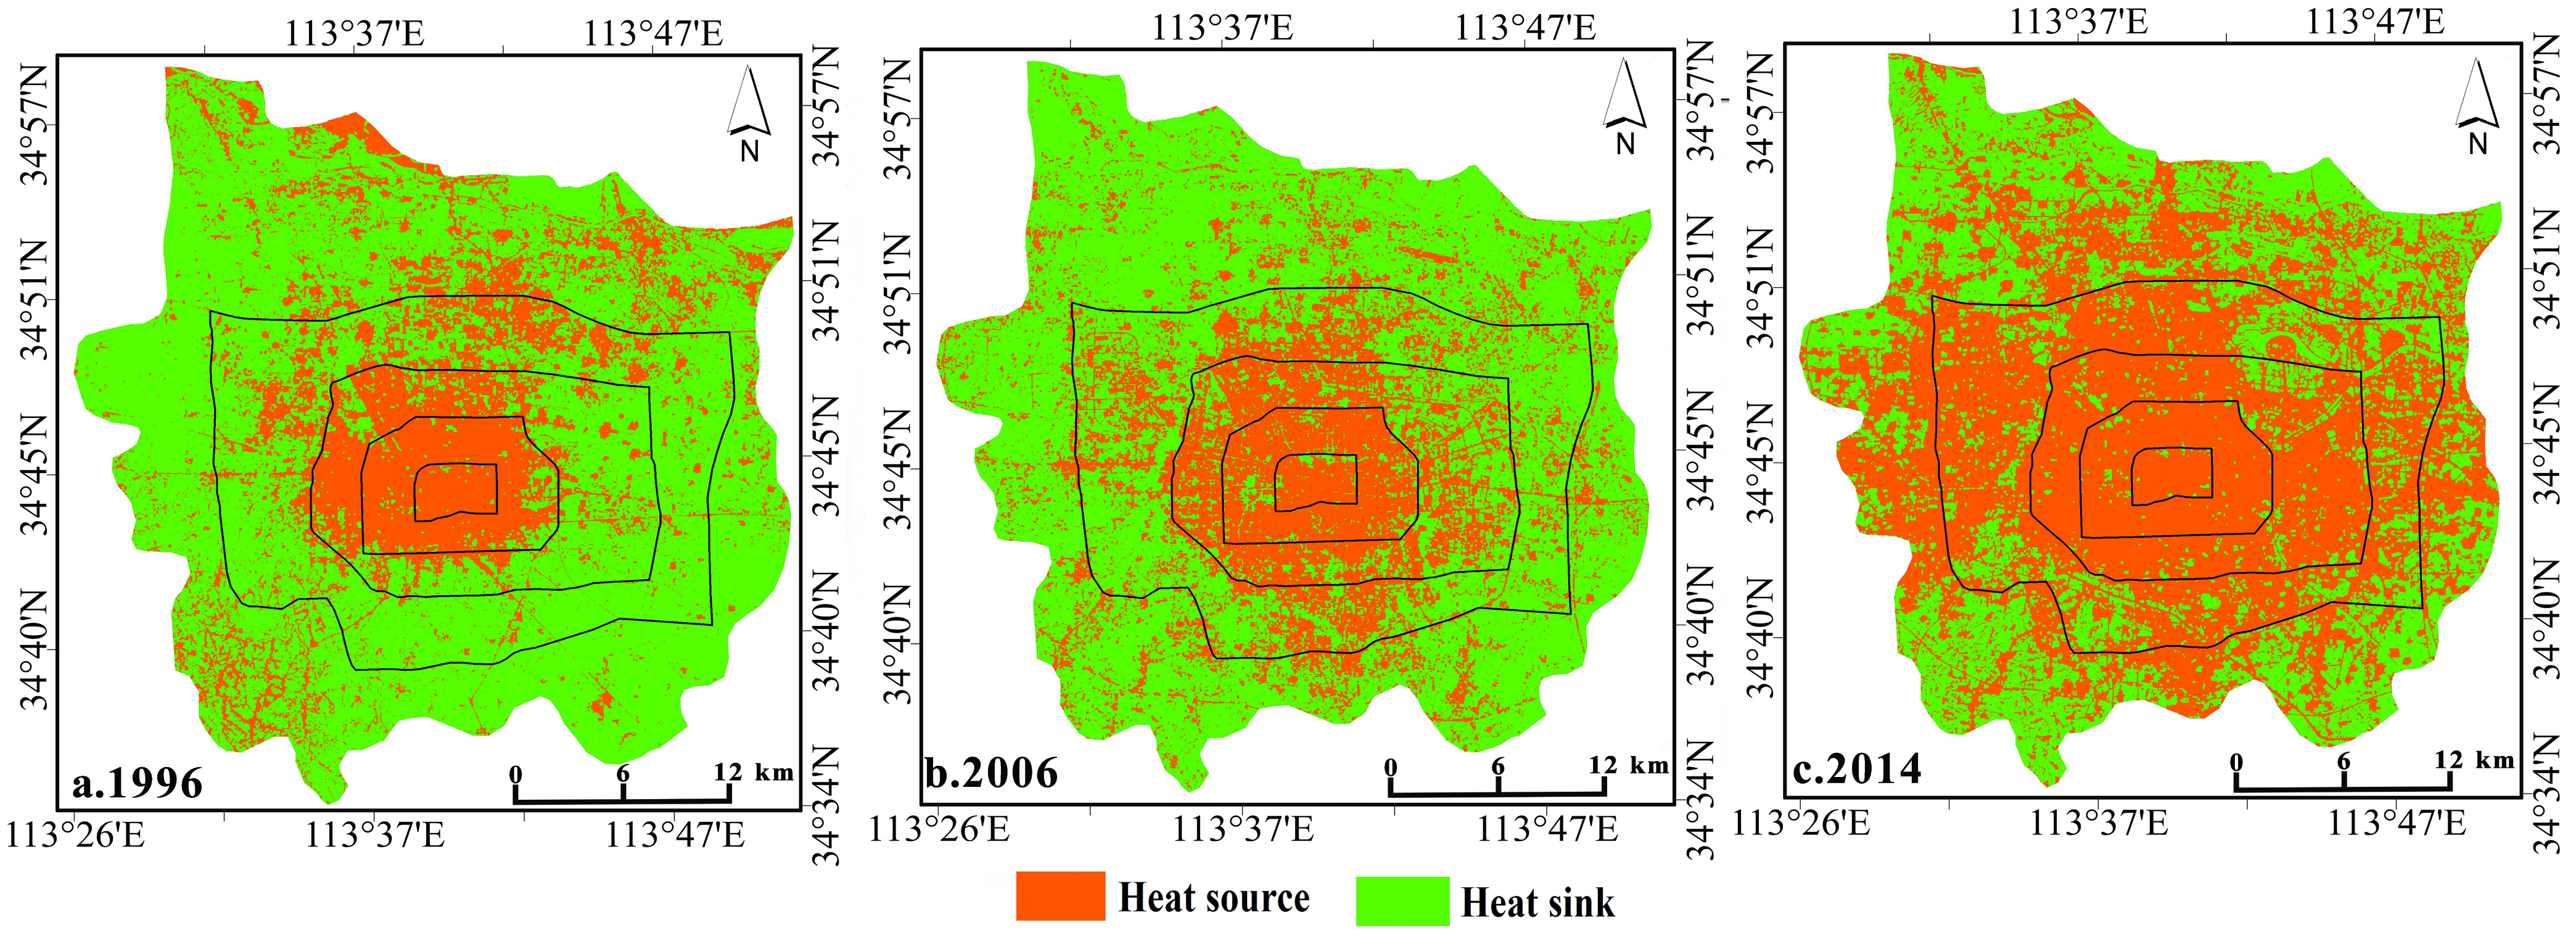
2.5. Identification of Heat Source and Sink Landscapes

In this section, we identified the properties of heat source and sink landscapes based on the contribution of each land use/land cover category to the thermal environment effect, and the formula is as follows [55]:
H S I = S i h S i / S h S
where Sih denotes the total areas of high and sub-high LST zones in the ith category; Si denotes the area of the ith category of LULC; S denotes the total area of the research object; and Sh denotes the total areas of high and sub-high LST zones in the entire study region. If HSI > 1, the land cover category has a large contribution to the thermal environment effect and should be defined as a heat source; in contrast, if HSI < 1, the land cover category should be defined as a heat sink [5].
In addition, the contributions of the source–sink landscapes to the intensity of the LST are different at the local scale. We introduced the contribution index (CI) to compute the contribution of source and sink landscapes [18,32], and the CI is expressed as (Equation (11)) [33]
Contribution   Index ( C I ) = D t × F
where Dt denotes the difference in the LST between the sink or source landscape and the whole area and F denotes the fraction of the total area that is source or sink landscape. For a source landscape, Dt is positive and the CI is also positive; conversely, both values are negative for a sink landscape.
Due to the intensity of LST at the local scale identified by the contributions of the source or sink landscape, the landscape index (LI) can be defined as the absolute value of the ratio of the CI; the formula is as follows (Equation (12)) [33]:
Landscape   Index ( L I ) = | C I s i n k / C I s o u r c e | .
When LI > 1, the contributions of the source and sink landscapes weaken the thermal environment. Then, when the LI value is <1, the contributions of the source and sink landscape strengthen the thermal environment. Finally, when LI = 1, the thermal environment is unchanged. Therefore, different LI values denote different degrees of weakening or strengthening of the thermal environment at the local scale.

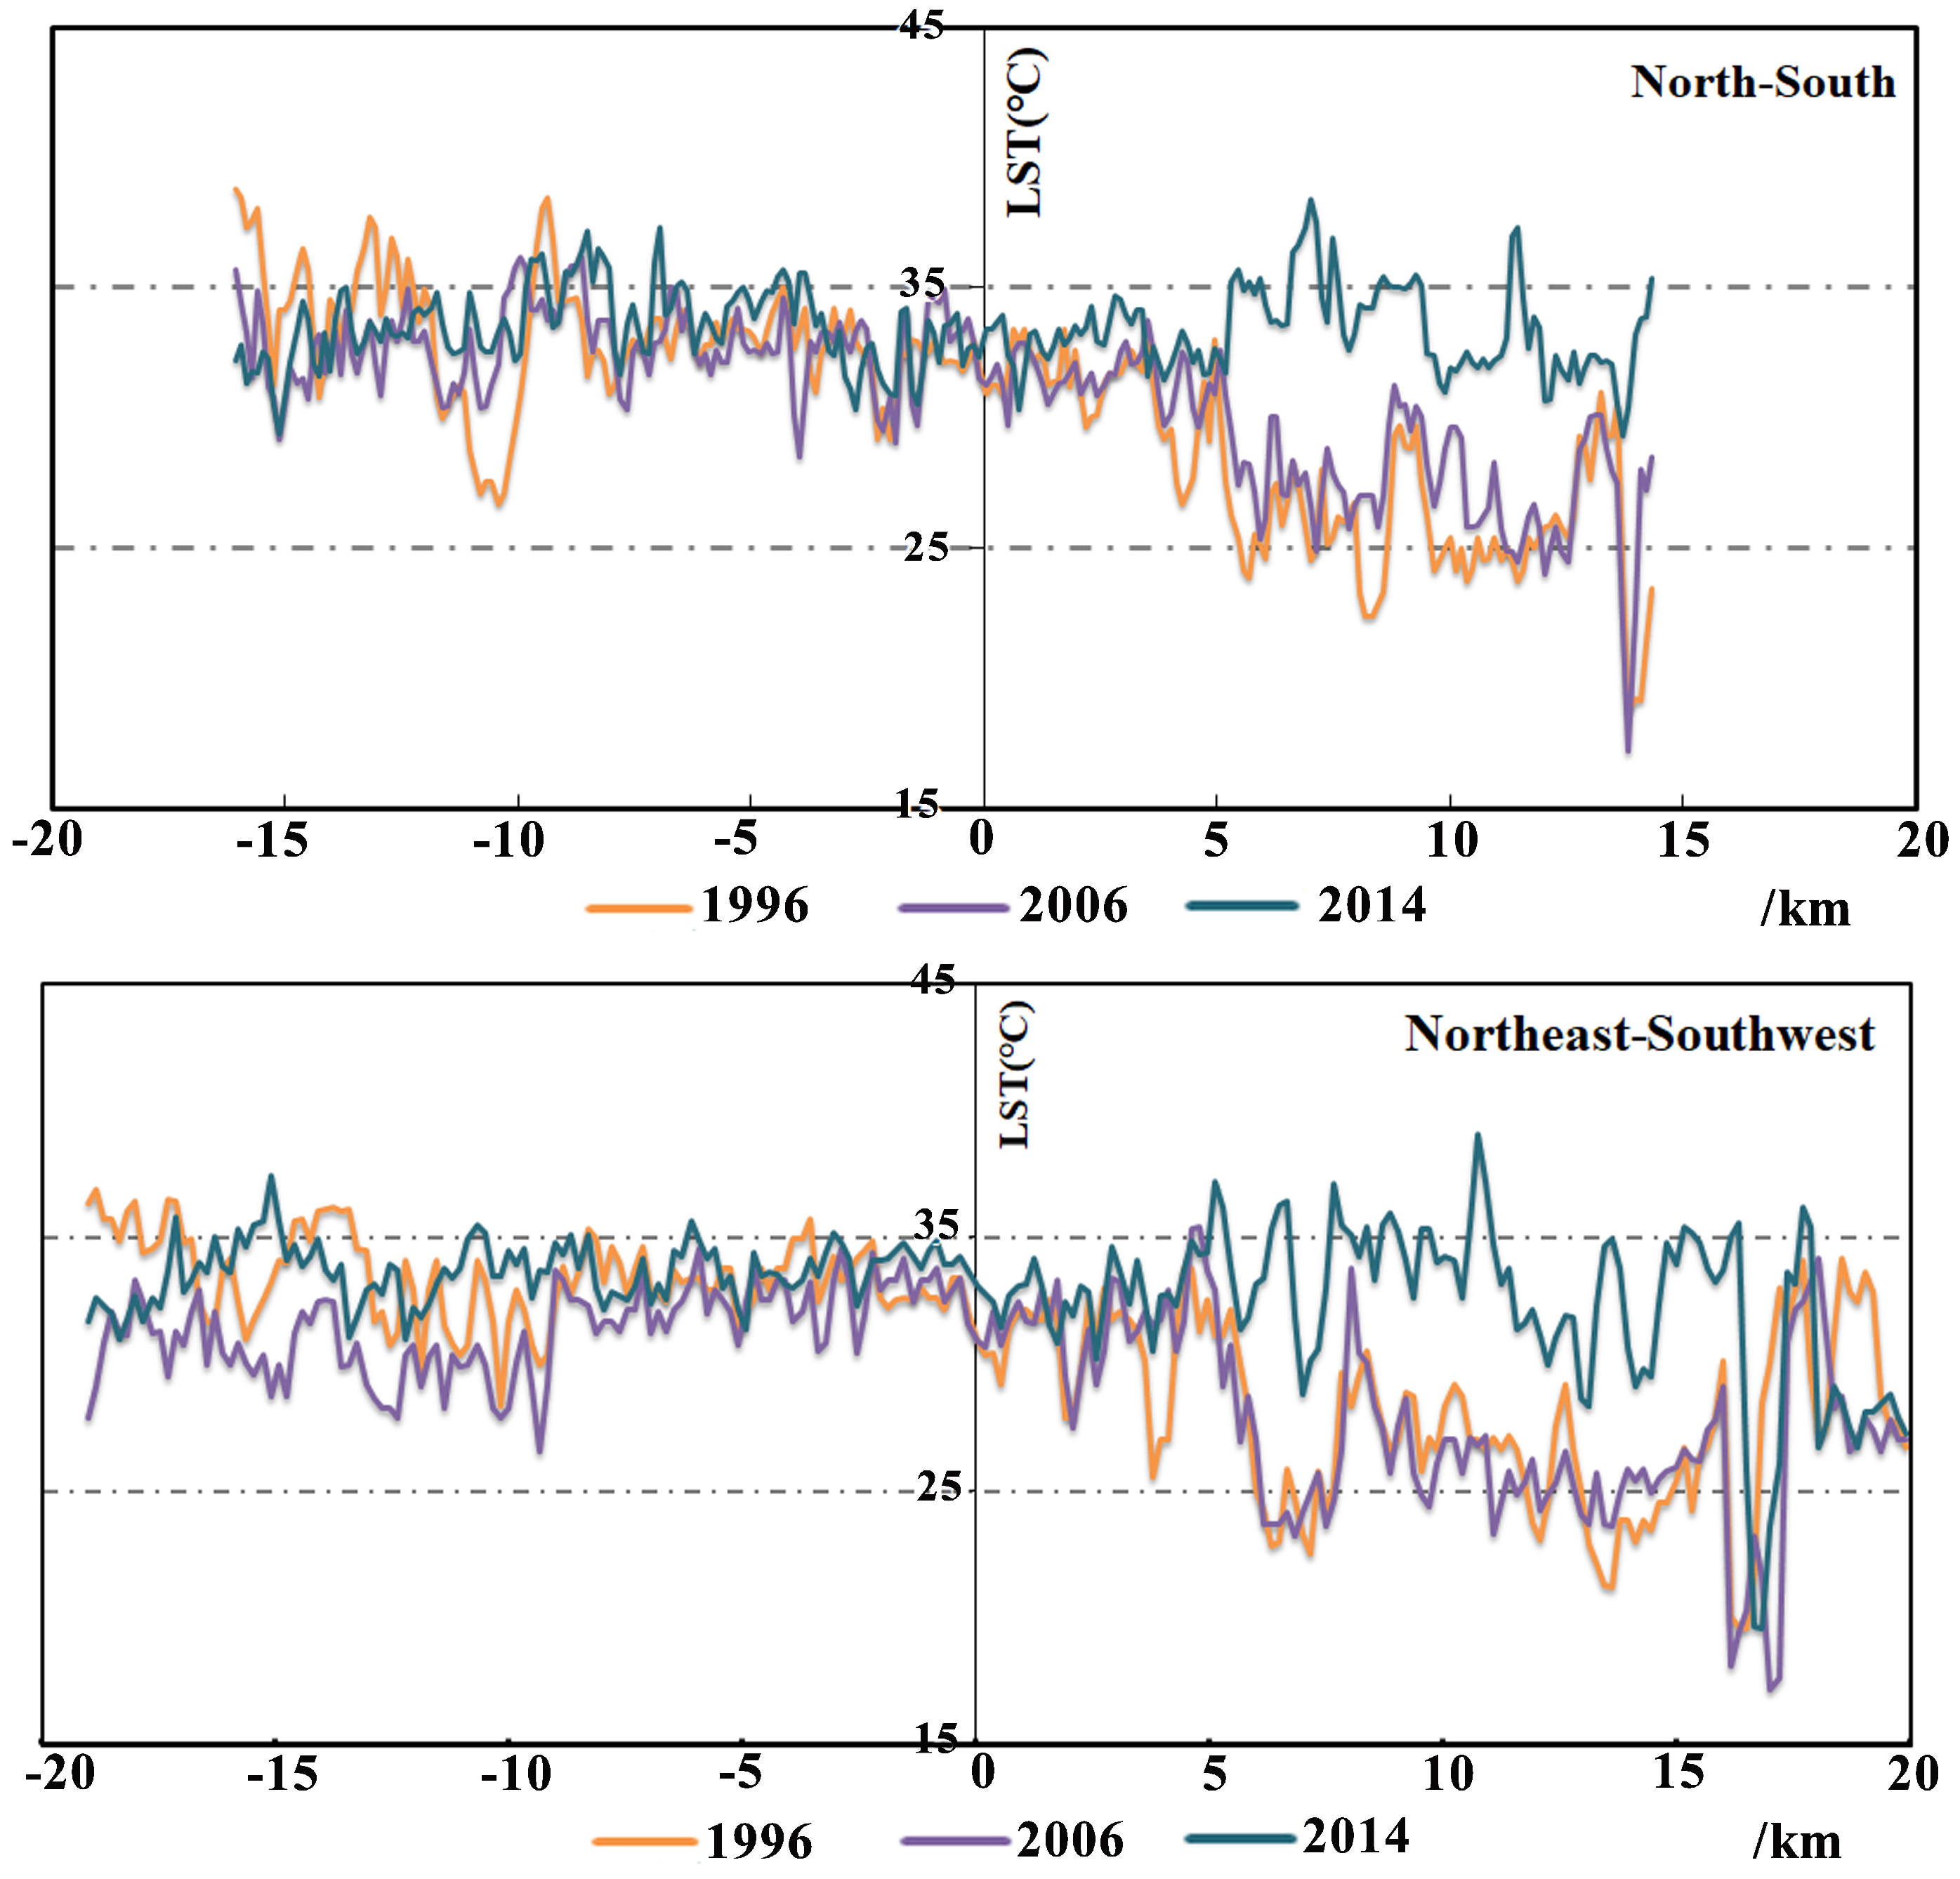
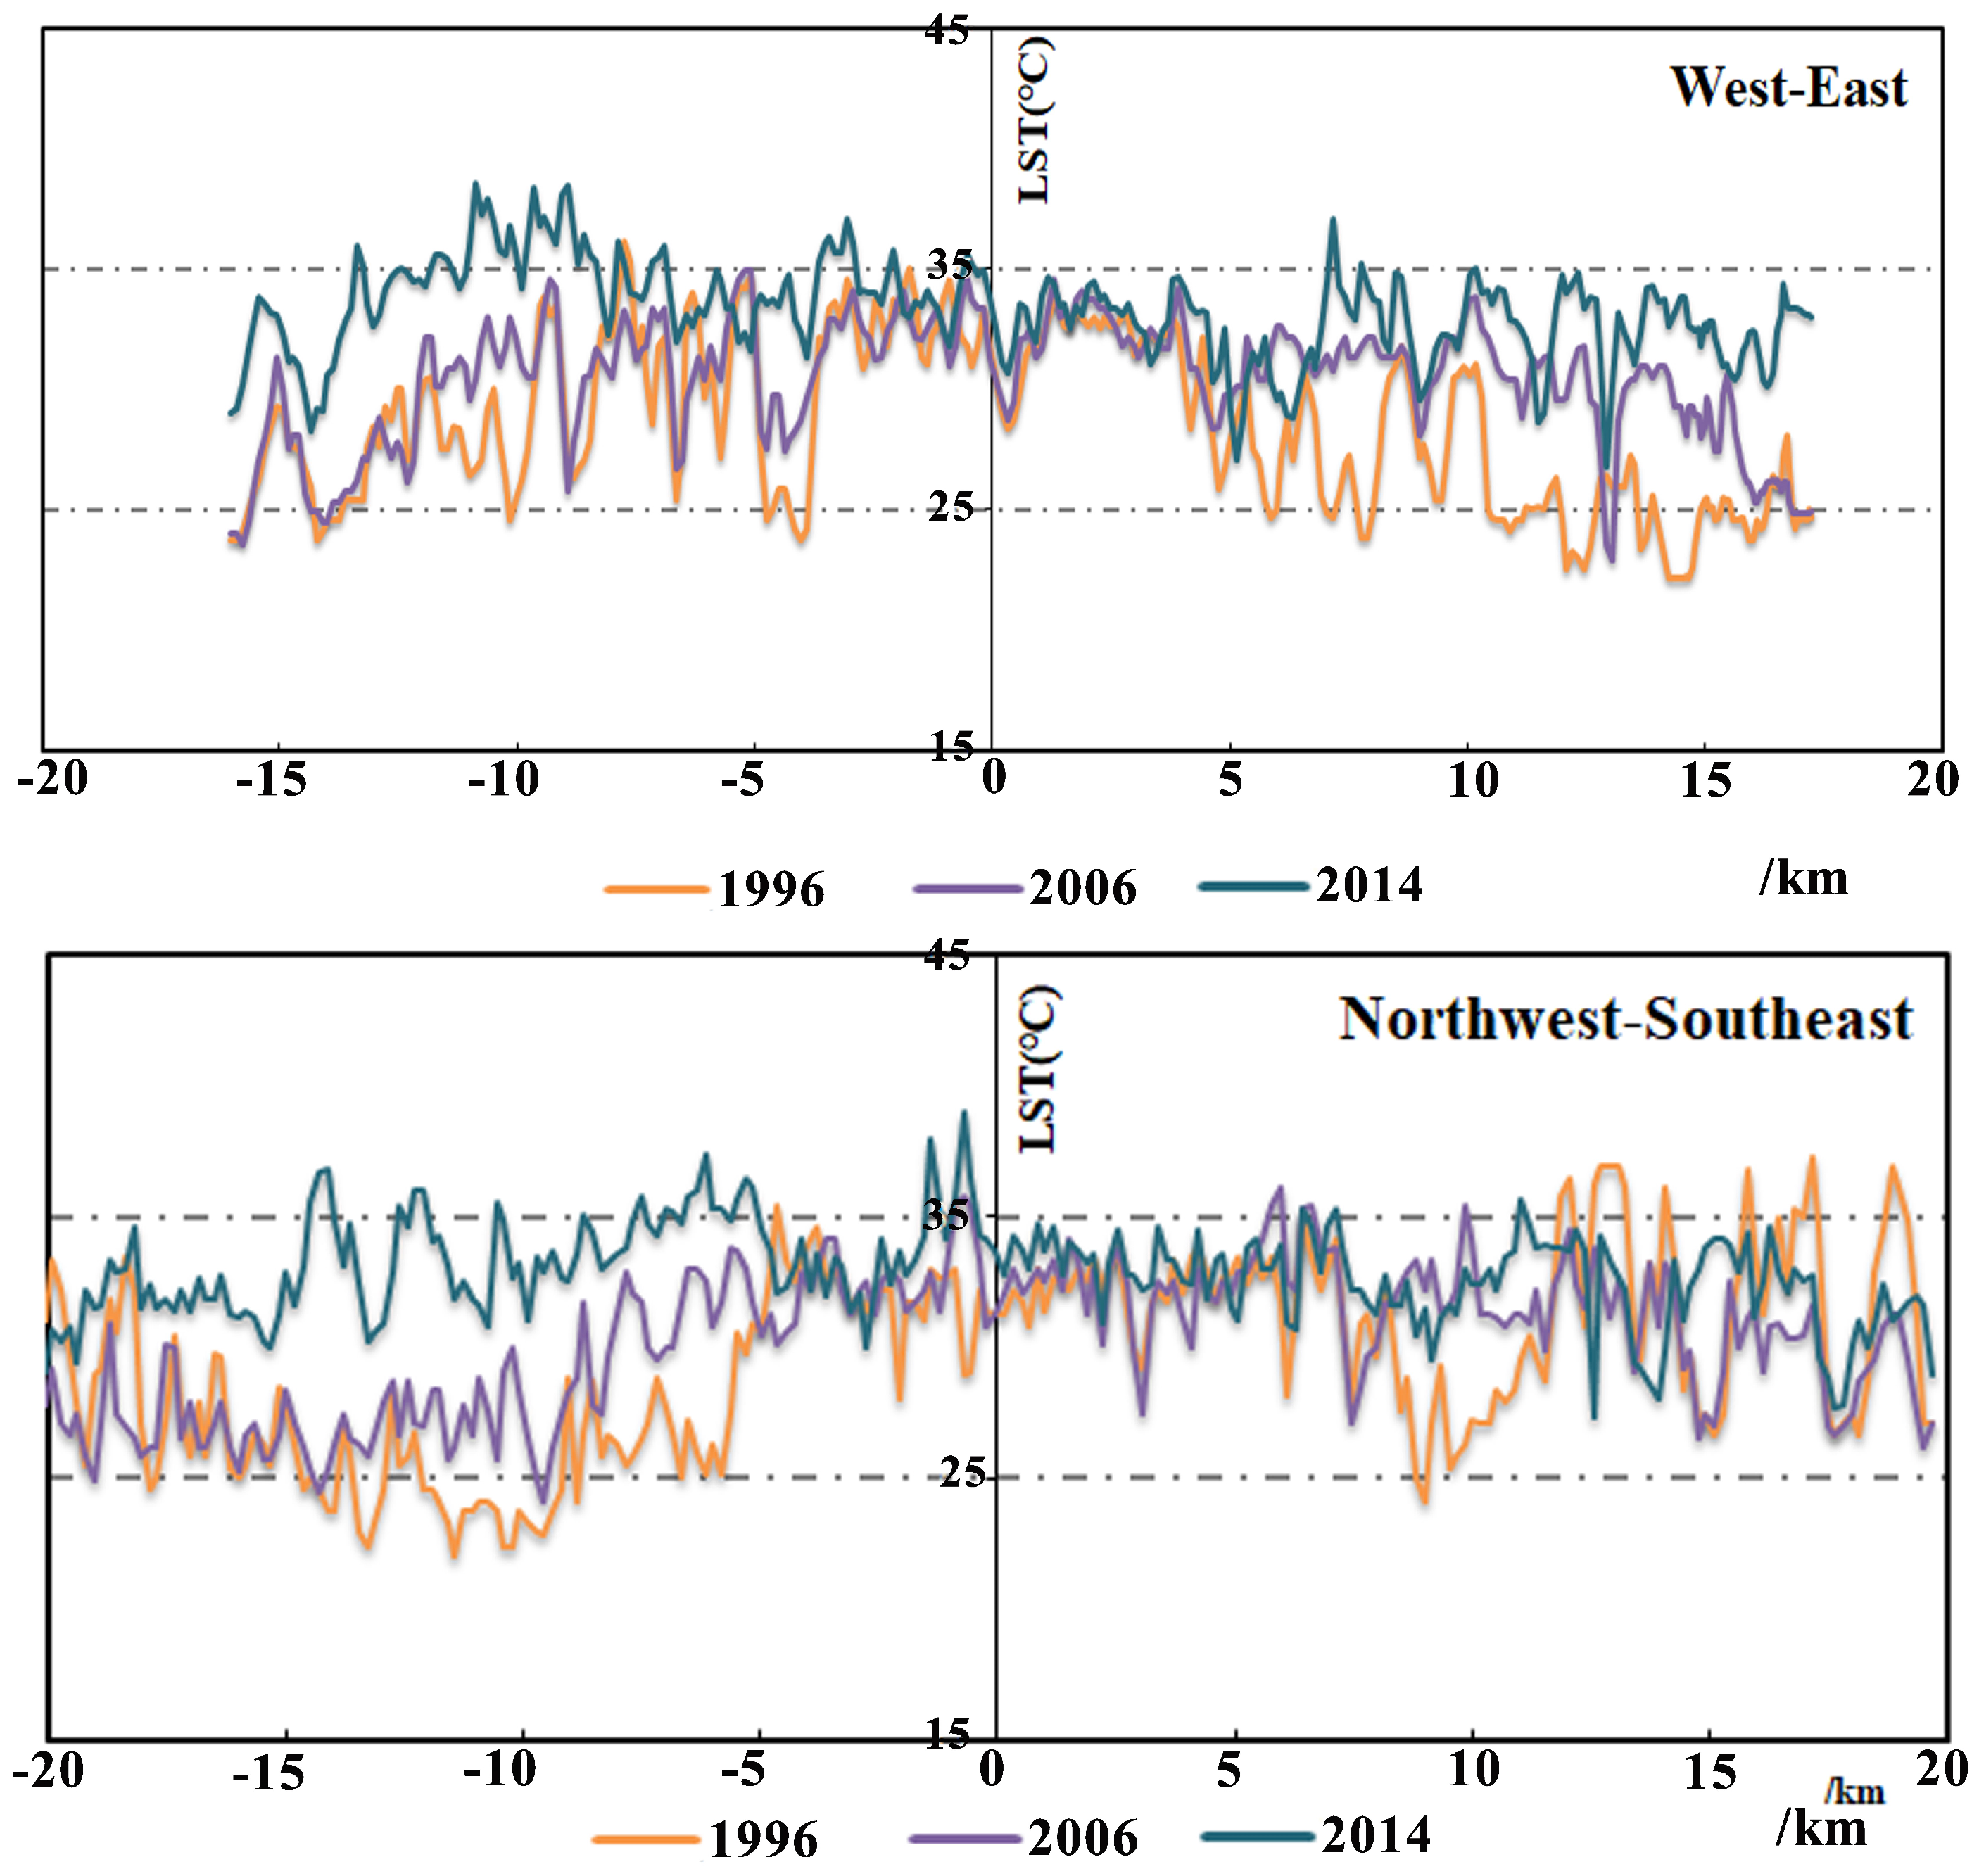
2.6. The LST Profile Analysis

This specific analysis identifies the spatial variability of LST from the urban center to the suburbs of the study region. Multidirectional LST profiles of Zhengzhou City following the diagonal and orthogonal directions, i.e., west–east, northwest–southeast, north–south, and northeast–southwest, were produced based on the LST values in three time series (1996, 2006, 2014). The LST value was computed by each polygon grid snapped to the respective LST retrieval maps from 1996, 2006, and 2014. The central location of Zhengzhou City, called kilometer 0, was located. Then, a series of sampling points were extracted by sampling with a distance interval of 180 m for each profile. Finally, the LST of each profile was investigated.

2.7. Quantification of Landscape Pattern Metrics and LST

To explore the relationships between the landscape patterns of heat source–sink and the LST based on the classification results, a series of landscape metrics (including composition, shape, and configuration) were estimated in FRAGSTATS 4.2 [56]. The selection of the moving window size would affect the calculation of landscape metrics, given that larger grid size and exothermic effects will hide small heat source–sink patches, while too small a grid size may cause large heat source–sink patches to be fragmented [5].Therefore, based on the above principles and after a series of tests, a 900 m × 900 m moving window was chosen to measure the landscape metrics because the results from this resolution accurately reflect the changes in landscape patterns of the study area according to the two principles of selecting landscape metrics: (1) minimal redundancy and (2) significant implication in both theory and practice [57,58]. The four landscape-level metrics were selected to depict the general characteristics of the landscape and the seven class-level metrics were selected to depict the characteristics of the specific category of heat source or sink in each grid from the perspective of patch density, patch shape, and patch configuration (Table 3). Additionally, to eliminate edge effects, grids that have an area of covered landscape less than 100% were excluded. A continuous surface was created using the landscape metrics and LST values of 1307 grids covering Zhengzhou. Finally, the Pearson correlation was applied to examine the relationships between LST and landscape pattern metrics of heat sources and heat sinks.

3. Results

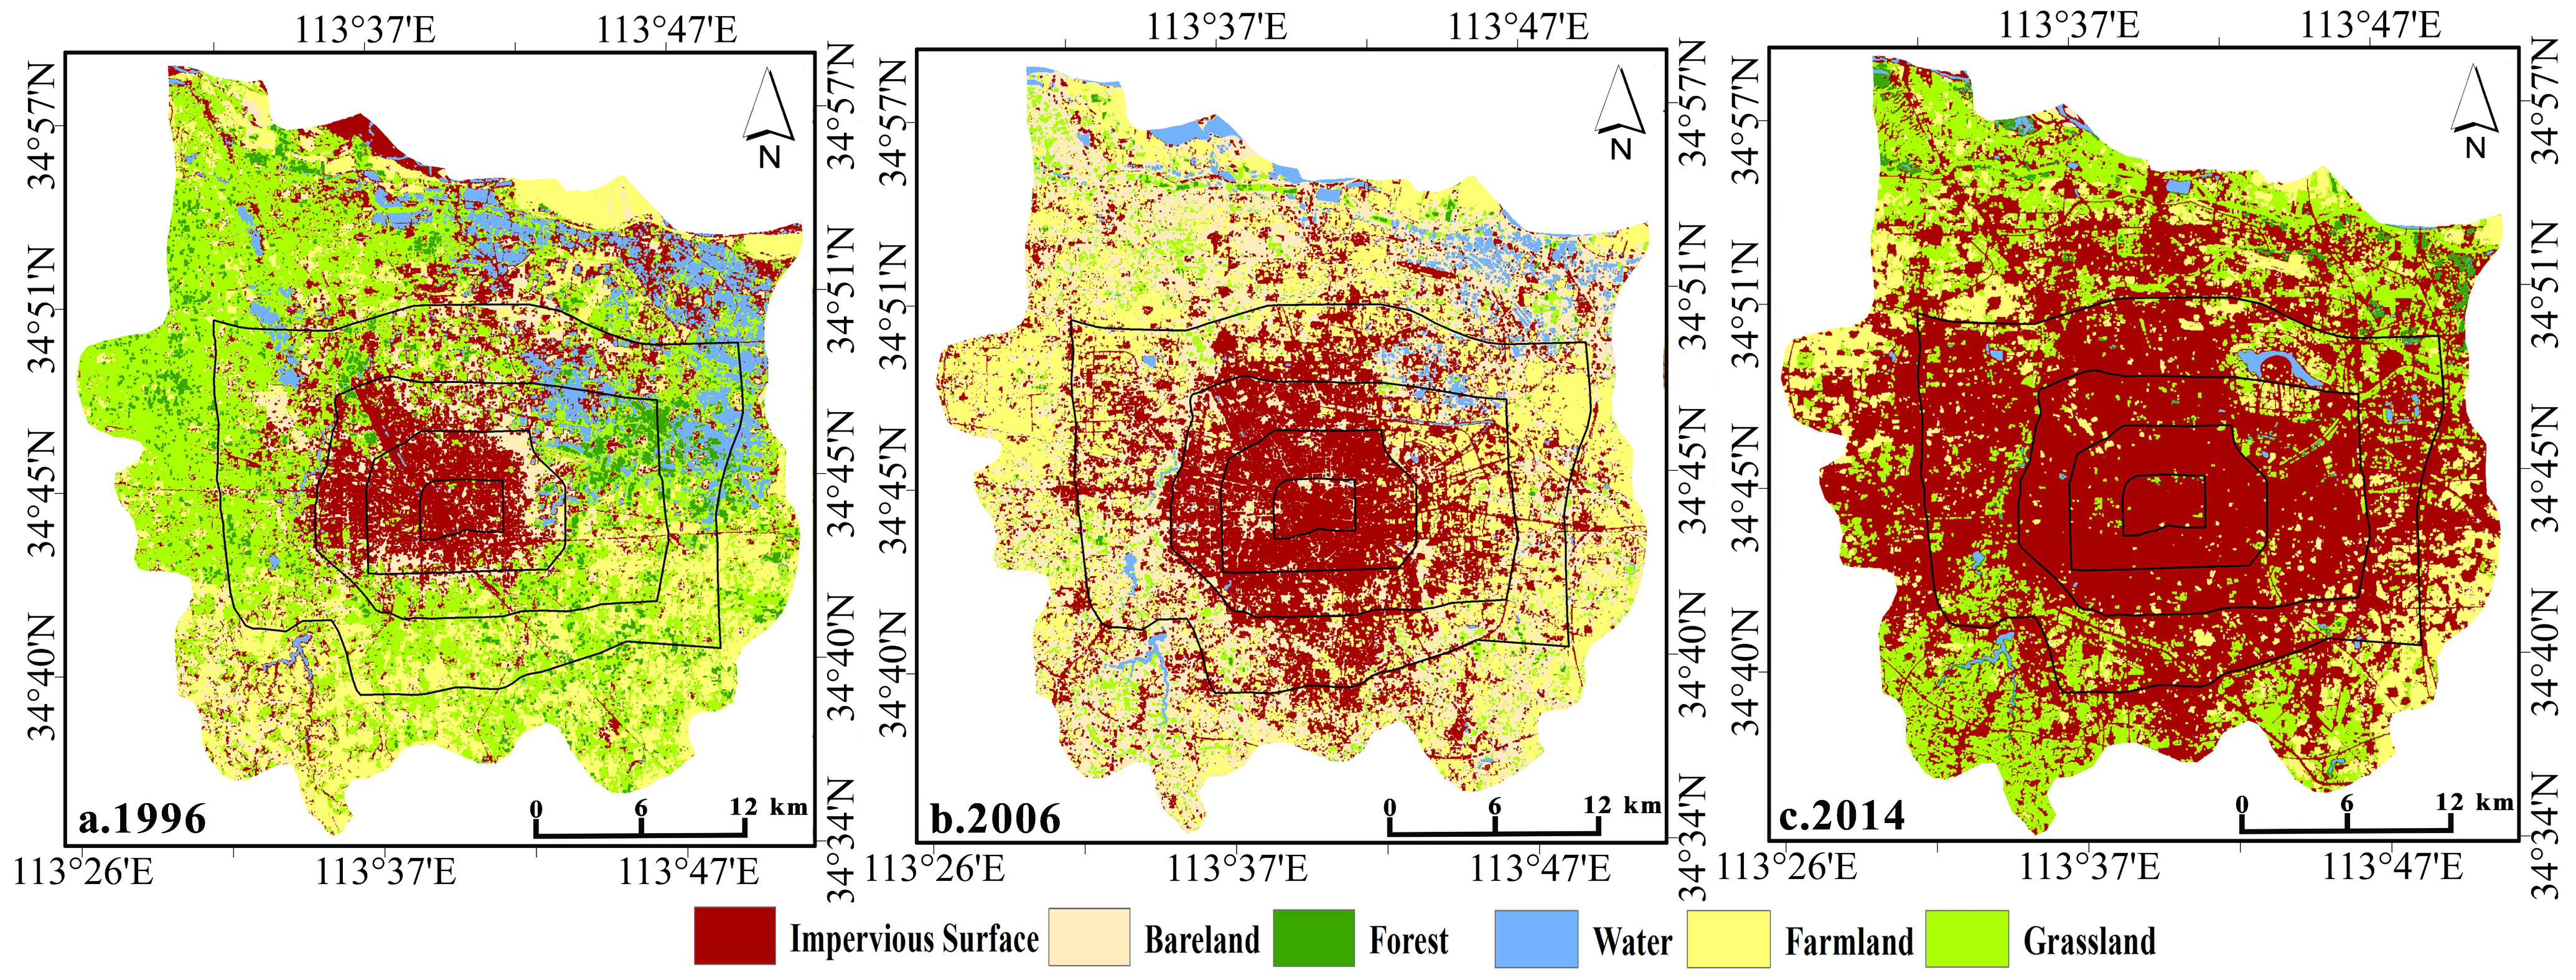
3.1. Land Cover Changes and the LST of LULC Classes

Figure 2 shows the spatiotemporal changes in land cover maps of Zhengzhou City from 1996 to 2014. The results indicated that the area of impervious surface (IS) increased from 112.8 km2 to 282 km2 between 1996 and 2006, and an ever-higher growth in the area of impervious surface (130.7 km2) was detected between 2006 and 2014. This is equivalent to a total increase of 299.9 km2 in the area of IS over 19 years. This translates to a net increase of 266.87% and a 15.78 km2 gain per year. The change indicates that the Zhengzhou City has experienced rapid urbanization over approximately the past two decades. Forest and grassland had a total net loss of 3.15% and 13.94% between 1996 and 2014, respectively. Generally, the spatiotemporal changes in the land cover have been heavily impacted by the rapid expansion of impervious surface in the study area.
Table 4 shows the dynamics of LST associated with specific land cover types across the study period. As can be seen, the impervious surface showed higher surface temperatures, while forest and water displayed lower surface temperatures between 1996 and 2014. The mean LST of the IS was consistently higher than the mean LSTs of other land cover types, and its mean LST increased from 28.204 °C to 30.583 °C. Overall, the impervious surface could promote the UHI effect, while to some extent, the vegetation (i.e., forest and grassland) and water could mitigate the UHI effect.

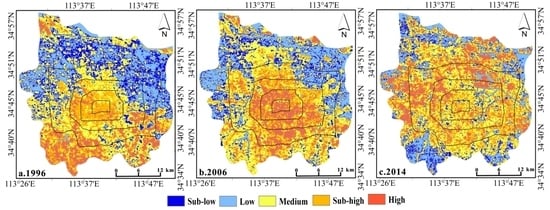
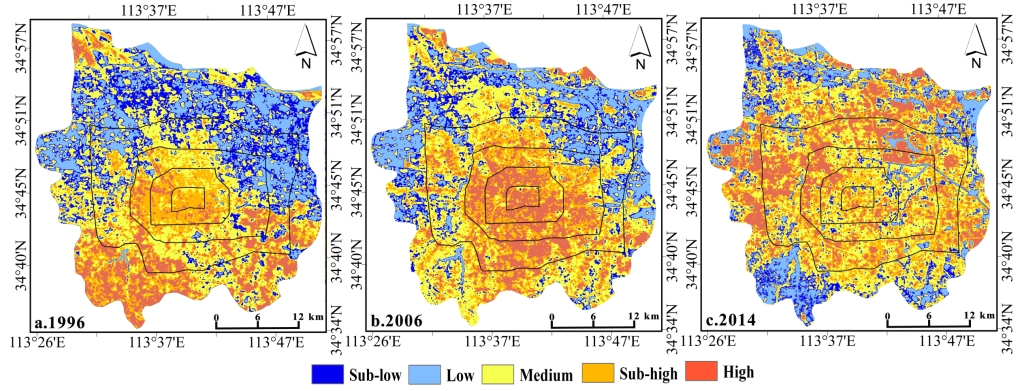
3.2. Spatial Pattern of the LST

Table 5 displays the LST in the different ring road areas of Zhengzhou City from 1996 to 2014. The pattern of LST has experienced obvious changes throughout the whole study area. In 1996, the LST of Zhengzhou City ranged between 13.24 °C and 40.83 °C, with a mean LST of 29.24 °C. The mean LST gradually decreased from the first ring road to the fourth ring road. Areas with high LST values were mainly concentrated in the area within the first ring road. In 2006, the LST ranged from 12.05 °C to 44.97 °C, with the mean LST of 30.04 °C. This shows that Zhengzhou City experienced a 0.8 °C increase in its mean LST between 1996 and 2006. Areas with high LST values were mainly concentrated in the area of the second ring road. In 2014, the LST ranged from 18.84 °C to 45.28 °C, with a mean LST of 31.96 °C. This indicates that the mean LST of Zhengzhou City gradually increased from 2006 to 2014. Areas with high LST values were mainly concentrated in the fourth ring road. Overall, the mean LST of Zhengzhou City experienced an increase of 2.72 °C during the study period, and areas with high LST values become wider from the first ring road to the fourth ring road, which was consistent with the examined urbanization results in this part of the study area (Figure 3).
Figure 3 shows the spatial patterns of LST levels from 1996 to 2014. In 1996, the overall pattern of the LST was higher in the south and lower in the north of the study area. The high and sub-high LST zones were mostly near the south of the third ring road and the central portion of the second ring road, respectively, and the sub-low and low LST zones were mostly distributed near the north of the fourth ring road. In 2006, the high and sub-high LST zones become wider, and these zones were mainly in the center of Zhengzhou City, while the sub-low and low LST zones gradually reduced. In 2014, the high and sub-high LST zones expanded to the north of the study area, and were mainly distributed in built-up areas found in the regions including the Zheng Dong New District and the Hi-Tech Development Zone. This indicated that activities including land development and urban expansion played an important part in promoting the severe UHI effect. The sub-low and low LST zones were mostly distributed in green spaces and water found in the north and south parts of the study area. In general, the sub-high and medium LST zones occupied a large proportion of Zhengzhou City across the three time points. Meanwhile, the thermal environment also showed strong spatial differences with urban expansion.
According to the LST profile analysis of Zhengzhou City (Figure 4), the results revealed that the zones closest to the city center did not show the highest mean LST between 1996 and 2014. The mean LST value reached its peak approximately 5 km from the city center before it reduced gradually. In addition, the pattern of mean LST along the LST profile shows evidence for the presence of the UHI phenomenon in the study area; more specifically, the LST values were small in 1996 but became larger in 2006 and even larger in 2014 because of the expansion in the amount of impervious surface.

3.3. The Classification of Heat Source and Sink Landscapes

Based on the HSI values applied to denote the contribution of land cover types to the thermal environment effect in 1996, 2006, and 2014, impervious surface (1.683, 1.847, 1.869, respectively) and bare land (1.264, 1.251, 1.352, respectively), with HSI values > 1, obviously strengthened the thermal effect and were defined as heat source landscapes. Farmland (0.631, 0.809, 0.615, respectively), water (0.153, 0.221, 0.201, respectively), forest (0.352, 0.266, 0.109, respectively), and grassland (0.788, 0.417, 0.315, respectively), with HIS values < 1, were defined as heat sink landscapes. Using this information, we identified the composition of land cover types in heat sources and sinks (Figure 5). As for the composition, it can be shown that the major proportion of heat sources were impervious surface (IS) in the study area, while the remaining part was the bare land. The heat sinks consisted primarily of farmland and grassland, while the remaining parts were water bodies and forest.
Then, we mapped the spatial patterns of heat source and sink zones (Figure 6). Between 1996 and 2014, heat source zones were distributed in the central and northern regions of Zhengzhou City, and heat sink zones were located in the southern and northwestern regions of the study area. These heat sink zones had the lowest LST values among the urban areas because of the presence of vegetation cover. Additionally, the dominant portion of heat source increased gradually from the center to the surrounding regions, while the remaining portion of heat sink gradually decreased during the study period.
At the local scale, Table 6 reveals the CI and LI of heat sources and sinks in the different Zhengzhou City ring road areas between 1996 and 2014. The rapid expansion of urban land resulted in dramatic change in the layouts and areas of heat sources and sinks. During the study period, the percentage of heat source areas showed a decreasing trend from the first ring road to the fourth ring road; contrarily, the percentage of heat sink areas indicated an increasing trend from the first ring road to the fourth ring road. The CI values for heat sources gradually decreased from the first ring road to the fourth ring road, while the absolute CI value for heat sinks become increased from the first ring road to the fourth ring road. The LI values of the different Zhengzhou City ring road areas were estimated and are presented in Table 6. The LI value was lower than 1 from the first ring road area to the fourth ring road area, which indicated that the combined contributions of heat source and sink landscapes promoted surface urban heat. However, overall, the LI value had an increasing trend and was getting closer to 1 from the first ring road to the fourth ring road between 1996 and 2014. This implied that the contributions of heat source and sink landscapes could weaken the UHI effect to some extent.

3.4. Effects of Heat Source and Sink Patterns on LST

Table 7 indicates the correlation coefficients between LST and landscape metrics of heat sources and sinks at the landscape scale. As shown, in heat source landscapes between 1996 and 2014, LST was positively correlated with CONTAG, LSI, PD, and SHDI. These results indicated that as the percentage of heat source patches is increased in the study area, the UHI effect would be enhanced. Contrarily, in heat sink landscapes from 1996 to 2014, LST was negatively correlated with CONTAG, LSI, PD, and SHDI, which implied that higher values of these variables would be accompanied by lower LST values. In general, these variables revealed the different effects of the general landscape composition, shape, and spatial configuration characteristics on the UHI effect.
In light of the results of the Pearson correlation analysis for heat source–sink and LST at the class level during the study period (Table 8), for the landscape metrics of heat sources, the spatial arrangement variables including AI and DIVISION exerted positive influence on LST. This indicated that a higher dispersion degree of heat sources is necessary and beneficial for reducing the effect on LST. Additionally, the composition variables including PD and PLAND, both of which were local variables, mostly had positive effects on LST. This implied that an increase in the proportion of heat source patches would strengthen the UHI effect, especially in developed urban areas. The shape variable SHAPE_MN had global positive influence on LST. This implied that an increase in the shape irregularity of heat source patches would strengthen the thermal environment effect. The local variable FRAC_MN had a significant positive correlation with LST, which meant that the UHI effects of heat source patches could be reduced by lessening the degree of shape complexity.
According to the results of the Pearson correlation analysis for the landscape metrics of heat sinks and LST at the class level (Table 8), as with spatial arrangement, AI had a significant global negative effect on LST, which indicated that higher aggregations of heat sink patches could reduce the thermal environment effect. DIVISION also exerted a negative influence on LST, which suggested that a higher dispersion degree of heat sinks was not beneficial to mitigating the UHI effect. The composition variables, including PD and PLAND, were mainly negatively correlated with LST, which revealed that LST would be reduced with an increase in the proportion and density of heat sink patches. In addition, the local variable ED had negative influences on LST, which illustrated that an increase in the edge regularity of heat sink patches would generate a cooling effect. The shape variable SHAPE_MN exerted negative influence on LST overall, and for some regions with distributed heat sink patches, an increase in the shape irregularity might enhance the cooling effect. The local variable FRAC_MN was negatively correlated with LST, which suggested that heat sink patches generate better cooling effects when their shape complexity was improved.

4. Discussion

4.1. Urbanization and Its Effects on Urban Thermal Environment

This study reveals that Zhengzhou City has experienced rapid urbanization, as evidenced by the substantial increase in the spatial extent of impervious surface (IS) over the past two decades (Figure 2). These findings are consistent with the existing research [60,61]. In fact, there are varying urbanization processes on the national scale because of the Chinese central government’s different regional development strategies. The period of rapid urbanization process in central China remarkably lagged that of the southern and eastern regions, which favored the national priority development strategy initiated since the 1978 Reform and Opening-up policy [60]. Since the 2000s, central China has entered a stage of rapid urbanization, especially Zhengzhou City, which was deeply influenced by the planning policies of the Central Plain Urban Agglomeration (CPUA) in 2006 and the Central Plain Economic Region (CPER) in 2010, according to the statistical data of Zhengzhou City (http://www.zzstjj.gov.cn). As shown in Figure 7, the urbanization rate of China has presented a trend of continuous growth from 1996 to 2014; this process has resulted in a significant urban heat island effect in major Chinese cities. In central China especially, the urban warming effect is more obvious [62]. Additionally, Figure 7 also indicated that the urbanization rate of Zhengzhou City was higher than those of the Henan Province and of China in the study period. Consequently, such rapid expansion of urbanization has led to a more prominent urban thermal environment effect than in surrounding areas, as evidenced by the remarkable change in land use/land cover, especially from the former arable land to the newly emerging built-up land which features impervious surface with sparse vegetation and water bodies, thus decreasing the cooling effect of the former natural/seminatural surfaces. Besides this, referring to other UHI research in several Chinese megacities, we obtained the mean UHI values of Nanchang, Shijiazhuang, Tianjin, Shanghai, and Nanjing at approximately 1.64 °C, 0.59 °C, 0.87 °C, 1.1 °C, and 0.5 °C, respectively [10,63]. Although these studies were analyzed in different time series, they can be used to understand the general situation of the UHI intensity in China. In this study, we showed that the mean LST value of Zhengzhou City increased by 2.72 °C from 1996 to 2014, higher than those of major large cities in China. Hence, we can believe that the urban warming effect in Zhengzhou City is relatively strong in China.
The urban growth of Zhengzhou City has evident spatial characteristics: the city areas have a clear shift and expand towards the northeast and southwest from 1996 to 2014 due to increased central government support and a number of planning policies from the local government. As the core city of central China, Zhengzhou City has exerted an important impact on regional development. In 1996, Zhengzhou had a gross domestic product (GDP) of 49.82 billion Yuan (RMB), which increased to 677.7 billion Yuan (RMB) in 2014 (www.tjj.zhengzhou.gov.cn). The city was home to 2.09 million people in 1996, and its population has grown continually and reached 4.78 million people in 2014 (www.tjj.zhengzhou.gov.cn). People flock to the city for various major socio-economic opportunities and an improved quality of life. However, such rapid urbanization has resulted in some negative effects on the natural environment. Between 1996 and 2014, most of the newly developed lands resulted from farmland, bare land, and grassland conversions. A considerable proportion of natural land surfaces were replaced with various buildings, traffic facilities, and other impervious surfaces. The built-up land area of Zhengzhou city has grown dramatically by 13.9% annually from 1996 to 2014, a higher rate than even those of the coastal megacities, such as Shanghai (3.58%, between 1997 and 2008) [64] and Guangzhou (7.7%, from 1979 to 2002) [65]. The rapid expansion of built-up land severely changed the source–sink landscape patterns formed by vegetation or water in the city underlying surface and further affected the biophysical parameters and conditions in the urban ecosystem [66,67]. These built-up surfaces generally reflect less and absorb more of the sun’s energy [9]. Some previous studies have also shown that the built-up land environment has high heat capacity and thermal conductivity rates [44,68,69]. This can cause unbalanced energy flux via latent flux. The examined increasing trend in the UHI effect in Zhengzhou City has been influenced by landscape changes caused by rapid urbanization. The findings of this study revealed that the impervious surface had consistently higher LST values than other LULC types from 1996 to 2014. The high LST zones were generally distributed in impervious surface types, while the low LST zones were distributed in land surfaces covered with vegetation. This result is consistent with other studies on UHI effect [10,22]. According to the LST profile analysis, the increase in mean LST was based on the expansion of built-up areas, which was the region with the highest fraction of impervious surface from 1996 to 2014. This also confirms the previous conclusion that UHI effect has a positive correlation with urban size, which revealed that the air temperature in urban areas tended to increase with the expansion of urban size [13,70,71].

4.2. The Relationships between the Heat Source–Sink Landscape Pattern and LST

In this study area, the landscape feature differences between heat sources and sinks were investigated at both the landscape level and the class level. For the landscape level, our results indicated that the composition and spatial configuration metrics were significantly associated with mean LST and were positive for heat sources and negative for heat sinks between 1996 and 2014. These findings are consistent with other studies, e.g., Chen and Yu [3] found significant relevance between mean LST and landscape patterns of SHUI (positive) and SHUS (negative) zones in Guangzhou, China. According to the category of heat sources and sinks, impervious surface occupies a high proportion of heat source zones, while grassland is dominant in heat sink zones throughout the cities. The major reason for this difference is that the thermal properties of the landscape types are distinct. Thus, it can be thought that landscape composition has a more notable influence on LST compared with landscape configuration in the study area. Many studies have demonstrated this result in metropolitan regions [22,72]. This result suggests the need to devote more efforts to expanding the coverage of green space to alleviate the thermal environment effect in Zhengzhou City. In addition, the investigation also found that class-based landscape composition and spatial configurations of heat source and sink were essential factors impacting the thermal environment. Specifically, the impacts of the heat source composition on the heat environment mostly showed an increase of LST, with a rise in the proportion and density of heat source patches. For the spatial arrangement of heat sources, aggregated landscape patterns can drastically promote urban temperatures. Because a remarkable positive association existed between the LST and the shape index of heat source patches, several smaller heat sources patches would generate a stronger thermal environment effect than larger and contiguous patches. On the other hand, with an increase in the proportion of heat sink patches, the impact of the heat sink composition on the heat environment revealed a decrease of LST. In addition, a higher diversity of heat sink patches can also effectively decrease LST. For the spatial configuration of heat sinks, a landscape arrangement with aggregated patterns and large patch size would be more practical in reducing the UHI effect than dispersed patches of heat sinks. The edge features and shape complexity of heat sink patches are also important to promote a cool island effect, as the increase of total patch edges and shape complexity could enhance the exchange of energy between heat sink patches and their surrounding areas [13,73,74].

4.3. Implications for UHI Mitigation

As discussed above, rapid urbanization has influenced the ecological environment of Zhengzhou City and generated UHI effects. The main reason for the increase in UHI effects is that more natural lands have been changed into impervious surface areas; this conversion comes at the expense of (i.e., the loss of) urban green spaces. In general, impervious surfaces enhance LST due to their higher thermal inertia [10], while vegetation helps reduce LST by providing a shade effect that can prevent land surface exposure to solar radiation and by generating cooling effects through evapotranspiration [22]. In this context, the increase in vegetation coverage is one way to alleviate the UHI effects, and it is key for the policy makers of Zhengzhou City to think about the provision of more forest areas and green spaces in their future urban planning to reduce the thermal environment effects. In addition, it should be noteworthy that the uneven LST intensity distribution also has adverse impacts on the dwelling environment and natural ecosystems [25]. As urbanization intensified between 1996 and 2014, the UHI effect became more intense in the study area, especially in terms of the spatial variation of LST values between urban and rural areas. The results show that regions approximately 5 km along the profiles from the city center are generally warmer than other regions in Zhengzhou City. Hence, we would like to recommend that urban planners use some effective UHI mitigation strategies within these regions. The previous studies have widely investigated highly reflective cool surfaces and retro-reflective (RR) materials as new countermeasures to the UHI effect [75,76,77]. Several studies have also proved that increasing the surface albedo of building envelopes and urban paving in urban areas can readily decrease air temperature [78,79,80]. For Zhengzhou City, the establishment of green roofs, cool pavements, cool roofs, and urban gardens in regions should be encouraged [13,81,82].
The other significant implication of the results relates to the strategies of the heat source–sink landscape patterns to alleviate the UHI effect. The expansion of the impervious surface areas is an established trend in the rapid process of urbanization [3]. This phenomenon was observed in Zhengzhou City from 1996 to 2014, and elsewhere in Chinese megacities and the world [83,84,85]. The rapid increase in impervious surface and the consequences of urbanization on the thermal environment are common to many other megacities in the world [86,87]. For example, concerning the relationships between AI, PD, and PLAND of heat source landscapes, Zhengzhou City was similar to Guangzhou, Shenzhen, and Wuhan [3,5,57], while in terms of the relationships between AI and SHAPE_MN of heat sink landscapes, Zhengzhou City was consistent with Bangkok, Jakarta, and Manila in southeast Asia [22]. Hence, given the situation and reality of Zhengzhou City and other megacities in rapid-development regions of the world, remarkably reducing the total amount of developed built-up areas is unrealistic. The findings observed in Zhengzhou City can provide useful, valuable information to relieve the effect of urbanization on the urban thermal environment. On the one hand, the results of this study may help urban planners optimize the spatial configurations of land cover landscapes to reduce the UHI effect. Reasonably adjusting the spatial distribution of heat source patches and increasing the diversity of landscape spatial configuration are effective ways to alleviate the thermal environment effect in future urban development. Dispersing built-up surfaces by arranging various green spaces in the surrounding areas could enhance the exchange of energy between them, which could generate cooling island effects. On the other hand, suitably regulating urban landscape morphology and ensuring a reasonable geometry of landscape patches are also conducive to mitigating the UHI effect [3,5]. Meanwhile, larger and contiguous heat sink patches, including green spaces and water, can contribute to optimizing the diversity of urban landscape spatial configurations and significantly decreasing the magnitude of LST. In addition, the increase in shape complexity, scale, and total patch edges of heat sink patches would also be beneficial for mitigating the UHI effect.

4.4. Limitations

The present study has synthetically analyzed the spatiotemporal evolution of LST and revealed the detailed relationships between landscape patterns and LST. However, there are some factors, including socio-economic transformation and seasonal variation, that were not included in the classification of heat sources and sinks due to limited data accessibility. Therefore, they are likely to exert certain impacts on the investigation of the relationship between urban landscape and LST. Besides this, long-series Landsat images can reduce the effect of climate background on LST and obtain better LST values, but due to the influence of weather factors such as cloud pollution and precipitation, the available images are limited, so long time series data cannot be obtained; this is also a limitation of this paper. In addition, the different biophysical conditions in urban regions commonly result in spatial heterogeneity of the landscape pattern. However, the heterogeneous effects of landscape pattern on LST were not considered sufficiently in correlation analysis using the statistical models. Hence, in future study, more and longer time series data should be included when possible, and the findings under different seasonal conditions and meteorological parameters should be compared. Meanwhile, the heterogeneous effects of urban landscape on the thermal environment should be seriously considered by a suitable statistical model.

5. Conclusions

This study investigated the spatiotemporal variation of LST in Zhengzhou City, China between 1996 and 2014 using thermal remote sensing and geospatial approaches. The results reveal that the overall mean LST has increased by 2.72 °C in the study area, which indicates that the local climate of Zhengzhou City and its environmental conditions have been influenced by the formation of the UHI phenomenon. This observed increasing trend in overall mean LST is consistent with the process of rapid urbanization in the study area, which led to the dramatic increase in the impervious surface areas and the substantial loss of vegetation coverage.
In addition, based on a comprehensive assessment of the contributions of various LULC types to the thermal environment, we identified the heat source and heat sink landscapes for the thermal environment. The relationships between landscape patterns and LST were also examined by applying correlation analysis.
The results revealed significantly different impacts of heat source and heat sink landscape on LST, and it was determined that the impact on LST is not only due to urban landscape composition but also to its size, shape, and spatial configurations. However, landscape compositions have stronger influence on LST than spatial configurations. For the heat source landscape patches, an increase in their proportion and density would strengthen the UHI effects, while adjusting the spatial distribution and abundance of urban landscape are effective ways to reduce LST. For the heat sink landscape patches, an increase in their size, density, and aggregation would enhance cooling effects. Meanwhile, increasing the total patch edges and shape complexity of heat sink patches should be considered as ways to alleviate the thermal environment effect. In general, these results have important implications for urban planners in designing and optimizing the urban landscape pattern to mitigate the UHI effect, so that the study area can have a healthier living environment and enhance sustainable development.

Author Contributions

H.Z. analyzed the data and wrote the paper. H.Z. helped in the organization of the paper. C.M. improved the research framework. X.Y. and M.M. contributed to editing the manuscript.

Funding

This research was funded by the Natural Sciences Foundation of China grant number 41501128, the Natural Sciences Foundation of China grant number 41430637, and the China Postdoctoral Science Foundation grant number 2015M582181.

Acknowledgments

The research is sponsored by a grant from the Natural Sciences Foundation of China (No. 41501128, 41430637) and support from the China Postdoctoral Science Foundation (2015M582181). The authors also would like to thank the anonymous reviewers for their constructive comments on improving this paper.

Conflicts of Interest

The authors declare no conflicts of interest.

References

  1. Deng, C.; Wu, C. Examining the impacts of urban biophysical compositions on surface urban heat island: A spectral unmixing and thermal mixing approach. Remote Sens. Environ. 2013, 131, 262–274. [Google Scholar] [CrossRef]
  2. Song, J.; Du, S.; Feng, X.; Guo, L. The relationships between landscape compositions and land surface temperature: Quantifying their resolution sensitivity with spatial regression models. Landsc. Urban Plan. 2014, 123, 145–157. [Google Scholar] [CrossRef]
  3. Chen, Y.; Yu, S. Impacts of urban landscape patterns on urban thermal variations in Guangzhou, China. Int. J. Appl. Earth Obs. Geoinf. 2017, 54, 65–71. [Google Scholar] [CrossRef]
  4. Zhou, W.Q.; Qian, Y.G.; Li, X.M.; Li, W.F.; Han, L.J. Relationships between land cover and the surface urban heat island: Seasonal variability and effects of spatial and thematic resolution of land cover data on predicting land surface temperatures. Landsc. Ecol. 2014, 29, 153–167. [Google Scholar] [CrossRef]
  5. Li, W.; Cao, Q.; Lang, K.; Wu, J. Linking potential heat source and sink to urban heat island: Heterogeneous effects of landscape pattern on land surface temperature. Sci. Total Environ. 2017, 586, 457–465. [Google Scholar] [CrossRef] [PubMed]
  6. Roth, M.; Oke, T.R.; Emery, W.J. Satellite-derived urban heat islands from three coastal cities and the utilization of such data in urban climatology. Int. J. Remote Sens. 1989, 10, 1699–1720. [Google Scholar] [CrossRef]
  7. Oke, T.R.; Hannel, F.G. The Form of the Urban Heat Island in Hamilton, Canada; Note No. 108, WMO No. 254 TP 141; WMO Technical: Geneva, Switzerland, 1970; pp. 113–126. [Google Scholar]
  8. Voogt, J.A.; Oke, T.R. Thermal remote sensing of urban climates. Remote Sens. Environ. 2003, 86, 370–384. [Google Scholar] [CrossRef]
  9. US Environmental Protection Agency (EPA). Reducing Urban Heat Islands: Compendium of Strategies; US Environmental Protection Agency: Washington, DC, USA, 2008.
  10. Zhang, X.; Estoque, R.C.; Murayama, Y. An urban heat island study in Nanchang City, China based on land surface temperature and social-ecological variables. Sustain. Cities Soc. 2017, 32, 557–568. [Google Scholar] [CrossRef]
  11. Memon, R.A.; Leung, D.Y.; Liu, C.H. An investigation of urban heat island intensity (UHII) as an indicator of urban heating. Atmos. Res. 2009, 94, 491–500. [Google Scholar] [CrossRef]
  12. Anniballe, R.; Bonafoni, S.; Pichierri, M. Spatial and temporal trends of the surface and air heat island over Milan using MODIS data. Remote Sens. Environ. 2014, 150, 163–171. [Google Scholar] [CrossRef]
  13. Estoque, R.C.; Murayama, Y. Monitoring surface urban heat island formation in a tropical mountain city using Landsat data (1987–2015). ISPRS J. Photogramm. Remote Sens. 2017, 133, 18–29. [Google Scholar] [CrossRef]
  14. Huang, N.; Wang, H.; Lin, T. Regulation framework of watershed landscape pattern for non-point source pollution control based on source-sink theory: A case study in the watershed of Maluan Bay, Xiamen City, China. Chin. J. Appl. Ecol. 2016, 27, 3325–3334. [Google Scholar]
  15. Li, Z.L.; Tang, B.H.; Wu, H.; Ren, H.; Yan, G.; Wan, Z. Satellite-derived land surface temperature: Current status and perspectives. Remote Sens. Environ. 2013, 131, 14–37. [Google Scholar] [CrossRef] [Green Version]
  16. Weng, Q. Thermal infrared remote sensing for urban climate and environmental studies: Methods, applications, and trends. ISPRS J. Photogramm. Remote Sens. 2009, 64, 335–344. [Google Scholar] [CrossRef]
  17. Liu, L.; Zhang, Y. Urban heat island analysis using the Landsat TM data and ASTER data: A case study in Hong Kong. Remote Sens. 2011, 3, 1535–1552. [Google Scholar] [CrossRef]
  18. Chen, X.L.; Zhao, H.M.; Li, P.X.; Yin, Z.Y. Remote sensing image-based analysis of the relationship between urban heat island and land use/cover changes. Remote Sens Environ. 2006, 104, 133–146. [Google Scholar] [CrossRef]
  19. Xiao, R.; Ouyang, Z.; Zheng, H.; Li, W.; Schienke, E.W.; Wang, X. Spatial pattern of impervious surfaces and their impacts on land surface temperature in Beijing, China. J. Environ. Sci. 2007, 19, 250–256. [Google Scholar] [CrossRef]
  20. Morabito, M.; Crisci, A.; Messeri, A.; Orlandini, S.; Raschi, A.; Maracchi, G.; Munafò, M. The impact of built-up surfaces on land surface temperatures in Italian urban areas. Sci. Total Environ. 2016, 551–552, 317–326. [Google Scholar] [CrossRef] [PubMed]
  21. Bokaie, M.; Zarkesh, M.K.; Arasteh, P.D.; Hosseini, A. Assessment of Urban Heat Island based on the relationship between land surface temperature and Land Use/Land Cover in Tehran. Sustain. Cities Soc. 2016, 23, 94–104. [Google Scholar] [CrossRef]
  22. Estoque, R.C.; Murayama, Y.; Myint, S.W. Effects of landscape composition and pattern on land surface temperature: An urban heat island study in the megacities of Southeast Asia. Sci. Total Environ. 2017, 577, 349–359. [Google Scholar] [CrossRef] [PubMed]
  23. Li, J.; Song, C.; Cao, L.; Zhu, F.; Meng, X.; Wu, J. Impacts of landscape structure on surface urban heat islands: A case study of Shanghai, China. Remote Sens. Environ. 2011, 115, 3249–3263. [Google Scholar] [CrossRef]
  24. Xiong, Y.; Huang, S.; Chen, F.; Ye, H.; Wang, C.; Zhu, C. The impacts of rapid urbanization on the thermal environment: A remote sensing study of Guangzhou, South China. Remote Sens. 2012, 4, 2033–2056. [Google Scholar] [CrossRef]
  25. Kikon, N.; Singh, P.; Singh, S.K.; Vyas, A. Assessment of urban heat islands (UHI) of Noida City: India using multi-temporal satellite data. Sustain. Cities Soc. 2016, 22, 19–28. [Google Scholar] [CrossRef]
  26. Hamada, S.; Ohta, T. Seasonal variations in the cooling effect of urban green areas on surrounding urban areas. Urban For. Urban Green. 2010, 9, 15–24. [Google Scholar] [CrossRef]
  27. Canadell, J.G.; Kirschbaum, M.U.F.; Kurz, W.A.; Sanz, M.; Schlamadinger, B.; Yamagata, Y. Factoring out natural and indirect human effects on terrestrial carbon sources and sinks. Environ. Sci. Pollut. 2007, 10, 370–384. [Google Scholar] [CrossRef]
  28. Lal, S. A study of the atmospheric photochemical loss of N2O based on trace gas measurements. Chemosphere Glob. Chang. Sci. 2000, 2, 455–463. [Google Scholar] [CrossRef]
  29. Chandrappa, R.; Kulshrestha, U.C. Sustainable Air Pollution Management; Air Quality Issues; Springer International Publishing: Berlin, Germany, 2016; pp. 49–107. [Google Scholar]
  30. Dai, E.; Huang, Y.; Wu, Z.; Zhao, D. Analysis of spatio-temporal features of a carbon source/sink and its relationship to climatic factors in the Inner Mongolia grassland ecosystem. J. Geogr. Sci. 2016, 26, 297–312. [Google Scholar] [CrossRef] [Green Version]
  31. Boughton, D.A. The dispersal system of a butterfly: A test of source-sink theory suggests the intermediate-scale hypothesis. Am. Nat. 2000, 156, 131–144. [Google Scholar] [PubMed]
  32. Chen, L.; Fu, B.; Zhao, W. Source-sink landscape theory and its ecological significance. Front. Biol. China 2008, 3, 131–136. [Google Scholar] [CrossRef]
  33. Xu, S. An approach to analyzing the intensity of the daytime surface urban heat island effect at a local scale. Environ. Monit. Assess. 2009, 151, 289–300. [Google Scholar] [CrossRef] [PubMed]
  34. Alves, E.D.L. Seasonal and spatial variation of surface urban heat island intensity in a small urban agglomerate in Brazil. Climate 2016, 4, 61. [Google Scholar] [CrossRef]
  35. Sakakibara, Y.; Owa, K. Urban-rural temperature differences in coastal cities: Influence of rural sites. Int. J. Climatol. 2005, 25, 811–820. [Google Scholar] [CrossRef]
  36. Lazzarini, M.; Marpu, P.R.; Ghedira, H. Temperature-land cover interactions: The inversion of urban heat island phenomenon in desert city areas. Remote Sens. Environ. 2013, 130, 136–152. [Google Scholar] [CrossRef]
  37. Min, M.; Zhao, H.; Miao, C. Spatio-Temporal Evolution Analysis of the Urban Heat Island: A Case Study of Zhengzhou City, China. Sustainability 2018, 10, 1992. [Google Scholar] [CrossRef]
  38. Gong, M.; Yin, S.; Gu, X.; Xu, Y.; Jiang, N.; Zhang, R. Refined 2013-based vehicle emission inventory and its spatial and temporal characteristics in Zhengzhou, China. Sci. Total Environ. 2017, 599, 1149–1159. [Google Scholar] [CrossRef] [PubMed]
  39. Singh, P.; Kikon, N.; Verma, P. Impact of land use change and urbanization on urban heat island in Lucknow city, Central India. A remote sensing based estimate. Sustain. Cities Soc. 2017, 32, 100–114. [Google Scholar] [CrossRef]
  40. Stehman, A.V. Sampling designs for accuracy assessment of land cover. Int. J. Remote Sens. 2009, 30, 5243–5272. [Google Scholar] [CrossRef]
  41. Shalaby, A.; Tateishi, R. Remote sensing and GIS for mapping and monitoring land cover and land-use changes in the Northwestern coastal zone of Egypt. Appl. Geogr. 2007, 27, 28–41. [Google Scholar] [CrossRef]
  42. Jassen, L.I.F.; Frans, J.M.; Wel, V.D. Accuracy assessment of satellite derived land-cover data: A review. Photogramm. Eng. Remote Sens. 1994, 60, 410–432. [Google Scholar]
  43. Bonafoni, S. Downscaling of Landsat and MODIS land surface temperature over the heterogeneous urban area of Milan. IEEE J. Sel. Top. Appl. Earth Obs. Remote Sens. 2016, 9, 2019–2027. [Google Scholar] [CrossRef]
  44. Lo, C.P.; Quattrochi, D.A. Land-use and land-cover change, urban heat island phenomenon, and health implications: A remote sensing approach. Photogramm. Eng. Remote Sens. 2003, 69, 1053–1063. [Google Scholar] [CrossRef]
  45. Xu, D.; Chen, R. Comparison of urban heat island and urban reflection in Nanjing City of China. Sustain. Cities Soc. 2017, 31, 26–36. [Google Scholar] [CrossRef]
  46. United States Geological Survey (USGS). Product Guide: Provisional Landsat 8 Surface Reflectance Product; Department of the Interior, U.S. Geological Survey: Reston, VA, USA, 2016.
  47. Sobrino, J.A.; Jiménez-Muñoz, J.C.; Paolini, L. Land surface temperature retrieval from LANDSAT TM 5. Remote Sens. Environ. 2004, 90, 434–440. [Google Scholar] [CrossRef]
  48. Carlson, T.N.; Ripley, D.A. On the relation between NDVI, fractional vegetation cover, and leaf area index. Remote Sens. Environ. 1997, 62, 241–252. [Google Scholar] [CrossRef]
  49. Sobrino, J.A.; Raissouni, N. Toward remote sensing methods for land cover dynamic monitoring: Application to Morocco. Int. J. Remote Sens. 2000, 21, 353–366. [Google Scholar] [CrossRef]
  50. Majumdar, D.D.; Biswas, A. Quantifying land surface temperature change from LISA clusters: An alternative approach to identifying urban land use transformation. Landsc. Urban Plan. 2016, 153, 51–65. [Google Scholar] [CrossRef]
  51. Weng, Q.; Lu, D.; Schubring, J. Estimation of land surface temperature vegetation abundance relationship for urban heat island studies. Remote Sens. Environ. 2004, 89, 467–483. [Google Scholar] [CrossRef]
  52. Markham, B.L.; Barker, J.K. Spectral characteristics of the LANDSAT Thematic Mapper sensors. Int. J. Remote Sens. 1985, 6, 697–716. [Google Scholar] [CrossRef]
  53. Smith, R.M. Comparing Traditional Methods for Selecting Class Intervals on Choropleth Maps. Prof. Geogr. 1986, 38, 62–67. [Google Scholar] [CrossRef]
  54. Liu, H.; Weng, Q. Seasonal Variations in the Relationship between Landscape Pattern and Land Surface Temperature in Indianapolis, USA. Environ. Monit. Assess. 2008, 144, 199–219. [Google Scholar] [CrossRef] [PubMed]
  55. Mottet, A.; Ladet, S.; Coqué, N.; Gibon, A. Agricultural land-use change and its drivers in mountain landscapes: A case study in the Pyrenees. Agric. Ecosyst. Environ. 2006, 114, 296–310. [Google Scholar] [CrossRef]
  56. McGarigal, K.; Cushman, S.A.; Ene, E. FRAGSTATS v4: Spatial Pattern Analysis Program for Categorical and Continuous Maps. Computer software program produced by the authors at the University of Massachusetts, Amherst. 2012. Available online: http://www.umass.edu/landeco/research/fragstats/fragstats.html (accessed on 25 March 2018).
  57. Wu, H.; Ye, L.P.; Shi, W.Z.; Clarke, K.C. Assessing the effects of land use spatial structure on urban heat islands using HJ-1B remote sensing imagery in Wuhan, China. Int. J. Appl. Earth Obs. Geoinf. 2014, 32, 67–78. [Google Scholar] [CrossRef]
  58. RivaMurray, K.; Riemann, R.; Murdoch, P.; Fischer, J.M.; Brightbill, R. Landscape characteristics affecting streams in urbanizing regions of the DelawareRiver Basin (New Jersey, New York, and Pennsylvania, U.S.). Landsc. Ecol. 2010, 25, 1489–1503. [Google Scholar] [CrossRef]
  59. Plexida, S.G.; Sfougaris, A.I.; Ispikoudis, I.P.; Papanastasis, V.P. Selecting landscape metrics as indicators of spatial heterogeneityA comparison among Greek landscapes. Int. J. Appl. Earth Obs. Geoinf. 2014, 26, 26–35. [Google Scholar] [CrossRef]
  60. Mu, B.; Mayer, A.L.; He, R.; Tian, G. Land use dynamics and policy implications in Central China: A case study of Zhengzhou. Cities 2016, 58, 39–49. [Google Scholar] [CrossRef]
  61. Duan, J.; Song, X.; Zhang, X. Spatiotemporal variation of urban heat island in Zhengzhou City based on RS. Chin. J. Appl. Ecol. 2011, 22, 165–170. [Google Scholar]
  62. Yao, R.; Wang, L.; Huang, X.; Niu, Z.; Liu, F.; Wang, Q. Temporal trends of surface urban heat islands and associated determinants in major Chinese cities. Sci. Total Environ. 2017, 609, 742–754. [Google Scholar] [CrossRef] [PubMed]
  63. Zeng, Y.; Qiu, X.F.; Gu, L.H.; He, Y.J.; Wang, K.F. The urban heat island in Nanjing. Quat. Int. 2009, 208, 38–43. [Google Scholar] [CrossRef]
  64. Li, Y.Y.; Zhang, H.; Kainz, W. Monitoring patterns of urban heat islands of the fast-growing Shanghai metropolis, China: Using time-series of Landsat TM/ETM+ data. Int. J. Appl. Earth Obs. Geoinf. 2012, 19, 127–138. [Google Scholar] [CrossRef]
  65. Ma, Y.; Xu, R. Remote sensing monitoring and driving force analysis of urban expansion in Guangzhou City, China. Habitat Int. 2010, 34, 228–235. [Google Scholar] [CrossRef]
  66. Ivajnšič, D.; Kaligarič, M.; Žiberna, I. Geographically weighted regression of the urban heat island of a small city. Appl. Geogr. 2014, 53, 341–353. [Google Scholar] [CrossRef]
  67. Pal, S.; Ziaul, S. Detection of land use and land cover change and land surface temperature in English Bazar urban centre. Egypt. J. Remote Sens. Space Sci. 2017, 20, 125–145. [Google Scholar] [CrossRef] [Green Version]
  68. Oke, T.R. The energetic basis of the urban heat island. Q. J. R. Meteorol. Soc. 1982, 108, 1–24. [Google Scholar] [CrossRef]
  69. Schatz, J.; Kucharik, C.J. Seasonality of the urban heat island effect in Madison, Wisconsin. J. Appl. Meteorol. Clim. 2014, 53, 2371–2386. [Google Scholar] [CrossRef]
  70. Oke, T.R. City size and the urban heat island. Atmos. Environ. 1973, 7, 769–779. [Google Scholar] [CrossRef]
  71. Takebayashi, H.; Senoo, M. Analysis of the relationship between urban size and heat island intensity using WRF model. Urban Clim. 2018, 24, 287–298. [Google Scholar] [CrossRef]
  72. Peng, J.; Xie, P.; Liu, Y.; Ma, J. Urban thermal environment dynamics and associated landscape pattern factors: A case study in the Beijing metropolitan region. Remote Sens. Environ. 2016, 173, 145–155. [Google Scholar] [CrossRef]
  73. Zhou, W.; Huang, G.; Cadenasso, M.L. Does spatial configuration matter? Understanding the effects of land cover pattern on land surface temperature in urban landscapes. Landsc. Urban Plan. 2011, 102, 54–63. [Google Scholar] [CrossRef]
  74. Li, X.; Zhou, W.; Ouyang, Z. Relationship between land surface temperature and spatial pattern of greenspace: What are the effects of spatial resolution? Landsc. Urban Plan. 2013, 114, 1–8. [Google Scholar] [CrossRef]
  75. Morini, E.; Castellani, B.; Presciutti, A.; Anderini, E.; Filipponi, M.; Nicolini, A.; Rossi, F. Experimental analysis of the effect of geometry and façade materials on urban district’s equivalent albedo. Sustainability 2017, 9, 1245. [Google Scholar] [CrossRef]
  76. Morini, E.; Castellani, B.; Presciutti, A.; Filipponi, M.; Nicolini, A.; Rossi, F. Optic-energy performance improvement of exterior paints for buildings. Energy Build. 2017, 139, 690–701. [Google Scholar] [CrossRef]
  77. Morini, E.; Castellani, B.; De Ciantis, S.; Anderini, E.; Rossi, F. Planning for cooler urban canyons: Comparative analysis of the influence of facades reflective properties on urban canyon thermal behavior. Sol. Energy 2018, 162, 14–27. [Google Scholar] [CrossRef]
  78. Jandaghian, Z.; Akbari, H. The Effect of Increasing Surface Albedo on Urban Climate and Air Quality: A Detailed Study for Sacramento, Houston, and Chicago. Climate 2018, 6, 19. [Google Scholar] [CrossRef]
  79. Fallmann, J.; Forkel, R.; Emeis, S. Secondary effects of urban heat island mitigation measures on air quality. Atmos. Environ. 2016, 125, 199–211. [Google Scholar] [CrossRef]
  80. Touchaei, A.G.; Akbari, H.; Tessum, C.W. Effects of increasing urban albedo on meteorology and air quality Montreal (Canada)-Episodic simulation of heat wave in 2005. Atmos. Environ. 2016, 132, 188–206. [Google Scholar] [CrossRef]
  81. Synnefa, A.; Dandou, A.; Santamouris, M.; Tombrou, M. On the use of cool materials as a heat island mitigation strategy. J. Appl. Meteorol. Climatol. 2008, 47, 2846–2856. [Google Scholar] [CrossRef]
  82. Hoag, H. How cities can beat the heat. Nature 2015, 524, 402–404. [Google Scholar] [CrossRef] [PubMed] [Green Version]
  83. Kuang, W.H.; Chi, W.F.; Lu, D.S.; Dou, Y.Y. A comparative analysis of megacity expansions in China and the U.S.: Patterns, rates and driving forces. Landsc. Urban Plan. 2014, 132, 121–135. [Google Scholar] [CrossRef]
  84. Wu, W.J.; Zhao, S.Q.; Zhu, C.; Jiang, J.L. A comparative study of urban expansion in Beijing, Tianjin and Shijiazhuang over the past three decades. Landsc. Urban Plan. 2015, 134, 93–106. [Google Scholar] [CrossRef]
  85. Powell, S.; Cohen, W.; Yang, Z.; Pierce, J.; Alberti, M. Quantification of impervious surface in the Snohomish Water Resources Inventory Area of Western Washington from 1972 to 2006. Remote Sens. Environ. 2008, 112, 1895–1908. [Google Scholar] [CrossRef]
  86. Myint, S.W.; Brazel, A.; Okin, G.; Buyantuyev, A. Combined effects of impervious surface and vegetation cover on air temperature variations in a rapidly expanding desert city. GISci. Remote Sens. 2010, 47, 301–320. [Google Scholar] [CrossRef]
  87. Wang, C.; Myint, S.W.; Wang, Z.; Song, J. Spatio-temporal modeling of the urban heat island in the Phoenix metropolitan area: Land use change implications. Remote Sens. 2016, 8, 8. [Google Scholar] [CrossRef]
Figure 1. The location of Zhengzhou City in Henan Province, China (the four traffic rings around the downtown area are shown).
Remotesensing 10 01268 g001
Figure 2. Land cover maps of Zhengzhou City, China in (a) 1996, (b) 2006, and (c) 2014.
Remotesensing 10 01268 g002
Figure 3. Spatial patterns of different LST levels in Zhengzhou in (a) 1996, (b) 2006, and (c) 2014.
Remotesensing 10 01268 g003
Figure 4. Multitemporal and multidirectional LST profiles of Zhengzhou City.
Remotesensing 10 01268 g004aRemotesensing 10 01268 g004b
Figure 5. The composition proportion of land cover types in heat source and sink.
Remotesensing 10 01268 g005
Figure 6. Spatial distribution of heat sources and sinks in Zhengzhou City in (a) 1996, (b) 2006, and (c) 2014.
Remotesensing 10 01268 g006
Figure 7. Urbanization rate and population growth of Zhengzhou City.
Remotesensing 10 01268 g007
Table 1. Descriptions of Landsat TM and OLI/TIRS images used in this study.
On-Board SensorAcquisition DatePath/RowSource
Landsat TM20 May 1996124/36http://glovis usgs.gov/
Landsat TM16 May 2006124/36
Landsat OLI/TIRS27 May 2014124/36
Table 2. Ranking of land surface temperature (LST) levels.
LST LevelDivision
LowTSTmean − 2std
Sub-lowTmean − 2 std < TSTmean − 0.5 std
MediumTmean − 0.5 std < TSTmean + 0.5 std
Sub-highTmean + 0.5 std < TSTmean + 2 std
HighTS > Tmean + 2std
Note: TS denotes the standardized LST; Tmean denotes the mean standardized LST; std denotes the standard deviation.
Table 3. The list of landscape pattern metrics [56,59].
LevelCategoryMetric
Landscape levelCompositionPatch density (PD)
ShapeLandscape shape index (LSI)
Spatial configurationContagion (CONTAG)
Shannon diversity index (SHDI)
Class levelCompositionPercent cover of class area (PLAND)
Patch density (PD)
ShapeEdge density (ED)
Mean shape index (SHAPE_MN)
Mean fractal dimension index (FRAC_MN)
Spatial configurationLandscape division index (DIVISION)
Aggregation index (AI)
Table 4. The LST change in land cover from 1996 to 2014 (unit: °C).
Land Cover1996–20062006–2014
Mean LST (°C)SD LST (°C)Mean LST (°C)SD LST (°C)
Impervious surface28.2041.51130.5831.439
Bare land27.9562.19328.8172.274
Forest24.8511.16024.7321.079
Water22.8720.76123.1750.835
Farmland26.0411.64226.0051.744
Grassland24.8671.66325.1581.693
Table 5. LST values in the different Zhengzhou City ring road areas from 1996 to 2014 (unit: °C).
YearIndicator1st Ring Road2nd Ring Road3rd Ring Road4th Ring RoadThe Whole Study Area
1996Max LST36.9640.4440.8340.8240.83
Min LST27.1113.2413.2413.2313.24
Mean LST32.7332.6731.1029.9629.24
2006Max LST38.1142.3542.3744.9744.97
Min LST26.1324.7121.1812.0512.05
Mean LST32.6332.6431.8430.5830.04
2014Max LST39.8741.7145.2845.2845.28
Min LST28.2828.2824.1920.0618.84
Mean LST33.5933.5133.4933.5931.96
Table 6. The heat source and sink indices in different ring road areas of Zhengzhou City from 1996 to 2014.
YearIndicator1st Ring Road2nd Ring Road3rd Ring Road4th Ring Road
1996Percentage of heat source area97.1689.1457.9138.34
Percentage of heat sink area2.8410.8642.0961.66
CI of heat source0.2631.4791.4510.773
CI of heat sink−0.005−0.091−0.525−0.615
LI0.0190.0610.3610.796
2006Percentage of heat source area86.5986.6669.0648.65
Percentage of heat sink area13.4113.3430.9351.34
CI of heat source2.4311.7712.2251.609
CI of heat sink−0.085−0.068−0.199−0.339
LI0.0340.0380.0890.211
2014Percentage of heat source area96.0396.3690.3179.32
Percentage of heat sink area3.973.679.6920.68
CI of heat source2.4311.8492.1291.909
CI of heat sink−0.051−0.034−0.114−0.25
LI0.0210.0190.0540.131
Note: CI denotes the contribution index, LI denotes the landscape index.
Table 7. Correlation coefficients of landscape pattern of heat sources and heat sinks and LST at the landscape level.
LST Acquired YearCONTAGLSIPDSHDI
Heat sink1996−0.296 *−0.261 *−0.201 *−0.214 **
2006−0.328 *−0.331 **−0.352 **−0.344 **
2014−0.481 **−0.495 **−0.551 **−0.498 **
Heat source19960.217 *0.246 **0.293 **0.293 **
20060.323 **0.398 *0.316 *0.378 **
20140.435 **0.451 **0.554 **0.479 **
Note: * denotes significance at the 0.05 level; ** denotes significance at the 0.01 level (two-tailed).
Table 8. Correlation coefficients of class-level landscape features and heat source–heat sink LST.
199620062014
Heat SinkHeat SourceHeat SinkHeat SourceHeat SinkHeat Source
AI−0.245 **0.235 **−0.313 **0.369 **−0.423 **0.405 **
DIVISION−0.221 **0.296 **−0.336 **0.464 **−0.475 **0.515 **
ED−0.240 **0.012−0.398 **0.015 *−0.454 **0.005 *
PD−0.280 **0.278 **−0.377 **0.378 **−0.515 **0.587 **
PLAND−0.285 **0.236 **−0.342 **0.479 **−0.529 **0.559 **
FRAC_MN−0.234 **0.227 **−0.380 **0.357 **−0.420 **−0.410 **
SHAPE_MN−0.223 **0.221 **−0.276 **0.388 **−0.326 **0.415 **
Note: * denotes significance at the 0.05 level; ** denotes significance at the 0.01 level (two-tailed).

