Investigation of the Fetch Effect Using Onshore and Offshore Vertical LiDAR Devices


1
National Institute of Advanced Industrial Science and Technology, Koriyama 963-0298, Japan
2
Department of Marine Resources and Energy, Tokyo University of Marine Science and Technology, Tokyo 108-8477, Japan
3
Graduate School of Maritime Sciences, Kobe University, Kobe 658-0022, Japan
4
National Institute of Maritime, Port and Aviation Technology, Yokosuka 239-0826, Japan
*
Author to whom correspondence should be addressed.
Remote Sens. 2018, 10(9), 1408; https://0-doi-org.brum.beds.ac.uk/10.3390/rs10091408
Submission received: 12 August 2018
/
Revised: 31 August 2018
/
Accepted: 2 September 2018
/
Published: 5 September 2018
(This article belongs to the Special Issue Remote Sensing of Atmospheric Conditions for Wind Energy Applications)
Abstract
:An offshore wind measurement campaign using vertical light detection and ranging (LiDAR) devices was conducted at the Hazaki Oceanographic Research Station (HORS) as part of an investigation into determining the optimal distance from the coast for a nearshore wind farm from a meteorological perspective. The research platform was a 427 m long pier located on a rectilinear coastline on the Pacific coast of the central Honshu Island in Japan. The relationship between the ratios of the increase of wind speed near the surface and fetch length within 5 km of the coast was analyzed via LiDAR observations taken at heights from 40 to 200 m. The results showed that the speed of the coastal wind blowing from land to sea gradually increased as the fetch length increased, by approximately 15–20% at 50 m above sea level around a fetch length of 2 km. Moreover, empirical equations were derived by applying the power law to the relationship between the increase of wind speed and fetch lengths at 1–5 km, as obtained from the LiDAR measurements. It was also found that the wind speed increase at a 2 km fetch length was equivalent to the effect of a 50–90 m vertical height increase on the coast in this region.
1. Introduction
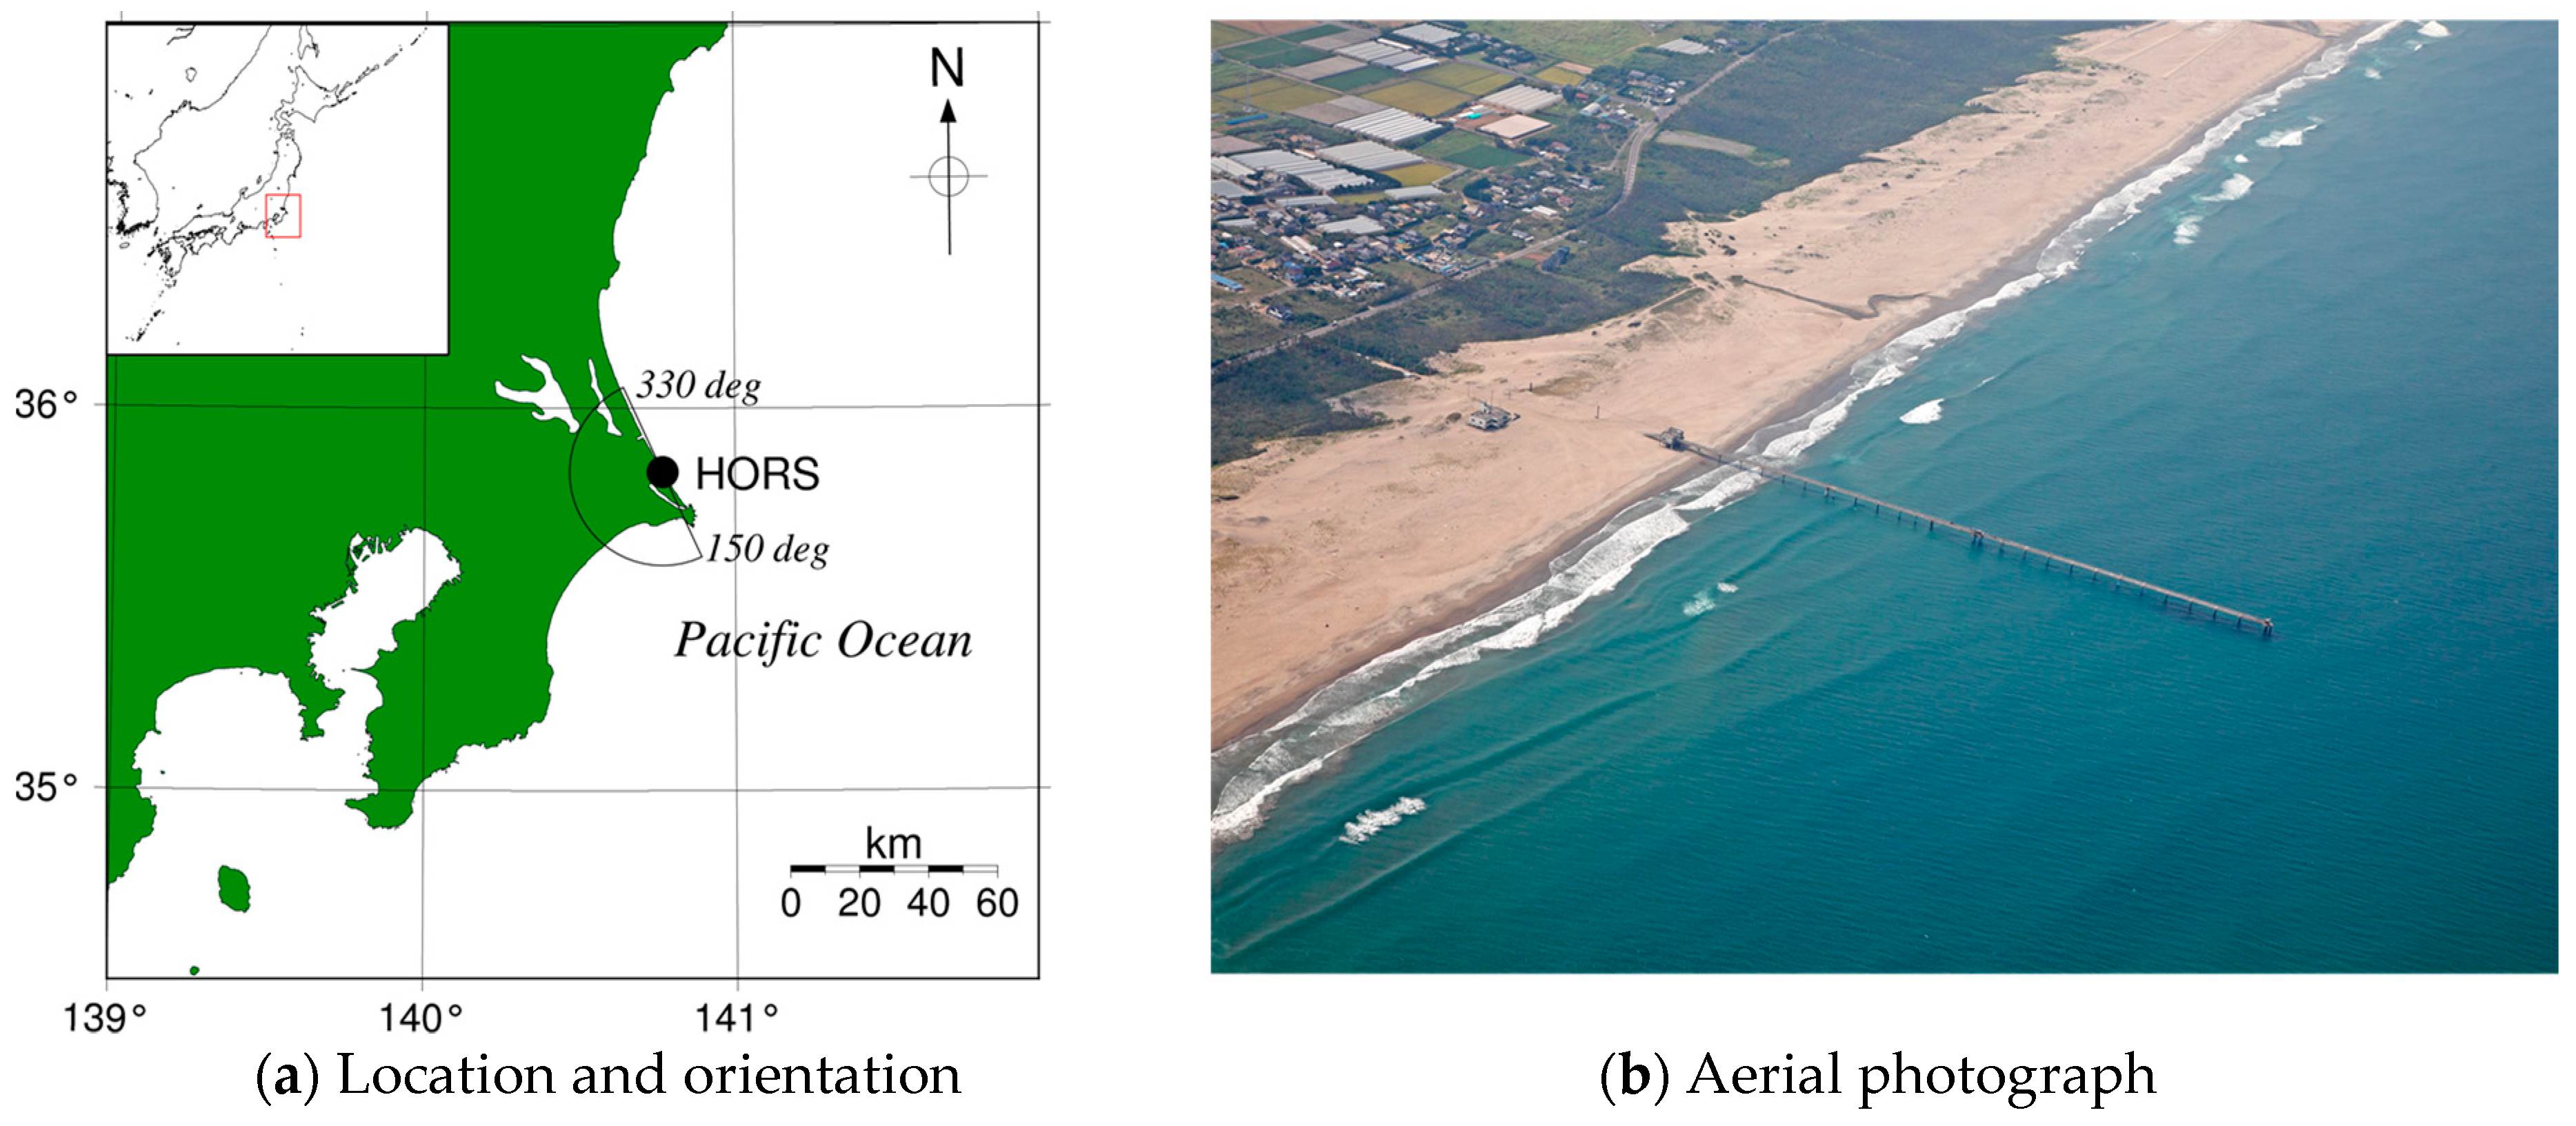
As part of efforts to obtain additional offshore wind observations for the New Energy and Industrial Technology Development Organization, the Offshore Wind Information System (NeoWins) project [1], a coastal wind measurement campaign using light detection and ranging (LiDAR) was conducted from October 2015 to December 2016 at the Hazaki Oceanographic Research Station (HORS) [2] operated by the Port and Airport Research Institute in Japan’s Ibaraki Prefecture (see Figure 1). The observations obtained from the measurement campaign were used to evaluate the accuracy of 500 m grid offshore wind simulations using the mesoscale meteorological model Weather Research and Forecasting (WRF) version 3.6.1 [3], which was employed to create a new Japanese offshore wind atlas.
Mesoscale meteorological models are useful for offshore wind resource assessments [4]. However, some previous studies [5,6,7] have shown that offshore winds simulated by WRF near the coast, where offshore wind farms are likely to be located in Japan in the near future, are less accurate than those simulated over the open ocean. Therefore, the authors have recently focused on the horizontal wind speed gradient near the coast to improve the WRF offshore wind simulation in this location. In addition to the LiDAR over the sea on the HORS research platform, another LiDAR was deployed on land to investigate coastal wind modifications, which is known as the fetch length effect, by comparing the onshore and offshore LiDAR observations. Because the performance of mesoscale models for the fetch length effect has yet to be thoroughly studied, and there were almost no suitable observations for the investigation, the authors believed that focusing on the fetch effect with LiDAR measurements would provide a means for enhancing the accuracy of coastal wind simulations with mesoscale models.
The fetch length effect in coastal environments has already been extensively studied in the field of coastal engineering. For example, Hasselmann et al. (1973) [8] investigated the relationship between the fetch length and the evolution of the wave spectrum in the Joint North Sea Wave Project, a comprehensive wind wave measurement campaign. They observed the atmospheric and oceanographic parameters for the distance from 2 to 160 km at a site on the Danish coast. From the results of this comprehensive measurement campaign, equations for describing wave characteristics such as wave height and peak spectral period were derived [9].
As well as wind waves for coastal engineering, several studies [10,11,12,13,14,15,16] have considered the implications for wind energy applications of the relationship between the wind speed and fetch length over the sea by comparing wind speeds measured onshore and offshore. According to these observational studies, onshore wind speeds increased between 5% and 45% over long marine fetch lengths. However, the increase in wind speed over fetch lengths less than a few kilometers, which are relevant for nearshore wind farm developments, has not been investigated, primarily due to the lack of suitable in situ observations available for such analyses.
The results of previous studies based on in situ observations were reviewed in Barthelmie and Palutikof (1996) [15]. Since the fetch effect depends on local conditions, such as the topography, land use, measurement height, and atmospheric stability, large variations in the relationship between the fetch length and wind speed can be found in these previous studies. For example, Sethuraman and Raynor (1980) [12] showed a wind speed increase of 10–15% at a 5 km fetch length near the sea surface, whereas Lindley et al. (1980) [11] suggested that at a height of 100 m wind speed increases of 5% and 12% are possible for fetch lengths of 7.5 and 20 km, respectively.
Recently, a comprehensive near-shore wind measurement campaign using a total of nine LiDAR systems (three scanning LiDARs, two LiDAR buoys, and four vertical LiDARs) was conducted at a site on the Danish coast as part of the Reducing Uncertainty of Near-shore wind resource Estimates (RUNE) experiment [17]. A RUNE experiment report [18] introduced the horizontal wind speed gradient, which is an index reflecting the fetch effect. During the RUNE experiment, the prevailing winds were strong westerly winds moving from sea to land. The horizontal wind speed gradient that was expected to be dependent on the distance from the shore was largely absent, because an insufficient amount of wind blew from land to sea during the three-month measurement campaign.
In this paper, the authors explain their attempt to explore the increase in wind speed as a function of the fetch length by means of a simple measurement setup using just two vertical LiDARs located on the HORS research platform. From this measurement campaign, they obtained vertical onshore and offshore wind profiles for approximately six months. After analyzing these LiDAR observations, they estimated an optimal coast-to-wind-farm distance from a meteorological perspective, which they believe will be useful for planning nearshore wind farm developments. The authors also believe that the results from these LiDAR observations could provide a useful benchmark dataset for improving the accuracy of numerical models.
2. Experimental Setup
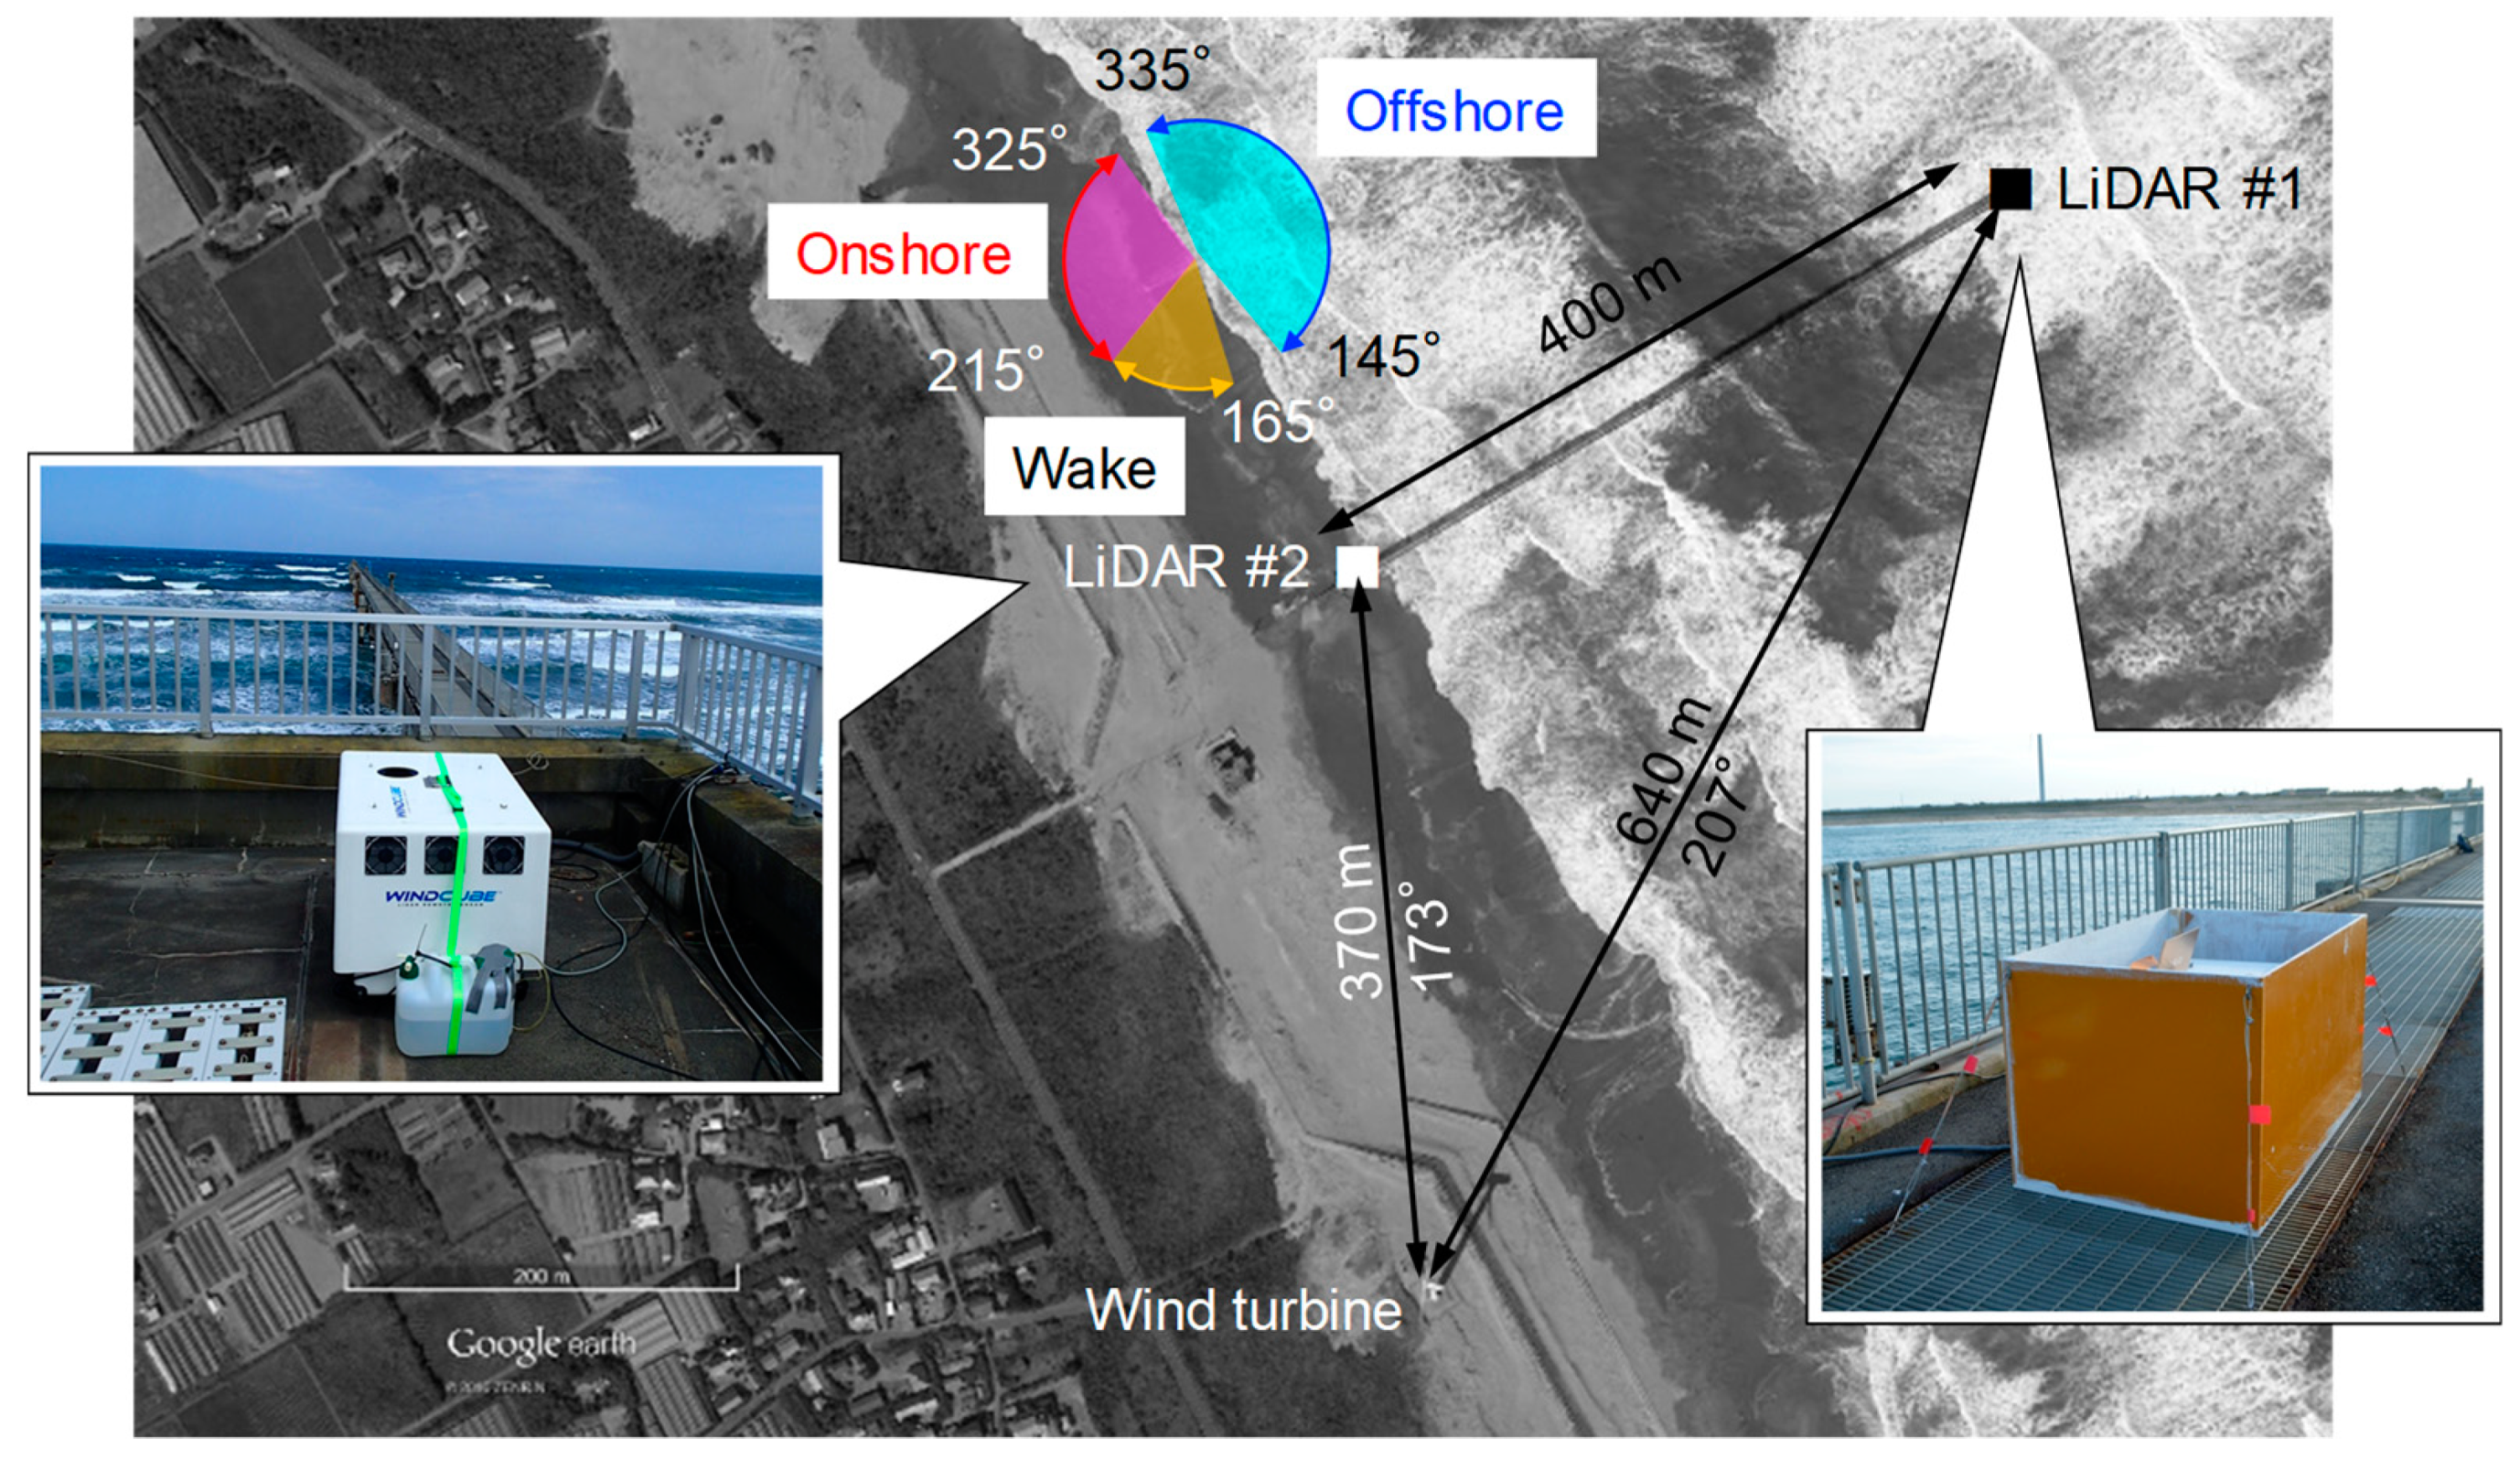
The measurement setup, shown in Figure 2, is a 427 m long pier constructed at a height of 7 m above sea level (ASL) at the HORS research station. Since this research platform was originally established for studies of coastal engineering, it has observed atmospheric and oceanographic parameters for more than 30 years. During the measurement campaign, two vertical profiling LiDAR devices were deployed on the pier. Vertical wind speed profiles at heights of 40 to 200 m from the LiDAR installation level were measured at 20 m intervals with two Windcube V1 units, for which detailed specifications can be found in the literature [19]. One Windcube WLS7-86 (hereafter referred to as LiDAR #1) was attached at the seaside end of the pier, and the other Windcube WLS7-78 (LiDAR #2) was located on the roof of a 3.5 m tall observational hut located at the landside end of the pier. The two LiDAR devices were exactly 400 m apart. Air temperature at 7 m ASL and seawater temperature at a depth of 2 m were observed at the halfway point of the pier, and they were used to evaluate the atmospheric stability during the measurement campaign.
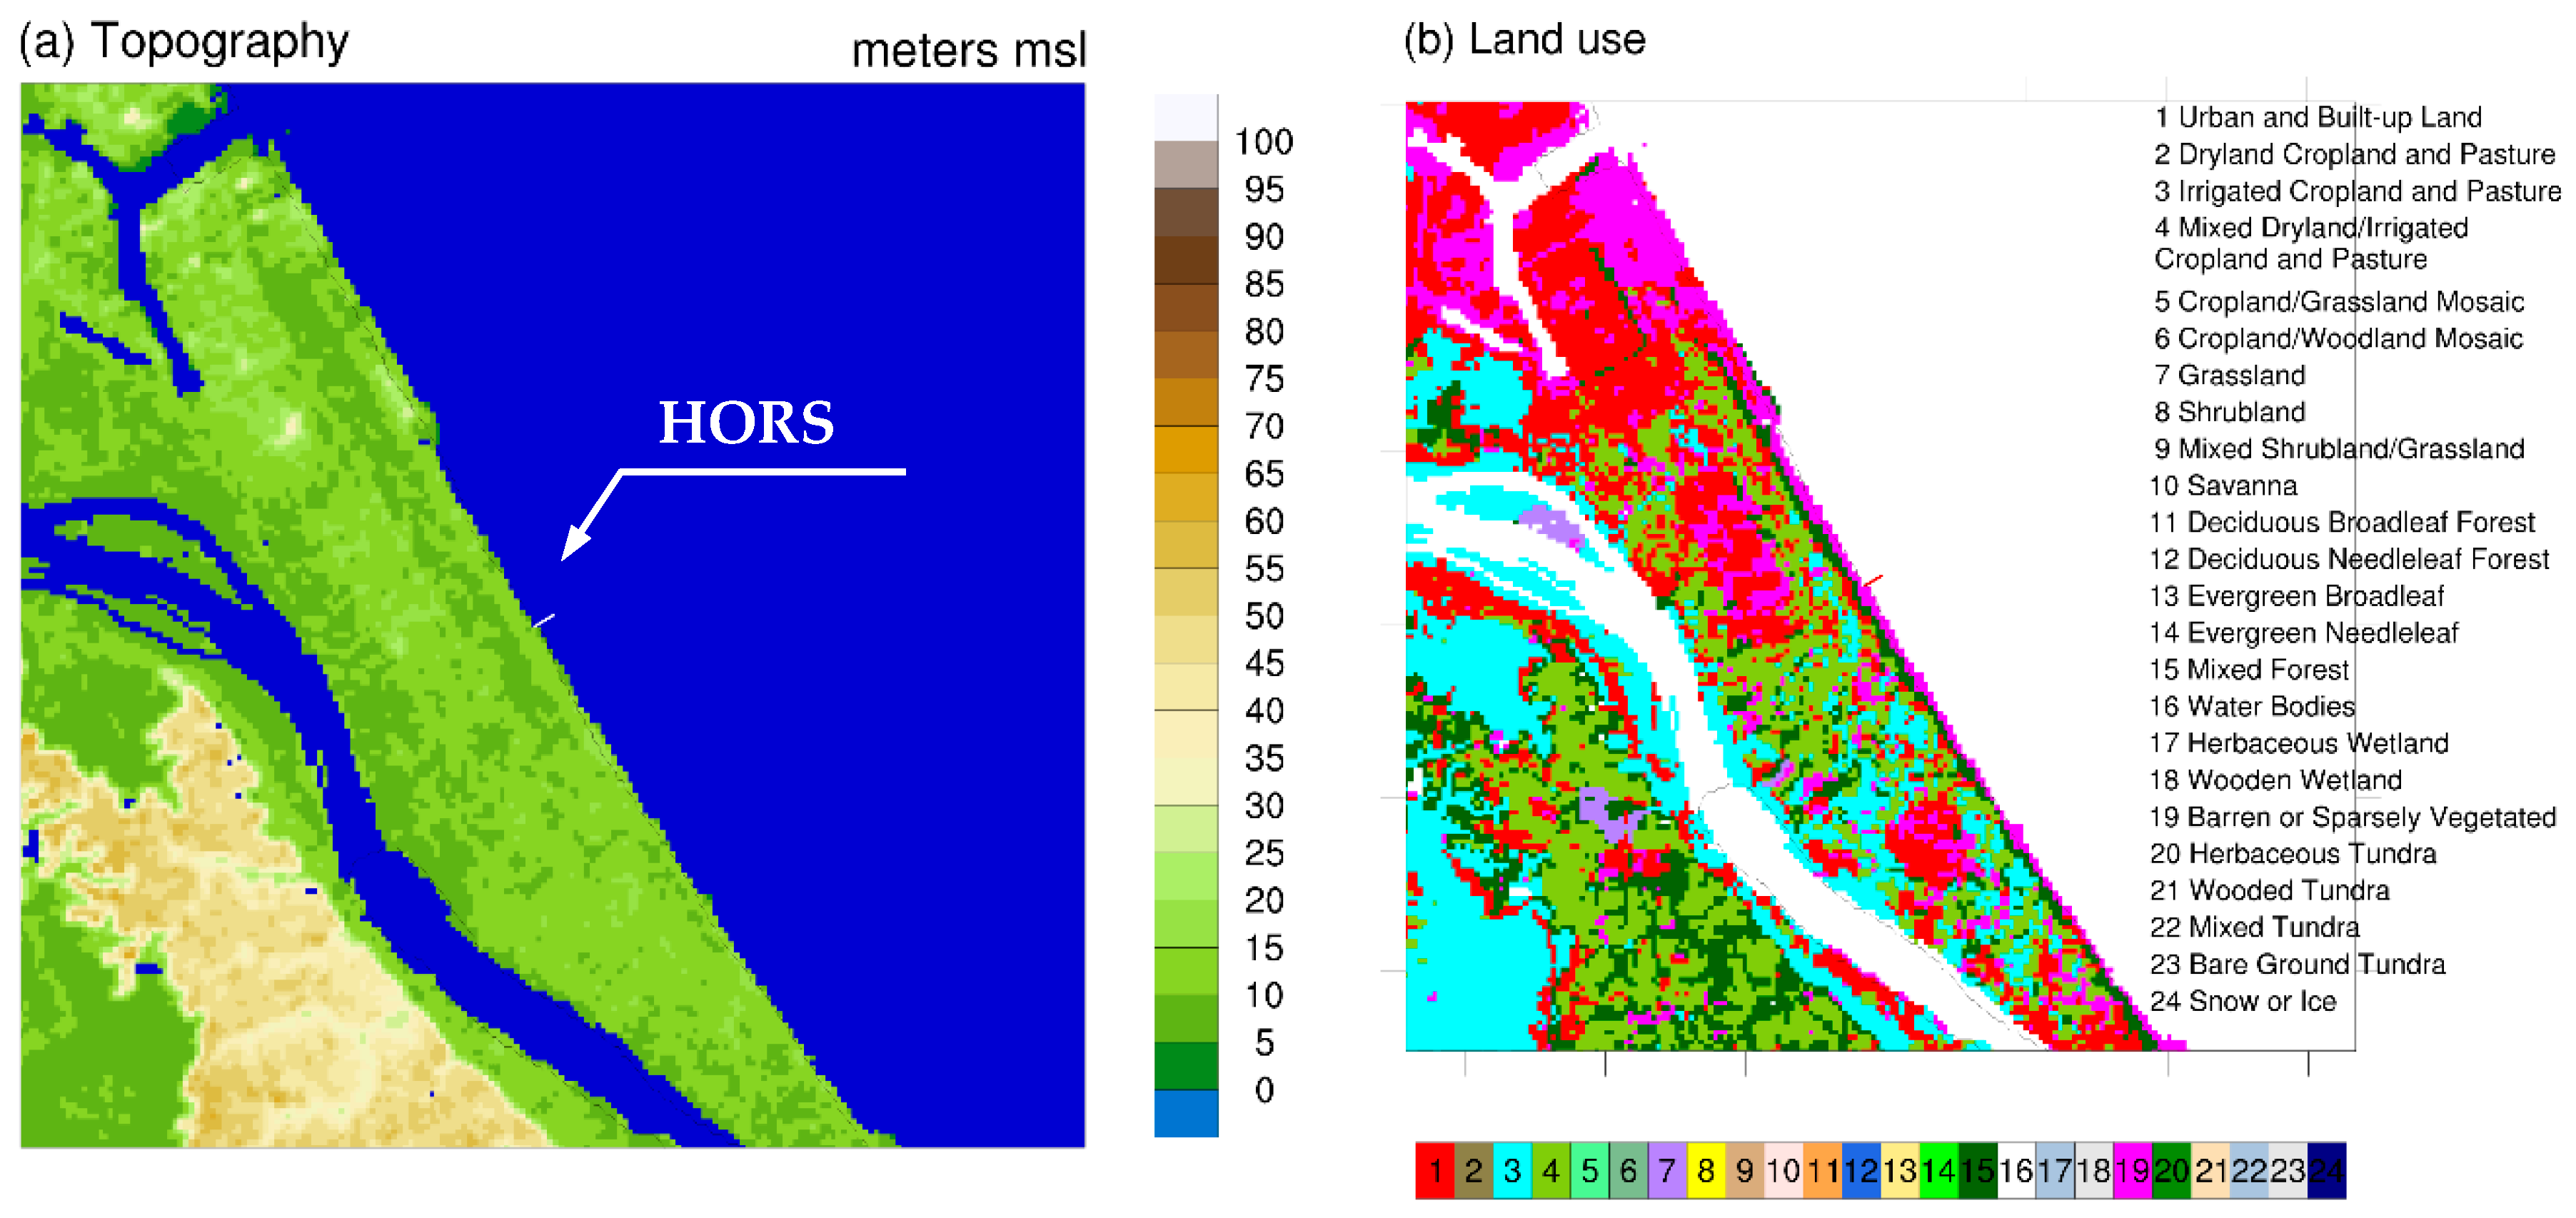
Figure 3 describes the topography and land use in the area surrounding of the HORS research platform; the figure covers an area of 20 km × 20 km. The topography distribution is based on the Advanced Spaceborne Thermal Emission and Reflection Radiometer Global Digital Elevation Model [20], which has a spatial resolution of 30 m, and the land use distribution is based on a 100 m resolution land use map provided by the government of Japan [21]. The terrain in this region, which is located outside a sparsely populated industrial area, is flat. Since this section of the coastline is rectilinear, the research platform provides ideal conditions for investigating variations in wind speed related to the fetch length effect. For example, categorizing onshore (land to sea) or offshore (sea to land) winds based on wind direction is frequently applied in coastal wind analysis, but it is difficult to accomplish this in regions with complex coastlines. Due to the straight coastline running from 150° to 330° at the HORS research platform, the authors could clearly distinguish between onshore or offshore winds.
It is to be noted that some winds observed by both LiDARs, blowing from between 165° and 215°, were influenced by nearby 1.25 MW wind turbines, which have hub heights of 64.5 m. Since the wind turbines have rotor diameters of 62 m and are built about 5 m above ground level, observations between 40 and 100 m ASL might be significantly influenced by these wind turbines. As a result, the authors categorized the winds with wind directions between 335° and 145° as offshore winds (sea to land), winds with directions between 165° and 215° as turbine wakes, and winds with directions between 215° and 325° as onshore winds (land to sea).
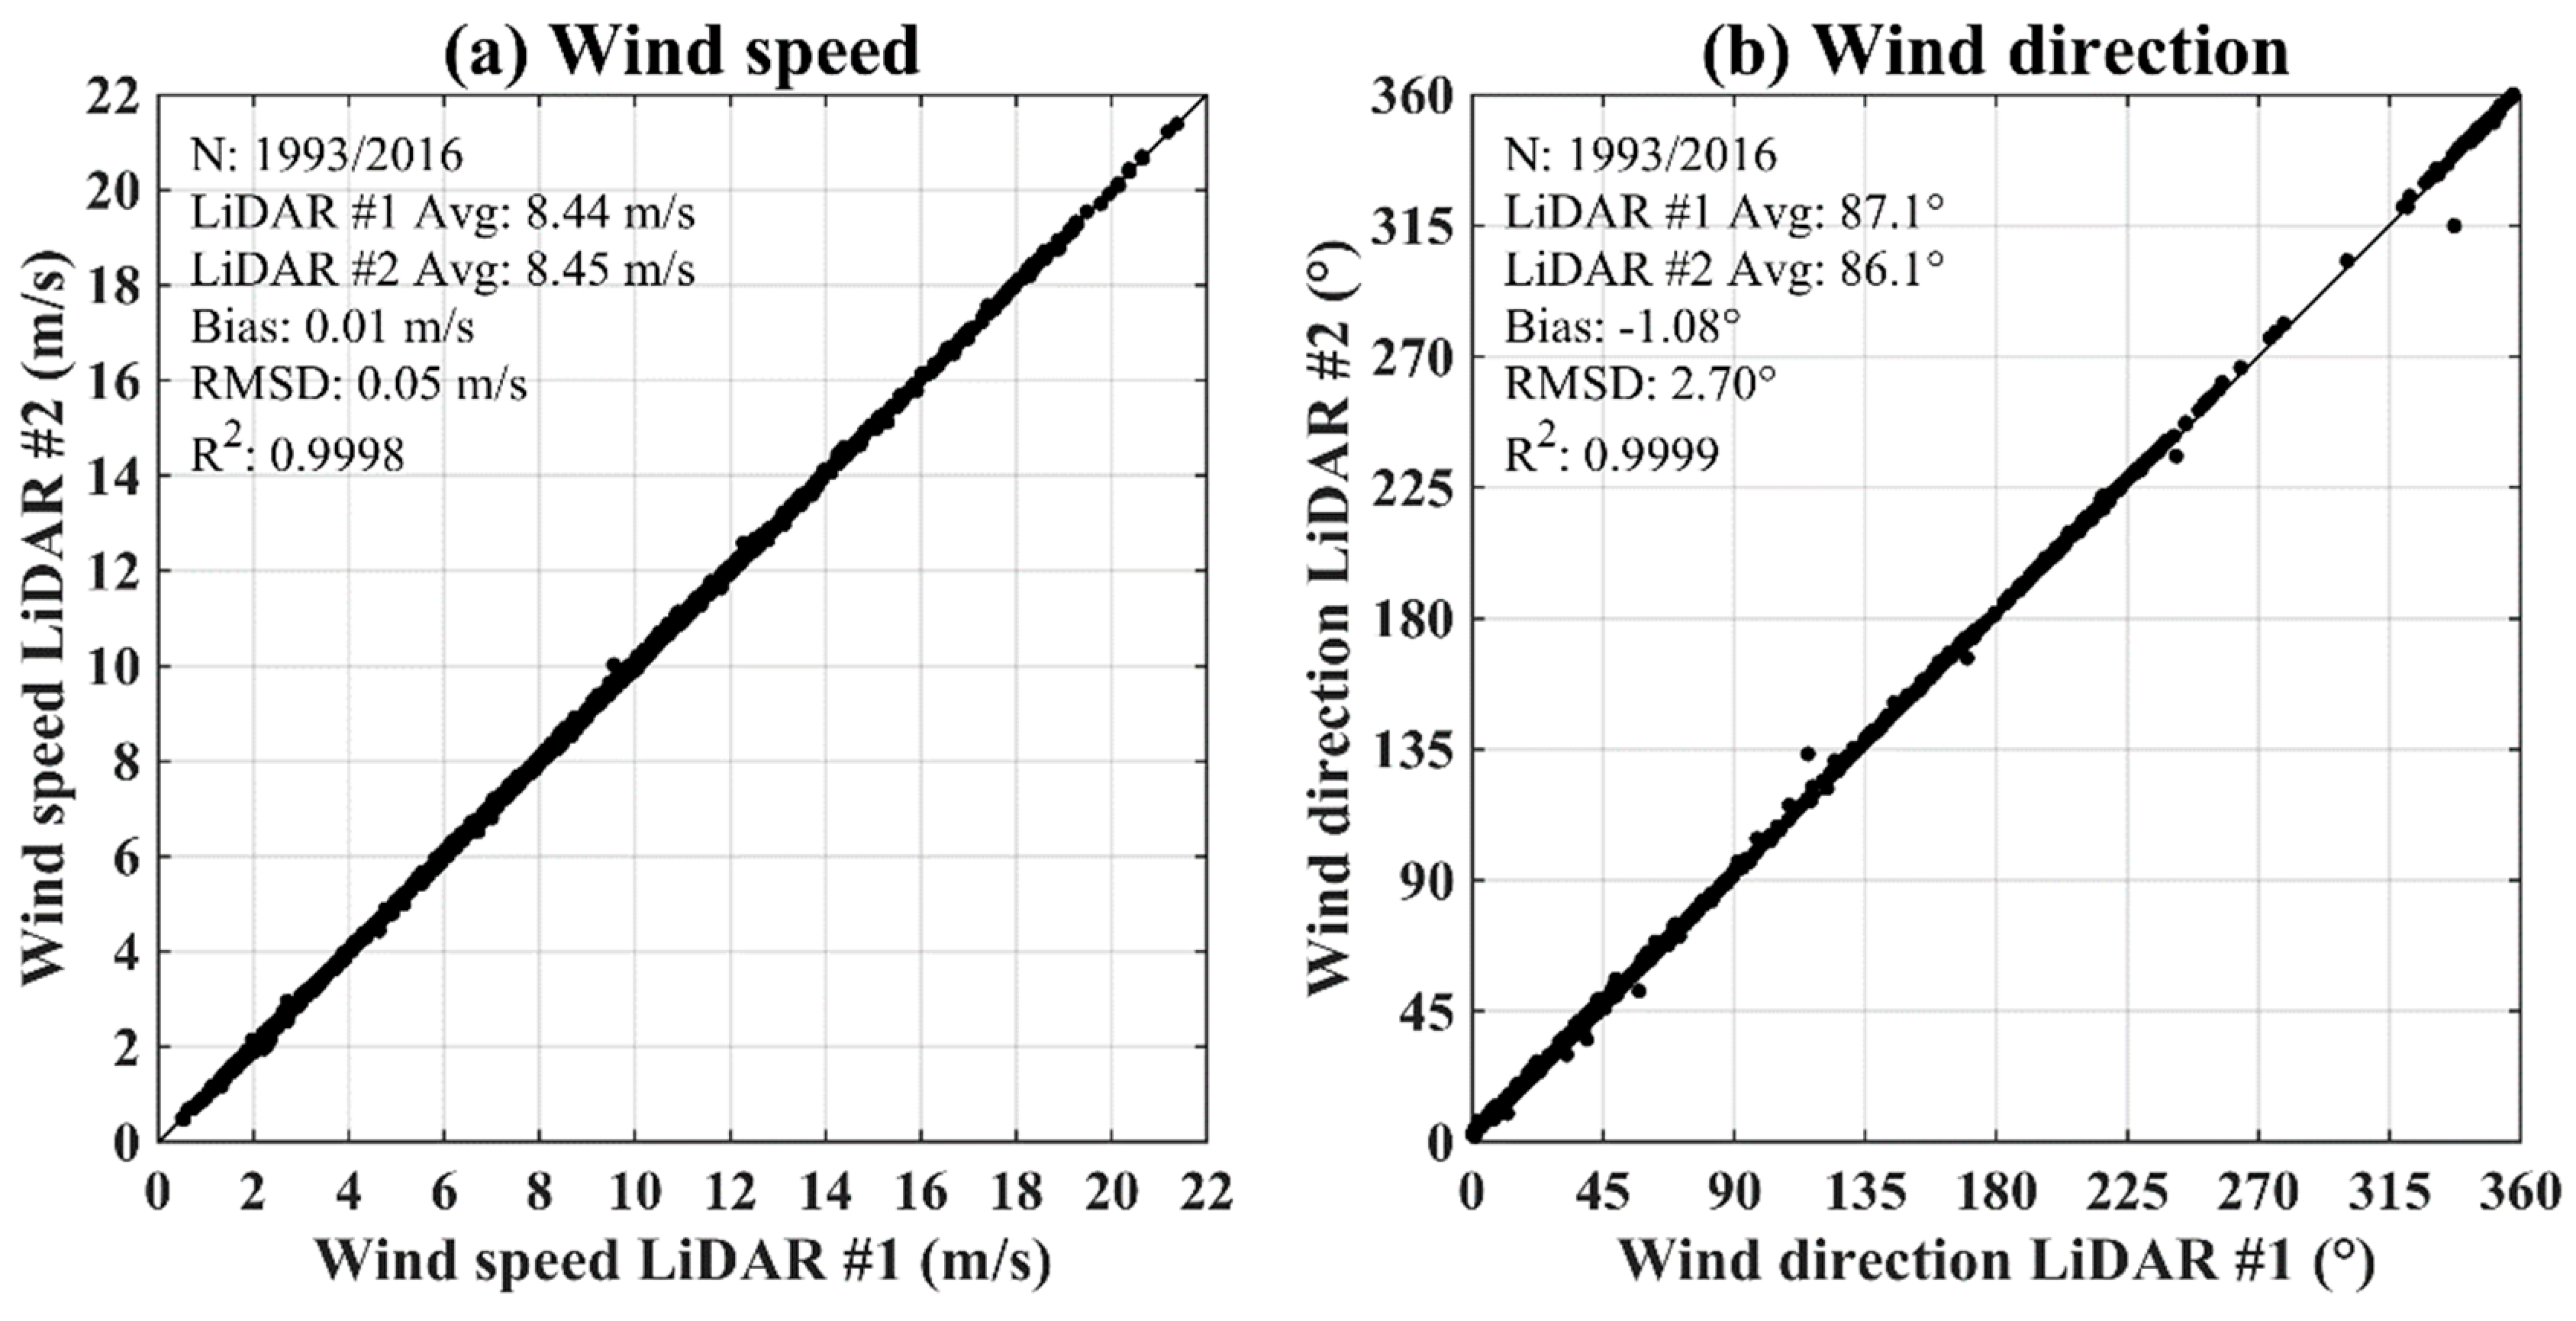
Measurements using the two vertical LiDAR devices began in March 2016. Prior to the actual measurement campaign, LiDAR #2 was located at the seaside end of the pier for two weeks to investigate the instrumental differences between the two LiDAR systems. Comparisons of 10 min mean wind speeds and wind directions at a height of 100 m above the pier for the period of 7–21 March 2016 are shown in Figure 4. The LiDAR devices used in the measurements output both instantaneous values at intervals of a few seconds and 10 min statistics. In this study, 10 min statistics of average and standard deviation were used. Since the LiDAR data acquisition ratio, which is generally associated with data reliability, depended on the atmospheric conditions, the authors used only observations where the ratio exceeded 30% for 10 min.
In Figure 4, the number of samples, average, bias, root mean square difference (RMSD) and coefficient of determination R2 are also described. Although the data acquisition ratio slightly decreased as the height increased, it was found that the differences between the two instruments were negligibly small. The wind speeds and wind directions had biases of 0.01 m/s and 1.08°, respectively. In addition, they had determination coefficients of more than 0.999. Namely, the authors could confirm that the observed wind speeds contained no unreasonable offsets that might lead to a misinterpretation of the measured data. After this comparison, the measurement campaign started on 23 March 2016, and it concluded on 30 September 2016.
3. Results and Discussion
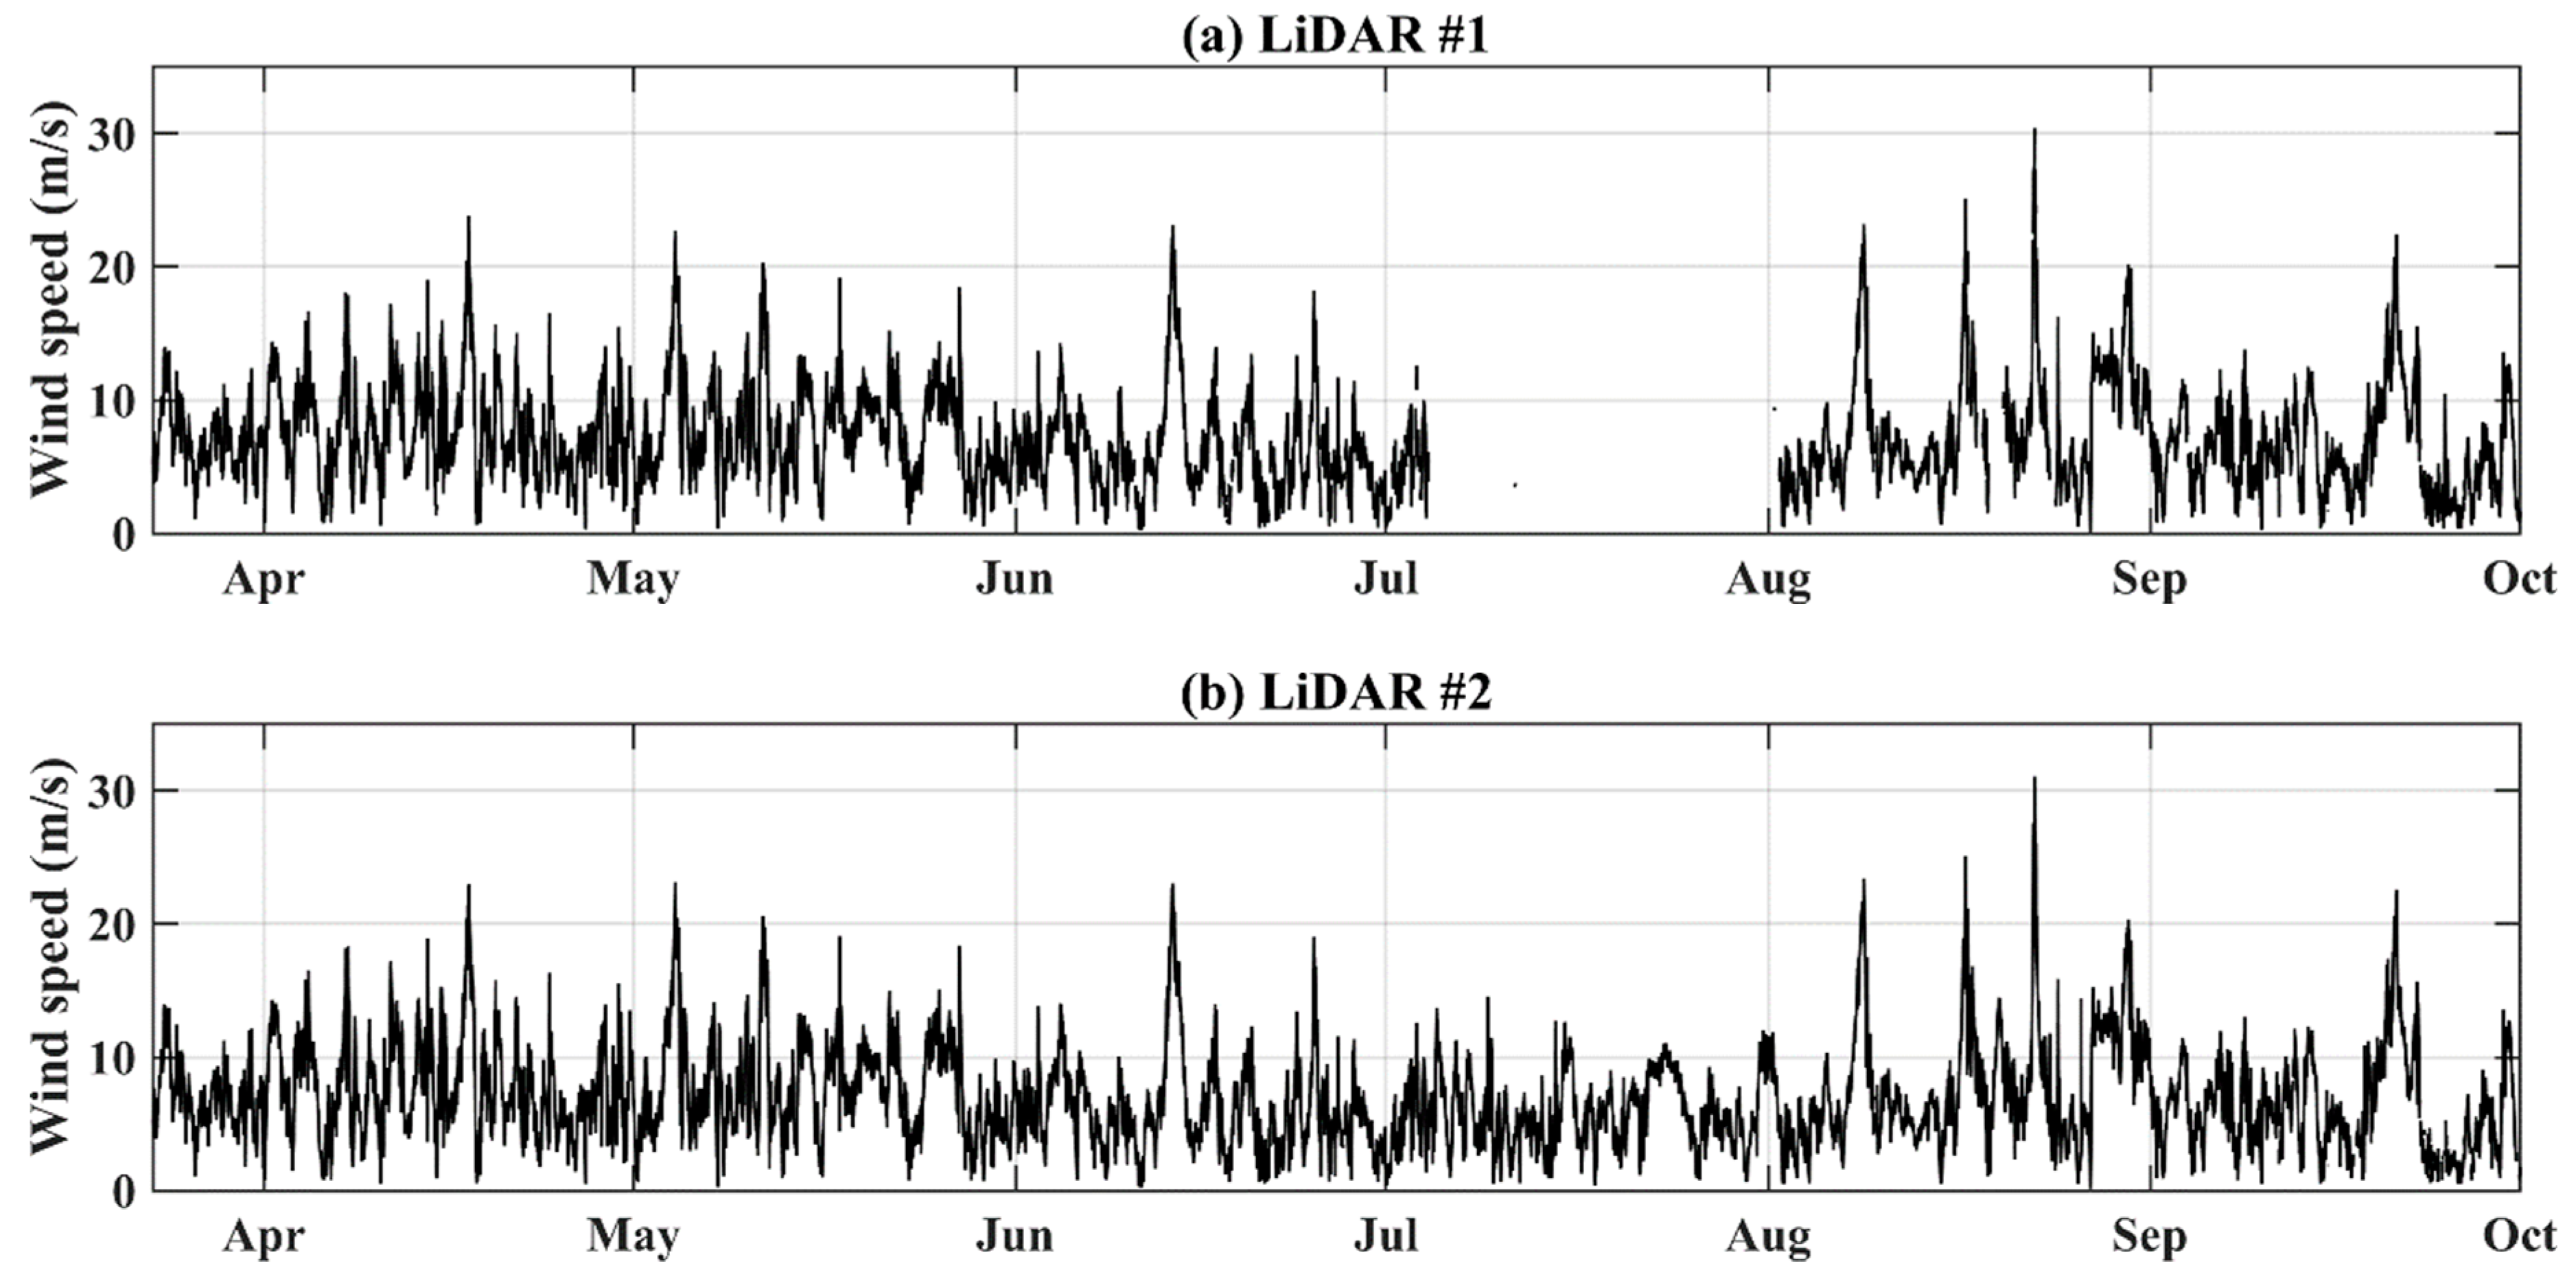
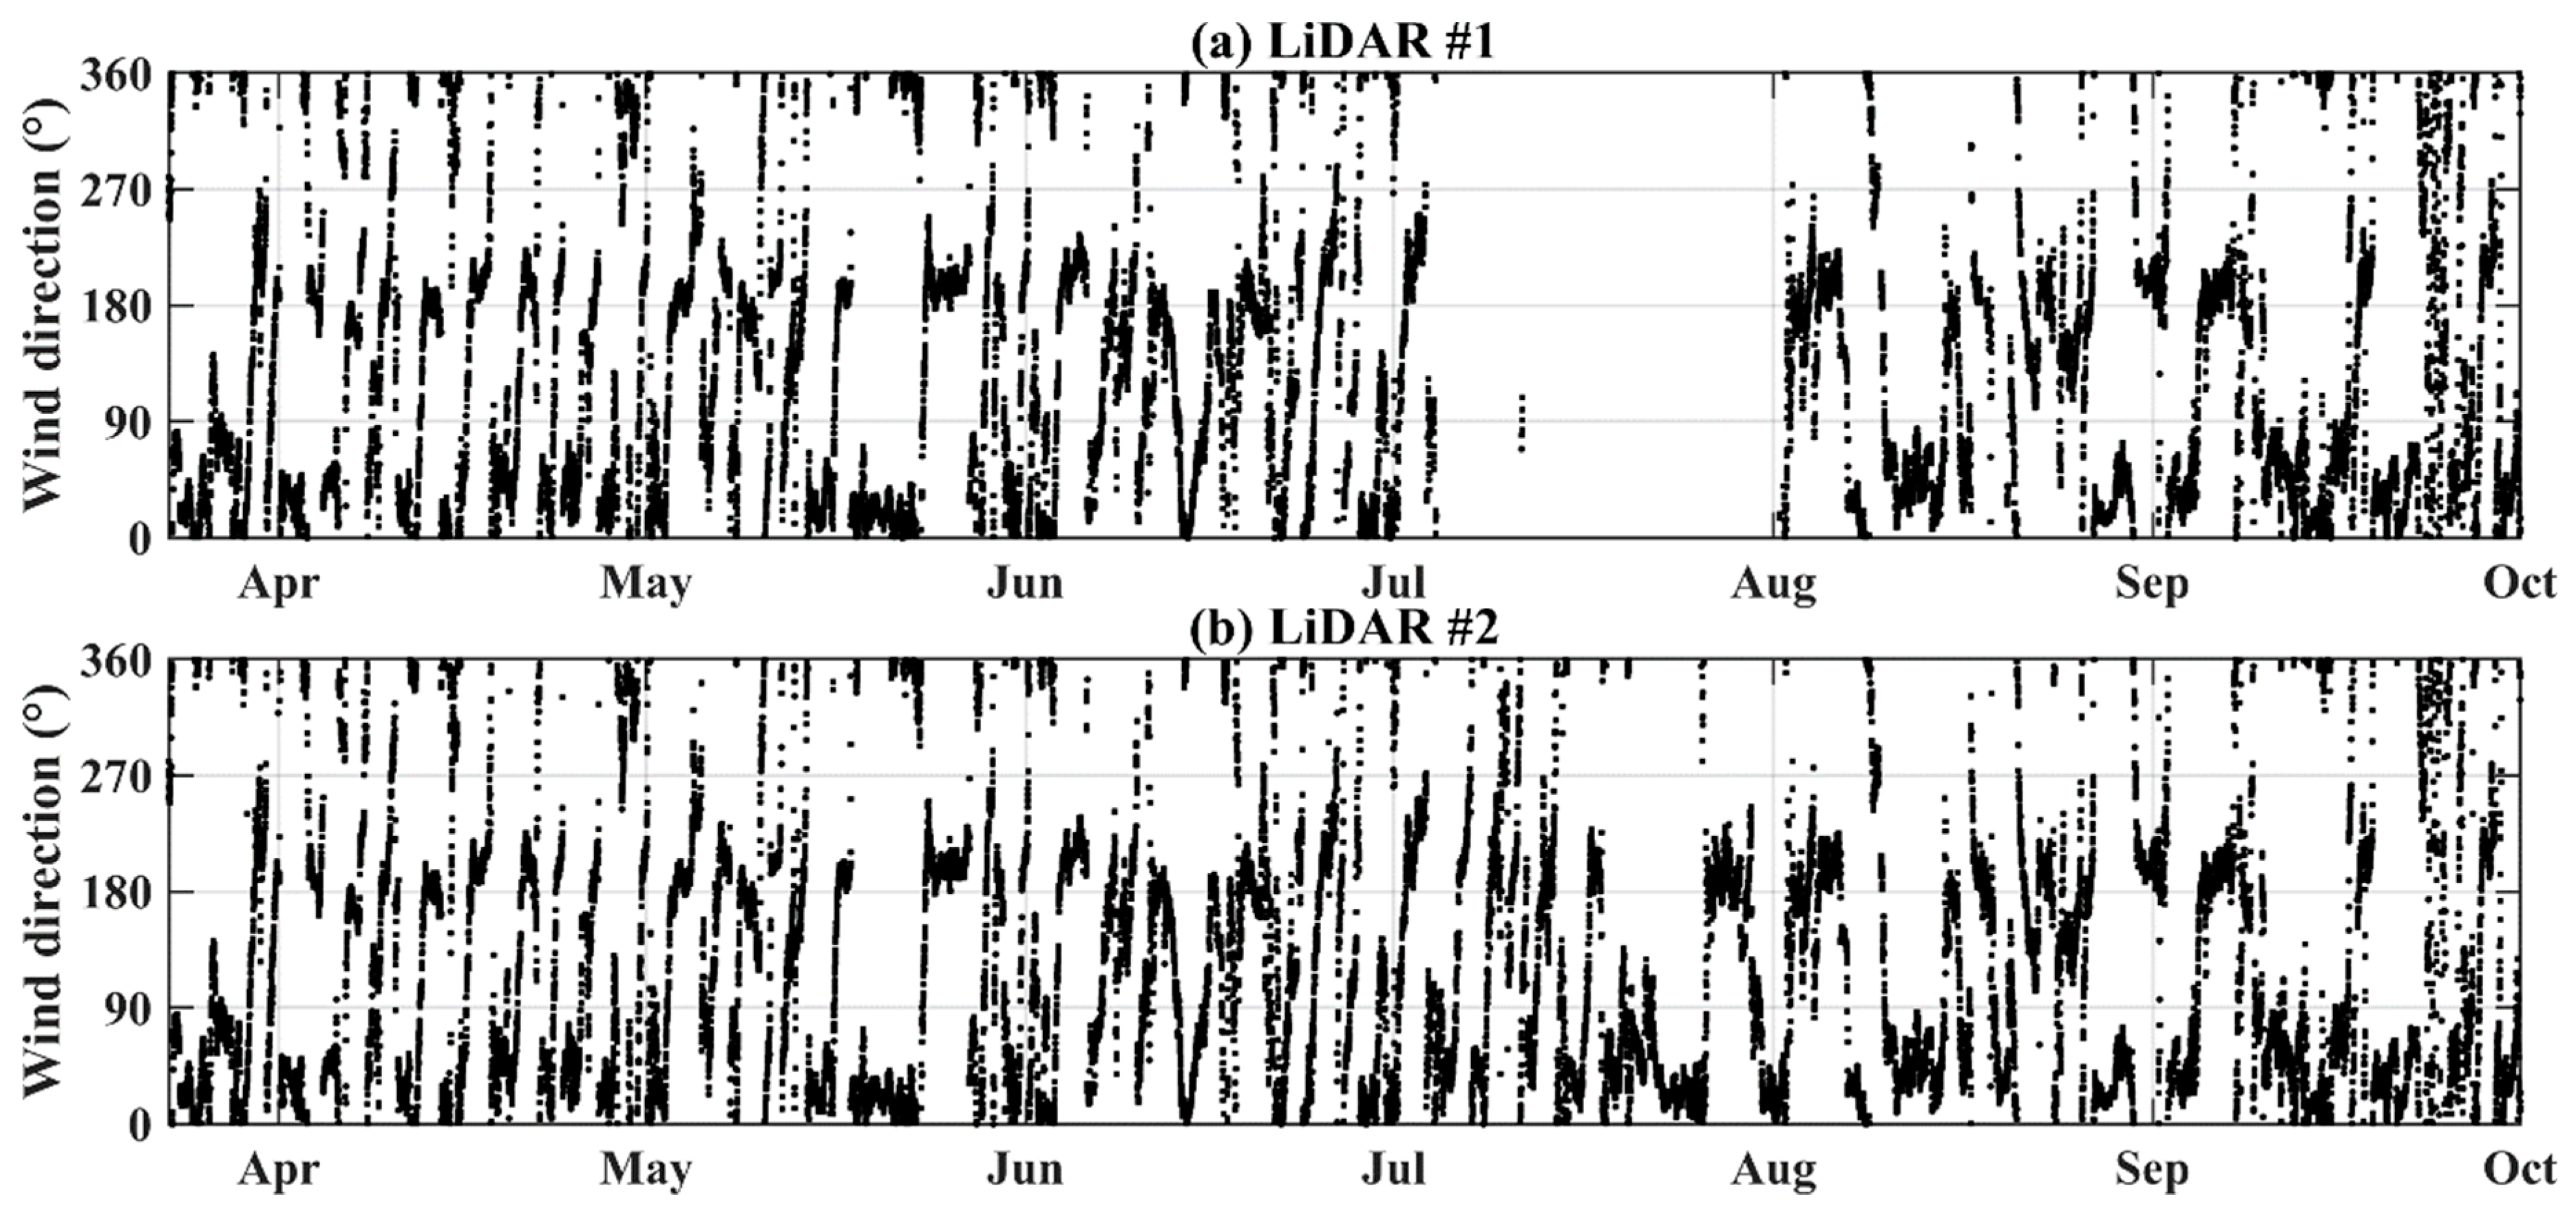
Figure 5 shows the timeseries of 10 min wind speed observations for LiDAR #1 and LiDAR #2 at 100 m above the LiDAR installation level during the whole measurement campaign. As seen in the figure, LiDAR #1 observations for July 2016 are missing, which is attributable to a problem with an electricity supply failure associated with the high air temperature. Overall, LiDAR #1 data availability during the whole measurement period was 81.6% for 100 m and 70.0% for 200 m. The timeseries of wind directions is also shown in Figure 6. When the observed winds were categorized by the sectors based on the LiDAR #1 wind direction at a height of 100 m, wind results of 59.3%, 25.4%, and 9.0% were recorded for offshore (sea to land), turbine wake, and onshore (land to sea) winds, respectively.
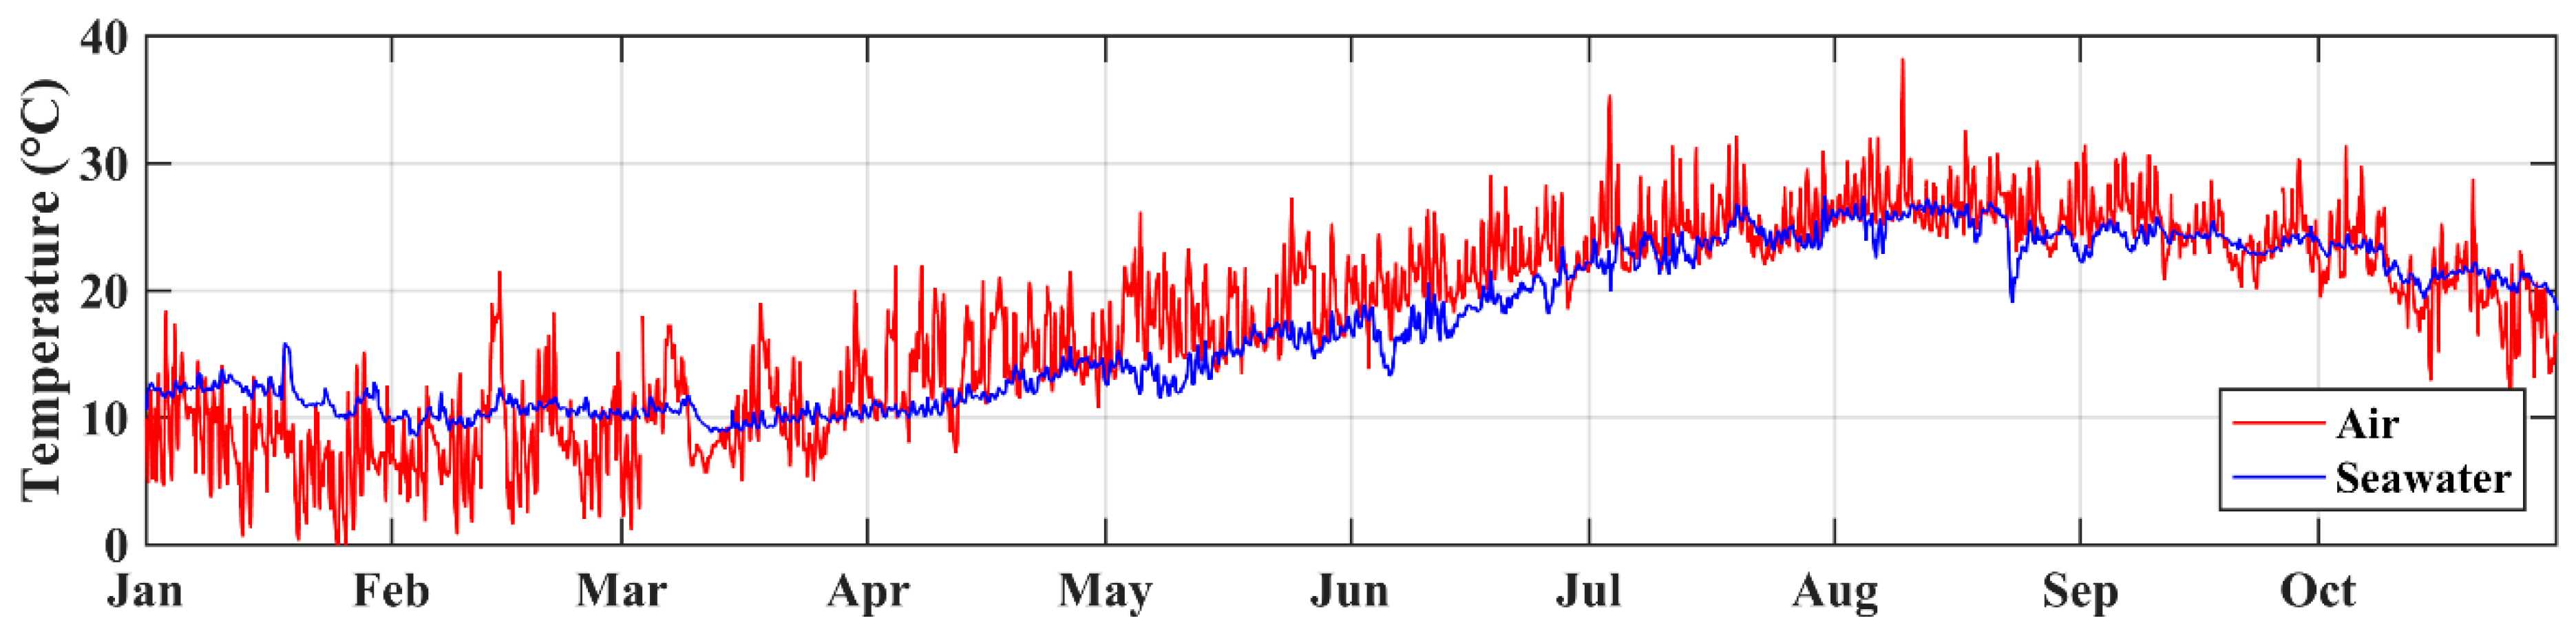
The differences between the air and seawater temperature shown in Figure 7 indicate that neutral to stable atmospheric stability conditions prevailed during the measurement period of spring to early autumn. The wintertime seawater temperature is usually higher than air temperature in this region, and vice versa for spring to summer. The fetch effect depends strongly on the atmospheric stability [16], but because the period of the measurement campaign did not cover the winter months with their expected dominance of unstable conditions, an analysis of the dependence of the fetch effect on stability was not part of this study.
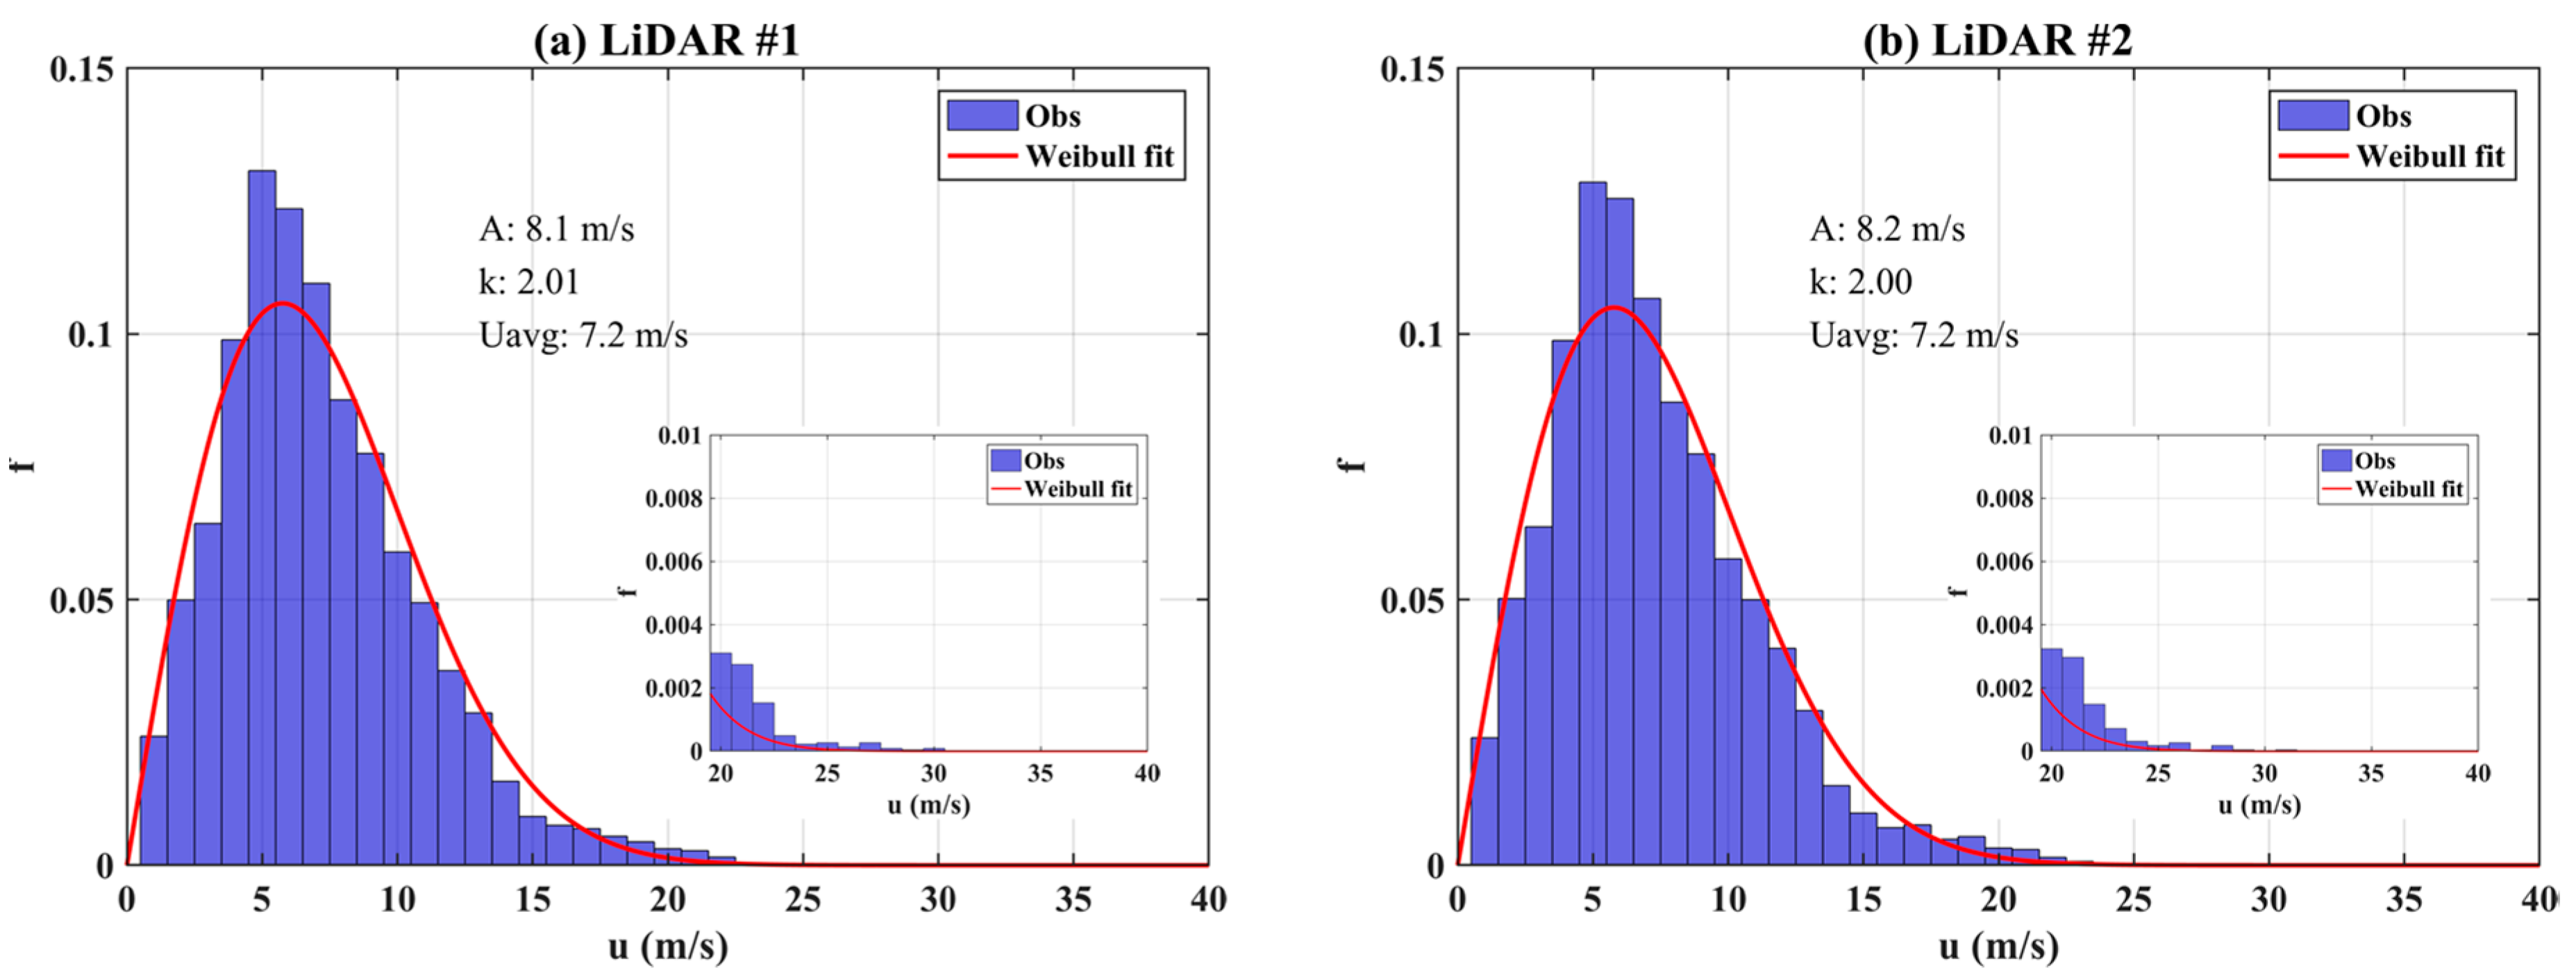
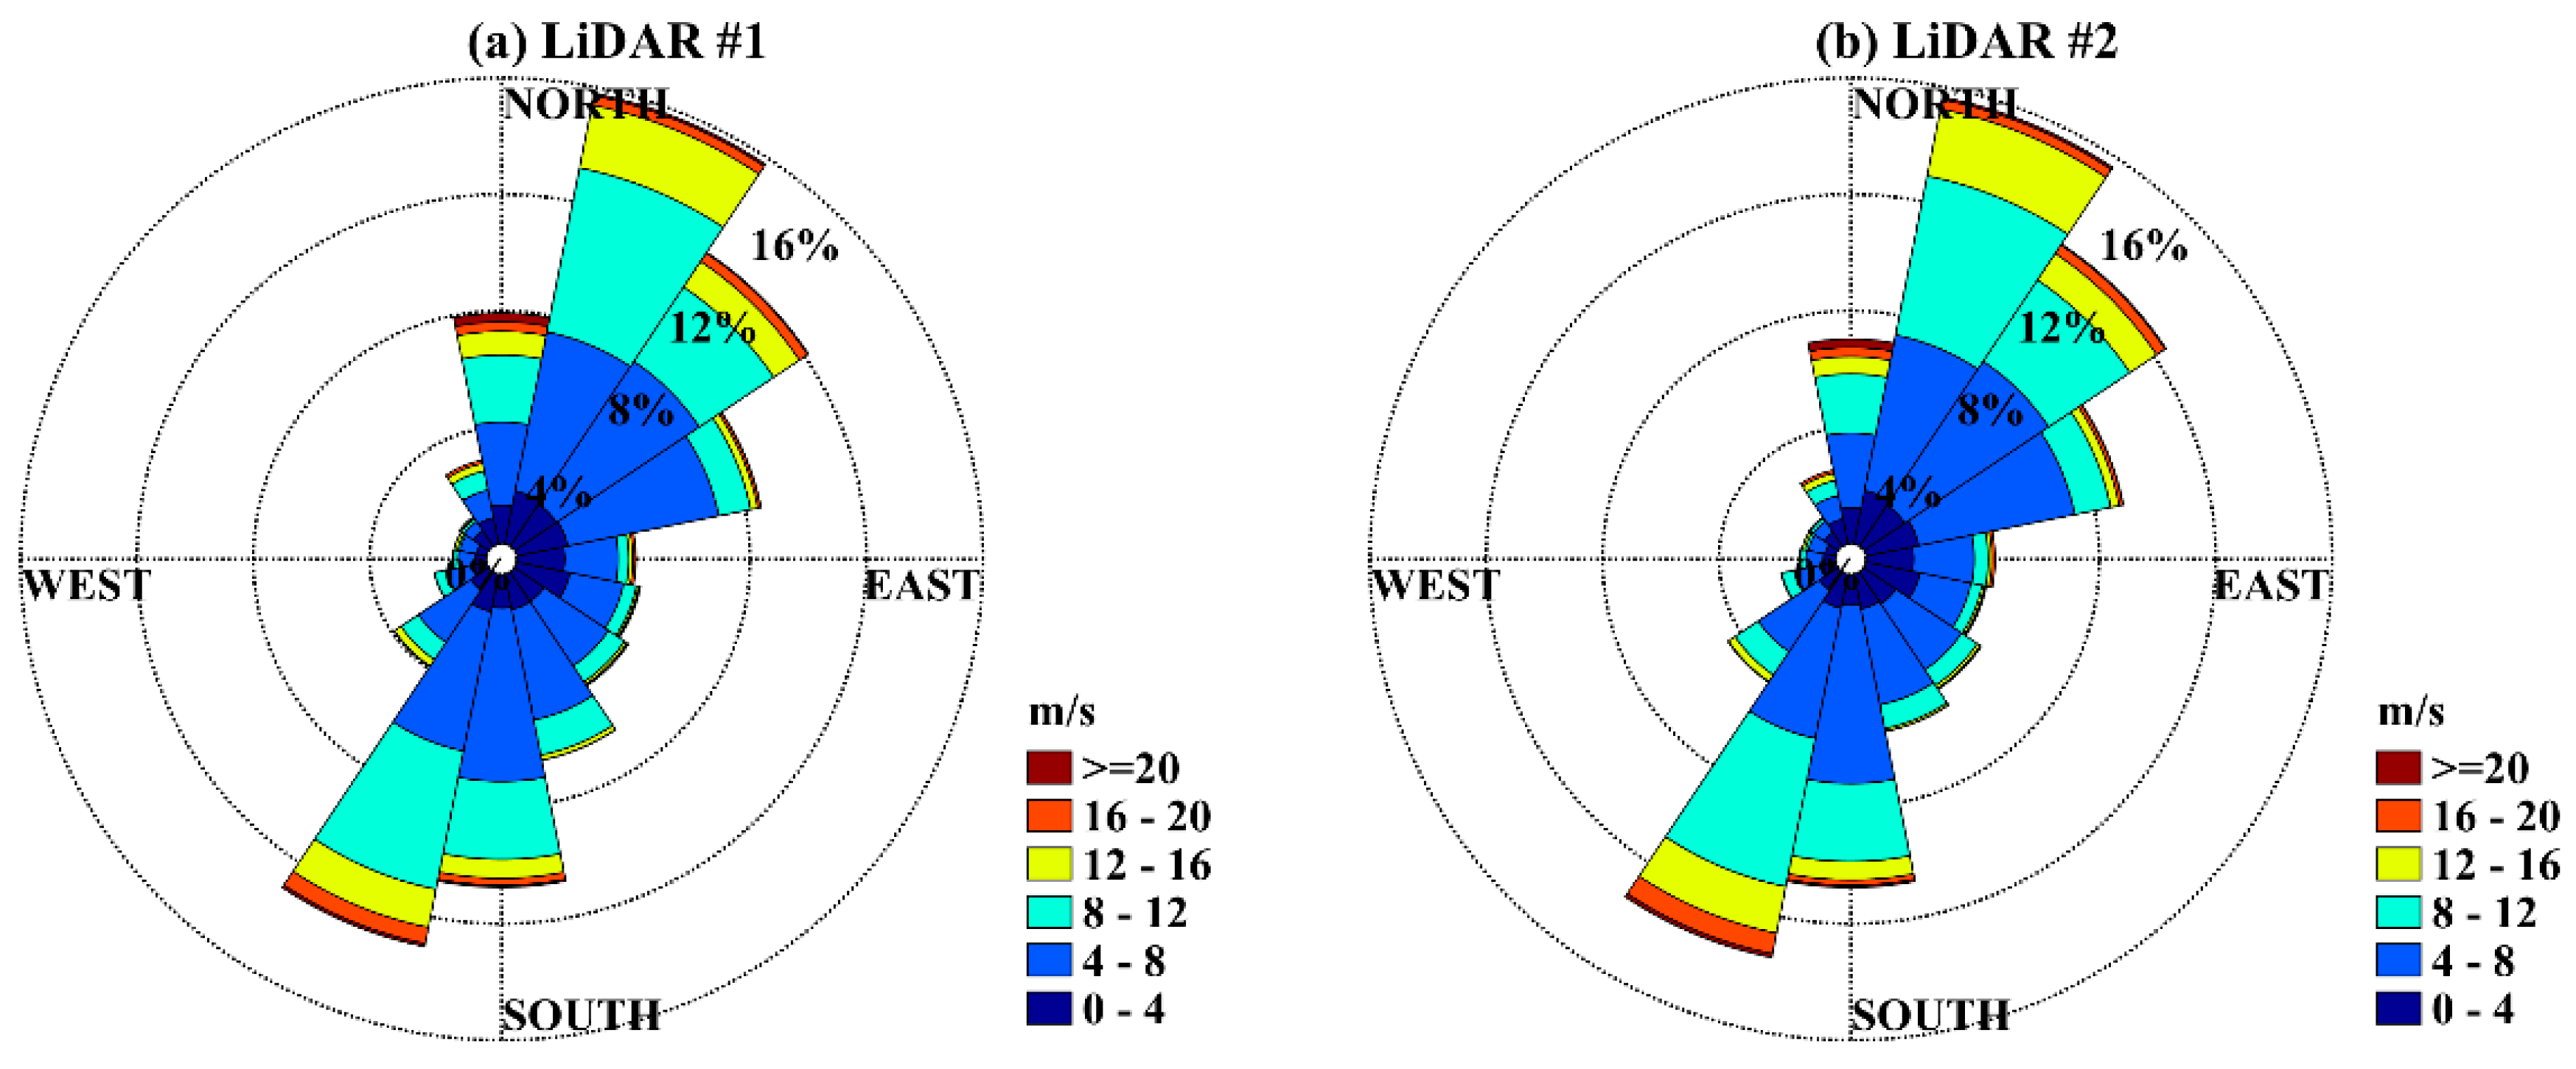
The two LiDAR observation datasets, when visualized, show no obvious significant differences, especially when basic wind climate statistics, such as the average or occurrence frequency, are compared. Figure 8 and Figure 9 show the occurrence frequencies and wind roses at 100 m above the LiDAR installation level for the period of March to September 2016. The Weibull scale parameter A and shape parameter k are described in Figure 8. In addition, the occurrence frequency at wind speeds greater than 20 m/s is also depicted in the insets in Figure 8. The maximum 10 min wind speeds for LiDAR #1 and LiDAR #2 were 30.4 m/s and 31.1 m/s, respectively, and the occurrence of wind speeds greater than 20 m/s due to extreme events such as typhoons was less than 1% during the measurement period.
Overall, the differences in the occurrence distributions for wind speed and wind direction between the two LiDAR devices, which were only 400 m apart, were small. However, interesting characteristics could be found in the instantaneous values of the wind speed ratios, especially for some wind directions. Accordingly, the authors will now focus on the wind speed ratio between the LiDAR observations. It is to be noted that, since there was a 3.5 m height difference between the LiDAR installation levels due to the building height, 10 min averages were vertically interpolated onto the same levels before the analysis was carried out using a logarithmic function to calculate the wind speed ratio at the same levels.
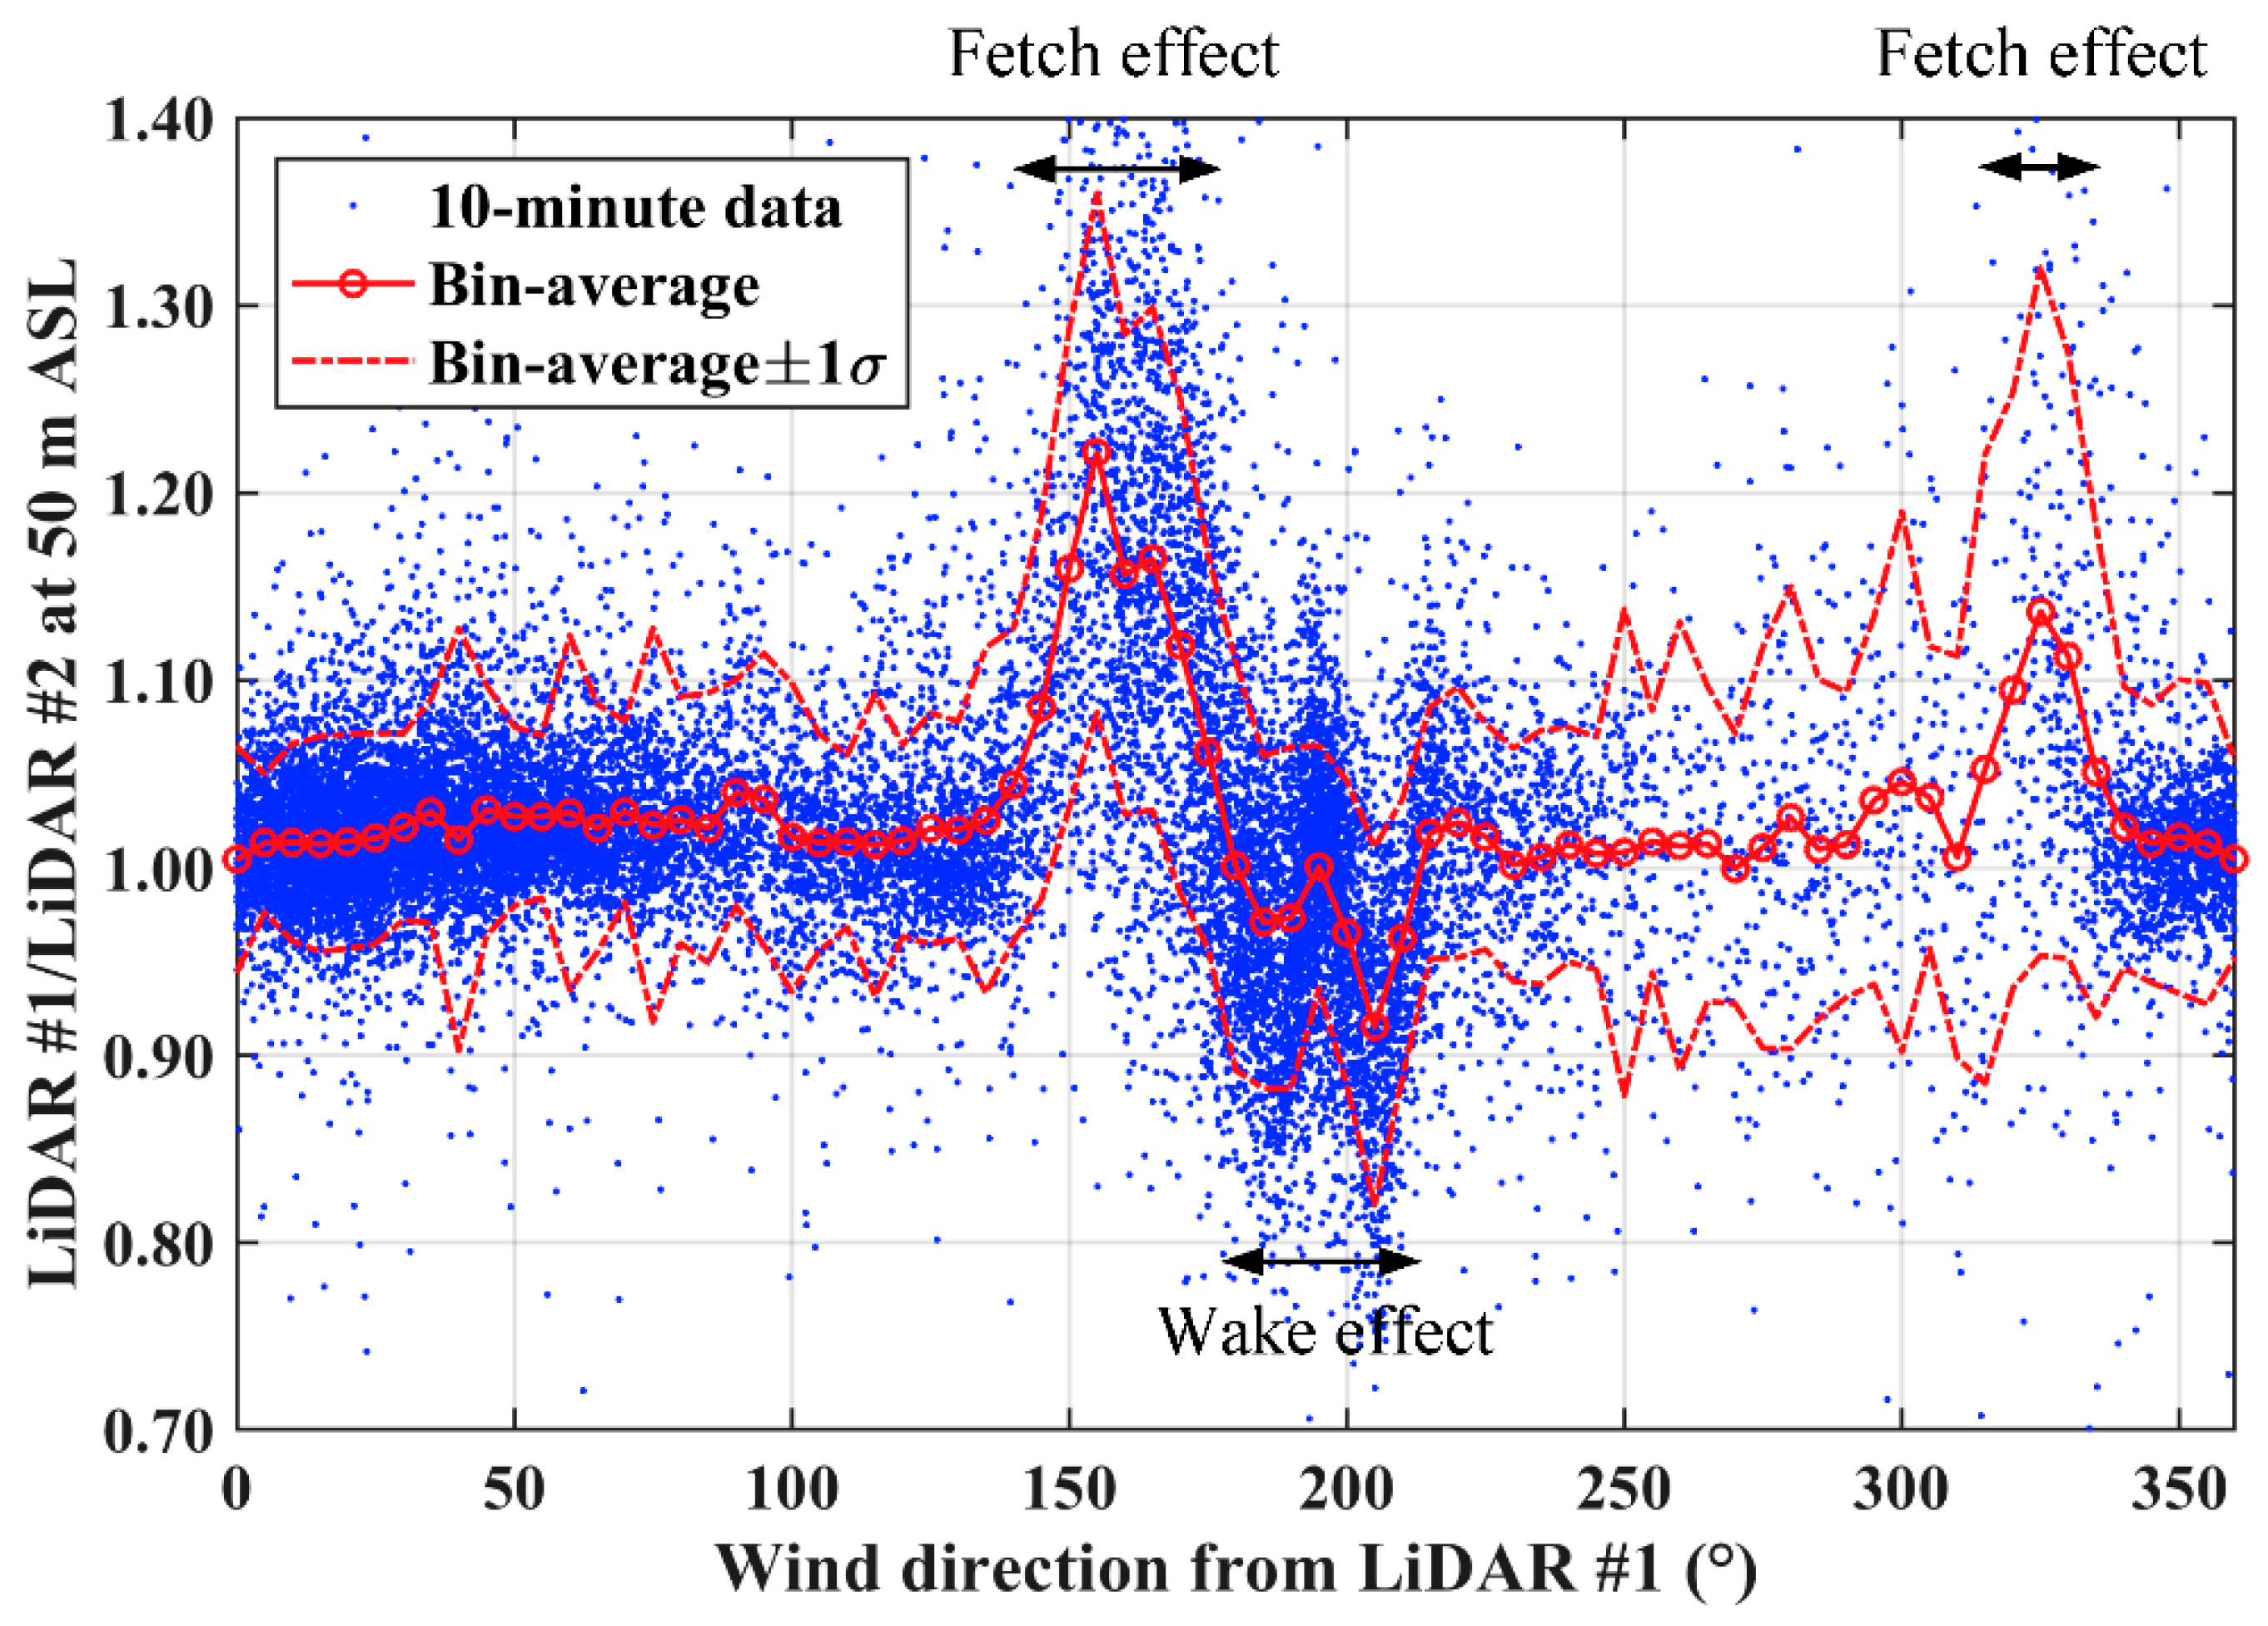
The wind speed ratio for LiDAR #1 to LiDAR #2 at 50 m ASL, as a function of wind direction, is shown in Figure 10. The bin-average and standard deviation were calculated at 5° intervals and then plotted in red for the 10 min values. The 10 min data for calm wind conditions, which corresponded to wind speed less than 2 m/s, were excluded from this analysis. In the figure, two peaks with bin-average ratios of approximately 1.15 to 1.2 can be seen around wind directions of 155° and 325°, which nearly coincide with the coastline. For these directions, winds measured by LiDAR #1 on the pier top had long marine fetch lengths, whereas those measured by LiDAR #2 were entirely onshore winds. This result suggested that the fetch length effect could increase the offshore wind speeds by up to 15–20% when they travelled over water at 50 m ASL. In contrast, the small ratios seen at around 200° might be attributable to the wake from the nearby 1.5 MW wind turbines.
Considering the shape of the straight coastline, the fetch length effect should be approximately symmetrical in the figure. However, the wind speed ratios around 155° were slightly higher than those around 325°. This asymmetry might be attributable to the contamination of the wake effect at LiDAR #2 from the nearby wind turbine. The LiDAR #2 observations between 140° and 175° might be impacted by the wind turbine at a direction of 170°, since LiDAR #2 was located only 370 m away from the wind turbine. As a result, the fetch effect around 155° may be enhanced by the wake effect for LiDAR #2.
The strength of the wake and fetch effects was found to depend significantly on height when the same relationships were illustrated with the LiDAR observations at different heights. Figure 11 shows the same relationships as Figure 10, but the relationships for all heights are depicted because, in this figure, the authors considered the height dependency of the wake and fetch effects. Figure 11 shows that the variations of the wind speed ratios dependent on wind directions found at 50 m ASL became ambiguous as the height increased. The wake effect around a direction of 200° disappeared for heights above 130 m. Moreover, the increase in wind speeds around wind directions of 155° and 325°, which might be associated with the fetch length effects, ultimately declined to a few points at 207 m height ASL.
Figure 10 and Figure 11 already suggest the maximum range of an increase of the wind speed due to the fetch effect within the surface layer near the coast, but the results are insufficient for understanding the relationship in detail. Thus, the authors converted the relationships between wind direction and wind speed ratio into fetch length and wind speed by taking into account the characteristics of the research platform. As mentioned above, since the region where the HORS research platform is located on a rectilinear coastline, the fetch length at the top of the pier can be defined simply as a function of wind direction θ as follows:
where Lpier and θpier are the pier length of 400 m from the shore and the heading angle of 59°, respectively. Although the pier is only 400 m long, the fetch length effect for a few kilometers can be analyzed when the characteristics of the site’s rectilinear coastline are considered.
Fetch(θ) = Lpier/cos(θ − θpier − 180°),
The wind speed ratio for LiDAR #1 to LiDAR #2 at 50 m ASL as a function of fetch length is shown in Figure 12. The bin width is 100 m. As can be seen in the figure, the wind speed ratio drops twice at fetch lengths of 500 m and 700 m due to the wind turbine wake effects, and then increases monotonically for fetch lengths of 700 to 1100 m. Moreover, it continues to increase slightly to 1.2 at a fetch length of 1900 m, after which the gradient of the variation appears to be moderate.
From this figure, one can see some interesting features with respect to the fetch length effect. It is difficult to discuss the fetch length effect at 600 m and 800 m, since the wind speeds from LiDAR #1, which was located at the seaside end of the pier, are disturbed by the nearby wind turbines. However, at 400 m, there is no wake effect for both LiDAR #1 and LiDAR #2, since it corresponds to the direction along the pier. Therefore, this might imply that the fetch effect needs some distance to appear, and the distance would be more than 400 m from the shore at a height of 50 m. Moreover, the wind speed at 50 m increased by up to 1.2 times while traveling over 2 km of water, and the fetch length effect appears to become less pronounced at distances exceeding 2 km. These results could provide a limit for the optimal distance for nearshore wind farms.
The relationships for the ratio of turbulence intensity, which is the standard deviation of wind speed for 10 min normalized by the mean value, are shown in Figure 13. Note that because it is difficult to adjust the height difference in the standard deviation, there is a 3 m height difference between the LiDAR #1 and LiDAR #2 values. Generally speaking, offshore winds have less turbulence than onshore winds. As shown in the figure, the turbulence intensity decreases rapidly as the fetch length reaches about 2 km. Additionally, much like the wind speed ratio shown in Figure 12, the ratios of turbulence intensity at fetch lengths of more than 2 km also become almost constant. These results indicated that the transition from onshore to offshore winds might occur within a few kilometers of the coast for flat terrain without forests and settlements.
Although there have been large variations in the fetch length effect in previous studies, a similar result to Figure 12 can be found in Barthelmie et al. (1996) [13]. They showed that onshore wind speeds at 38 m could increase by up to approximately 20% at a distance of 1630 m by comparing onshore and offshore met mast observations from the Vindeby project [22]. Moreover, they also analyzed the wind speed increase ratio using the Wind Atlas Analysis and Application Program (WAsP) model [23], which is a frequently used application for analyzing wind climates over flat terrain. Specifically, wind speeds observed by a land meteorological mast were input into the WAsP model and wind speed increases, as a function of the distance from the coast, were extracted. As a result, a strong gradient creating a wind speed increase of up to 15% could be found within a fetch length of 3 km, after which the gradient flattened.
In addition, a similar result is found in another numerical study using a simple calculation model based on the internal boundary layer theory by Barthelmie and Palutikof [15]. In their theoretical analysis, the wind speed increase ratio shows its steepest gradient until reaching a 2 km fetch length, after which the ratio stops increasing. The results from the numerical studies are similar to the results obtained from the measurement campaign that are shown in Figure 12. From the results described above, the authors concluded that the results obtained in this study were in line with previous results that were calculated from simple numerical models.
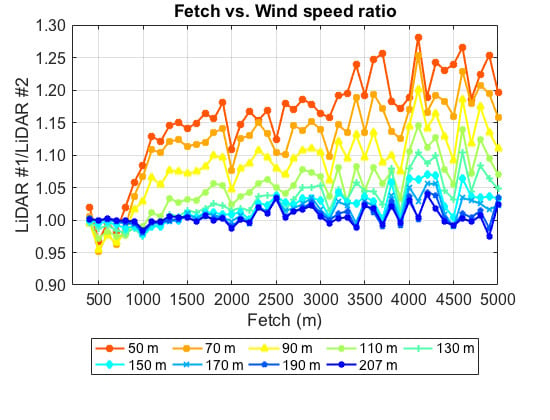
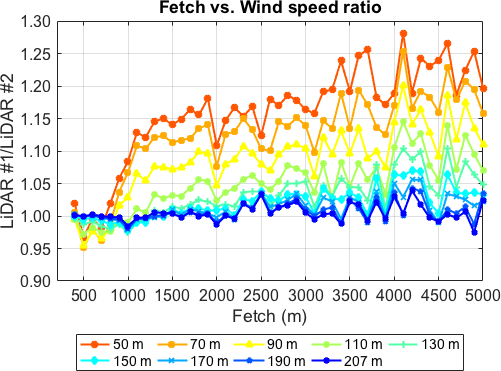
As expected from Figure 11, the increase of the wind speed ratio relevant to the fetch effect becomes unclear as the height increases. The relationships between the fetch length and bin-averaged wind speed ratio at 50 to 207 m ASL are shown in Figure 14. Due to the reduced data availability for levels higher than 50 m, the plots for heights from 70 to 207 m are slightly less stable than those for the lower levels. However, it can unmistakably be seen that the turbine wake and fetch length effects decrease gradually as the height increases, and that almost no clear fetch length-dependent differences can be found above 130 m ASL. Ultimately, the wind speed ratio at a height of 207 m seems to be independent of both the fetch length and turbine wake.
To compare this study’s results with those from other sites and numerical models, the relationships of the increase in wind speed and fetch length would be preferable as formulations. Empirical equations derived from the results in Figure 14 are illustrated in Figure 15. The equations are derived by fitting the power law as follows:
where Usea/Uland is the ratio of wind speed on the land and sea as a function of the fetch length x in meters. The values of coefficients a and b, which are parameters dependent on the height z, are listed in the figure legend. Since the wind speed ratio at a fetch length less than 1000 m seemed to be strongly influenced by wind turbines at this site, the coefficients were derived using only the data obtained with fetch lengths of more than 1000 m. These coefficients might be useful for investigating the fetch length effect at the other sites, as well as for comparing results with numerical models.
Usea/Uland(x, z) = a(z) × xb(z),
Because the authors’ analysis of the LiDAR observations revealed that the 50 m wind speed increased up to 15–20% around a fetch length of about 2 km, the last question then becomes, “How attractive or effective is this 20% speedup from a wind resource usage perspective?” Normally, wind speeds can clearly increase independently of fetch length effects as altitude increases due to increased distance from surface roughness. Thus, the authors finally compared the increasing wind speeds resulting from height increases to quantify the advantage of the fetch length effect.
Figure 16 shows mean wind speed profiles and the profiles normalized at the lowest level values for the onshore winds (215° to 325°). Only observations that were taken when all heights were available were used for this analysis. The shear exponents for the LiDAR #1 and LiDAR #2 profiles were 0.267 and 0.277, which corresponded to the values between shrub and forest [24], respectively. The normalized profile for LiDAR #2 shows that the 50 m wind speed increased up to 20% at a 90 m height. This indicates that the fetch length effect over a 2 km distance can be considered equivalent to increasing the height from 50 to 90 m over land. Furthermore, if the height is increased to up to 130 m, the value at 130 m increases to 40%. This is of particular importance because, as the development of taller wind turbines nears completion and they become available, positioning such turbines onshore in coastal areas could provide an acceptable alternative to nearshore wind farm developments in locations where sufficient space is available.
4. Conclusions and Recommendations
In this paper, the authors reported results from an onshore and offshore wind measurement campaign for the period of March to September 2016 using two vertical profiling LiDAR devices at the coastal research platform HORS to investigate increases in wind speed with increasing fetch length from the coast. They began by describing the experimental setup and wind conditions at HORS during the six-month measurement period used in this study, after which the increases in wind speed were examined from comparisons of observations recorded from the two vertical LiDAR devices.
From the wind speed ratios between the two LiDARs, they found that the 50 m wind speed increased by a factor of about 1.15 to 1.2 times when travelling over a long marine fetch length. In addition, observations taken at the top of the pier were found to be significantly influenced by onshore wind turbines located more than several hundred meters away, which is more than 10 times the wind turbine rotor diameter. In addition, the increase in wind speed as a function of fetch length for 400 m to 5 km was demonstrated by applying the characteristics of rectilinear coastline in this region. Furthermore, empirical equations based on the power law to describe the fetch effect dependence, which are useful for comparisons with other sites or numerical models, were introduced.
According to the results obtained, the authors found that the 50 m wind speed on the coast increased monotonically over a 2 km fetch length and approached a ratio of 1.2 at a 1900 m fetch length. The ratio was found to increase slightly after a fetch length of 1900 m. Moreover, the same relationships for the turbulence intensity also showed that it decreased rapidly in the offshore direction, especially up to a 2 km fetch length. These results suggested that the transition from onshore winds to offshore winds that have a higher wind speed and lower turbulence than onshore winds occurred within a few kilometers of the shore. These results also suggested that locating wind turbines a few kilometers away from the coast would be reasonable from a meteorological perspective for efficient near-shore wind energy usage when the coast was not surrounded by complex terrain and vegetation.
The wind speed ratios obtained from the two LiDAR observations had a steep gradient within 2 km of the coast and then gradually flattened further offshore. This strong gradient within a few kilometers was found in previous studies using simple numerical models. These analyses were based on internal boundary layer theory, and a wind analysis application program was run for areas surrounded by flat terrain, similar to the HORS research platform. Although the effect of atmospheric stability was not taken into account in this study due to the measurement period, the relationship between wind speed and fetch length seemed to be applicable for areas with similar geographical conditions, such as flat terrain and little vegetation.
In addition, the dependency of the fetch effect on the height was clearly visualized by means of the LiDAR observations. As a result, the fetch length effect was shown to gradually become less pronounced as the height increased, and it was also found that the fetch length and wake effects from nearby wind turbines were negligible at heights above 130 m. Finally, the impact of the fetch length effect was compared with the impact of increasing height on the wind speed. The result suggested that using taller wind turbines with hub heights more than 100 m on land would be an alternative option to locating turbines offshore when sufficient space was available. The authors finally emphasize that it would be inconceivable to obtain such informative observations without using remote sensing technologies for this study.
In this measurement campaign, the authors obtained informative and valuable offshore wind observations that they believe will provide good benchmark data for the validation of numerical models. In their continuing research, they intend to install a scanning LiDAR system to collect more detailed measurements, strengthen the reproducibility of numerical models, and thus facilitate a more comprehensive understanding of coastal winds.
Author Contributions
Conceptualization, S.S.; data curation, S.S., Y.T., T.K., T.O., and S.N.; funding acquisition, S.S., T.K., and T.O.; methodology, S.S.; project administration, S.S.; resources, S.N.; validation, T.O.; writing—original draft, S.S.
Funding
This work was supported by the Japan Society for the Promotion of Science (JSPS) KAKENHI Grant Number 15K21665. This research was also partially supported by the NeoWins project commissioned by the New Energy and Industrial Technology Development Organization (NEDO).
Conflicts of Interest
The authors declare no conflict of interest.
References
- NEDO. NEDO Offshore Wind Information System (NeoWins). Available online: http://www.nedo.go.jp/english/news/AA5en_100201.html (accessed on 20 July 2018).
- PARI. Hazaki Oceanographical Research Station (HORS). Available online: https://www.pari.go.jp/unit/edosy/en/main-facility/2.html (accessed on 26 June 2018).
- Skamarock, W.; Klemp, J.; Dudhia, J.; Gill, D.; Barker, D.; Duda, M.; Huang, X.; Wang, W.; Powers, J. A Description of the Advanced Research WRF Version 3; NCAR Technical Note NCAR/TN-475+ STR; National Center for Atmospheric Research: Boulder, CO, USA, 2008; 113p. [Google Scholar]
- Sempreviva, A.M.; Barthelmie, R.J.; Pryor, S.C. Review of Methodologies for Offshore Wind Resource Assessment in European Seas. Surv. Geophys. 2008, 29, 471–497. [Google Scholar] [CrossRef]
- Shimada, S.; Ohsawa, T.; Chikaoka, S.; Kozai, K. Accuracy of the Wind Speed Profile in the Lower PBL as Simulated by the WRF Model. Sola 2011, 7, 109–112. [Google Scholar] [CrossRef] [Green Version]
- Hahmann, A.N.; Vincent, C.L.; Pena, A.; Lange, J.; Hasager, C.B. Wind climate estimation using WRF model output: Method and model sensitivities over the sea. Int. J. Climatol. 2015, 35, 3422–3439. [Google Scholar] [CrossRef]
- Floors, R.; Hahmann, A.N.; Pena, A. Evaluating Mesoscale Simulations of the Coastal Flow Using Lidar Measurements. J. Geophys. Res. Atmos. 2018, 123, 2718–2736. [Google Scholar] [CrossRef] [Green Version]
- Hasselmann, K.P.; Barnett, T.; Bouws, E.; Carlson, H.E.; Cartwright, D.; Enke, K.; Ewing, J.A.; Gienapp, H.E.; Hasselmann, D.; Kruseman, P.; et al. Measurements of Wind-Wave Growth and Swell Decay during the Joint North Sea Wave Project (JONSWAP); Deutches Hydrographisches Institut: Hamburg, Germany, 1973; Volume 8, pp. 1–95. [Google Scholar]
- Hasselmann, K.; Ross, D.B.; Muller, P.; Sell, W. Parametric wave prediction model. J. Phys. Oceanogr. 1976, 6, 200–228. [Google Scholar] [CrossRef]
- Francis, P.E. Effect of Changes of Atmospheric Stability and Surface Roughness on Off-Shore Winds over East Coast of Britain. Meteorol. Mag. 1970, 99, 130. [Google Scholar]
- Lindley, D.; Simpson, P.B.; Hassan, H.; Milborrow, D. An assessment of offshore siting of wind turbine generators. In Proceedings of the 3rd International Symposium on Wind Energy Systems, Cranfield, UK, 26–29 August 1980; BHRA Fluid Engineering: Cranfield, UK, 1980; pp. 17–42. [Google Scholar]
- Sethuraman, S.; Raynor, G.S. Comparison of Mean Wind Speeds and Turbulence at a Coastal Site and an Offshore Location. J. Appl. Meteorol. 1980, 19, 15–21. [Google Scholar] [CrossRef]
- Barthelmie, R.J.; Courtney, M.S.; Hojstrup, J.; Larsen, S.E. Meteorological aspects of offshore wind energy: Observations from the Vindeby wind farm. J. Wind Eng. Ind. Aerodyn. 1996, 62, 191–211. [Google Scholar] [CrossRef]
- Barthelmie, R.J.; Grisogono, B.; Pryor, S.C. Observations and simulations of diurnal cycles of near-surface wind speeds over land and sea. J. Geophys. Res. Atmos. 1996, 101, 21327–21337. [Google Scholar] [CrossRef]
- Barthelmie, R.J.; Palutikof, J.P. Coastal wind speed modelling for wind energy applications. J. Wind Eng. Ind. Aerodyn. 1996, 62, 213–236. [Google Scholar] [CrossRef]
- Pryor, S.C.; Barthelmie, R.J. Analysis of the effect of the coastal discontinuity on near-surface flow. Ann. Geophys. 1998, 16, 882–888. [Google Scholar] [CrossRef] [Green Version]
- Floors, R.; Pena, A.; Lea, G.; Vasiljevic, N.; Simon, E.; Courtney, M. The RUNE Experiment—A Database of Remote-Sensing Observations of Near-Shore Winds. Remote Sens. 2016, 8, 884. [Google Scholar] [CrossRef]
- Peña, A. RUNE Benchmarks; DTU Wind Energy E, No. 0134(EN); DTU Wind Energy: Roskilde, Denmark, 2017; p. 25. [Google Scholar]
- Gottschall, J.; Courtney, M. Verification Test for three WindCube WLS7 LiDARs at the Høvsøre Test Site; No. 1732(EN); Danmarks Tekniske Universitet, Risø Nationallaboratoriet for Bæredygtig Energi: Kgs. Lyngby, Denmark, 2010; p. 44. [Google Scholar]
- Tachikawa, T.; Hato, M.; Kaku, M.; Iwasaki, A. Characteristics of ASTER GDEM Version 2; IEEE: Piscataway, NJ, USA, 2011; pp. 3657–3660. [Google Scholar]
- MLIT. National Land Numerical Information Download Service. Available online: http://nlftp.mlit.go.jp/ksj-e/index.html (accessed on 27 July 2018).
- Barthelmie, R.J.; Courtney, M.; Højstrup, J.; Sanderhoff, P. The Vindeby Project: A Description; Risø National Laboratory: Roskilde, Denmark, 1994; ISBN 87-550-1969-2. [Google Scholar]
- Mortensen, N.G.; Landberg, L.; Troen, I.; Lundtang Petersen, E. Wind Atlas Analysis and Application Program (WAsP); Risø National Laboratory: Roskilde, Denmark, 1993. [Google Scholar]
- Emeis, S. Wind Energy Meteorology: Atmospheric Physics for Wind Power Generation; Springer International Publishing: Berlin, Germany, 2018. [Google Scholar]
Figure 1.
(a) Location and orientation and (b) aerial photograph of the Hazaki Oceanographic Research Station (HORS) research platform.
Figure 1.
(a) Location and orientation and (b) aerial photograph of the Hazaki Oceanographic Research Station (HORS) research platform.

Figure 2.
Experimental setup.

Figure 3.
(a) Topography and (b) land use around the HORS research platform.

Figure 4.
Comparison of (a) wind speed and (b) wind direction from light detection and ranging (LiDAR) #1 and LiDAR #2 at a height of 100 m above the pier for the period of 7–21 March 2016.
Figure 4.
Comparison of (a) wind speed and (b) wind direction from light detection and ranging (LiDAR) #1 and LiDAR #2 at a height of 100 m above the pier for the period of 7–21 March 2016.

Figure 5.
Timeseries of 10 min wind speeds at a height of 100 m for (a) LiDAR #1 and (b) LiDAR #2 for the period 22 March to 30 September 2016.
Figure 5.
Timeseries of 10 min wind speeds at a height of 100 m for (a) LiDAR #1 and (b) LiDAR #2 for the period 22 March to 30 September 2016.

Figure 6.
Same as Figure 5, but for wind directions.
Figure 6.
Same as Figure 5, but for wind directions.

Figure 7.
Comparison of 10 min mean air temperature on the pier and seawater temperatures at a depth of 2 m for the period of January to October 2016 at the HORS research platform.
Figure 7.
Comparison of 10 min mean air temperature on the pier and seawater temperatures at a depth of 2 m for the period of January to October 2016 at the HORS research platform.

Figure 8.
Comparison of occurrence frequency of 10 min wind speed for LiDAR #1 and LiDAR #2 at a height of 100 m from the LiDAR installation levels.
Figure 8.
Comparison of occurrence frequency of 10 min wind speed for LiDAR #1 and LiDAR #2 at a height of 100 m from the LiDAR installation levels.

Figure 9.
Comparison of wind roses for LiDAR #1 and LiDAR #2 at a height of 100 m from the LiDAR installation levels.
Figure 9.
Comparison of wind roses for LiDAR #1 and LiDAR #2 at a height of 100 m from the LiDAR installation levels.

Figure 10.
LiDAR #1 to LiDAR #2 wind speed ratios at 50 m above sea level (ASL) as a function of wind direction. Only LiDAR #2 wind speeds greater than 2 m/s were used in the analysis.
Figure 10.
LiDAR #1 to LiDAR #2 wind speed ratios at 50 m above sea level (ASL) as a function of wind direction. Only LiDAR #2 wind speeds greater than 2 m/s were used in the analysis.

Figure 11.
Bin-averaged LiDAR #1 to LiDAR #2 wind speed ratio as a function of wind direction at heights of 50, 70, 90, 110, 130, 150, 170, 190, and 207 m ASL.
Figure 11.
Bin-averaged LiDAR #1 to LiDAR #2 wind speed ratio as a function of wind direction at heights of 50, 70, 90, 110, 130, 150, 170, 190, and 207 m ASL.

Figure 12.
Wind speed ratio as a function of fetch length at 50 m ASL.

Figure 13.
Ratios of turbulence intensity between LiDAR #1 at 47 m and LiDAR #2 at 50 m ASL as a function of fetch length.
Figure 13.
Ratios of turbulence intensity between LiDAR #1 at 47 m and LiDAR #2 at 50 m ASL as a function of fetch length.

Figure 14.
Bin-averaged wind speed ratio as a function of fetch length at heights of 50, 70, 90, 110, 130, 150, 170, 190, and 207 m ASL.
Figure 14.
Bin-averaged wind speed ratio as a function of fetch length at heights of 50, 70, 90, 110, 130, 150, 170, 190, and 207 m ASL.

Figure 15.
Empirical equations of the ratio of onshore and offshore wind speeds as functions of the fetch length and height, derived from the LiDAR observations for more than a 1000 m fetch length.
Figure 15.
Empirical equations of the ratio of onshore and offshore wind speeds as functions of the fetch length and height, derived from the LiDAR observations for more than a 1000 m fetch length.

Figure 16.
(a) Absolute mean wind speed profiles and (b) mean wind speed profiles normalized by the lowest level values for land sectors (215° to 325°) at the HORS research platform. Only observations that were taken when all heights were available were used for this analysis.
Figure 16.
(a) Absolute mean wind speed profiles and (b) mean wind speed profiles normalized by the lowest level values for land sectors (215° to 325°) at the HORS research platform. Only observations that were taken when all heights were available were used for this analysis.

© 2018 by the authors. Licensee MDPI, Basel, Switzerland. This article is an open access article distributed under the terms and conditions of the Creative Commons Attribution (CC BY) license (http://creativecommons.org/licenses/by/4.0/).
Share and Cite
MDPI and ACS Style
Shimada, S.; Takeyama, Y.; Kogaki, T.; Ohsawa, T.; Nakamura, S. Investigation of the Fetch Effect Using Onshore and Offshore Vertical LiDAR Devices. Remote Sens. 2018, 10, 1408. https://0-doi-org.brum.beds.ac.uk/10.3390/rs10091408
AMA Style
Shimada S, Takeyama Y, Kogaki T, Ohsawa T, Nakamura S. Investigation of the Fetch Effect Using Onshore and Offshore Vertical LiDAR Devices. Remote Sensing. 2018; 10(9):1408. https://0-doi-org.brum.beds.ac.uk/10.3390/rs10091408
Chicago/Turabian StyleShimada, Susumu, Yuko Takeyama, Tetsuya Kogaki, Teruo Ohsawa, and Satoshi Nakamura. 2018. "Investigation of the Fetch Effect Using Onshore and Offshore Vertical LiDAR Devices" Remote Sensing 10, no. 9: 1408. https://0-doi-org.brum.beds.ac.uk/10.3390/rs10091408
Note that from the first issue of 2016, this journal uses article numbers instead of page numbers. See further details here.