Retrieval of Salt Marsh Above-Ground Biomass from High-Spatial Resolution Hyperspectral Imagery Using PROSAIL

 , ,
, ,
Abstract
:
1. Introduction
2. Field Survey
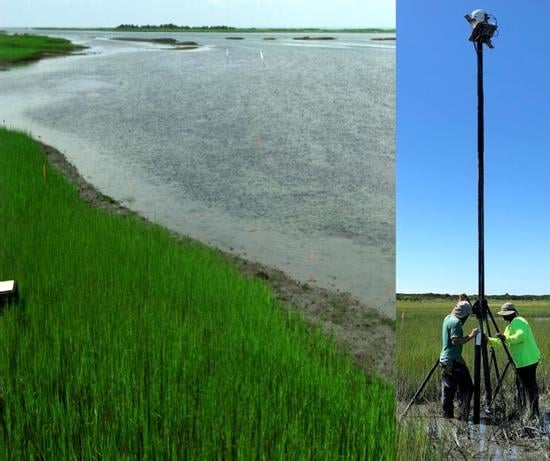
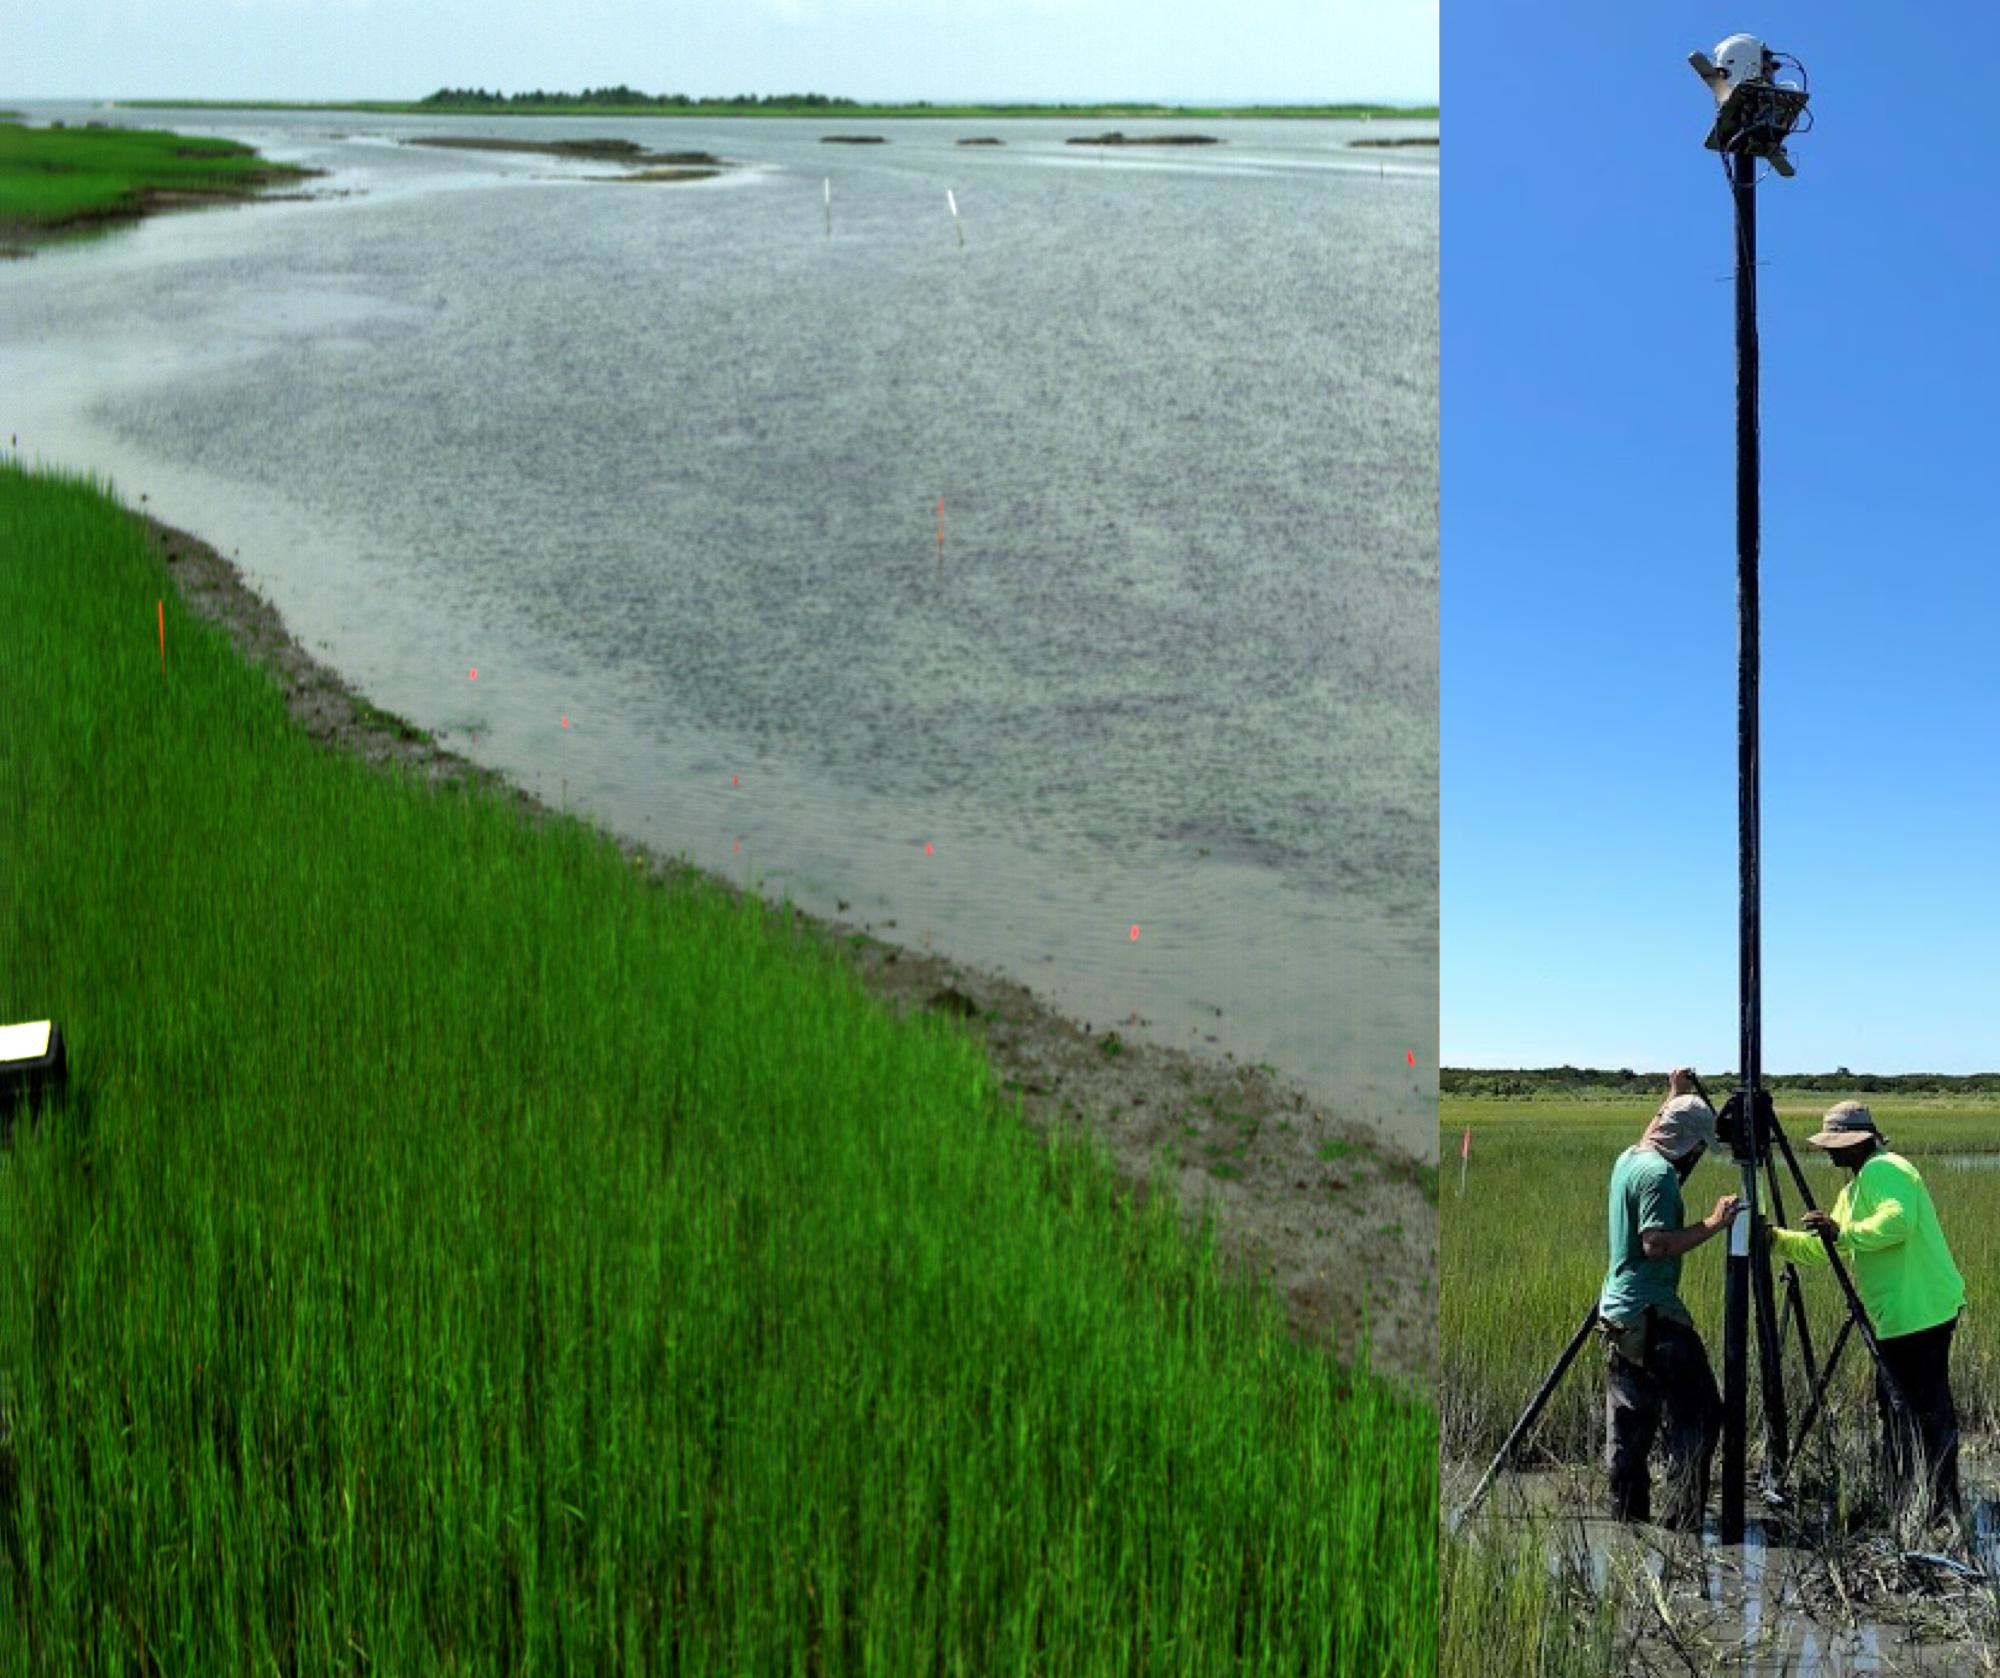
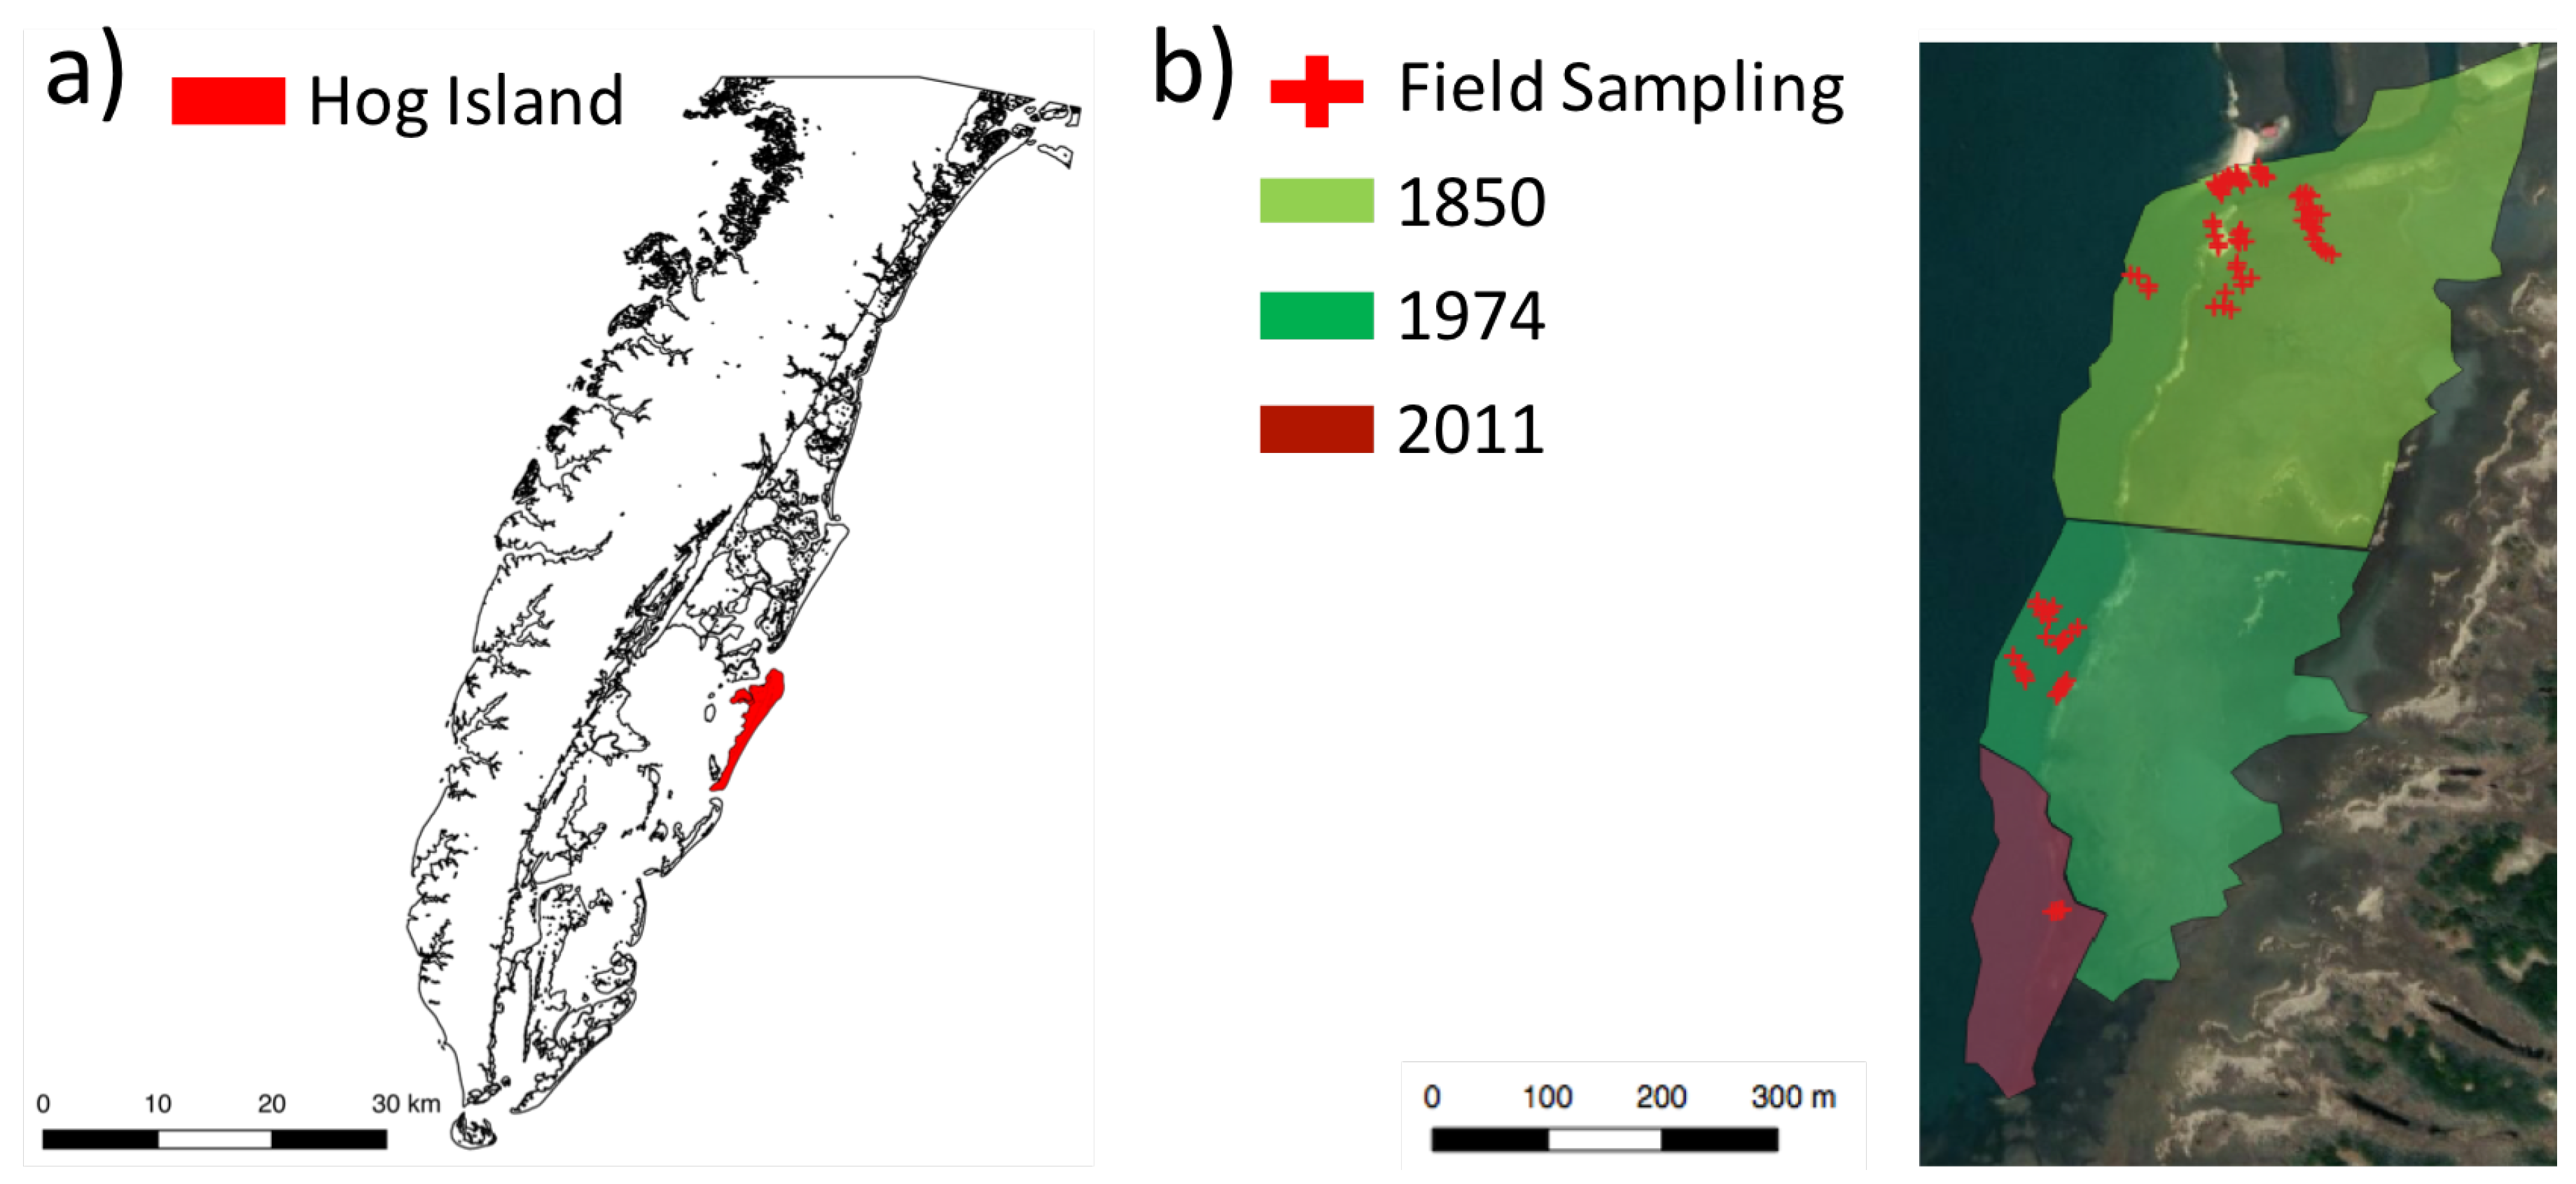
2.1. Study Area
2.2. In Situ Measurements
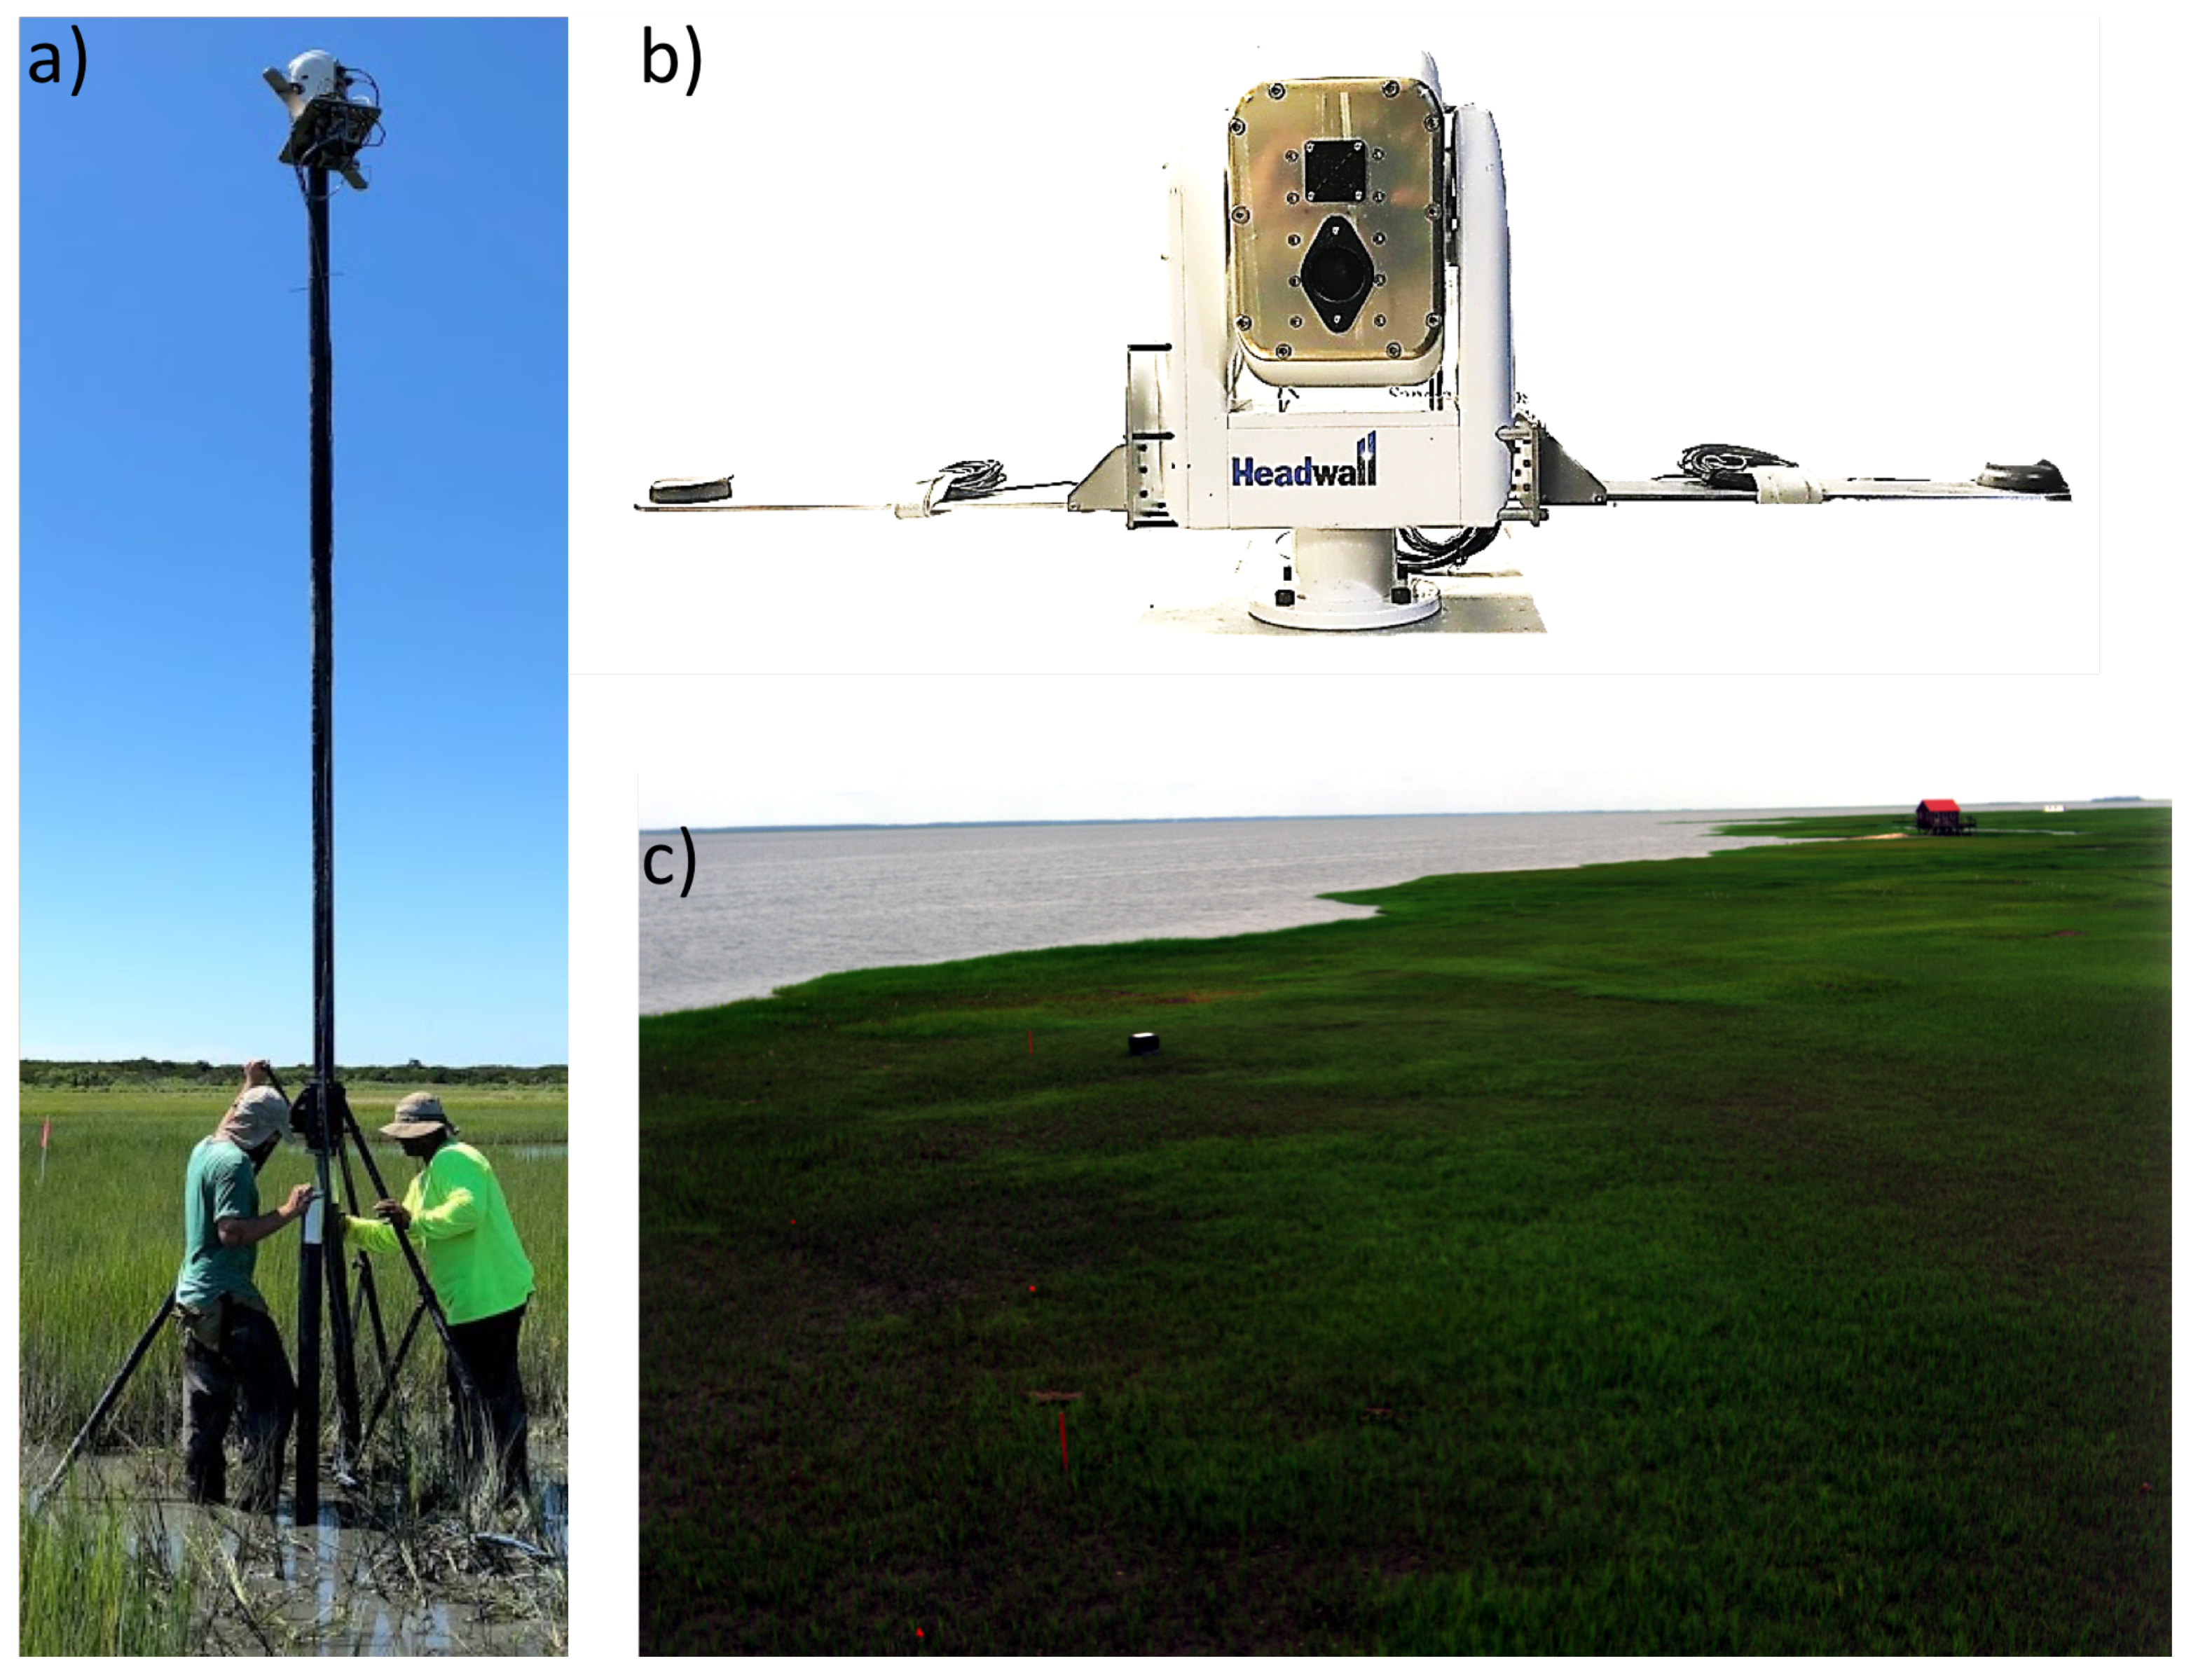
3. Hyperspectral Imaging Sensor
3.1. Design and Instrumentation
3.2. Image Acquisition and Processing
4. The PROSAIL Radiative Transfer Model
4.1. PROSAIL: Model Overview
4.2. PROSAIL: Inversion Methodology
4.3. PROSAIL: Spatial Resampling
5. Results
6. Discussion and Conclusions
Author Contributions
Funding
Conflicts of Interest
References
- Boesch, D.F.; Turner, R.E. Dependence of fishery species on salt marshes: The role of food and refuge. Estuaries 1984, 7, 460–468. [Google Scholar] [CrossRef]
- Barbier, E.B.; Koch, E.W.; Silliman, B.R.; Hacker, S.D.; Wolanski, E.; Primavera, J.; Granek, E.F.; Polasky, S.; Aswani, S.; Cramer, L.A.; et al. Coastal ecosystem-based management with nonlinear ecological functions and values. Science 2008, 319, 321–323. [Google Scholar] [CrossRef]
- Koch, E.W.; Barbier, E.B.; Silliman, B.R.; Reed, D.J.; Perillo, G.M.; Hacker, S.D.; Granek, E.F.; Primavera, J.H.; Muthiga, N.; Polasky, S.; et al. Non-linearity in ecosystem services: Temporal and spatial variability in coastal protection. Front. Ecol. Environ. 2009, 7, 29–37. [Google Scholar] [CrossRef]
- Morgan, P.A.; Burdick, D.M.; Short, F.T. The functions and values of fringing salt marshes in northern New England, USA. Estuar. Coasts 2009, 32, 483–495. [Google Scholar] [CrossRef]
- Chmura, G.L.; Anisfeld, S.C.; Cahoon, D.R.; Lynch, J.C. Global carbon sequestration in tidal, saline wetland soils. Glob. Biogeochem. Cycles 2003, 17. [Google Scholar] [CrossRef]
- Kulawardhana, R.W.; Feagin, R.A.; Popescu, S.C.; Boutton, T.W.; Yeager, K.M.; Bianchi, T.S. The role of elevation, relative sea-level history and vegetation transition in determining carbon distribution in Spartina alterniflora dominated salt marshes. Estuar. Coast. Shelf Sci. 2015, 154, 48–57. [Google Scholar] [CrossRef]
- Mcleod, E.; Chmura, G.L.; Bouillon, S.; Salm, R.; Björk, M.; Duarte, C.M.; Lovelock, C.E.; Schlesinger, W.H.; Silliman, B.R. A blueprint for blue carbon: Toward an improved understanding of the role of vegetated coastal habitats in sequestering CO2. Front. Ecol. Environ. 2011, 9, 552–560. [Google Scholar] [CrossRef]
- Pendleton, L.; Donato, D.C.; Murray, B.C.; Crooks, S.; Jenkins, W.A.; Sifleet, S.; Craft, C.; Fourqurean, J.W.; Kauffman, J.B.; Marbà, N.; et al. Estimating global “blue carbon” emissions from conversion and degradation of vegetated coastal ecosystems. PLoS ONE 2012, 7, e43542. [Google Scholar] [CrossRef]
- Chmura, G.L. What do we need to assess the sustainability of the tidal salt marsh carbon sink? Ocean Coast. Manag. 2013, 83, 25–31. [Google Scholar] [CrossRef]
- Morris, J.T.; Sundareshwar, P.; Nietch, C.T.; Kjerfve, B.; Cahoon, D.R. Responses of coastal wetlands to rising sea level. Ecology 2002, 83, 2869–2877. [Google Scholar] [CrossRef]
- Kathilankal, J.C.; Mozdzer, T.J.; Fuentes, J.D.; D’Odorico, P.; McGlathery, K.J.; Zieman, J.C. Tidal influences on carbon assimilation by a salt marsh. Environ. Res. Lett. 2008, 3, 044010. [Google Scholar] [CrossRef]
- Fagherazzi, S.; Kirwan, M.L.; Mudd, S.M.; Guntenspergen, G.R.; Temmerman, S.; D’Alpaos, A.; Koppel, J.; Rybczyk, J.M.; Reyes, E.; Craft, C.; et al. Numerical models of salt marsh evolution: Ecological, geomorphic, and climatic factors. Rev. Geophys. 2012, 50, RG1002. [Google Scholar] [CrossRef]
- Kirwan, M.L.; Mudd, S.M. Response of salt-marsh carbon accumulation to climate change. Nature 2012, 489, 550–553. [Google Scholar] [CrossRef]
- McLoughlin, S.M.; Wiberg, P.L.; Safak, I.; McGlathery, K.J. Rates and forcing of marsh edge erosion in a shallow coastal bay. Estuar. Coasts 2015, 38, 620–638. [Google Scholar] [CrossRef]
- Byrd, K.B.; O’Connell, J.L.; Di Tommaso, S.; Kelly, M. Evaluation of sensor types and environmental controls on mapping biomass of coastal marsh emergent vegetation. Remote Sens. Environ. 2014, 149, 166–180. [Google Scholar] [CrossRef]
- Deegan, L.A.; Johnson, D.S.; Warren, R.S.; Peterson, B.J.; Fleeger, J.W.; Fagherazzi, S.; Wollheim, W.M. Coastal eutrophication as a driver of salt marsh loss. Nature 2012, 490, 388–392. [Google Scholar] [CrossRef]
- Alber, M.; Swenson, E.M.; Adamowicz, S.C.; Mendelssohn, I.A. Salt marsh dieback: An overview of recent events in the US. Estuar. Coast. Shelf Sci. 2008, 80, 1–11. [Google Scholar] [CrossRef]
- Osgood, D.T.; Silliman, B.R. From Climate Change to Snails. In Human Impacts on Salt Marshes: A Global Perspective; University of California Press: Orlando, FL, USA, 2009; pp. 231–252. [Google Scholar]
- Morris, J.T.; Bowden, W.B. A Mechanistic, Numerical Model of Sedimentation, Mineralization, and Decomposition for Marsh Sediments 1. Soil Sci. Soc. Am. J. 1986, 50, 96–105. [Google Scholar] [CrossRef]
- Swanson, K.M.; Drexler, J.Z.; Schoellhamer, D.H.; Thorne, K.M.; Casazza, M.L.; Overton, C.T.; Callaway, J.C.; Takekawa, J.Y. Wetland accretion rate model of ecosystem resilience (WARMER) and its application to habitat sustainability for endangered species in the San Francisco Estuary. Estuar. Coasts 2014, 37, 476–492. [Google Scholar] [CrossRef]
- Klemas, V. Remote sensing of wetlands: Case studies comparing practical techniques. J. Coast. Res. 2011, 27, 418–427. [Google Scholar]
- Wright, C.; Gallant, A. Improved wetland remote sensing in Yellowstone National Park using classification trees to combine TM imagery and ancillary environmental data. Remote Sens. Environ. 2007, 107, 582–605. [Google Scholar] [CrossRef]
- Bachmann, C.M.; Donato, T.F.; Lamela, G.M.; Rhea, W.J.; Bettenhausen, M.H.; Fusina, R.A.; Du Bois, K.R.; Porter, J.H.; Truitt, B.R. Automatic classification of land cover on Smith Island, VA, using HyMAP imagery. IEEE Trans. Geosci. Remote Sens. 2002, 40, 2313–2330. [Google Scholar] [CrossRef] [Green Version]
- Bachmann, C.M.; Bettenhausen, M.H.; Fusina, R.A.; Donato, T.F.; Russ, A.L.; Burke, J.W.; Lamela, G.M.; Rhea, W.J.; Truitt, B.R.; Porter, J.H. A credit assignment approach to fusing classifiers of multiseason hyperspectral imagery. IEEE Trans. Geosci. Remote Sens. 2003, 41, 2488–2499. [Google Scholar] [CrossRef]
- Andrew, M.E.; Ustin, S.L. The role of environmental context in mapping invasive plants with hyperspectral image data. Remote Sens. Environ. 2008, 112, 4301–4317. [Google Scholar] [CrossRef]
- Wang, C.; Menenti, M.; Stoll, M.P.; Belluco, E.; Marani, M. Mapping mixed vegetation communities in salt marshes using airborne spectral data. Remote Sens. Environ. 2007, 107, 559–570. [Google Scholar] [CrossRef]
- Artigas, F.J.; Yang, J. Spectral discrimination of marsh vegetation types in the New Jersey Meadowlands, USA. Wetlands 2006, 26, 271–277. [Google Scholar] [CrossRef]
- Hirano, A.; Madden, M.; Welch, R. Hyperspectral image data for mapping wetland vegetation. Wetlands 2003, 23, 436–448. [Google Scholar] [CrossRef]
- Bachmann, C.M. Improving the performance of classifiers in high-dimensional remote sensing applications: An adaptive resampling strategy for error-prone exemplars (ARESEPE). IEEE Trans. Geosci. Remote Sens. 2003, 41, 2101–2112. [Google Scholar] [CrossRef]
- Hladik, C.; Schalles, J.; Alber, M. Salt marsh elevation and habitat mapping using hyperspectral and LIDAR data. Remote Sens. Environ. 2013, 139, 318–330. [Google Scholar] [CrossRef]
- Ramsey, I.; Rangoonwala, A. Canopy reflectance related to marsh dieback onset and progression in coastal Louisiana. Photogramm. Eng. Remote Sens. 2006, 72, 641–652. [Google Scholar] [CrossRef]
- Ghosh, S.; Mishra, D.R.; Gitelson, A.A. Long-term monitoring of biophysical characteristics of tidal wetlands in the northern Gulf of Mexico—A methodological approach using MODIS. Remote Sens. Environ. 2016, 173, 39–58. [Google Scholar] [CrossRef]
- Marsh, A.; Blum, L.K.; Christian, R.R.; Ramsey, E.; Rangoonwala, A. Response and resilience of Spartina alterniflora to sudden dieback. J. Coast. Conserv. 2016, 20, 335–350. [Google Scholar] [CrossRef] [Green Version]
- McKee, K.L.; Mendelssohn, I.A.; D. Materne, M. Acute salt marsh dieback in the Mississippi River deltaic plain: A drought-induced phenomenon? Glob. Ecol. Biogeogr. 2004, 13, 65–73. [Google Scholar] [CrossRef]
- Sun, C.; Fagherazzi, S.; Liu, Y. Classification mapping of salt marsh vegetation by flexible monthly NDVI time-series using Landsat imagery. Estuar. Coast. Shelf Sci. 2018, 213, 61–80. [Google Scholar] [CrossRef]
- Campbell, A.; Wang, Y. Examining the influence of tidal stage on salt marsh mapping using high-spatial-resolution satellite remote sensing and topobathymetric lidar. IEEE Trans. Geosci. Remote Sens. 2018, 56, 5169–5176. [Google Scholar] [CrossRef]
- Ramsey, E., III; Rangoonwala, A.; Chi, Z.; Jones, C.E.; Bannister, T. Marsh dieback, loss, and recovery mapped with satellite optical, airborne polarimetric radar, and field data. Remote Sens. Environ. 2014, 152, 364–374. [Google Scholar] [CrossRef]
- Campbell, A.; Wang, Y.; Christiano, M.; Stevens, S. Salt marsh monitoring in Jamaica Bay, New York from 2003 to 2013: A decade of change from restoration to Hurricane Sandy. Remote Sens. 2017, 9, 131. [Google Scholar] [CrossRef]
- Silliman, B.R.; Van De Koppel, J.; Bertness, M.D.; Stanton, L.E.; Mendelssohn, I.A. Drought, snails, and large-scale die-off of southern US salt marshes. Science 2005, 310, 1803–1806. [Google Scholar] [CrossRef]
- Angelini, C.; Griffin, J.N.; van de Koppel, J.; Lamers, L.P.; Smolders, A.J.; Derksen-Hooijberg, M.; van der Heide, T.; Silliman, B.R. A keystone mutualism underpins resilience of a coastal ecosystem to drought. Nat. Commun. 2016, 7, 12473. [Google Scholar] [CrossRef] [Green Version]
- Tyler, A.C.; Mastronicola, T.A.; McGlathery, K.J. Nitrogen fixation and nitrogen limitation of primary production along a natural marsh chronosequence. Oecologia 2003, 136, 431–438. [Google Scholar] [CrossRef]
- Tyler, A.C.; Zieman, J.C. Patterns of development in the creekbank region of a barrier island Spartina alterniflora marsh. Mar. Ecol. Prog. Ser. 1999, 161–177. [Google Scholar] [CrossRef]
- Burkart, A.; Aasen, H.; Alonso, L.; Menz, G.; Bareth, G.; Rascher, U. Angular dependency of hyperspectral measurements over wheat characterized by a novel UAV based goniometer. Remote Sens. 2015, 7, 725–746. [Google Scholar] [CrossRef]
- Morton, D.C.; Nagol, J.; Carabajal, C.C.; Rosette, J.; Palace, M.; Cook, B.D.; Vermote, E.F.; Harding, D.J.; North, P.R. Amazon forests maintain consistent canopy structure and greenness during the dry season. Nature 2014, 506, 221–224. [Google Scholar] [CrossRef]
- Verrelst, J.; Schaepman, M.E.; Koetz, B.; Kneubühler, M. Angular sensitivity analysis of vegetation indices derived from CHRIS/PROBA data. Remote Sens. Environ. 2008, 112, 2341–2353. [Google Scholar] [CrossRef]
- Schalles, J.F.; Hladik, C.M.; Lynes, A.A.; Pennings, S.C. Landscape estimates of habitat types, plant biomass, and invertebrate densities in a Georgia salt marsh. Oceanography 2013, 26, 88–97. [Google Scholar] [CrossRef]
- Baret, F.; Jacquemoud, S.; Guyot, G.; Leprieur, C. Modeled analysis of the biophysical nature of spectral shifts and comparison with information content of broad bands. Remote Sens. Environ. 1992, 41, 133–142. [Google Scholar] [CrossRef]
- Jacquemoud, S.; Verhoef, W.; Baret, F.; Bacour, C.; Zarco-Tejada, P.J.; Asner, G.P.; François, C.; Ustin, S.L. PROSPECT+ SAIL models: A review of use for vegetation characterization. Remote Sens. Environ. 2009, 113, S56–S66. [Google Scholar] [CrossRef]
- Féret, J.B.; Gitelson, A.; Noble, S.; Jacquemoud, S. PROSPECT-D: Towards modeling leaf optical properties through a complete lifecycle. Remote Sens. Environ. 2017, 193, 204–215. [Google Scholar] [CrossRef] [Green Version]
- Berger, K.; Atzberger, C.; Danner, M.; D’Urso, G.; Mauser, W.; Vuolo, F.; Hank, T. Evaluation of the PROSAIL Model Capabilities for Future Hyperspectral Model Environments: A Review Study. Remote Sens. 2018, 10, 85. [Google Scholar] [CrossRef]
- Bsaibes, A.; Courault, D.; Baret, F.; Weiss, M.; Olioso, A.; Jacob, F.; Hagolle, O.; Marloie, O.; Bertrand, N.; Desfond, V.; et al. Albedo and LAI estimates from FORMOSAT-2 data for crop monitoring. Remote Sens. Environ. 2009, 113, 716–729. [Google Scholar] [CrossRef]
- Koetz, B.; Baret, F.; Poilvé, H.; Hill, J. Use of coupled canopy structure dynamic and radiative transfer models to estimate biophysical canopy characteristics. Remote Sens. Environ. 2005, 95, 115–124. [Google Scholar] [CrossRef]
- Danner, M.; Berger, K.; Wocher, M.; Mauser, W.; Hank, T. Retrieval of Biophysical Crop Variables from Multi-Angular Canopy Spectroscopy. Remote Sens. 2017, 9, 726. [Google Scholar] [CrossRef]
- Darvishzadeh, R.; Matkan, A.A.; Ahangar, A.D. Inversion of a radiative transfer model for estimation of rice canopy chlorophyll content using a lookup-table approach. IEEE J. Sel. Top. Appl. Earth Obs. Remote Sens. 2012, 5, 1222–1230. [Google Scholar] [CrossRef]
- Breunig, F.M.; Galvão, L.S.; Formaggio, A.R.; Epiphanio, J.C. Influence of data acquisition geometry on soybean spectral response simulated by the prosail model. Eng. Agrícola 2013, 33, 176–187. [Google Scholar] [CrossRef] [Green Version]
- Baret, F.; Clevers, J.; Steven, M. The robustness of canopy gap fraction estimates from red and near-infrared reflectances: A comparison of approaches. Remote Sens. Environ. 1995, 54, 141–151. [Google Scholar] [CrossRef]
- Richter, K.; Atzberger, C.; Vuolo, F.; Weihs, P.; d’Urso, G. Experimental assessment of the Sentinel-2 band setting for RTM-based LAI retrieval of sugar beet and maize. Can. J. Remote Sens. 2009, 35, 230–247. [Google Scholar] [CrossRef]
- Jay, S.; Maupas, F.; Bendoula, R.; Gorretta, N. Retrieving LAI, chlorophyll and nitrogen contents in sugar beet crops from multi-angular optical remote sensing: Comparison of vegetation indices and PROSAIL inversion for field phenotyping. Field Crop Res. 2017, 210, 33–46. [Google Scholar] [CrossRef] [Green Version]
- Bachmann, C.; Eon, R.; Lapszynski, C.; Badura, G.; Vodacek, A.; Hoffman, M.; Mckeown, D.; Kremens, R.; Richardson, M.; Bauch, T.; et al. A Low-Rate Video Approach to Hyperspectral Imaging of Dynamic Scenes. J. Imaging 2019, 5, 6. [Google Scholar] [CrossRef]
- Osgood, D.T.; Zieman, J.C. Spatial and temporal patterns of substrate physicochemical parameters in different-aged barrier island marshes. Estuar. Coast. Shelf Sci. 1993, 37, 421–436. [Google Scholar] [CrossRef]
- Hayden, B.; Dueser, R.; Callahan, J.; Shugart, H. Long-term research at the Virginia Coast Reserve. BioScience 1991, 41, 310–318. [Google Scholar] [CrossRef]
- Stewart, J.Q. The great Atlantic coast tides of 5–8 March 1962. Weatherwise 1962, 15, 117–120. [Google Scholar] [CrossRef]
- Walsh, J.P. Low Marsh Succession along an Over-Wash Salt Marsh Chronosequence. Ph.D. Thesis, University of Virginia, Charlottesville, VA, USA, 1999. [Google Scholar]
- Tyler, A.C.; Lambrinos, J.G.; Grosholz, E.D. Nitrogen inputs promote the spread of an invasive marsh grass. Ecol. Appl. 2007, 17, 1886–1898. [Google Scholar] [CrossRef]
- Headwall E-Series Specifications. Available online: https://cdn2.hubspot.net/hubfs/145999/docs/Hyperspec_VNIR_2017.pdf?t=1515090180800 (accessed on 8 October 2018).
- General Dynamics Vector 20 Maritime Pan Tilt. Available online: https://www.gd-ots.com/wp-content/uploads/2017/11/Vector-20-Stabilized-Maritime-Pan-Tilt-System-1.pdf (accessed on 8 October 2018).
- Vectornav VN-300 GPS IMU. Available online: https://www.vectornav.com/products/vn-300 (accessed on 8 October 2018).
- BlueSky AL-3 (15m) Telescopic Mast. Available online: http://blueskymast.com/product/bsm3-w-l315-al3-000/ (accessed on 9 October 2018).
- Jacquemoud, S.; Baret, F. PROSPECT: A model of leaf optical properties spectra. Remote Sens. Environ. 1990, 34, 75–91. [Google Scholar] [CrossRef]
- Verhoef, W. Light scattering by leaf layers with application to canopy reflectance modeling: The SAIL model. Remote Sens. Environ. 1984, 16, 125–141. [Google Scholar] [CrossRef] [Green Version]
- Kuusk, A. The hot spot effect in plant canopy reflectance. In Photon-Vegetation Interactions: Applications in Optical Remote Sensing and Plant Ecology; Springer: Berlin, Germany, 1991; pp. 139–159. [Google Scholar]
- Allen, W.A.; Gausman, H.W.; Richardson, A.J.; Thomas, J.R. Interaction of isotropic light with a compact plant leaf. JOSA 1969, 59, 1376–1379. [Google Scholar] [CrossRef]
- Feret, J.B.; François, C.; Asner, G.P.; Gitelson, A.A.; Martin, R.E.; Bidel, L.P.; Ustin, S.L.; Le Maire, G.; Jacquemoud, S. PROSPECT-4 and 5: Advances in the leaf optical properties model separating photosynthetic pigments. Remote Sens. Environ. 2008, 112, 3030–3043. [Google Scholar] [CrossRef]
- Darvishzadeh, R.; Skidmore, A.; Schlerf, M.; Atzberger, C. Inversion of a radiative transfer model for estimating vegetation LAI and chlorophyll in a heterogeneous grassland. Remote Sens. Environ. 2008, 112, 2592–2604. [Google Scholar] [CrossRef]
- Atzberger, C.; Jarmer, T.; Schlerf, M.; Kötz, B.; Werner, W. Retrieval of wheat bio-physical attributes from hyperspectral data and SAILH+ PROSPECT radiative transfer model. In Proceedings of the 3rd EARSeL Workshop on Imaging Spectroscopy, Herrsching, Germany, 13–16 May 2003; pp. 473–482. [Google Scholar]
- Verhoef, W. Theory of Radiative Transfer Models Applied in Optical Remote Sensing of Vegetation Canopies. Ph.D. Thesis, Wageningen Agricultural University, Wageningen, The Netherlands, 1989. [Google Scholar]
- Nelder, J.A.; Mead, R. A simplex method for function minimization. Comput. J. 1965, 7, 308–313. [Google Scholar] [CrossRef]
- He, B.; Quan, X.; Xing, M. Retrieval of leaf area index in alpine wetlands using a two-layer canopy reflectance model. Int. J. Appl. Earth Obs. Geoinf. 2013, 21, 78–91. [Google Scholar] [CrossRef]
- Houborg, R.; Anderson, M.; Daughtry, C. Utility of an image-based canopy reflectance modeling tool for remote estimation of LAI and leaf chlorophyll content at the field scale. Remote Sens. Environ. 2009, 113, 259–274. [Google Scholar] [CrossRef]
- Quan, X.; He, B.; Yebra, M.; Yin, C.; Liao, Z.; Zhang, X.; Li, X. A radiative transfer model-based method for the estimation of grassland aboveground biomass. Int. J. Appl. Earth Obs. Geoinf. 2017, 54, 159–168. [Google Scholar] [CrossRef]
- Weiss, M.; Baret, F.; Myneni, R.; Pragnère, A.; Knyazikhin, Y. Investigation of a model inversion technique to estimate canopy biophysical variables from spectral and directional reflectance data. Agronomie 2000, 20, 3–22. [Google Scholar] [CrossRef]
- Price, J.C. On the information content of soil reflectance spectra. Remote Sens. Environ. 1990, 33, 113–121. [Google Scholar] [CrossRef]
- Price, J.C. An approach for analysis of reflectance spectra. Remote Sens. Environ. 1998, 64, 316–330. [Google Scholar] [CrossRef]
- Weiss, M.; Baret, F.; Leroy, M.; Bégué, A.; Hautecoeur, O.; Santer, R. Hemispherical reflectance and albedo estimates from the accumulation of across-track sun-synchronous satellite data. J. Geophys. Res. Atmos. 1999, 104, 22221–22232. [Google Scholar] [CrossRef] [Green Version]
- Bacour, C.; Jacquemoud, S.; Vogt, P.; Hosgood, B.; Andreoli, G.; Frangi, J.P. Optimal sampling configurations for the estimation of canopy properties from BRDF data acquired with the EGO/JRC. In Proceedings of the International Symposium on Physical Measurements & Signatures in Remote Sensing, Aussois, France, 8–12 January 2001; pp. 8–12. [Google Scholar]
- Atzberger, C.; Darvishzadeh, R.; Immitzer, M.; Schlerf, M.; Skidmore, A.; Le Maire, G. Comparative analysis of different retrieval methods for mapping grassland leaf area index using airborne imaging spectroscopy. Int. J. Appl. Earth Obs. Geoinf. 2015, 43, 19–31. [Google Scholar] [CrossRef] [Green Version]
- Verrelst, J.; Rivera, J.P.; Gitelson, A.; Delegido, J.; Moreno, J.; Camps-Valls, G. Spectral band selection for vegetation properties retrieval using Gaussian processes regression. Int. J. Appl. Earth Obs. Geoinf. 2016, 52, 554–567. [Google Scholar] [CrossRef]
- Li, L.; Cheng, Y.B.; Ustin, S.; Hu, X.T.; Riaño, D. Retrieval of vegetation equivalent water thickness from reflectance using genetic algorithm (GA)-partial least squares (PLS) regression. Adv. Space Res. 2008, 41, 1755–1763. [Google Scholar] [CrossRef]
- Saltelli, A.; Tarantola, S.; Chan, K.S. A quantitative model-independent method for global sensitivity analysis of model output. Technometrics 1999, 41, 39–56. [Google Scholar] [CrossRef]
- Bowyer, P.; Danson, F. Sensitivity of spectral reflectance to variation in live fuel moisture content at leaf and canopy level. Remote Sens. Environ. 2004, 92, 297–308. [Google Scholar] [CrossRef]
- Ceccato, P.; Flasse, S.; Tarantola, S.; Jacquemoud, S.; Grégoire, J.M. Detecting vegetation leaf water content using reflectance in the optical domain. Remote Sens. Environ. 2001, 77, 22–33. [Google Scholar] [CrossRef]
- Ceccato, P.; Gobron, N.; Flasse, S.; Pinty, B.; Tarantola, S. Designing a spectral index to estimate vegetation water content from remote sensing data: Part 1: Theoretical approach. Remote Sens. Environ. 2002, 82, 188–197. [Google Scholar] [CrossRef]
- Matheson, D.S.; Dennison, P.E. Evaluating the effects of spatial resolution on hyperspectral fire detection and temperature retrieval. Remote Sens. Environ. 2012, 124, 780–792. [Google Scholar] [CrossRef]
- Cheng, Y.; Gamon, J.A.; Fuentes, D.A.; Mao, Z.; Sims, D.A.; Qiu, H.l.; Claudio, H.; Huete, A.; Rahman, A.F. A multi-scale analysis of dynamic optical signals in a Southern California chaparral ecosystem: A comparison of field, AVIRIS and MODIS data. Remote Sens. Environ. 2006, 103, 369–378. [Google Scholar] [CrossRef]
- Dalponte, M.; Bruzzone, L.; Gianelle, D. Tree species classification in the Southern Alps based on the fusion of very high geometrical resolution multispectral/hyperspectral images and LiDAR data. Remote Sens. Environ. 2012, 123, 258–270. [Google Scholar] [CrossRef]
- Hardisky, M.; Klemas, V.; Daiber, F. Remote sensing salt marsh biomass and stress detection. Adv. Space Res. 1983, 2, 219–229. [Google Scholar] [CrossRef]
- Fernandez, S.; Vidal, D.; Simon, E.; Sole-Sugraiies, L. Radiometric characteristics of Triticum aestivum cv, Astral under water and nitrogen stress. Int. J. Remote Sens. 1994, 15, 1867–1884. [Google Scholar] [CrossRef]


| Model | Parameter | Symbol | Unit | Range or Fixed Value |
|---|---|---|---|---|
| PROSPECT | Leaf Structure Parameter | N | N/A | 1–1.25 |
| Chlorophyll a+b Content | μg/cm−2 | 10–101 | ||
| Equivalent Water Thickness | EWT | cm | 0.001–0.02 | |
| Leaf Mass Area | LMA | g/m−2 | 20–1000 | |
| Brown Pigment | N/A | 0 | ||
| Carotenoid Content | μg/cm−2 | 1–20 | ||
| SAIL | Leaf Area Index | LAI | m2m−2 | 1–10 |
| Hot Spot Factor | hspot | N/A | 0.5/LAI | |
| Soil Factor | ρsoil | N/A | 0.2–1 | |
| Two Leaf Inclination Distribution function (LIDF) | LIDFa/LIDFb | N/A | 1/0 | |
| Sun Zenith Angle | sza | deg | / | |
| View Zenith Angle | vza | deg | / | |
| Relative Azimuth Angle | raa | deg | / |
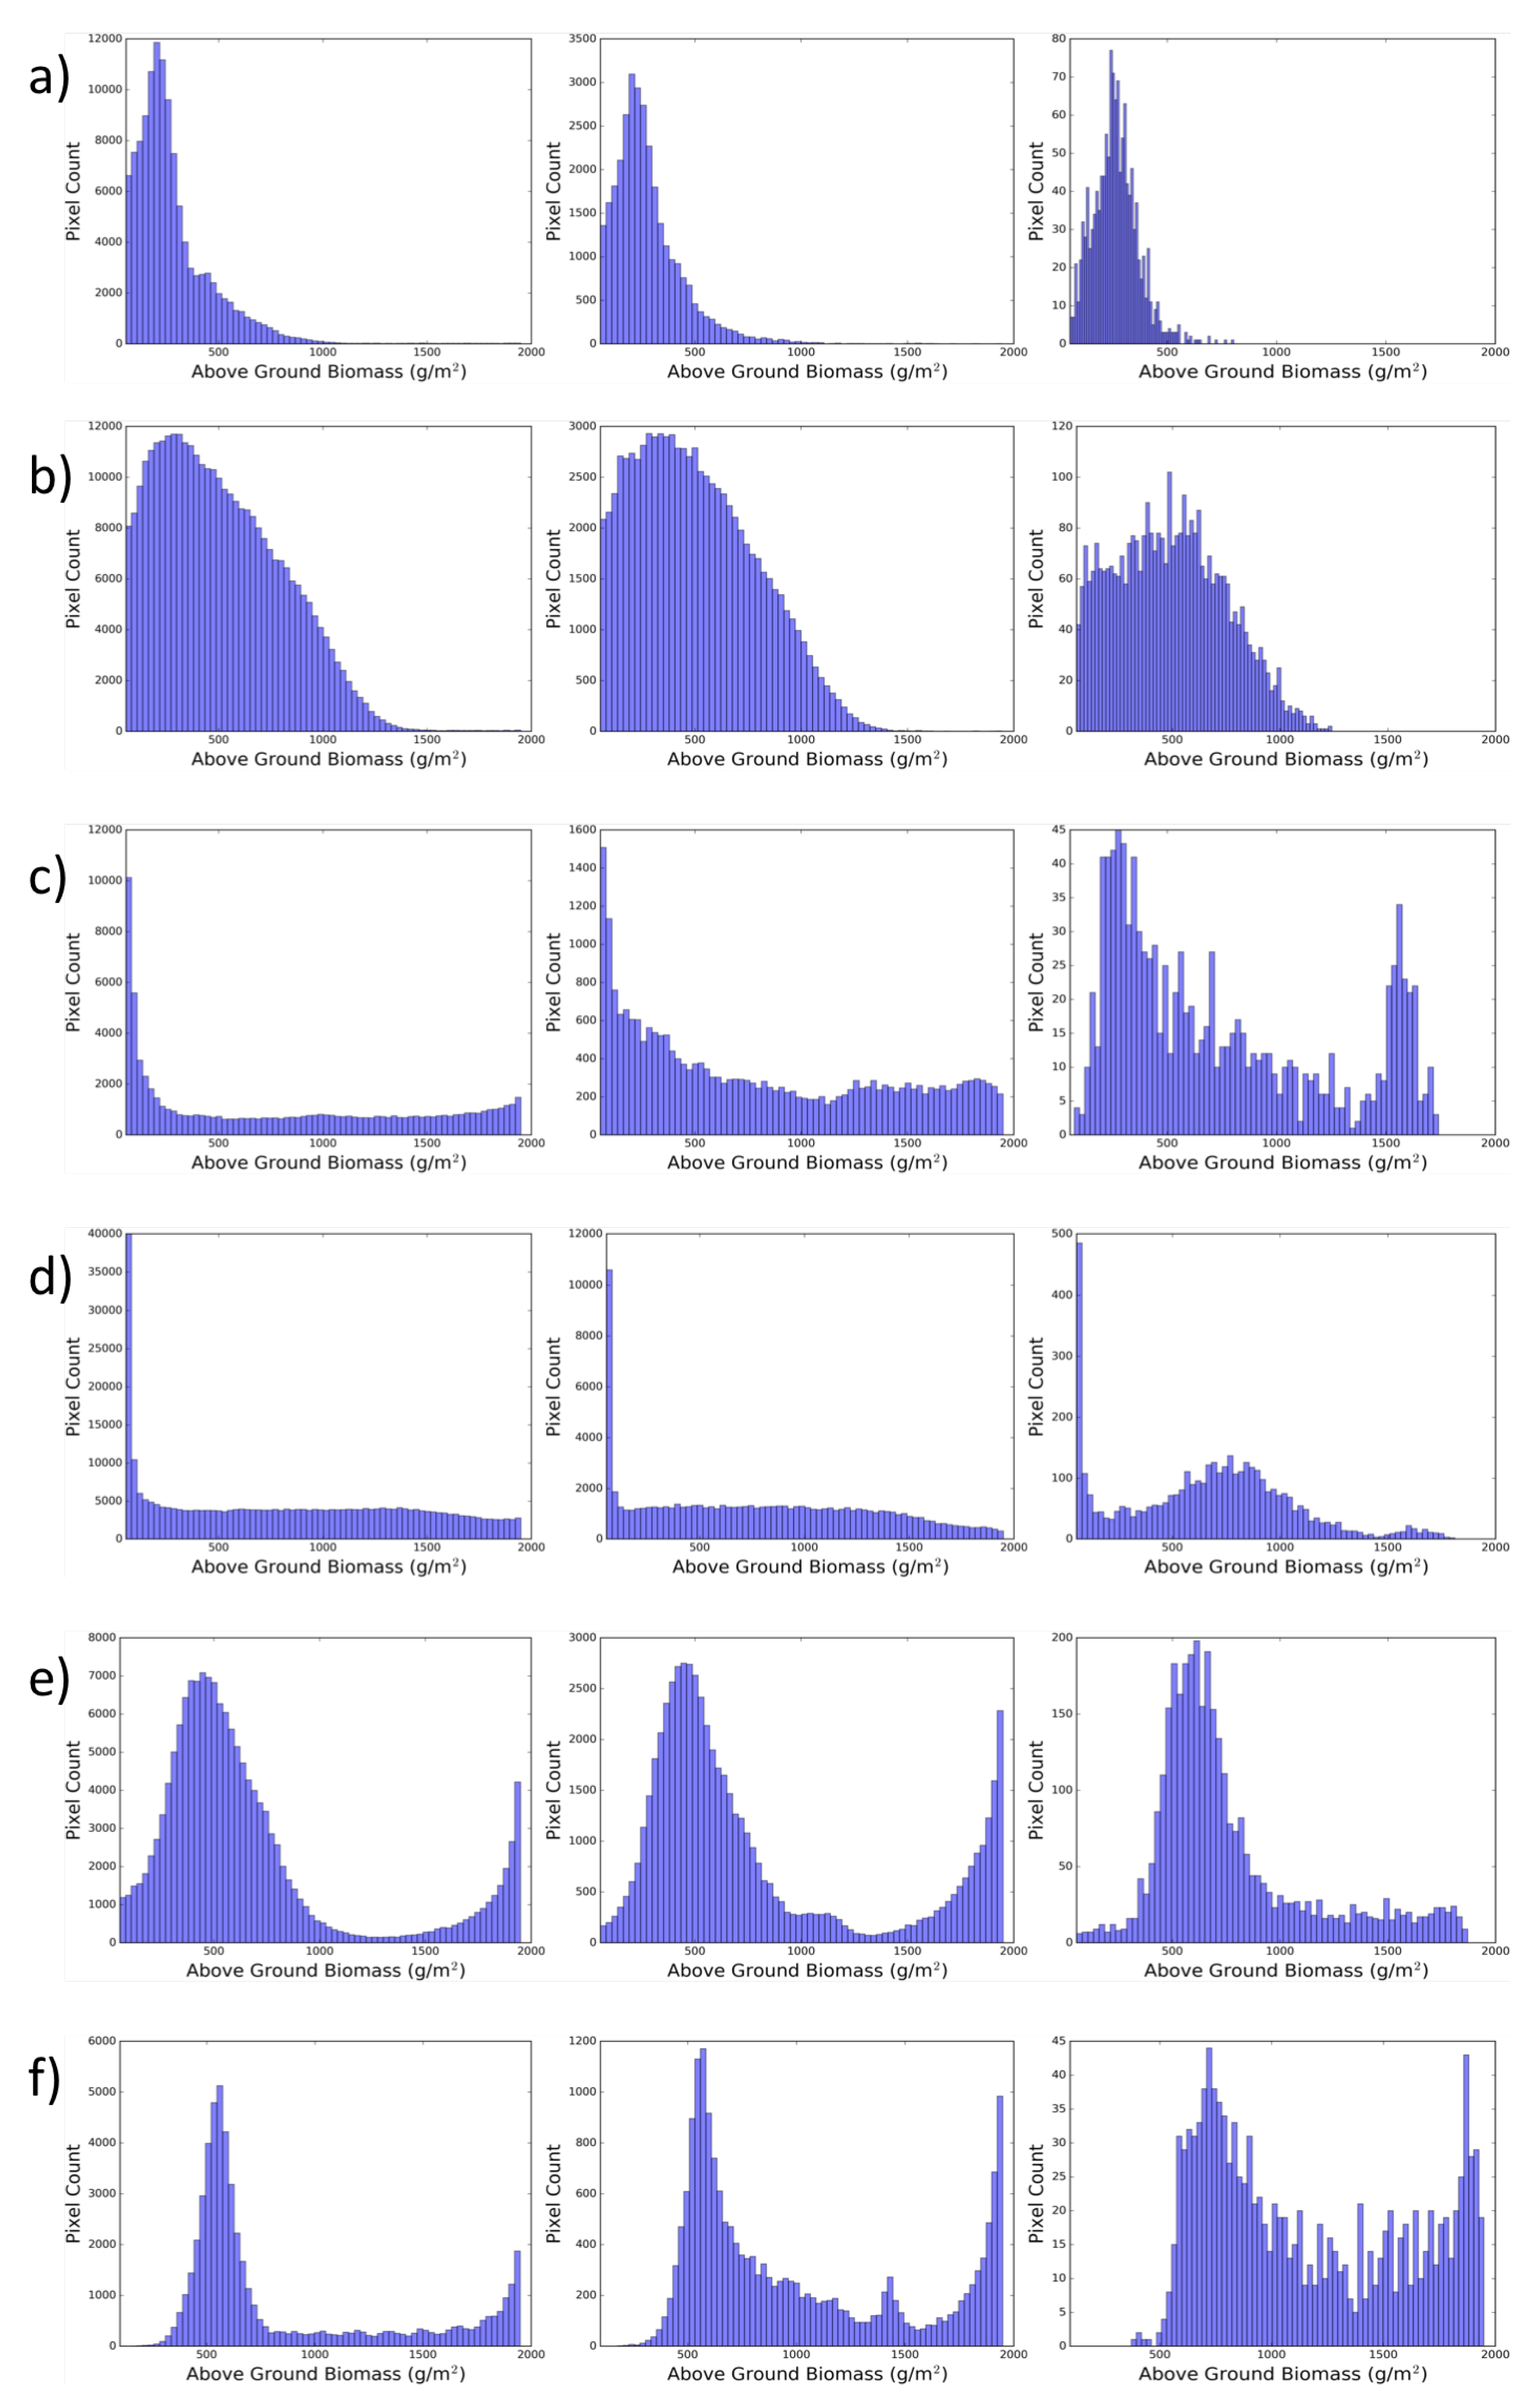
| Spatial Resolution | Mean | Standard Deviation | Skewness | Kurtosis |
|---|---|---|---|---|
| Marsh Site: 1850 “Short Zone at Panne Edge” | ||||
| 1 | 288 | 203 | 2.56 | 11.43 |
| 2 | 284 | 174 | 2.29 | 9.98 |
| 3 | 270 | 108 | 0.94 | 2.23 |
| Marsh Site: 1850 “Tall Zone at Creekbank” | ||||
| 1 | 481 | 295 | 0.66 | −0.087 |
| 2 | 473 | 901 | 0.58 | −0.38 |
| 3 | 452 | 257 | 0.37 | −0.70 |
| Marsh Site: 1974 “Medium Zone at Lagoon Edge” | ||||
| 1 | 841 | 641 | 0.22 | −1.41 |
| 2 | 793 | 566 | 0.40 | −1.12 |
| 3 | 732 | 444 | 0.62 | −0.72 |
| Marsh Site: 1974 “Short Zone With Hummock” | ||||
| 1 | 822 | 584 | 0.21 | −1.23 |
| 2 | 786 | 535 | 0.26 | −1.05 |
| 3 | 656 | 396 | 0.25 | −0.27 |
| Marsh Site: 2011 “Tall Zone at Lagoon Edge” | ||||
| 1 | 683 | 480 | 1.53 | 1.35 |
| 2 | 801 | 552 | 1.05 | −0.35 |
| 3 | 773 | 365 | 1.25 | 1.06 |
| Marsh Site: 2011 “Medium Zone with Die-off” | ||||
| 1 | 858 | 501 | 1.13 | −0.28 |
| 2 | 1008 | 507 | 0.69 | −0.99 |
| 3 | 1149 | 437 | 0.41 | −1.22 |
© 2019 by the authors. Licensee MDPI, Basel, Switzerland. This article is an open access article distributed under the terms and conditions of the Creative Commons Attribution (CC BY) license (http://creativecommons.org/licenses/by/4.0/).
Share and Cite
Eon, R.S.; Goldsmith, S.; Bachmann, C.M.; Tyler, A.C.; Lapszynski, C.S.; Badura, G.P.; Osgood, D.T.; Brett, R. Retrieval of Salt Marsh Above-Ground Biomass from High-Spatial Resolution Hyperspectral Imagery Using PROSAIL. Remote Sens. 2019, 11, 1385. https://0-doi-org.brum.beds.ac.uk/10.3390/rs11111385
Eon RS, Goldsmith S, Bachmann CM, Tyler AC, Lapszynski CS, Badura GP, Osgood DT, Brett R. Retrieval of Salt Marsh Above-Ground Biomass from High-Spatial Resolution Hyperspectral Imagery Using PROSAIL. Remote Sensing. 2019; 11(11):1385. https://0-doi-org.brum.beds.ac.uk/10.3390/rs11111385
Chicago/Turabian StyleEon, Rehman S., Sarah Goldsmith, Charles M. Bachmann, Anna Christina Tyler, Christopher S. Lapszynski, Gregory P. Badura, David T. Osgood, and Ryan Brett. 2019. "Retrieval of Salt Marsh Above-Ground Biomass from High-Spatial Resolution Hyperspectral Imagery Using PROSAIL" Remote Sensing 11, no. 11: 1385. https://0-doi-org.brum.beds.ac.uk/10.3390/rs11111385