1. Introduction
Accurate identification of tropical forest species would support a more accurate measure of several important species-dependent environmental variables, such as above-ground biomass and carbon uptake [
1]. Currently, large uncertainties exist in estimates of biomass and carbon uptake for tropical forests [
2]. An improved species inventory leading to better biomass estimates could improve current carbon budget measurements, leading to more accurate carbon offset programs [
3]. The use of remote sensing imagery for forest analysis has a long history, from the use of the legacy Landsat systems [
4], to contemporary imaging systems such as Landsat 8 [
5], Sentinel 2, and high-resolution commercial imaging systems [
1,
6]. In addition, many studies have attempted to use remotely sensed imagery for tree type identification in complex tropical forest assemblages [
4,
7].
Many pixel-based classification studies have used several different classification processes (e.g., maximum likelihood, spectral angle mapper, support vector machine, random forest, etc.) to determine which method works best in different types of forests, but with minimal success [
8,
9,
10]. Most pixel-based tropical forest studies generated accuracies ranging from 42–74%, depending on the forest assemblage and environments studied [
8,
9,
10]. Some features, such as tree canopies, are typically not homogeneous, which can lead to a reduction of separability between other features [
9]. This can lead to poor feature definition and low classification accuracies [
11].
As pixel-base approaches have been the standard for remote sensing classification, Geospatial Object-Based Image Analysis (GEOBIA) has made significant advances in the last decade and has proven to be superior to pixel based approaches [
12,
13]. Many studies have also evaluated various types of machine learning methods, such as Random Forest (RF), decision trees, Support Vector Machines (SVM) and Artificial Neural Network (ANN) schemas. Utilizing the entire tree canopy (including all of the nuanced variances in the tree crown) rather than individual pixels within the crown or even individual leaves, has proven to be a more accurate method for a classifying complex features such as tree canopies [
14]. High spatial resolution imagery can provide multiple pixels per tree canopy, and a segmentation process performed on such an image can yield (with careful tuning of parameters) clusters of pixels that represent single-tree canopy tops. This cluster of pixels, when averaged, contains higher-fidelity representation of the overall canopy reflectance. Object-based classification methods can also add additional whole-object information beyond spectral content such as shape, size, pixel variability and proximity to other objects [
9,
13] that can provide critical information to identify objects even in the case of non-homogeneity within a defined object. With the introduction of high resolution imagery (nearing 1 m spatial resolution), the application of a segmentation process to identify image objects has been successfully extended to vegetation studies, specifically for the identification of canopy tree types within a forest [
13].
Regarding object-based classification, Clark et al. [
15] achieved an 87.4% classification accuracy in their study of a tropical forest regime in Costa Rica when using an object-based approach through a Random Forest classifier. Others have directly compared the pixel-based approach to the objects based approach, with the object-based approach achieving superior results in a complex forest setting [
14,
15,
16]. Immitzer et al. [
12] used a random forest classifier to compare pixel based versus object-based classification in an Austrian mixed forest using Worldview-2 image data. Manually extracted tree crown data provided ground truth from known tree locations in the study area. An object-based random forest approach provided the highest classification accuracy at 82.4% and the pixel-based classification was on average 10 percentage points lower in accuracy.
An option for a GEOBIA application is a rule-set object-based approach which provides the ability of user input on variable importance and ranges of variable response to better characterize features [
17]. The success of this technique depends heavily on the data input types and the segmentation procedure to accurately define the objects being classified. Myint et al. [
18] used a rule-set object-based classification to quantify mangrove extent in Bangladesh using Landsat imagery and achieved an overall accuracy of 84.1%, but the authors noted that the settings for segmentation and rules applied to the particular study might not be suitable for other study areas. They also discovered that more bands included in the classification process did not equate to higher accuracies but instead led to lower accuracies due to signature confusion related to high correlation between certain Landsat bands. Additionally, Ke et al. [
19] used a rule-based classification to map forests in New York State by using both QuickBird imagery and LiDAR data (tree height measurements) for both the segmentation and rule-set data input. Classification of four specific evergreen species and a broad deciduous species group yielded an accuracy of near 90%. The addition of height information from the LiDAR data increased classification accuracy by approximately 10%, supporting the premise that more and diverse data sets of a study area increases the classification accuracy [
19].
In addition, traditional statistical techniques such as Multinomial Logistics Regression and Linear Discriminant Analysis [
15,
16,
20,
21,
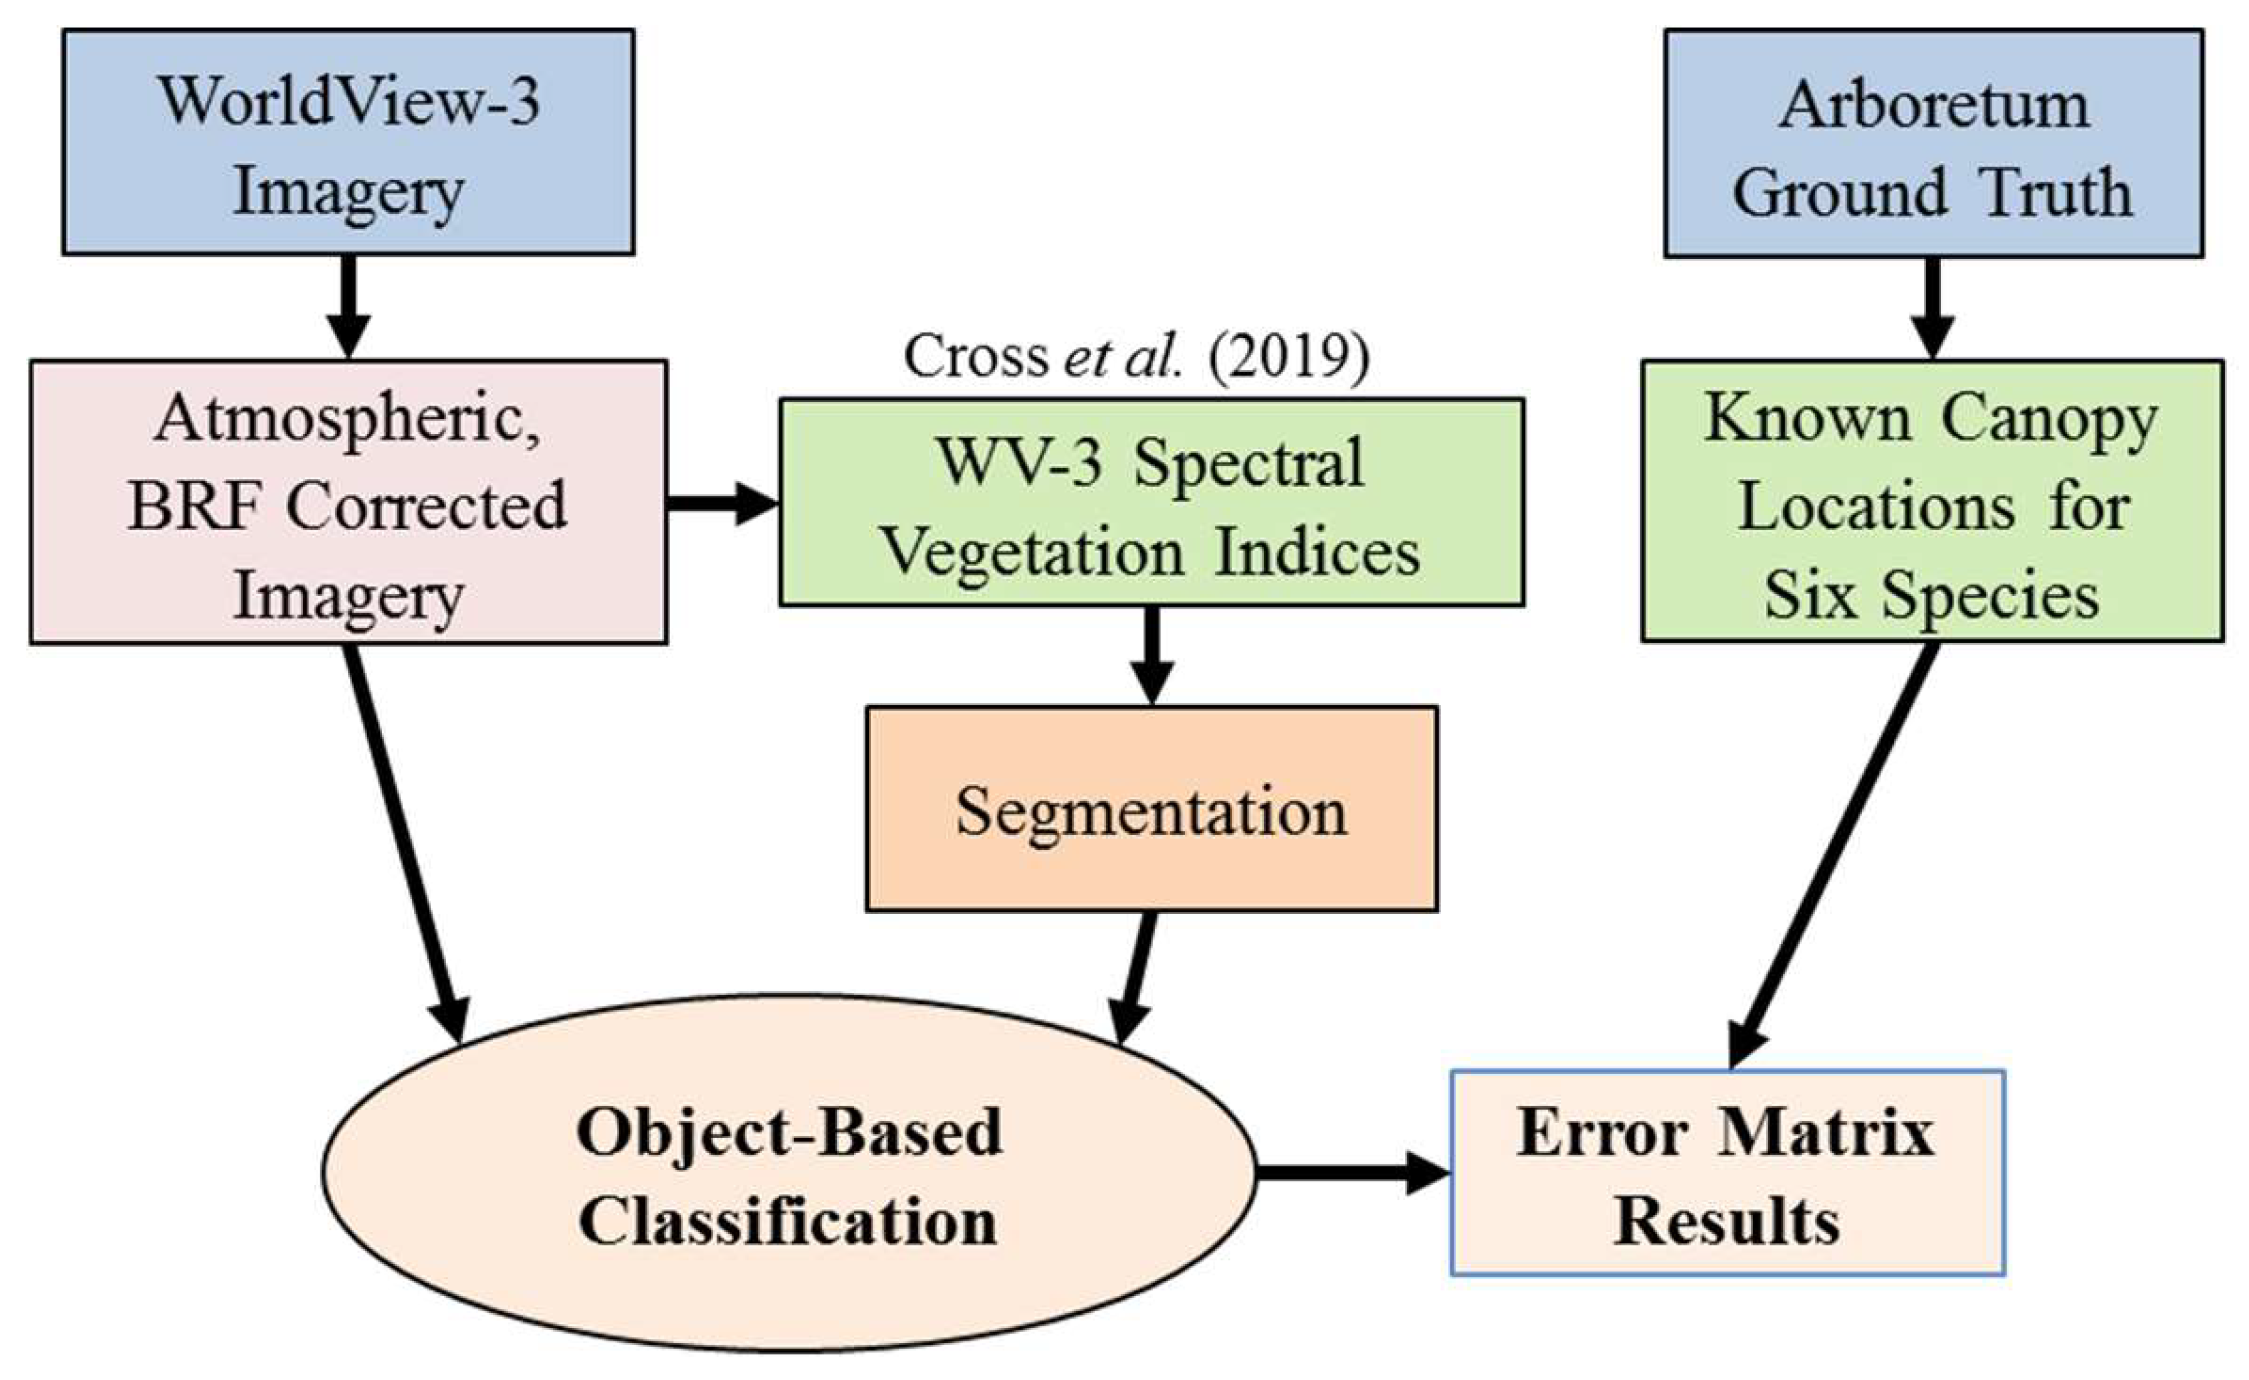
22] have had some success to assist in determining the best combination of data types for classification purposes. Cross et al. [
20] used a Discriminant Analysis with a Wilks’ Lambda test to analyze WorldView-3 bands and 14 distinct Spectral Vegetation Indexes (SVIs) in their discriminatory power to differentiate tropical forest tree types in Costa Rica.
Any process of classification of tropical vegetation would need to account for a variety of variables that control intra-species and inter-species variations [
11]. Seasonality is an important consideration in any study of the tropical rainforest. Hesketh et al. [
23] showed that all data used for classification purposes should be constrained to one of the seasons (wet or dry) as inter-seasonal variability is typically low (with a dry season preference due to showing more differences between features consistently through the season) but variability between seasons is high. Castro et al. [
24] also reported this effect, where classifying using data from various seasons or sites can reduce classification accuracy substantially. In addition, lianas can significantly skew the tree crown spectral signature for a given species at the leaf level, and possibly at, the crown level [
11,
23].
In this study, we build on our previous research [
20,
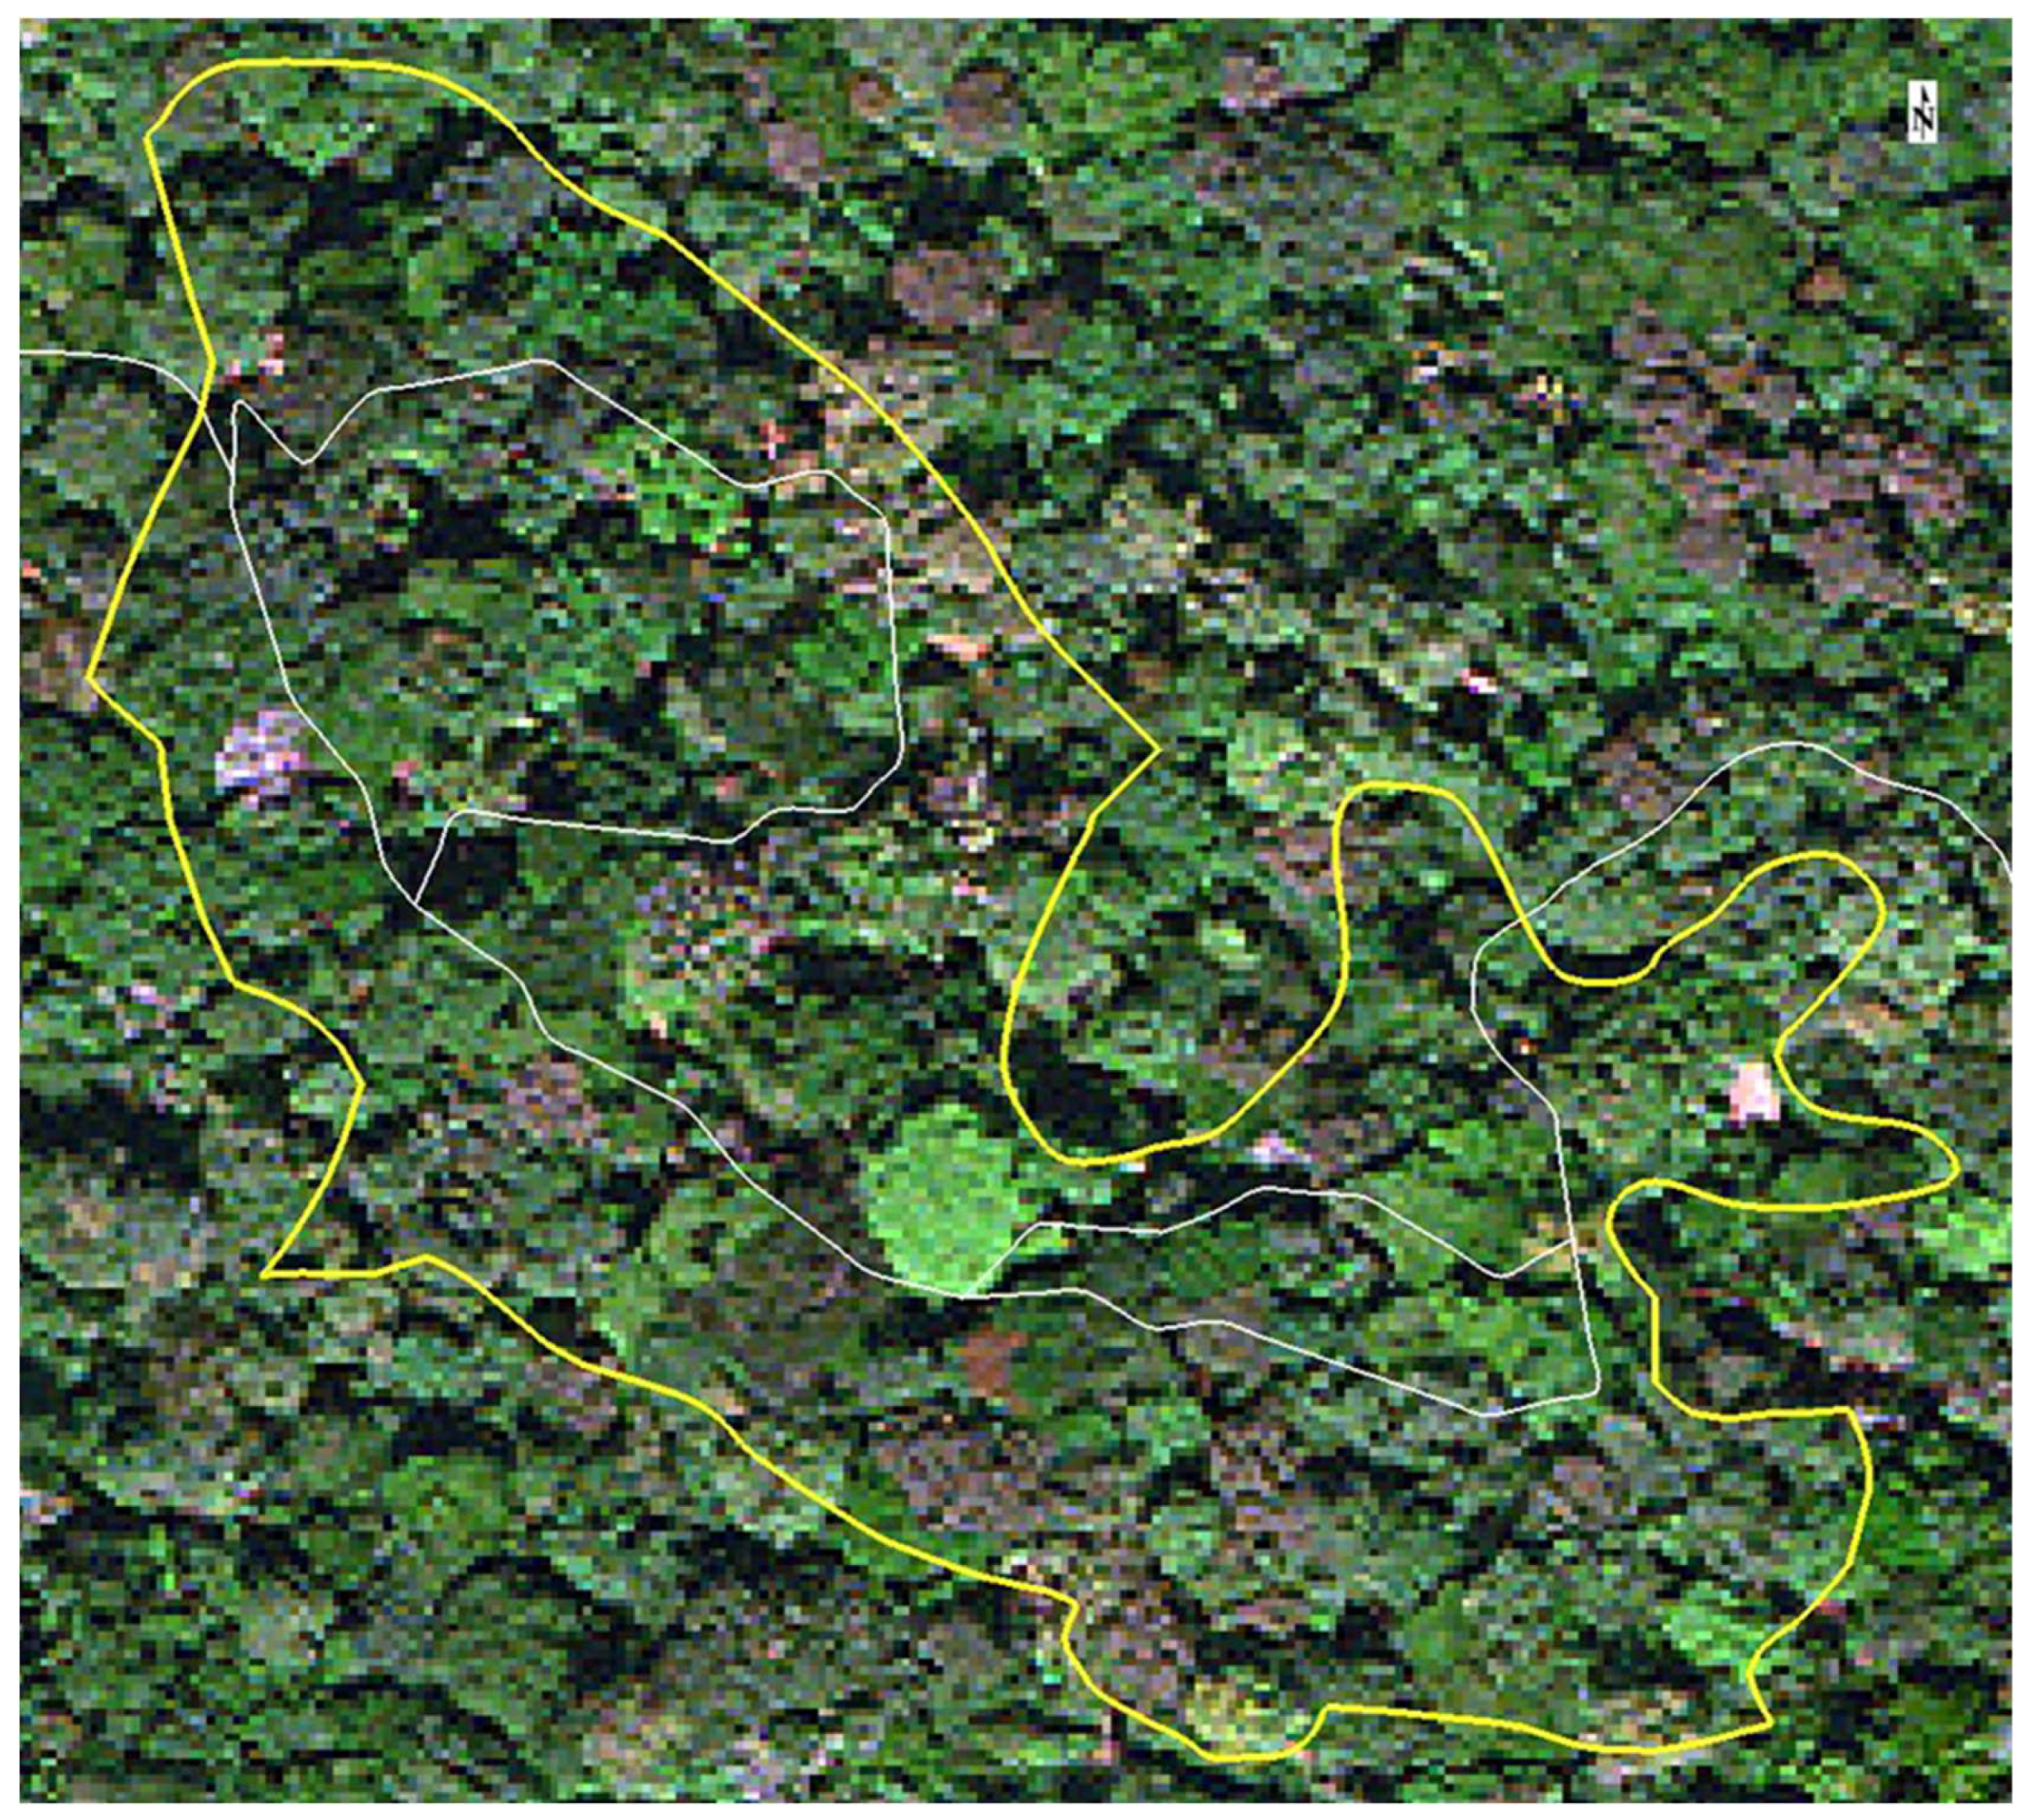
25], which determines effective data types for species differentiation and validates WorldView-3 as a viable data source for differentiating tree species respectively, to move the current research forward by utilizing very high resolution image-derived data products in a rule-set object-based classification for accurate identification of tropical forest species. This process contrasts to the complex approaches stated above, where affordable multispectral imagery and a simple, straightforward approach is utilized to differentiate tree species. This approach employed the information from several WorldView-3 image bands and two WorldView-3 image spectral vegetation indices derived in Cross et al. [
20] to identify six different tropical forest species in Costa Rica. All data and imagery collected was constrained to the dry season minimizing any variance [
23]. Illumination and view angle corrections, and the application of an atmospheric compensation procedure, assisted in creating an accurate forest canopy reflectivity image data set. Guidance on the makeup of the segmentation settings [
9,
18,
26,
27] allowed an accurate classification of tree species within the study site.
3. Results and Discussion
The first classification analysis performed (Classification 1) assessed all bands and SVIs available for the process, excluding the Coastal band and Blue band, as both of these bands are unreliable for use in a humid tropical environment as they are susceptible to severe atmospheric attenuation [
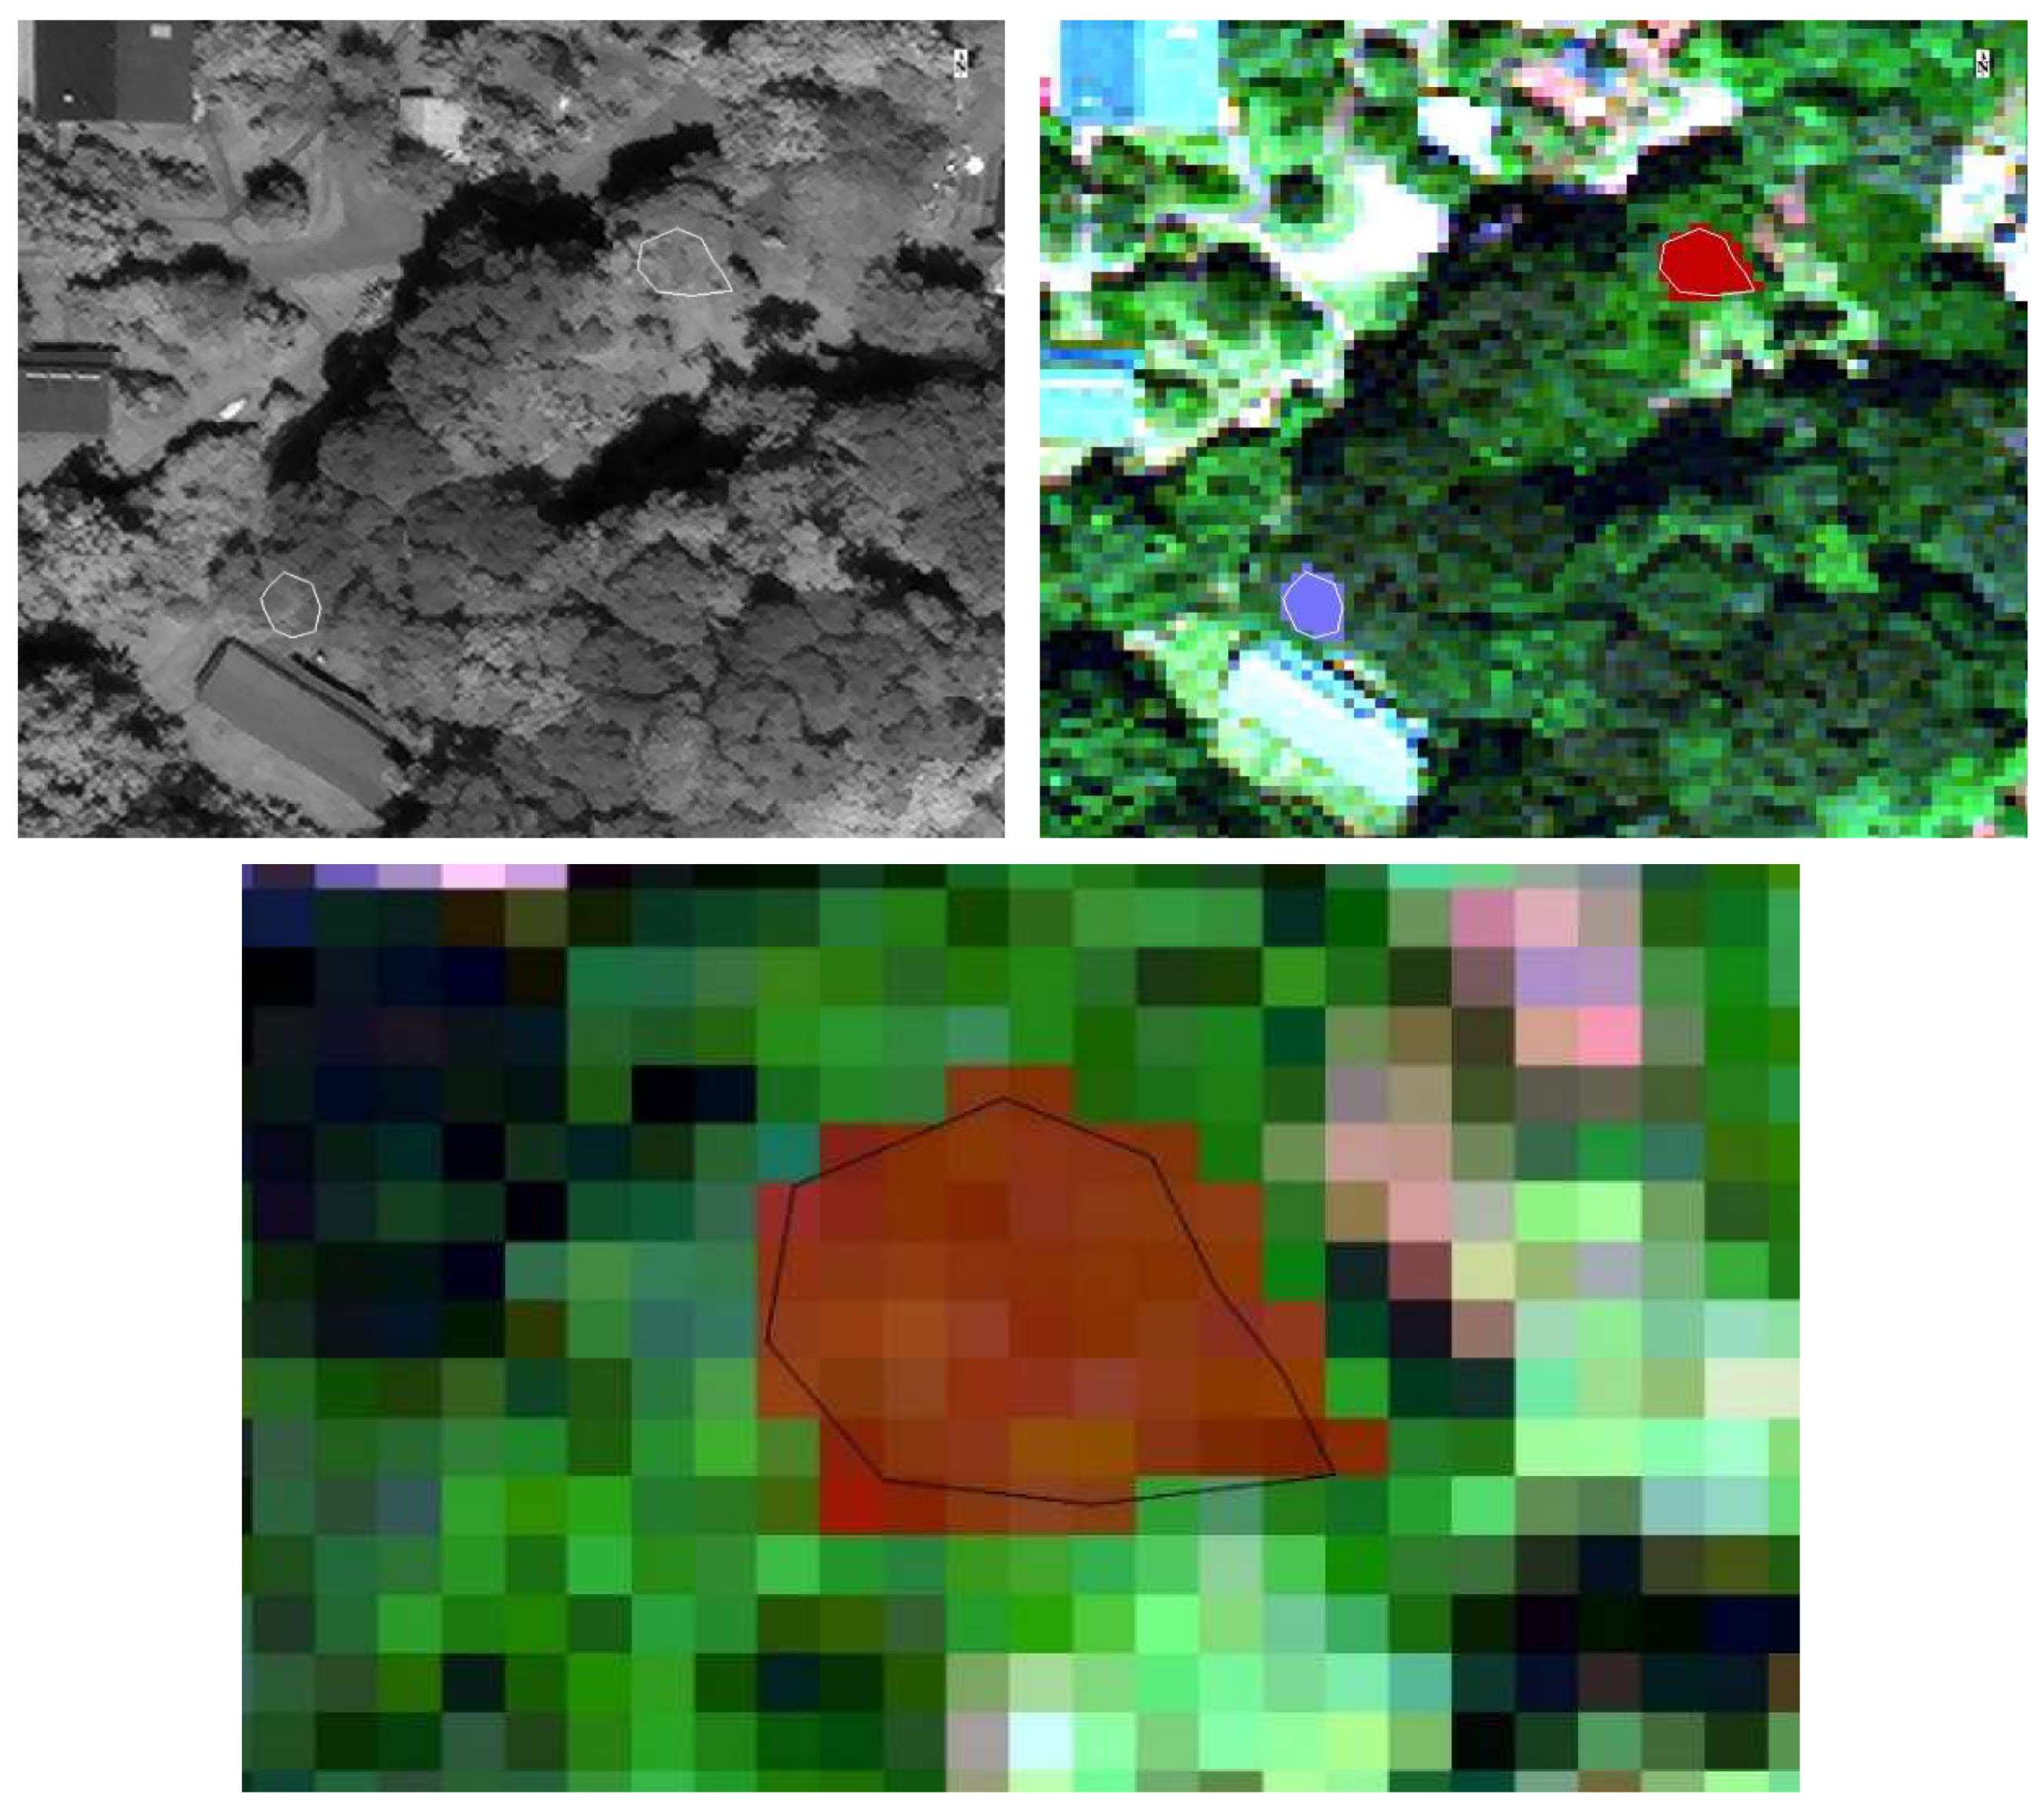
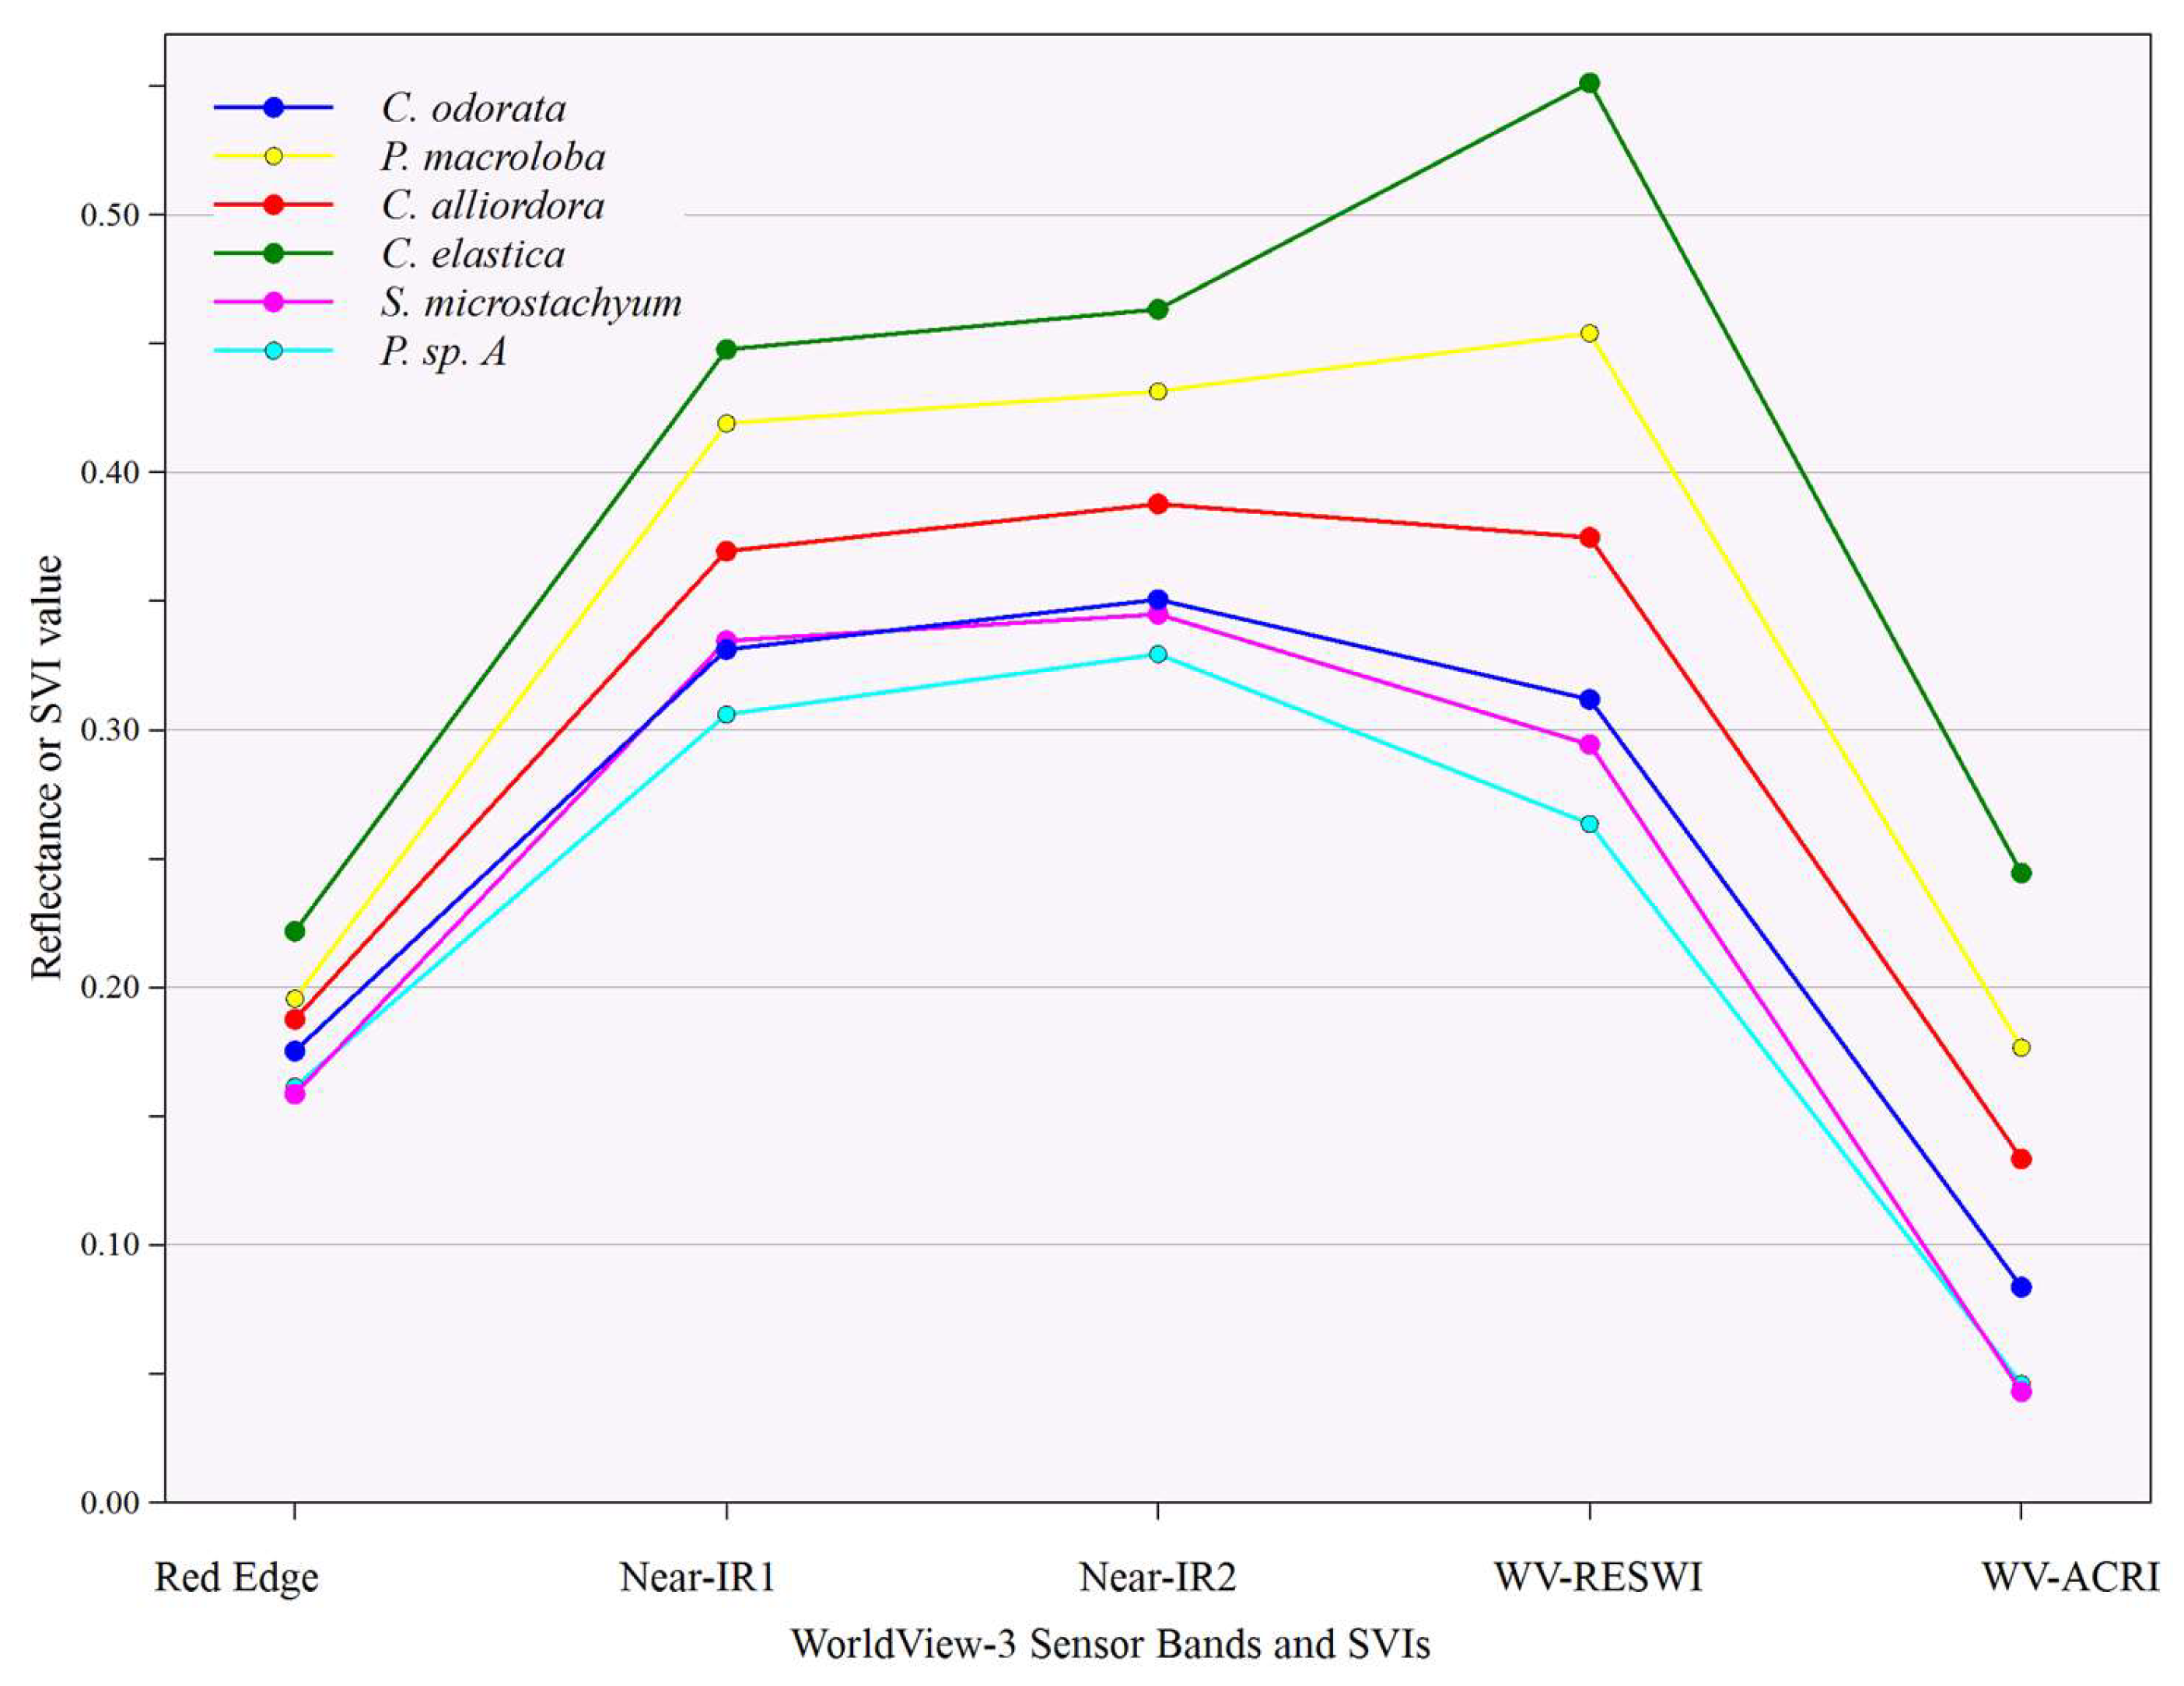
46]. The data input for Classification 1 included only the top three image bands (Red Edge, Near-IR1 and Near-IR2) and the top SVI (WV-RESWI), based on the Wilk’s Lambda scores and Correlation values.
Table 6 shows the results of the error matrix of Classification 1. An “Unknown” classification result was specified to represent trees or ground cover not included in the error matrix analysis.
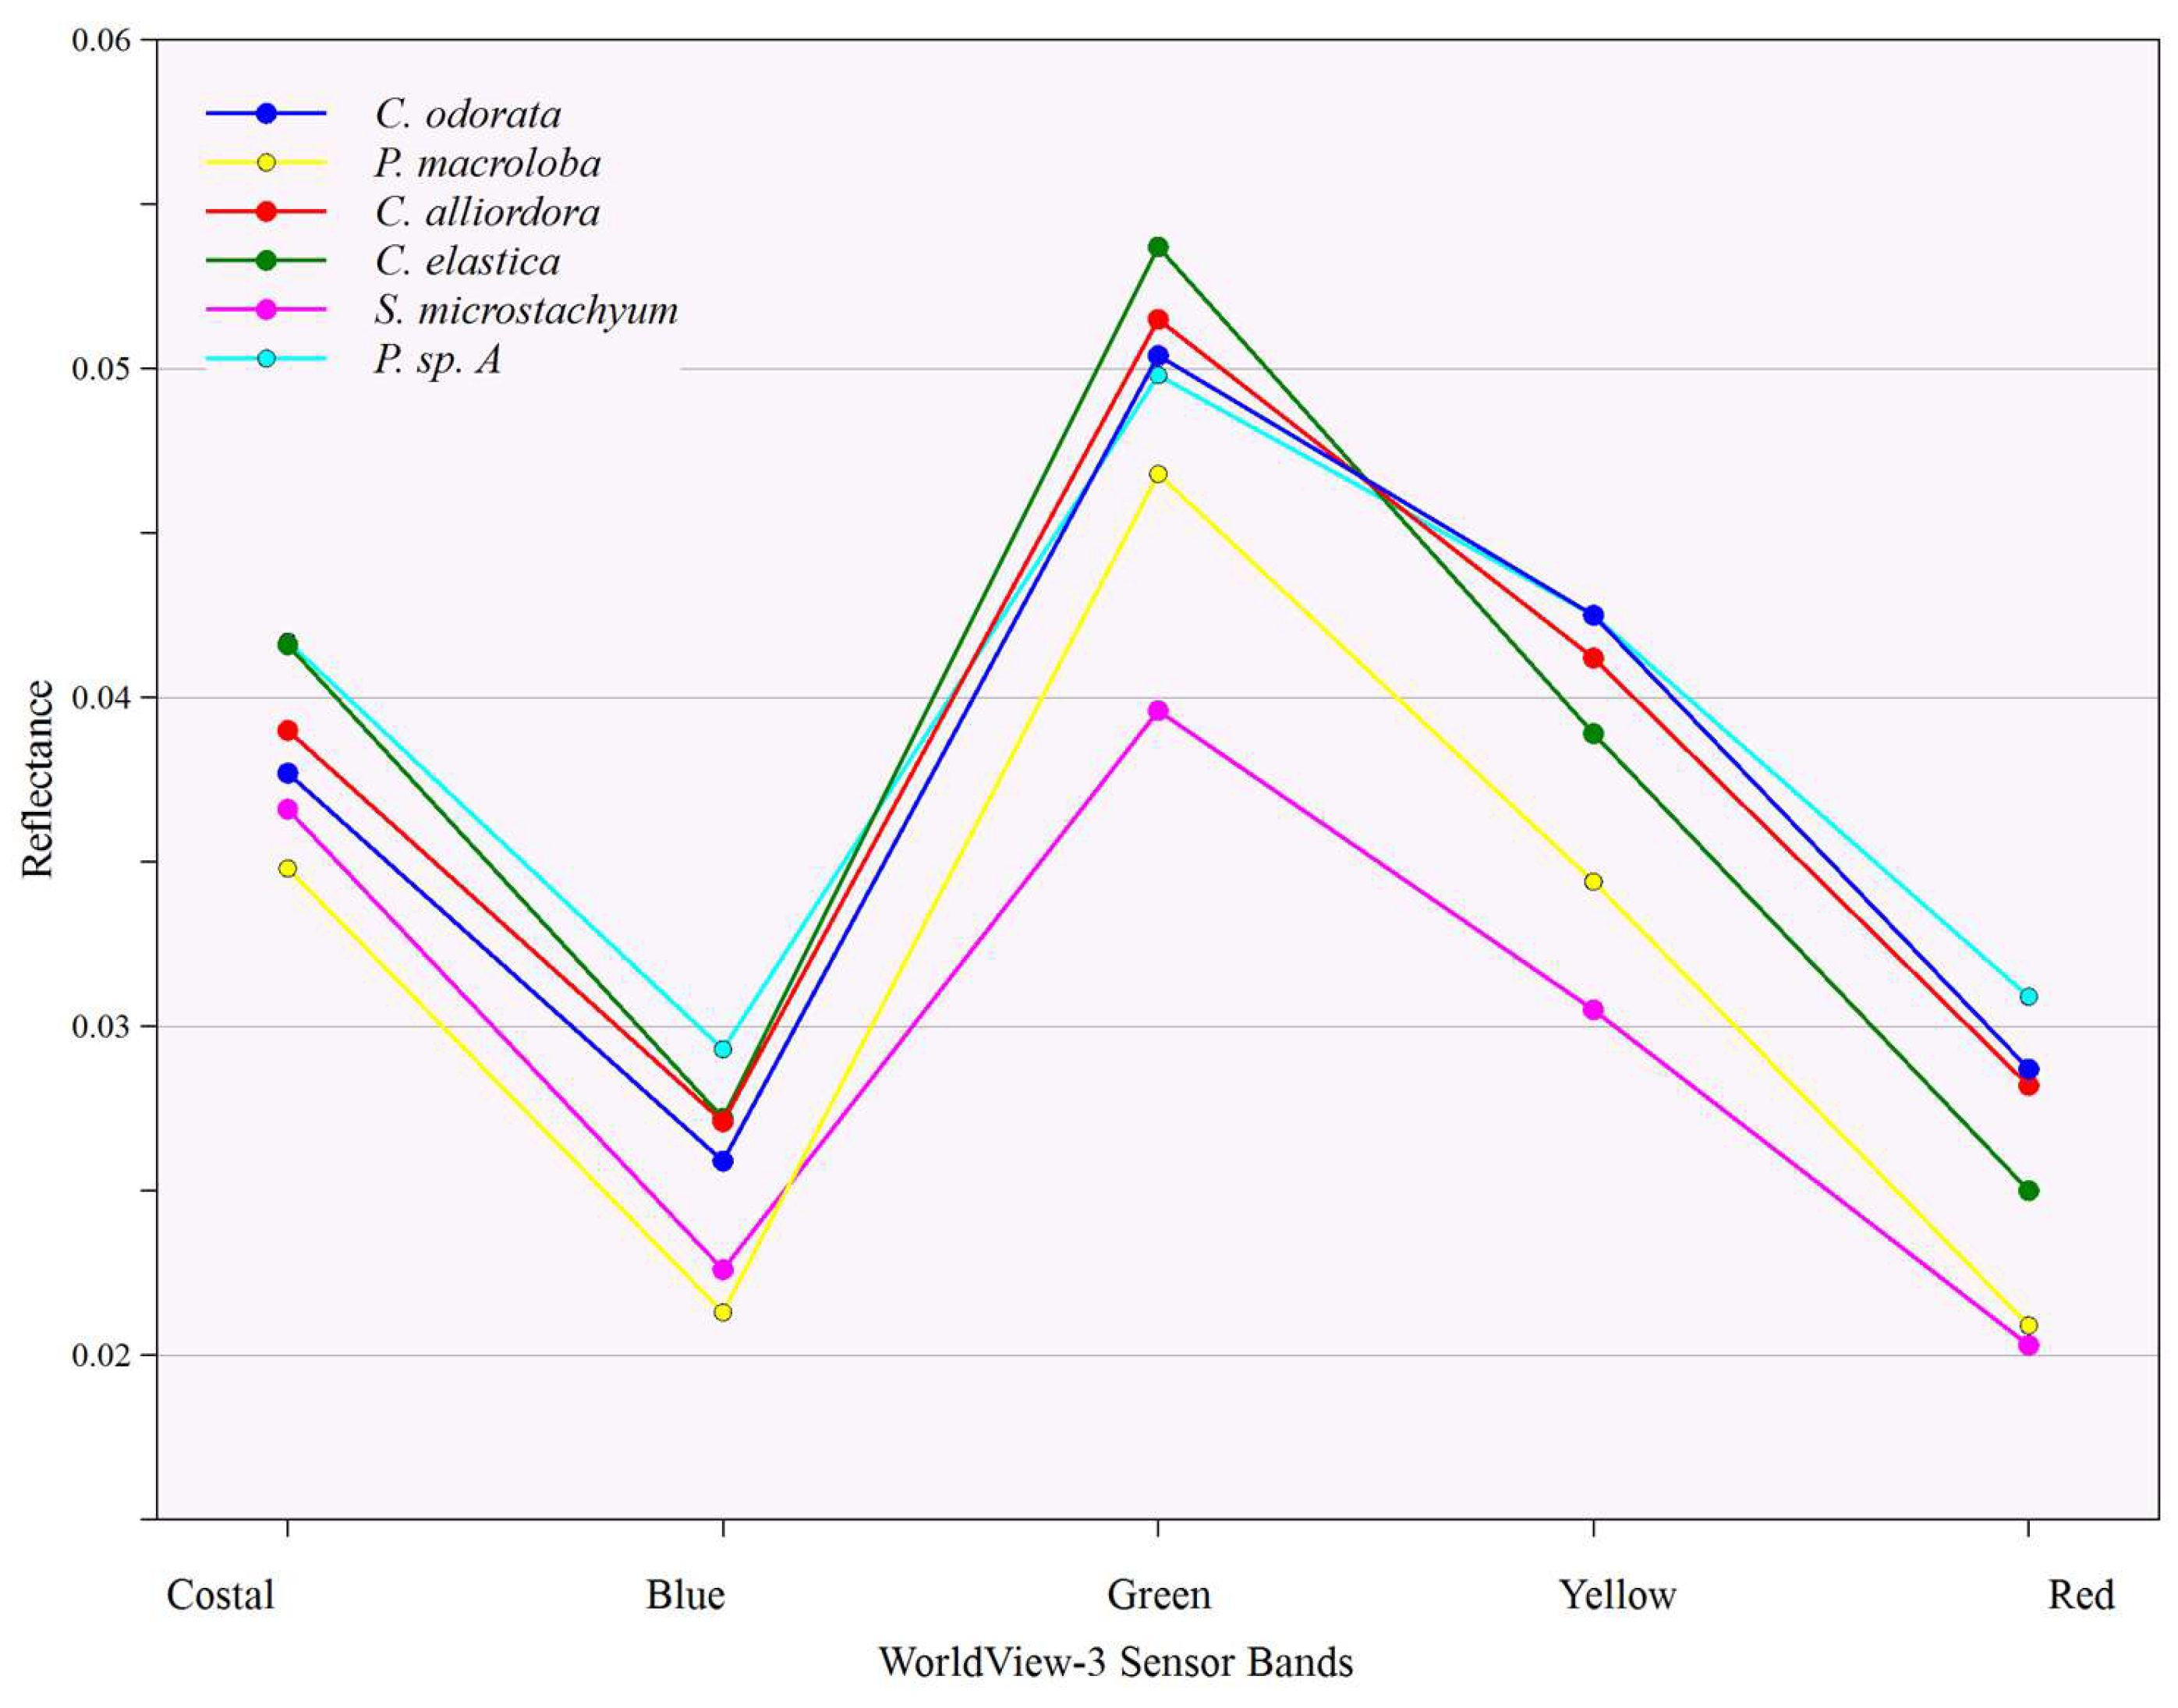
Classification 2 included additional bands and SVIs based on information from
Table 4 and
Table 5, and the visual separation of values as shown in
Figure 5 and
Figure 6. For each tree species, rule weights varied for each data input in the classification rule-set. These were based on the combination of bands or SVIs that best defined a particular species, improving the classification accuracy. The error matrix results of Classification 2 are shown in
Table 7.
As is evident from the error matrix results, the WorldView-3 imagery captured the spectral variations between the tree species studied. The low errors of commission (7.89%) and omission (14.63%) in the error matrix for Classification 2 (
Table 7) suggest that the segmentation parameters and rule-sets chosen maximized the unique species reflectivity response in the imagery.
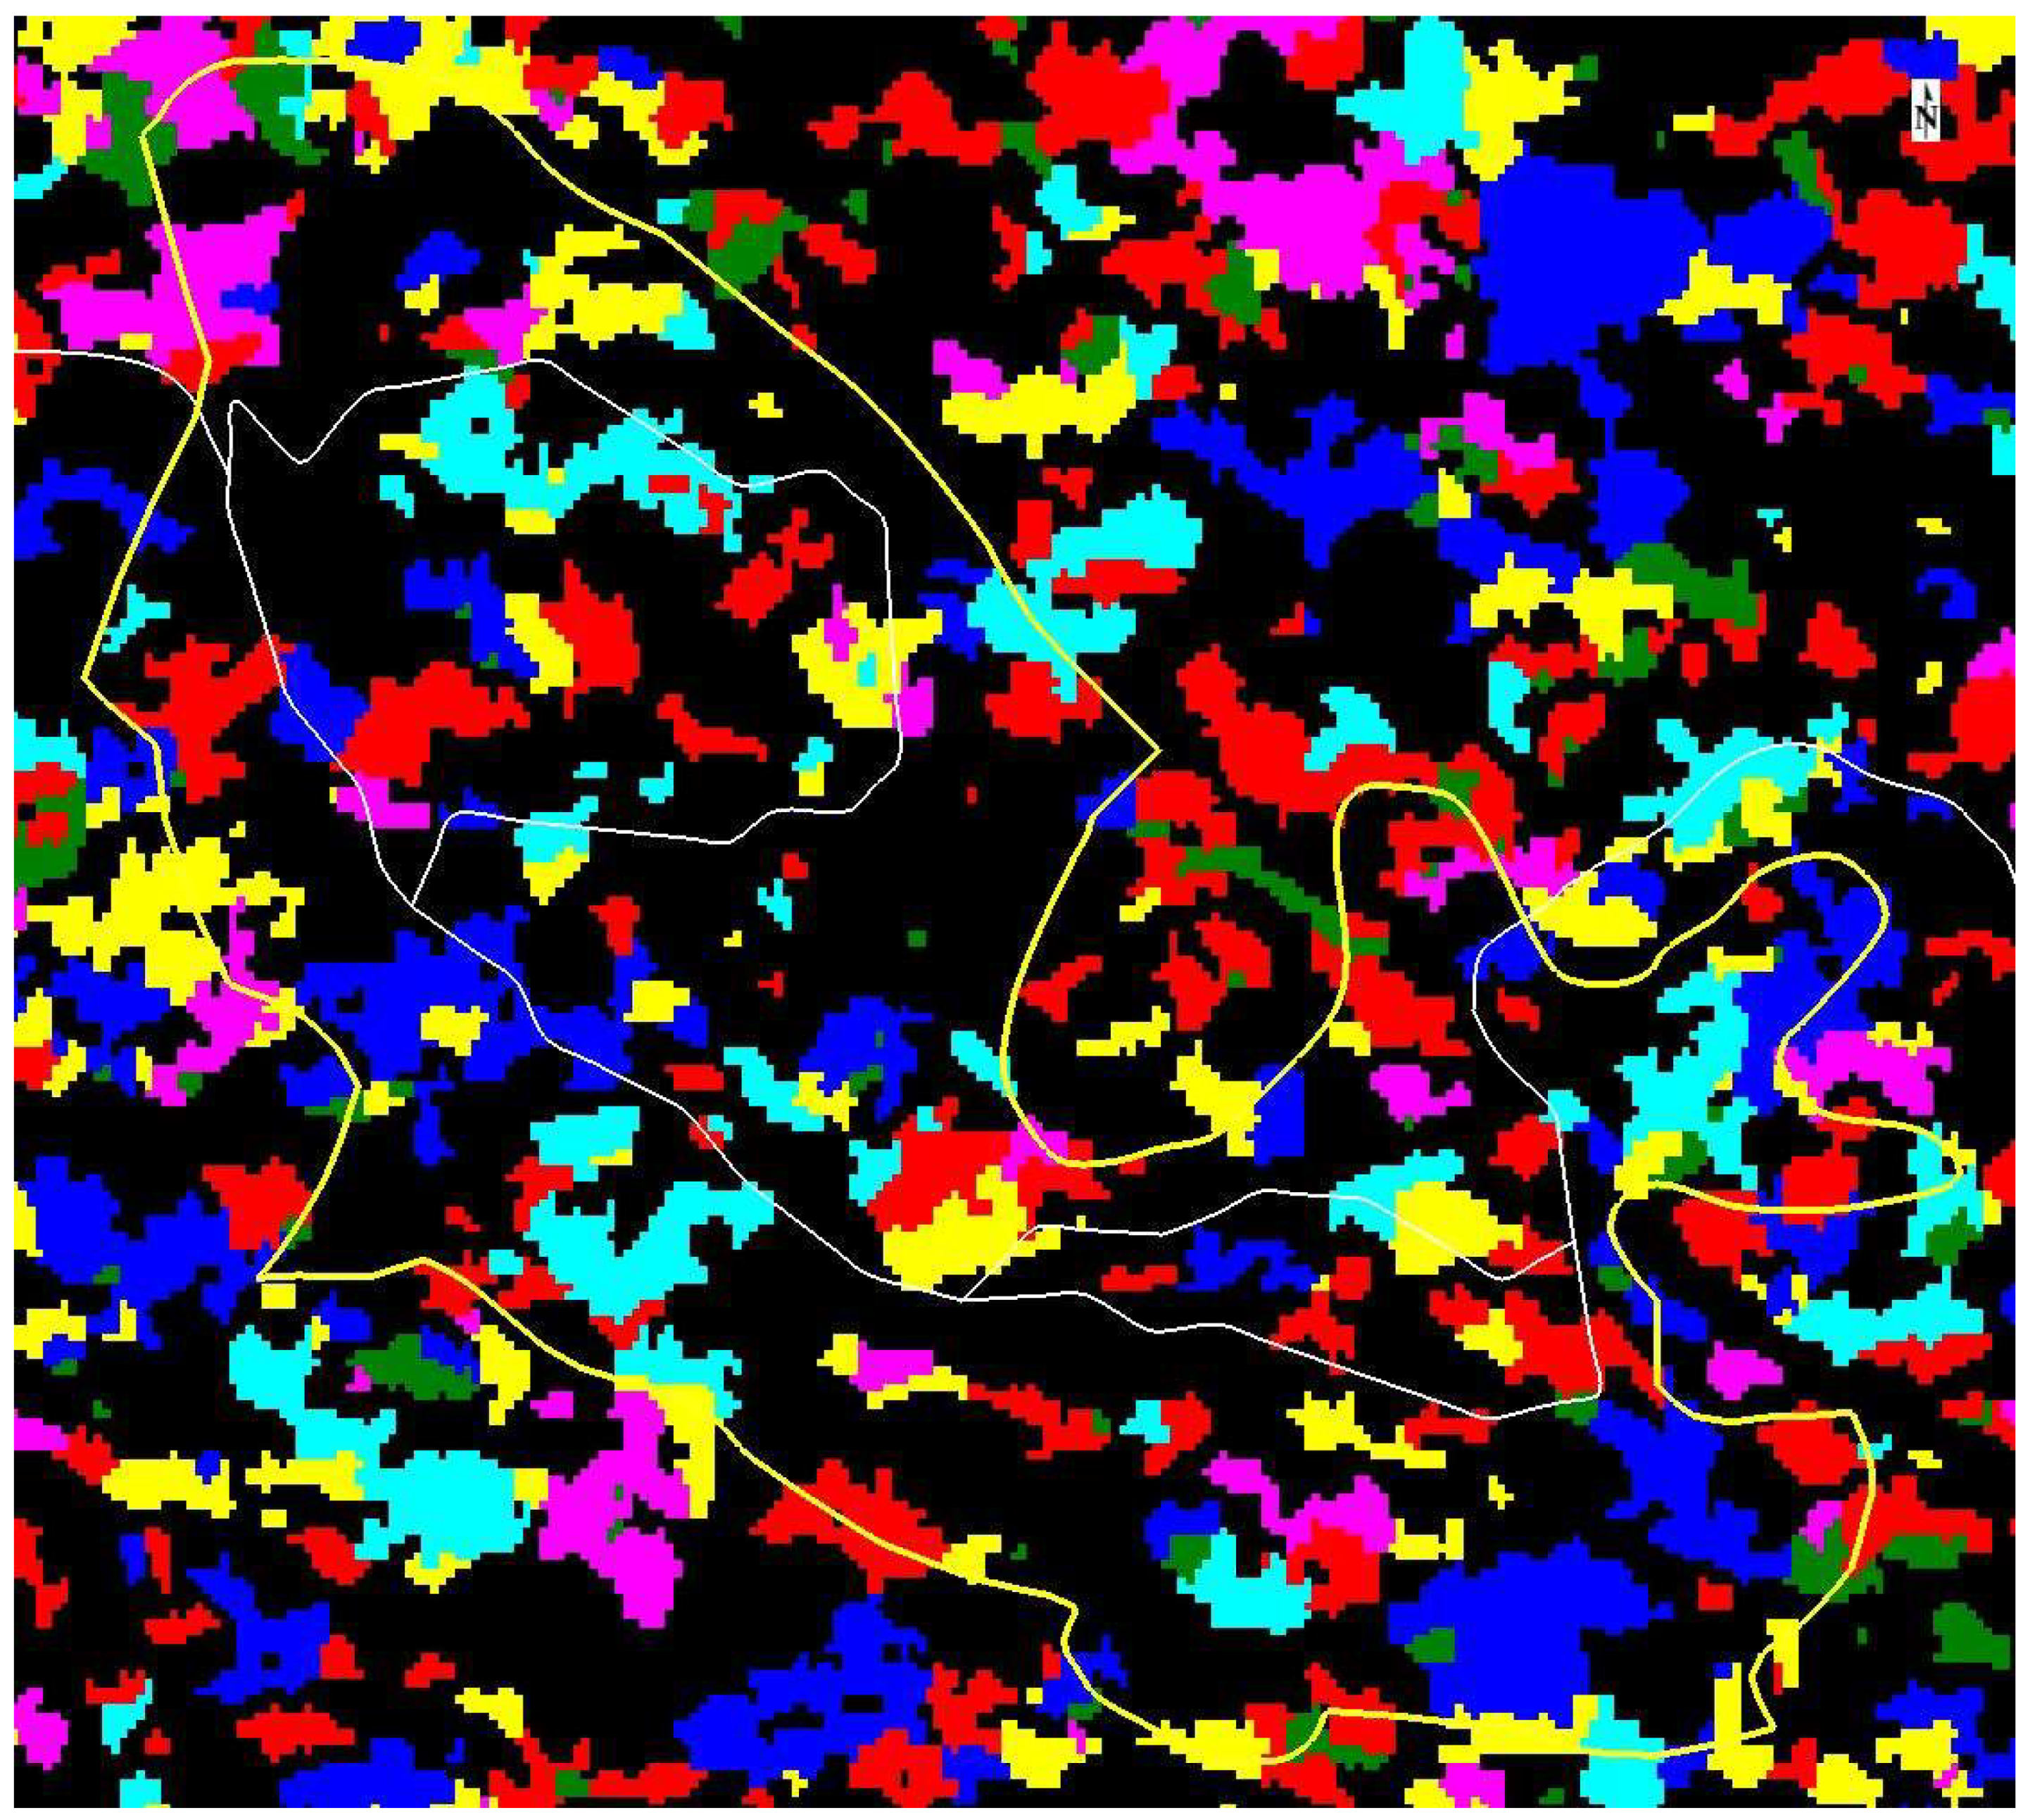
Figure 8 illustrates the distribution of species in and around the Arboretum as defined by Classification 2.
Miss-classifications could be the result of shadowing within the Arboretum image due to the off-nadir WorldView-3 image acquisition at 26.2° zenith view angle (
Table 1), as foreground tree crowns likely obscured or shadowed other possible canopy crowns. There is some evidence of this by the low Canopy Average values derived from the Arboretum (
Figure 4). Other variables, such as lianas suspended within the canopies studied, could have also affected classification accuracy [
23,
24], potentially adding to miss–classifications and increasing the unknown fraction in the error matrix.
Both SVIs significantly improved the segmentation process and overall classification accuracy outperforming all other bands available (
Figure 6,
Table 4,
Table 5). The WV-ACRI showed promise, but its overall performance was likely affected in this study due to suppressed Canopy Average values (
Figure 4). The WV-RESWI performed well in showing variability between the chlorophyll production and plant structure because of its focus on the Red Edge variability between species [
46].
Over-classifying individual crowns to a specific species was likely, as the rule-set process attempts to fit a tree type to a defined segment that represents all or part of a known tree crown within the study. The high classification accuracy from Classification 2 (85.37%) likely reflects this potential error, as the tree assemblage within the study area is extremely complex, as tree crowns can easily overlap creating confusion in the classification procedure.
Figure 8, which shows the geographical distribution of Classification 2 illustrates this effect, where
C. alliodora and
C. odorata are shown as widespread as
P. macroloba in the Arboretum based on the classification, but in truth
P. macroloba is the dominant species in this area [
28].
4. Conclusions
We sought to establish a process of differentiating selected crown-canopy tree species within the tropical forest regime through the implementation of an object-based rule set classification schema. The complexity of a tropical forest assemblage, both in species diversity and inter-species variability, poses a great challenge to identifying individual tree species [
2]. Successfully achieving a deeper understanding of the species assemblage within the tropical forest could improve our overall understanding of the role of forests in climate [
1]. The results of this study show that a simple object-based rule-set classification, using readily available multispectral data, can yield accurate results in a complex tropical rainforest.
Characterizing the intra-crown reflectivity response (using the collective pixels in a segment that defines the tree crown) is the key to identification of species in a complex forest [
63], as all of the information (and variability) within the tree crown is necessary information to identify tree-species within the forest assemblage. This provides a significant advantage as compared to pixel-based approaches, as the natural variability in the object (the tree canopy) is included in the characterization of the object [
12]. This study identified that the necessary components needed to achieve that goal are high spatial and radiometric resolution imagery (e.g., WorldView-3 or similar) with appropriate bands and/or data products [
20], careful corrections for illumination and attenuation-absorption effects [
25], and a segmentation process that properly assigns single-tree canopies to one (or a few) segmented pixel cluster(s). Continuing to improve the inputs to the object-based rule-set classification parameters (more precise segmentation, better data inputs through field measurements of more tree species) will be important steps in future analyses. This will ultimately contribute to accurately defining more tree species with their unique spectral signatures in other diverse tropical rainforest locations. It is envisioned that this simple, straightforward process can be expanded to more regional scale tropical environments.

 and
and 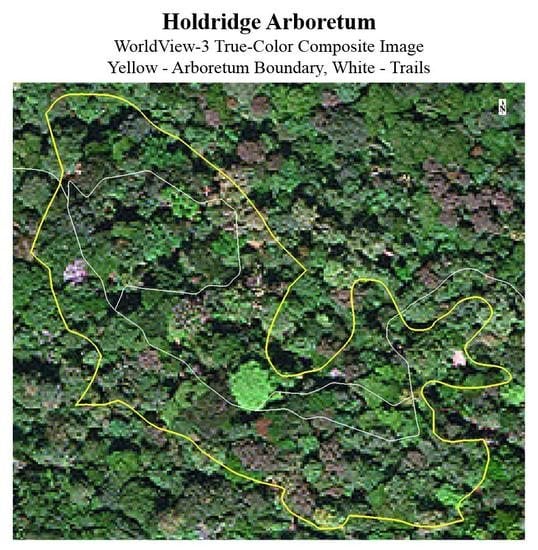


