IR Thermography from UAVs to Monitor Thermal Anomalies in the Envelopes of Traditional Wine Cellars: Field Test


Abstract
:
1. Introduction
2. A Brief Recap of IRT’s Key Issues
2.1. IRT in Building Inspection
2.2. Aerial IRT Inspection
3. Materials and Methods
3.1. Study Site
3.1.1. The Building
3.1.2. The Climate
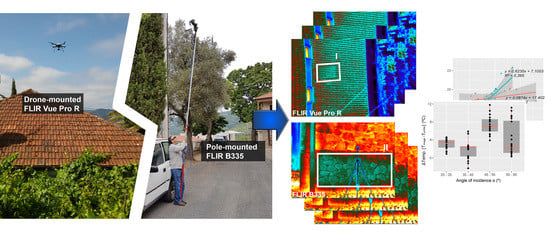
3.2. Equipment
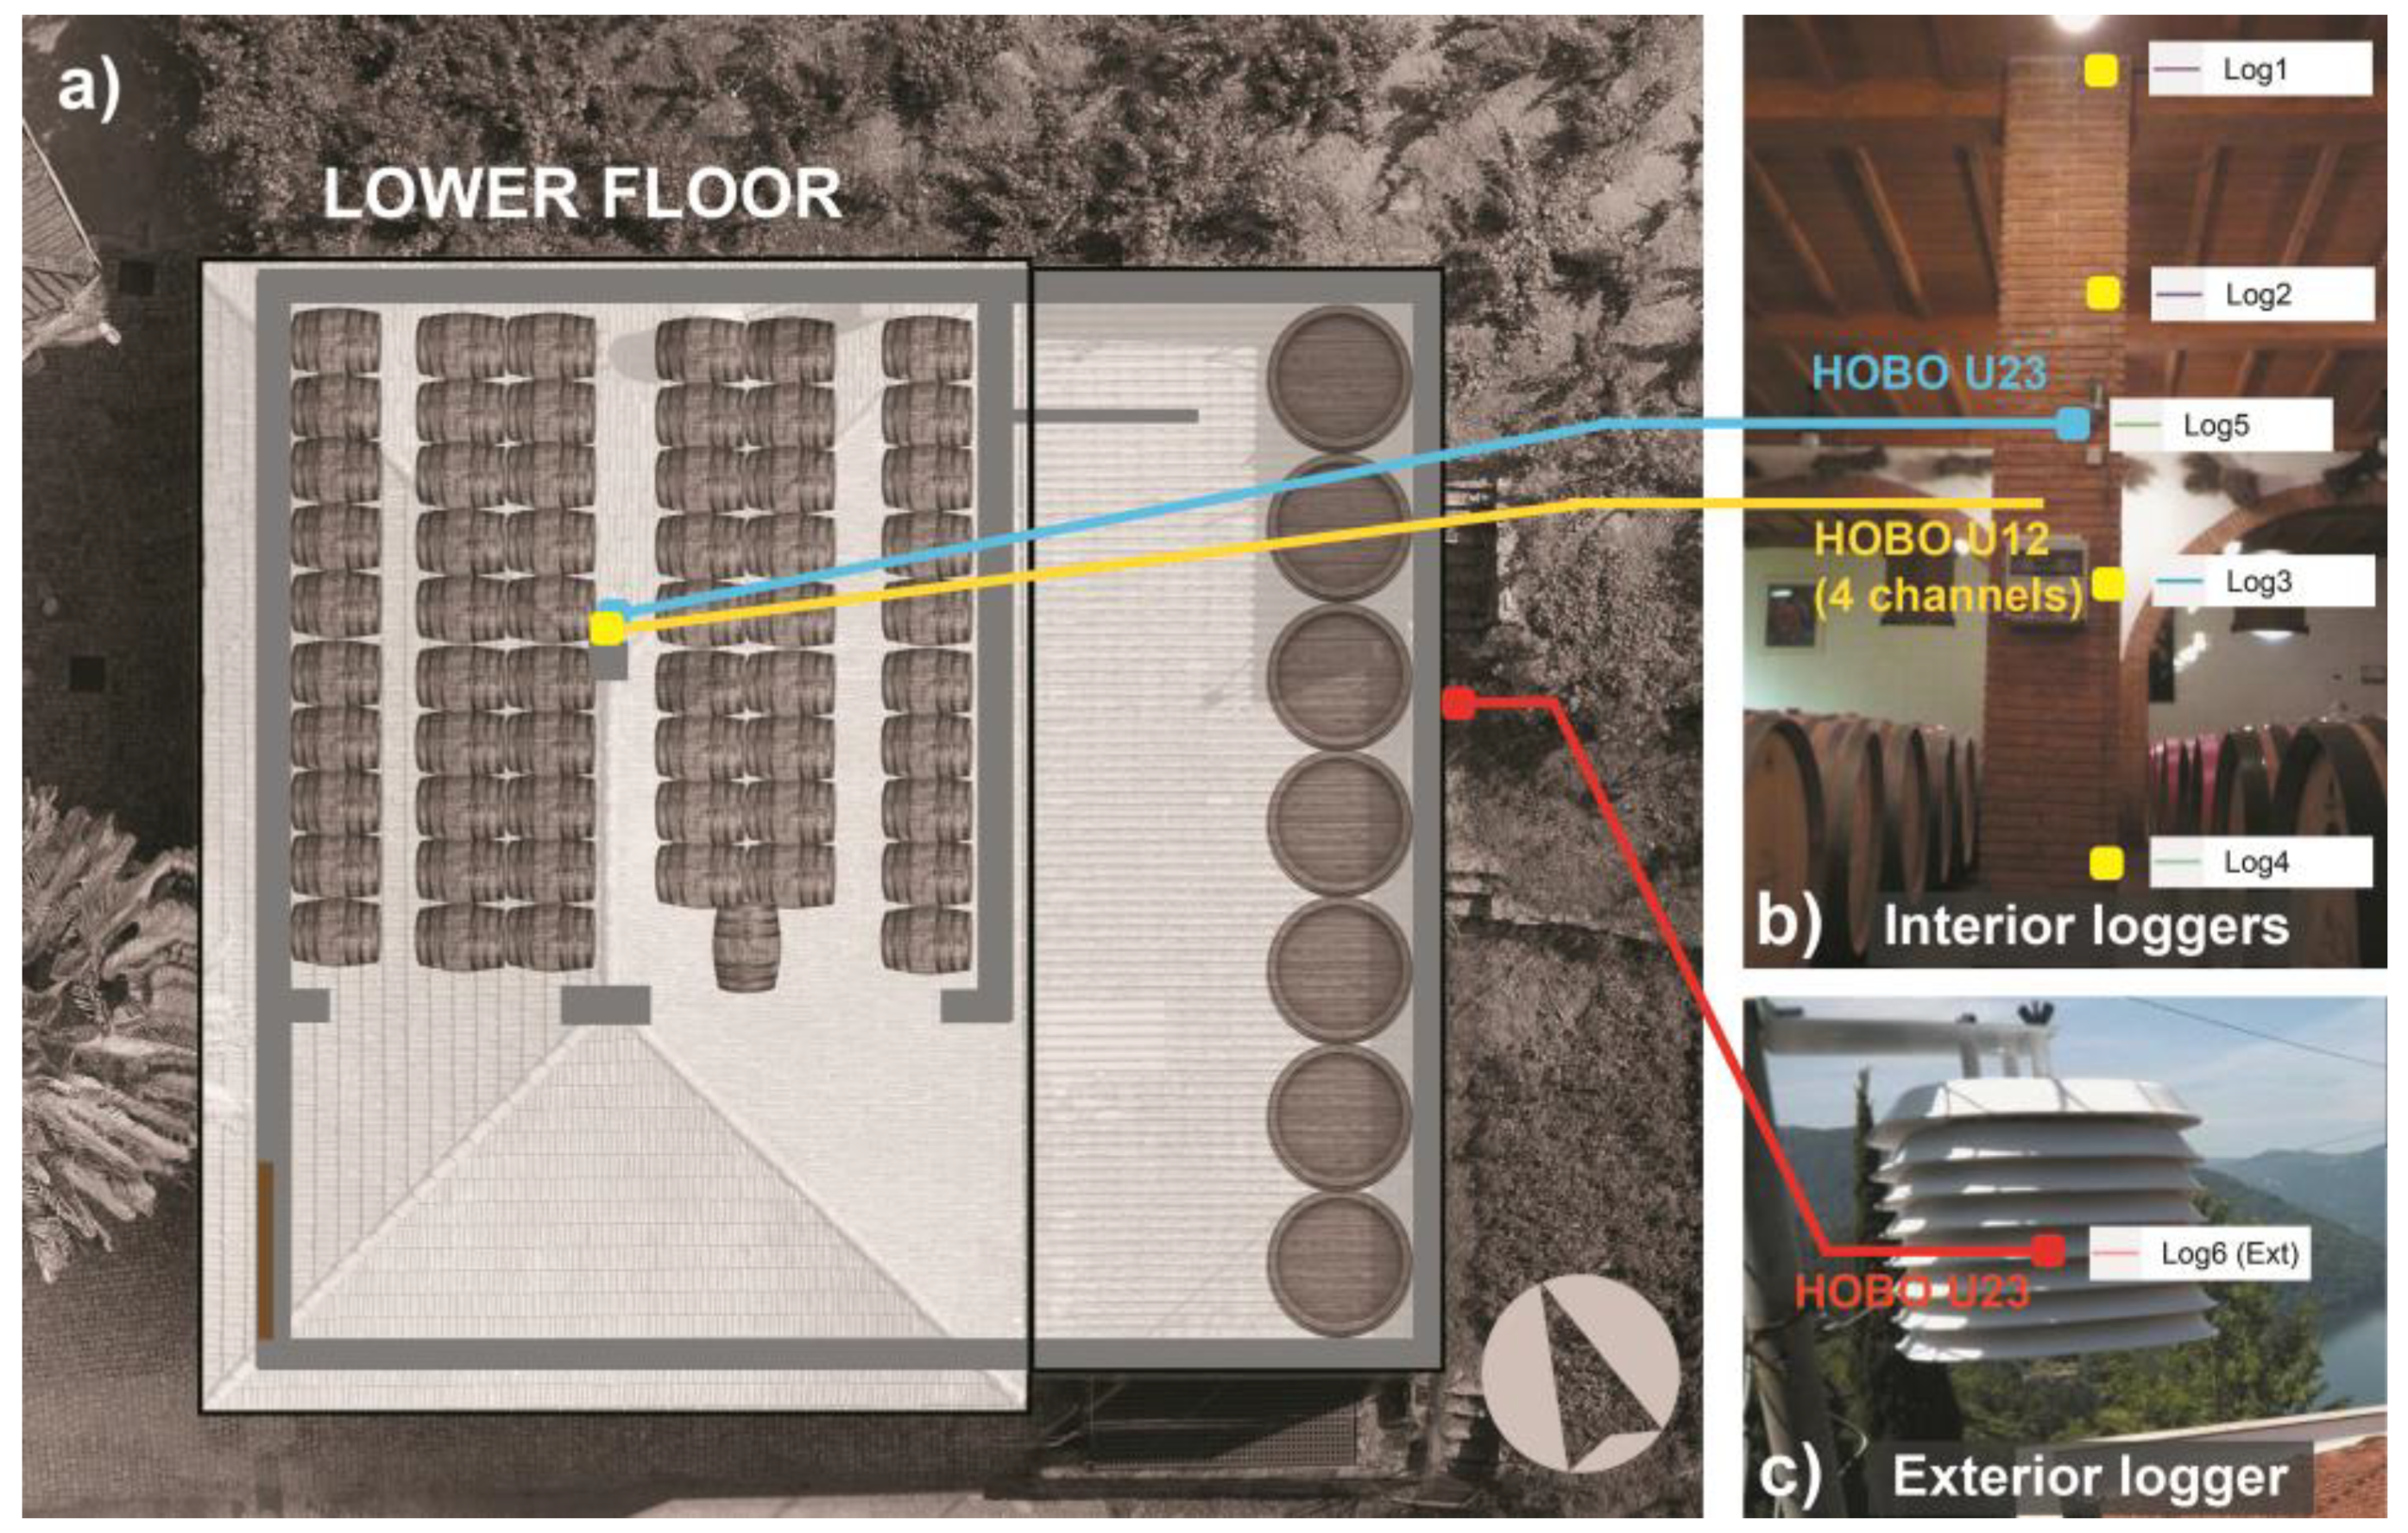
3.2.1. Measuring Instruments
3.2.2. Thermal cameras
3.2.3. Platforms
3.3. Data Acquisition and Post-Processing
4. Results and Discussion
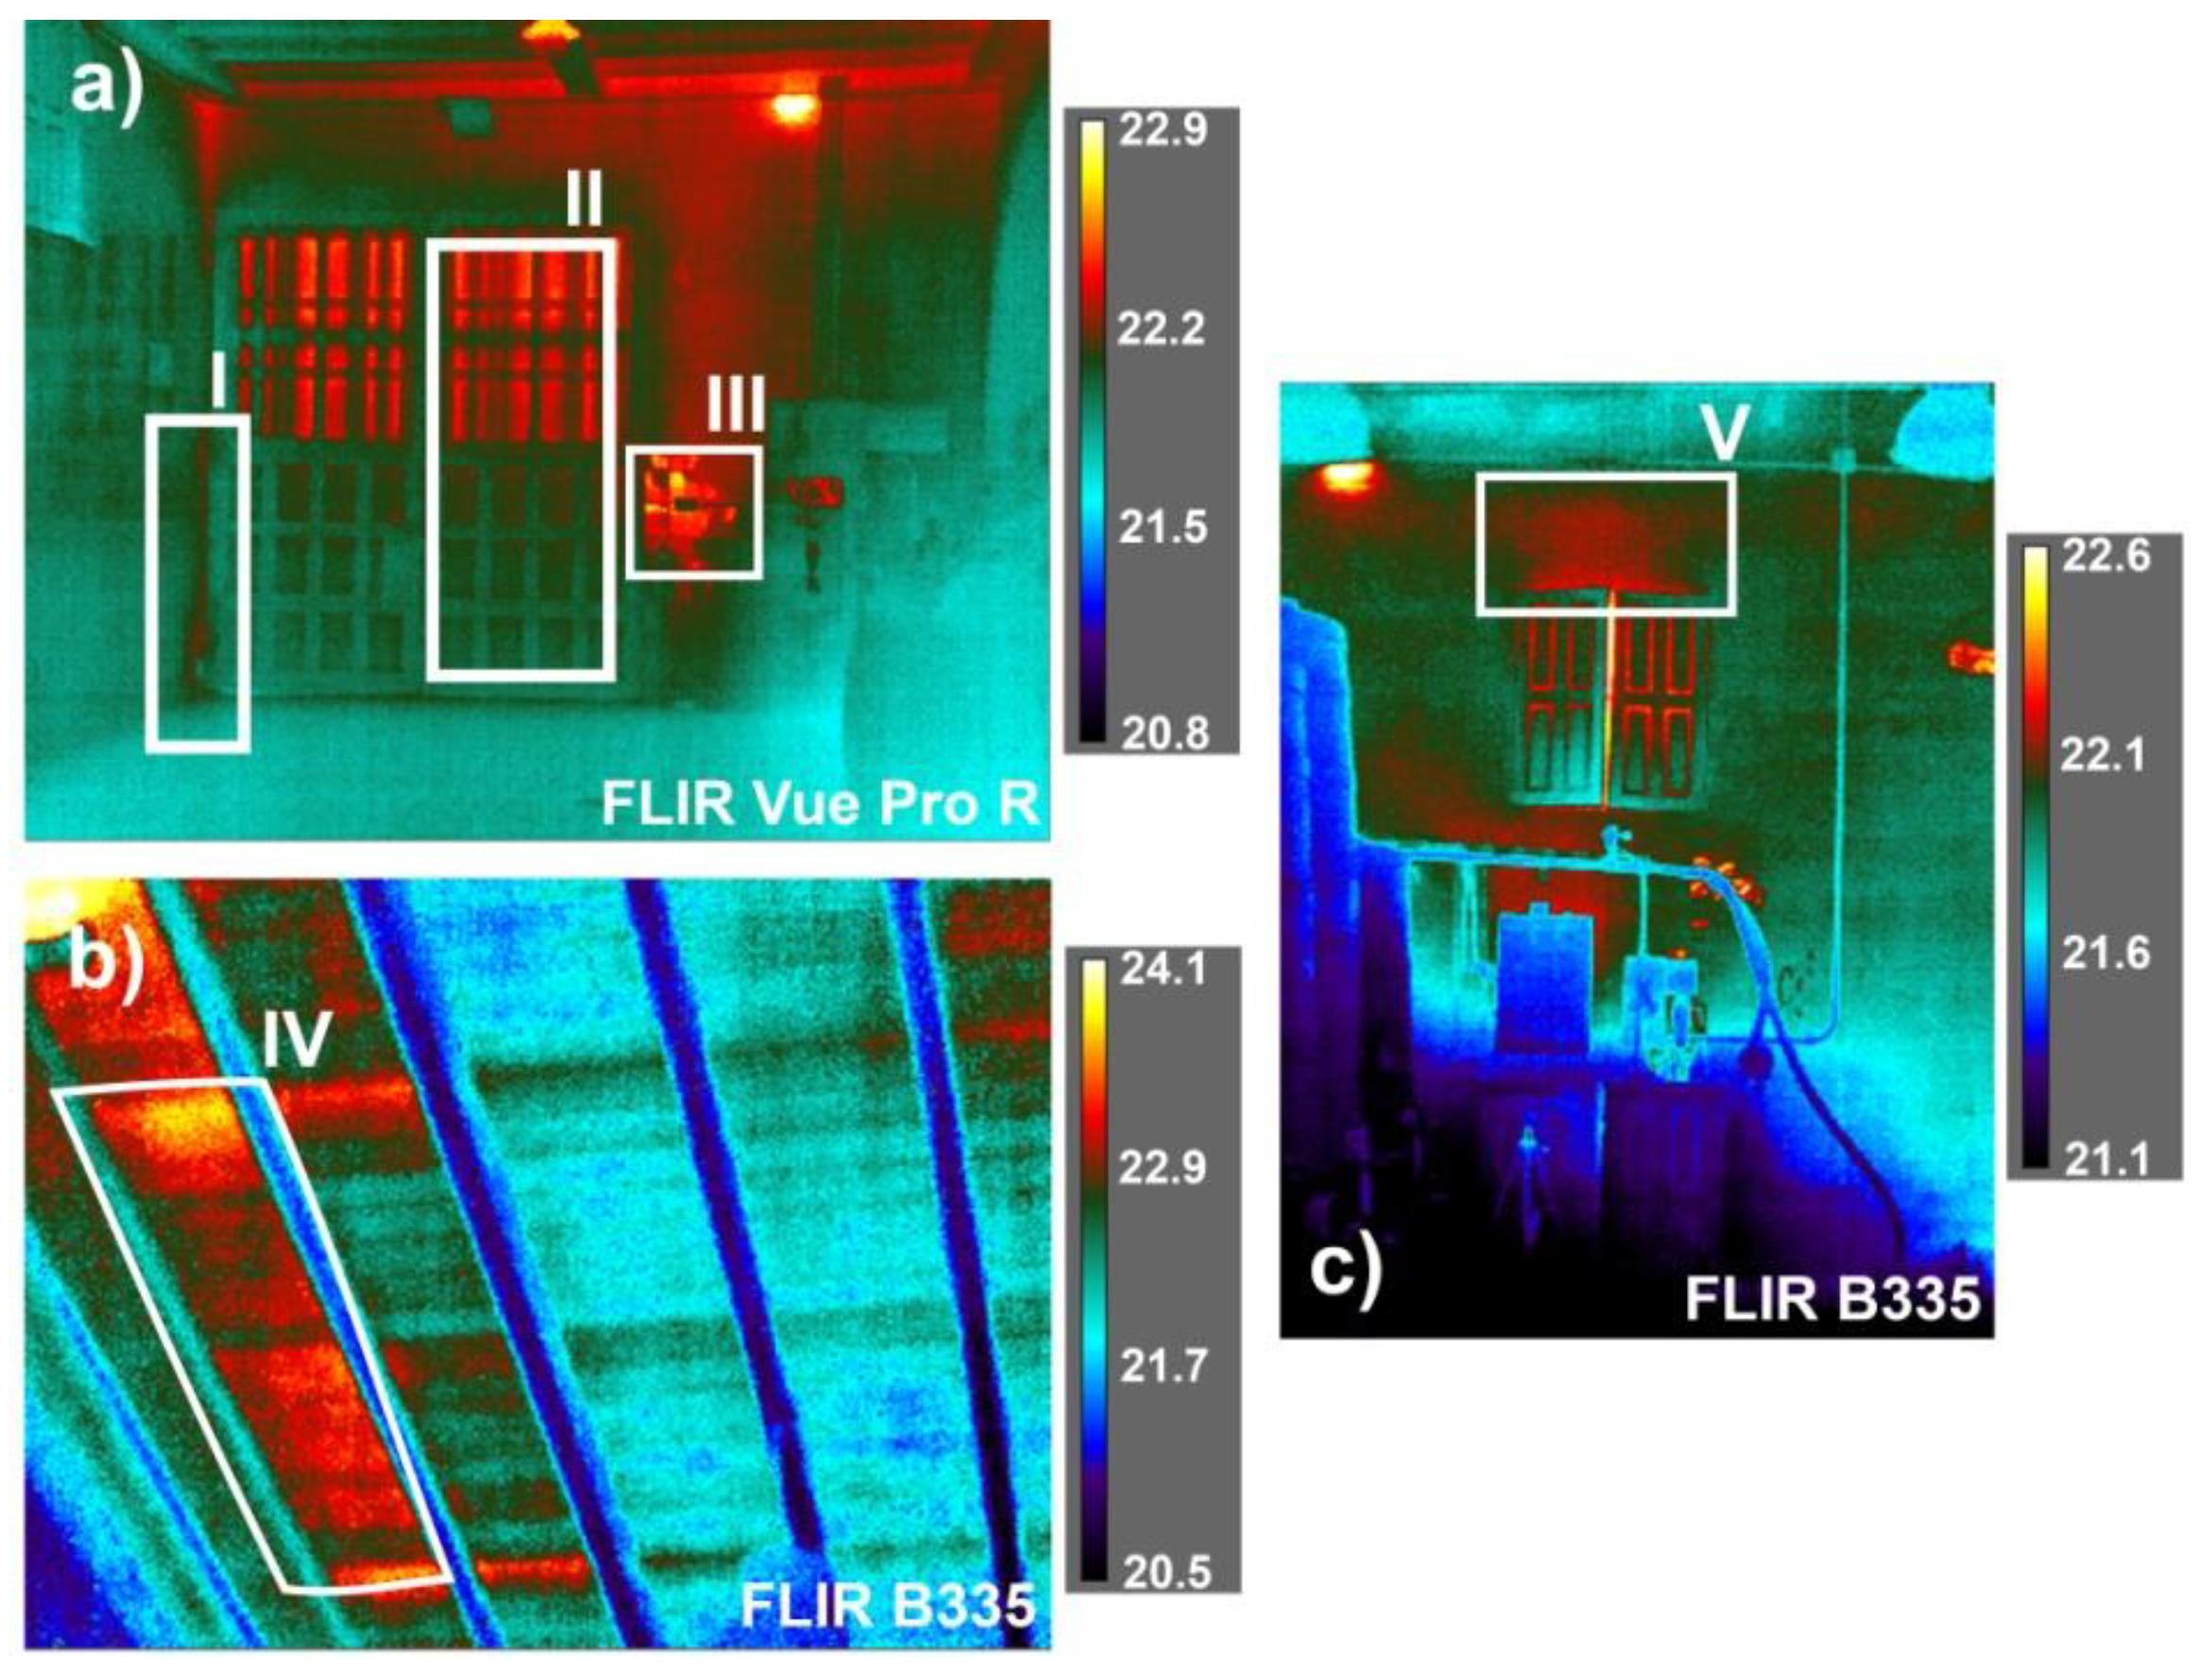
4.1. Building Diagnosis with IRT
4.2. The Camera Platform
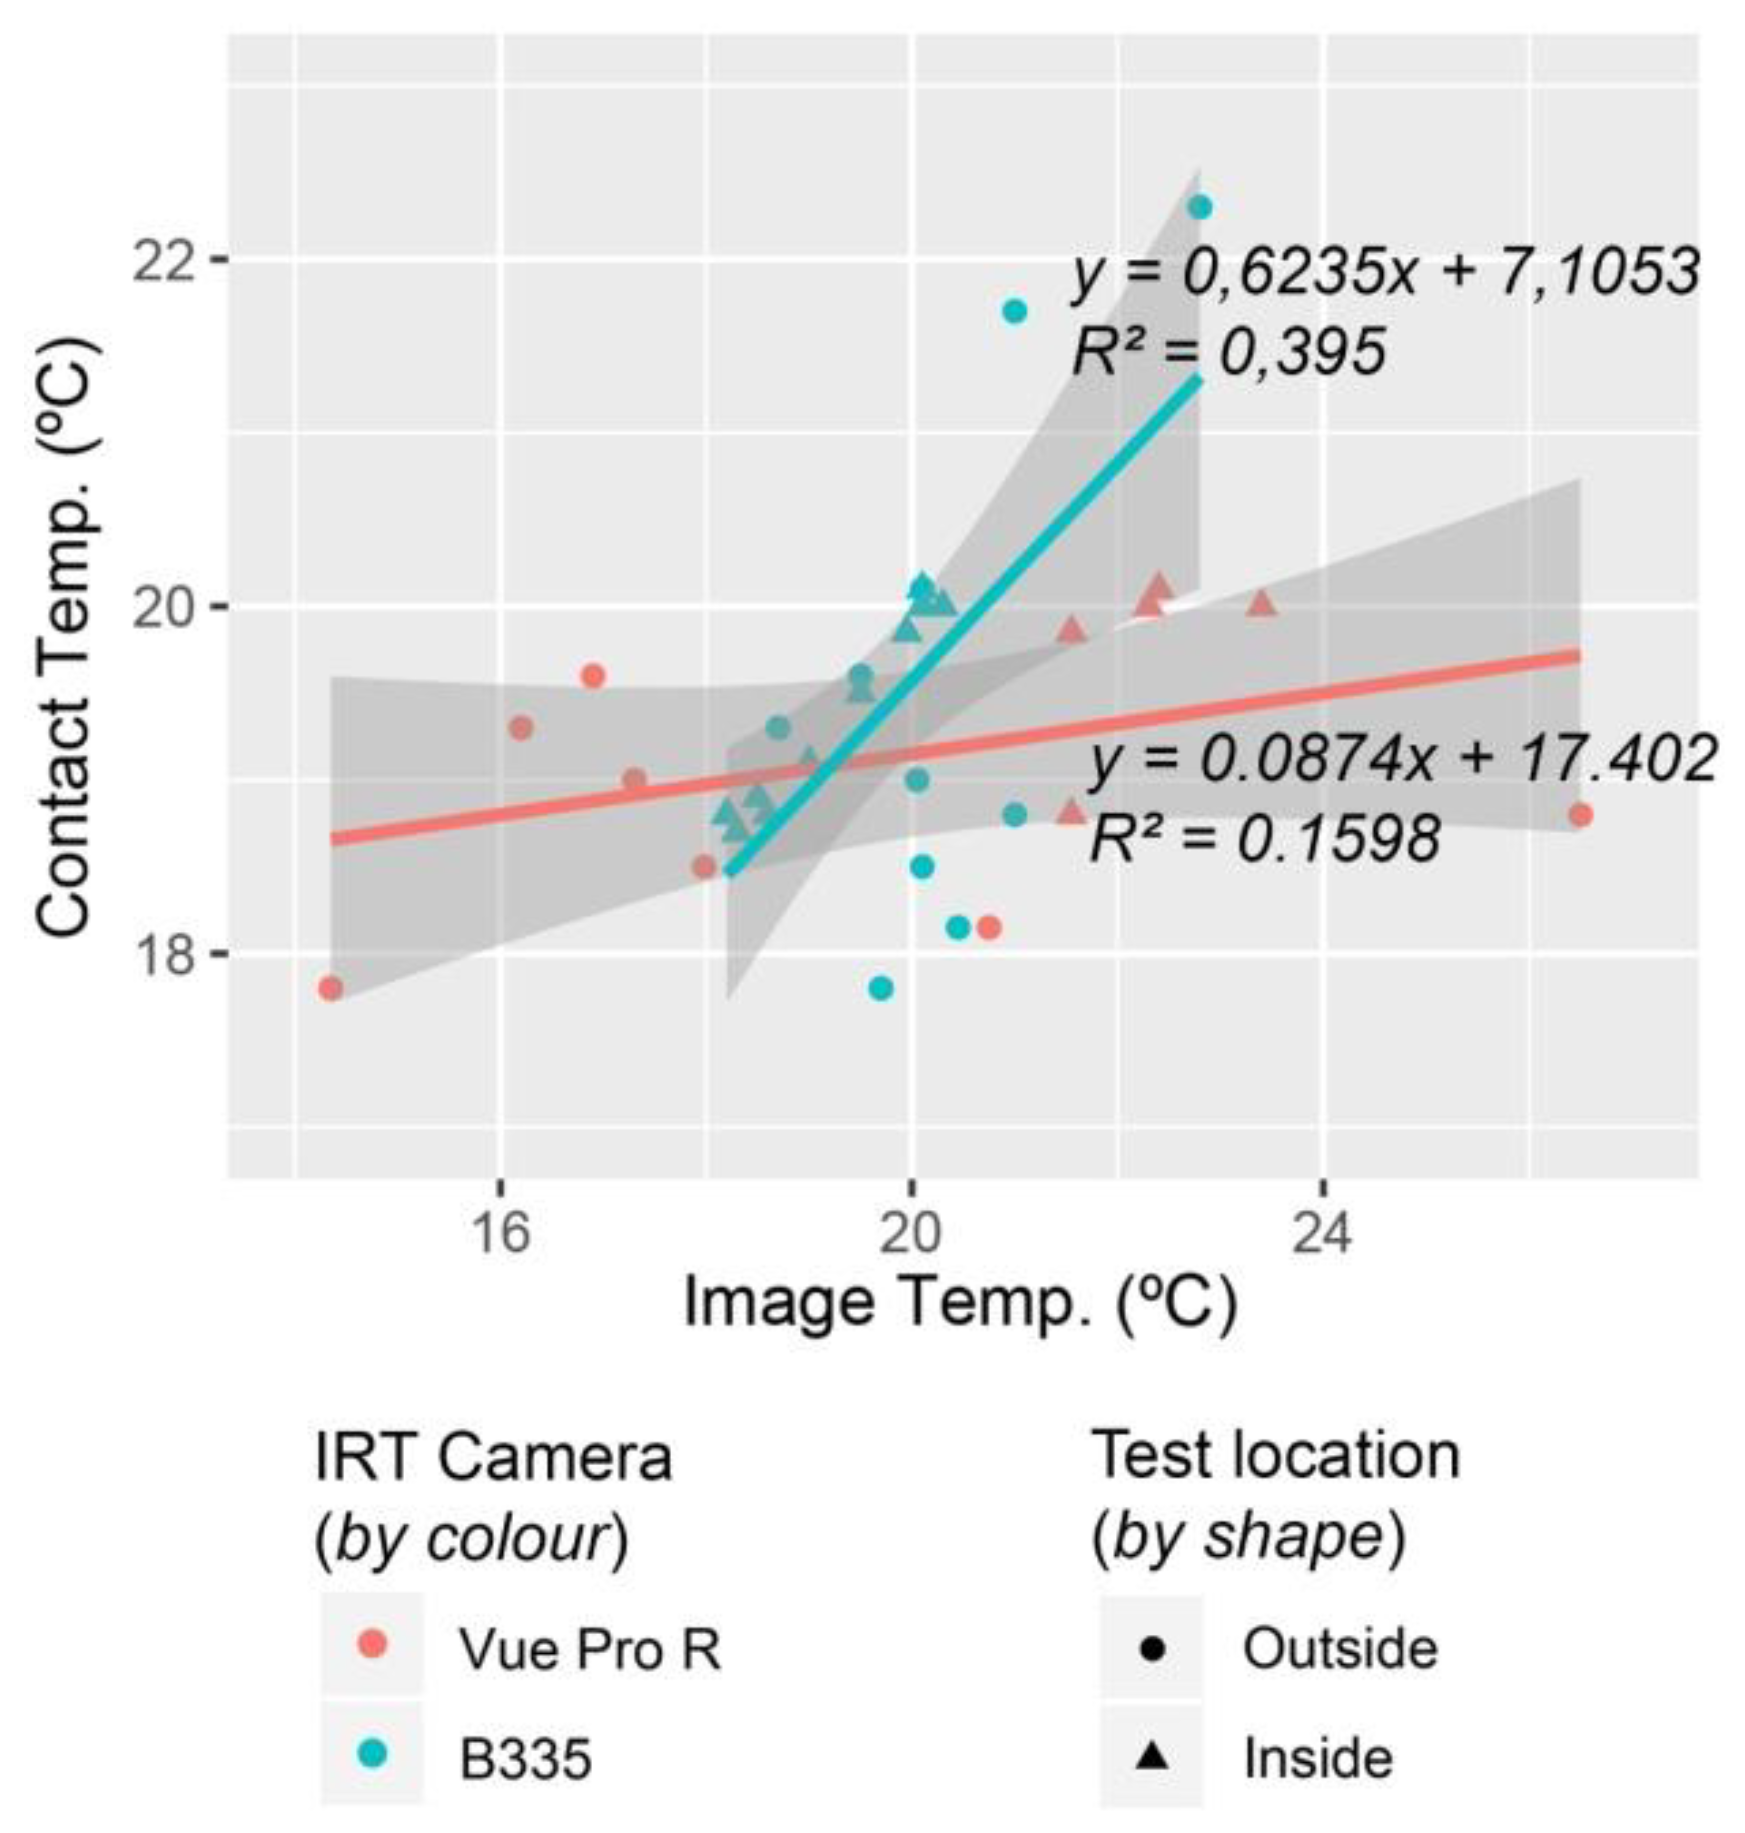
4.3. Accuracy Assessment of Thermal Images
4.4. The Influence of Angle with the Surface
5. Conclusions
Author Contributions
Funding
Acknowledgements
Conflicts of Interest
References
- Cancela, J.J.; Trigo-Córdoba, E.; Martínez, E.M.; Rey, B.J.; Bouzas-Cid, Y.; Fandiño, M.; Mirás-Avalos, J.M. Effects of climate variability on irrigation scheduling in white varieties of Vitis vinifera (L.) of NW Spain. Agric. Water Manag. 2016, 170, 99–109. [Google Scholar] [CrossRef]
- Bonfante, A.; Alfieri, S.M.; Albrizio, R.; Basile, A.; De Mascellis, R.; Gambuti, A.; Giorio, P.; Langella, G.; Manna, P.; Monaco, E.; et al. Evaluation of the effects of future climate change on grape quality through a physically based model application: A case study for the Aglianico grapevine in Campania region, Italy. Agric. Syst. 2017, 152, 100–109. [Google Scholar] [CrossRef]
- Crespo, J.; Rigou, P.; Romero, V.; García, M.; Arroyo, T.; Cabellos, J. Effect of seasonal climate fluctuations on the evolution of glycoconjugates during the ripening period of grapevine cv. Muscat à petits grains blancs berries. J. Sci. Food Agric. 2018, 98, 1803–1812. [Google Scholar] [CrossRef] [PubMed]
- Ifie, I.; Abrankó, L.; Villa-Rodriguez, J.A.; Papp, N.; Ho, P.; Williamson, G.; Marshall, L.J. The effect of ageing temperature on the physicochemical properties, phytochemical profile and α-glucosidase inhibition of Hibiscus sabdariffa (roselle) wine. Food Chem. 2018, 267, 263–270. [Google Scholar] [CrossRef] [PubMed]
- Styger, G.; Prior, B.; Bauer, F. Wine flavor and aroma. J. Ind. Microbiol. Biotechnol. 2011, 38, 1145–1159. [Google Scholar] [CrossRef] [PubMed]
- Barbaresi, A.; Torreggiani, D.; Benni, S.; Tassinari, P. Indoor air temperature monitoring: A method lending support tomanagement and design tested on a wine-aging room. Build. Environ. 2015, 86, 203–210. [Google Scholar] [CrossRef]
- Zhang, W.; Skouroumounis, G.; Monro, T.; Taylor, D. Distributed wireless monitoring system for ullage and temperature in wine barrels. Sensors 2015, 15, 19495–19506. [Google Scholar] [CrossRef] [PubMed]
- Correia, J.; Mourão, A.; Cavique, M. Energy evaluation at a winery: A case study at a Portuguese producer. In Proceedings of the IManE&E. MATEC Web of Conferences, Iasi, Romania, 24–27 May 2017; Volume 10001, pp. 1–9. [Google Scholar]
- Mazarrón, F.R.; Cid-Falceto, J.; Cañas-Guerrero, I. An assessment of using ground thermal inertia as passive thermal technique in the wine industry around the world. Appl. Therm. Eng. 2012, 33–34, 54–61. [Google Scholar] [CrossRef]
- Cañas Guerrero, I.; Martin Ocaña, S. Study of the thermal behaviour of traditional wine cellars: The case of the area of “Tierras Sorianas del Cid” (Spain). Renew. Energy 2005, 30, 43–55. [Google Scholar] [CrossRef]
- Fuentes Pardo, J.M.; Cañas Guerrero, I. Subterranean wine cellars of Central-Spain (Ribera de Duero): An underground built heritage to preserve. Tunn. Undergr. Sp. Technol. 2006, 21, 475–484. [Google Scholar] [CrossRef]
- Mazarrón, F.; Cañas-Guerrero, I. Seasonal analysis of the thermal behaviour of traditional underground wine cellars in Spain. Renew. Energy 2009, 34, 2484–2492. [Google Scholar] [CrossRef]
- Menezes, A.C.; Cripps, A.; Bouchlaghem, D.; Buswell, R. Predicted vs. actual energy performance of non-domestic buildings: Using post-occupancy evaluation data to reduce the performance gap. Appl. Energy 2012, 97, 355–364. [Google Scholar] [CrossRef] [Green Version]
- Guerra-Santin, O.; Tweed, C.; Jenkins, H.; Jiang, S. Monitoring the performance of low energy dwellings: Two UK case studies. Energy Build. 2013, 64, 32–40. [Google Scholar] [CrossRef]
- Demanuele, C.; Tweddell, T.; Davies, M. Bridging the gap between predicted and actual energy performance in schools. In Proceedings of the World Renewable Energy Congress XI, Abu Dhabi, UAE, 25–30 September 2010; pp. 1–6. [Google Scholar]
- Bordass, B.; Cohen, R.; Field, J. Energy Performance of Non-Domestic Buildings: Closing the Credibility Gap. In Proceedings of the 8th International Conference on Improving Energy Efficiency in Commercial Buildings, Frankfurt, Germany, 2–3 April 2004; pp. 1–10. [Google Scholar]
- De Wilde, P. The gap between predicted and measured energy performance of buildings: A framework for investigation. Autom. Constr. 2014, 41, 40–49. [Google Scholar] [CrossRef]
- Fox, M.; Coley, D.; Goodhew, S.; De Wilde, P. Thermography methodologies for detecting energy related building defects. Renew. Sustain. Energy Rev. 2014, 40, 296–310. [Google Scholar] [CrossRef] [Green Version]
- Nardi, I.; Lucchi, E.; de Rubeis, T.; Ambrosini, D. Quantification of heat energy losses through the building envelope: A state-of-the-art analysis with critical and comprehensive review on infrared thermography. Build. Environ. 2018, 146, 190–205. [Google Scholar] [CrossRef] [Green Version]
- Lucchi, E. Applications of the infrared thermography in the energy audit of buildings: A review. Renew. Sustain. Energy Rev. 2018, 82, 3077–3090. [Google Scholar] [CrossRef]
- Kirimtat, A.; Krejcar, O. A review of infrared thermography for the investigation of building envelopes: Advances and prospects. Energy Build. 2018, 176, 390–406. [Google Scholar] [CrossRef]
- Kylili, A.; Fokaides, P.; Christou, P.; Kalogirou, S. Infrared thermography (IRT) applications for building diagnostics: A review. Appl. Energy 2014, 134, 531–549. [Google Scholar] [CrossRef]
- Cerdeira, F.; Vázquez, M.E.; Collazo, J.; Granada, E. Applicability of infrared thermography to the study of the behaviour of stone panels as building envelopes. Energy Build. 2011, 43, 1845–1851. [Google Scholar] [CrossRef]
- Dufour, M.; Derome, D.; Zmeureanu, R. Analysis of thermograms for the estimation of dimensions of cracks in building envelope. Infrared Phys. Technol. 2009, 52, 70–78. [Google Scholar] [CrossRef]
- Titman, D.J. Applications of thermography in non-destructive testing of structures. NDT&E Int. 2001, 34, 149–154. [Google Scholar]
- Lerma, C.; Barreira, E.; Almeida, R. A discussion concerning active infrared thermography in the evaluation of buildings air infiltration. Energy Build. 2018, 168, 56–66. [Google Scholar] [CrossRef]
- Taylor, T.; Counsell, J.; Gill, S. Energy efficiency is more than skin deep: Improving construction quality control in new-build housing using thermography. Energy Build. 2013, 66, 222–231. [Google Scholar] [CrossRef]
- Bauer, E.; de Freitas, V.P.; Mustelier, N.; Barreira, E.; de Freitas, S.S. Infrared thermography – evaluation of the results reproducibility. Struct. Surv. 2015, 33, 20–35. [Google Scholar] [CrossRef]
- Barreira, E.; Almeida, R.; Delgado, J. Infrared thermography for assessing moisture related phenomena in building components. Constr. Build. Mater. 2016, 110, 251–269. [Google Scholar] [CrossRef]
- Grinzato, E.; Ludwing, N.; Cadelano, G.; Bertucci, M.; Garaganot, M.; Bison, P. Infrared Thermography for Moisture Detection: A Laboratory Study and In-situ Test. Mater. Eval. 2011, 69, 97–104. [Google Scholar]
- Edis, E.; Flores-Colen, I.; de Brito, J. Quasi-quantitative infrared thermographic detection of moisture variation in facades with adhered ceramic cladding using principal component analysis. Build. Environ. 2015, 94, 97–108. [Google Scholar] [CrossRef]
- Kalamees, T. Air tightness and air leakages of new lightweight single-family detached houses in Estonia. Build. Environ. 2007, 42, 2369–2377. [Google Scholar] [CrossRef]
- Barreira, E.; Almeida, R.; Moreira, M. An infrared thermography passive approach to assess the effect of leakage points in buildings. Energy Build. 2017, 140, 224–235. [Google Scholar] [CrossRef]
- Martín Ocaña, S.; Cañas Guerrero, I.; González Requena, I. Thermographic survey of two rural buildings in Spain. Energy Build. 2004, 36, 515–523. [Google Scholar] [CrossRef]
- Bauer, E.; Pavón, E.; Barreira, E.; De Castro, E.K. Analysis of building facade defects using infrared thermography: Laboratory studies. J. Build. Eng. 2016, 6, 93–104. [Google Scholar] [CrossRef]
- Sfarra, S.; Cicone, A.; Yousefi, B.; Ibarra-Castanedo, C.; Perilli, S.; Maldague, X. Improving the detection of thermal bridges in buildings via on-site infrared thermography: The potentialities of innovative mathematical tools. Energy Build. 2019, 182, 159–171. [Google Scholar] [CrossRef]
- Lai, W.W.L.; Lee, K.K.; Poon, C.S. Validation of size estimation of debonds in external wall’s composite finishes via passive Infrared thermography and a gradient algorithm. Constr. Build. Mater. 2015, 87, 113–124. [Google Scholar] [CrossRef]
- Tejedor, B.; Casals, M.; Gangolells, M.; Roca, X. Quantitative internal infrared thermography for determining in-situ thermal behaviour of façades. Energy Build. 2017, 151, 187–197. [Google Scholar] [CrossRef]
- Barreira, E.; de Freitas, V.P. Evaluation of building materials using infrared thermography. Constr. Build. Mater. 2007, 21, 218–224. [Google Scholar] [CrossRef]
- Moyano-Campos, J.; Anton-García, D.; Rico-Delgado, F.; Martín-García, D. Threshold Values for Energy Loss in Building Façades Using Infrared Thermography Sustainable. Sustain. Dev. Renov. Archit. Urban. Eng. 2017, 6, 3859. [Google Scholar] [CrossRef]
- Minkina, W.; Klecha, D. Atmospheric transmission coefficient modelling in the infrared for thermovision measurements. J. Sensors Sens. Syst. 2016, 5, 17–23. [Google Scholar] [CrossRef] [Green Version]
- O’Grady, M.; Lechowska, A.; Harte, A. Quantification of heat losses through building envelope thermal bridges influenced by wind velocity using the outdoor infrared thermography technique. Appl. Energy 2017, 208, 1038–1052. [Google Scholar] [CrossRef] [Green Version]
- Sagan, V.; Maimaitijiang, M.; Sidike, P.; Eblimit, K.; Peterson, K.T.; Hartling, S.; Esposito, F.; Khanal, K.; Newcomb, M.; Pauli, D.; et al. UAV-based high resolution thermal imaging for vegetation monitoring, and plant phenotyping using ICI 8640 P, FLIR Vue Pro R 640, and thermoMap cameras. Remote Sens. 2019, 11, 330. [Google Scholar] [CrossRef]
- Khanal, S.; Fulton, J.; Shearer, S. An overview of current and potential applications of thermal remote sensing in precision agriculture. Comput. Electron. Agric. 2017, 139, 22–32. [Google Scholar] [CrossRef]
- Park, S.; Nolan, A.; Fuentes, S.; Hernandez, E.; Chung, H.; O´Connell, M. Estimation of crop water stress in a nectarine orchard using high-resolution imagery from unmanned aerial vehicle (UAV) Digital Vineyards View project Apple Sunburn Risk and Fruit Diameter Estimation Using a Smartphone App View project. In Proceedings of the 21st International Congress on Modelling and Simulation, Gold Coast, Australia, 29 November–4 December 2015. [Google Scholar]
- Aicardi, I.; Chiabrando, F.; Lingua, A.M.; Noardo, F.; Piras, M.; Vigna, B. A methodology for acquisition and processing of thermal data acquired by UAVs: A test about subfluvial springs’ investigations. Geomat. Nat. Hazards Risk 2017, 8, 5–17. [Google Scholar] [CrossRef]
- Gallardo-Saavedra, S.; Hernández-Callejo, L.; Duque-Perez, O. Technological review of the instrumentation used in aerial thermographic inspection of photovoltaic plants. Renew. Sustain. Energy Rev. 2018, 93, 566–579. [Google Scholar] [CrossRef]
- Zefri, Y.; ElKettani, A.; Sebari, I.; Lamallam, S.A. Thermal Infrared and Visual Inspection of Photovoltaic Installations by UAV Photogrammetry—Application Case: Morocco. Drones 2018, 2, 41. [Google Scholar] [CrossRef]
- Rakha, T.; Liberty, A.; Gorodetsky, A.; Kakillioglu, B.; Velipasalar, S. Heat Mapping Drones: An Autonomous Computer-Vision-Based Procedure for Building Envelope Inspection Using Unmanned Aerial Systems (UAS). Technol. Des. 2018, 2, 30–44. [Google Scholar] [CrossRef]
- Entrop, A.G.; Vasenev, A. Infrared drones in the construction industry: Designing a protocol for building thermography procedures. Energy Procedia 2017, 132, 63–68. [Google Scholar] [CrossRef]
- Kayan, H.; Eslampanah, R.; Yeganli, F.; Askar, M. Heat Leakage Detection and Surveiallance Using Aerial Thermography Drone. In Proceedings of the 26th Signal Processing and Communications Applications Conference (SIU), Çeşme, Turkey, 2–5 May 2018; Volume 1, pp. 1–4. [Google Scholar]
- Mavromatidis, L.; Dauvergne, J.; Saleri, R.; Batsale, J. First experiments for the diagnosis and thermophysical sampling using impulse IR thermography from Unmanned Aerial Vehicle (UAV). In Proceedings of the 12th International Conference on Quantitative Infrared Thermography (QIRT 2014), Bordeaux, France, 7–11 July 2014. [Google Scholar]
- Cañas-Guerrero, I.; Martín-Ocaña, S.; González-Requena, I. Thermal-physical aspects of materials used for the construction of rural buildings in Soria (Spain). Constr. Build. Mater. 2005, 19, 197–211. [Google Scholar] [CrossRef]
- Lehmann, B.; Ghazi Wakili, K.; Frank, T.; Vera Collado, B.; Tanner, C. Effects of individual climatic parameters on the infrared thermography of buildings. Appl. Energy 2013, 110, 29–43. [Google Scholar] [CrossRef]
- Fang, J.B.; Grot, R.A.; Childs, K.W.; Courville, G.E. Heat Loss from Thermal Bridges. Batim. Int. Build. Res. Pract. 1984, 12, 346–352. [Google Scholar] [CrossRef]
- Fox, M.; Coley, D.; Goodhew, S.; De Wilde, P. Time-lapse thermography for building defect detection. Energy Build. 2015, 92, 95–106. [Google Scholar] [CrossRef]
- Spain Spain CTE-HE. Código Técnico de la Edificación. Basic document HE (Energy saving). June 2017, p. 68. Available online: https://www.codigotecnico.org/images/stories/pdf/ahorroEnergia/DBHE.pdf (accessed on 1 April 2019).
- Fraga, H.; Malheiro, A.C.; Moutinho-Pereira, J.; Cardoso, R.M.; Soares, P.M.M.; Cancela, J.J.; Pinto, J.G.; Santos, J.A. Integrated analysis of climate, soil, topography and vegetative growth in iberian viticultural regions. PLoS ONE 2014, 9. [Google Scholar] [CrossRef] [PubMed]
- Blanco-Ward, D.; García Queijeiro, J.M.; Jones, G.V. Spatial climate variability and viticulture in the Miño River Valley of Spain. Vitis J. Grapevine Res. 2007, 46, 63–70. [Google Scholar]
- Coutts, A.; Harris, R.; Phan, T.; Livesley, S.; Williams, N.; Tapper, N. Thermal infrared remote sensing of urban heat: Hotspots, vegetation, and an assessment of techniques for use in urban planning. Remote Sens. Environ. 2016, 186, 637–651. [Google Scholar] [CrossRef]
- CIBSE Guide Volume C—Reference Data; Chartered Institution of Building Service Engineers: London, UK, 2007.
- Harvey, L.D. A handbook on Low-Energy Buildings and District-Energy Systems: Fundamentals, Techniques and Examples; Routledge: Abingdon, UK, 2012. [Google Scholar]
- Brooke, C. Thermal imaging for the archaeological investigation of historic buildings. Remote Sens. 2018, 10, 1401. [Google Scholar] [CrossRef]
- Bisegna, F.; Ambrosini, D.; Paoletti, D.; Sfarra, S.; Gugliermetti, F. A qualitative method for combining thermal imprints to emerging weak points of ancient wall structures by passive infrared thermography—A case study. J. Cult. Herit. 2014, 15, 199–202. [Google Scholar] [CrossRef]
- Kordatos, E.Z.; Exarchos, D.A.; Stavrakos, C.; Moropoulou, A.; Matikas, T.E. Infrared thermographic inspection of murals and characterization of degradation in historic monuments. Constr. Build. Mater. 2013, 48, 1261–1265. [Google Scholar] [CrossRef]
- Lerma, C.; Mas, Á.; Gil, E.; Vercher, J.; Peñalver, M.J. Pathology of Building Materials in Historic Buildings. Relationship between Laboratory Testing and Infrared Thermography. Mater. Constr. 2013, 64, e009. [Google Scholar] [CrossRef]
- Muniz, P.; Cani, S.; Da, S.; Magalhaes, R. Influence of field of view of thermal imagers and angle of view on temperature measurements by infrared thermovision. IEEE Sens. J. 2014, 14, 729–733. [Google Scholar] [CrossRef]
- Muniz, P.; de Araújo Kalid, R.; Cani, S.; da Silva Magalhães, R. Handy method to estimate uncertainty of temperature measurement by infrared thermography. Opt. Eng. 2014, 53, 074101. [Google Scholar] [CrossRef] [Green Version]
- Álvarez-Tey, G.; Jiménez-Castañeda, R.; Carpio, J. Analysis of the configuration and the location of thermographic equipment for the inspection in photovoltaic systems. Infrared Phys. Technol. 2017, 87, 40–46. [Google Scholar] [CrossRef]
- Echániz, T.; Pérez-Sáez, R.B.; Tello, M.J. IR radiometer sensitivity and accuracy improvement by eliminating spurious radiation for emissivity measurements on highly specular samples in the 2–25 μm spectral range. Meas. J. Int. Meas. Confed. 2017, 110, 22–26. [Google Scholar] [CrossRef]


| Manufacturer | Model | Resolution (pixels × pixels) | Thermal Sensitivity (NETD) | Accuracy |
|---|---|---|---|---|
| FLIR (Wilsonville, US) | Vue PRO 336 | 336 × 256 | 0.05 K | Non-radiometric |
| Vue PRO 640 | 640 × 512 | |||
| Vue PRO R 336 | 336 × 256 | ±5 °C or ± 5% | ||
| Vue PRO R 640 | 640 × 512 | |||
| FLIR [& DJI (Shenzhen, CN)] | Zenmuse XT 336 | 336 × 256 | 0.05 K | Non-radiometric |
| Zenmuse XT 640 | 640 × 512 | |||
| Zenmuse XT2 336 | 336 × 256 | |||
| Zenmuse XT2 640 | 640 × 512 | |||
| Duo (+RGB) | 160 × 120 | Non-radiometric | ||
| Duo R (+RGB) | 160 × 120 | ±5 °C or ± 5% | ||
| Duo PRO R 336 (+RGB) | 336 × 256 | |||
| Duo PRO R 640 (+RGB) | 640 × 512 | |||
| Workswell (Praha, CZ) | WIRIS (2nd Gen) 336 | 336 × 256 | 0.03 K | ±2 °C or ± 2% |
| WIRIS (2nd Gen) 640 | 640 × 512 | |||
| WIRIS mini | 384 × 288 | 0.05 K | ±3 °C or ± 3% | |
| Optris (Berlin, DE) | PI 160 | 160 × 120 | 0.04 K | ±2 °C or ± 2% |
| PI 200/230 | 160 × 120 | 0.08 K | ||
| PI 400 | 382 × 288 | |||
| PI 450 | 382 × 288 | 0.04 K | ||
| PI 640 | 640 × 480 | 0.075 K | ||
| Thermoteknix (Cambridge, UK) | MicroCAM2 384 | 384 × 288 | 0.05–0.06 K | Non-radiometric |
| MicroCAM2 640 | 640 × 480 | 0.06 K | ||
| MicroCAM3 384 | 384 × 288 | 0.05 K | ||
| MicroCAM3 640 | 640 × 480 | 0.04–0.05 K | ||
| Yuneec (Jiangsu, CN) | CGOET | 160 × 120 | 0.05 K | Non-radiometric |
| E10T 320 | 320 × 256 | |||
| E10T 640 | 640 × 512 | |||
| Optix (Panagyurishte, BG) | Minion L | 384 × 288 | 0.05 K | Non-radiometric |
| Model | Resolution (pixels × pixels) | Thermal Sensitivity (NETD) | Accuracy | Platform | ~System Cost (cam. + platform) |
|---|---|---|---|---|---|
| FLIR Vue PRO R | 640 × 512 | 0.05 K | ±5 °C or 5% | Rotary-wing UAV + 3-axis gimbal | 4500 + 25,000 $ |
| FLIR B335 | 320 × 240 | 0.05 K | ±2 °C or 2% | Extensible pole + fixed ball end | 7000 + 200 $ |
© 2019 by the authors. Licensee MDPI, Basel, Switzerland. This article is an open access article distributed under the terms and conditions of the Creative Commons Attribution (CC BY) license (http://creativecommons.org/licenses/by/4.0/).
Share and Cite
Ortiz-Sanz, J.; Gil-Docampo, M.; Arza-García, M.; Cañas-Guerrero, I. IR Thermography from UAVs to Monitor Thermal Anomalies in the Envelopes of Traditional Wine Cellars: Field Test. Remote Sens. 2019, 11, 1424. https://0-doi-org.brum.beds.ac.uk/10.3390/rs11121424
Ortiz-Sanz J, Gil-Docampo M, Arza-García M, Cañas-Guerrero I. IR Thermography from UAVs to Monitor Thermal Anomalies in the Envelopes of Traditional Wine Cellars: Field Test. Remote Sensing. 2019; 11(12):1424. https://0-doi-org.brum.beds.ac.uk/10.3390/rs11121424
Chicago/Turabian StyleOrtiz-Sanz, Juan, Mariluz Gil-Docampo, Marcos Arza-García, and Ignacio Cañas-Guerrero. 2019. "IR Thermography from UAVs to Monitor Thermal Anomalies in the Envelopes of Traditional Wine Cellars: Field Test" Remote Sensing 11, no. 12: 1424. https://0-doi-org.brum.beds.ac.uk/10.3390/rs11121424