Evaluating the Drought-Monitoring Utility of Four Satellite-Based Quantitative Precipitation Estimation Products at Global Scale


1
Institute of Environment and Sustainable Development in Agriculture, Chinese Academy of Agricultural Sciences, Beijing 100081, China
2
Department of Geography, Handan College, Handan 056005, Hebei, China
*
Author to whom correspondence should be addressed.
Remote Sens. 2019, 11(17), 2010; https://0-doi-org.brum.beds.ac.uk/10.3390/rs11172010
Submission received: 29 June 2019
/
Revised: 22 August 2019
/
Accepted: 22 August 2019
/
Published: 26 August 2019
(This article belongs to the Section Atmospheric Remote Sensing)
Abstract
:This study simultaneously analyzed and evaluated the meteorological drought-monitoring utility of the following four satellite-based, quantitative precipitation estimation (QPE) products: the Tropical Rainfall Measuring Mission (TRMM) Multi-Satellite Precipitation Analysis 3B43V7 (TRMM-3B43), the Climate Hazards Group InfraRed Precipitation with Station (CHIRPS), the Climate Prediction Center Morphing Technique gauge-satellite blended product (CMORPH-BLD), and the Precipitation Estimation from Remotely Sensed Information using Artificial Neural Networks-Climate Data Record (PERSIANN-CDR). Data from 2000 to 2016 was used at global scale. The global Climate Research Unit (CRU) Version 4.02 was used as reference data to assess QPE products. The Standardized Precipitation Evapotranspiration Index (SPEI) drought index was chosen as an example to evaluate the drought utility of four QPE products. The results indicate that CHIRPS has the best performance in Europe, Oceania, and Africa; the PERSIANN-CDR has the best performance in North America, South America, and Asia; the CMORPH-BLD has the worst statistical indices in all continents. Although four QPE products showed satisfactory performance for most of the world according to SPEI statistics, poor drought monitoring ability occurred in Southeast Asia, Central Africa, the Tibetan plateau, the Himalayas, and Amazonia. The PERSIANN-CDR achieves the best performance of the four QPE products in most regions except for Africa; CHIRPS and TRMM-3B43 have comparable performances. According to the spatial probability of detection (POD) and false alarm ratio (FAR) of the SPEI, more than 50% of all drought events cannot be accurately identified by QPE products in regions with sparse gauge distribution. In other regions, such as the southeastern USA, southeastern China, and South Africa, QPE products capture more than 75% of drought events. Temporally, all datasets (except for CMORPH-BLD) can detect all typical drought events, namely, in the southeastern US in 2007, western Europe in 2003, Kenya in 2006, and Central Asia in 2008. The study concludes that CHIRPS and TRMM-3B43 can be used as near-real-time drought monitoring techniques whereas PERSIANN-CDR might be more suitable for long-term historical drought analysis.
1. Introduction
Drought is one of the most destructive natural disasters in the world; droughts occur not only in arid areas but also in humid areas [1,2,3]. Frequent drought disasters can profoundly affect agricultural production and, consequently, severely threaten food security and the ecological environment. With the advent of global warming, the global drought area as well as drought hazards are expected to further expand and intensify. Therefore, it is necessary to effectively monitor the occurrence, area, and intensity of droughts.
Although drought is a frequent extreme natural hazard, the mechanism underlying drought is very complex and not well understood. As a complicated climatic event, drought is generally classified into four types: meteorological, agricultural, hydrologic, and socioeconomic [4,5]. Drought indices, determined by climatic and hydrological variables, are generally used to monitor and analyze intensity and duration of the drought events [6]. Recently, various precipitation-based drought indices, e.g., the Standardized Precipitation Index (SPI) [7], the Palmer Drought Severity Index (PDSI) [8], and the Standardized Precipitation Evapotranspiration Index (SPEI) [9], have been introduced and widely applied to monitor and evaluate drought events at different spatiotemporal scales in the world [10,11,12,13,14,15].
Among these drought indices, the SPI is based on a statistical probability distribution and can show precipitation deficit at various time scales (i.e., 3-, 6-, and 12-month periods). However, the calculation of SPI only uses the precipitation variable and does not consider temperature and evaporation; however, temperature and evaporation are receiving increasing attention in the study of drought occurrence in response to global warming [16]. In addition, Zhong et al. [17] suggested that a drought index that considers more water-balance variables might be relatively less sensitive to the length of the utilized data records. Unlike SPI, the PDSI is based on the theory of the balance of moisture supply and demand; the calculation process requires the precipitation, temperature, and soil moisture information. Although PDSI can simultaneously consider multiple water balance variables, these lead to a more difficult PDSI calculation at larger scale, especially for regions in which PDSI has not been calibrated. Moreover, the hydrological model that is used to produce variables for PDSI calculation requires parameter calibration, creating further uncertainty for the PDSI in large regions. Previous studies have indicated that the PDSI underestimates runoff conditions in mountainous and snow-covered areas [18,19]. In addition, re-normalization for comparison among different regions is also problematic for large-scale PDSI application. Concurrently, the self-calibrating PDSI (scPDSI) suffers from a fixed timescale [20,21]. In comparison with the SPI and PDSI, the SPEI is based on a water balance and simultaneously considers the roles of precipitation and temperature. Moreover, the calculation method of the SPEI is mathematically similar to that of the SPI, which enables it to analyze and monitor drought at different time scales. These advantages indicate SPEI to be a practical drought index to monitor multiple droughts at global scale [13,22].
Precipitation, an indispensable variable for precipitation-based drought indices, is conventionally captured by rainfall observation stations. However, distributions of rain gauges are sparse and spatially uneven in some remote regions, which increases uncertainty when generating areal precipitation estimations via spatial interpolation [23,24], which largely influences the performance of drought indices [25]. However, with the launch of new satellites and the improvement of retrieval algorithms, new satellite-based quantitative precipitation estimation (QPE) products are constantly released and available to the public. In comparison with conventional rainfall gauge observations, remotely sensed precipitation products have large spatial coverage and can avoid the influence of sparse rainfall station distributions. In addition to the accurate evaluations and hydrological simulation for remotely sensed precipitation products newly available in recent decades [26,27,28,29], several studies have monitored and analyzed the drought utility using multiple remotely sensed precipitation products at both regional and global scales. Sahoo et al. [30] compared the Tropical Rainfall Measuring Mission (TRMM) Multisatellite Precipitation Analysis (TMPA) [31] research version (3B42V6, 3B42V7) and real-time version (3B42RTV7) for drought monitoring using the SPI at global scale. Results showed that the performance of 3B42V7 was the best among the tested products. The 3B42V6 product also performed reasonably well; however, the 3B42RTV7 performed worst and caution should be exercised when it is used. Guo et al. [19] compared the drought detection abilities of the Precipitation Estimation from Remotely Sensed Information using Artificial Neural Networks [32]-Climate Data Record (PERSIANN-CDR) [33] against the Precipitation Analysis Product (CPAP) using the SPI from 1983 to 2014 throughout China. Their results displayed that the PERSIANN-CDR showed a similar drought pattern of drought events to that of CPAP over eastern China; however, large differences occurred over regions with relatively sparse gauge networks. Zhong et al. [17] evaluated and compared satellite-based QPE products, including the PERSIANN-CDR, Climate Hazards Group Infrared Precipitation with Station (CHIRPS) [34], and TRMM 3B42V7, for the drought monitoring of mainland China using both the SPI and the PDSI. The results showed that all three QPE products performed better in the eastern part of China than in the west. Lu et al. [35] evaluated the accuracy of multiple satellite-based precipitation products. TRMM 3B42RT and 3B42 as well as Climate Prediction Center (CPC) Morphing Technique (CMORPH) [36] for pure satellite precipitation product (CMORPH-RAW), and for gauge-satellite blended product (CMORPH-BLD) were used via the SPI across China. The results indicated that 3B42 and CMORPH-BLD were generally more consistent with the SPI obtained with in situ measurements than 3B42RT and CMORPH RAW products.
Previous studies focused on evaluating the performance of remotely sensed precipitation products for the monitoring of drought using the SPI [15,17,19,30,37]. However, relatively few studies have evaluated the utility of remotely sensed precipitation products for estimating drought indices, such as more water balance variables, e.g., the Gridded Standardized Precipitation Evapotranspiration Index [38] and PDSI [17]. The SPEI, which considers more water balance variables than the SPI and has less calculative complexity than the PDSI, might also be a suitable index for QPE product-based drought monitoring in the short term. The SPEI has begun to be employed to evaluate the regional drought utility of satellite-based precipitation [38]. In addition, increasing regional studies indicate it is practical to use remotely sensed precipitation products to monitor and analyze drought. However, simultaneous evaluation of multiple remotely sensed precipitation products remains unquantified at global scale.
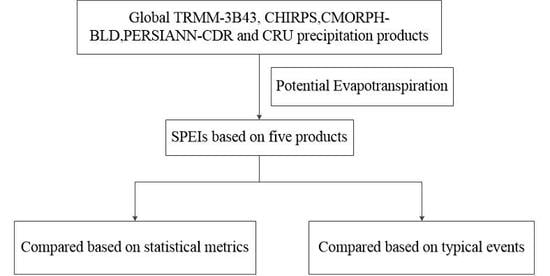
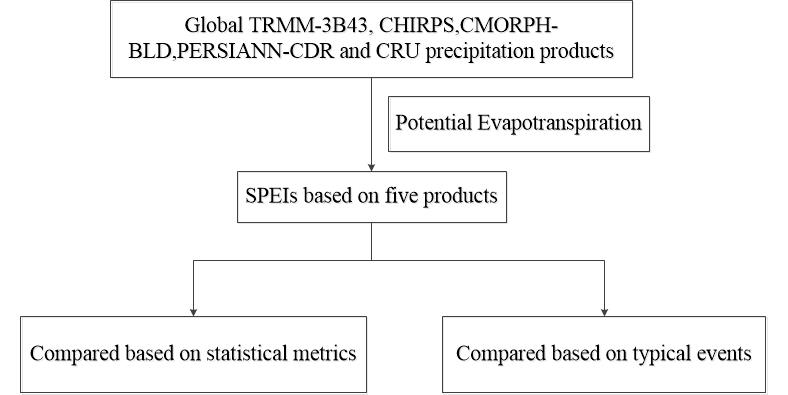
Therefore, this study analyzed four widely used satellite-based QPE products (CMORPH-BLD, TRMM-3B43, PERSIANN-CDR, and CHIRPS) for drought monitoring at the global scale via relative comparison of these products against CRU global reference using the form of the SPEI.
This study is organized as follows: Section 2 describes the four satellite-based QPE products, CRU global gauge-based observations, and the calculating method of the SPEI. The estimation results of four widely-used satellite-based QPE products are described in Section 3. The discussion and conclusions are presented in Section 4 and Section 5, respectively. The results of this study serve as reference for the use of QPE products for drought monitoring and evaluation of recent drought events.
2. Materials and Methods
2.1. Data Used in This Study
2.1.1. Reference Data
In this study, the four satellite-based precipitation products were blended with different gauge precipitation products. This study excluded those gauge precipitation products which had been used to adjust the satellite precipitation products when selecting the reference data. On this basis, this study chose gridded Climate Research Unit (CRU) [39] Version 4.02 as reference data. The monthly CRU dataset with spatial resolution of 0.5° × 0.5° was developed by the Climatic Research Unit (University of East Anglia) based on a large number of stations with good quality control and homogeneity check [40]. The version 4.02 CRU precipitation dataset is available online (http://www.cru.uea.ac.uk/data/). In this study, the original CRU precipitation data was interpolated into 0.25° × 0.25°. Previous studies have indicated that CRU is a reliable data source for climate studies [12,41].
2.1.2. Satellite-Based Data
In this study, four gauge-satellite blended datasets including CHIRPS Version 2.0 (CHIRPS), TRMM Multi-satellite Precipitation Analysis (TMPA) 3B43 Version 7 (TRMM-3B43), PERSIANN-CDR, and CMORPH-BLD were evaluated on a global scale. The retrieval algorithm differs between these satellite-based products.
CHIRPS is a collaboration between the U.S. Geological Survey and the Climate Hazards Group of the University of California (USA), and can be accessed at ftp://ftp.chg.ucsb.edu/pub/org/chg/products/CHIRPS-2.0/. It blends satellite estimates and gauge observations based on infrared Cold Cloud Duration (CCD) observations. It covers the global land mass and a monthly temporal resolution and a spatial resolution of 0.05° × 0.05°. In this study, the latest version of CHIRPS v2.0 was used.
The TRMM satellite data is jointly produced by the National Aeronautics and Space Administration and the Japan Aerospace Exploration Agency to observe the precipitation in tropical regions and is available for download at https://pmm.nasa.gov/data-access/downloads/trmm. The satellite was launched into orbit in 1997 and was decommissioned in 2015 [17,31,42]. The data released by the TRMM encompasses an area between 50° N and 50° S latitude and has a temporal and spatial resolution of 3 h and 0.25° × 0.25°. It combines infrared, microwave, and radar information from TRMM and other precipitation-relevant satellite sensors. It blends the ground-observed data from the Global Climatology Precipitation Center (GPCC). In this study, the latest monthly 3B43 version 7 data, which was aggregated using 3 h data was released in mid-2011, was used.
The CMORPH combines existing microwave rainfall algorithms to generate a new precipitation estimation. In this process, motion vectors derived from half-hour interval geostationary satellite infrared imagery are used to propagate the relatively high-quality precipitation estimates derived from passive microwave data. The Climate Prediction Center provides raw, satellite-only precipitation estimates as well as bias-corrected and gauge-satellite blended precipitation (CMORPH-BLD) products at ftp://ftp.cpc.ncep.noaa.gov/precip/. The CMORPH-BLD product was first released in 1998. The 0.25° daily CMORPH-BLD product covers an area from 60°N to 60°S latitude.
The PERSIANN-CDR was developed by the National Oceanic and Atmospheric Administration (NOAA) based on the Climatic Data Center (NCDC) Climate Data Record (CDR) program [43]. PERSIANN uses local cloud textures from GridSat-B1 infrared data to estimate precipitation based on artificial neural networks. To improve the accuracy of precipitation estimates, the Global Precipitation Climatology Project (GPCP) monthly product (at a 2.5° scale) was used to adjust for bias throughout the entire record generated by the PERSIANN model. More detailed descriptive information about the PERSIANN-CDR can be found in Ashouri et al. [33]. In this study, the PERSIANN-CDR data was downloaded from the Center for Hydrometeorology and Remote Sensing (CHRS) at the University of California, Irvine (http://chrsdata.eng.uci.edu/). It has daily near-global estimates (60°S to 60°N) with a resolution of 0.25° × 0.25° since 1983.
Detailed information about the four satellite-based precipitation products is listed in Table 1. For the calculation of drought index, the daily CMORPH-BLD, CHIRPS and PERSIANN-CDR were aggregated into monthly time scale and CHIRPS dataset was resampled into 0.25° × 0.25° using the nearest neighbor method to maintain consistency with other three satellite-based datasets in this study.
In this study, very dry regions such as deserts and barren land were masked when calculating the monthly SPEIs at the global scale. A land cover type data with a spatial resolution of 0.5° × 0.5° in 2012 [44] was downloaded from the Global Land Cover Facility (GLCF) website (http://glcf.umd.edu/data/lc/) to eliminate particularly dry regions. This land cover product was derived by the Moderate-Resolution Imaging Spectroradiometer (MODIS) satellite and was processed based on the International Geosphere-Biosphere Program (IGBP) land cover classification scheme. This study re-gridded this product into 0.25° × 0.25° and masked the monthly precipitation SPEIs based on the IGBP Class Code of 16, representing barren and sparsely vegetated regions.
2.1.3. Potential Evapotranspiration Data
The potential evapotranspiration (PET) data used in this study is the output of Global Land Evaporation Amsterdam Model (GLEAM) that aims to estimate evapotranspiration [45,46]. The PET data has a range 1980–2018 and can be accessed at https://www.gleam.eu. It has daily temporal resolution and 0.25° spatial resolution. The Priestley and Taylor equation used in GLEAM calculates potential evaporation based on observations of surface net radiation and near-surface air temperature. The GLEAM PET dataset has been widely applied to many hydro-meteorological applications, such as global land wetting and drying trend analyses, global drought monitoring, and regional eco-hydrological resilience to drought [47,48,49]. The daily GLEAM v3.3 PET data was summarized into a monthly dataset in this study.
2.2. The Standardized Precipitation Evapotranspiration Index (SPEI)
The drought index SPEI [9] was used to evaluate the drought monitoring utility of the four satellite-based precipitation estimates versus gauge-observed data. The calculation of the SPEI is based on a water balance, and simultaneously considers the precipitation and potential evapotranspiration (PET). First, the differences between precipitation and PET for month i are calculated based on Equation (1).
Then, these differences are aggregated at various time scales, as shown in Equation (2).
where P and PET represent the monthly precipitation (mm) and potential evapotranspiration (mm), respectively; the parameters k and n represent the aggregation timescale and final month, respectively. is calculated using the P and PET values in the nth month and the preceding k − 1 months. For instance, the calculation of the six-month SPEI requires the D sum values of the five months preceding the current month.
When the monthly differences between P and PET are aggregated, the strong seasonal change may lead to an incomparable SPEI series. To exclude these seasonal effects, the log-logistic probability distribution function, expressed by Equation (3), was chosen to transform the D series into a normal distribution with a mean of zero and a standard deviation of one.
where α, β and γ are scale, shape, and origin parameters, respectively. The detailed derivation process was defined by Vicente-Serrano et al. [9].
2.3. Statistical Metrics
In addition to the SPEI, the correlation coefficient (CC) [29], root-mean-square error (RMSE) [29], probability of detection (POD) [29], and false alarm ratio (FAR) [29] were used to identify the drought event detection capability of the four QPE products. The following equations were used:
where N represents the number of months; S represents the satellite precipitation estimate; G represents the observed precipitation. and are means of satellite precipitation estimate and observed precipitation. n11 represents the drought month detected by both rain gauge observation and QPE, and n10 and n01 represent the drought months that are only observed by rain gauge and QPE, respectively. According to this definition, higher POD and lower FAR indicate better drought event detection capability.
3. Results
3.1. Comparison of the Accuracy of the Precipitation of Quantitative Precipitation Estimation (QPE) Products Versus Reference Data
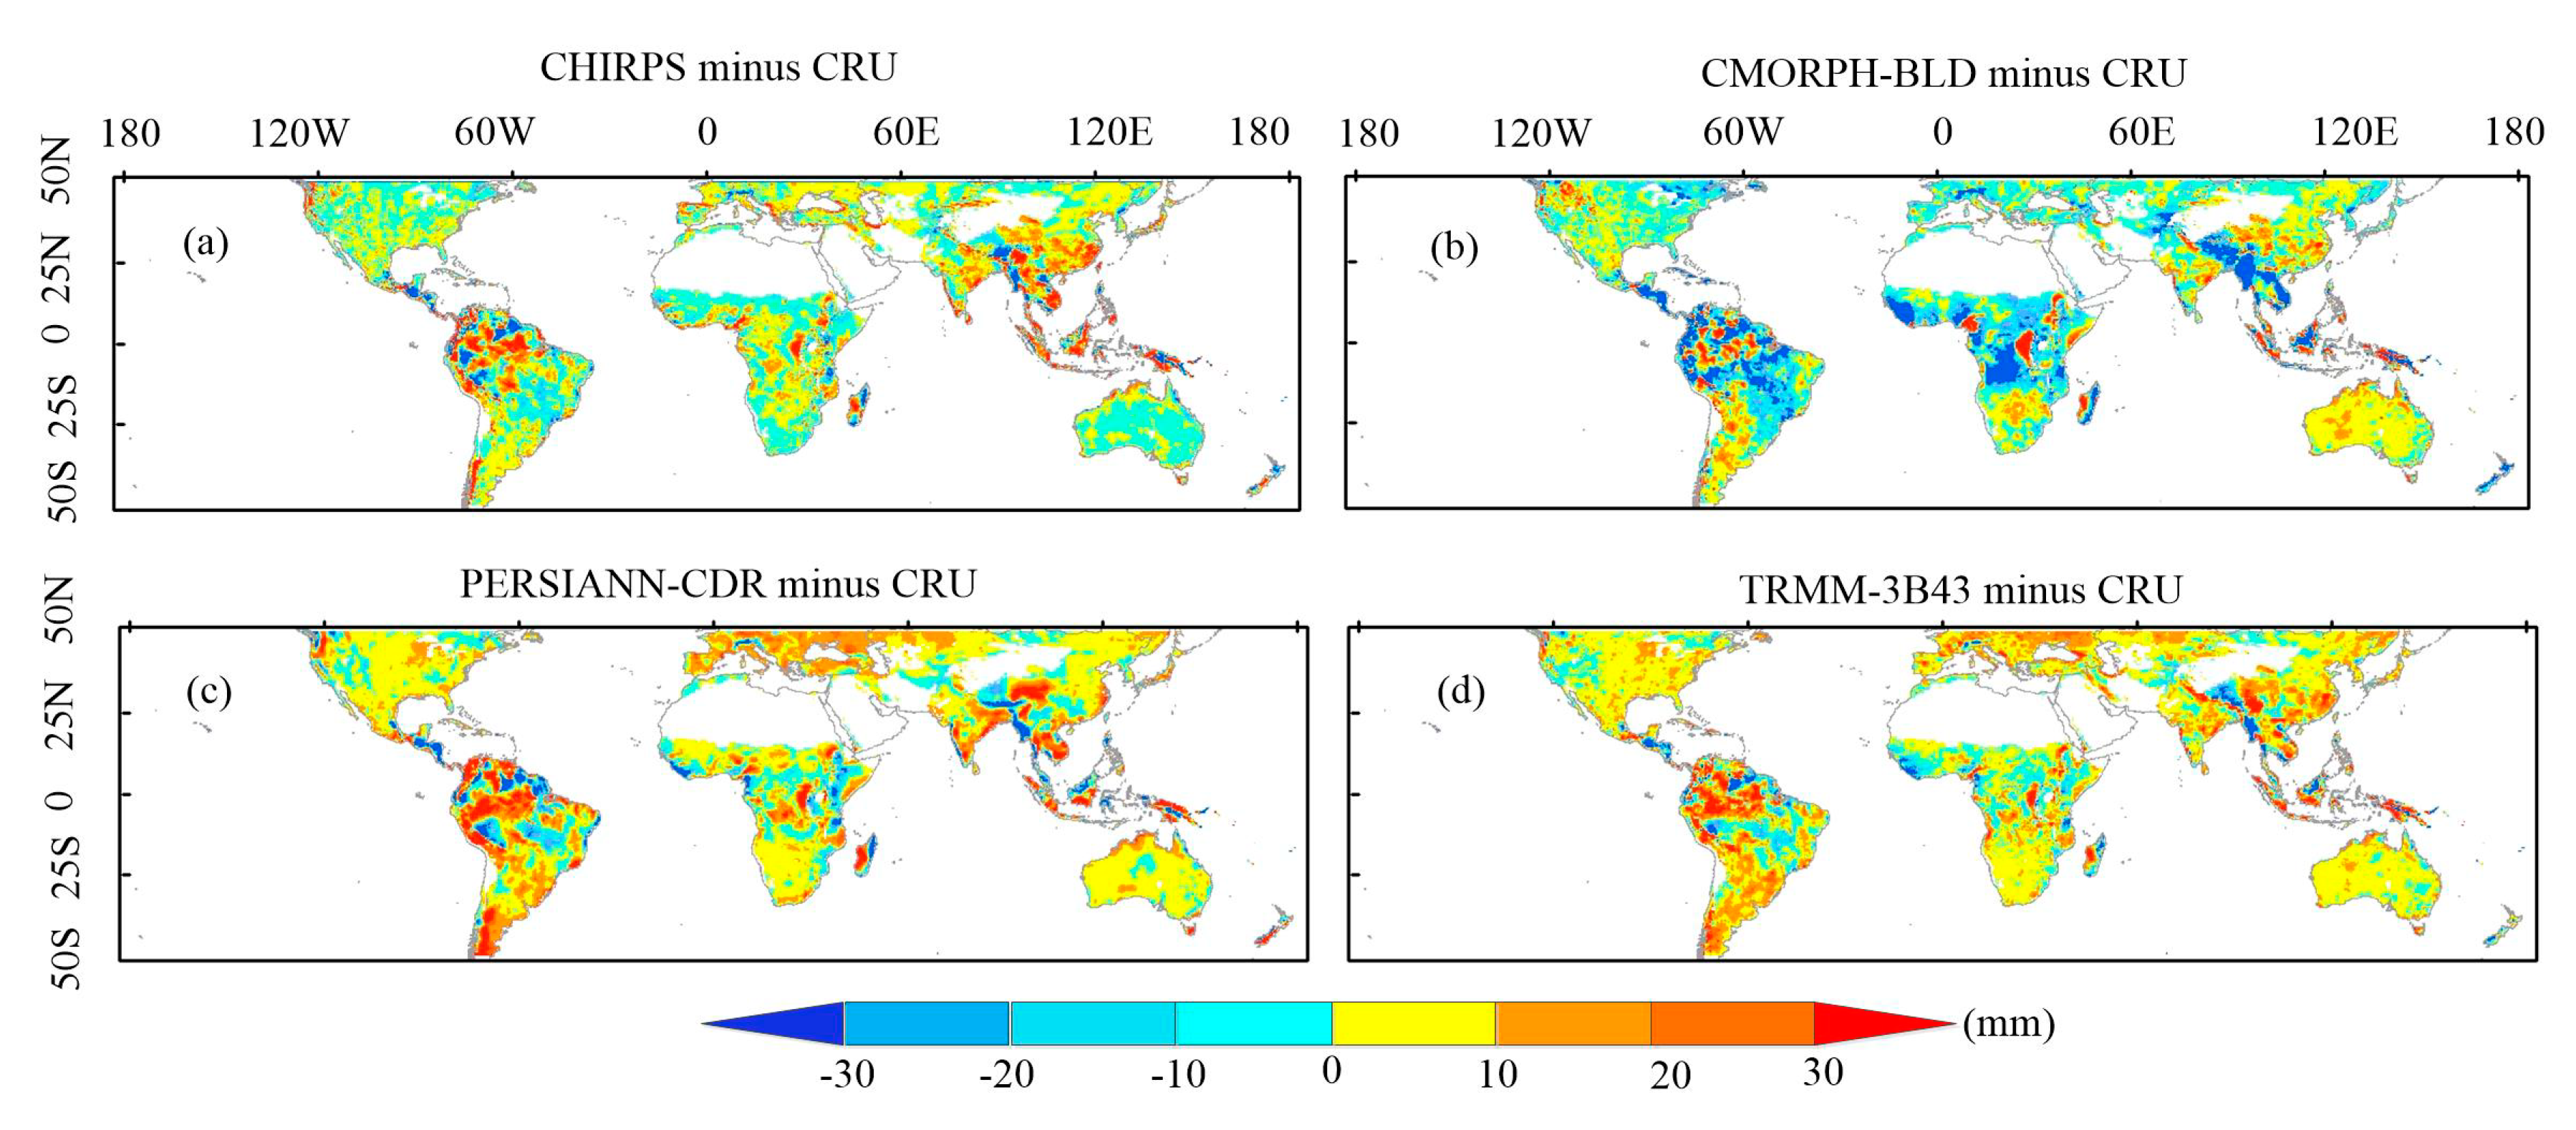
Figure 1 shows the global differences of the mean monthly precipitation between the QPE products and the CRU gauge observations 2000–2016. The distribution of the differences with a spatial resolution of 0.25° × 0.25° has coverage from 50°S to 50°N due to the spatial coverage of the TRMM-3B43 product. The positive values (indicated in red) and negative values (indicated in blue) represent the change from overestimation to underestimation between the QPE products and CRU gauge observations. Overall, the PERSIANN-CDR and TRMM-3B43 have a similar spatial difference distribution over the entire globe and overestimate precipitation for most areas of the world. In contrast, CHIRPS underestimates precipitation for most regions of the world. Severe positive discrepancies (higher than 30 mm/month) for PERSIANN-CDR, TRMM-3B43, and CHIRPS against CRU gauge observations are clearly distributed in Southeast Asia, Central Africa, and Amazonia. However, CMORPH-BLD product has a contrasting performance when compared with the other three products in these regions, and underestimates precipitation more in these areas (exceeding −20 mm/month). In addition, CMORPH-BLD has significant precipitation underestimation in the Tibetan plateau and Himalayas in comparison with the other three products (exceeding −30 mm/month).
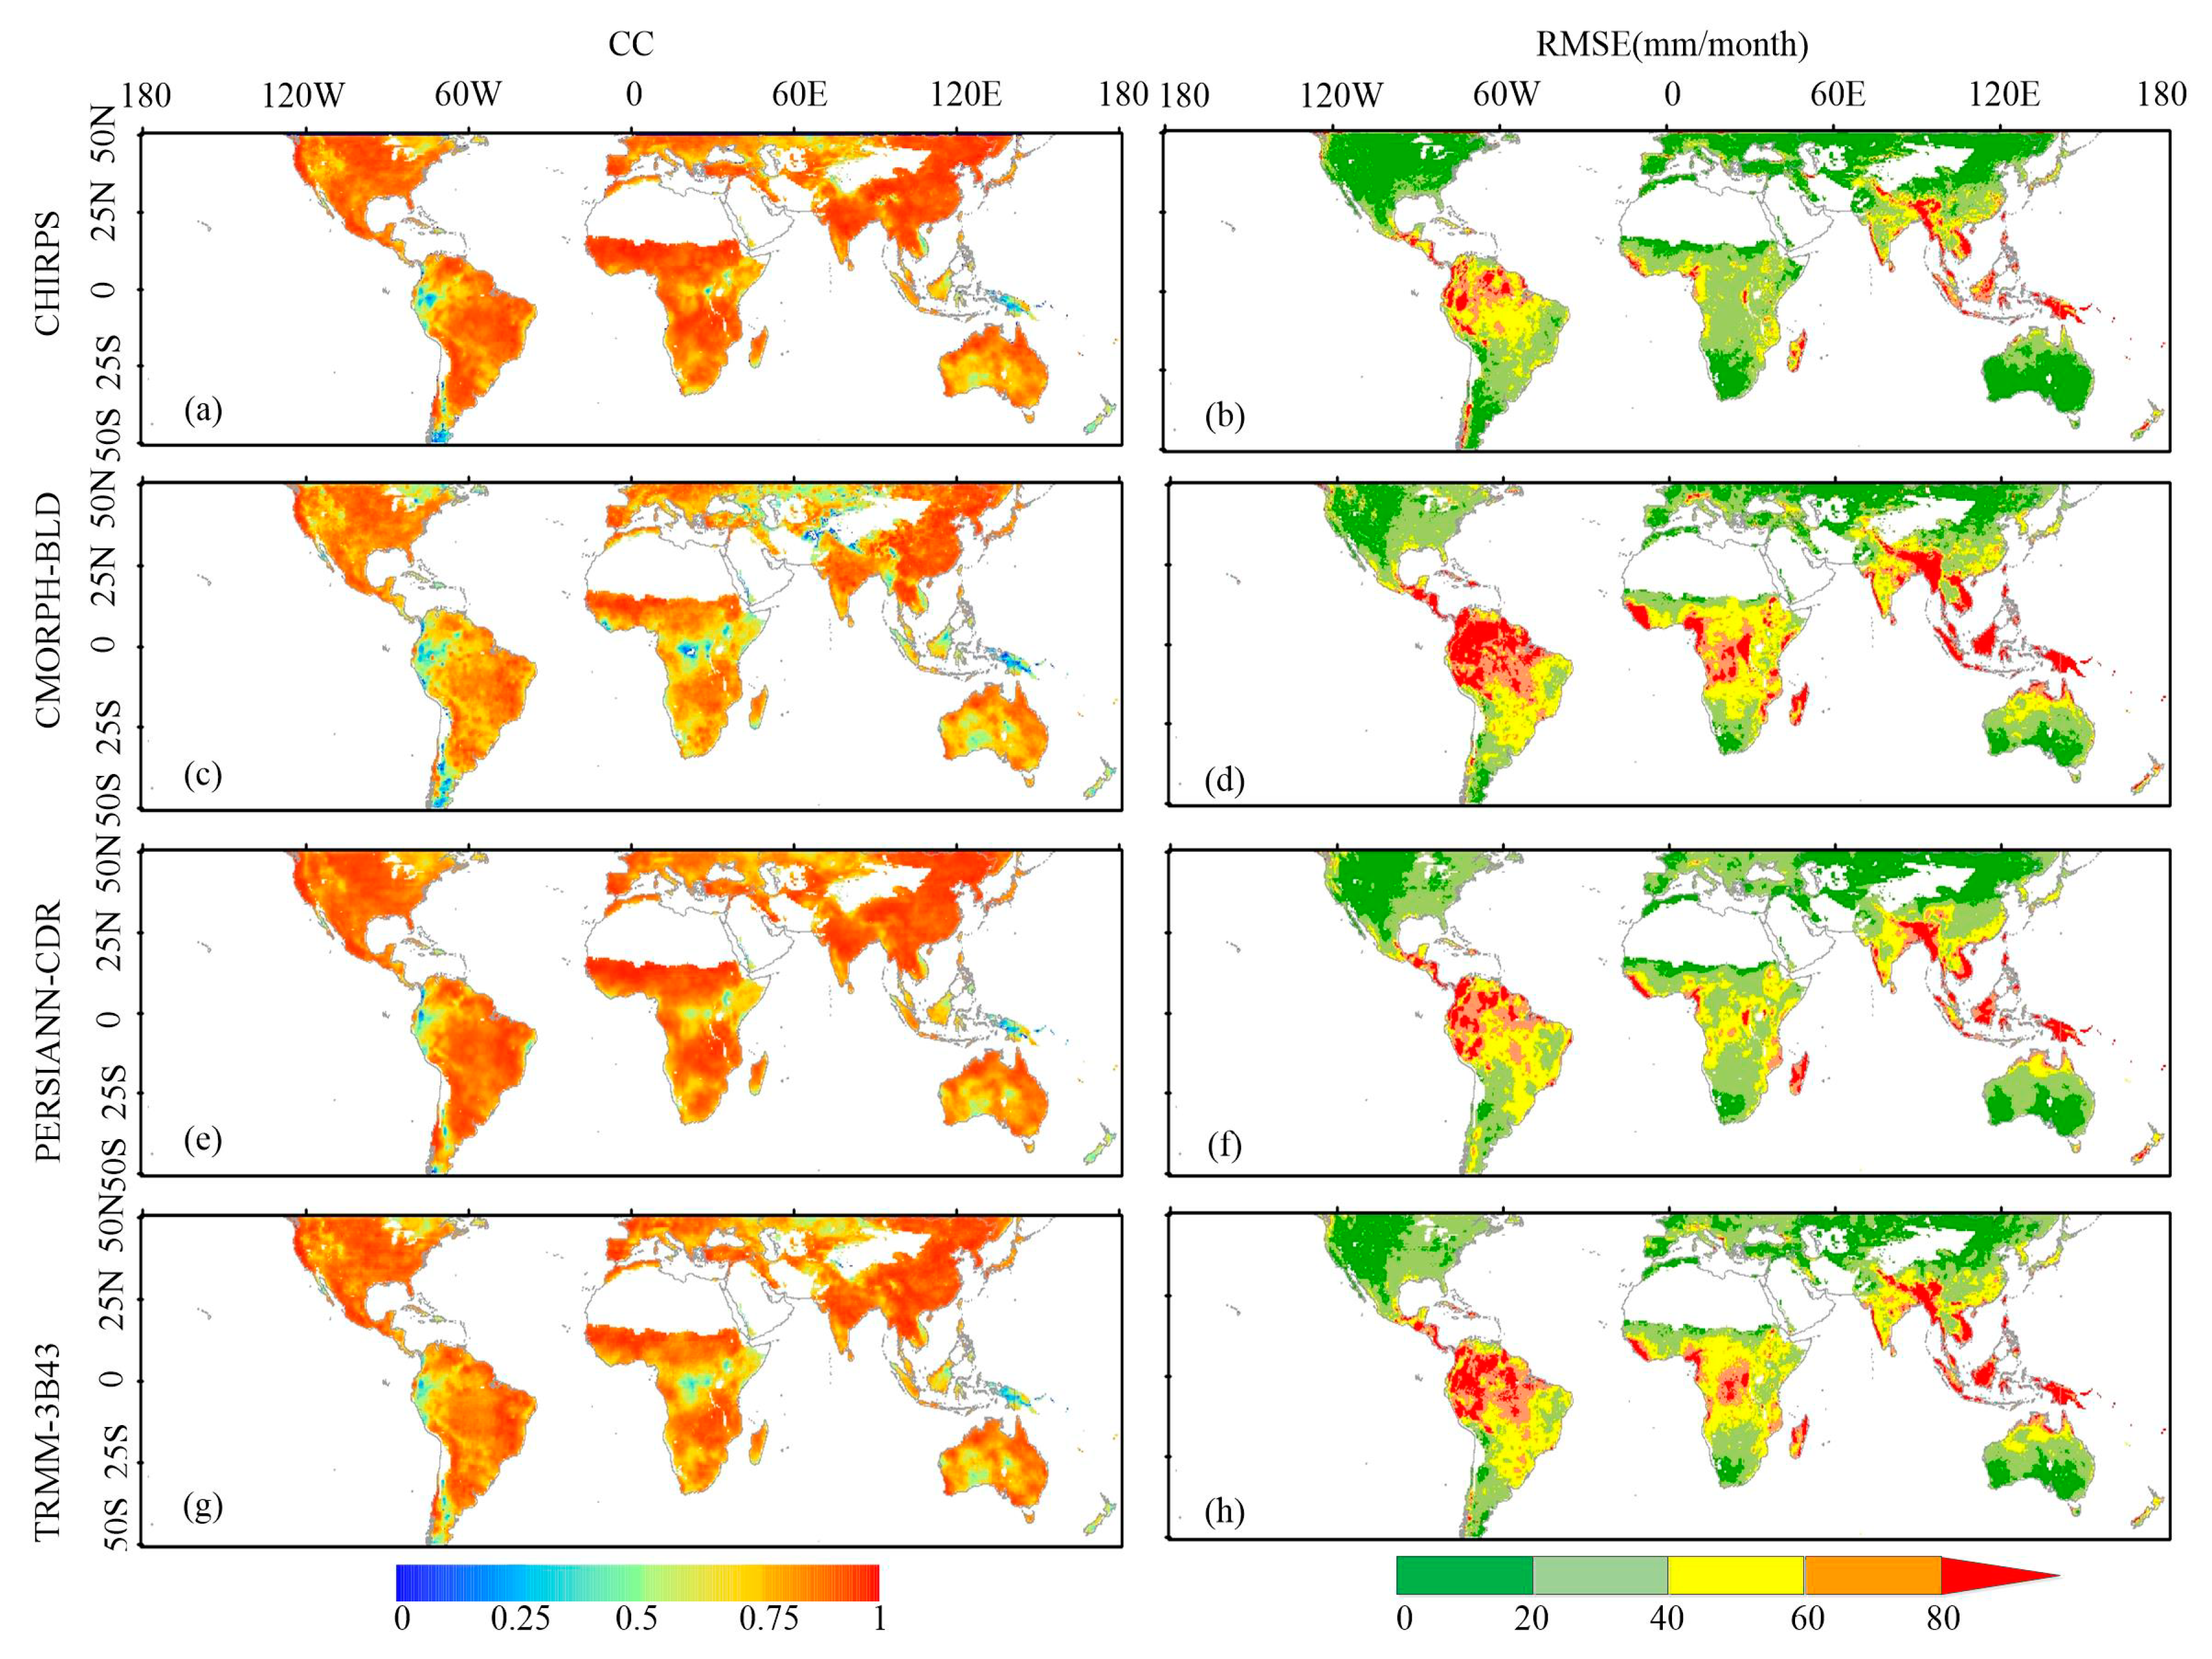
The spatial grid distributions of CC and RMSE between the QPE products and CRU precipitation are plotted in Figure 2. For the four satellite-based precipitation products, regardless of whether it is CC or RMSE, the worse results were obtained for Southeast Asia, Central Africa, Amazonia, the Tibetan plateau, and the Himalayas. In these regions, the CC values are generally lower than 0.65 and the RMSE values exceed 60 mm/month.
The three quantiles (5%, 50%, and 95%) of monthly areal mean CC and RMSE over the six continents are provided in Table 3. They show that the continents with denser gauges (e.g., North America, Europe, and Oceania) generally had higher correlations and smaller RMSE than continents with sparse gauges (e.g., Africa and South America) between remotely sensed data and in situ data. These findings are consistent with similar findings of previous studies [17,26,51]. This indicates that sparse gauges can result in high discrepancies between in situ observations and QPE products and cause high uncertainties in the evaluation of the QPE products at global and regional scales. Additionally, complex climate and terrain characteristics and the method of precipitation retrieval might cause errors between the QPE products and rain gauges [26]. In addition to these common features among the four QPE products, the data in Table 3 also show differences among the satellite products in the same region. Generally, CHIRPS had the best performance in Europe, Oceania, and Africa; PERSIANN-CDR had the best performance in North America, South America, and Asia; CMORPH-BLD had the worst statistical indices in all the continents.
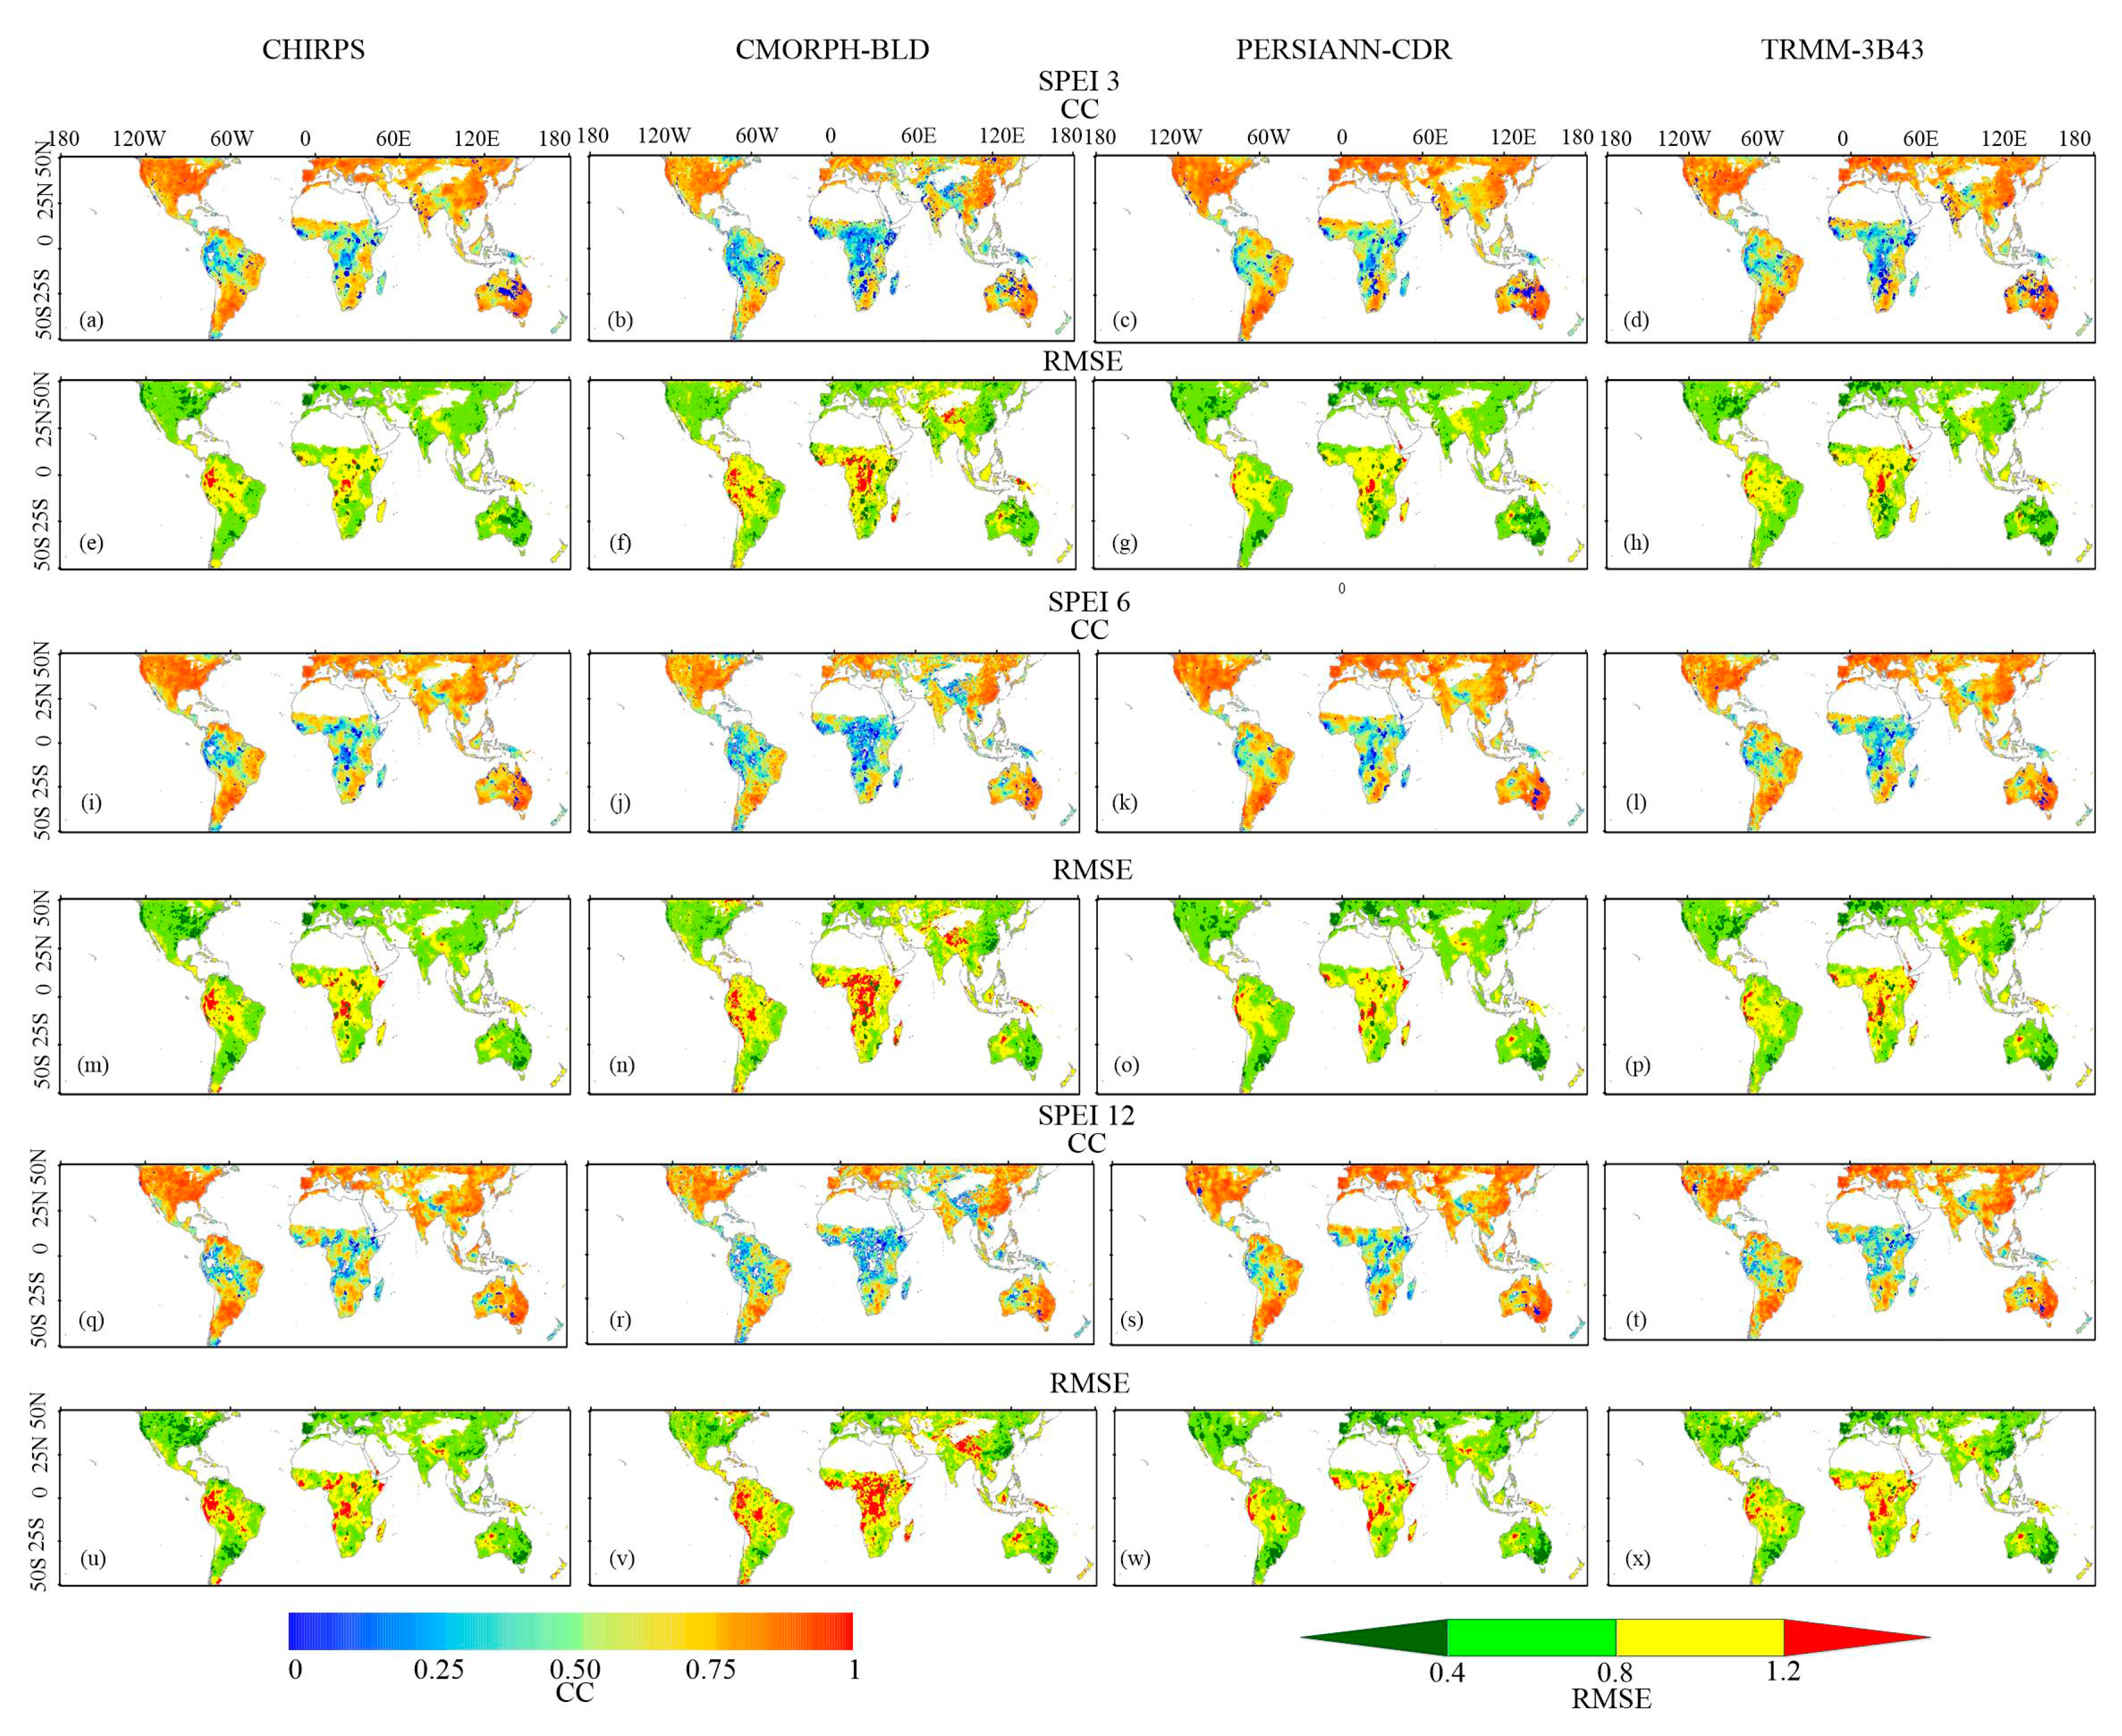
3.2. Comparison of the Grid SPEI Estimates from the QPE Products and References
The SPEI from the four QPE precipitation products are compared in this study. The spatial patterns of the CC and RMSE were used to reflect the discrepancies from SPEI estimates of QPE products with respect to the CRU SPEI estimate at three time scales (3, 6, and 12 months). The CC and RMSE for the SPEI3, as seen in Figure 3a–h, SPEI6, as seen Figure 3i–p, and SPEI12, as seen in Figure 3q–x, are shown in Figure 3. Overall, the spatial distributions of the CC and RMSE for particular QPE products at three time scales are similar due to consistent precipitation and PET, which were used to calculate the SPEI. Furthermore, the spatial distributions of the CC and RMSE of four QPE products at a single time scale show clear differences, which may be caused by the effect of the respective processing algorithm on different complexities of underlying geographical surfaces and climate as well as the density of the rain-gauge network used to calibrate the satellite data. Four SPEIs have worse performances in Central Africa, Amazonia, the Tibetan plateau, the Himalayas, and Southeast Asia. Specifically, the central African area showed the worst CC (<0.5) and RMSE (>0.8) performances for the four QPE products when compared with other areas in the world. In contrast, the southeastern United States, southeastern South America, southern Africa, most areas of India, Australia, and eastern China have high CC values (>0.8) and low RMSE values (<0.4) for the four QPE products in Figure 3. Notably, TRMM-3B43 and PERSIANN-CDR show evident improvements in the northwest of the Amazon compared to CHIRPS and CMORPH-BLD, as seen in Figure 3.
To further quantitatively compare the SPEIs calculated by the QPE products and the CRU precipitation, the CCs metrics (5%, 50%, and 95% quantiles) of the QPE products in the six continents are shown in Table 4. PERSIANN-CDR generally has higher CC in most regions in the globe (except for Africa) and CMORPH-BLD has lower CC in the world; CHIRPS and TRMM-3B43 have comparable performances. In addition, the data presented in Table 4 also show that the SPEI12s of the four QPEs generally show the lowest CCs for each quantile in the world. The systematic error, which dominates the errors of the QPE products, may accumulate with an increasing timescale.
Notably, the SPEI CC and RMSE for CHIRPS had worse performances in comparison with those of PERSIANN-CDR in most regions of the world (except for Africa) despite the better precipitation records of the CHIRPS than that of PERSIANN-CDR in Europe, Oceania, and Africa in Table 3. These results indicate that there is more severe inconsistency in the temporal variability between the SPEIs CHIRPS and SPEIs CRU gauge observations and the SPEIs that do not co-vary in time.
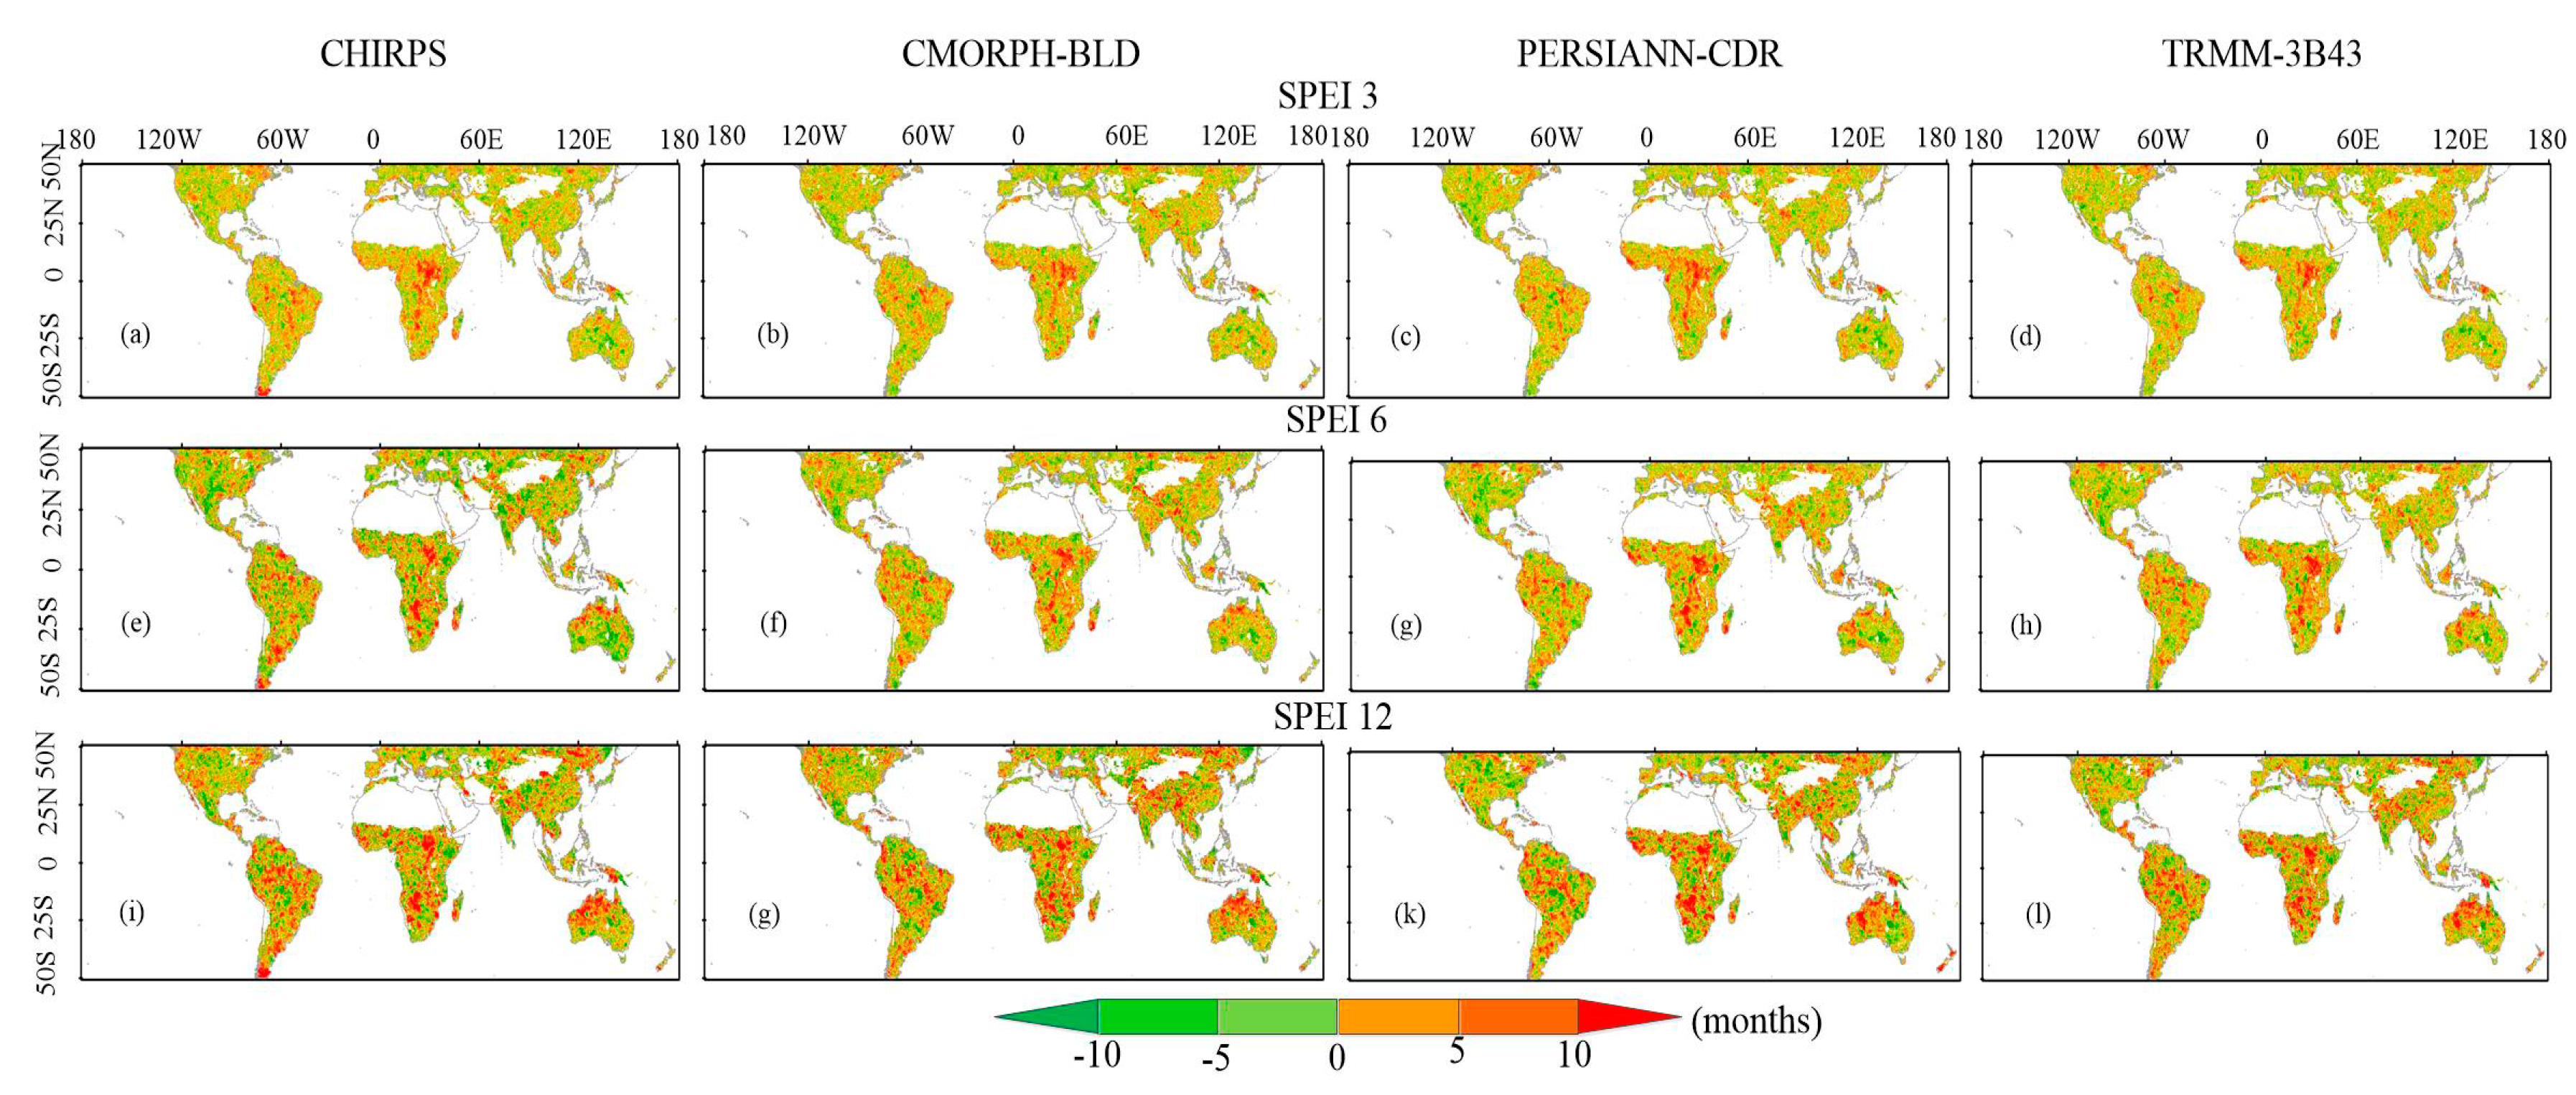
3.3. Analysis of SPEI-Based Drought Events
The regional SPEI can characterize the spatiotemporal variation of drought events. In this study, the SPEI under −1 (moderate dry) was used to identify whether drought is happening in a region. The total number of drought months in each grid is calculated for SPEI 3, 6, and 12 using each of the QPE products subtracting CRU observation. The resulting spatial difference distributions are shown in Figure 4. In general, the four QPE products estimated more drought months in most regions in comparison with the CRU observations, especially in parts of Central Africa, Amazonia, the Himalayas, the Tibetan plateau, and Australia. The difference in the drought month number ranged between 0 and 15 among the four SPEI 3 QPE products. For each QPE product, the more drought months (even more than 15 months) were identified by the increase of the time scale.
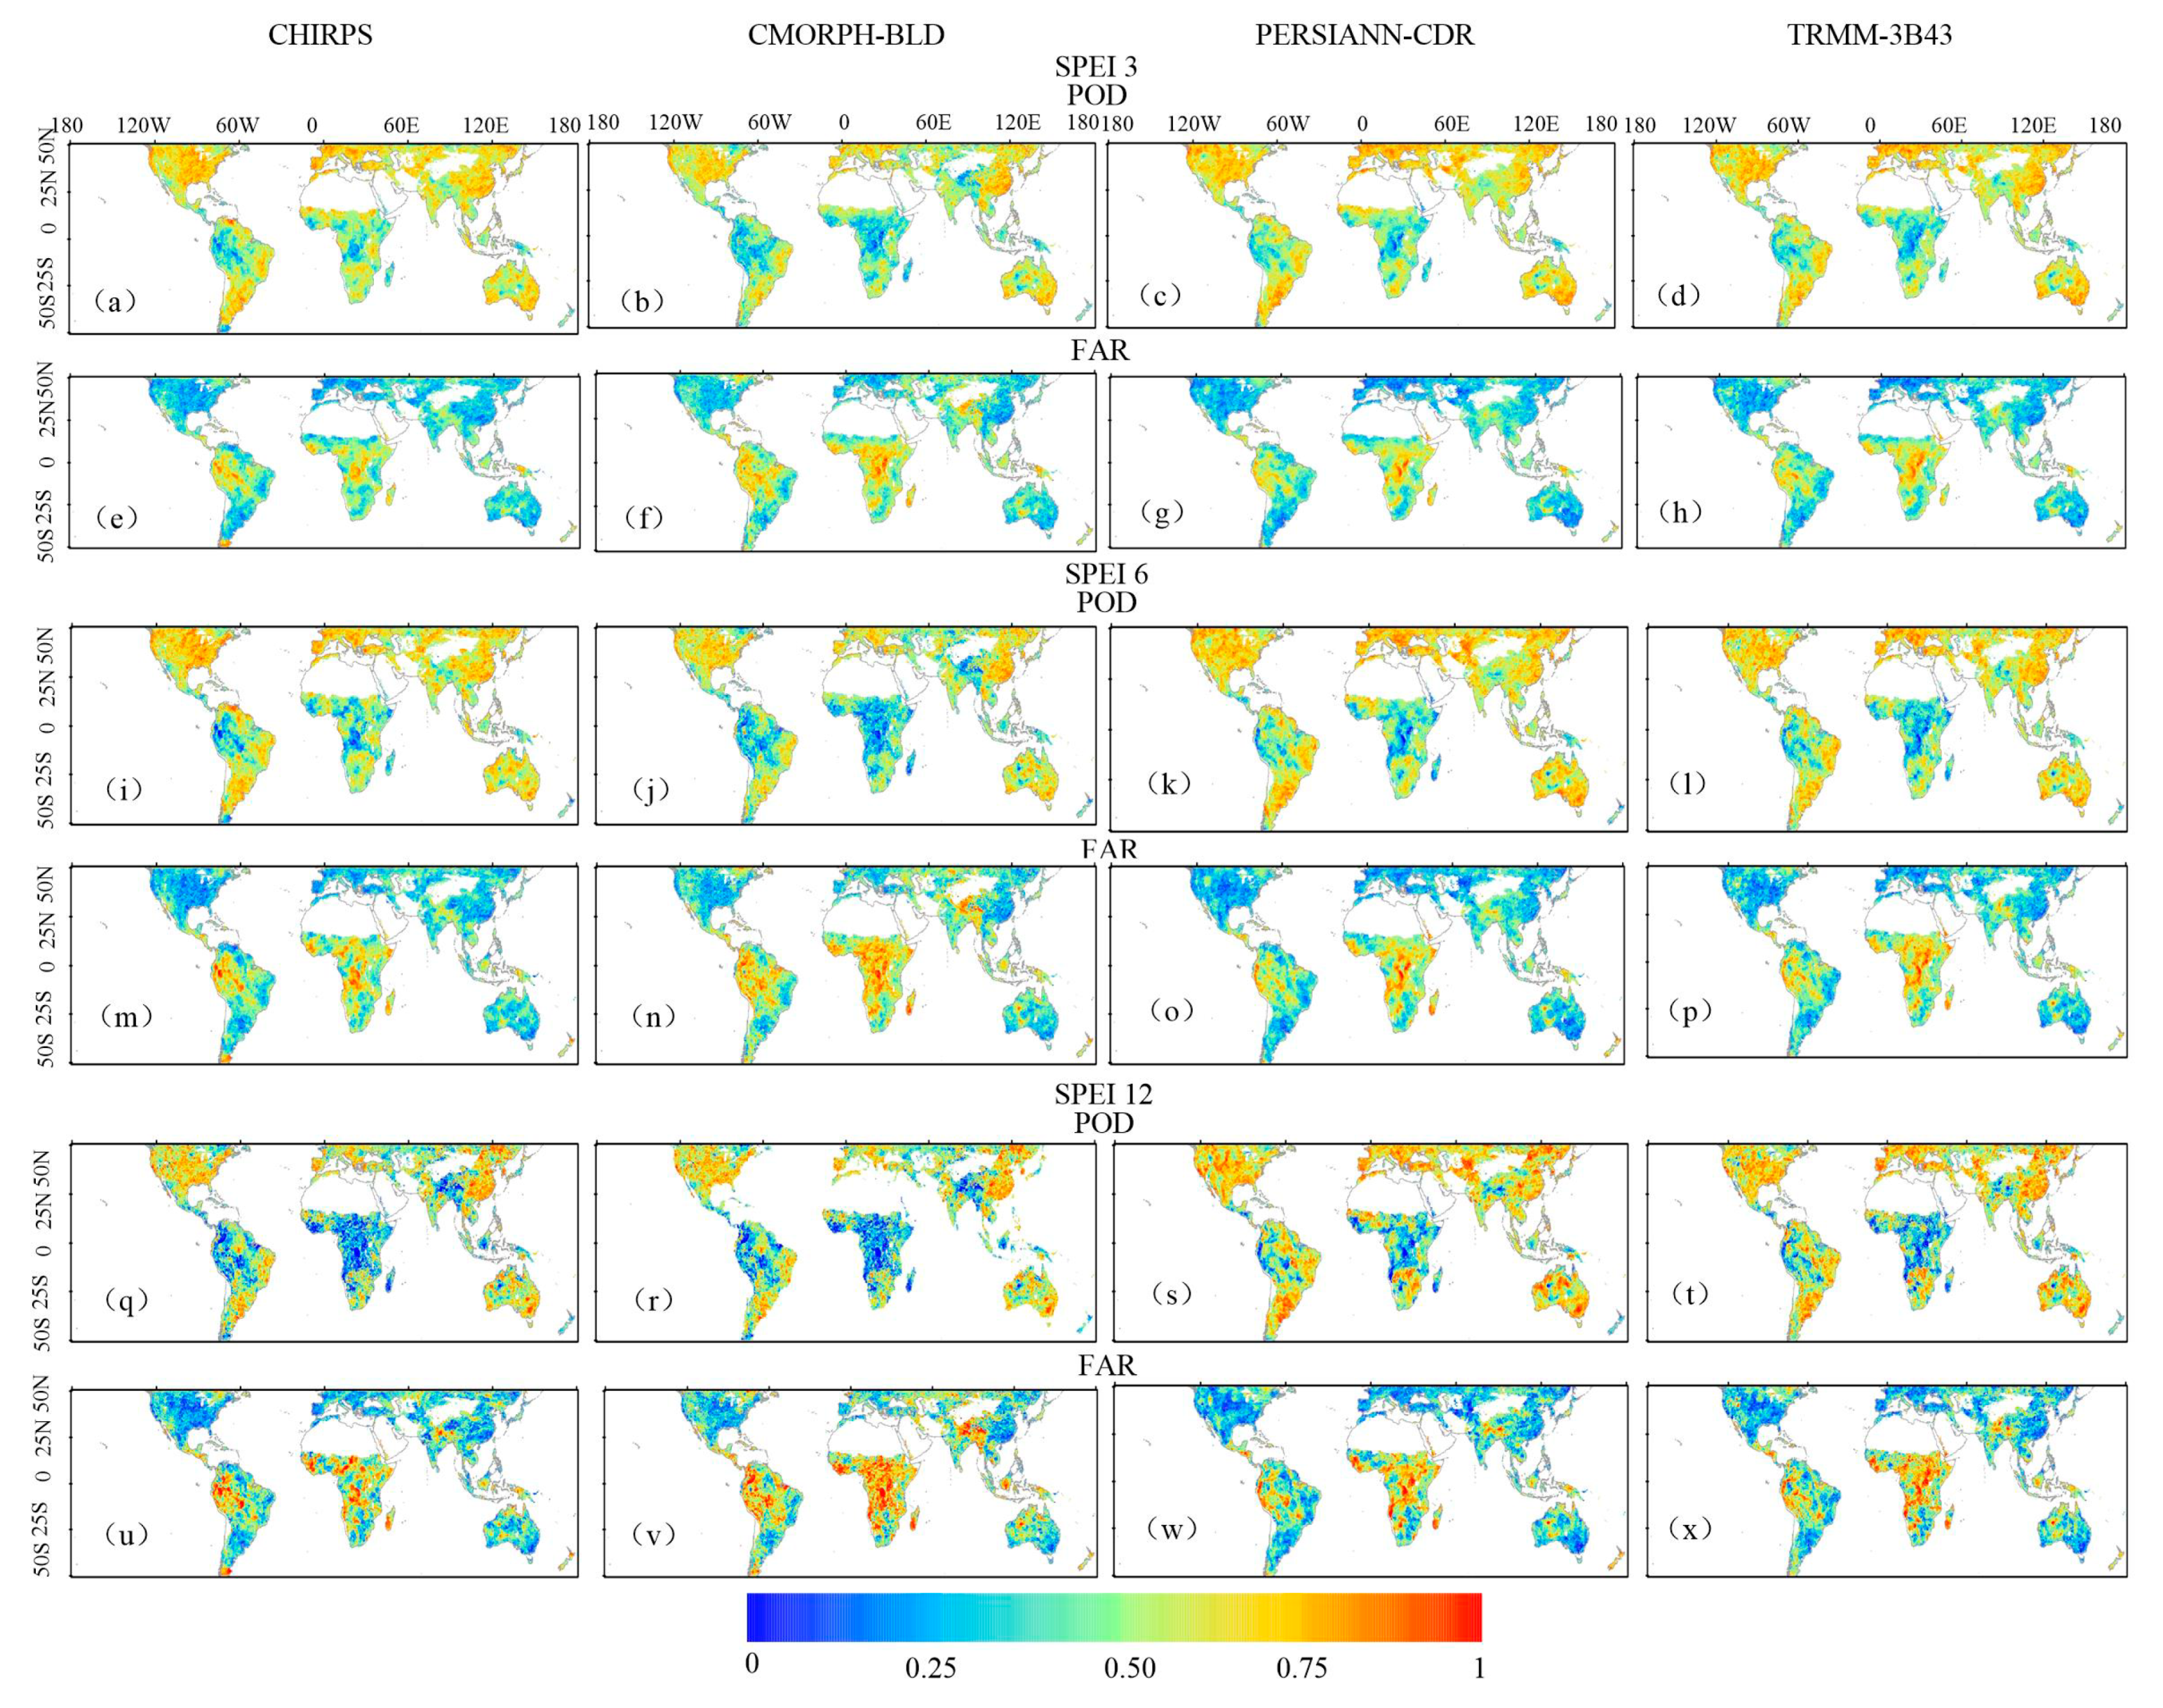
To further determine whether the QPE products and CRU observations can capture the same drought events, this study paired the POD and FAR for each QPE product and CRU observation data, as seen in Figure 5. Four QPE products exhibited similar spatial pattern of POD and FAR for the SPEI3, with lower POD (<0.45) and higher FAR (>0.5) in Central Africa, Amazonia, the Tibetan plateau, the Himalayas, and parts of Southeast Asia and Australia. These results indicate that more than 50% of the drought events cannot be accurately identified by the QPE products in these regions. In comparison with the above regions, other regions in the world, e.g., the southeastern USA, southeastern China, western Europe, and southern South America, performed well and had higher POD (>0.75) and lower FAR (<0.25), indicating that the QPE products can capture more than 75% drought events in these regions. Additionally, the CMORPH-BLD and PERSIANN-CDR obtain the worst and best global performance, respectively, especially in Central Africa, Amazonia, the Himalayas, and the Tibetan plateau. The results for the SPEI3 are similar to those for the SPEI6 and SPEI12.
3.4. Studies of Several Specific Drought Events
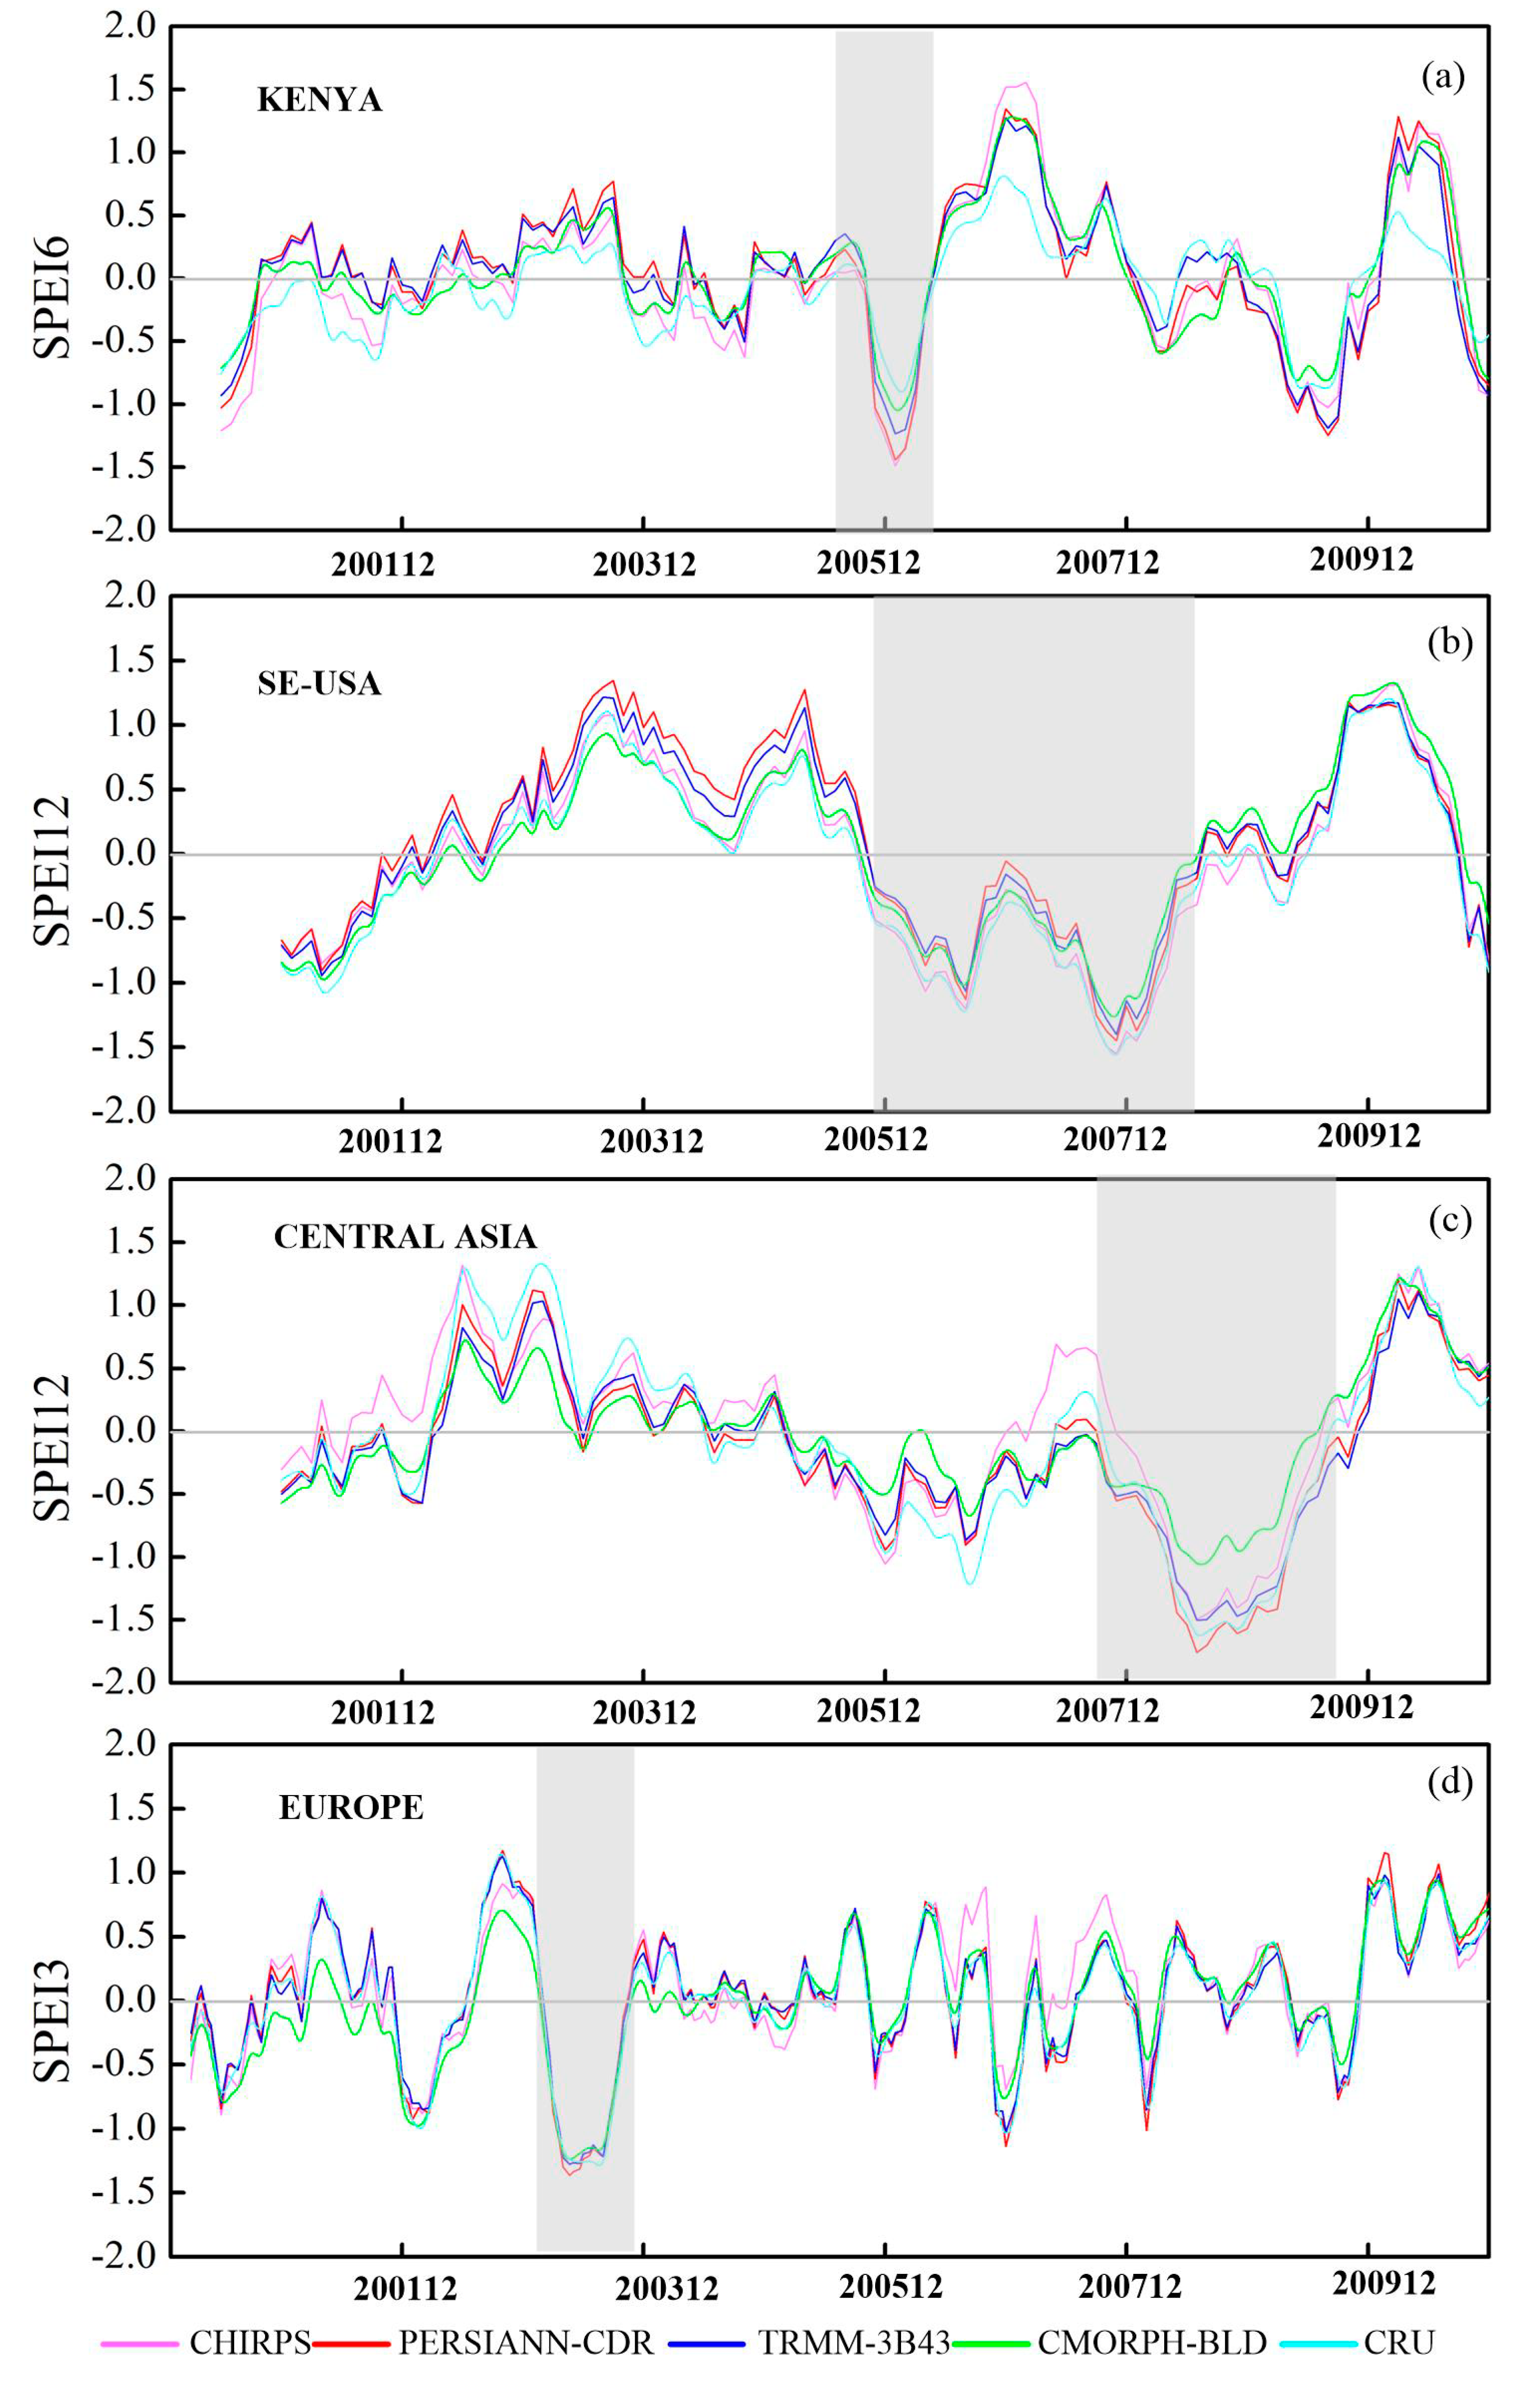
The temporal and spatial variations of the drought index reflects the occurrence of drought events. In this study, four drought events in different locations and climatic regimes (the 2007 southeastern USA drought, the 2003 western European drought, the 2006 Kenyan drought, and the 2008 central Asia drought) were analyzed. The SPEI durations that best characterize these drought events were provided by Sahoo et al. [30] and Guo et al. [12]. Detailed information about these drought events are listed in Table 5.
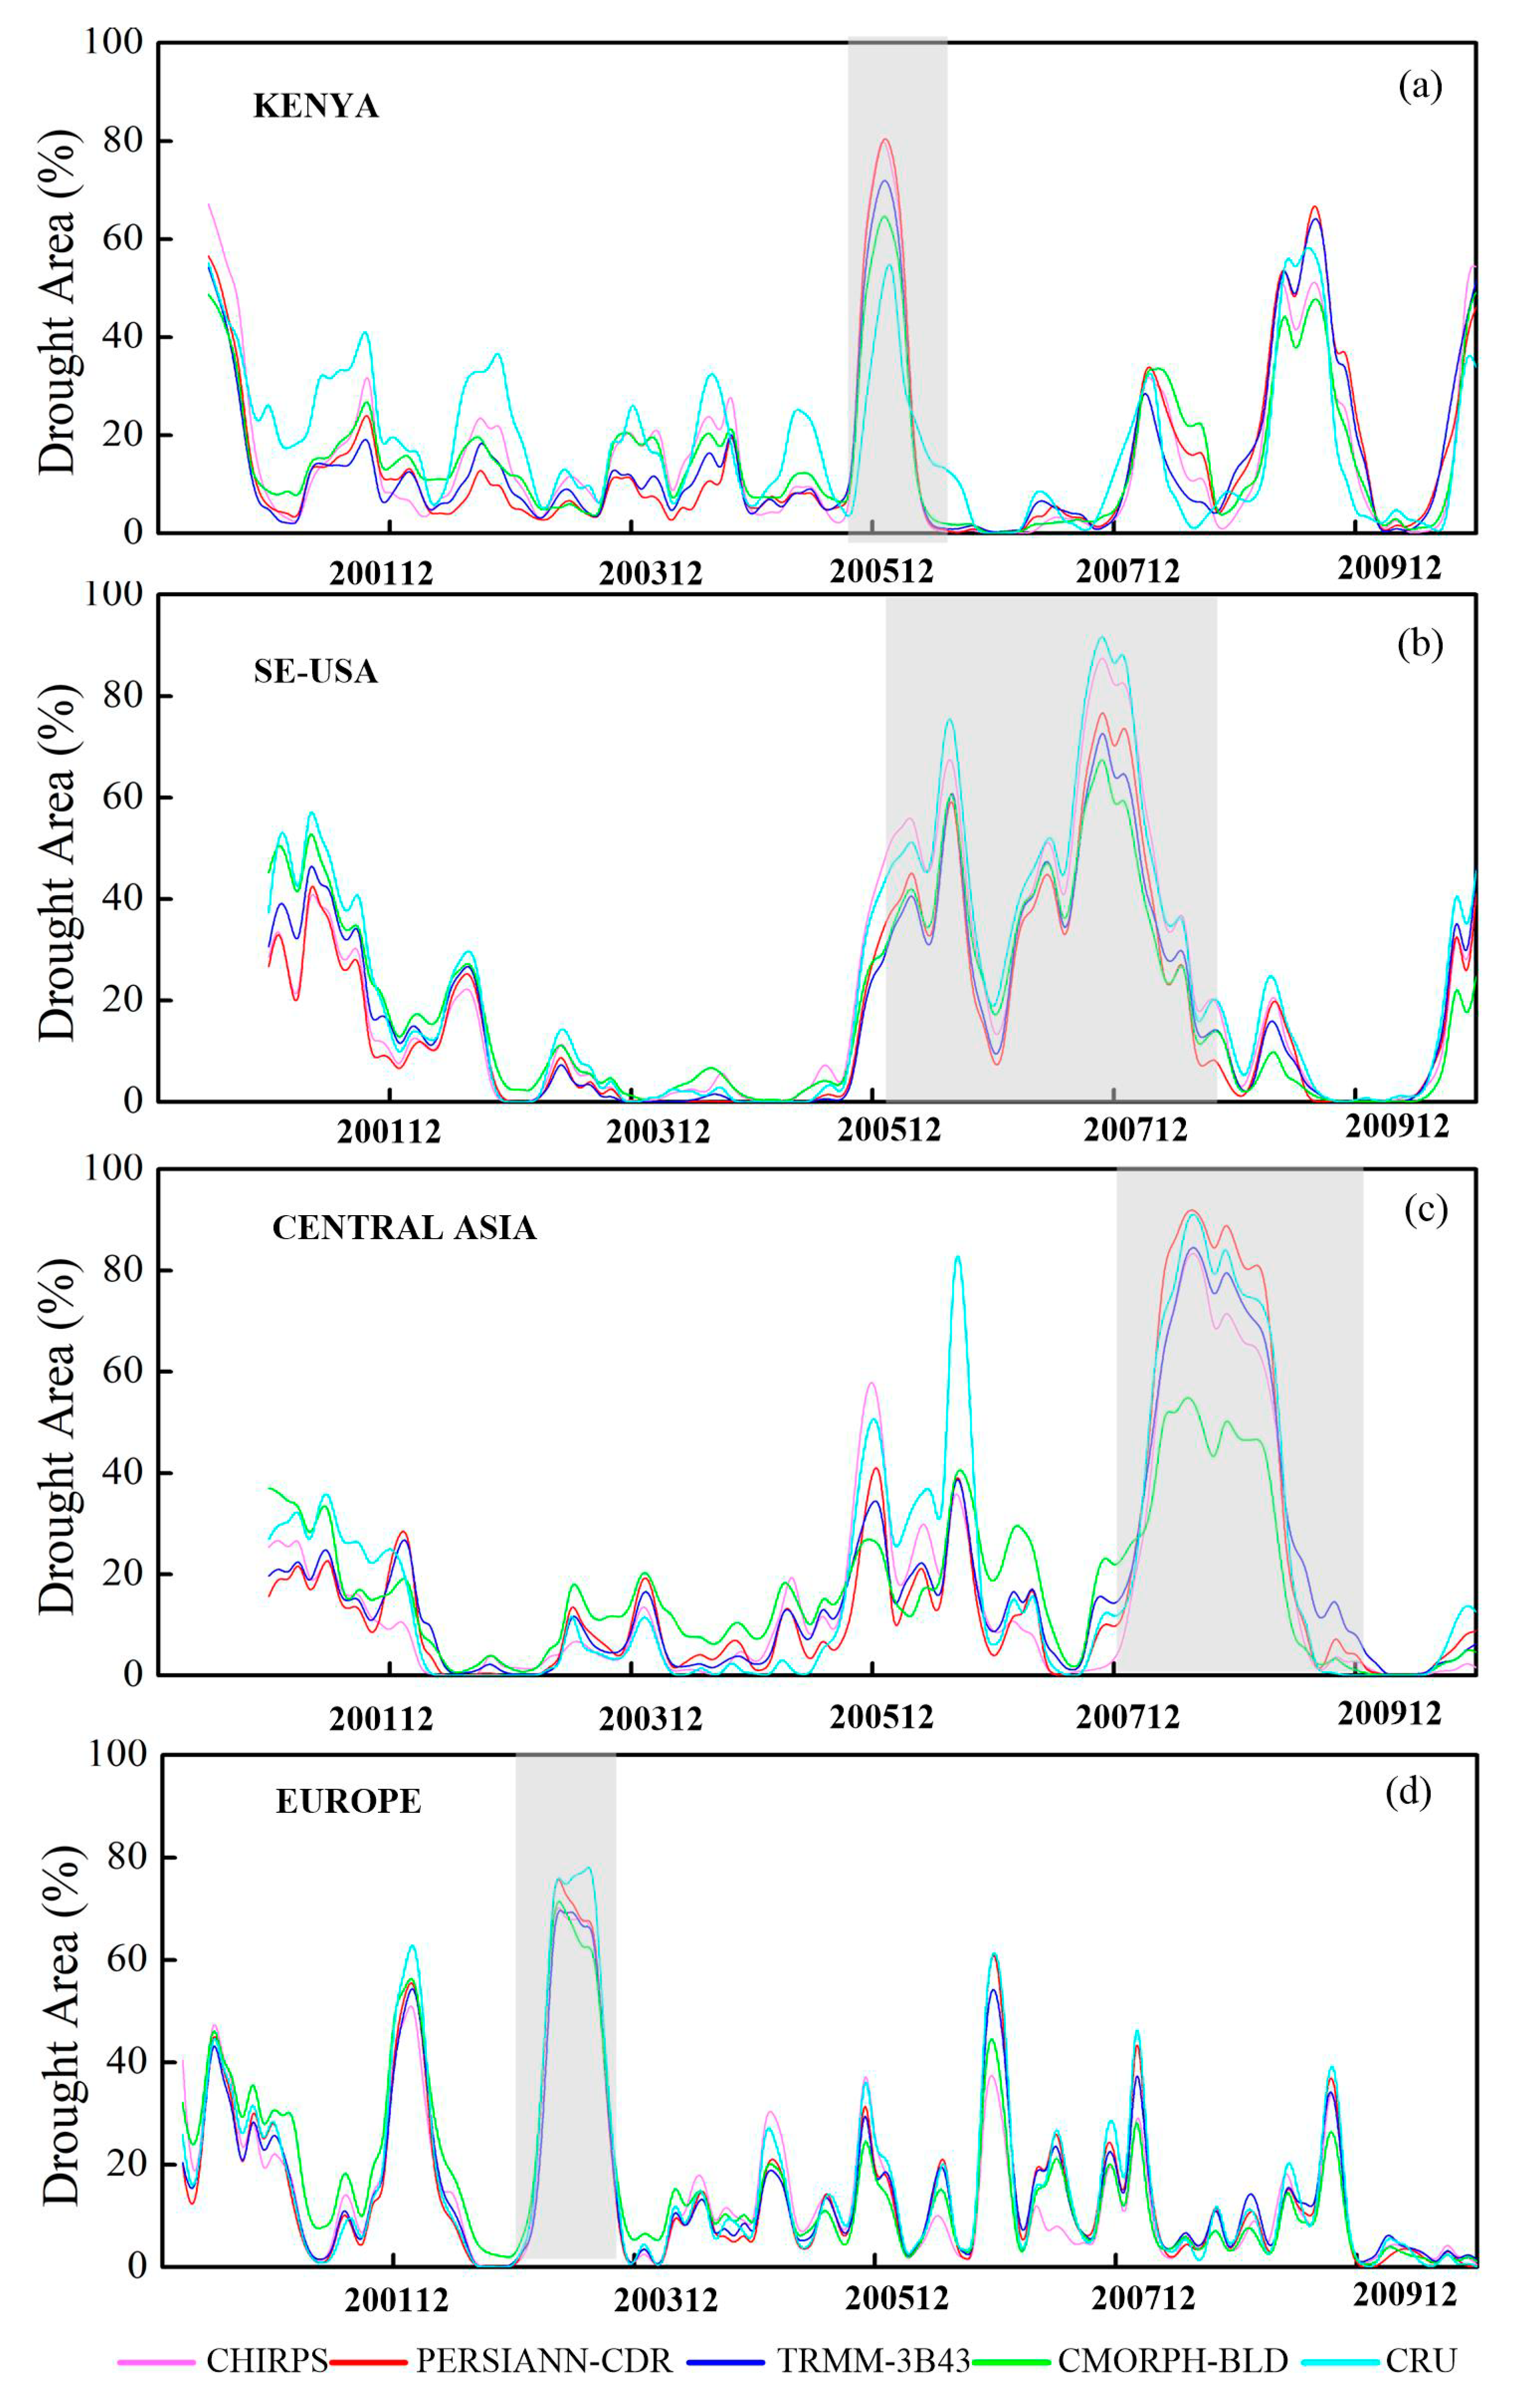
The monthly areal averaged SPEI series for the four QPE products and CRU observations between 2000 and 2016 are plotted in Figure 6. The dotted domain in the Table 5 for each precipitation product was used to calculate the areal averaged SPEI time series in Figure 6 and Figure 7. The drought duration of each drought event is highlighted with a gray background in each plot. The SPEI time series of four satellite-based precipitation products and CRU precipitation are generally in agreement from 2000 to 2010. All datasets (except for CMORPH-BLD) can determine the five typical drought events using an areal mean SPEIs below −1 (moderately dry). The CMORPH-BLD is not able to effectively pick up the 2008 Central Asia drought and the 2006 Kenyan drought despite several grid values being less than −2.25.
This study also calculated the proportion of the monthly drought grid number to the monthly total spatial domain number using the drought event criteria mentioned above for each drought event. The calculation results are shown in Figure 7, where the drought event durations are labeled using a gray color. These results show that the drought area proportions of the five drought events are general consistent with the SPEI time series shown in Figure 6. Overall, the four precipitation datasets can distinguish more than 60% of drought extents for every drought event under moderate dry conditions with the exception of CMORPH-BLD estimate for the 2008 drought in Central Asia.
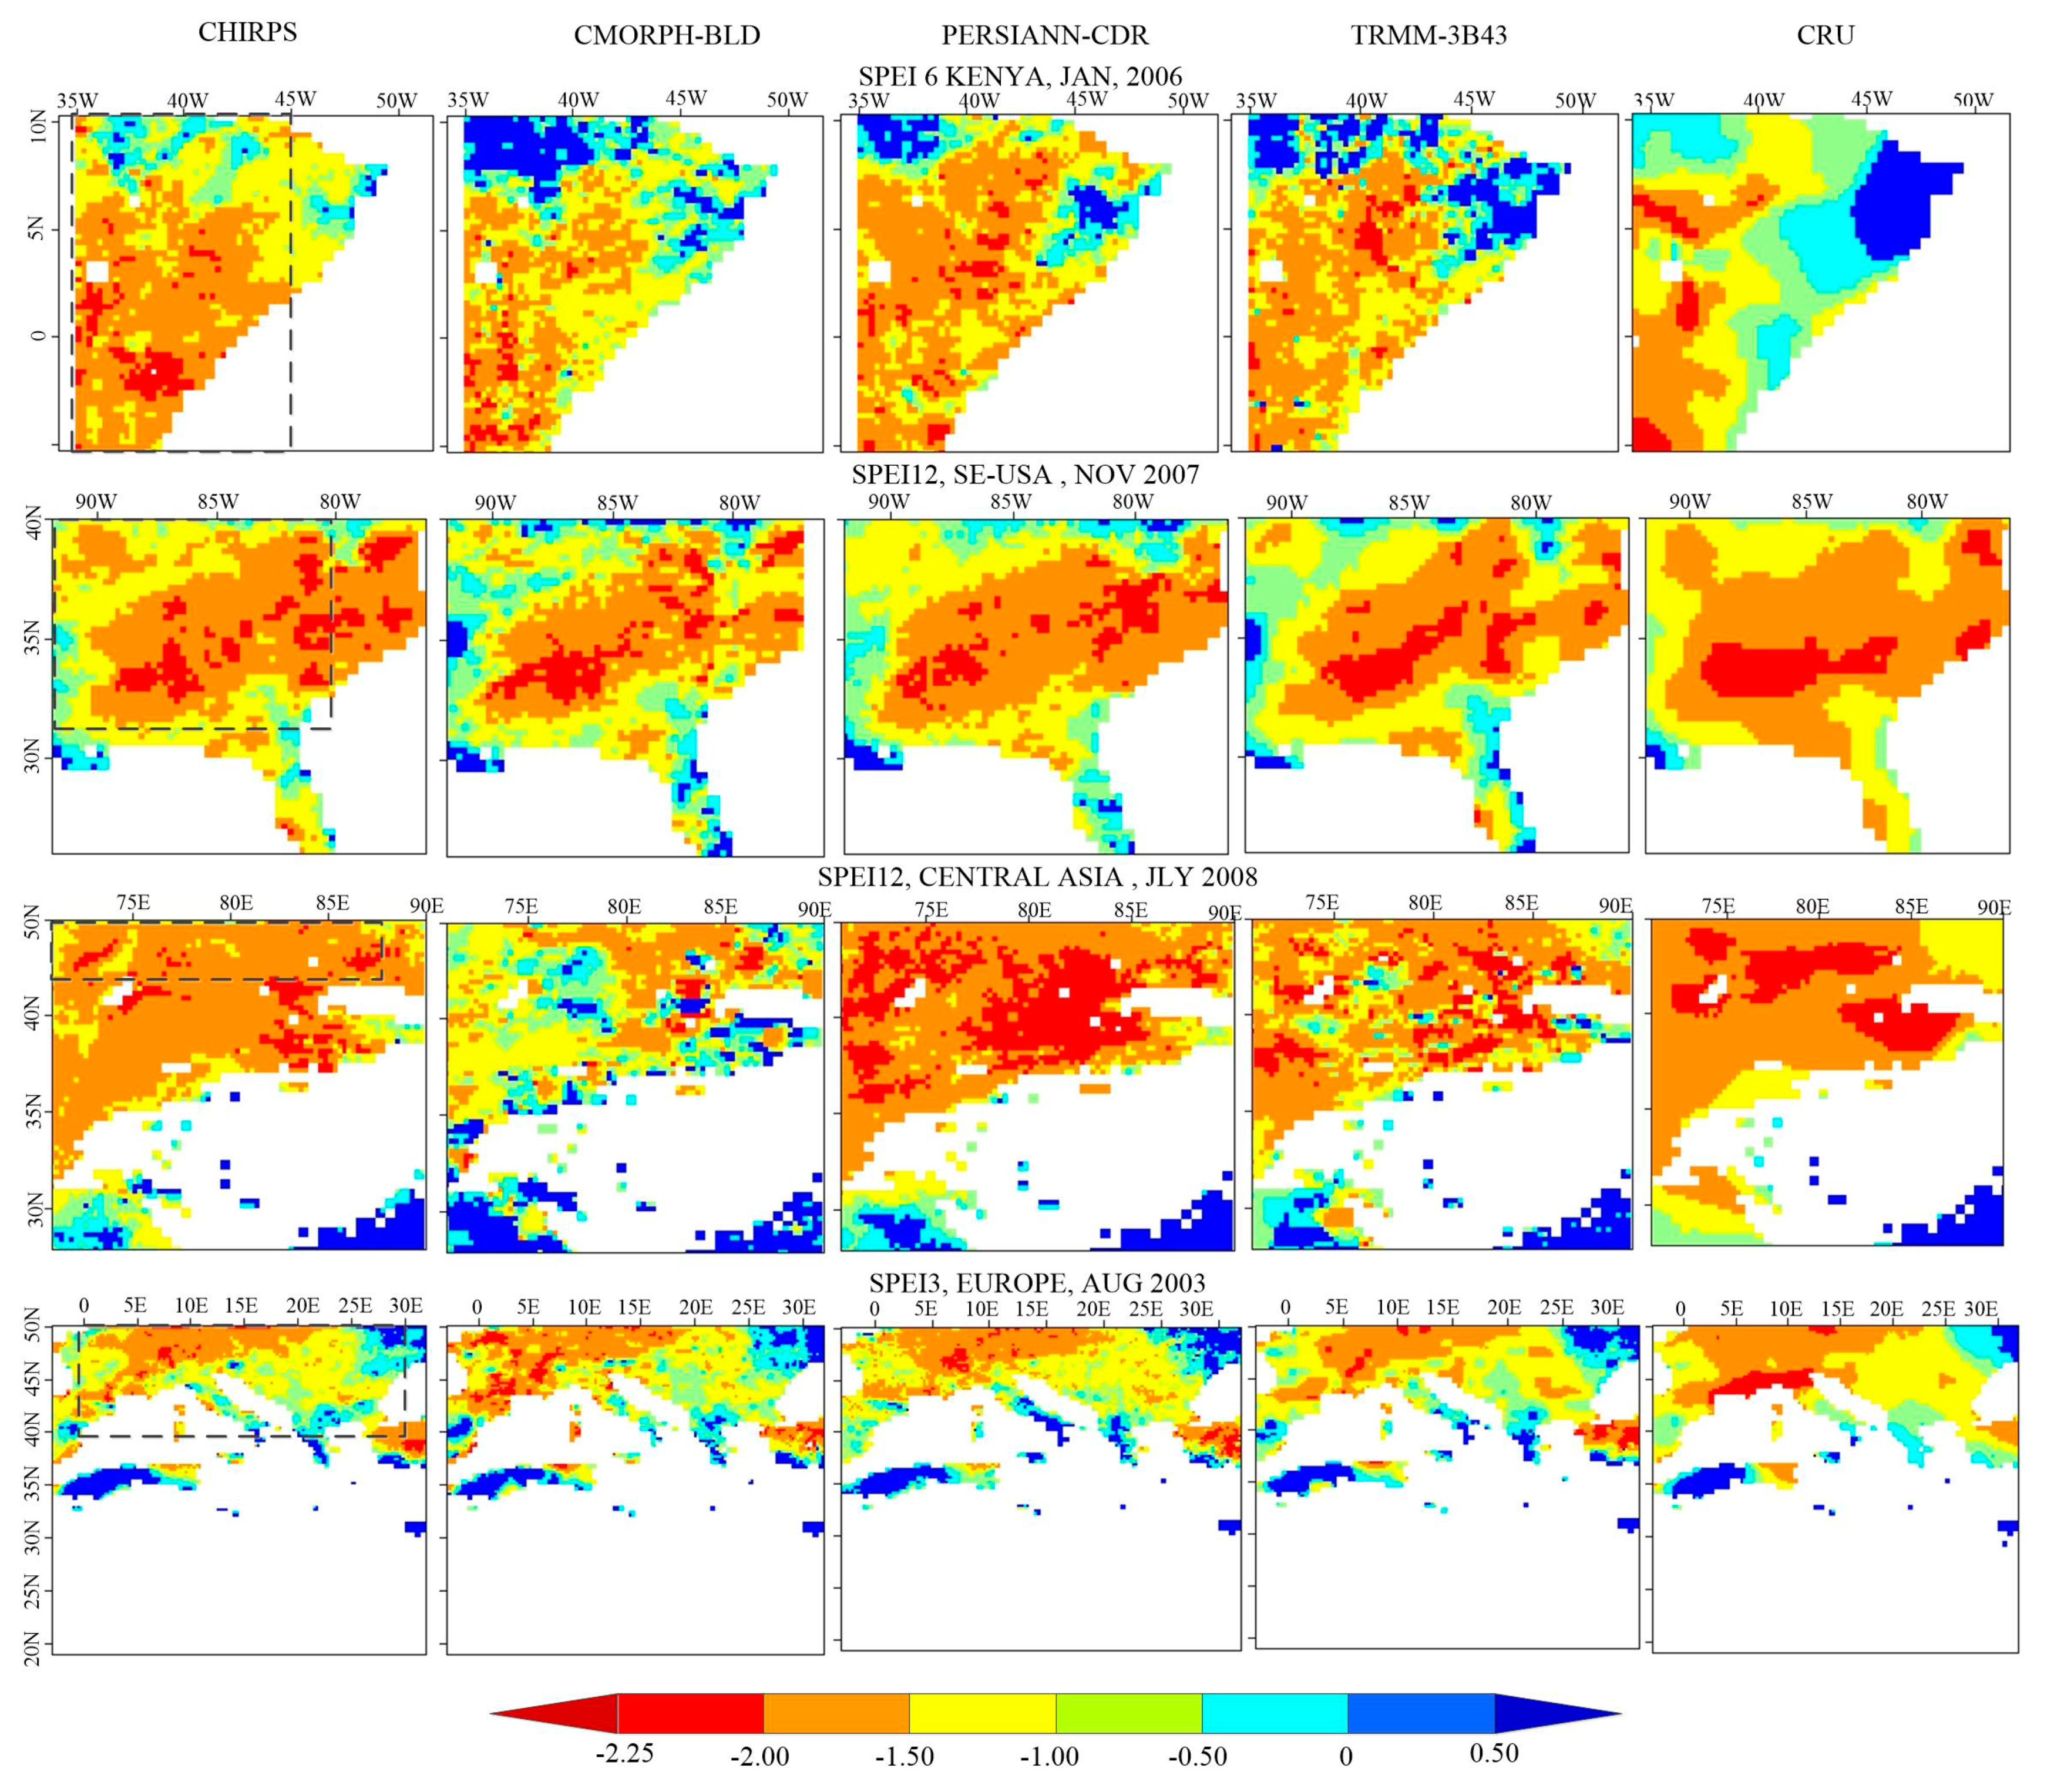
In addition to the descriptions of time series for drought events, the spatial distributions of the SPEI for most drought months and each drought duration are shown in Figure 8. The dotted domain in the first column for each precipitation product was used to calculate the areal averaged SPEI time series for each drought event in Figure 6 and Figure 7. The plots in Figure 8 show that the spatial SPEI patterns of the four satellite-based precipitation products agree with that of the CRU precipitation for the 2003 western Europe drought and the 2007 southeastern US drought. CHIRPS had a distinct over-recognition of drought severity for the 2006 Kenyan drought. In addition, CMORPH-BLD had obvious spatial discrepancies against the other precipitation products for the 2008 central Asian drought. In addition to PERSIANN-CDR, the other three satellite-based precipitation products suffer from under-recognition of the drought domain for the 2008 central Asian drought.
4. Discussion
4.1. Precipitation Accuracy Comparison of the Four QPE Products
The results in this study show that both PERSIANN-CDR and TRMM-3B43 have overall overestimation while CHIRPS underestimates precipitation for most regions of the world. The reasons may be the following: (1) CHIRPS uses gauge data to blend satellite data to produce a preliminary information product while PERSIANN-CDR and TRMM-3B43 employ gauge-based analysis data to blend the satellite data [36,52]. (2) The anchor stations from different sources may result in duplication. For CHIRPS calculation, stations were only added to the anchor list if they were outside of a 10-km radius from any station already in the list, assuming that stations within the 10-km radius to be duplicates [52]. In this sense, duplication could result in a deficient blending and a misrepresentation of precipitation. The statistical indices calculated on the basis of Figure 2 show that CHIRPS has the best performance while CMORPH-BLD has the worst performance. This may be attributed to the time scale of blended data. The PMW–IR (passive microwave–infrared) merged precipitation estimates in the TMPA are calibrated against the GPCC monthly gauge analysis [53,54] over land; the purely satellite-based precipitation estimates are adjusted to the GPCP merged analysis of monthly precipitation [55] to construct the PERSIANN-CDR over land [38]; the monthly CHIRP-station blending process is carried out based on the stations provided by Climate Hazards Group (CHG). However, blending is performed for the CMORPH satellite-based estimates based on the daily CPC gauge-based analysis data. Thus, the daily error accumulation may increase the uncertainty risk of the monthly data. In addition, CPC gauge station network is not appropriate for many sparsely populated or mountainous regions [56], which is an important cause used to interpret this phenomenon.
Sparse distribution of gauge in Southeast Asia, Central Africa, and Amazonia also cause the estimation deviation for all satellite-based products. The Tibetan plateau is a typical region in which few stations could be used in the blending process of satellite precipitation products [57,58]. Moreover, high elevations, cold surfaces, and virga can cause precipitation retrievals on the Tibetan plateau to be generally less accurate in capturing orographic precipitation and solid precipitation [57,58]. In addition, in comparison with the other three products, CMORPH-BLD has significant precipitation underestimation in Tibetan plateau and Himalayas. This may be that CMORPH tends to underestimate the precipitation due to the less-than-desirable performance of the current-generation PMW retrievals in detecting and quantifying snowfall and cold season rainfall.
4.2. Drought Monitoring Utility of the Four QPE Products
The results in Section 3 indicate that the four satellite-based products generally detect and capture the spatial and temporal distribution of droughts in most of the world (except for Southeast Asia, Central Africa, and Amazonia). PERSIANN-CDR generally achieved superior performance in most regions in the world (except for Africa) while CHIRPS and TRMM-3B43 have satisfactory and comparable performances where PERSIANN-CDR performs well. In addition, CHIRPS and PERSIANN-CDR have more than 30 years of data record, which suggests them as alternatives for in situ observations to detect and analyze droughts at regional and global scales. Studies involving the use of CHIRPS and PERSIANN-CDR to detect and analyze droughts have been reported before [15,59]. Although PERSIANN-CDR obtained slightly superior results than CHIRPS at the continental scale, PERSIANN-CDR was relatively worse in detecting drought events in some regions with denser in situ observations, as seen in the eastern USA in Figure 6b and Figure 7b, and southeastern China in Figure 5q,s. This may be attributed to the correction data. PERSIANN-CDR had a relatively coarse reanalysis of GPCP data (2.5° resolution) [33] while CHIRPS was directly adjusted using gauge stations [17]. With regard to TRMM-3B43, although several case studies have used this to detect drought, further evaluation is still required due to its short data records. In comparison with the other three satellite-based precipitation products, the overall performance of CMORPH-BLD is weak. The possible reasons for this phenomenon have been provided in the analysis of CMORPH-BLD precipitation accuracy. Accordingly, caution should be exercised when using the CMORPH-BLD to analyze drought dynamics.
Notably, large differences between in situ observations and the four QPE products occurred in Southeast Asia, Central Africa, and Amazonia. This phenomenon was not only found in this study but also reported in previous reports [26,30,52,60,61]. The sparse gauge networks in these regions can result in a lack of in situ error correction and might be an important factor that reduced data quality. Furthermore, dry climate, heavy rain, and complex underlying surfaces can lower the quality of QPE products, and the inherent poor accuracy can limit their application for drought monitoring to these regions.
The present study only compared and evaluated the global utility of the four gauge-adjusted satellite products. However, real-time or near-real-time drought monitoring based on remotely sensed products is also important and deserves more attention. This acquisition of global gauge-adjusted products requires significant time latency due to the data collection process and error correction using in situ data. In this study, CHIRPS and TRMM-3B43 had latencies of one and two months, respectively. Since drought is a long-term phenomenon with much larger timescale than flood and rain storm, the latency of data release of CHIRPS and TRMM-3B43 might be acceptable for the ‘near-real-time’ drought monitoring [17]. In comparison, PERSIANN-CDR usually has a latency of several months and may be more suitable for long-term historical drought analysis. Undoubtedly, the best method for real-time drought monitoring is the use of real-time remotely sensed products. Unfortunately, existing studies show that real-time or near-real-time precipitation products have unsatisfactory accuracy in the regional or global scale; challenges still exist if the released products are to be directly applied to monitor drought [17,30,62,63]. However, near-real-time QPE products with high quality are currently in development. Aadhar and Mishra [64] have generated a near-real-time QPE product with 0.05° coverage of southern Asia. Nevertheless, global real-time QPE products with high quality require further study.
In summary, the four products achieved satisfactory performances and can be used to monitor drought in most regions in the world. The large differences between the gauge records and QPE products estimates in Southeast Asia, Central Africa, the Tibetan plateau, the Himalayas, and Amazonia can be attributed to both the inherently low accuracy of the product and sparsity of the gauge network. Therefore, the four QPE products in these regions are not recommended for drought monitoring. CHIRPS and TRMM can be used to monitor drought at near-real-time; PERSIANN-CDR might be more suitable for long-term historical drought analysis.
5. Conclusions
This study compared and assessed the drought monitoring utilities of four gauge-adjusted satellite precipitation products (CHIRPS, CHORPH OLD, PERSIANN-CDR, and TRMM-3B43) over the 2000–2016 time period at the global scale. A CRU gridded dataset was used as reference data to assess the QPE products. The SPEI drought index was chosen as an example to evaluate the drought monitoring utility of four QPE products.
- (1)
- PERSIANN-CDR and TRMM-3B43 overestimated precipitation more and CHIRPS underestimated precipitation more for most regions. Severe discrepancies for the above three QPE products against CRU gauge observations are clearly distributed in Southeast Asia, Central Africa, and Amazonia; however, the CMORPH-BLD product had the opposite performance. On the basis of the CC and RMSE, the worst CC and RMSE occurred in the regions above; generally, CHIRPS had the best performance in Europe, Oceania and Africa; the PERSIANN-CDR had the best performance in North America, South America and Asia; the CMORPH-BLD had the worst statistical indices in all continents.
- (2)
- On the basis of the SPEI statistics, the four SPEIs performed worse in Central Africa, Amazonia, the Tibetan plateau, the Himalayas, and Southeast Asia; Central Africa had the worst CC (<0.5) and RMSE (>0.8) performances for the four QPE products. In contrast, the southeastern United States, the southeast of South America, the south of Africa, most areas of India, Australia, and eastern China have higher CC values (>0.8) and low RMSE values (<0.4) for the four QPE products. The PERSIANN-CDR generally had higher CC in most regions in the world (except for Africa) and the CMORPH-BLD had lower CC in the world; CHIRPS and TRMM-3B43 had comparable performances.
- (3)
- According to POD and FAR for the SPEI, more than 50% of the drought events cannot be accurately identified by the QPE products in Central Africa, Amazonia, the Tibetan plateau, the Himalayas, and parts of Southeast Asia and Australia. In other regions, e.g., the southeastern United States, southeastern China, and South Africa, the QPE product can capture more than 75% of drought events.
- (4)
- All datasets (except for CMORPH-BLD) could detect all four typical drought events in Table 5 using the domain-averaged SPEIs of less than −1. The CMORPH-BLD was not able to effectively detect the 2007 central Asian drought and the 2006 Kenyan drought. The spatial SPEI patterns of the four QPE products agreed very well with that of the CRU precipitation for the 2007 southeastern USA drought and the 2003 western European drought. CHIRPS had a distinct over-recognition of drought severity for the 2006 Kenyan drought. In addition, CMORPH-BLD had obvious spatial discrepancies in comparison with other precipitation products for the 2008 central Asian drought.
In summary, on the basis of the SPEI results, the four QPE products performed satisfactorily for drought monitoring in most regions of the world. CHIRPS and TRMM-3B43 could be used to monitor drought at ‘near real time’ while PERSIANN-CDR might be more suitable for long-term historical drought analysis.
Author Contributions
Conceptualization, H.Z. and Y.M.; methodology, H.Z.; formal analysis, H.Z.; writing—original draft preparation, H.Z.; writing—review and editing, Y.M.; funding acquisition, Y.M.
Funding
This research was funded by The National Natural Science Foundation of China, grant number 41701517; the Youth Top-notch Personnel of Scientific and Technological Research Projects of Higher Learning Institutions of Hebei, grant number BJ2016001.
Acknowledgments
The authors are very thankful to the anonymous reviewers and editors for their helpful and constructive comments.
Conflicts of Interest
The authors declare no conflict of interest.
References
- Dai, A. Drought under global warming: A review. Wiley Interdiscip. Rev. Clim. Chang. 2011, 2, 45–65. [Google Scholar] [CrossRef]
- Lai, C.; Zhong, R.; Wang, Z.; Wu, X.; Chen, X.; Wang, P.; Lian, Y. Monitoring hydrological drought using long-term satellite-based precipitation data. Sci. Total Environ. 2019, 649, 1198–1208. [Google Scholar] [CrossRef] [PubMed]
- Mishra, A.K.; Singh, V.P. A review of drought concepts. J. Hydrol. 2010, 391, 202–216. [Google Scholar] [CrossRef]
- Heim, R.R. A review of twentieth-century drought indices used in the United States. Bull. Am. Meteorol. Soc. 2002, 83, 1149–1165. [Google Scholar] [CrossRef]
- Keyantash, J.; Dracup, J.A. The quantification of drought: An evaluation of drought indices. Bull. Am. Meteorol. Soc. 2002, 83, 1167–1180. [Google Scholar] [CrossRef]
- Zargar, A.; Sadiq, R.; Naser, B.; Khan, F.I. A review of drought indices. Environ. Rev. 2011, 19, 333–349. [Google Scholar] [CrossRef]
- McKee, T.B.; Doesken, N.J.; Kleist, J. The relationship of drought frequency and duration to time scales. In Proceedings of the 8th Conference on Applied Climatology, Boston, CA, USA, 17–22 January 1993. [Google Scholar]
- Palmer, W.C. Meteorological Drought. Research Paper No. 45, US Dept. of Commerce 58. 1965. Available online: http://www.ncdc.noaa.gov/oa/climate/research/drought/palmer.pdf (accessed on 25 August 2019).
- Vicente-Serrano, S.M.; Beguería, S.; López-Moreno, J.I. A Multiscalar Drought Index Sensitive to Global Warming: The Standardized Precipitation Evapotranspiration Index. J. Clim. 2010, 23, 1696–1718. [Google Scholar] [CrossRef] [Green Version]
- Bayissa, Y.; Tadesse, T.; Demisse, G.; Shiferaw, A. Evaluation of Satellite-Based Rainfall Estimates and Application to Monitor Meteorological Drought for the Upper Blue Nile Basin, Ethiopia. Remote Sens. 2017, 9, 669. [Google Scholar] [CrossRef]
- Frank, A.; Armenski, T.; Gocic, M.; Popov, S.; Popovic, L.; Trajkovic, S. Influence of mathematical and physical background of drought indices on their complementarity and drought recognition ability. Atmos. Res. 2017, 194, 268–280. [Google Scholar] [CrossRef]
- Guo, H.; Bao, A.M.; Liu, T.; Jiapaer, G.; Ndayisaba, F.; Jiang, L.L.; Kurban, A.; De Maeyer, P. Spatial and temporal characteristics of droughts in Central Asia during 1966–2015. Sci. Total Environ. 2018, 624, 1523–1538. [Google Scholar] [CrossRef] [PubMed]
- Tian, L.; Yuan, S.S.; Quiring, S.M. Evaluation of six indices for monitoring agricultural drought in the south central United States. Agric. For. Meteorol. 2018, 249, 107–119. [Google Scholar] [CrossRef]
- Wang, Z.; Li, J.; Lai, C.; Zeng, Z.; Zhong, R.; Chen, X.; Zhou, X.; Wang, M. Does drought in China show a significant decreasing trend from 1961 to 2009? Sci. Total Environ. 2017, 579, 314–324. [Google Scholar] [CrossRef] [PubMed]
- Zambrano, F.; Wardlow, B.; Tadesse, T.; Lillo-Saavedra, M.; Lagos, O. Evaluating satellite-derived long–term historical precipitation datasets for drought monitoring in Chile. Atmos. Res. 2016, 186, 26–42. [Google Scholar] [CrossRef]
- Yoon, J.H.; Mo, K.; Wood, E.F. Dynamic–Model–Based Seasonal Prediction of Meteorological Drought over the Contiguous United States. J. Hydrometeorol. 2012, 13, 463–482. [Google Scholar] [CrossRef]
- Zhong, R.D.; Chen, X.H.; Lai, C.G.; Wang, Z.L.; Lian, Y.Q.; Yu, H.J.; Wu, X.Q. Drought monitoring utility of satellite–based precipitation products across mainland China. J. Hydrol. 2019, 568, 343–359. [Google Scholar] [CrossRef]
- Alley, W.M. The palmer drought severity index—Limitations and assumptions. J. Clim. Appl. Meteorol. 1984, 23, 1100–1109. [Google Scholar] [CrossRef]
- Guo, H.; Bao, A.M.; Liu, T.; Chen, S.; Felix Ndayisaba, F. Evaluation of PERSIANN–CDR for Meteorological Drought Monitoring over China. Remote Sens. 2016, 8, 379. [Google Scholar] [CrossRef]
- Liu, Y.; Zhu, Y.; Ren, L.L.; Singh, V.P.; Yang, X.L.; Yuan, F. A multiscalar Palmer drought severity index. Geophys. Res. Lett. 2017, 44, 6850–6858. [Google Scholar] [CrossRef]
- Wells, N.; Goddard, S.; Hayes, M.J. A self–calibrating palmer drought severity index. J. Clim. 2004, 17, 2335–2351. [Google Scholar] [CrossRef]
- Vicente-Serrano, S.M.; Begueria, S.; Lorenzo-Lacruz, J.; Camarero, J.J.; Lopez-Moreno, J.I.; Azorin-Molina, C.; Revuelto, J.; Moran-Tejeda, E.; Sanchez-Lorenzo, A. Performance of Drought Indices for Ecological, Agricultural, and Hydrological Applications. Earth Interact. 2012, 16, 10. [Google Scholar] [CrossRef]
- Tang, G.; Zeng, Z.; Long, D.; Guo, X.; Yong, B.; Zhang, W.; Hong, Y. Statistical and Hydrological Comparisons between TRMM and GPM Level-3 Products over a Midlatitude Basin: Is Day-1 IMERG a Good Successor for TMPA 3B42V7? J. Hydrometeorol. 2015, 17, 121–131. [Google Scholar] [CrossRef]
- Wang, Z.; Zhong, R.; Lai, C. Evaluation and Hydrologic Validation of TMPA Satellite Precipitation Product Downstream of the Pearl River Basin, China. Hydrol. Process 2017, 31, 4169–4182. [Google Scholar] [CrossRef]
- Trenberth, K.E.; Dai, A.; Schrier, G.V.D.; Jones, P.D.; Barichivich, J.; Briffa, K.R.; Sheffield, J. Global warming and changes in drought. Nat. Clim. Chang. 2014, 4, 17–22. [Google Scholar] [CrossRef]
- Beck, H.E.; Vergopolan, N.; Pan, M.; Levizzani, V.; van Dijk, A.I.J.M.; Weedon, G.P.; Brocca, L.; Pappenberger, F.; Huffman, G.J.; Wood, E.F. Global-scale evaluation of 22 precipitation datasets using gauge observations and hydrological modeling. Hydrol. Earth Syst. Sci. 2017, 21, 6201–6217. [Google Scholar] [CrossRef] [Green Version]
- Chen, S.; Hu, J.J.; Zhang, Z.X.; Behrangi, A.; Hong, Y.; Gebregiorgis, A.S.; Cao, J.R.; Hu, B.Q.; Xue, X.W.; Zhang, X.H. Hydrologic Evaluation of the TRMM Multisatellite Precipitation Analysis Over Ganjiang Basin in Humid Southeastern China. IEEE J. STARS 2015, 8, 4568–4580. [Google Scholar] [CrossRef]
- Zhao, H.G.; Yang, S.T.; Wang, Z.W.; Zhou, X.; Luo, Y.; Wu, L.N. Evaluating the suitability of TRMM satellite rainfall data for hydrological simulation using a distributed hydrological model in the Weihe River catchment in China. J. Geogr. Sci. 2015, 25, 177–195. [Google Scholar] [CrossRef]
- Yang, B.G.; Zhao, Y.J.; Zhao, H.G.; Li, B.B.; Huang, Y.C. Assessment of the Two Successive GPM–Based V3 and V4 GSMaP Precipitation Products at Multiple Temporal and Spatial Scales Over China. IEEE J. STARS 2019, 12, 577–588. [Google Scholar] [CrossRef]
- Sahoo, A.K.; Sheffield, J.; Pan, M.; Wood, E.F. Evaluation of the Tropical Rainfall Measuring Mission Multi-Satellite Precipitation Analysis (TMPA) for assessment of large–scale meteorological drought. Remote Sens. Environ. 2015, 159, 181–193. [Google Scholar] [CrossRef]
- Huffman, G.J.; Adler, R.F.; Bolvin, D.T.; Gu, G.; Nelkin, E.J.; Bowman, K.P.; Hong, Y.; Stocker, E.F.; Wolff, D.B. The TRMM multisatellite precipitation analysis (TMPA): Quasi–global, multiyear, combined–sensor precipitation estimates at fine scales. J. Hydrometeorol. 2007, 8, 38–55. [Google Scholar] [CrossRef]
- Sorooshian, S.; Hsu, K.-L.; Gao, X.; Gupta, H.V.; Imam, B.; Braithwaite, D. Evaluation of persiann system satellite-based estimates of tropical rainfall. Bull. Am. Meteorol. Soc. 2000, 81, 2035–2046. [Google Scholar] [CrossRef]
- Ashouri, H.; Hsu, K.L.; Sorooshian, S.; Braithwaite, D.K.; Knapp, K.R.; Cecil, L.D.; Nelson, B.R.; Prat, O.P. PERSIANN–CDR: Daily precipitation climate data record from multisatellite observations for hydrological and climate studies. Bull. Am. Meteorol. Soc. 2014, 96, 197–210. [Google Scholar] [CrossRef]
- Funk, C.C.; Peterson, P.J.; Landsfeld, M.F.; Pedreros, D.H.; Verdin, J.P.; Rowland, J.D.; Bo, E.R.; Husak, G.J.; Michaelsen, J.C.; Verdin, A.P. A Quasi-Global Precipitation Time Series for Drought Monitoring. US Geol. Surv. 2014, 832, 1–12. [Google Scholar]
- Lu, J.; Jia, L.; Menenti, M.; Yan, Y.P.; Zheng, C.L.; Zhou, J. Performance of the Standardized Precipitation Index Based on the TMPA and CMORPH Precipitation Products for Drought Monitoring in China. IEEE J. STARS 2018, 11, 1387–1396. [Google Scholar] [CrossRef]
- Joyce, R.J.; Janowiak, J.E.; Arkin, P.A.; Xie, P. CMORPH: A method that produces global precipitation estimates from passive microwave and infrared data at high spatial and temporal resolution. J. Hydrometeorol. 2004, 5, 487–503. [Google Scholar] [CrossRef]
- Alizadeh, M.R.; Nikoo, M.R. A fusion-based methodology for meteorological drought estimation using remote sensing data. Remote Sens. Environ. 2018, 211, 229–247. [Google Scholar] [CrossRef]
- Wang, F.; Yang, H.B.; Wang, Z.M.; Zhang, Z.Z.; Li, Z.H. Drought Evaluation with CMORPH Satellite Precipitation Data in the Yellow River Basin by Using Gridded Standardized Precipitation Evapotranspiration Index. Remote Sens. 2019, 11, 485. [Google Scholar] [CrossRef]
- Harris, I.; Jones, P.D.; Osborn, T.J.; Lister, D.H. Updated high–resolution grids of monthly climatic observations—The CRU TS3.10 Dataset. Int. J. Climatol. 2014, 34, 623–642. [Google Scholar] [CrossRef]
- Mitchell, T.D.; Jones, P.D. An improved method of constructing a database of monthly climate observations and associated high-resolution grids. Int. J. Climatol. 2005, 25, 693–712. [Google Scholar] [CrossRef]
- Pan, M.; Sahoo, A.K.; Troy, T.J.; Vinukollu, R.K.; Sheffield, J.; Wood, E.F. Multisource estimation of long–term terrestrial water budget for major global river basins. J. Clim. 2012, 25, 3191–3206. [Google Scholar] [CrossRef]
- Huffman, G.J.; Adler, R.F.; Bolvin, D.T.; Nelkin, E.J. The TRMM Multi-Satellite Precipitation Analysis (TMPA) Satellite Rainfall Applications for Surface Hydrology; Springer: Dordrecht, The Netherlands, 2010; pp. 3–22. [Google Scholar]
- Faridzad, M.; Yang, T.T.; Hsu, K.; Sorooshian, S.; Xiao, C. Rainfall frequency analysis for ungauged regions using remotely sensed precipitation information. J. Hydrol. 2018, 563, 123–142. [Google Scholar] [CrossRef] [Green Version]
- Channan, S.; Collins, K.; Emanuel, W.R. Global Mosaics of the Standard MODIS Land Cover Type Data; University of Maryland and the Pacific Northwest National Laboratory: College Park, MD, USA, 2014. [Google Scholar]
- Miralles, D.G.; Holmes, T.R.H.; De Jeu, R.A.M.; Gash, J.H.; Meesters, A.G.C.A.; Dolman, A.J. Global land-surface evaporation estimated from satellite-based observations. Hydrol. Earth Syst. Sci. 2011, 15, 453–469. [Google Scholar] [CrossRef] [Green Version]
- Martens, B.; Miralles, D.G.; Lievens, H.; van der Schalie, R.; de Jeu, R.A.M.; Fernandez-Prieto, D.; Beck, H.E.; Dorigo, W.A.; Verhoest, N.E.C. GLEAM v3: Satellite-based land evaporation and root-zone soil moisture. Geosci. Model Dev. 2017, 10, 1903–1925. [Google Scholar] [CrossRef]
- Peng, J.; Dadsona, S.; Leng, G.Y.; Duan, Z.; Jagdhuber, T.; Guo, W.D.; Ludwig, R. The impact of the Madden-Julian Oscillation on hydrological extremes. J. Hydrol. 2019, 571, 142–149. [Google Scholar] [CrossRef] [Green Version]
- Vicente-Serrano, S.M.; Miralles, D.G.; Domínguez-Castro, D.; Azorin-Molina, C.; Eenawy, A.E.; Mcvicar, T.R.; Tomás-Burguera, M.; Beguería, S.; Maneta, M.; Peña-Gallardo, M. Global Assessment of the Standardized Evapotranspiration Deficit Index (SEDI) for Drought Analysis and Monitoring. J. Clim. 2018, 31, 5371–5393. [Google Scholar] [CrossRef]
- Liu, W.B.; Sun, F.B.; Sun, S.B.; Guo, L.M.; Wang, H.; Cui, H.J. Multi-scale assessment of eco-hydrological resilience to drought in China over the last three decades. Sci. Total Environ. 2019, 672, 201–211. [Google Scholar] [CrossRef]
- Wang, Q.F.; Wu, J.J.; Li, X.H.; Zhou, H.K.; Yang, J.H.; Geng, G.P.; An, X.L.; Liu, L.Z.; Tang, Z.H. A comprehensively quantitative method of evaluating the impact of drought on crop yield using daily multi-scale SPEI and crop growth process model. Int. J. Biometeorol. 2017, 61, 685–699. [Google Scholar] [CrossRef]
- Xie, P.; Joyce, R.; Wu, S.R.; Yoo, S.Y.; Yarosh, Y.; Sun, F.Y.; Lin, R. Reprocessed, Bias-Corrected CMORPH Global High-Resolution Precipitation Estimates from 1998. J. Hydrometeorol. 2017, 8, 1617–1640. [Google Scholar] [CrossRef]
- Rivera, J.A.; Marianetti, G.; Hinrichs, S. Validation of CHIRPS precipitation dataset along the Central Andes of Argentina. Atmos. Res. 2018, 213, 437–449. [Google Scholar] [CrossRef]
- Becker, A.; Finger, P.; Meyer-Christoffer, A.; Rudolf, B.; Schamm, K.; Schneider, U.; Ziese, M. A description of the global land-surface precipitation data products of the Global Precipitation Climatology Centre with sample applications including centennial (trend) analysis from 1901–present. Earth Syst. Sci. Data 2013, 5, 71–99. [Google Scholar] [CrossRef]
- Schneider, U.; Becker, A.; Finger, P.; Meyer-Christoffer, A.; Ziese, M.; Rudolf, B. GPCC’s new land surface precipitation climatology based on quality-controlled in situ data and its role in quantifying the global water cycle. Theor. Appl. Climatol. 2014, 115, 15–40. [Google Scholar] [CrossRef]
- Adler, R.F.; Huffman, G.J.; Chang, A.; Ferraro, R.; Xie, P.-P.; Janowiak, J.; Rudolf, B.; Schneider, U.; Curtis, S.; Bolvin, D.; et al. The version-2 Global Precipitation Climatology Project (GPCP) monthly precipitation analysis (1979–present). J. Hydrometeorol. 2003, 4, 1147–1167. [Google Scholar] [CrossRef]
- Xie, P.; Chen, M.; Shi, W. 2010: CPC Unified Gauge-Based Analysis of Global Daily Precipitation. Available online: https://ams.confex.com/ams/90annual/webprogram/Paper163676.html (accessed on 25 August 2019).
- Sun, Q.; Miao, C.; Duan, Q.; Ashouri, H.; Sorooshian, S.; Hsu, K.-L. A Review of Global Precipitation Data Sets: Data Sources, Estimation, and Intercomparisons. Rev. Geophys. 2018, 56, 79–107. [Google Scholar] [CrossRef] [Green Version]
- Yong, B.; Liu, D.; Gourley, J.J.; Tian, Y.; Huffman, G.J.; Ren, L.; Hong, Y. Global View of Real-Time Trmm Multisatellite Precipitation Analysis: Implications for Its Successor Global Precipitation Measurement Mission. Bull. Am. Meteorol. Soc. 2015, 96, 283–296. [Google Scholar] [CrossRef]
- Dembele, M.; Zwart, S.J. Evaluation and comparison of satellite-based rainfall products in Burkina Faso, West Africa. Int. J. Remote. Sens. 2017, 37, 3995–4014. [Google Scholar] [CrossRef]
- Bookhagen, B.; Burbank, D.W. Topography, relief, and TRMM–derived rainfall variations along the Himalaya. Geophys. Res. Lett. 2006, 33, L08405. [Google Scholar] [CrossRef]
- Awange, J.L.; Forootan, E. An evaluation of high–resolution gridded precipitation products over Bhutan (1998–2012). Int. J. Climatol. 2016, 36, 1067–1087. [Google Scholar]
- Shrestha, N.K.; Qamer, F.M.; Pedreros, D.; Murthy, M.S.R.; Wahid, S.M.; Shrestha, M. Evaluating the accuracy of Climate Hazard Group (CHG) satellite rainfall estimates for precipitation based drought monitoring in Koshi basin, Nepal. J. Hydrol. Reg. Stud. 2017, 13, 138–151. [Google Scholar] [CrossRef]
- Vernimmen, R.R.; Hooijer, A.; Aldrian, E.; Van Dijk, A.I. Evaluation and bias correction of satellite rainfall data for drought monitoring in Indonesia. Hydrol. Earth Syst. Sci. 2012, 16, 133–146. [Google Scholar] [CrossRef] [Green Version]
- Aadhar, S.; Mishra, V. High-resolution near real-time drought monitoring in South Asia. Sci. Data 2017, 4, 170145. [Google Scholar] [CrossRef]
Figure 1.
Spatial distributions of mean monthly precipitation differences between Climate Research Unit (CRU) gauge observations against the Quantitative Precipitation Estimation (QPE) product estimates from 2000 to 2016 (a–d).
Figure 1.
Spatial distributions of mean monthly precipitation differences between Climate Research Unit (CRU) gauge observations against the Quantitative Precipitation Estimation (QPE) product estimates from 2000 to 2016 (a–d).

Figure 2.
Spatial grid distributions of correlation coefficient (CC) and root-mean-square error (RMSE) between QPE product precipitation estimates and CRU observations from 2000 to 2016 (a–h).
Figure 2.
Spatial grid distributions of correlation coefficient (CC) and root-mean-square error (RMSE) between QPE product precipitation estimates and CRU observations from 2000 to 2016 (a–h).

Figure 3.
Spatial grid distributions of CC and RMSE for the SPEIs (SPEI3, SPEI6, and SPEI12) between QPE products and CRU gauge observations from 2000 to 2016 (a–x).
Figure 3.
Spatial grid distributions of CC and RMSE for the SPEIs (SPEI3, SPEI6, and SPEI12) between QPE products and CRU gauge observations from 2000 to 2016 (a–x).

Figure 4.
Spatial distributions of drought month’s numbers differences calculated by every QPE product subtracting reference data between 2000 and 2016 (a–i).
Figure 4.
Spatial distributions of drought month’s numbers differences calculated by every QPE product subtracting reference data between 2000 and 2016 (a–i).

Figure 5.
The POD and FAR of the 3-, 6-, and 12-month SPEI for each QPE product versus CRU product from 2000 to 2016 (the first and second rows represent the SPEI3, the third and fourth rows represent the SPEI6, and the fifth and sixth rows represent the SPEI12) (a–x).
Figure 5.
The POD and FAR of the 3-, 6-, and 12-month SPEI for each QPE product versus CRU product from 2000 to 2016 (the first and second rows represent the SPEI3, the third and fourth rows represent the SPEI6, and the fifth and sixth rows represent the SPEI12) (a–x).

Figure 6.
Areal averaged SPEIs for four drought events from 2000 to 2010 (a–d). The specific domain of the drought event is shown in Table 5.
Figure 6.
Areal averaged SPEIs for four drought events from 2000 to 2010 (a–d). The specific domain of the drought event is shown in Table 5.

Figure 7.
Drought area (%) for four drought events (a–d). The specific domain of the drought event is shown in Table 5.
Figure 7.
Drought area (%) for four drought events (a–d). The specific domain of the drought event is shown in Table 5.

Figure 8.
Spatial monthly SPEIs pattern of CHIRPS, CMORPH-BLD, PERSIANN-CDR, TRMM-3B43, and CRU gauges for four drought events. The dotted box indicates the actual extent used to calculate the area averaged SPEIs and drought area proportion in Figure 6 and Figure 7.


Table 1.
Detailed description of four satellite-based precipitation estimates.
| Products | Temporal Resolution | Spatial Resolution (°) | Coverage | Period | Data Source |
|---|---|---|---|---|---|
| CMORPH-BLD | daily | 0.25 × 0.25 | 60N–60S | 1998 to present | ftp://ftp.cpc.ncep.noaa.gov/precip/CMORPH_V1.0/ |
| CHIRPS | daily | 0.05 × 0.05 | 60N–60S | 1981 to present | ftp://ftp.chg.ucsb.edu/pub/org/chg/products/CHIRPS-2.0/ |
| PERSIANN-CDR | daily | 0.25 × 0.25 | 60N–60S | 1983 to present | http://chrsdata.eng.uci.edu/ |
| TRMM-3B43 | monthly | 0.25 × 0.25 | 50N–50S | 1998 to present | https://pmm.nasa.gov/data-access/downloads/trmm |
| Drought Class | SPEI Values |
|---|---|
| Extreme wet | SPEI ≥ 2.0 |
| Severe wet | 1.5 < SPEI < 2.0 |
| Moderate wet | 1 < SPEI ≤ 1.5 |
| Mild wet | 0.5 < SPEI ≤ 1.0 |
| Normal | −0.5 ≤ SPEI ≤ 0.5 |
| Mild dry | −1 < SPEI < −0.5 |
| Moderate dry | −1.5 < SPEI ≤ −1.0 |
| Severe dry | −2 < SPEI ≤ −1.5 |
| Extreme dry | SPEI ≤ −2.0 |
Table 3.
5%, 50%, and 95% quantiles of the monthly precipitation CC and RMSE for six regions 2000–2016.
Table 3.
5%, 50%, and 95% quantiles of the monthly precipitation CC and RMSE for six regions 2000–2016.
| Continents | Quantile | CHIRPS | CMORPH-BLD | PERSIANN-CDR | TRMM-3B43 | ||||
|---|---|---|---|---|---|---|---|---|---|
| CC | RMSE | CC | RMSE | CC | RMSE | CC | RMSE | ||
| North America | 5% | 0.82 | 19.38 | 0.74 | 23.48 | 0.82 | 20.78 | 0.84 | 20.58 |
| 50% | 0.88 | 33.08 | 0.83 | 39.93 | 0.89 | 31.07 | 0.90 | 32.92 | |
| 95% | 0.92 | 45.92 | 0.89 | 52.45 | 0.93 | 41.34 | 0.94 | 42.69 | |
| South America | 5% | 0.78 | 44.30 | 0.67 | 51.95 | 0.78 | 41.86 | 0.78 | 45.36 |
| 50% | 0.85 | 62.78 | 0.79 | 74.59 | 0.86 | 60.67 | 0.85 | 64.28 | |
| 95% | 0.91 | 81.09 | 0.88 | 93.03 | 0.91 | 79.76 | 0.91 | 84.08 | |
| Asia | 5% | 0.82 | 31.94 | 0.68 | 41.43 | 0.81 | 29.95 | 0.82 | 34.20 |
| 50% | 0.89 | 51.15 | 0.82 | 59.31 | 0.90 | 43.59 | 0.89 | 47.92 | |
| 95% | 0.94 | 95.92 | 0.89 | 108.03 | 0.94 | 82.77 | 0.93 | 89.01 | |
| Europe | 5% | 0.74 | 17.14 | 0.58 | 21.61 | 0.74 | 17.11 | 0.76 | 18.15 |
| 50% | 0.82 | 23.65 | 0.76 | 28.64 | 0.84 | 25.03 | 0.85 | 26.50 | |
| 95% | 0.91 | 33.81 | 0.86 | 37.22 | 0.91 | 36.44 | 0.92 | 40.68 | |
| Oceania | 5% | 0.74 | 15.76 | 0.63 | 18.62 | 0.69 | 17.25 | 0.71 | 16.25 |
| 50% | 0.86 | 24.04 | 0.80 | 28.89 | 0.84 | 25.77 | 0.85 | 24.91 | |
| 95% | 0.93 | 57.63 | 0.90 | 70.14 | 0.93 | 60.36 | 0.94 | 67.52 | |
| Africa | 5% | 0.81 | 32.98 | 0.58 | 58.82 | 0.79 | 37.35 | 0.73 | 44.45 |
| 50% | 0.89 | 42.59 | 0.70 | 71.55 | 0.86 | 46.50 | 0.82 | 54.62 | |
| 95% | 0.93 | 57.05 | 0.78 | 87.44 | 0.91 | 61.68 | 0.89 | 67.08 | |
Table 4.
5%, 50%, and 95% quantiles of the monthly SPEI CC for six regions from 2000 to 2016.
| Regions | Quantile | CHIRPS | CMORPH-BLD | PERSIANN-CDR | TRMM-3B43 | ||||||||
|---|---|---|---|---|---|---|---|---|---|---|---|---|---|
| SPEI3 | SPEI6 | SPEI12 | SPEI3 | SPEI6 | SPEI12 | SPEI3 | SPEI6 | SPEI12 | SPEI3 | SPEI6 | SPEI12 | ||
| North America | 5% | 0.63 | 0.60 | 0.61 | 0.58 | 0.52 | 0.52 | 0.67 | 0.65 | 0.64 | 065 | 0.60 | 0.58 |
| 50% | 0.81 | 0.81 | 0.79 | 0.75 | 0.73 | 0.70 | 0.83 | 0.82 | 0.80 | 0.81 | 0.80 | 0.78 | |
| 95% | 0.89 | 0.89 | 0.87 | 0.83 | 0.83 | 0.80 | 0.90 | 0.90 | 0.90 | 0.88 | 0.88 | 0.88 | |
| South America | 5% | 0.47 | 0.44 | 0.40 | 0.34 | 0.32 | 0.30 | 0.50 | 0.49 | 0.47 | 0.49 | 0.47 | 0.46 |
| 50% | 0.61 | 0.59 | 0.56 | 0.51 | 0.50 | 0.46 | 0.64 | 0.65 | 0.63 | 0.62 | 0.62 | 0.60 | |
| 95% | 0.76 | 0.78 | 0.78 | 0.68 | 0.71 | 0.69 | 0.80 | 0.81 | 0.81 | 0.75 | 0.77 | 0.78 | |
| Asia | 5% | 0.60 | 0.61 | 0.59 | 0.51 | 0.49 | 0.46 | 0.62 | 0.64 | 0.66 | 0.61 | 0.61 | 0.64 |
| 50% | 0.75 | 0.74 | 0.74 | 0.64 | 0.63 | 0.62 | 0.74 | 0.75 | 0.75 | 0.73 | 0.73 | 0.73 | |
| 95% | 0.83 | 0.83 | 0.81 | 0.74 | 0.73 | 0.70 | 0.84 | 0.83 | 0.83 | 0.82 | 0.82 | 0.80 | |
| Europe | 5% | 0.66 | 0.66 | 0.65 | 0.57 | 0.54 | 0.51 | 0.71 | 0.72 | 0.71 | 0.71 | 0.72 | 0.70 |
| 50% | 0.82 | 0.81 | 0.81 | 0.75 | 0.73 | 0.72 | 0.85 | 0.85 | 0.84 | 0.84 | 0.83 | 0.83 | |
| 95% | 0.91 | 0.90 | 0.89 | 0.5 | 0.83 | 0.82 | 0.92 | 0.93 | 0.93 | 0.91 | 0.91 | 0.91 | |
| Oceania | 5% | 0.50 | 0.40 | 0.26 | 0.39 | 0.31 | 0.30 | 0.45 | 0.39 | 031 | 0.47 | 0.40 | 0.35 |
| 50% | 0.70 | 0.68 | 0.64 | 0.65 | 0.61 | 0.55 | 0.70 | 0.69 | 0.64 | 0.71 | 0.68 | 0.63 | |
| 95% | 0.86 | 0.86 | 0.87 | 0.83 | 0.83 | 0.84 | 0.87 | 0.87 | 0.88 | 0.86 | 0.86 | 0.86 | |
| Africa | 5% | 0.42 | 0.40 | 0.36 | 0.29 | 0.28 | 0.23 | 0.36 | 0.37 | 0.37 | 0.37 | 0.36 | 0.36 |
| 50% | 0.57 | 0.52 | 0.51 | 0.44 | 0.39 | 0.37 | 0.53 | 0.51 | 0.49 | 0.51 | 0.47 | 0.45 | |
| 95% | 0.72 | 0.66 | 0.61 | 0.63 | 0.54 | 0.52 | 0.72 | 0.67 | 0.66 | 0.69 | 0.64 | 0.63 | |
Table 5.
Information of the five drought events analyzed in this study.
| Events Location | Event Extents | Drought Duration | Index Time Scale |
|---|---|---|---|
| 2007 southeastern US | 31°N to 40°N; 92°W to 80°W | Winter June 2005 to winter August 2007 | 12 |
| 2003 western European | 40°N to 50°N; 0° to 30°E | June 2003 to August 2003 | 3 |
| 2006 Kenyan | 5°S to 10°N; 35°E to 45°E | End of 2005 and beginning of 2006 | 6 |
| 2008 Central Asia | 45°N to 50°N;64.5°E to 87.5°E | December 2007 and July 2009 | 12 |
© 2019 by the authors. Licensee MDPI, Basel, Switzerland. This article is an open access article distributed under the terms and conditions of the Creative Commons Attribution (CC BY) license (http://creativecommons.org/licenses/by/4.0/).
Share and Cite
MDPI and ACS Style
Zhao, H.; Ma, Y. Evaluating the Drought-Monitoring Utility of Four Satellite-Based Quantitative Precipitation Estimation Products at Global Scale. Remote Sens. 2019, 11, 2010. https://0-doi-org.brum.beds.ac.uk/10.3390/rs11172010
AMA Style
Zhao H, Ma Y. Evaluating the Drought-Monitoring Utility of Four Satellite-Based Quantitative Precipitation Estimation Products at Global Scale. Remote Sensing. 2019; 11(17):2010. https://0-doi-org.brum.beds.ac.uk/10.3390/rs11172010
Chicago/Turabian StyleZhao, Haigen, and Yanfei Ma. 2019. "Evaluating the Drought-Monitoring Utility of Four Satellite-Based Quantitative Precipitation Estimation Products at Global Scale" Remote Sensing 11, no. 17: 2010. https://0-doi-org.brum.beds.ac.uk/10.3390/rs11172010
Note that from the first issue of 2016, this journal uses article numbers instead of page numbers. See further details here.