Assessing Interannual Urbanization of China’s Six Megacities Since 2000


1
Aerospace information research institute, Chinese Academy of Sciences, Beijing 100101, China
2
Institute of Remote Sensing and Digital Earth, Chinese Academy of Sciences, Beijing 100101, China
3
University of Chinese Academy of Sciences, Beijing 100049, China
*
Author to whom correspondence should be addressed.
Remote Sens. 2019, 11(18), 2138; https://0-doi-org.brum.beds.ac.uk/10.3390/rs11182138
Submission received: 1 August 2019
/
Revised: 4 September 2019
/
Accepted: 10 September 2019
/
Published: 13 September 2019
Abstract
:As a large and populous developing country, China has entered the rapid urbanization stage since 2000. Until 2018, China has accounted for nearly 1/5 of global megacities. Understanding their urbanization processes is of great significance. Given the deficiencies of existing research, this study explored the interannual urbanization process of China’s six megacities during 2000–2018 from four aspects, namely, the basic characteristics of urban land expansion, expansion types, cotemporary evolution of urban land–population–economy, and urbanization effects on the local environment. Results indicated that (1) urban lands in China’s six megacities increased by 153.27%, with distinct differences across megacities; (2) all of six megacities experienced the expansion processes from high-speed to low-speed, but they varied greatly in detail; (3) the speeds of urban land expansion in China’s megacities outpaced the population growth but lagged behind in GDP increase; and (4) urbanization has triggered an environmental crisis, which is represented by the decline in vegetation coverage and the increase in land surface temperature in newly expanded urban lands. This study enriched the content of urbanization, supplemented the existing materials of megacities, and provided a scientific reference for designing rational urban planning.
1. Introduction
Global urbanization has progressed considerably with the proportion of urban population increasing from 33% in 1950 to 55% in 2018 and urban lands expanding at twice the rate of population growth [1]. Urbanization has both advantages and disadvantages. On the one hand, it provides increased urban housing, convenient transportation, sophisticated education, and excellent medical treatment and social services. On the other hand, the irrational urbanization may result in negative effects on socioeconomic and eco-environment development, such as increasing housing prices, traffic congestion, and emissions of domestic garbage, and vehicle exhaust. All these issues pose both opportunities and challenges to the further development of urban areas in the 21st century [2]. Researches of the urbanization processes could provide basic materials as references when designing rational urban planning and building the inclusive, safe, resilient, and sustainable human settlements, which is also the goals of the 2030 Development Agenda [3].
Urbanization, characterized by the demographic migration from rural to urban areas and the conversion of territorial resources from other types to urban lands [4,5,6], has remarkably improved cities in both number and scale, thereby facilitating the formation of megacities. According to the United Nations [7], only two megacities existed in the world in 1950. This number increased to 29 in 2014 and will exceed 40 by 2030. Megacities are defined as cities with over 10,000,000 inhabitants [8]. Despite conducting denser social activities and causing more drastic urban sprawl effects than other medium- and small-sized cities [9], megacities must face more serious eco-environment problems, such as air pollution [10,11], flood disaster [12,13], and cropland losses [14], which have been proven to reflect the urbanization characteristics of a country or region better [15].
Urbanization hotspots are expected to emerge in developing countries in the next several decades of the 21st century [1]. As a large and populous developing country with nearly 1/5 of the megacities worldwide, China has experienced significant urbanization at an increasing rate of 232.48% since the implementation of the Reform and Opening-up Policy in 1978 and the country has entered into the rapid expansion stage since 2000 [16]. Therefore, China is a good research area for investigating the urbanization process. During the past decades, urban expansion in China has been thoroughly investigated by using remote sensing technology. These studies have identified the following features. (1) Research objects ranged from a single city (i.e., Beijing [5], Shanghai [17], Harbin [18], Guangzhou [19], Nanjing [20], etc.) to urban aggregations (i.e., Beijing–Tianjin–Hebei [21], Pearl River Delta [22], Yangtze River Delta [23], etc.). However, limited investigations have been conducted on China’s six megacities. (2) Research approaches included but not limited to various classification models (i.e., supervised or unsupervised classification, artificial neural network, etc.) and analysis methods (i.e., spatiotemporal dynamics, sprawl patterns, etc.). However, urbanization is a comprehensive process involving both physical morphology and socioeconomic development [2]. Although the physical morphology of urban lands has been extensively investigated by using diverse and complex models in previous studies (i.e., [24,25]), the relationship between urban land expansion and socioeconomic development has received little attention. (3) As a crucial factor influencing urban sustainability, environmental problems have been thoroughly explored at the single-city scale (i.e., [26,27,28]) but rarely discussed across multiple cities, especially their performance effected by urbanization. (4) Although considerable studies (i.e., [2,29,30]) have been carried out on the urbanization process of megacities, they have mainly focused on the dynamics of urban physical morphology in certain years (i.e., using five or ten years as the basic time interval). As an active period, the manifestation of urbanization in the 21st century has not been researched in detail and annually.
Remote sensing satellites are advanced tools for the frequent observation of the land surface that provide good opportunities for monitoring annual urbanization activities. Given the aforementioned problems, the comprehensive urbanization process of China’s six megacities has been revealed annually by carrying out the following tasks: (1) Quantification of the basic characteristics of urban land expansion, (2) observation of the dynamics of urban land expansion types on the basis of urban land areas and perimeters, (3) analysis of the cotemporary evolution of urban land, population, and gross domestic production (GDP), and (4) discussion of the urbanization effects on the local environment from the aspects of vegetation coverage (VC) and land surface temperature (LST).
2. Study Areas
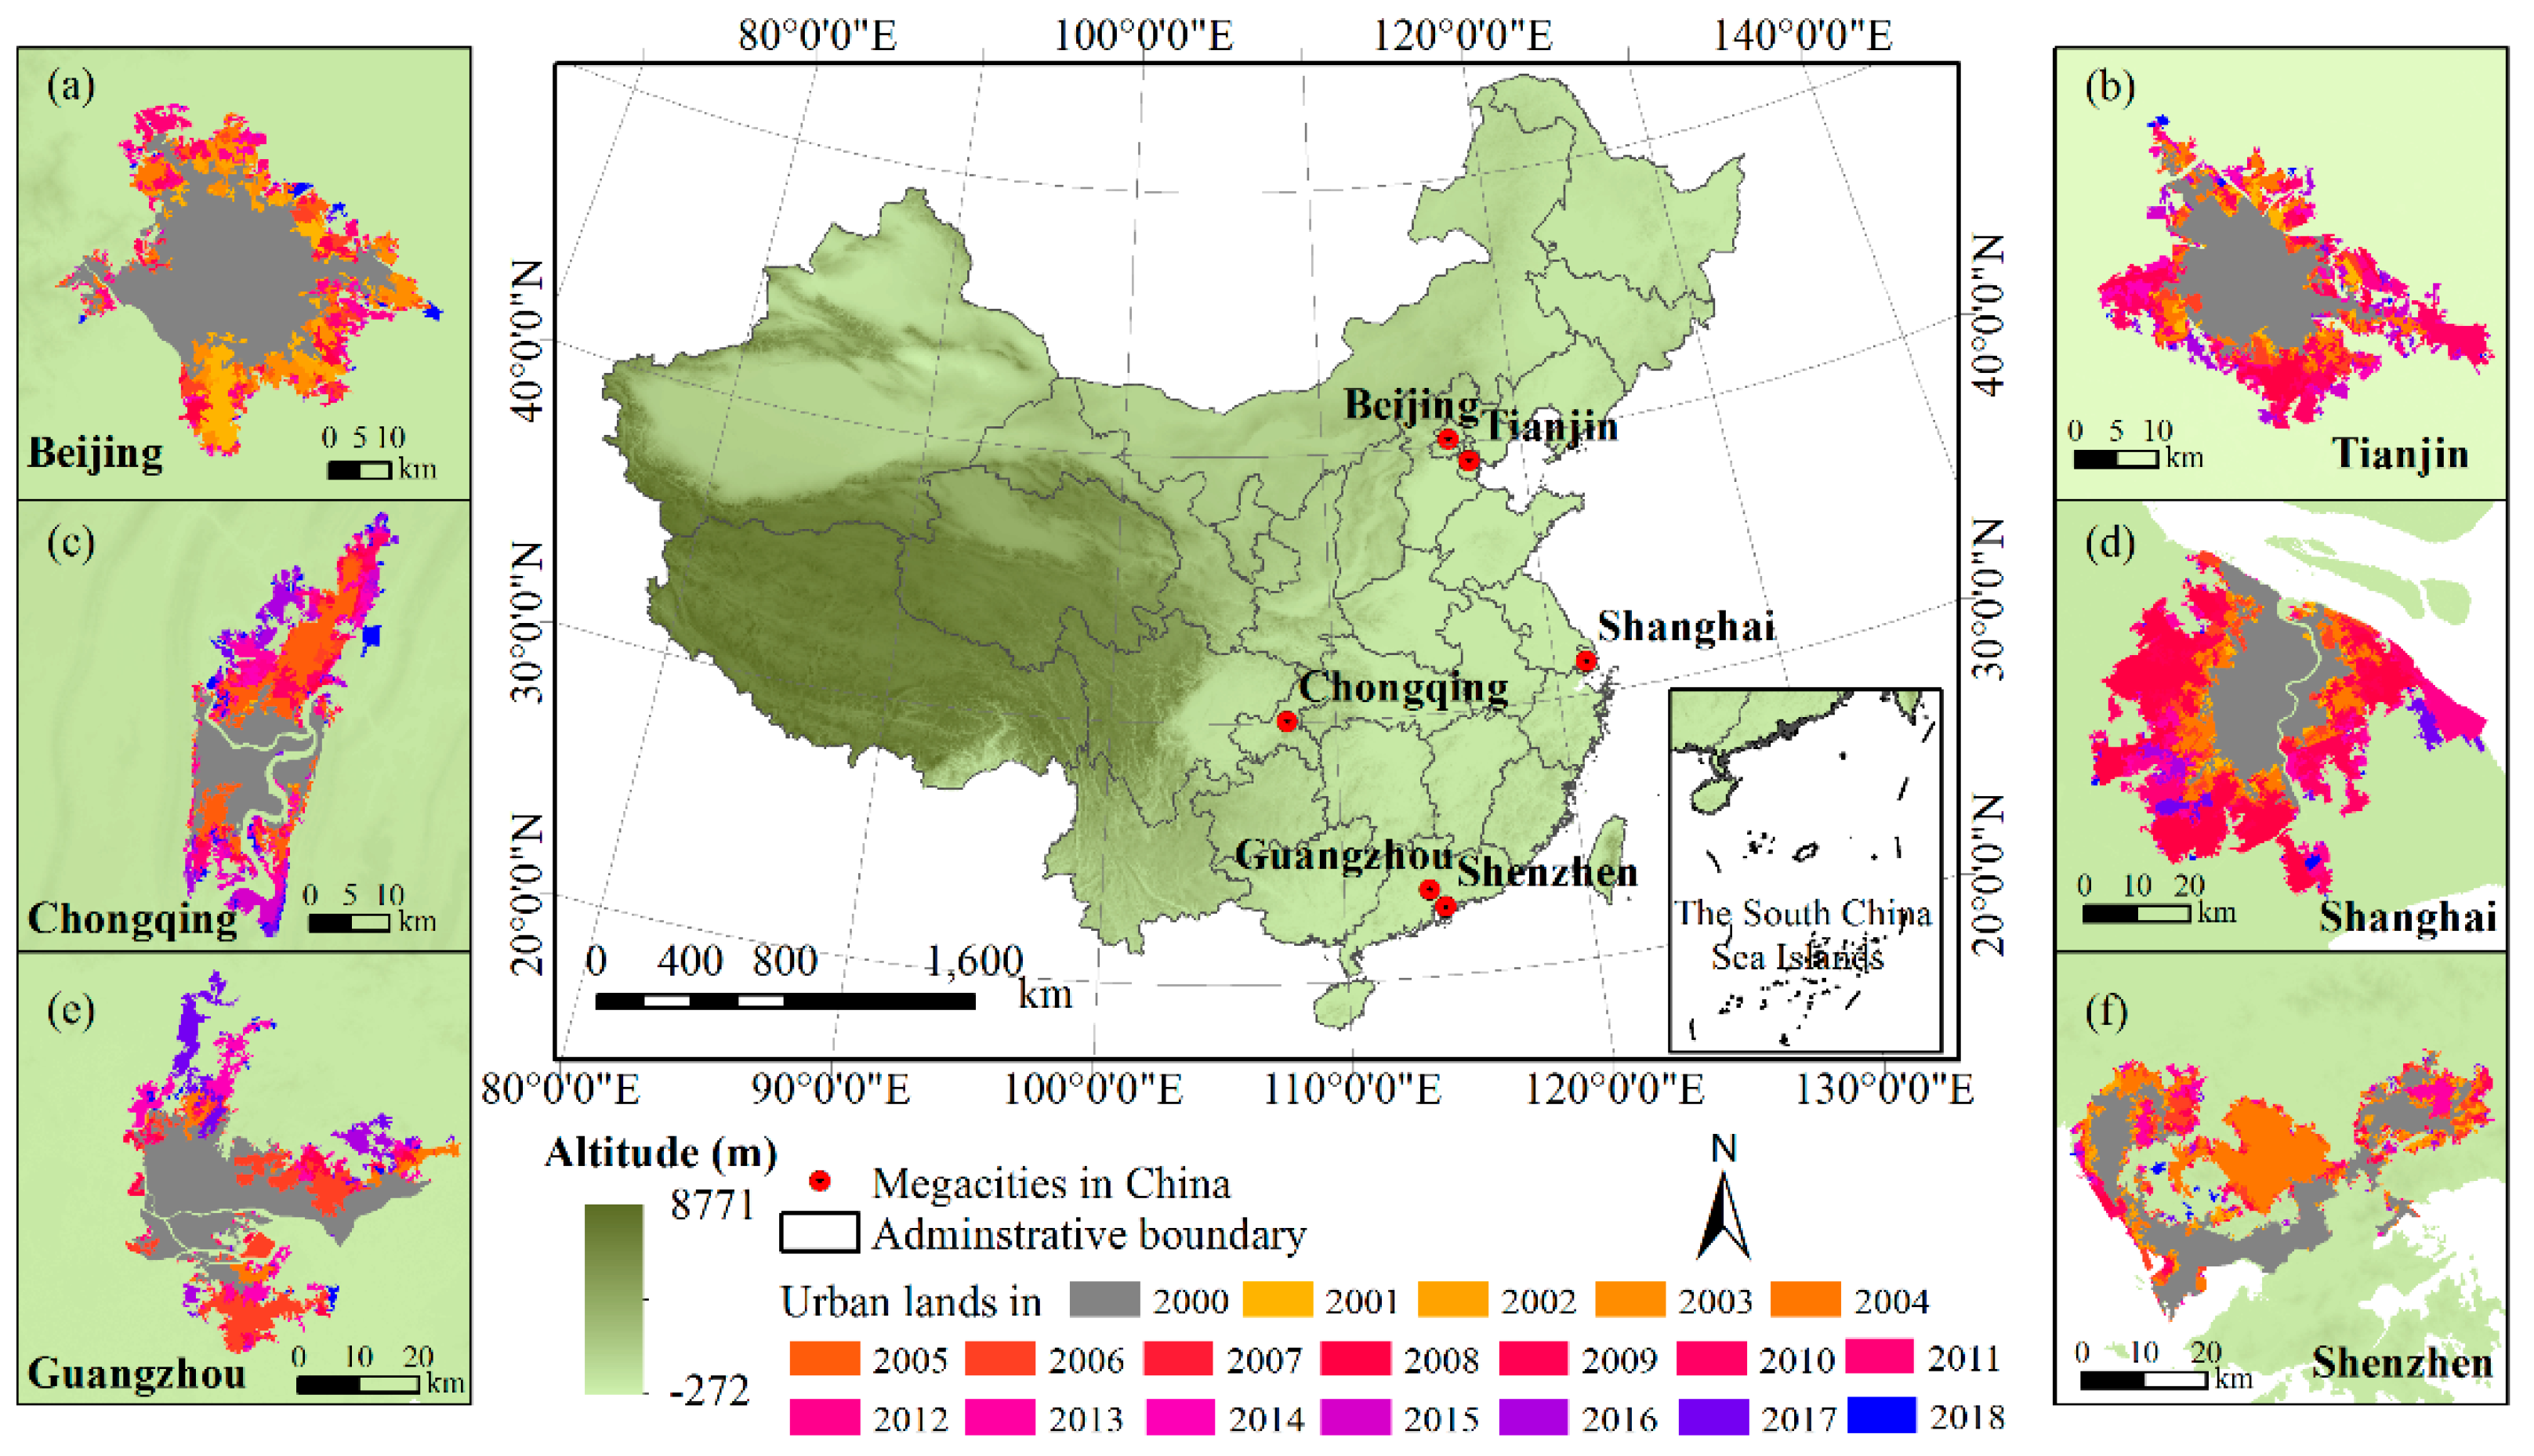
This study focused on the six megacities in China, including Beijing, Tianjin, Chongqing, Shanghai, Guangzhou, and Shenzhen (Figure 1). Detailed information was shown in Table 1. Although accounting for limited proportions of the national territory area, the six megacities have accumulated dense population and experienced drastic socioeconomic development. As the core city in Pudong New Area established in the early 1990s, Shanghai became the first megacity in China with its inhabitants exceeding 10,000,000 in 1995. The second to become a megacity is Beijing, which is the administrative center of China with significant political, historical, and cultural backgrounds. Since the establishment of Binhai and Xiong’an New Areas in 1994 and 2018, respectively, Tianjin has become another economic center in north China. Although Chongqing is presently under the direct administration of the Chinese central government, it has not become an individual municipality before 1997. Moreover, as two major members of the Pearl River Delta established in 1994, Guangzhou is the capital of China’s densest province (i.e., Guangdong Province), while Shenzhen has become China’s first special economic zone and the crucial import-export port. Until 2018, Shanghai, Beijing, and Tianjin have ranked the first three with their urbanization proportions of 88.10%, 86.50%, and 83.15%, respectively. The urbanization proportion of Guangzhou and Shenzhen have surpassed 70.00%, while that of Chongqing has reached 65.80%. Totally, the urbanization proportions of six megacities were all prior to the national average.
3. Materials and Methods
The main workflow of our study includes five steps. Firstly, all datasets were downloaded and preprocessed. Secondly, urban lands of China’s six megacities were delineated (Section 3.2). Thirdly, urban expansion types were characterized (Section 3.3). Fourthly, the cotemporary evolution of urban land-population-GDP was analyzed (Section 3.4). Fifthly, the effect of urban expansion on environment was monitored (Section 3.5).
3.1. Data Acquisition and Preprocessing
In this study, 135 scenes of multisource remotely sensed images with 30–80 m spatial resolutions, less than 10% cloud cover, and vigorous vegetation growth [31] were applied to delineate the urban lands of China’s six megacities during 2000–2018 (Appendix A Table A1). With a spatial resolution of nearly 1000 m, Terra MOD13A3 and MOD11A2 8-day composite products were selected to obtain the VC and LST in summer from 2000 to 2018 (Appendix A Table A2). Urban populations and GDPs of China’s six megacities during 2000–2016 were collected from the China City Statistical Yearbook (Table 2). During data preprocessing, all multisource remotely sensed images and MODIS products were resampled to 30 or 1000 m pixel sizes by using Albers equal-area conic coordinate system, respectively.
3.2. Urban Land Extracting
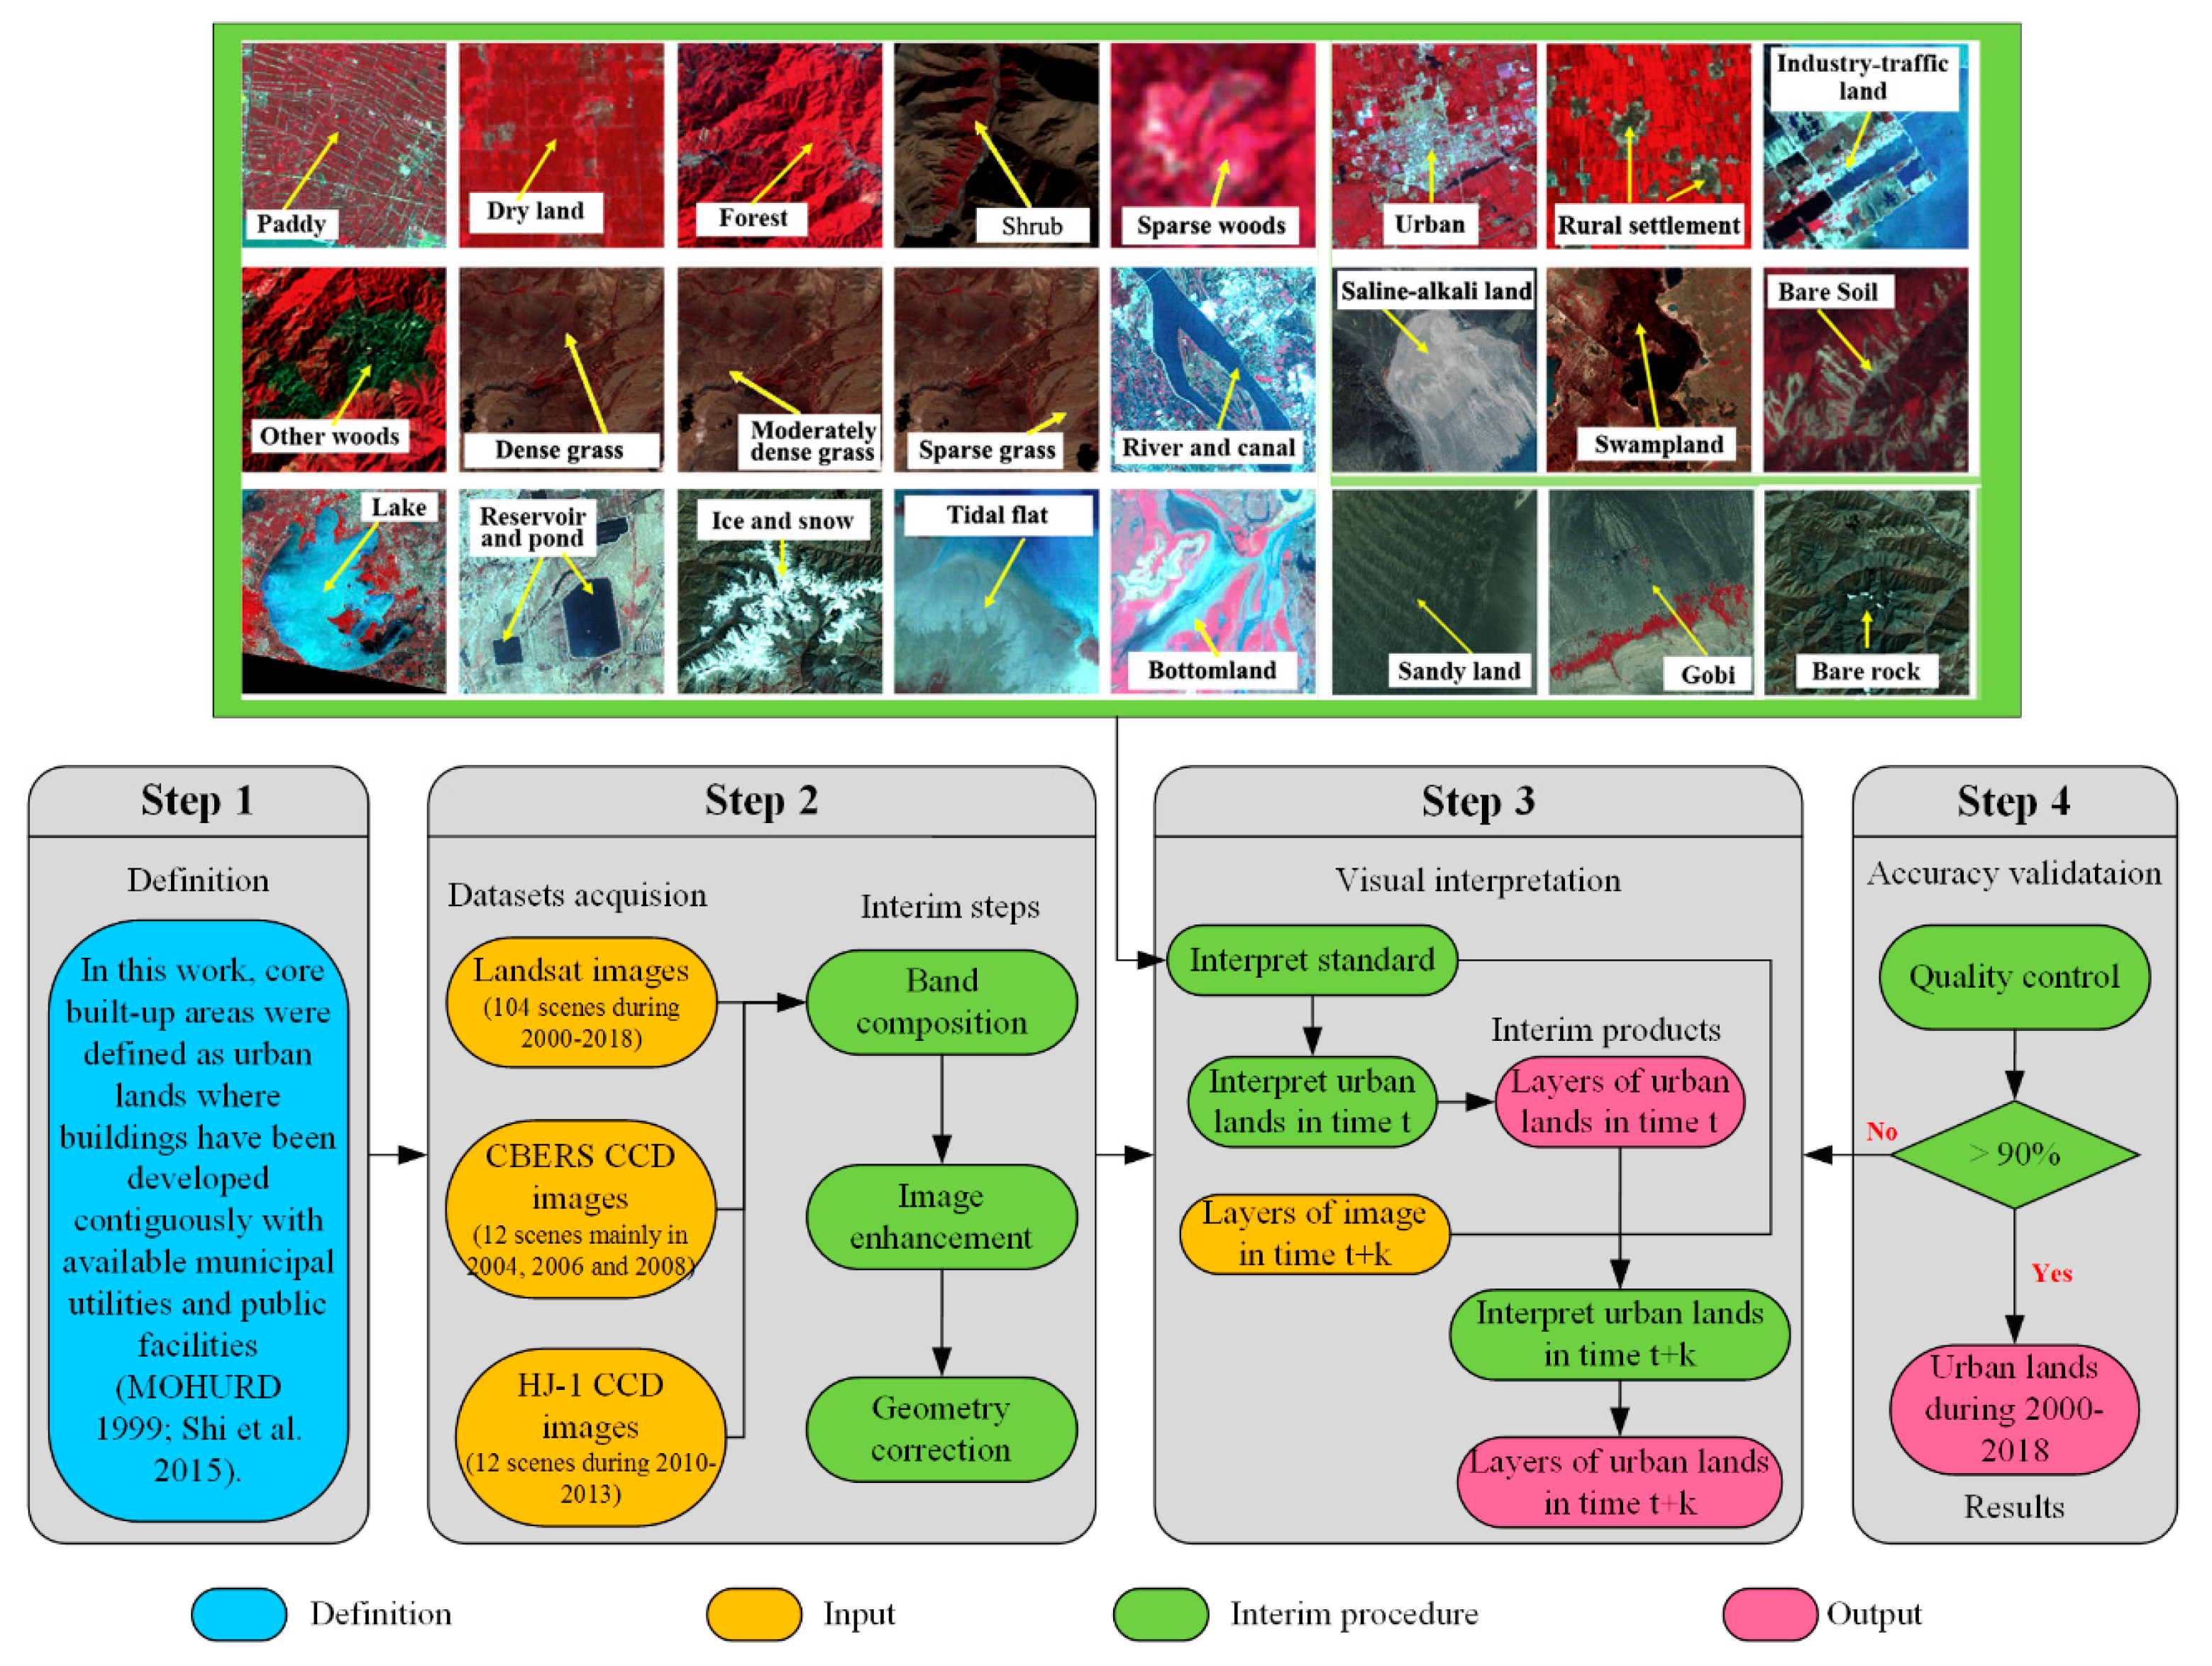
Visual interpretation method was used to extract urban lands in China’s six megacities, and a subsequent procedure that consists of four steps is deployed (Figure 2).
Step 1: Apart from the data preprocessing, a clear definition of urban lands is necessary. Our research focused on the central built-up areas, which were defined as urban lands where buildings have been developed contiguously with available municipal utilities and public facilities [32,33].
Step 2: The band composition was executed based on standard false-color synthesis and the images were enhanced using linear contrast stretching and histogram equalization. By employing this step, differences (i.e., color, and hue) between various land use/cover types seemed more obvious. Besides, the accuracy of geometric correction in terms of the relative position error or the same feature point does not exceed 2 pixels.
Step 3: In accordance with various interpretation symbols as shown in Figure 2, urban lands were separated from other land use/cover types. When interpreting the remotely sensed images of next year, the original urban lands were applied as the basic layers and the newly developed urban lands during this year were delineated. For instance, the original urban lands in 2000 and newly developed urban lands during 2000–2001 constituted the urban lands in 2001, the urban lands in 2001 and newly developed ones during 2001–2002 constituted the urban lands in 2002, and so on.
Step 4: Quality control was executed by adopting field validation and repeated interpretation. Among which, field verification mainly employed in 2000, 2005, 2008, 2010, and 2015, by taking photos and recording the situation of local land use/cover on tables. The repeated interpretation was employed annually by referring to interpretation symbols, Google Earth platform and topographic maps. If the urban lands showed low accuracies (less than 90%), they should be re-interpreted.
This procedure was performed on the Modular GIS Environment (MGE) platform, which was developed by the Intergraph Company of America and had strong image processing functions. The visual interpretation was accomplished by professional interpreters with rich experience. More detailed information of the procedure had been elaborated by Zhang et al. [34]. Noticeably, given the difficulty in obtaining high-quality remotely sensed images of China’s six megacities in some years, the interpolation data on urban land areas in these years were applied as a supplement by executing the method of Liu et al. [9].
3.3. Measurement for Characterizing Urban Land Expansion Types
As the result of the comprehensive development of factors, such as economy, society, culture, and national policies, the urban land expansion in different cities generally exhibited distinct differences in morphology. Area and perimeter dynamics are two of the basic manifestations of urban land expansion. In this study, the combination of growth rates of urban land area (GRA) (Formula (1)) and urban land perimeter (GRP) (Formula (2)) were applied to characterize the urban expansion types of China’s megacities [35].
where and are the urban land areas in t1 and t2, respectively; and are the urban land perimeters in t1 and t2, respectively.
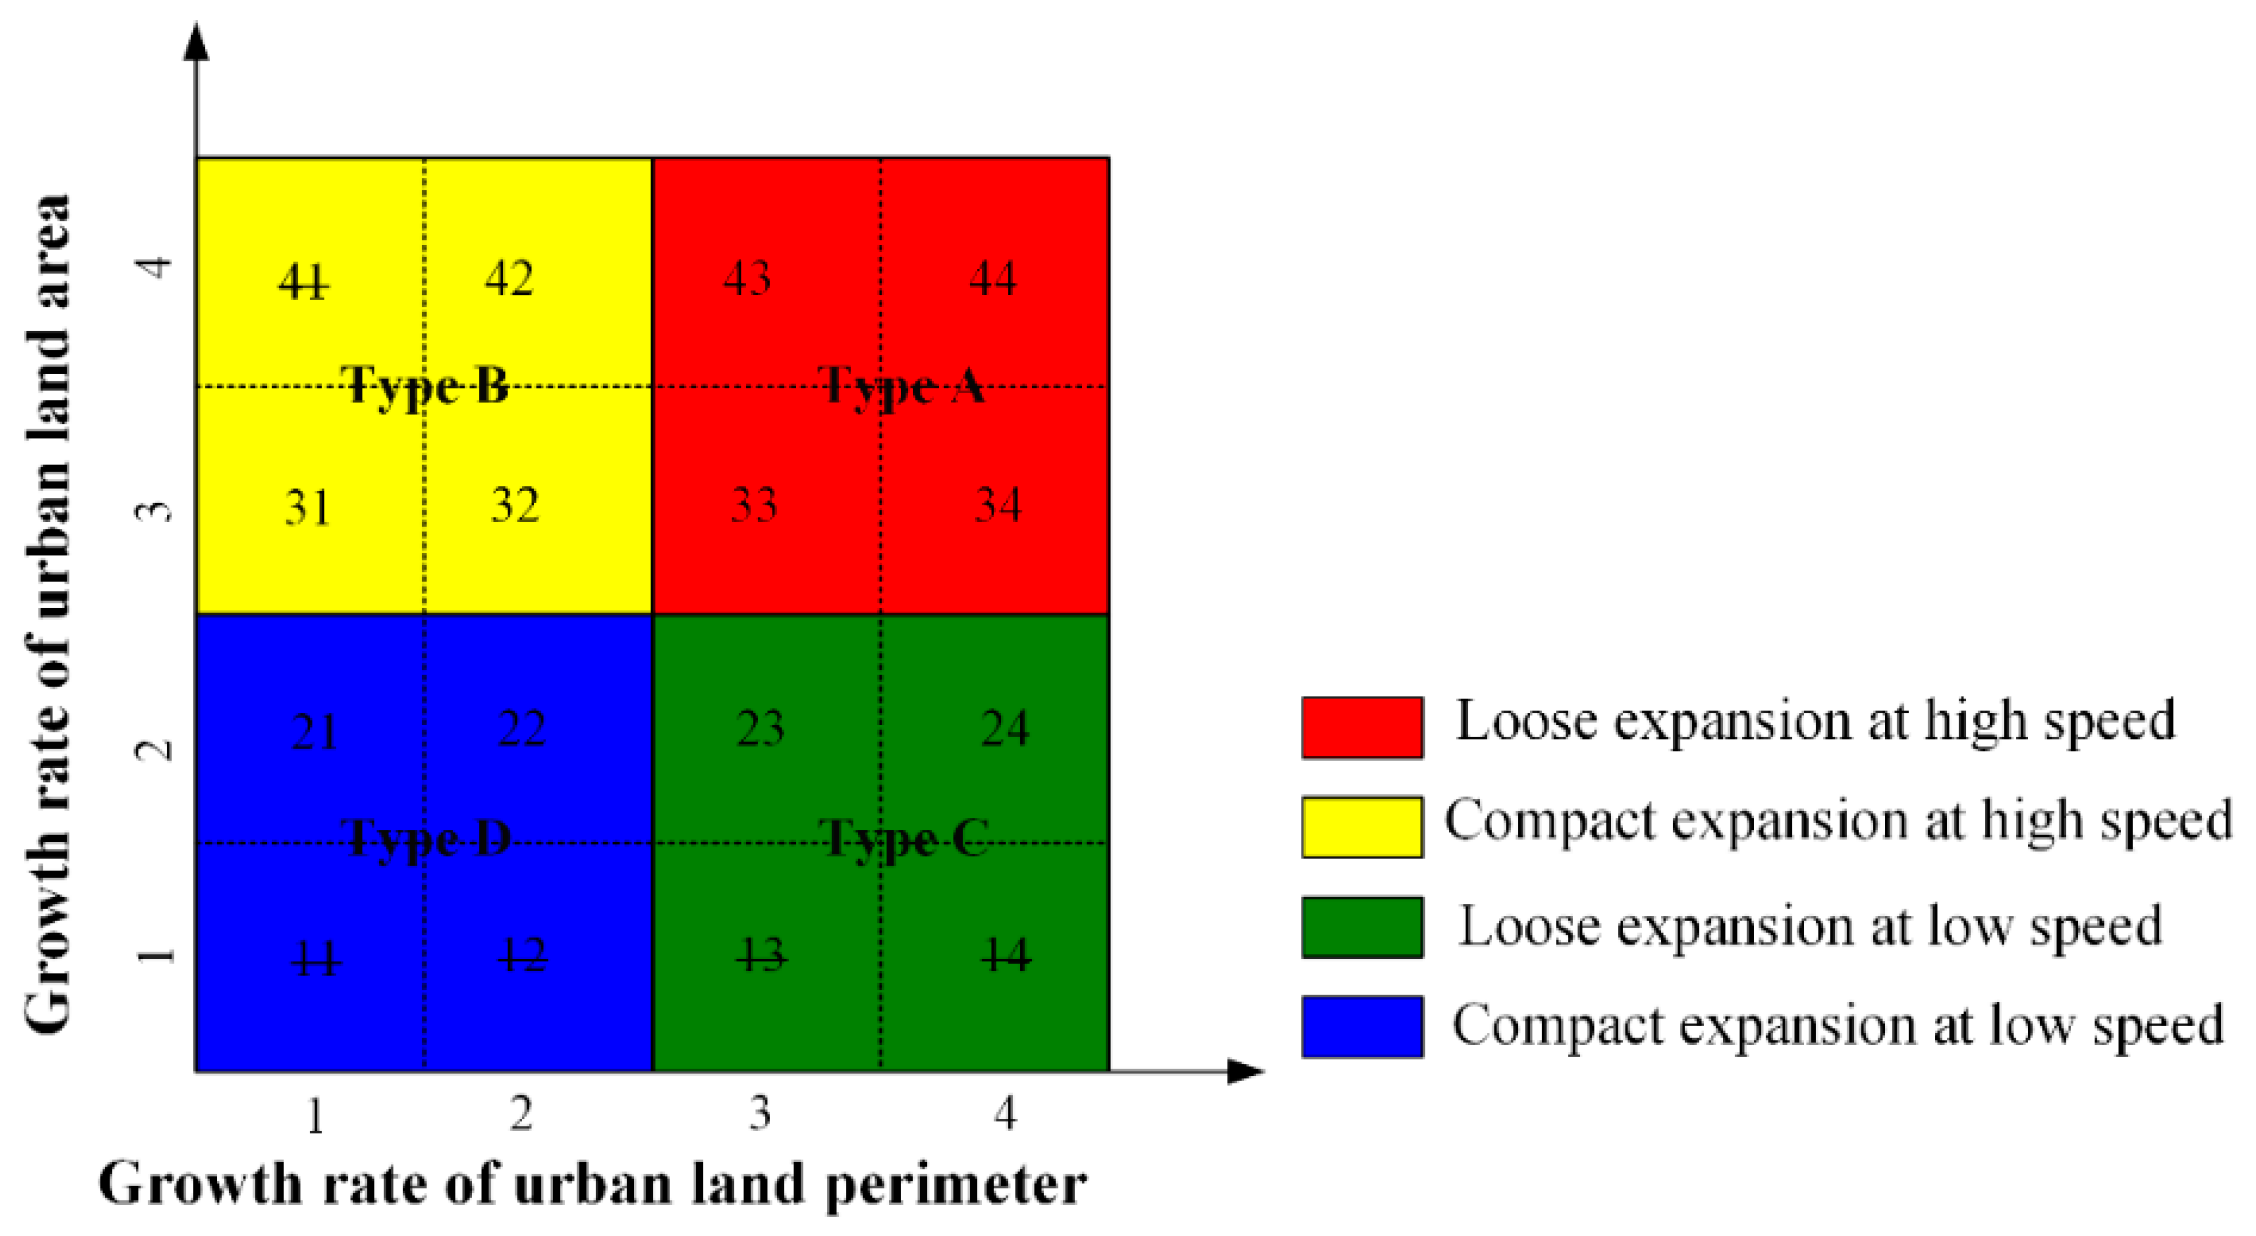
When characterizing urban land expansion types, the following steps were used according to the method proposed by Shi et al. [35]: (1) Calculating the GRA and GRP, (2) standardizing the GRA and GRP by employing Z-score normalization in the SPSS 2.0 software, and (3) dividing the normalized GRA and GRP into four levels, including Levels 1 (minimum, −1), 2 (−1, 0), 3 (0, 1), and 4 (1, maximum). Figure 3 shows that each block is combined by using two-digit codes. The first and second numbers indicated the GRA and GRP levels, respectively. High values of GRA and GRP indicated high expanding speeds and decreased compact morphologies. Then, all newly expanded urban lands were categorized into four expanding types. In this study, Types A, B, C, and D represented the loose expansion at high speed, compact expansion at high speed, loose expansion at low speed, and compact expansion at low speed, respectively.
3.4. Growth Rates of Urban Population (GRPOP) and Gross Domestic Product (GRGDP)
Urbanization is a complex process involving multiple developments in physical, demographic, and socioeconomic dimensions [2]. Therefore, apart from the scale and morphology of urban land, urban population and GDP were also regarded as representative indicators of the urbanization process. Researches about the cotemporary evolution of these indicators could help further understand the urbanization process of China’s megacities. Given the accessibility of statistical data and the definition of urban lands, year-end household-registered populations, and GPDs in city districts from 2000 to 2016 were applied as urban populations and GDPs of China’s six megacities. The growth rate of urban population (GRPOP) and the growth rate of urban GDP (GRGDP) were calculated by using Formulas (3) and (4), respectively.
where and are the urban populations in t1 and t2, respectively; and are the urban GDPs in t1 and t2, respectively.
3.5. Vegetation Coverage (VC) and Land Surface Temperature (LST)
As a crucial factor in achieving urban sustainability, the dynamics of urban environment have attracted considerable attention from researchers in the remote sensing community during the past several years [36]. The previous researches have shown that VC and LST were two important indicators of environmental conditions [36,37]. To explore the urbanization effects on the local environment of China’s megacities, the dynamics of VC and LST in both pre-grown urban lands in 2000 (“R1” hereinafter) and newly expanded urban lands during 2000–2018 (“R2” hereinafter) were calculated by using Formula (5).
where indicates the changed VC or LST of the ith pixel from 2000 to 2018; and is the VC or LST of the ith pixel in 2000 and 2018, respectively. The VC in 2000 and 2018 is calculated using Formula (6).
where indicates the VC of the ith pixel; is the NDVI value of the ith pixel in MOD13A3 products; and are the minimum and maximum NDVI values of MOD13A3 products, respectively.
The LST in 2000 and 2018 is calculated using Formula (7) [38].
where indicates the LST of the ith pixel; and is the DN value of the ith pixel in MOD11A2 products.
4. Results
4.1. Basic Characteristics of Urban Land Expansion
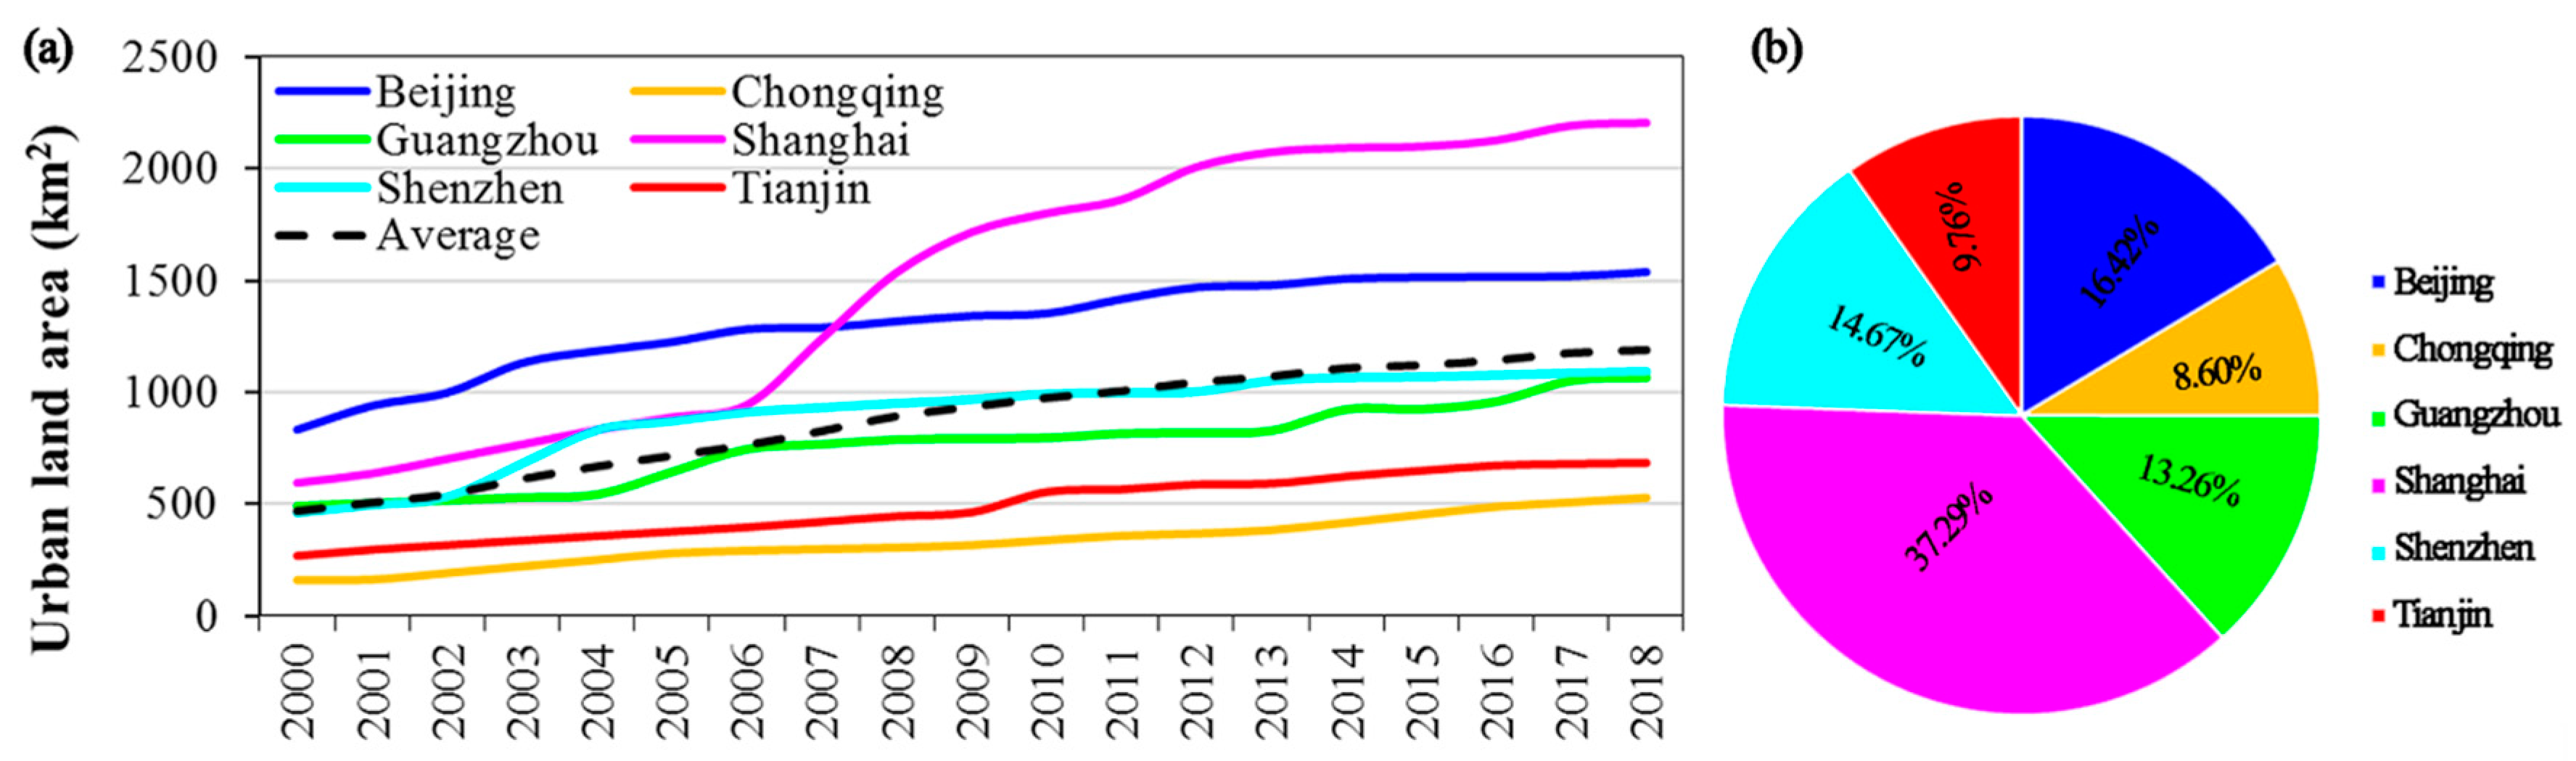
The magnitude of urban lands varied greatly in China’s six megacities (Figure 4a). In 2000, Beijing had the largest urban land area of 830.78 km2, followed by Shanghai (598.78 km2) and Guangzhou (491.75 km2). Urban land in Shenzhen (461.82 km2) and Tianjin (266.23 km2) ranked third and second from the end. Chongqing had the smallest urban land area of 161.43 km2, which was less than 1/5 of that in Beijing. In 2003, urban land areas in Shenzhen surpassed Guangzhou and ranked third. In 2008, urban land areas in Shanghai outpaced Beijing, thereby becoming the largest megacities in terms of urban land areas. Until 2018, the magnitude of urban land areas is ranked in the order of Shanghai (2205.09 km2), Beijing (1538.28 km2), Shenzhen (1093.96 km2), Guangzhou (1063.14 km2), Tianjin (686.54 km2), and Chongqing (531.76 km2). Overall, the averaged area of urban lands in six megacities increased from 486.46 km2 in 2000 to 1186.46 km2 in 2018. In comparison, urban land areas in Beijing and Shanghai always outpaced the average, those in Guangzhou and Shenzhen were close to the average, whereas, those in Tianjin and Chongqing lagged behind the average.
Urban lands in China’s megacities expanded from 2810.77 km2 in 2000 to 7118.77 km2 in 2018 with a 153.27% increase. Six megacities contributed differently to the newly expanded urban lands (Figure 4b). During the past 18 years, the maximum expansion emerged in Shanghai with the area of 1606.32 km2, whereas the minimal expansion emerged in Chongqing with the area of 370.33 km2. Although the mean expansion area of six megacities reached 718.00 km2, only that in Shanghai surpassed the average. Statistically, the proportion of newly expanded urban lands was ranked in the order of Shanghai (37.29%), Beijing (16.42%), Shenzhen (14.67%), Guangzhou (13.26%), Tianjin (9.76%), and Chongqing (8.60%).
Spatially, the newly expanded urban lands of Beijing mainly distributed in the north, east, and south directions (Figure 1). Tianjin had witnessed urban land expansion at all directions. For Shanghai, urban land expansion mainly emerged in the west, south, and east directions. Urban lands in Chongqing and Guangzhou mainly expanded along the south–north directions. For Shenzhen, the urban lands expanded minimally in the south direction, however, the north direction had undergone dramatic expansion.
4.2. Types of Urban Land Expansion
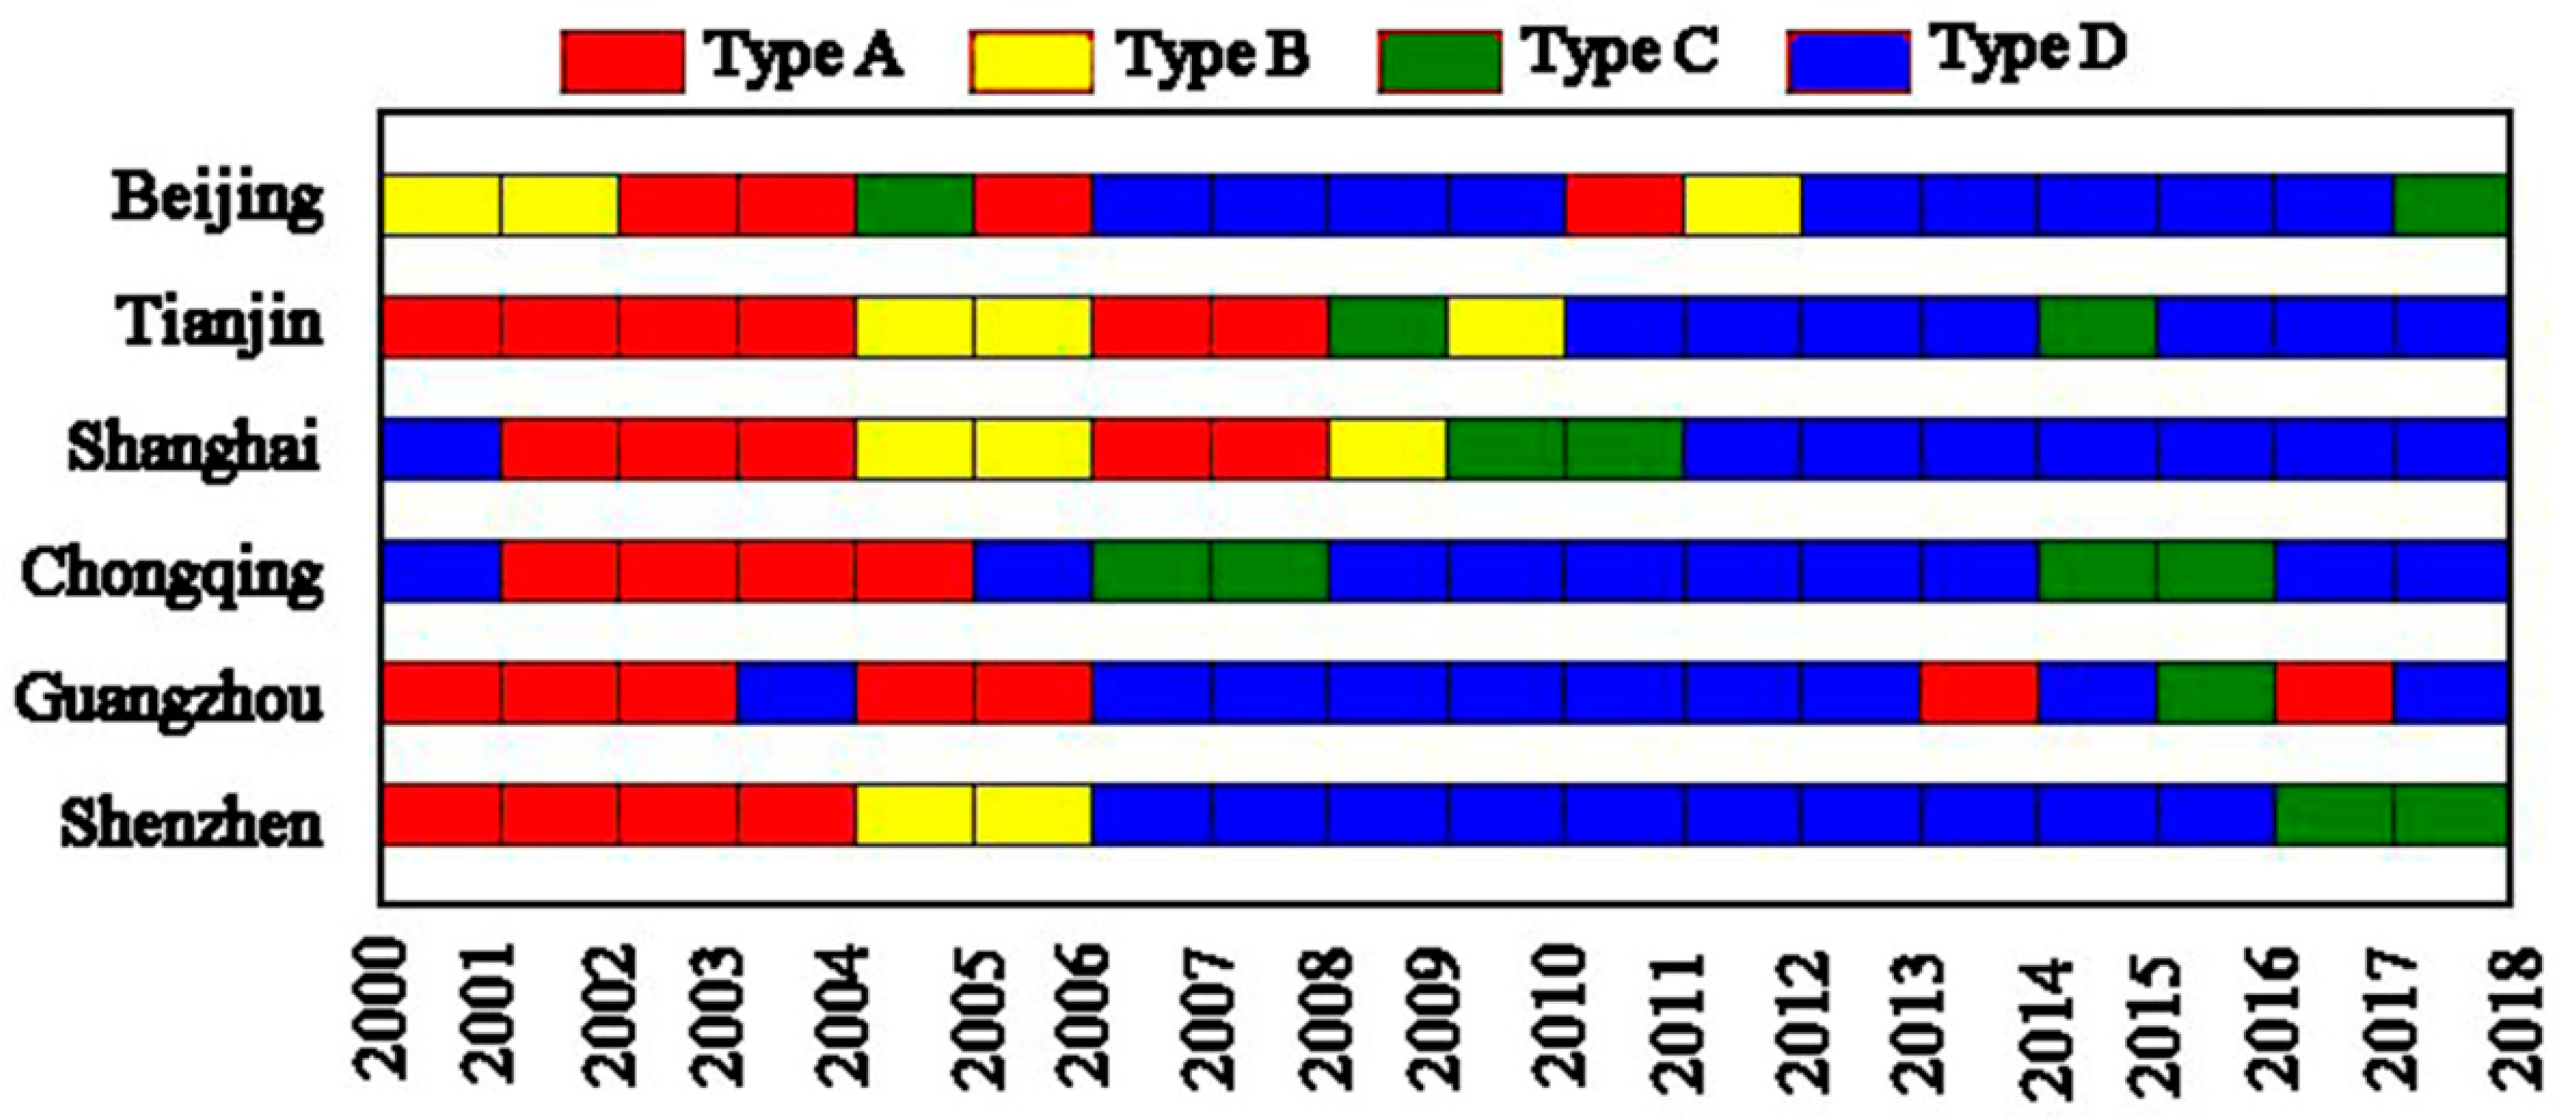
From 2000 to 2018, the urban lands in China’s six megacities have undergone various expansion processes (Figure 5). The expansion process of Beijing was relatively complex and mainly included nine stages, those were 2000–2002 (Type B), 2002–2004 (Type A), 2004–2005 (Type C), 2005–2006 (Type A), 2006–2010 (Type D), 2010–2011 (Type A), 2011–2012 (Type B), 2012–2017 (Type D), and 2017–2018 (Type C). Tianjin had undergone eight periods: 2000–2004 (Type A), 2004–2006 (Type B), 2006–2008 (Type A), 2008–2009 (Type C), 2009–2010 (Type B), 2010–2014 (Type D), 2014–2015 (Type C), and 2015–2018 (Type D). The urban land expansion in Shanghai adopted Types A and B during 2001–2009, and Type D took the lead subsequently. The expansion process of Shenzhen was relatively simple, which was mainly dominated by Type A in 2000–2004, Type B in 2004–2006, Type D in 2006–2016, and Type C in 2016–2018, respectively. Different from four other megacities, Type B had not emerged in Guangzhou and Chongqing during the past 18 years. Overall, urban lands in China’s megacities have experienced the high- to low-speed expansion processes.
During 2000–2018, the distributions and contribution rates of four urban land expansion types were uneven in the six megacities (Figure 6). Type A was the dominated expansion type of Beijing with the proportion of 43.63%, followed by Types B (30.94%), D (17.12%), and C (8.31%). The four expansion types distributed evenly in the north, east, and south directions. For Tianjin, Types A (33.18%) and B (31.27%) were its main expansion types, supported by Types C (10.46%) and D (25.09%). Although Tianjin had witnessed urban land expansion at all directions, the distributions of four expansion types were distinct. Among which, the southeast direction of Tianjin mainly expanded by Type B. Nearly 2/3 of the newly developed urban lands in Shanghai were from Type A and B, meanwhile, the other 1/3 were from Types C and D. Type A dominated the west direction, while Type D mainly took place in the east direction. Types A, C, and D contributed 32.03%, 22.97%, and 45.00% to the urban land expansion of Chongqing, respectively. Similar to Chongqing, Guangzhou also expanded to the south by Type C and D, and to the north by Type A. Totally, 75.04%, 18.97%, and 6.00% of the newly developed urban lands adopted Types A, D, and C, respectively. For Shenzhen, the north direction had undergone dramatic expansion and mainly adopted Type A. Overall, Type A was the main urban land expansion type of China’s megacities, Type C contributed relatively little to urban land expansion, whereas, Type B had no contribution to urban land expansion in Guangzhou and Chongqing.
4.3. Cotemporary Evolution of Urban Land, Population, and GDP
From 2000 to 2016, China’s megacities experienced drastic urbanization as represented by the dynamics of urban land, population, and GDP that increased by 4036.33 km2, 31.80 million persons, and 1140.57 billion Renminbi (RMB), respectively (Figure 7). Statistically evident log-linear relationships existed between urban lands and populations with slopes ranging from 671.35 (Beijing) to 22,483.00 (Shanghai), thereby suggesting that doubling populations would increase the urban land areas by nearly 1484.68 km2 in Beijing, 202.10 km2 in Chongqing, 784.18 km2 in Guangzhou, 6768.06 km2 in Shanghai, 373.76 km2 in Shenzhen, and 738.04 km2 in Tianjin, respectively. Although lower slopes than those between urban lands and populations have been presented, urban lands and GDPs also exhibited significant log-linear relationships, and each doubling GDP would result in additional 176.28, 64.13, 146.76, 654.56, 171.76, and 107.16 km2 of urban land areas in Beijing, Chongqing, Guangzhou, Shanghai, Shenzhen, and Tianjin, respectively. Therefore, urban population and GDP products have resulted in positive influences on urban land expansion in China’s six megacities since 2000.
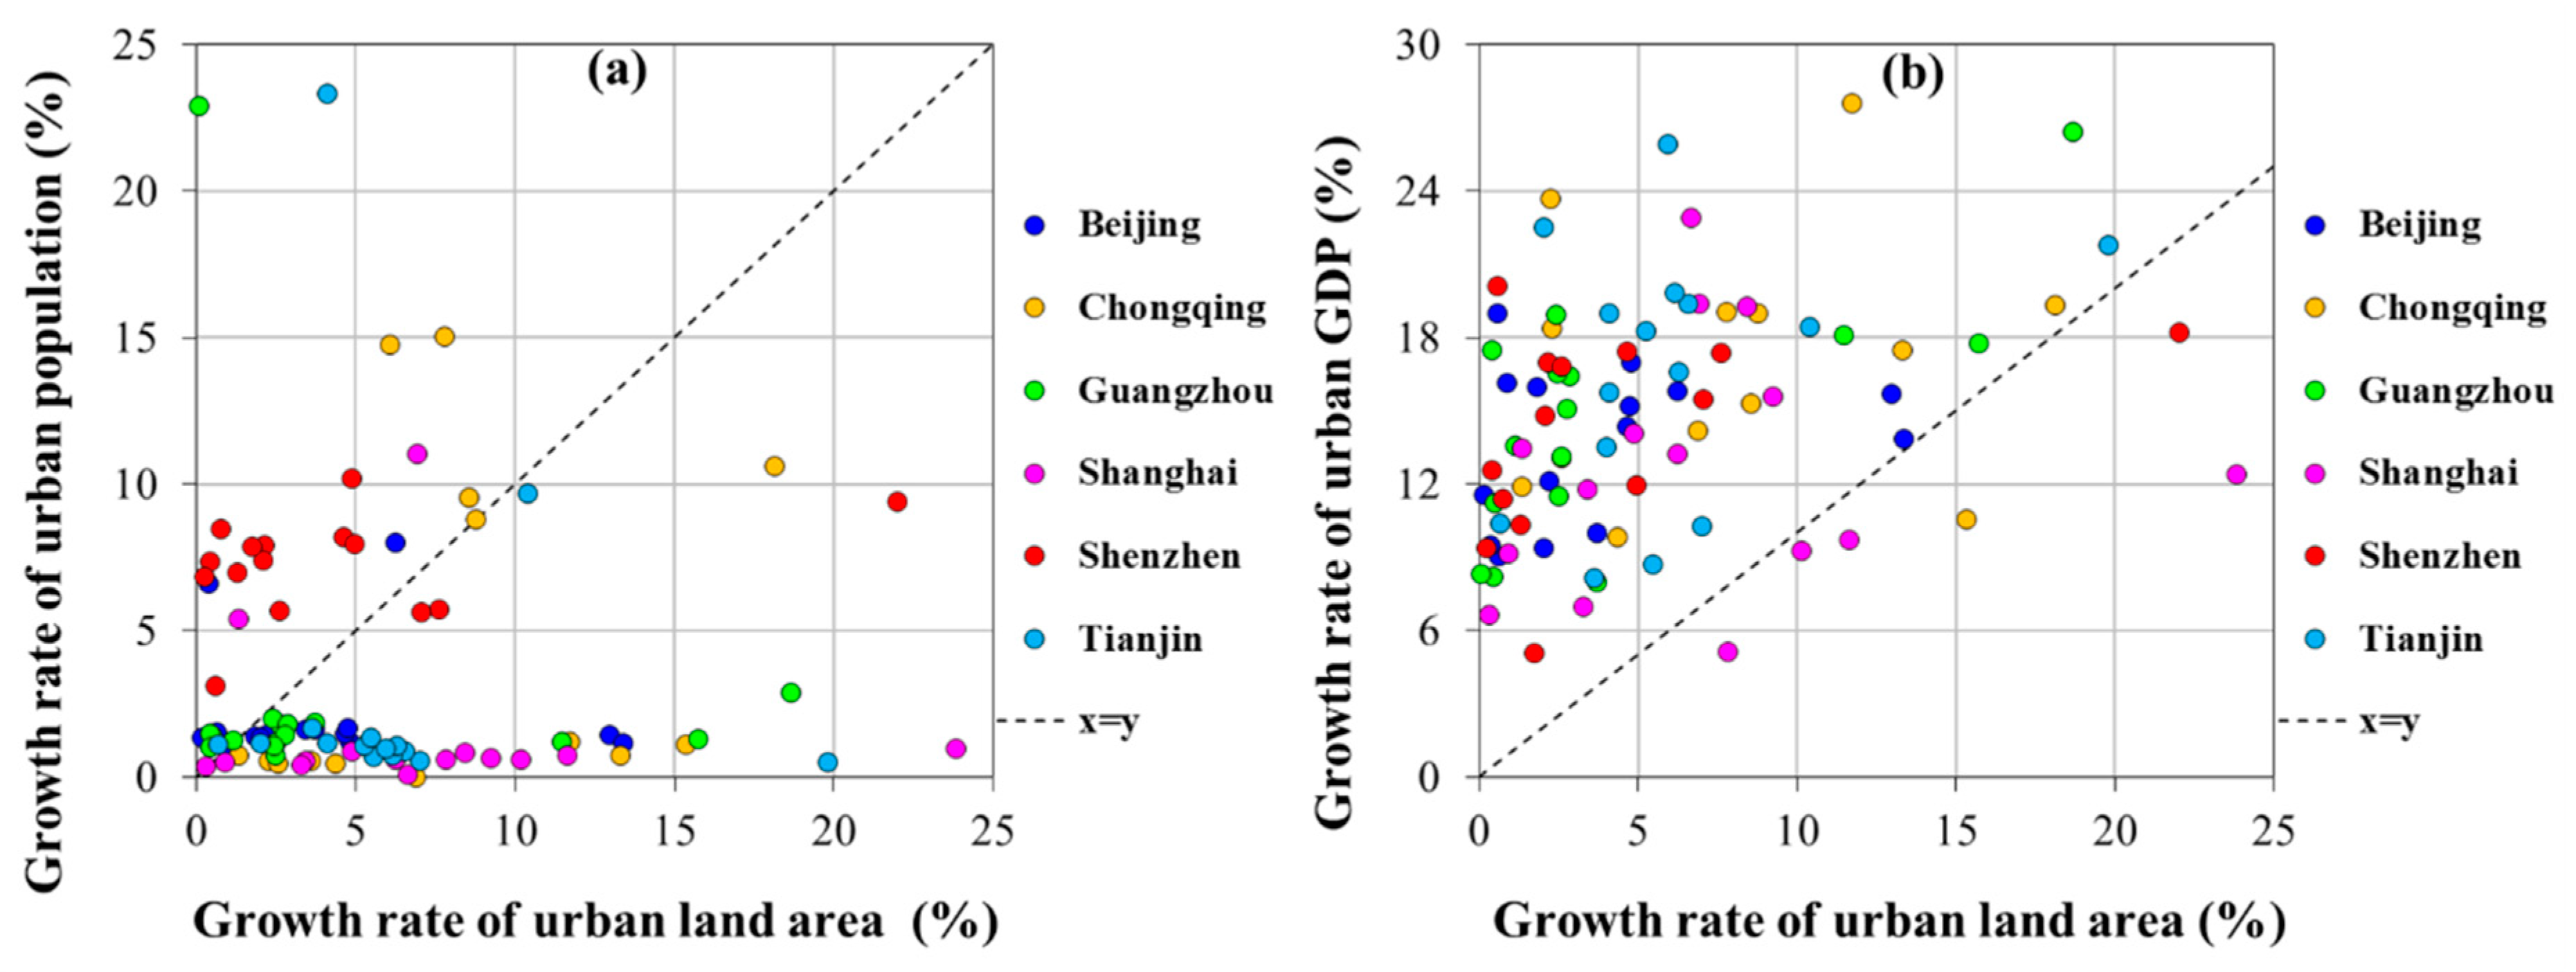
During 2000–2016, the average GRPOP and GRGDP in China’s megacities were 3.52% and 15.74% with the dispersion of 0.23 and 0.10, respectively. Urban land areas, populations, and GDPs of China’s megacities changed variously from 2000 to 2016 (Figure 8). The urban population grew faster than urban land areas in Shenzhen and Chongqing with average GRPOPs of 7.02% and 7.30% and GRPOP dispersions of 0.42 and 0.06, respectively. The average GRPOPs in the four other megacities ranged from 1.57% (Shanghai) to 2.84% (Tianjin) and clearly lagged behind their corresponding GRAs (3.35–7.77%). Beijing, Chongqing, Guangzhou, Shanghai, Shenzhen, and Tianjin showed high average GRGDPs of 16.70%, 20.96%, 14.84%, 12.91%, 16.92%, and 17.45%, respectively, and their GRGDP dispersions ranged from 0.08 (Guangzhou) to 0.19 (Beijing). By contrast, all these six megacities presented higher GRGDPs than GRAs. Overall, the speed of urban land expansion in China’s megacities outpaced their corresponding population growth but lagged behind their GDP increase from 2000 to 2016.
4.4. Urbanization Effects on Local Environment
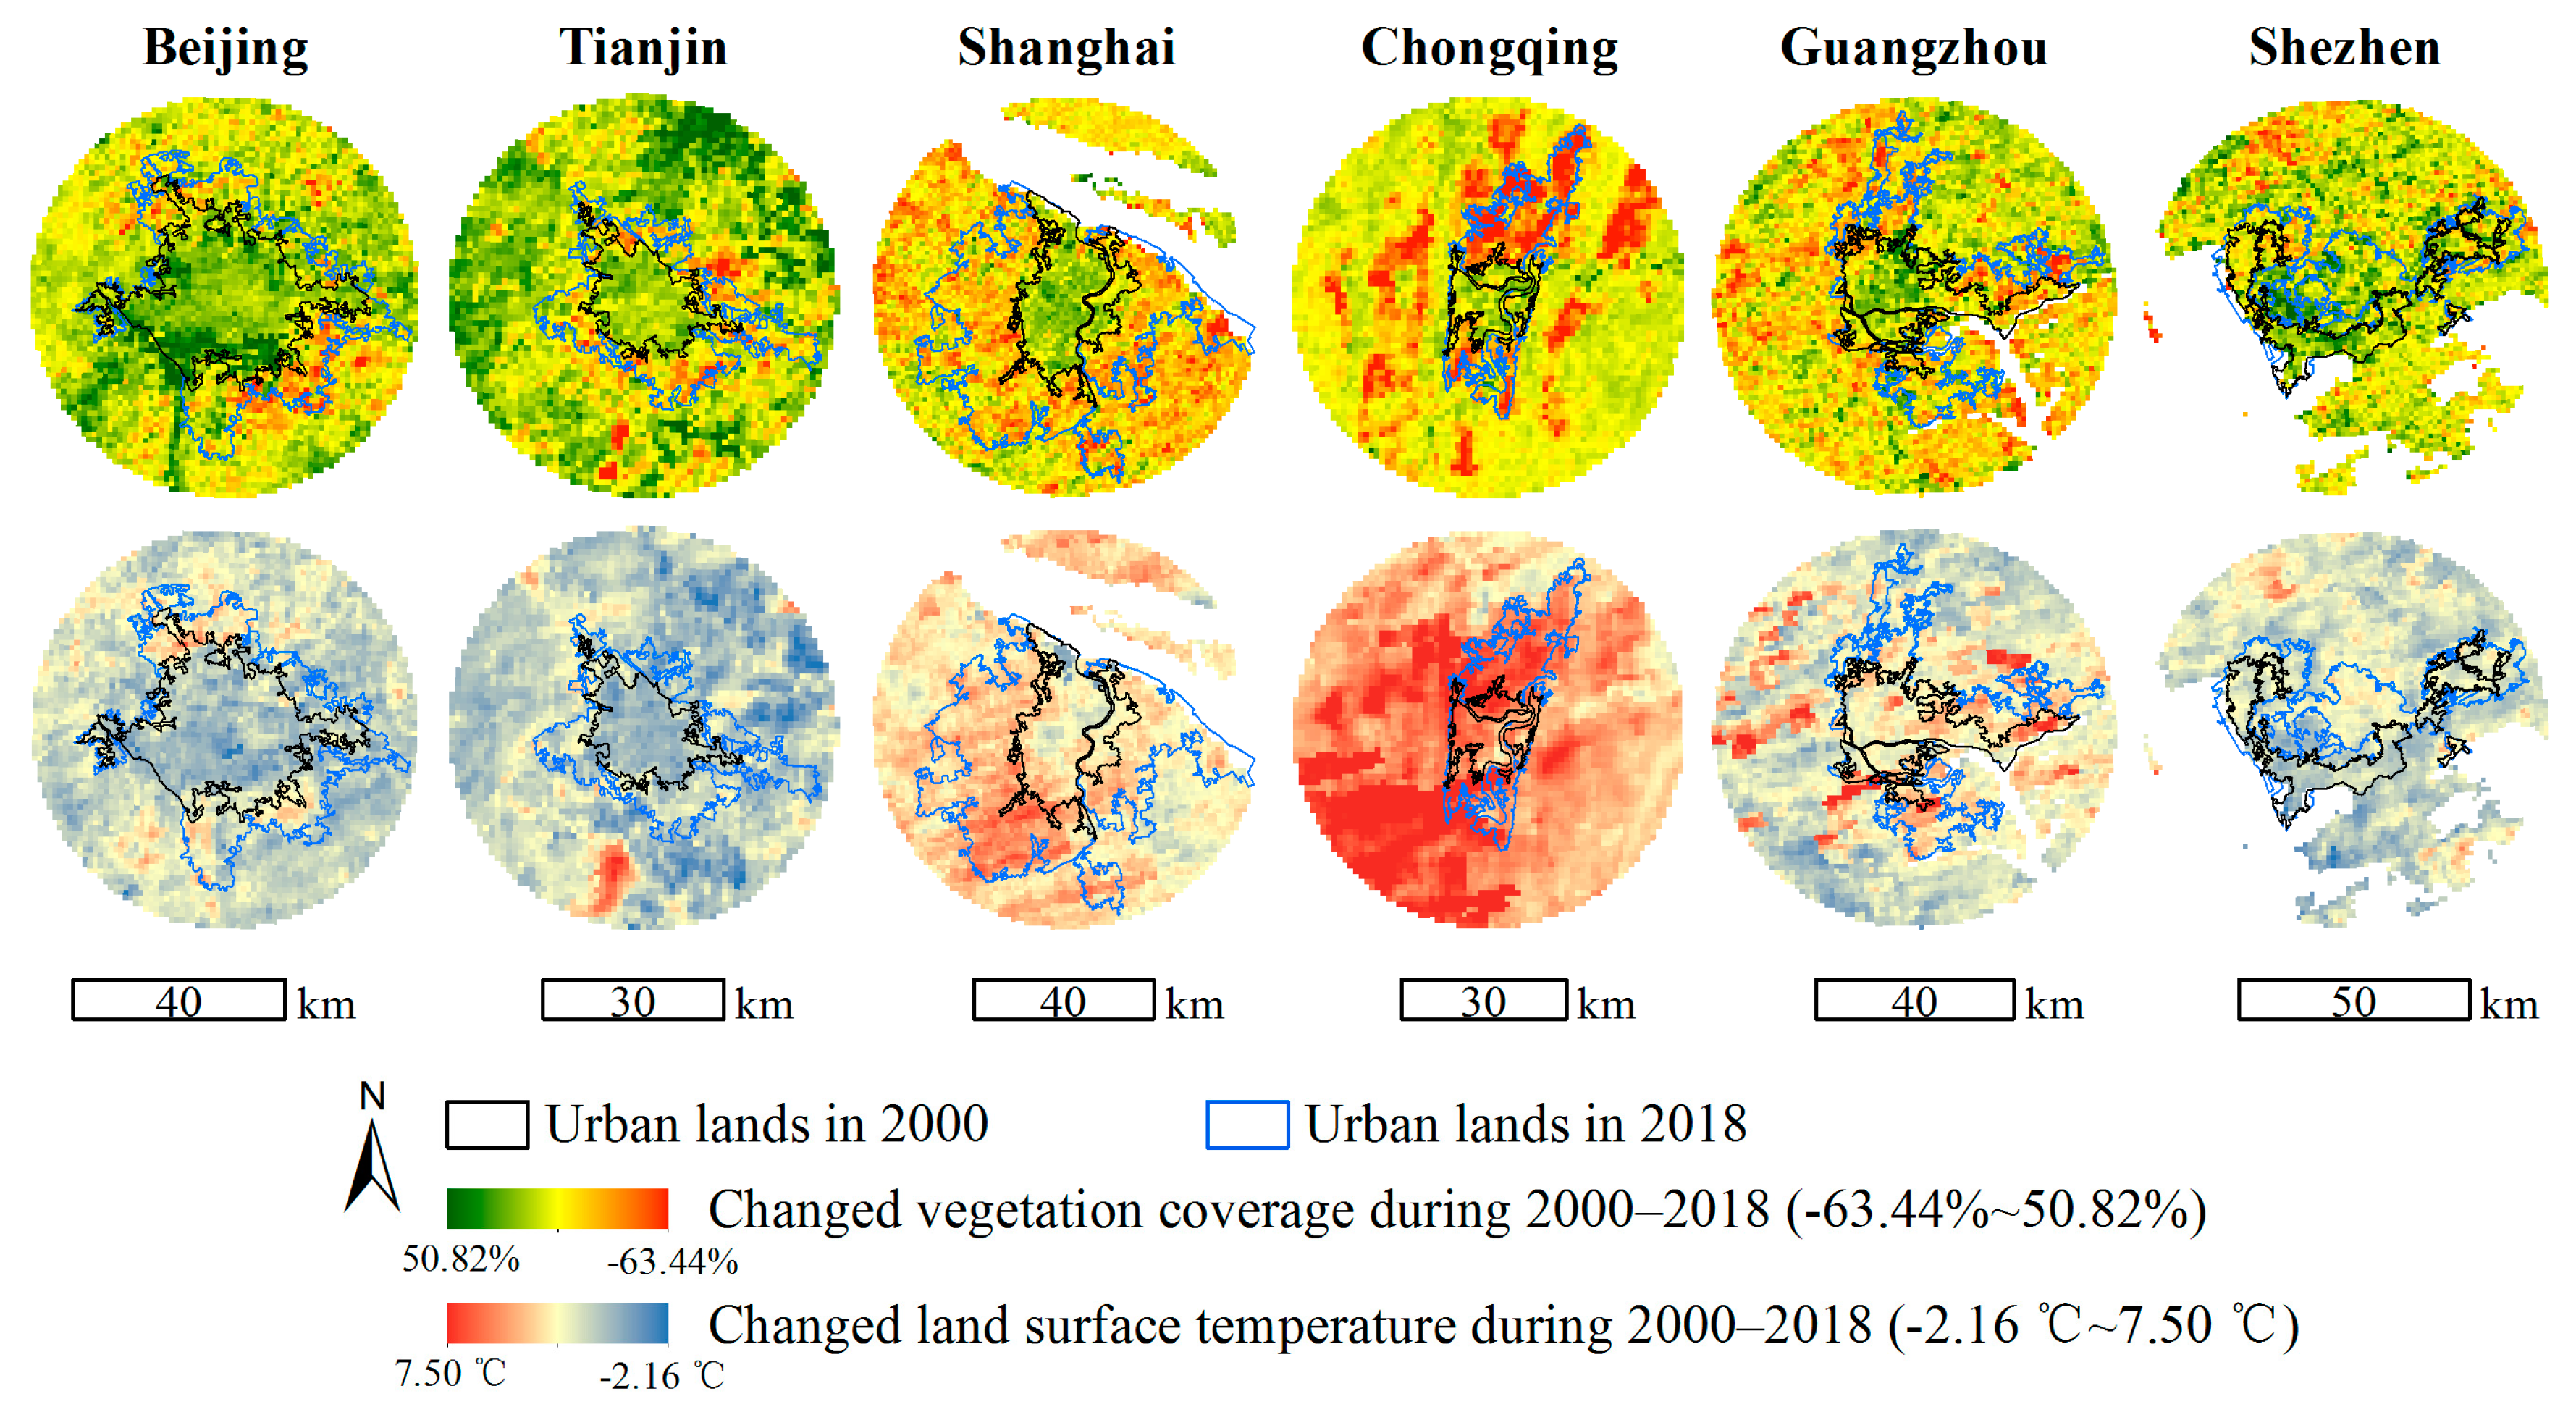
From 2000 to 2018, VC dynamics in R1 and R2 varied greatly in China’s six megacities (Figure 9). The VCs of six megacities in R1 showed increasing trends and their average value grew by 3.32% during the past 18 years. VC increases in Beijing (8.09%) and Tianjin (4.27%) were larger than the average. VC increase in Shanghai was 3.02% and ranked third. However, VC increases in Shenzhen, Guangzhou and Chongqing had not reached 3.00%. On the contrast, the VCs of six megacities in R2 mainly exhibited the descending trends with their average value reducing by 5.07%. The most obvious decline of VC values emerged in Chongqing (15.40%), followed by Shanghai (6.82%) and Guangzhou (5.40%). The VC of Tianjin reduced by 3.55%, which was lower than the average. Beijing showed the minimal VC decrease with 0.90%, whereas, VC in Shenzhen had not even decreased.
Moreover, the LSTs of the six megacities presented increasing trends, gentle in R1 and dramatic in R2. The averaged LST increased by 1.65 °C in R1 and 2.12 °C in R2, respectively. For R1, the highest LST increases emerged in Chongqing (3.92 °C), while the lowest occurred in Tianjin (0.30 °C). LST increases in Guangzhou and Shanghai ranked second and third, which grew by 2.17 °C and 2.02 °C, respectively. LST increases in Beijing and Shenzhen were lower than 1.00 °C, far below the average. For R2, the LST increases in Chongqing, Shanghai, and Guangzhou have surpassed the average, with 4.38 °C, 2.70 °C, and 2.22 °C, respectively. Meantime, the LST increases in Beijing (1.26 °C), Shenzhen (1.35 °C), and Tianjin (0.84 °C) was lower than the average.
5. Discussions
The 2030 Development Agenda has devoted a specific goal to cities, which aims to “make cities and human settlements inclusive, safe, resilient and sustainable” [3,39]. Understanding the urbanization processes might help to achieve the goal. As the important city forms carrying dense population and social activities, megacities in China was selected as the study areas in this work. Urban lands in China’s six megacities were delineated from multi-source remotely sensed images using visual interpretation method. To ensure the accuracy of monitoring results more than 90%, this procedure was executed based on strict criteria and accomplished by professional interpreters with rich experience. Section 4.1 elaborated the differences of urban lands in China’s six megacities, in terms of magnitudes and expansion directions. Apart from the various historical, socioeconomical and political backgrounds of six megacities illustrated in Section 2, natural terrain (Table 3) might be the other vital factor that influenced the urban land expansion. The interpretation results provided the data base for subsequent research. However, the spatial resolutions of multi-source remotely sensed images used in this work are 30–80 m, therefore, the urban land products were only applied as the referenced extents when analyzing urbanization effects on environment. In the future, more remotely sensed images with various spatial resolutions should be used to obtain urban land products to meet the needs of multi-scales.
Dynamics of physical features (i.e., scale, and morphology) of urban lands are vital indicators to understand urbanization processes. The previous studies (i.e., [9,43]) mostly characterized urban land sprawl types via edge-expansion, infilling, and outlying patterns. Shi et al. [35] provided a simple approach to identify expansion types by synergistically considering areas and perimeters, and divided China’s 340 cities into four types based on the newly developed urban land during 1987–2010. In this work, the interannual newly grown urban land of each megacity was applied as a basic unit to characterize expansion types, and the monitored epoch was updated to 2018. Therefore, more detailed information could be acquired. Figure 5 showed that Type A was the main expansion type in six megacities before 2004, while Type D dominated the urban land expansion after 2012. Although urban land expansion in six megacities exhibited the similar tendency from high GRA/GRP to low GRA/GRP, they underwent a diverse sprawl process. For instance, expansion types presented distinct differences during 2004–2012, those changed frequently in coastal megacities (i.e., Tianjin, and Shanghai) but gently in four other megacities. Accordingly, four types contributed distinctly to urban land expansion in the six megacities. By employing this method, the expansion types of more cities in China or other countries could be characterized in the future.
Urbanization is a complex process involving many aspects. Apart from the uncontrollable urban sprawl, the remarkable economic growth, continuous population explosion, and negative effects on environment are also characteristics considered in the urbanization process. Results of this work revealed two problems existing in China’s six megacities at the onset of the 21st century. From a statistical perspective, urban lands, populations, and GDPs in China’s six megacities grew at different speeds, and their specific manifestation was that the speed of urban land expansion outpaced the population growth but lagged behind in GDP increase. This finding also supported the standpoints of Fei et al. [2]. From an environmental perspective, the rise in LST has become a problem that cannot be ignored. Besides, VC in R2 presented obvious decline because proportional vegetation had been encroached by the newly expanded urban lands. However, VC in R1 showed a slight increase. According to Qian et al. [44], this phenomenon could be ascribed to the great efforts in increasing urban greenspace by the local government. In this study, researches about the VC and LST were just a preliminary attempt. However, it provided referenced materials and new ideas for further studies. More exploring about urbanization effects on the environment should be executed in the future.
Specially, urban sustainability is defined as an adaptive capacity that can balance social wellbeing, economic development, and environmental protection [45]. Li et al. [46] stated that the sustainable development of megacities has four major challenges, including land subsidence, environment, traffic, and energy aspects. According to the results of this work, there was still a distance to achieve sustainability for China’s six megacities. Natural conditions are stable factors that cannot be changed frequently during a short period, but social factors can be rationally regulated and controlled. In the future, helpful measures and special urban planning should be applied to the six megacities to mitigate the negative effects of urbanization on the local environment. Overall, obtaining sustainability in China’s cities is an expected achievable goal that requires the joint efforts of the government and ordinary people. In addition, this work characterized China’s six megacities from the limited aspects, providing some materials as references when designing rational urban planning. However, these aspects could not thorough respect urbanization of China’s six megacities. More key indicators (i.e., population density, air temperature [47], food production [48], cropland losses [14], etc.) of cities and megacities should be investigated in the future.
6. Conclusions
Acknowledging and understanding the detailed process of urbanization is crucial in designing development planning and realizing urban sustainability. Taking China’s six megacities as the study area, this work explored their interannual urbanization processes during 2000–2018 from the aspects of basic characteristics of urban land expansion, expansion types, cotemporary evolution of urban land–demography–economy, and urbanization effects on the local environment. Four conclusions were summarized as follows: (1) Urban lands in China’s six megacities expanded significantly and showed remarkable differences. The largest and slightest expansion occurred in Shanghai (1606.32 km2) and Chongqing (370.33 km2), respectively. (2) The contributions of urban land expansion types varied greatly in China’s six megacities. Two expansion types—loose expansion at high speed and compact expansion at low speed—dominated the urban land expansion in the early and later years, respectively. (3) Urban land–population–GDP showed an uneven evolution. GDP increased the fastest (1140.57 billion RMB), followed by urban land expansion (4036.33 km2), whereas population growth (31.80 million persons) was the slowest. (4) Urbanization resulted in distinct environmental effects. Vegetation coverage in newly expanded urban lands decreased significantly, whereas those in pre-grown urban lands increased slightly. Land surface temperatures in newly expanded urban lands exhibited a higher increase than those in pre-grown urban lands. This study enriched the content of urbanization, supplemented the existing materials of megacities, and provided a scientific reference in designing rational urban planning.
Author Contributions
Conceptualization, methodology, formal analysis, investigation, and original draft preparation, S.Y.; Supervision, Z.Z.; Review and editing, F.L.; Data curation, X.W. and S.H.
Funding
This research was funded by National Key Research and Development Plan, ‘Dynamic monitoring and evaluation of gully erosion in black soil region Northeast China’ (Grant No. 2017YFC0504201) and the International Partnership Program of Chinese Academy of Sciences (Grant No. 131C11KYSB20160061).
Acknowledgments
The authors thank all researchers involved in data acquisition, image registration, and urban lands delineation and verification. They were members and students in the Renewable Resources Laboratory, Institute of Remote Sensing and Digital Earth, Aerospace information research institute, Chinese Academy of Sciences.
Conflicts of Interest
The authors declare no conflict of interest.
Appendix A

Table A1.
Details of the multisource remotely sensed images.
| City | Path/Row | TM/ETM+ | CBERS | HJ-1 | OLI |
|---|---|---|---|---|---|
| Beijng | 122/032 | 2000-2007,2009-2011 | 2008 | 2012 | 2013-2018 |
| Tianjin | 122/033 | 2000, 2001, 2004, 2006, 2009, 2010 | 2008 | 2011,2012 | 2013-2018 |
| Shanghai | 118/038, 118/039 | 2000, 2001, 2004, 2008-2010 | 2006,2008 | 2011,2012 | 2013-2018 |
| Chongqing | 128/039 | 2000-2002, 2004, 2005, 2006, 2009, 2010 | 2004,2008 | 2011-2013 | 2013-2018 |
| Guangzhou | 122/044 | 2001, 2004, 2006, 2009, 2010 | 2006,2008 | 2010-2013 | 2013-2018 |
| Shenzhen | 121/044, 122/044 | 2000-2002, 2004, 2006, 2007, 2009 | 2008 | 2010-2012 | 2013-2018 |
Notes: For each megacity, months with vigorous vegetation growth were preferred. Cloud coverage of each image was lower than 10%. Details have been listed in the book named “Atlas of urban expansion by remote sensing in China”.
Table A2.
Details of MODIS products.
| City | Path/Row | Data |
|---|---|---|
| Beijng | h26v04, h26v04 | June, July, August in 2000-2018 |
| Tianjin | h26v04, h26v05, h27v04, h27v05 | June, July, August in 2000-2018 |
| Shanghai | h28v05 | June, July, August in 2000-2018 |
| Chongqing | h27v05, h27v06 | June, July, August in 2000-2018 |
| Guangzhou | h28v06 | June, July, August in 2000-2018 |
| Shenzhen | h28v06 | June, July, August in 2000-2018 |
References
- United Nations. World Urbanization Prospects 2018; United Nations, Department of Economic and Social Affairs: New York, NY, USA, 2019. [Google Scholar]
- Fei, W.; Zhao, S. Urban land expansion in China ’ s six megacities from 1978 to 2015. Sci. Total Environ. 2019, 664, 60–71. [Google Scholar] [CrossRef] [PubMed]
- United Nations General Assembly. Transforming Our World: The 2030 Agenda for Sustainable Development; United Nations General Assembly: New York, NY, USA, 2015; Volume 16301. [Google Scholar]
- Yu, S.; Zhang, Z.; Liu, F. Monitoring population evolution in China using time-series DMSP/OLS nightlight imagery. Remote Sens. 2018, 10, 194. [Google Scholar] [CrossRef]
- Yang, Y.; Liu, Y.; Li, Y.; Du, G. Quantifying spatio-temporal patterns of urban expansion in Beijing during 1985–2013 with rural-urban development transformation. Land Use Policy 2018, 74, 220–230. [Google Scholar] [CrossRef]
- Xu, H. Analysis of Impervious Surface and its Impact on Urban Heat Environment using the Normalized Difference Impervious Surface Index (NDISI). Photogramm. Eng. Remote Sens. 2010, 76, 557–565. [Google Scholar] [CrossRef]
- United Nations, Department of Economic and Social Affairs. World Population Prospects; United Nations, Department of Economic and Social Affairs: New York, NY, USA, 2019. [Google Scholar]
- Aguilár, A.G.; Ward, P.M. Globalization, regional development, and mega-city expansion in Latin America: Analyzing Mexico City’s peri-urban hinterland. Cities 2003, 20, 3–21. [Google Scholar] [CrossRef]
- Liu, F.; Zhang, Z.; Shi, L.; Zhao, X.; Xu, J.; Yi, L.; Liu, B.; Wen, Q.; Hu, S.; Wang, X.; et al. Urban expansion in China and its spatial-temporal differences over the past four decades. J. Geogr. Sci. 2016, 26, 1477–1496. [Google Scholar] [CrossRef]
- Baklanov, A.; Molina, L.T.; Gauss, M. Megacities, air quality and climate. Atmos. Environ. 2016, 126, 235–249. [Google Scholar] [CrossRef]
- Cheng, Z.; Luo, L.; Wang, S.; Wang, Y.; Sharma, S.; Shimadera, H.; Wang, X.; Bressi, M.; de Miranda, R.M.; Jiang, J.; et al. Status and characteristics of ambient PM2.5 pollution in global megacities. Environ. Int. 2016, 89–90, 212–221. [Google Scholar] [CrossRef] [PubMed]
- Chen, A.S.; Hammond, M.J.; Djordjević, S.; Butler, D.; Khan, D.M.; Veerbeek, W. From hazard to impact: Flood damage assessment tools for mega cities. Nat. Hazards 2016, 82, 857–890. [Google Scholar] [CrossRef]
- Zope, P.E.; Eldho, T.I.; Jothiprakash, V. Impacts of land use-land cover change and urbanization on flooding: A case study of Oshiwara River Basin in Mumbai, India. Catena 2016, 145, 142–154. [Google Scholar] [CrossRef]
- Liu, F.; Zhang, Z.; Zhao, X.; Wang, X.; Zuo, L.; Wen, Q.; Yi, L.; Xu, J.; Hu, S.; Liu, B. Chinese cropland losses due to urban expansion in the past four decades. Sci. Total Environ. 2019, 650, 847–857. [Google Scholar] [CrossRef] [PubMed]
- Kuang, W.; Chi, W.; Lu, D.; Dou, Y. A comparative analysis of megacity expansions in China and the U.S.: Patterns, rates and driving forces. Landsc. Urban Plan. 2014, 132, 121–135. [Google Scholar] [CrossRef]
- National Bureau of Statistics of the People’s Republic of China. The 2018 Statistical Communique on National Economic and Social Development; National Bureau of Statistics of the People’s Republic of China: Beijing, China, 2019.
- Zhao, S.; Da, L.; Tang, Z.; Fang, H.; Song, K.; Fang, J. Ecological consequences of rapid urban expansion: Shanghai, China. Front. Ecol. Environ. 2006, 4, 341–346. [Google Scholar] [CrossRef]
- Li, M.; Zang, S.; Wu, C.; Na, X. Spatial and temporal variation of the urban impervious surface and its driving forces in the central city of Harbin. J. Geogr. Sci. 2018, 28, 323–336. [Google Scholar] [CrossRef] [Green Version]
- Gong, J.; Hu, Z.; Chen, W.; Liu, Y.; Wang, J. Urban expansion dynamics and modes in metropolitan Guangzhou, China. Land Use Policy 2018, 72, 100–109. [Google Scholar] [CrossRef]
- Xu, C.; Liu, M.; Zhang, C.; An, S.; Yu, W.; Chen, J.M. The spatiotemporal dynamics of rapid urban growth in the Nanjing metropolitan region of China. Landsc. Ecol. 2007, 22, 925–937. [Google Scholar] [CrossRef]
- Sun, Y.; Zhao, S. Spatiotemporal dynamics of urban expansion in 13 cities across the Jing-Jin-Ji Urban Agglomeration from 1978 to 2015. Ecol. Indic. 2018, 87, 302–313. [Google Scholar] [CrossRef]
- Luo, J.; Xing, X.; Wu, Y.; Zhang, W.; Chen, R.S. Spatio-temporal analysis on built-up land expansion and population growth in the Yangtze River Delta Region, China: From a coordination perspective. Appl. Geogr. 2018, 96, 98–108. [Google Scholar] [CrossRef]
- Lu, H.; Zhang, M.; Sun, W.; Li, W. Expansion Analysis of Yangtze River Delta Urban Agglomeration Using DMSP/OLS Nighttime Light Imagery for 1993 to 2012. ISPRS Int. J. Geo-Inf. 2018, 7, 52. [Google Scholar] [CrossRef]
- Wilson, E.H.; Hurd, J.D.; Civco, D.L.; Prisloe, M.P.; Arnold, C. Development of a geospatial model to quantify, describe and map urban growth. Remote Sens. Environ. 2003, 86, 275–285. [Google Scholar] [CrossRef]
- Marquez, L.O.; Smith, N.C. A framework for linking urban form and air quality. Environ. Model. Softw. 1999, 14, 541–548. [Google Scholar] [CrossRef]
- Zhao, M.; Cai, H.; Qiao, Z.; Xu, X. Influence of urban expansion on the urban heat island effect in Shanghai. Int. J. Geogr. Inf. Sci. 2016, 30, 2421–2441. [Google Scholar] [CrossRef]
- Mohanta, K.; Sharma, L.K. Assessing the impacts of urbanization on the thermal environment of Ranchi City (India) using geospatial technology. Remote Sens. Appl. Soc. Environ. 2017, 8, 54–63. [Google Scholar] [CrossRef]
- Meng, H.; Jing, L.; Xin, H. The Influence of Underlying Surface on Land Surface Temperature—A Case Study of Urban Green Space in Harbin. Energy Procedia 2019, 157, 746–751. [Google Scholar] [CrossRef]
- Taubenböck, H.; Esch, T.; Felbier, A.; Wiesner, M.; Roth, A.; Dech, S. Monitoring urbanization in mega cities from space. Remote Sens. Environ. 2012, 117, 162–176. [Google Scholar] [CrossRef]
- Yu, S.; Sun, Z.; Guo, H.; Zhao, X.; Sun, L.; Wu, M. Monitoring and analyzing the spatial dynamics and patterns of megacities along the Maritime Silk Road. Yaogan Xuebao/J. Remote Sens. 2017, 21, 169–181. [Google Scholar]
- Zhang, Z.; Wang, X.; Zhao, X.; Liu, B.; Yi, L.; Zuo, L.; Wen, Q.; Liu, F.; Xu, J.; Hu, S. Remote Sensing of Environment A 2010 update of National Land Use/Cover Database of China at 1:100000 scale using medium spatial resolution satellite images. Remote Sens. Environ. 2014, 149, 142–154. [Google Scholar] [CrossRef]
- Shi, L.; Liu, F.; Zhang, Z.; Zhao, X.; Liu, B.; Xu, J.; Wen, Q.; Yi, L.; Hu, S.; Yi, L. Spatial differences of coastal urban expansion in China from 1970s to 2013. Chin. Geogr. Sci. 2015, 25, 389–403. [Google Scholar] [CrossRef]
- Ministry of Housing and Urban-Rural Development of the People’s Republic of China. City Planning Basic Terminology Standards; China Building Industry Press: Beijing, China, 1999.
- Zhang, Z.; Zhao, X.; Liu, F.; Xu, J.; Wen, Q.; Hu, S. Atlas of Urban Expansion by Remote Sensing in China, 1st ed.; Star Map Press: Beijing, China, 2014. [Google Scholar]
- Shi, L.; Taubenböck, H.; Zhang, Z.; Liu, F.; Wurm, M. Urbanization in China from the end of 1980s until 2010—Spatial dynamics and patterns of growth using EO-data. Int. J. Digit. Earth 2017, 8947, 78–94. [Google Scholar] [CrossRef]
- He, C.; Gao, B.; Huang, Q.; Ma, Q.; Dou, Y. Environmental degradation in the urban areas of China: Evidence from multi-source remote sensing data. Remote Sens. Environ. 2017, 193, 65–75. [Google Scholar] [CrossRef]
- Mathew, A.; Khandelwal, S.; Kaul, N. Investigating spatial and seasonal variations of urban heat island effect over Jaipur city and its relationship with vegetation, urbanization and elevation parameters. Sustain. Cities Soc. 2017, 35, 157–177. [Google Scholar] [CrossRef]
- Su, Z.; He, B.; Ding, C.; Liu, F.; Kou, J. Analysis on the effect of land use changes on urban heat island in Wuhan based on remote sensing. J. Cent. China Norm. Univ. 2015, 49, 139–146. [Google Scholar]
- Melchiorri, M.; Pesaresi, M.; Florczyk, A.J.; Corbane, C.; Kemper, T. Principles and Applications of the Global Human Settlement Layer as Baseline for the Land Use Efficiency Indicator—SDG 11.3.1. Int. J. Geo-Inf. 2019, 8, 96. [Google Scholar] [CrossRef]
- Wang, P.; Deng, X.; Zhou, H.; Qi, W. Responses of urban ecosystem health to precipitation extreme: A case study in Beijing and Tianjin. J. Clean. Prod. 2018, 177, 124–133. [Google Scholar] [CrossRef]
- Xiao, Q.; Jiang, Y.; Shen, L.; Yuan, D. Origin of calcium sulfate-type water in the Triassic carbonate thermal water system in Chongqing, China: A chemical and isotopic reconnaissance. Appl. Geochem. 2018, 89, 49–58. [Google Scholar] [CrossRef]
- Qiu, G.Y.; Zou, Z.; Li, X.; Li, H.; Guo, Q.; Yan, C.; Tan, S. Experimental studies on the effects of green space and evapotranspiration on urban heat island in a subtropical megacity in China. Habitat Int. 2017, 68, 30–42. [Google Scholar] [CrossRef]
- Yu, S.; Zhang, Z.; Liu, F.; Wang, X.; Hu, S. Urban expansion in the megacity since 1970s: A case study in Mumbai. Geocarto Int. 2019, 1–19. [Google Scholar] [CrossRef]
- Qian, Y.; Zhou, W.; Li, W.; Han, L. Urban Forestry & Urban Greening Understanding the dynamic of greenspace in the urbanized area of Beijing based on high resolution satellite images. Urban For. Urban Green. 2015, 14, 39–47. [Google Scholar]
- Wu, J. Urban sustainability: An inevitable goal of landscape research. Landsc. Ecol. 2010, 25, 1–4. [Google Scholar] [CrossRef]
- Li, D.; Ma, J.; Cheng, T.; van Genderen, J.L.; Shao, Z. Challenges and opportunities for the development of megacities. Int. J. Digit. Earth 2018, 1–14. [Google Scholar] [CrossRef]
- Wang, M.; He, G.; Zhang, Z.; Wang, G.; Zhang, Z.; Cao, X.; Wu, Z.; Liu, X. Comparison of spatial interpolation and regression analysis models for an estimation of monthly near surface air temperature in China. Remote Sens. 2017, 9, 1278. [Google Scholar] [CrossRef]
- He, G.; Zhao, Y.; Wang, L.; Jiang, S.; Zhu, Y. China ’ s food security challenge: Effects of food habit changes on requirements for arable land and water. J. Clean. Prod. 2019, 229, 739–750. [Google Scholar] [CrossRef]
Figure 1.
Locations of China’s six megacities and their urban lands during 2000–2018: (a) Beijing, (b) Tianjin, (c) Chongqing, (d) Shanghai, (e) Guangzhou, and (f) Shenzhen.
Figure 1.
Locations of China’s six megacities and their urban lands during 2000–2018: (a) Beijing, (b) Tianjin, (c) Chongqing, (d) Shanghai, (e) Guangzhou, and (f) Shenzhen.

Figure 2.
Flowchart for extracting urban lands during 2000–2018. The definition of urban lands was based on Shi et al. and MOUHURD [32,33].

Figure 3.
Measurement for characterizing urban expansion types; crossed out numbers do not exist among China’s six megacities in this study.
Figure 3.
Measurement for characterizing urban expansion types; crossed out numbers do not exist among China’s six megacities in this study.

Figure 4.
Urban land expansion of China’s megacities during 2000–2018: (a) Areas and (b) contribution rates to total expanded areas.
Figure 4.
Urban land expansion of China’s megacities during 2000–2018: (a) Areas and (b) contribution rates to total expanded areas.

Figure 5.
The expansion processes of urban lands in China’s megacities.

Figure 6.
Urban land expansion types of China’s megacities: (a) Distributions and (b) proportions.

Figure 7.
Relationships between urban land expansion and population and GDP growth.

Figure 8.
Relationships (a) between growth rate of urban land area and population, and (b) between growth rate of urban land area and GDP.
Figure 8.
Relationships (a) between growth rate of urban land area and population, and (b) between growth rate of urban land area and GDP.

Figure 9.
The dynamics of vegetation coverage and land surface temperature in China’s megacities during 2000–2018.
Figure 9.
The dynamics of vegetation coverage and land surface temperature in China’s megacities during 2000–2018.

Table 1.
Basic information of China’s six megacities.
| Megacity | Location | Population (1000 Persons) | Area Proportion (%) |
|---|---|---|---|
| Beijing | 39.40°–41.60°N, 115.70°–117.40°E, Northern China Plain | 16,912 | 0.34% |
| Tianjin | 38°34′–40°15′N, 116°43′–118°04′E, Northern China Plain | 12,938 | 0.25% |
| Shanghai | 30°40′–31°53′N, 120°51′–122°12′E, Yangtze River Delta | 23,019 | 0.13% |
| Chongqing | 28°10′–32°13′N, 105°17′–110°11′E, transitional area between the Qinghai–Tibet Plateau and the lower-middle Yangtze Plain | 28,846 | 1.72% |
| Guangzhou | 22°26′–23°56′N, 112°57′–114°03′E, Pearl River Delta | 12,701 | 0.16% |
| Shenzhen | 22°27′–22°52′N, 113°46′–114°37′E, Pearl River Delta | 10,358 | 0.04% |
Note: “Population” materials are from China’s sixth census executed in 2010. Area proportion indicates the ratio of administrative area of the megacity to China’s total area. The relative data are from China City Statistical Yearbook, while those in Hong Kong, Macau, and Taiwan are absent.
Table 2.
Information of the datasets.
| Dataset | Source | |
|---|---|---|
| Urban land | Landsat TM/ETM+/OLI | https://glovis.usgs.gov/ |
| China-Brazil Earth resource satellite | http://www.cresda.com/ | |
| Environmental satellite (HJ-1) CCD | http://www.cresda.com/CN/ | |
| Urban population | China City Statistical Yearbook | http://www.stats.gov.cn/ |
| Urban GDP | China City Statistical Yearbook | http://www.stats.gov.cn/ |
| Environment indicator | MOD13A3, MOD11A2 | https://modis.gsfc.nasa.gov/ |
Table 3.
Basic information of China’s six megacities.
| Megacity | Terrain | Reference |
|---|---|---|
| Beijing | Covers a wide topographic gradient from 83 the mountainous areas in the north and west to the plain areas in the central, south, and east | [5] |
| Tianjin | Relatively flat | [40] |
| Shanghai | Relatively flat | [26] |
| Chongqing | The famous “mountainous city”, with many SN-trending mountains and a complex elevation ranging from 75 m to 2800 m | [41] |
| Guangzhou | Higher in the northeast and lower in the southwest | [19] |
| Shenzhen | Higher in the southeast and lower in the northwest | [42] |
© 2019 by the authors. Licensee MDPI, Basel, Switzerland. This article is an open access article distributed under the terms and conditions of the Creative Commons Attribution (CC BY) license (http://creativecommons.org/licenses/by/4.0/).
Share and Cite
MDPI and ACS Style
Yu, S.; Zhang, Z.; Liu, F.; Wang, X.; Hu, S. Assessing Interannual Urbanization of China’s Six Megacities Since 2000. Remote Sens. 2019, 11, 2138. https://0-doi-org.brum.beds.ac.uk/10.3390/rs11182138
AMA Style
Yu S, Zhang Z, Liu F, Wang X, Hu S. Assessing Interannual Urbanization of China’s Six Megacities Since 2000. Remote Sensing. 2019; 11(18):2138. https://0-doi-org.brum.beds.ac.uk/10.3390/rs11182138
Chicago/Turabian StyleYu, Sisi, Zengxiang Zhang, Fang Liu, Xiao Wang, and Shunguang Hu. 2019. "Assessing Interannual Urbanization of China’s Six Megacities Since 2000" Remote Sensing 11, no. 18: 2138. https://0-doi-org.brum.beds.ac.uk/10.3390/rs11182138
Note that from the first issue of 2016, this journal uses article numbers instead of page numbers. See further details here.