Hybrid Urban Canyon Pedestrian Navigation Scheme Combined PDR, GNSS and Beacon Based on Smartphone


1
College of Geology Engineering and Geomatics, Chang’an University, Xi’an 710054, Shanxi, China
2
Department of Land Surveying and Geo-Informatics, Hong Kong Polytechnic University, Hong Kong, China
*
Author to whom correspondence should be addressed.
Remote Sens. 2019, 11(18), 2174; https://0-doi-org.brum.beds.ac.uk/10.3390/rs11182174
Submission received: 6 August 2019
/
Revised: 12 September 2019
/
Accepted: 13 September 2019
/
Published: 18 September 2019
Abstract
:This study presents a comprehensive urban canyon pedestrian navigation scheme. This scheme combines smart phone internal MEMS sensors, GNSS and beacon observations together. Heading estimation is generally a key issue of the PDR algorithm. We design an orientation fusion algorithm to improve smart phone heading using MEMS measurements. Static and kinematic tests are performed, superiority of the improved heading algorithm is verified. We also present different heading processing solutions for comparison and analysis. Heading bias increases with time due to error accumulation and model inaccuracy. Thus, we develop a related heading calibration method based on beacons. This method can help correct smart phone headings continuously to decrease cumulative error. In addition to PDR, we also use GNSS and beacon measurements to integrate a fusion location. In the fusion procedure, we design related algorithms to adjust or limit the use of these different type observations to constrain large jumps in our Kalman filter model, thereby making the solution stable. Navigation experiments are performed in the streets of Mong Kok and Wanchai, which are typically the most crowded areas of Hong Kong, with narrow streets and many pedestrians, vehicles and tall buildings. The first experiment uses the strategy PDR + GNSS + beacon, in east–west orientation street, in which 10 m positioning error is improved from (smart phone internal GNSS) to and in south–north orientation street, in which 15 m positioning error is improved from (smart phone internal GNSS) to . The second experiment performs two long-distance tests without any beacons, in which the fusion scheme also has significant improvement, that is, 10 m positioning error is improved from to .

1. Introduction
At present, smart phones are widely used, some products of LOT have been developed and many mobile phone applications have been provided in Google Play or Apple Store. Navigation applications and location-based services are now becoming standard features in smart phones [1]. Positioning is a key issue to resolve the business requirements of these products. Generally, most time GNSS can obtain good positioning results in open-sky environment using professional devices; however, GNSS receiver positioning capability degrades in harsh environment due to signal blockage and multipath. As a consumption-level positioning device, smart phones, their sensors, chips and antenna have low quality; thus, their positioning capability worsens, especially in urban canyon areas.
In recent years, some researchers have proposed combining other positioning methods, such as inertial navigation, visual localisation and external signal-aided positioning techniques, with GNSS to improve pedestrian navigation capability and stability. In inertial navigation, INS mechanisation and PDR are the most used inertial positioning algorithms; however, previous studies show that mechanisation is easily affected by accumulative errors compared with the PDR algorithm. Thus, in our study, we use the PDR algorithm and then fuse multiple data sources together. The four key problems that need to be resolved in the procedure of PDR positioning are pedestrian heading, initial location, step detection and step length.
Heading estimation is the most important issue of inertial navigation, especially in pedestrian navigation areas. In the study in Reference [2], Afzal et al. used a relatively stable data-aided inertial navigation device for the gravity and geomagnetic fields to consider the heading error as the estimated quantity and they used EKF to achieve data fusion, thereby gaining reliable heading data. Sabatini presented an orientation determination strategy using inertial and magnetic sensors based on Kalman filer [3]. External interference sometimes degrades heading estimation precision; thus, researchers have used algorithms to improve stability. In the study in Reference [4], Zhang et al. designed a dual-linear Kalman filter for real-time orientation determination system using low-cost MEMS sensors, magnetometer, gyro and accelerometer. The RMSE of the estimated attitude angles are reduced by 30.6% under magnetic disturbances. Accelerometer and magnetic-aiding sensors are used to limit the drift errors resulting from the gyroscope data integration. Two sensor fusion methods, namely, representative of the stochastic (EKF) and complementary (nonlinear observer) filtering have been used and their precision is significantly more accurate than gyroscope data integration [5]. Some algorithms have been used to improve the stability and accuracy of the heading; however, without external correction, accumulation error can still occur due to hardware instability, external environment variability and inaccurate algorithms. Meanwhile, the positioning of PDR is relative and its initial location in absolute positioning systems, such as WGS84, is not given; the precision of the initial location depends on positioning methods. GNSS measurement and signal-based control point are the most used initial positioning methods. In our study, we obtain the initial location using GNSS, ’weak’ beacon and ’strong’ beacon methods. Step counter and step length estimation are also two key elements. Many related studies exist in the literature. Li et al. proposed an effective multi-threshold step detection algorithm to improve position accuracy [2]. Kang used the periodicity of walking motion and sensitivity of gyroscope and proposed an algorithm that extracts the frequency domain features from 3D angular velocities through FFT to identify whether the holder is walking irrespective of the placement [6]. In the current work, we combine three-axis accelerometer signals to one to detect the peak and valley and count step change. From our test, the algorithm can detect pedestrian step movement accurately. The step length varies during the movement and it also depends on the field situation, such as stairs, obstacles, doors and floor surface. The value of the step length is related to a pedestrian profile (such as weight, height, age, sex and style of walking) [7]. Zhao proposed an improved method of step length estimation based on an inverted pendulum model [8]. Ilkovičová et al. proposed an approach that uses map matching to adjust the step length with different types of movement [7]. Chen used an electromyography sensor for step detection and step length estimation and performed several tests [1].
Signal-aided positioning technologies, like beacon, WIFI, UWB, these are extensively used; in this study, we employ beacon. Beacon positioning uses a low-power Bluetooth technique, its RSSI is a key parameter for wireless positioning. Several mathematical models have been established to analyse the relation of RSSI and distance [9,10]. Wang compared three distance-based Bluetooth positioning algorithms based on least square estimation, three-border and centroid methods for wireless positioning [11]. Kleeman presented a scheme that logs the arrival times and amplitudes of beacon pulses for position and orientation estimation using Kalman filtering [5,12]. Beacon RSSI is mostly used to compute the distance between the receiver and beacon; although several models have been proposed, there is still large error produced due to the effect of multipath and environment interference. In sum, the well-known models used in previous studies are the free space propagation model, log distance path loss model, Rappaport’s path loss model and Friis’ transmission model [13]. According to our tests, these models depend on devices and environments. Thus, we simulate a loss function model to compute the broadcasting distance using RSSI for our beacon.
Smart phone internal GNSS has high sensitivity for signal acquisition. Thus, its positioning capability will be seriously degraded in harsh environments. Although sufficient navigation satellites are available, the problem of multipath remains serious. Some multipath elimination algorithms, such as shadow matching and ray-tracking methods, have been proposed. Wang used a 3D city model to reduce the problem of multipath and improve the cross-street positioning error of an Android smart phone [14]. The ray-tracking method, which is based on frequency-domain characteristics, is a multipath propagation algorithm that has been proposed to distinguish LOS and NLOS signals and reduce GNSS errors [15]. Although some multipath elimination algorithms can be used in smartphone applications, high-accuracy positioning results remain difficult to obtain due to low-quality positioning chip, a lack of professional antenna and memory limitation of smart phones. Thus, GNSS positioning locations will still experience dragging and disturbance. In this study, we develop a related adjustment algorithm and evaluate GNSS observation noise to adjust GNSS measurement weight. Then, we utilise the advantages of different types of measurement and fuse them together. Previous studies have presented several integration or fusion solutions, such as EKF, UKF and PF, in combining different positioning techniques and use them together to improve smart phone navigation capability [16,17,18,19,20]. These algorithms use a loose or tight combination of measurements or positions to improve positioning precision [14,21,22,23]. In this study we integrate PDR, beacon, GNSS observations to obtain a comprehensive navigation strategy using a designed EKF model.
Although previous studies have presented several pedestrian navigation strategies, most are experimental and immature, especially in a harsh street environment. Thus, this study presents a comprehensive strategy for fusing smart phone internal GNSS, MEMS sensors and beacon observations so to improve pedestrian positioning capability and stability in an urban canyon area. The contributions of this study are as follows.
- (1)
- Smart phone heading is vital to pedestrian navigation. In this study, we process and compare multiple heading methods and utilise their advantages to construct a comprehensive heading fusion strategy that combines the measurements of smart phone internal sensors’ and external beacon.
- (2)
- Most researchers have used beacon for positioning due to its high precision and easy installation characteristics. In this study, we develop related algorithms and workflow in using beacon RSSI to construct ground truth and calibrate smart phone heading continuously, in this manner, IMU cumulative error and impact of environment disturbance can be reduced, which improves positioning accuracy.
- (3)
- We research multiple fusion positioning algorithms, such as UKF, EKF and PF, to integrate GNSS, inertial navigation and beacon positioning results. Then, we design a noise evaluation algorithm and fusion strategy to construct a comprehensive solution. Tests verify that the algorithm works well in a consumption-level positioning device, such as a smart phone.
- (4)
- In this study, we perform tests in Hong Kong’s streets, which are a typical urban canyon. Hong Kong is a crowded city with many pedestrians and vehicles, high-density tall buildings and narrow streets. At present, the positioning capability of most consumption-level navigation devices in Hong Kong is poor, often producing large errors. Thus, tests and research to improve positioning capability in such a harsh environment is important.
This paper is organized as follows: Section 1 describes smart phone heading, step counter, step length, beacon and GNSS navigation-related information; Section 2 presents the methodology, containing PDR theory, heading computation and fusion from MEMS sensors and beacon RSSI and positioning results from the fusion of PDR, GNSS and beacon; heading tests and navigation tests are performed in Section 3; discussion is presented in the Section 4; and finally, Section 5 concludes the paper.
2. Methodology
2.1. PDR Algorithm
In the PDR algorithm, pedestrian plane location can be computed by previous location combined with moved distance and pedestrian heading.
where is the north coordinate of the current location, is the east coordinate of the current location, is the north coordinate of the previous location, is the east coordinate of the previous location, is the pedestrian walking orientation of the procedure and is the moved distance from the previous epoch to the current location.
2.2. Coordinate System and Initial Position for Localization
In our scheme, we use WGS84 and HK1980 as the coordinate systems. WGS84 is a global geodetic coordinate system that can provide absolute positioning coordinates in global area. Google Maps also uses the WGS84 coordinate system. Given the algorithm requirements, we also use HK1980, which is a local plane grid coordinate system. In our strategy, the initial position can be obtained using three methods. Once a pedestrian is near the weak beacon, the observations for this beacon is used to decide the initial position. However, without a weak beacon, GNSS observation and middle and strong beacon positioning results are used to decide the initial location. In view of the strong and middle beacon positioning, we design a comprehensive intersection algorithm using the received RSSI.
2.3. Step Detection
Step detection is vital in pedestrian navigation. It affects the moved distance directly and ultimately decides the PDR positioning accuracy. Thus, far, many step detection algorithms have been proposed. In our strategy, we attempt to detect the signal peak and valley using the summarised three-axis accelerometer measurements to count the step number. Figure 1 shows the statistical information of the three-axis accelerometer measurements for step detection.
Formula (2) presents how we use the three-axis accelerometer measurements in detecting the moved step. Previous studies have used single-axis measurements to count the steps and assumed that pedestrians always keep their smart phones horizontally. However, when pedestrians moving, they need to avoid other pedestrians and obstacles; thus, keeping their smart phones horizontally are difficult. On this basis, we use three-axis measurements to detect the signal peak and valley and then decide a step.
2.4. Step Length
Step length is an important element in PDR positioning. It depends on the pedestrians and some external factors, such as pedestrian height, step frequency, walking posture and ground slope. Previous studies have proposed several step length estimation methods [24,25]. Table 1 lists some main step length estimation methods:
Most models use pedestrian height, step frequency and accelerometer measurements in constructing an algorithm. On the basis of our comparison and combinations of known algorithms, we use two strategies to adjust the step length. In the first step, we use the traditional model in adjusting the step length [26].
where is the step length; is the step frequency; H is the height of the pedestrian; and a, b and c are the model coefficients, with values of , and 1, respectively. In the first step, once a weak beacon signal is received and the pedestrian walks in a straight line without a large turn, we use the beacon distance and change the step numbers to adjust the step length, as shown as follows:
Figure 2 presents the manner in which the weak beacon is used to adjust the step length. In this process, the key point is to assess whether the pedestrian walks in a straight line; if a large turn exists, then the actual walking route is not a straight line. The number of steps is smaller when walking in a straight line in comparison with a path with turns; hence, the step length in a straight line is also shorter. In the procedure, the main work is to design an algorithm for assessing the presence of a large turn. We use moving window to record a series of gyroscope integration headings to analyze the turning angle of the procedure. On the basis of the example in Figure 2, we adjust the step length in B–C and ignore A–B.
2.5. Heading Computation Using MEMS Sensors’ Measurements
Most smart phones integrate MEMS sensors. Thus, traditionally, we can use the following equations to calculate smart phone heading via accelorometer and magnetometer measurements. Roll can be obtained by X- and Z-axis accelerometer measurements ( and ):
Pitch can be computed using X-, Y- and Z-axis accelerometer measurements:
Magnetic north and true north can be obtained by combining , and magnetometer measurements:
where , and denote the X-, Y- and Z-axis values in the body coordinate system of the magnetometer; represents ‘magnetic declination’, which can be obtained from the IGRF model. Formulas (1)–(4) describe the manner in which the internal MEMS sensor measurements of a smart phone can be processed to obtain the heading. The heading has big bias compare with the true pedestrian direction due to sensor error, environment interference and orientation bias of pedestrians and smart phones [27,28]. Thus, we use gyroscope, accelerometer and magnetometer measurements to obtain a fusion solution via Kalman filter to improve the heading precision in our strategy. In addition to the Kalman filter, we also use other algorithms, such as complementary filter and gyroscope integration heading. Comparison and analysis results of the different heading solutions are presented in next section.
2.6. Improved Heading Algorithm Combining Accelerometer, Gyroscope, Magnetometer Measurements
In the previous section, we have introduced how to calculate smart phone heading using accelerometer and magnetometer measurements. In Android smart phones, the heading can be obtained in real time from APIs. However, consumption-level sensors have low stability and precision, the heading always has a larger error compared to its actual direction. In this part, we present a fusion algorithm, which integrates accelerometer, gyroscope, magnetometer measurements by Kalman filter and complementary filter to improve pedestrian heading precision. The Formulas (5)–(8) show the heading computation method by accelerometer and magnetometer measurements, in this part, we design a Kalman filter model to estimate smart phone heading and gyroscope bias on the bias of gyroscope measurement and the heading (processed by Formulas (5)–(8)) [29]. Following presents the detail information of Kalman filter model:
Measurement equation:
State equation:
is the estimation state vector, it contains two state parameters and ; is the real-time heading of smart phone, is gyroscope integration bias. is the heading computed by the Formulas (5)–(8) using accelerometer and magnetometer measurements, is gyroscope angle update rate. is measurement noise, , are state noises, which are got from our previous statistic based on sensors’ characteristics and Allan variance analysis of our test smart phone. where is the heading computed by using accelerometer and magnetometer measurements; and are the estimated state parameters, in which the former is the real-time heading of the smart phone and the latter is the gyroscope integration bias; is the measurement noise; is the gyroscope angle update rate; and and are state noises obtained from our previous statistics based on the sensor characteristics and Allan variance analysis of our test smart phone [30,31].
We know gyroscope measures angle update rate, in this study, we compute smart phone heading combining gyroscope integration angle and initial orientation, we named it , the initial angle used the filtered heading () got from a previous Kalman filter estimation.
is gyroscope outputted angle change rate, and are start epoch and end epoch separately. Once we had the two smart phone heading estimations and , we used following algorithm to fuse them [5,32]:
is the fusion coefficient, we set it to in our solution.
2.7. Beacon Positioning and Heading Computation
We classify the beacon signals as ‘weak’, ‘middle’ and ‘strong’ on the basis of the signal transmitting power, which is not a fixed value and depends on the brand of beacon. In our solution, each group contains the three types of beacon. Figure 3 shows the beacon positioning and the heading computation method used in this study. The broadcasting distance of the weak beacon is no more than 5 m; thus, most of the time, pedestrians should be close to receive a weak beacon signal. Meanwhile, the broadcasting ranges of the middle and strong beacons are far more than that of the weak beacon. Moreover, overlapping areas exist; a smart phone can receive nearly all the surrounding signals of strong and middle beacons. On the basis of these beacon characteristics, we design related algorithms to compensate position and heading biases.
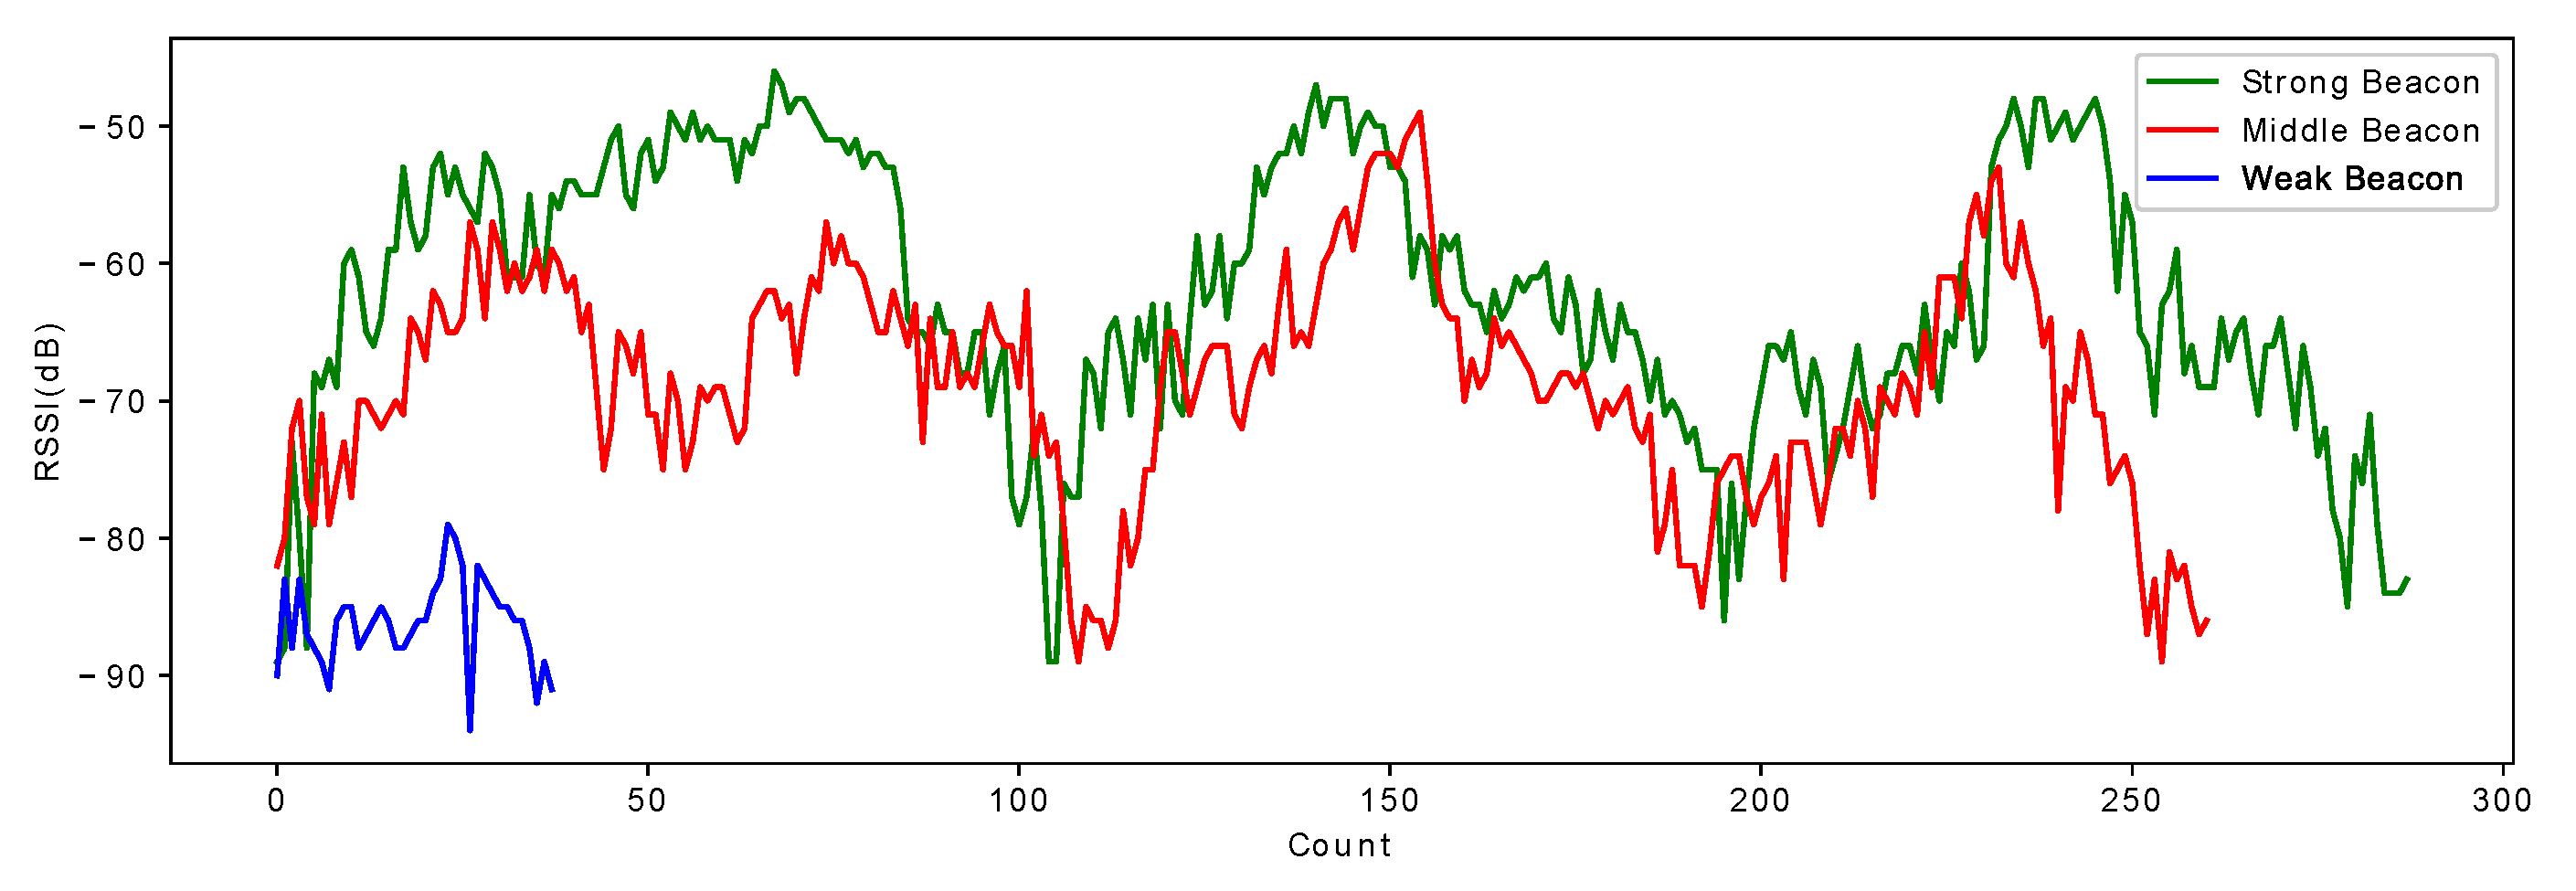
Generally, RSSI is widely used for computing the transmitting distance between pedestrians and base station. Many researchers have used RSSI in studying Bluetooth, WiFi and UWB positioning. In this study, we receive beacon RSSI and use the loss function to compute the transmitting distance, which is used for the positioning of the weak beacon. Signal strength is easily influenced by multipath and environment interferences. Thus, the transmitting distances of the middle and strong beacons are difficult to evaluate using the RSSI–distance model. Figure 4 presents the received RSSI situation of our test results. We installed three types of beacon in our test field (that is, each site contains one weak, one middle and one strong beacon) and the pedestrian went across them. From the figure, the blue line (weak beacon) is evidently short. Thus, a smart phone can only receive a weak beacon signal in a nearby location; once the pedestrian leaves, the smart phone will lose track of the signal. Most RSSI is in the range of (−90 dBHZ, −80 dBHZ). The signal from the weak beacon is obviously weak and has smaller fluctuations compared with the middle and strong beacons. The green line (strong beacon) and the red line (middle beacon) nearly have the same change situations, in which the maximum signal strength exceeds −50 dBHZ. Three signal peaks and three signal valleys of the strong and middle beacons are evident in the graph. The RSSI increases as the pedestrian comes close to the strong or middle beacon. Upon leaving, the RSSI begins to decrease. Thus, on the basis of the increase and decrease of the RSSI, the program can know when pedestrians are leaving from one beacon to another. The beacons in this study were installed in known locations; thus, the true walking direction can be computed.
2.8. Heading Fusion Combining Improved MEMS Heading and Beacon Heading
In the previous sections, we have compared and analysed different heading processing results, described how the heading precision can be improved using MEMS sensor observations via the designed algorithm and constructed beacon heading using its RSSI. In this section, we present our heading calibration strategy, Algorithm 1 is the pseudocode that introduces the basic workflow. A key point in the procedure is to determine if it is the actual heading error or the true orientation bias between smart phone and pedestrian. Then, the program decides whether to calibrate the heading error. Once a large bias between the smart phone heading and the pedestrian’s actual walking direction is produced, program cannot calibrate the smart phone orientation with beacon heading at that time. In our strategy, we set thresholds and use a filtered MEMS sensor heading to limit the use of beacon heading in correcting the smart phone heading. Although the accuracy of the calibration cannot be always guaranteed, the continuous correction decreases the cumulative error and the influence of external disturbances.
| Algorithm 1: Heading fusion algorithm |
 |
2.9. GNSS/DGNSS Positioning and Noise Evaluation
In urban canyon environment, GNSS observations can also be obtained via smart phone. However, the positioning result can be easily disturbed by the surrounding environment, such as multipath, pedestrian interference and moving vehicles. Thus, a large jump is often produced, from the statistics of previous tests, we find the jump in the harsh environment, like Hong Kong streets, it often exceeds several meters, even more than 100 m. So it leads evaluating absolute GNSS positioning accuracy of smart phones is difficult and the positioning results cannot be used directly due to the degraded accuracy. Fusing GNSS, PDR and beacon observations for improved positioning results is also challenging. On the basis of these problems, we send the raw smart phone measurements (that is, pseudorange, carrier phase and NMEA) to the server and develop related server-side algorithms to improve GNSS positioning accuracy [33,34]. DGNSS position refers to the corrected position results. In this study, we do not elaborate how GNSS precision can be improved in the server side. We use DOPs, Android-reported GNSS precision and PDR observations to design related algorithms for excluding large-jump observations and evaluating GNSS observation noise variance in handheld side. Algorithm 2 gives the details of the algorithm.
| Algorithm 2: GNSS measurement noise evaluation algorithm |
 |
2.10. Integration of PDR, Beacon and GNSS
In this section we integrate the PDR position with the beacon and GNSS/DGNSS observations to obtain a fusion position using EKF [35,36,37]. PDR theory indicates that the current location of a smart phone can be calculated by its previous location combined with moved distance and heading, which depend on the detected number of steps and estimated step length. However, estimation error and bias with pedestrian’s true walking direction exist in smart phone heading. Thus, we calculate the current pedestrian location as follows:
where and are the current north and east coordinates, respectively; and are the previous north and east coordinates, respectively; is the distance scale factor; D is the pedestrian’s moved distance; is the smart phone heading; and , , and are the north coordinate error, the east coordinate error, the scale factor error and the heading error, respectively. We set the state vector as
where is the north error, is the east error, is the scale factor error of the moved distance and is the heading error. The state equation is:
Measurement vector:
and denote coordinate bias in north and east direction respectively.
If only the GNSS position is updated, then we set the observation as
If the DGNSS updated, then the observation is switched to:
If the weak beacon detected, then the measurement vector switches to
Otherwise, if the weak beacon, GNSS and DGNSS are not updated, then the measurement vector switches to
The measurement equation coefficient matrix C is
Measurement equation:
and denote measurement and state estimation value in epoch k respectively, is the related measurement noise vector.The preceding filtering model is updated by a time interval of 1000 ms, regardless whether the pedestrian is static. The pedestrian position should be updated. The position is calculated as follows:
3. Evaluation and Experiment
In the previous section, we have introduced the algorithms we developed and used in this study. Although we aim to use these algorithms in real environment and hope to improve pedestrian navigation capability and stability, most smart phones currently integrate MEMS sensors; particularly, Google provides APIs for developers to obtain multiple sensor measurements in real-time. On the basis of our requirements and real conditions, we develop a related real-time navigation application that can run in most mainstream Android smart phones. We also develop a server-side application to improve GNSS positioning precision and support smart phone navigation. In this study, we focus on smart phone side algorithms.
In this part, we design field experiments to verify our application and evaluate the proposed algorithms. We present three experiments; the first one, we perform smart phone heading test in static and kinematic the two modes. The second experiment, we install several beacons in the test field and use the GNSS/DGNSS + PDR + beacon fusion scheme to verify its navigation capability. Whereas in the third experiment, we use the GNSS/DGNSS + PDR fusion strategy without any beacons. The following subsections will describe and discuss these tests in detail.
3.1. Navigation Application Development
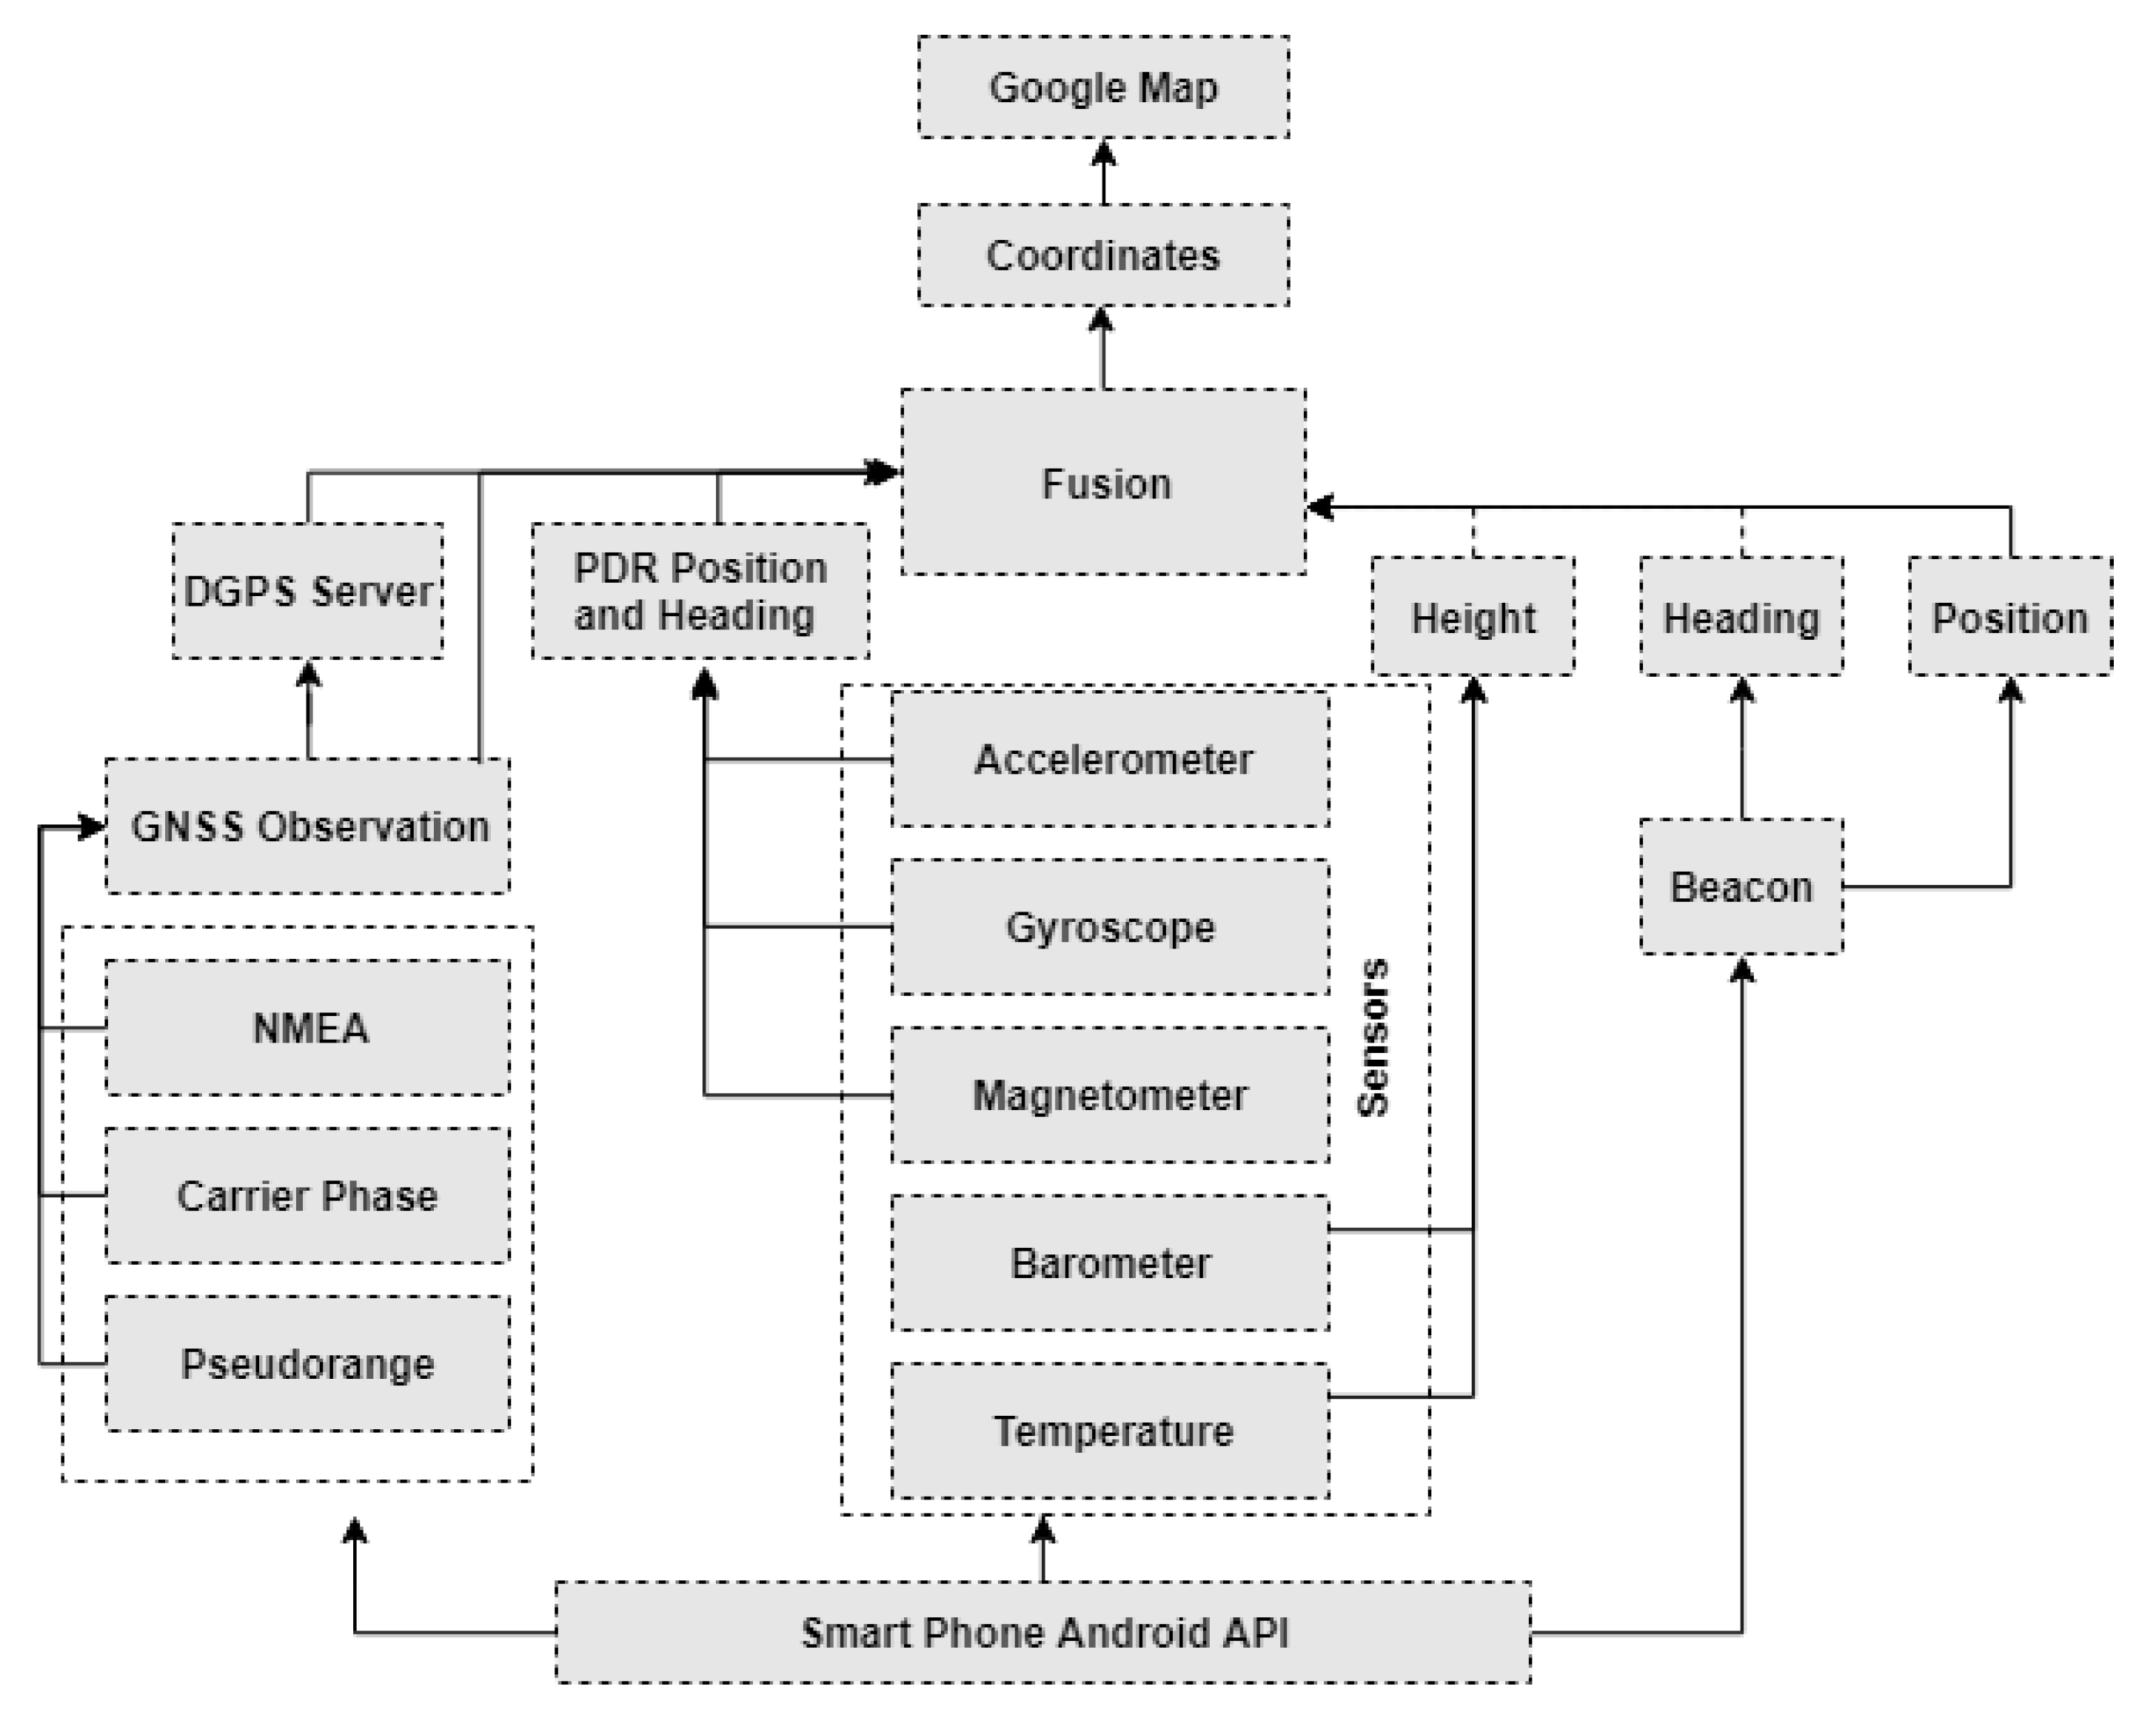
The main workflow of smart phone application is shown in Figure 5.
Figure 5 presents the basic architecture of the proposed multisensor fusion strategy, which mainly contains the following parts:
- (1)
- MEMS sensor measurement processing. In this part, the program reads measurements from smart phone internal sensors (particularly, accelerometer, gyroscope, magnetometer, barometer and thermometer) using Android APIs. Low-pass filtering algorithm is used to process raw data. These data are used to detect step movement, estimate step length and calculate smart phone attitude.
- (2)
- GNSS observation synchronization and processing. Smart phone internal location can be obtained Android APIs, calculated by GNSS and surround telecommunication base stations. However, smart phones are not a professional geodetic GNSS receiver. Smart phones can track low SNR and has high sensitivity; moreover, in a harsh environment, NLOS and multipath degrade smart phones’ positioning capability and stability severely. PDR can only compute the relative position, whereas GNSS can provide global WGS84 coordinates, that is, the absolute positioning. In our solution, we want to combine PDR andGNSS; thus, improving GNSS position accuracy is vital. On the basis of the requirements, a smart phone application sends a pseudorange, a carrier phase and NMEA to our DGPS server to develop a related algorithm for improving GNSS positioning accuracy and then send it back to the smart phone. Many smart phones do not output GNSS raw measurements, except for Huawei P20 and Mate20.
- (3)
- Beacon scanning and processing algorithms. In this part, we focus on beacon scanning, construction of beacon heading, step length calibration and beacon positioning. Beacon scanning is always running in the background of smart phones; thus, it can scan surrounding beacons continuously nearly in real-time. Once a new signal is tracked, the RSSI series is used to construct heading. Different heading construction algorithms are designed for the weak, middle and strong beacons. In addition to the heading, the weak beacon is used to calibrate the step length and PDR position.
- (4)
- Positioning fusion algorithm and mapping. Positioning fusion is the key issue of our solution. Here, we design an EKF model to integrate GNSS/DGNSS results, beacon location and PDR. Once the filtered position is obtained, the location and walking trajectory can be updated and displayed in Google Maps in real time.
3.2. Smart Phone Heading Test
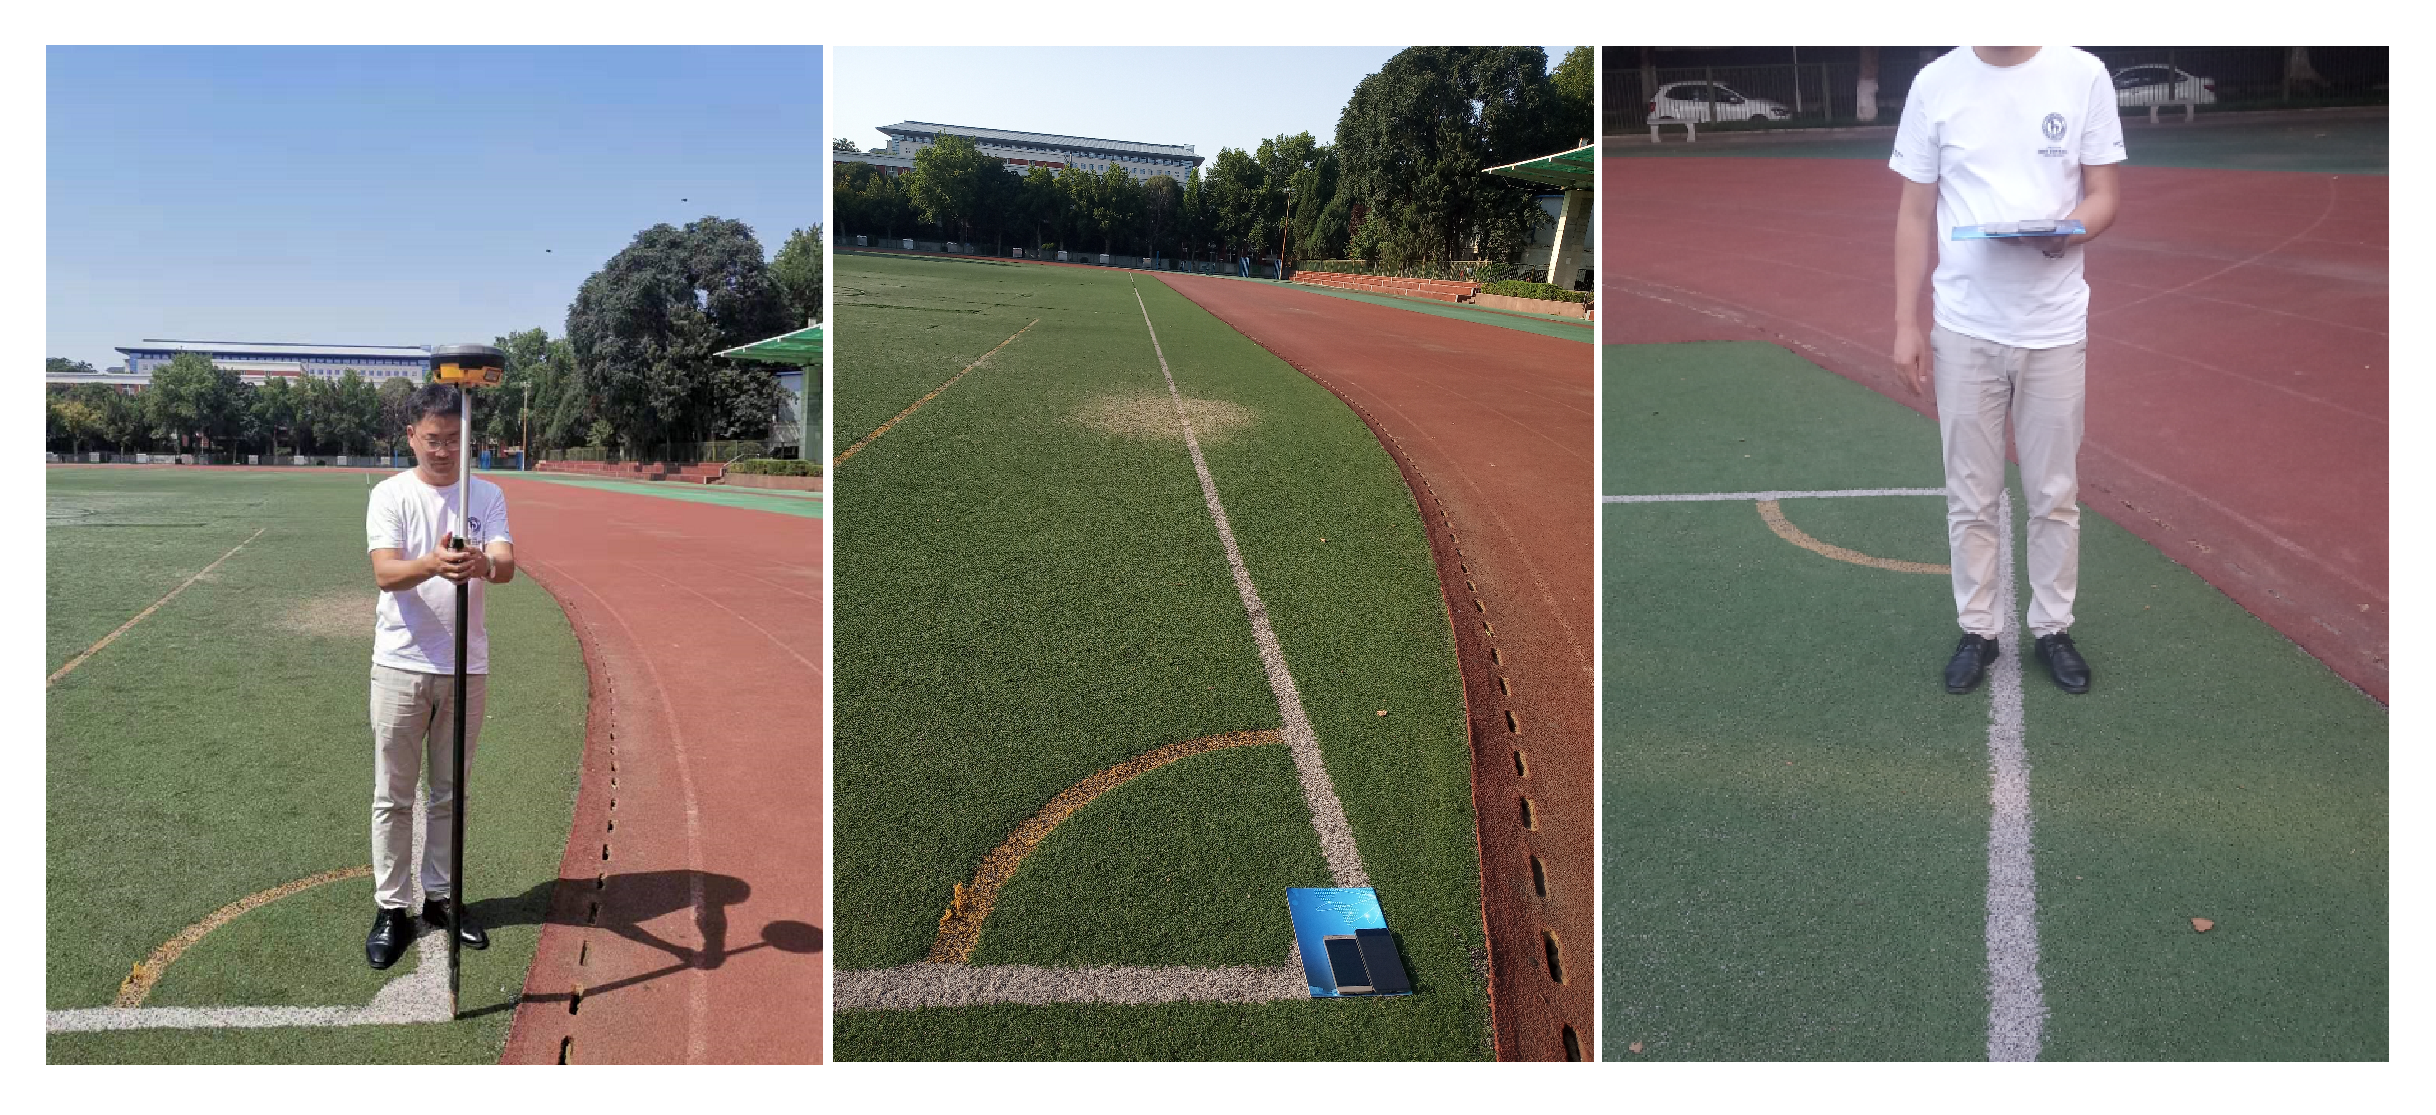
We designed the heading test field in the playground of Chang’an University, where there were several straight lines, which was convenient for reference in the procedure of the test. Figure 6 presents the heading experiments situation in test field. We measured the WGS84 coordinates of the three endpoints (1,2,3) of straight lines by RTK and calculate the azimuths as the ground truths. In the test field, ground is flat, sky is open, besides there is no obvious electromagnetic interference in surrounding.
The heading experiment contains two test cases, the first one we did along east-west orientation straight line 1–2; the other one we did along the north-south orientation straight line 3–2. In 1–2 direction test, we performed 10 min static test and 10 min kinematic test. In static test, we put the two test phones Huawei AL10 and Mate20 on a flat plate and kept them along the straight line direction. In kinematic test, we fixed the two smart phones on the flat plate, held it and walked along the reference line, walking smoothly, the speed was about m/s. The azimuths of 1–2 and 3–2 were and separately. In 3–2 direction test, we repeated the same procedure like 1–2 test. We corrected the local magnetic declination, checked from the website http://www.magnetic-declination.com/, the bias was about . All tests were performed in nearly same situation, the same tester, besides, the temperature had no obviously change. Each test lasted 10 min and collected more than 20,000 records.
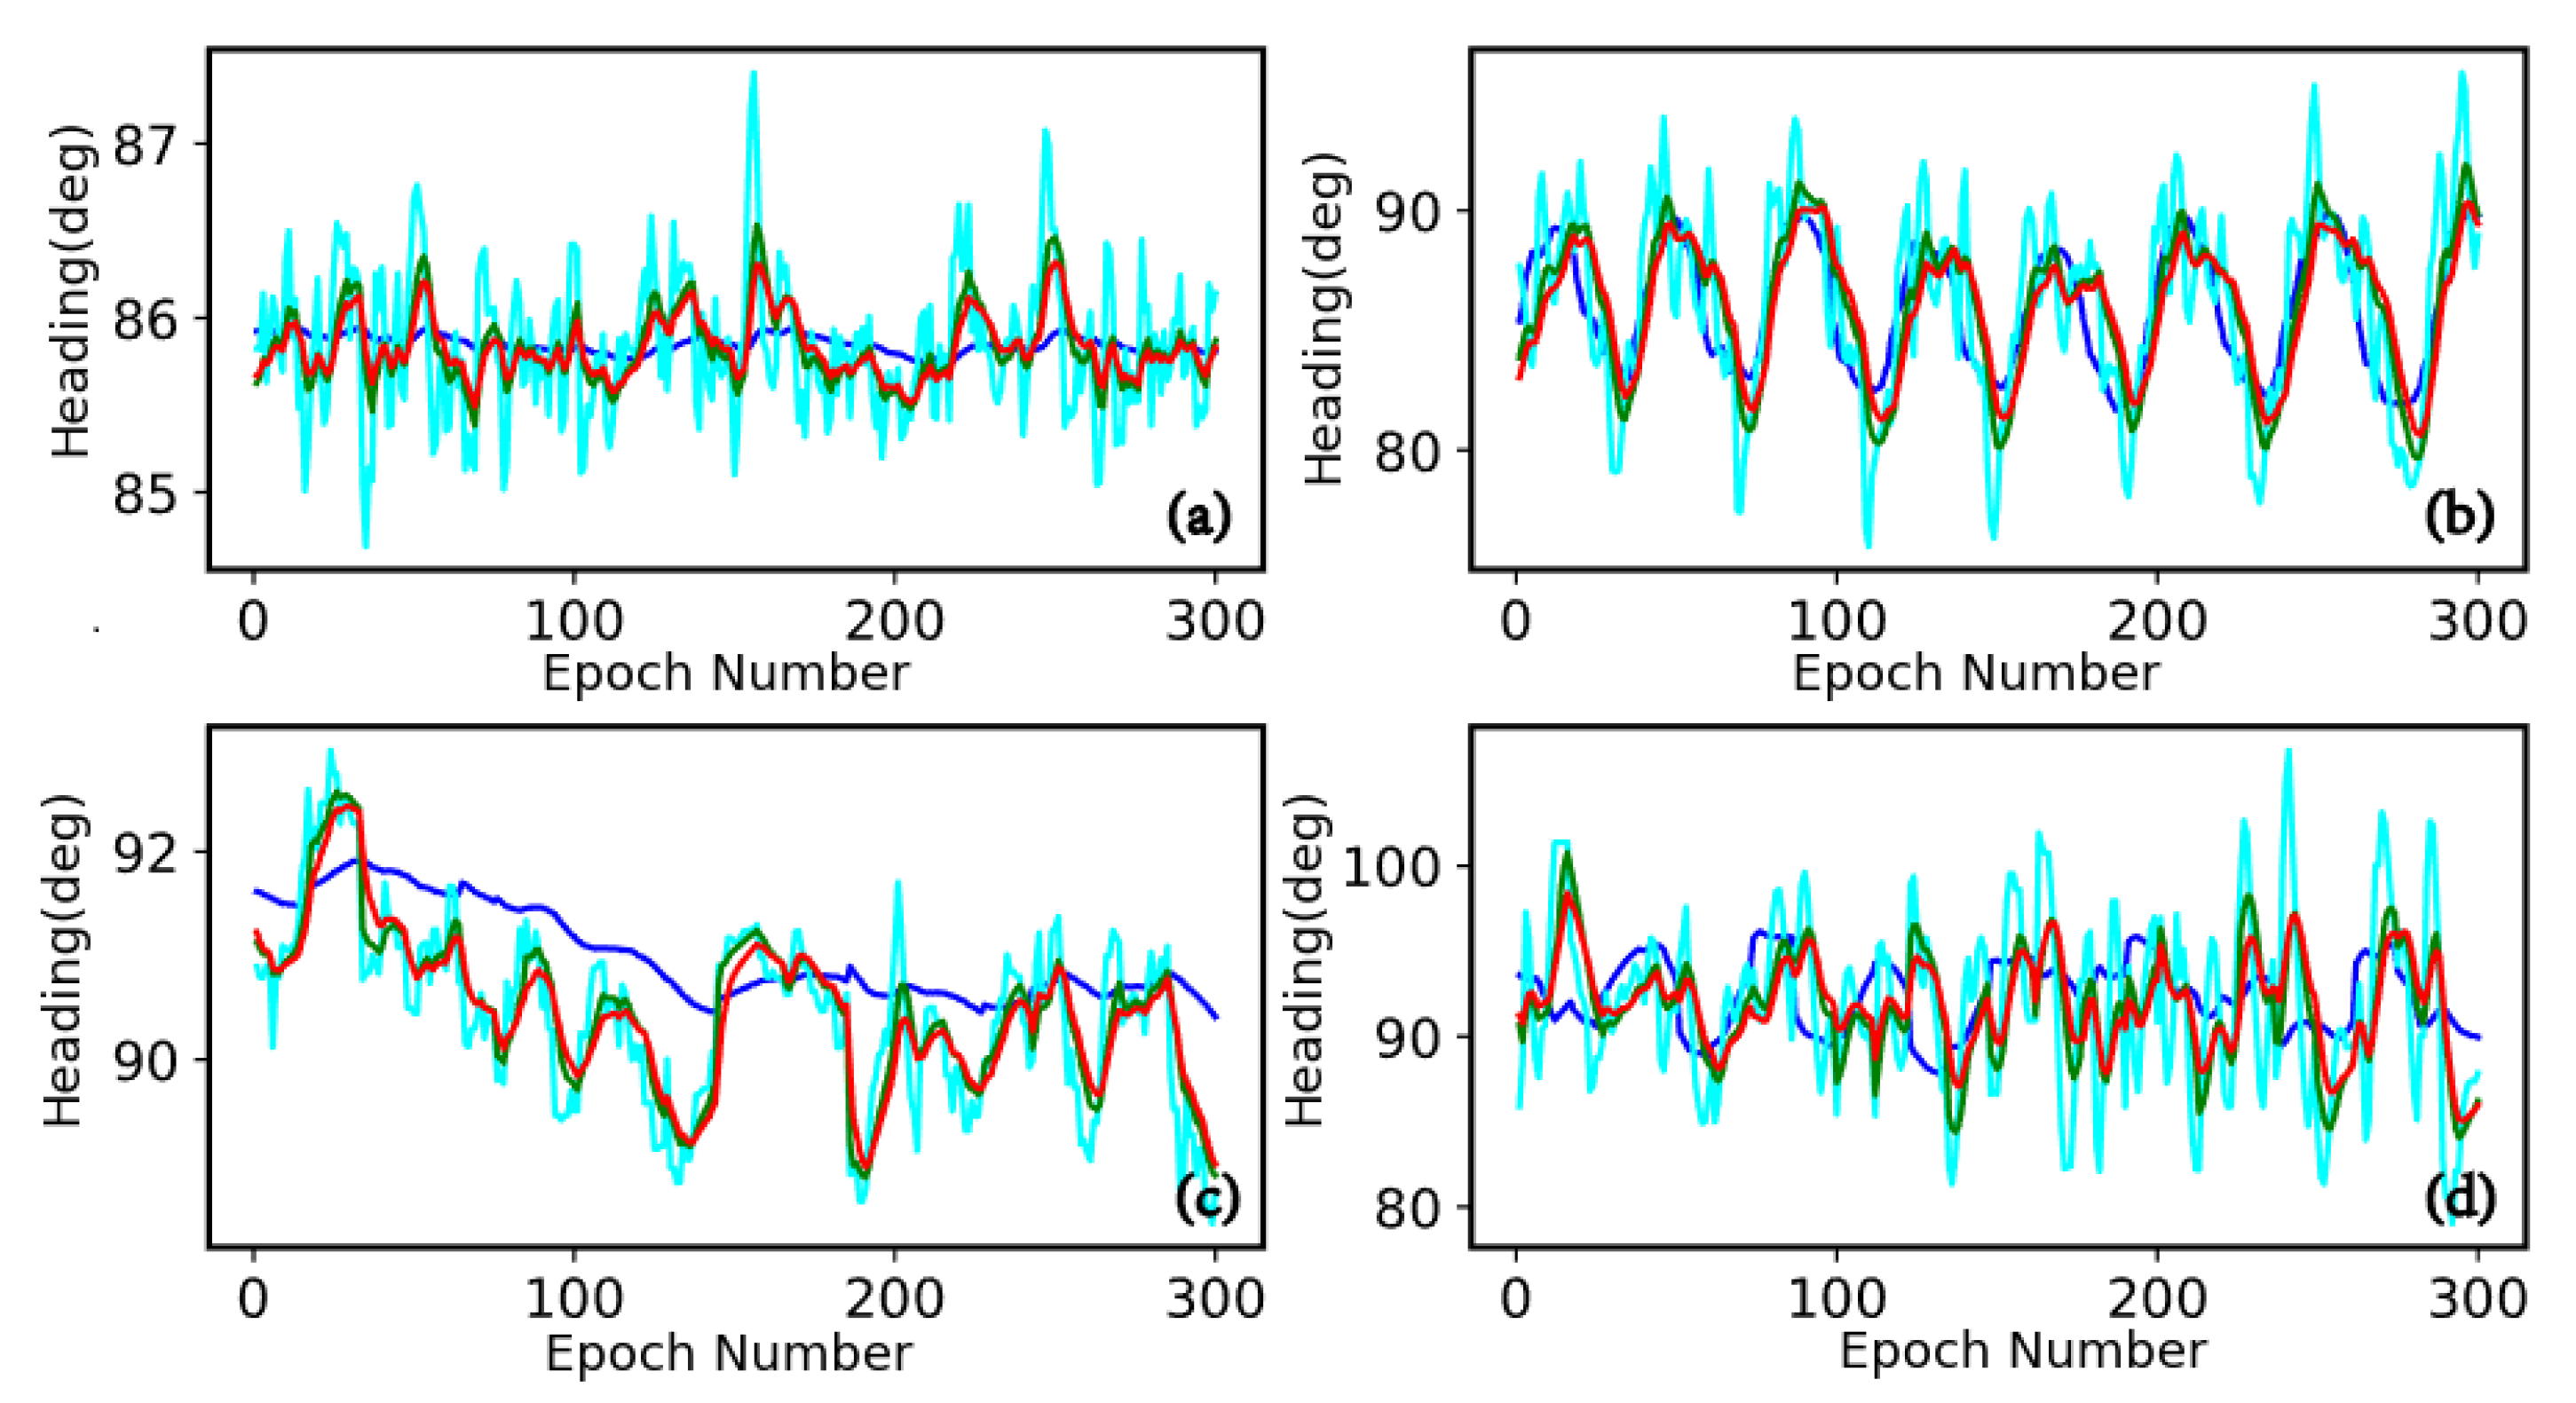
In order to verify the improved MEMS heading algorithm, we also present the results processed by other three methods for comparison; raw heading is got from accelerometer, magnetometer measurements and local magnetic declination; other two proposed methods, Kalman filter, its model is presented in the Section 2.2, First-order Complementary filter, the detail please refer to these studies [38,39]). The first case, we did a static test and a kinematic test along the straight line 1−2, the reference azimuth was . Figure 7 presents the part of the results processed by the four algorithms.
The second case, we also did a static test and a kinematic test along the straight line 3–2, the reference azimuth was . Figure 8 presents part of the results processed by the four algorithms.
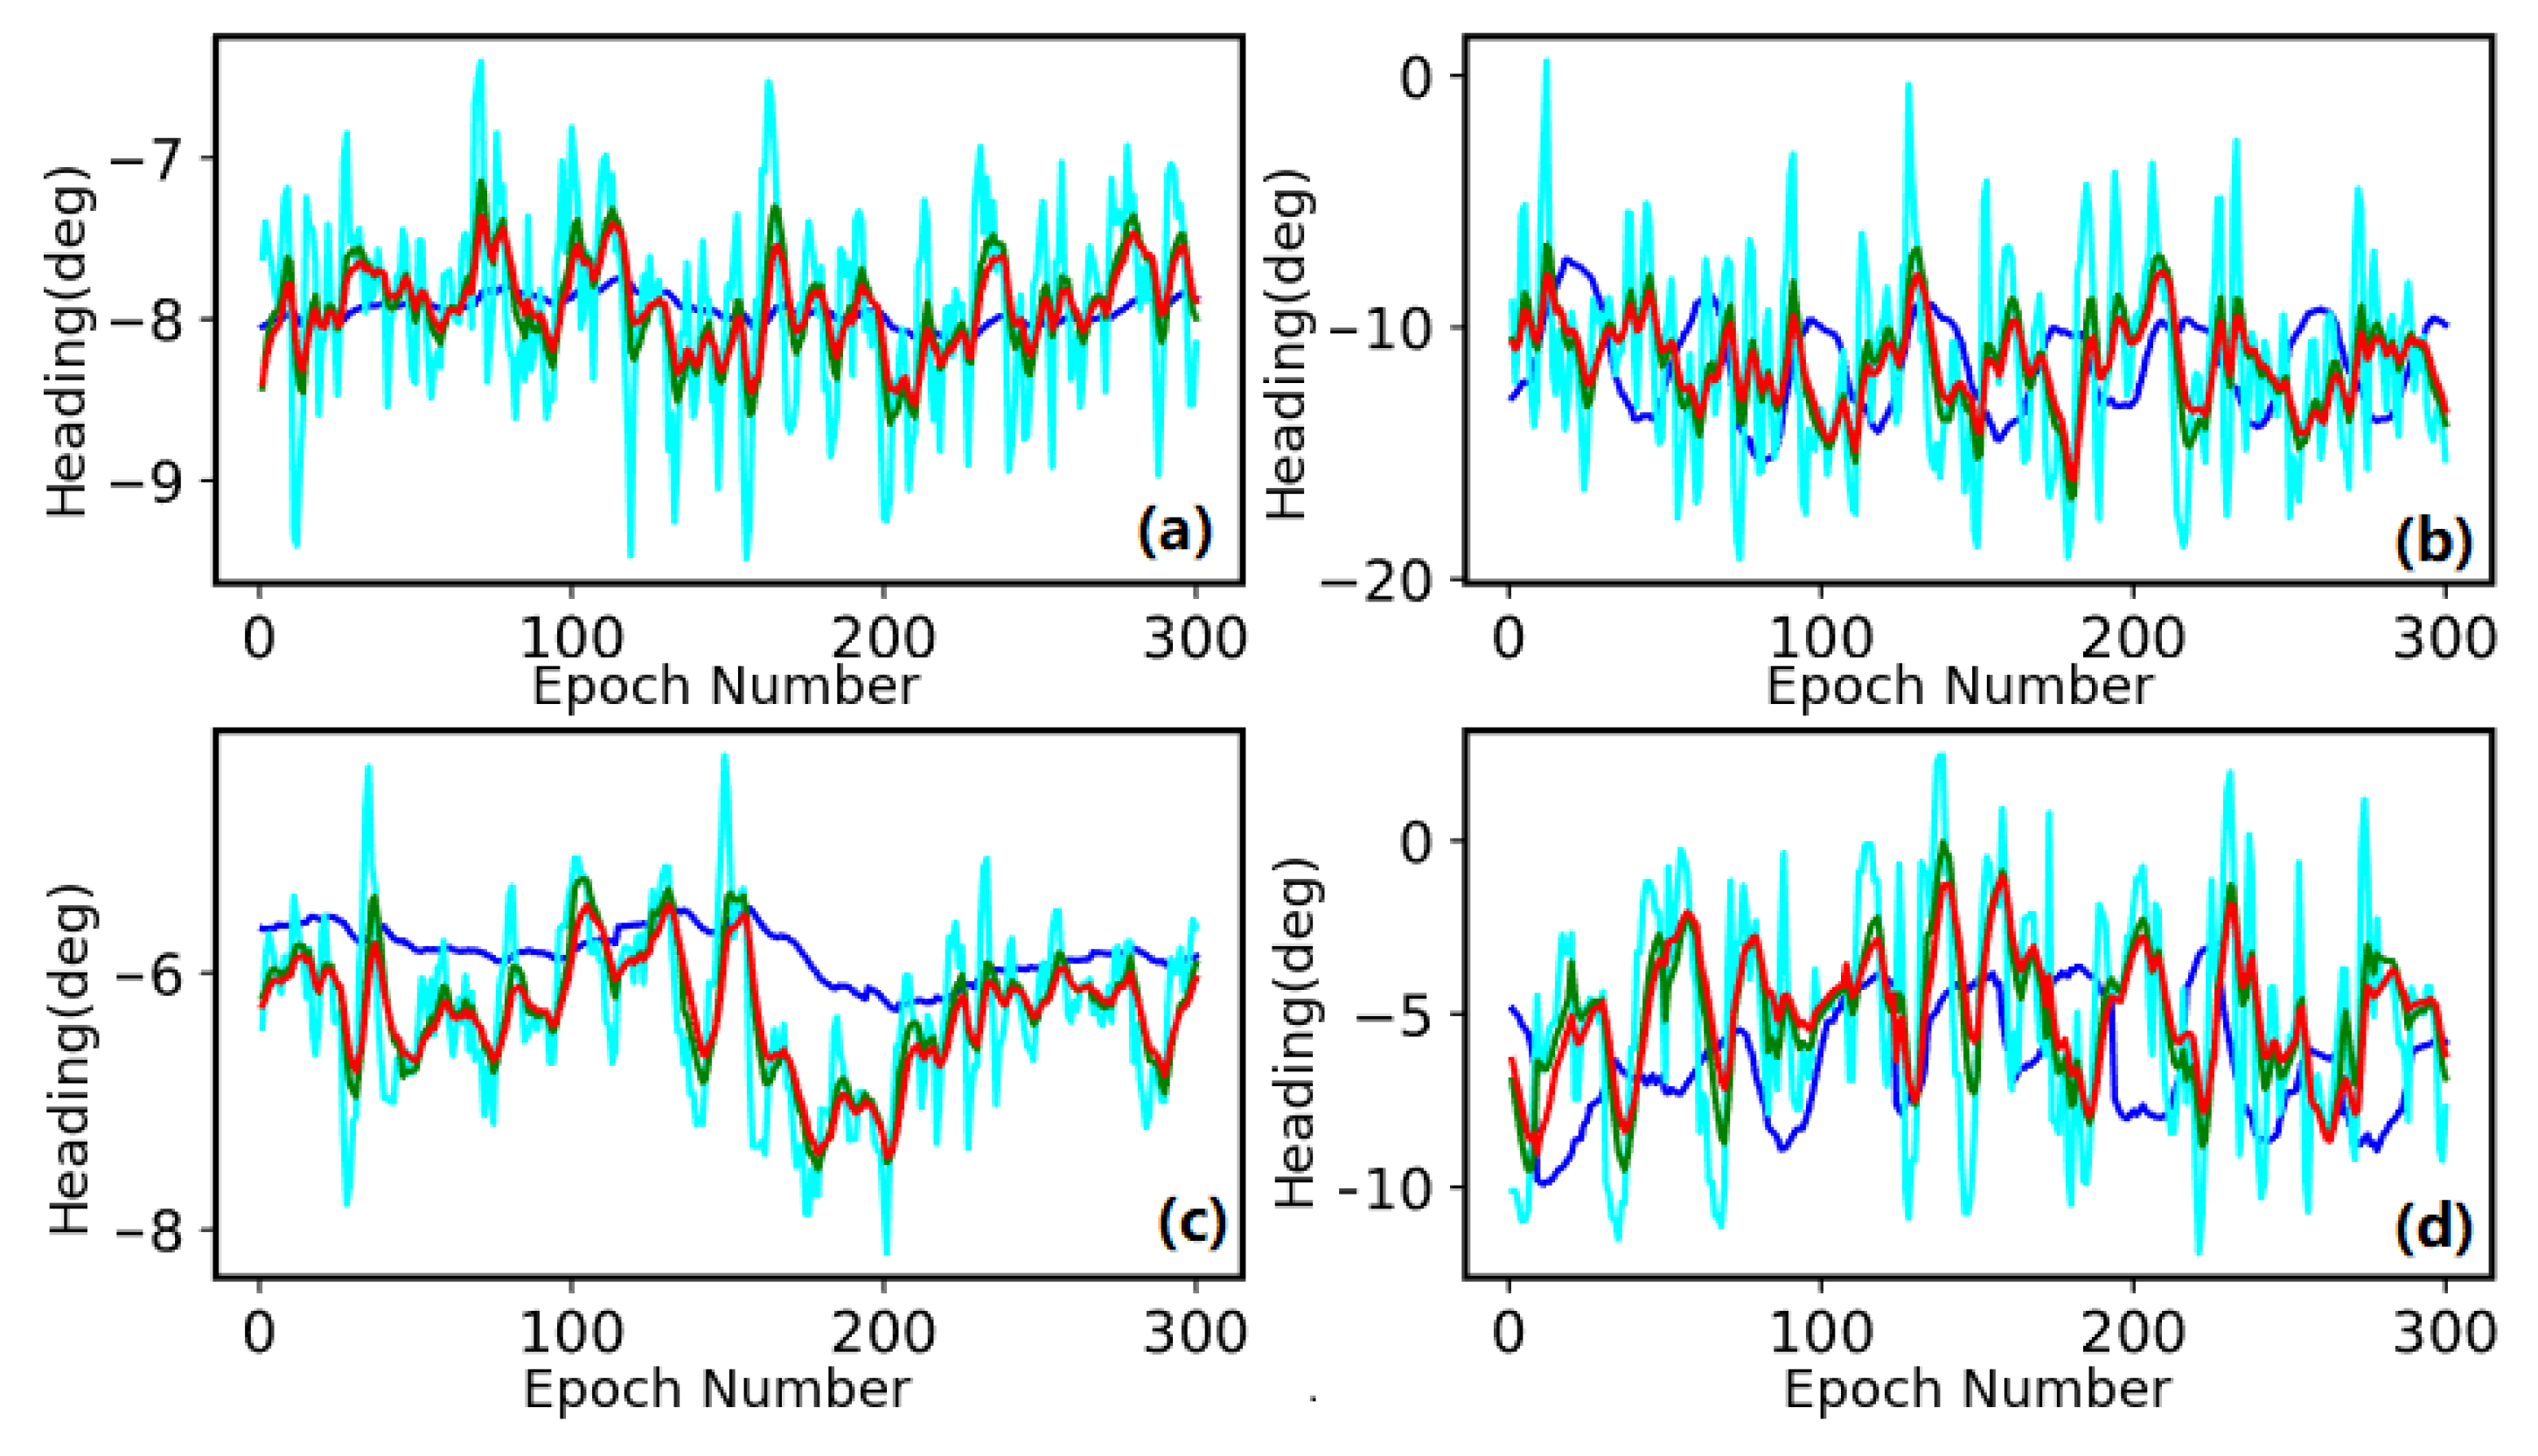
Actually, numerous methods based on MEMS sensor’ measurements have been used in previous studies to compute for the smart phone heading [40,41,42]. In Figure 7 and Figure 8, we present the headings processed by different strategies. These figures only give 300 epochs of the results for plotting, in total, each test contains more than 20,000 results. The cyan line is the heading series processed by the traditional method ( refer to Formulas (5)–(8)) using accelerometer and magnetometer measurements. It is a basic and well-known method, it can also be obtained from Android API and it has low precision and large bias. Except the raw heading, we present several heading solutions, red line, green line and blue line represent the processed results of the Kalman filter, first-order complementary filter and improved algorithm respectively.
3.3. Navigation Test Using GNSS + PDR + Beacon Fusion Scheme
This part mainly introduces the application and hardware used in the Mong Kok test. Table 2 lists the detailed information.
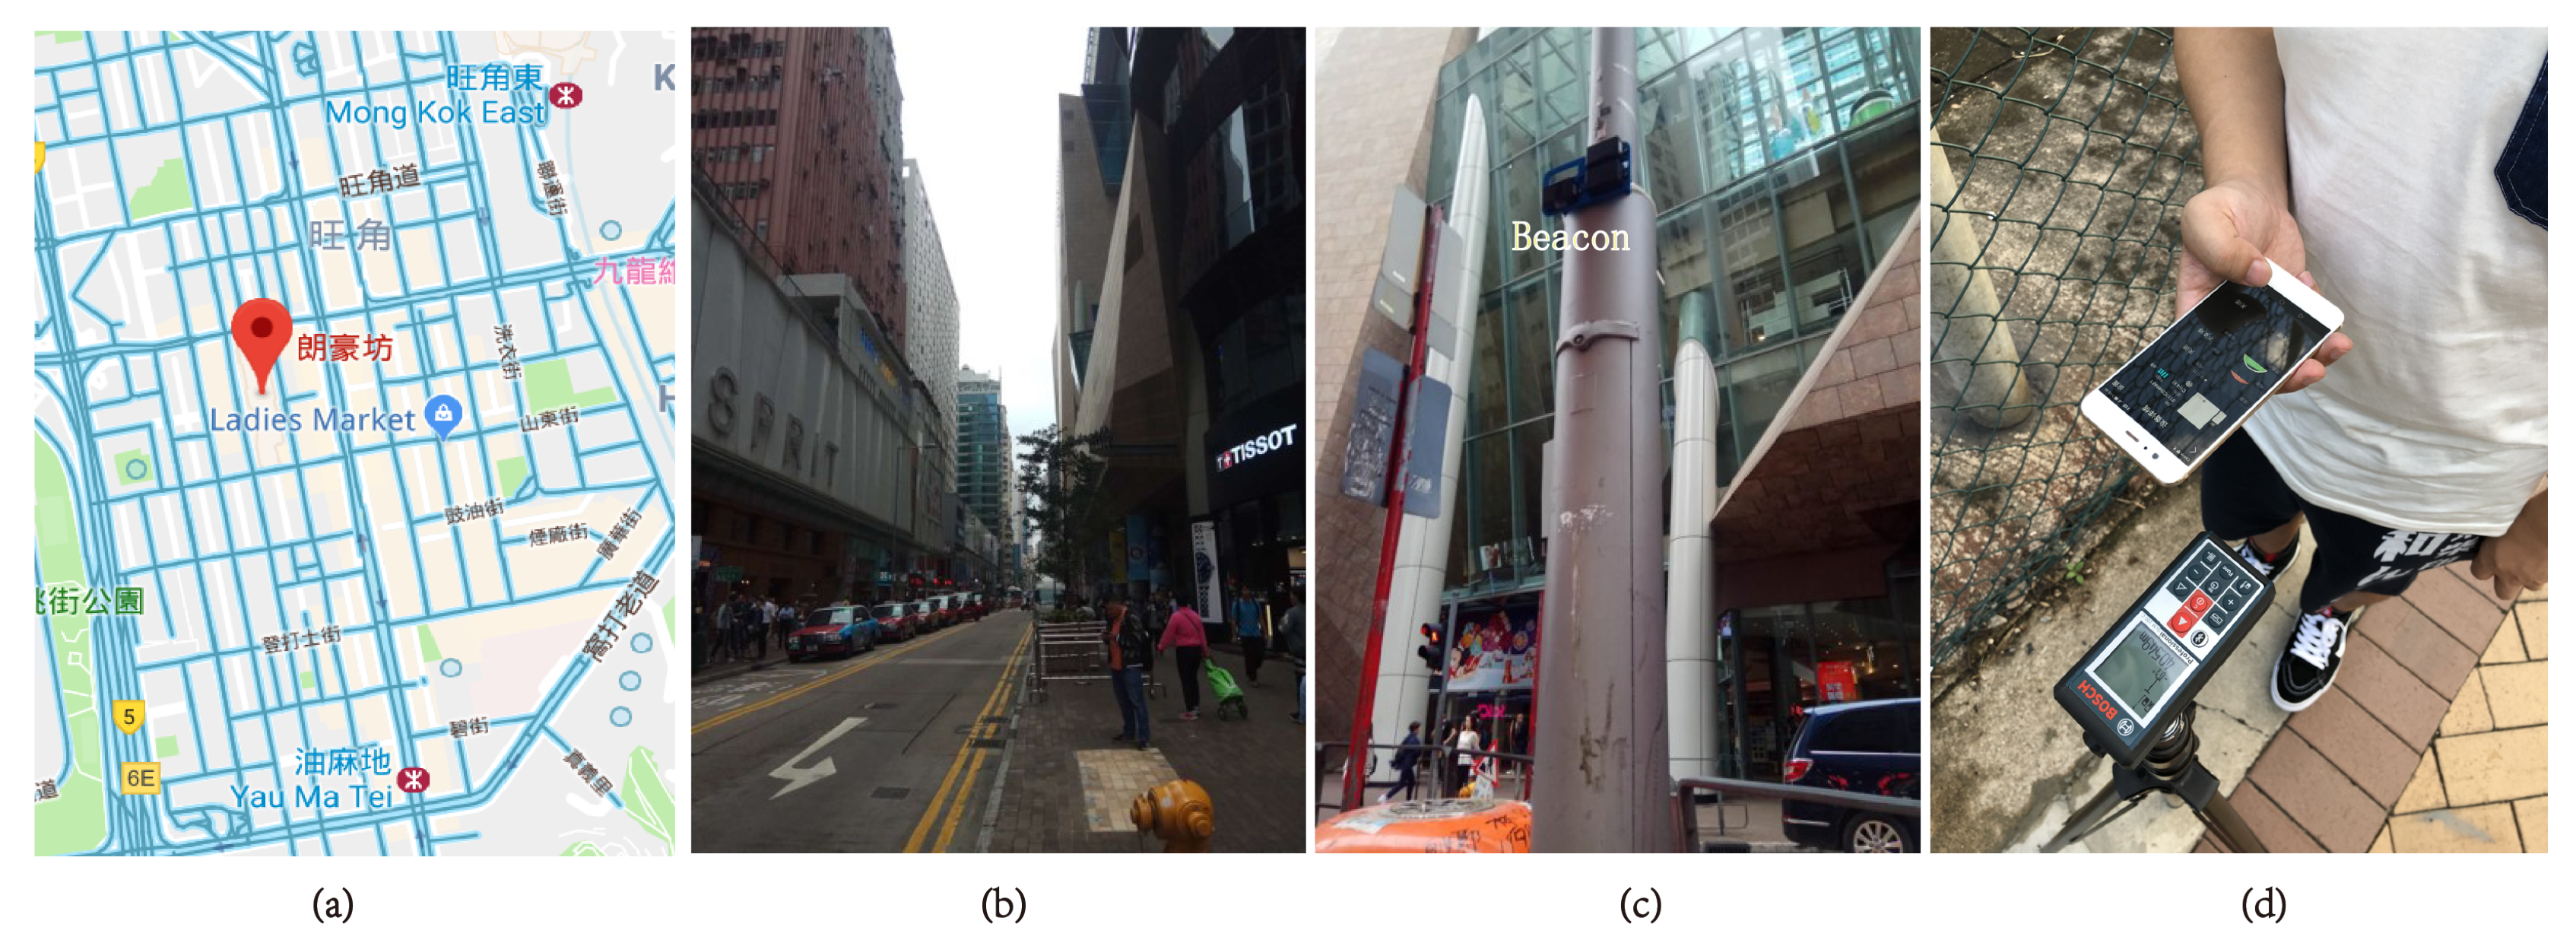
The test field was conducted on 19 November 2018 near Mong Kok Metro Station. This location is one of the busiest and crowded areas of Hong Kong, where many people would be walking in the testing roads and several tall buildings are present. Prior to the test, we installed 12 groups of beacons on the pre-planned lamp posts based on the test plan. Then, we installed our application in Huawei P20, which has an Android operating system. Given the numerous shops and restaurants in the study area, the tester sometimes needed to avoid pedestrians and obstacles, such as vehicles; thus, the smart phone was easily swung during the test. Although our application designed attitude transformation algorithms, we aim to avoid large vibrations to reduce attitude transformation errors when estimating step detection, step length and heading. From the objective of usage, most time pedestrian holds smart phone in horizontal when they need to navigate locations.Thus, our tester attempted to hold the smart phone approximately horizontally. It’s still not in absolute horizontal level, especially in walking, hand swinging, large vibrations existing in the procedure. So, it does not mean the scheme does not work in non-horizontal. During the test, one tester started from Portland Street and stopped in Argyle Street, walking along the test streets for more than three rounds to verify the sustained navigation capability. Detailed information and analysis about this test will be presented in the next section.
As shown in Figure 9a,b, many streets exist in the area, the distance between buildings is short; thus, GNSS satellite signals can be easily blocked, which often degrades the positioning accuracy. As shown in Figure 9c, one group of beacons is installed on a lamp post; it contains three beacons, namely, weak, middle and strong beacons, on the basis of their signal transmitting power. In the beacon settings, multiple signal transmitting power levels are from 1 to 5. We set levels 1, 3 and 5 as the weak, middle and strong beacons, respectively. These beacons are 2.2 m above ground and face the pedestrian walking side. Figure 9d shows the pose of test smart phone when tester moving. In most time, tester hold P20 in hand and keep nearly horizontally.
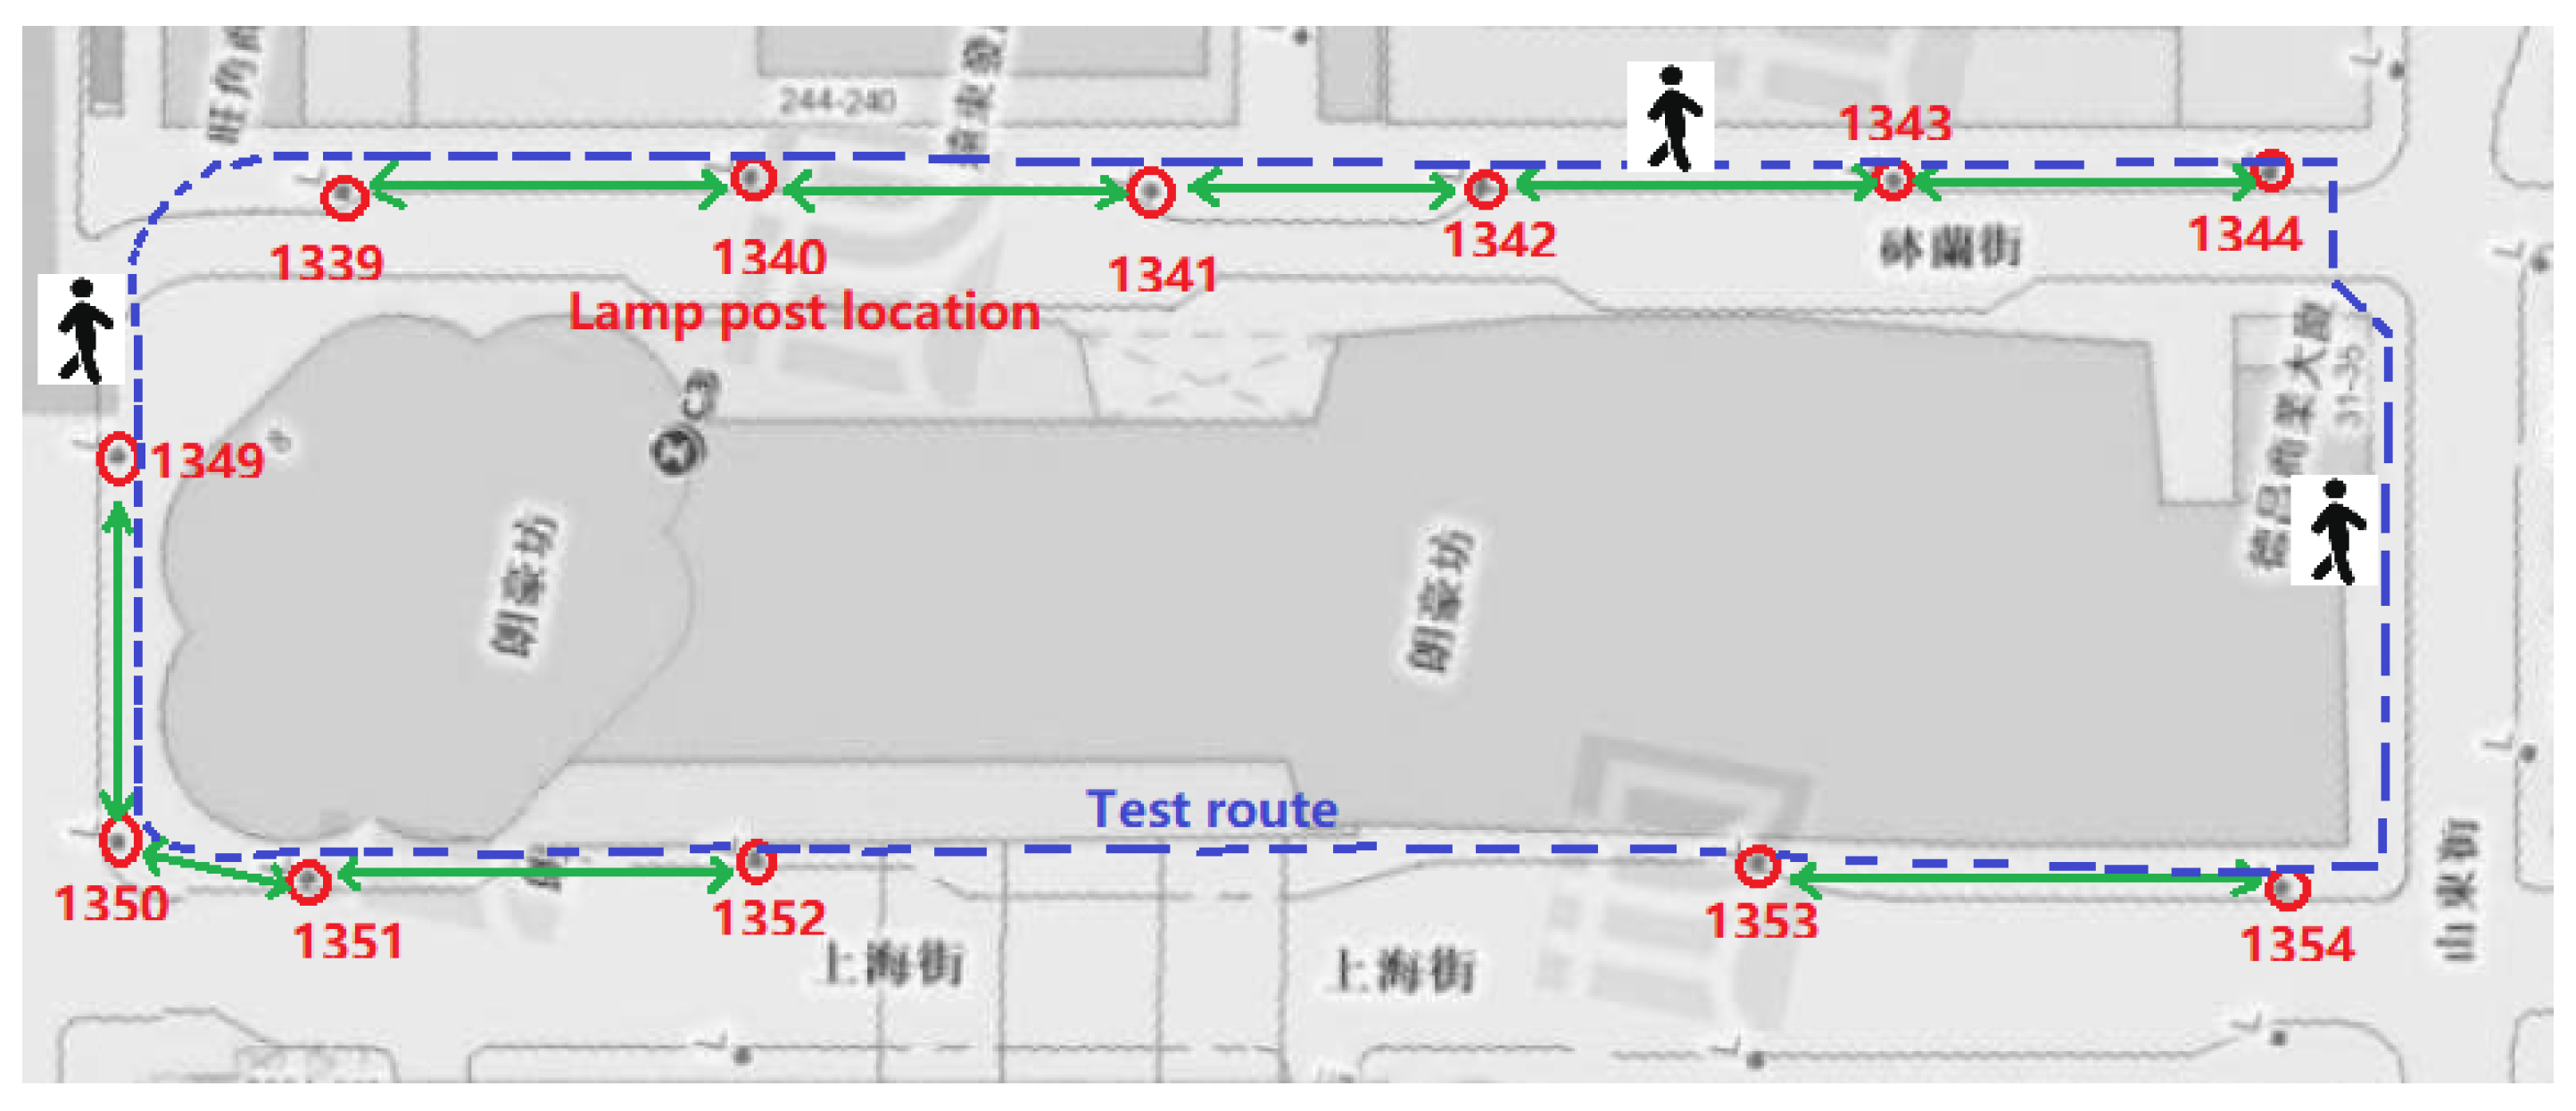
Figure 10 shows our planned route in this test and the 12 lamp post locations. In each lamp post, we installed a group of beacons that these beacons face the tester walking route, with a total of 36 beacons; each group contains three beacons, namely, weak, middle and strong. We used these lamp post coordinates and beacon ID to create an orientation library for the beacon heading search. From Figure 10, easy to see we constructed 18 headings, with two directions in each side. For example, if pedestrian walks from the lamp post 1340 to 1341, the heading is , whereas if walking in the opposite direction, the heading should be . Detailed information of beacon heading is listed in Table 3. In our study, we aim to use beacon for positioning and heading calibration. We used an easy, convenient and low-cost method to install the beacons on the basis of real test environment situation and actual requirement; hence, we installed the beacons on the lamp posts in the best way possible. Four standards are used in selecting the lamp posts to construct beacon heading as the ground truth. (1) The two adjacent beacons must be in a straight line; thus, no turns exist in the walking route. (2) The connecting line of two beacons and the tester walking route are approximately parallel. (3) The distance of two adjacent lamp posts is no less 10 m and no more than 40 m due to the present algorithm limitation. (4) The vertical distance from the lamp post to the walking route is no more than 8 m. On the basis of these standards, we excluded 1349–1339 (has a large turn), 1352–1353 (exceeds distance limitation) and 1344–1354 (not in a straight line). Finally, we used nine groups of beacon and calculated the azimuths to construct the heading library for ground truth calibration. However, all the 12 groups of beacons are used for positioning calibration.
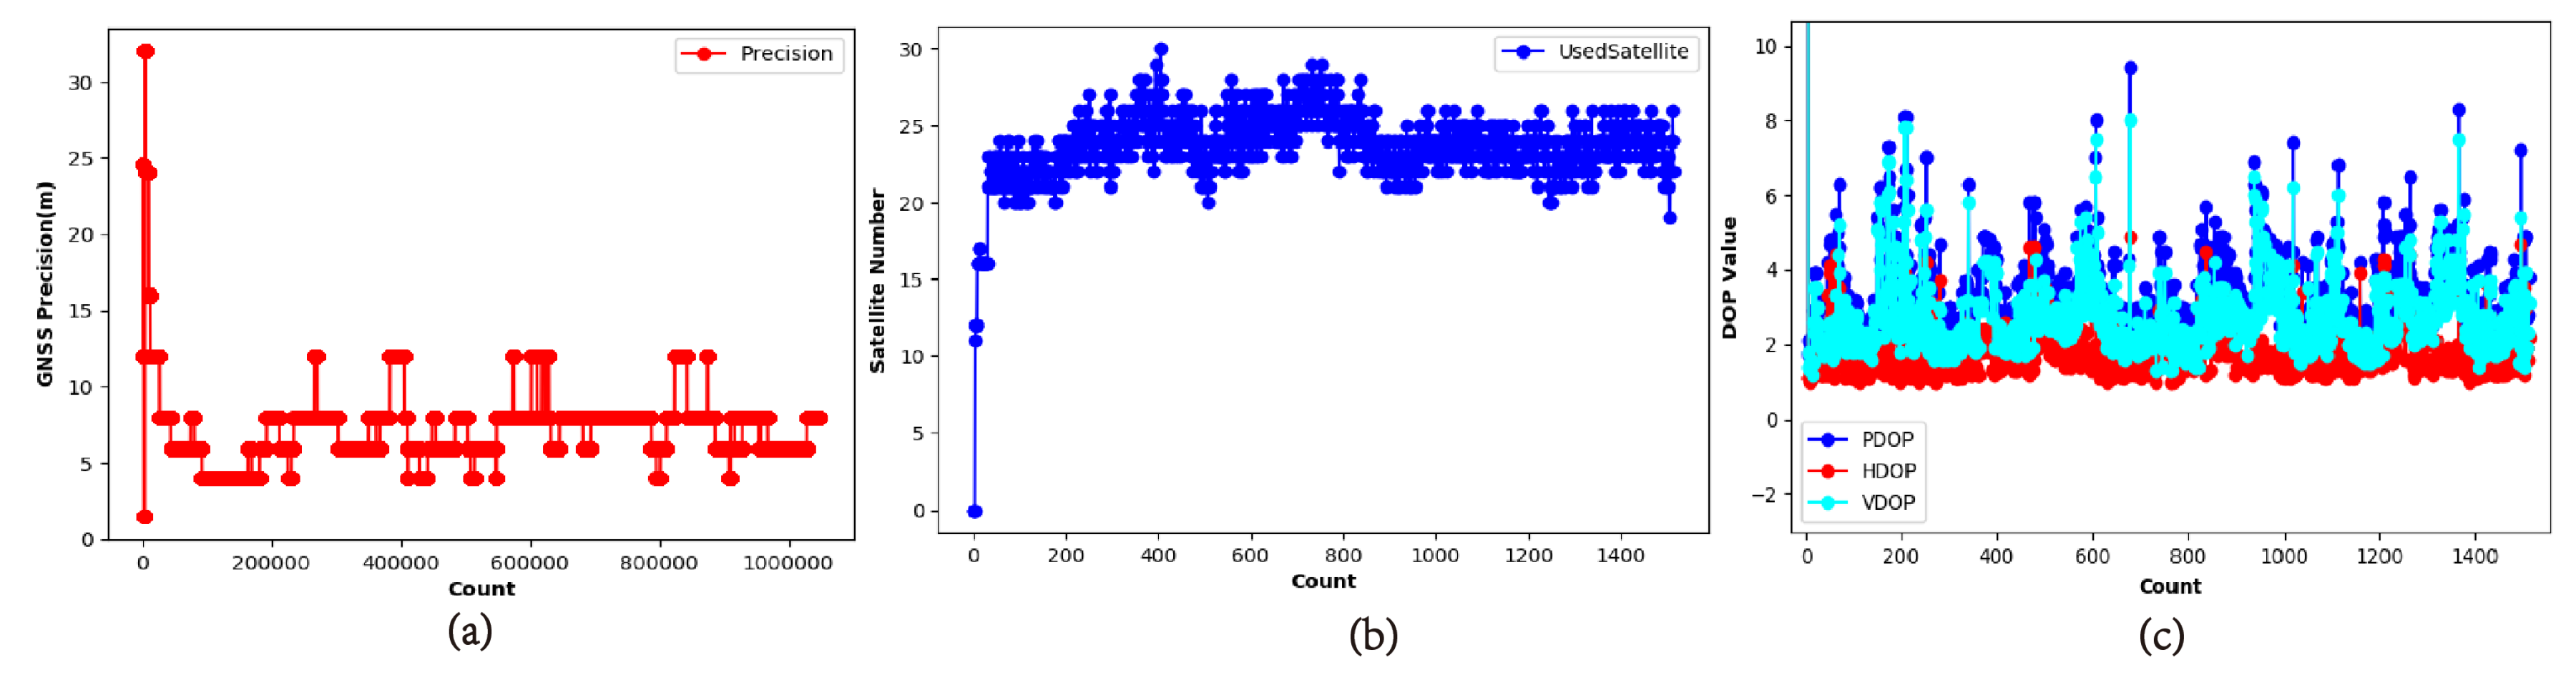
When using smart phone internal GNSS, one key issue is to evaluate its positioning precision, which is difficult to determine in real time without any reference control points. Some previous studies indicate that DOPs, tracked satellite number and SNR have a direct relationship with positioning accuracy. However, the change situation of these indicators in a harsh environment is unknown. Figure 11 shows three statistical graphs of smart phone internal GNSS measurements, that is, the graphs of GNSS position accuracy, satellite numbers used and DOPs obtained from the recorded NMEA of the smart phone. In our study, we also aim to determine some relationship to detect GNSS positioning accuracy using these indicators. Especially in an urban canyon area, open-sky and harsh environment are sometimes mixed together, which easily makes GNSS produce a large jump. The graph Figure 11a reports the GNSS precision, which is mostly in the range of 5–15 m. On t3e basis of our comparison and analysis, the statistical precision is incorrect in expressing the absolute positioning accuracy. Nevertheless, it can denote GNSS measurements dispersion to some extent and can be used to exclude some large jump measurements. The graph in Figure 11b shows the statistics of the number of satellites used. It shows that smart phones can use more than 20 satellites; hence, the surrounding tall buildings do not block most of the satellites, which is sufficient for satellite navigation. Figure 11c presents the PDOP, HDOP and VDOP statistic information, which is mostly below 6 and with an acceptable geometry.
The test was performed surrounding Langham Place Shopping Mall, started from Portland Street and ended in Argyle Street. The tester walked along Portland, Shandong and Shanghai Streets and ended in Argyle Street. The tester walked for rounds in total, each round was approximately 520 m.
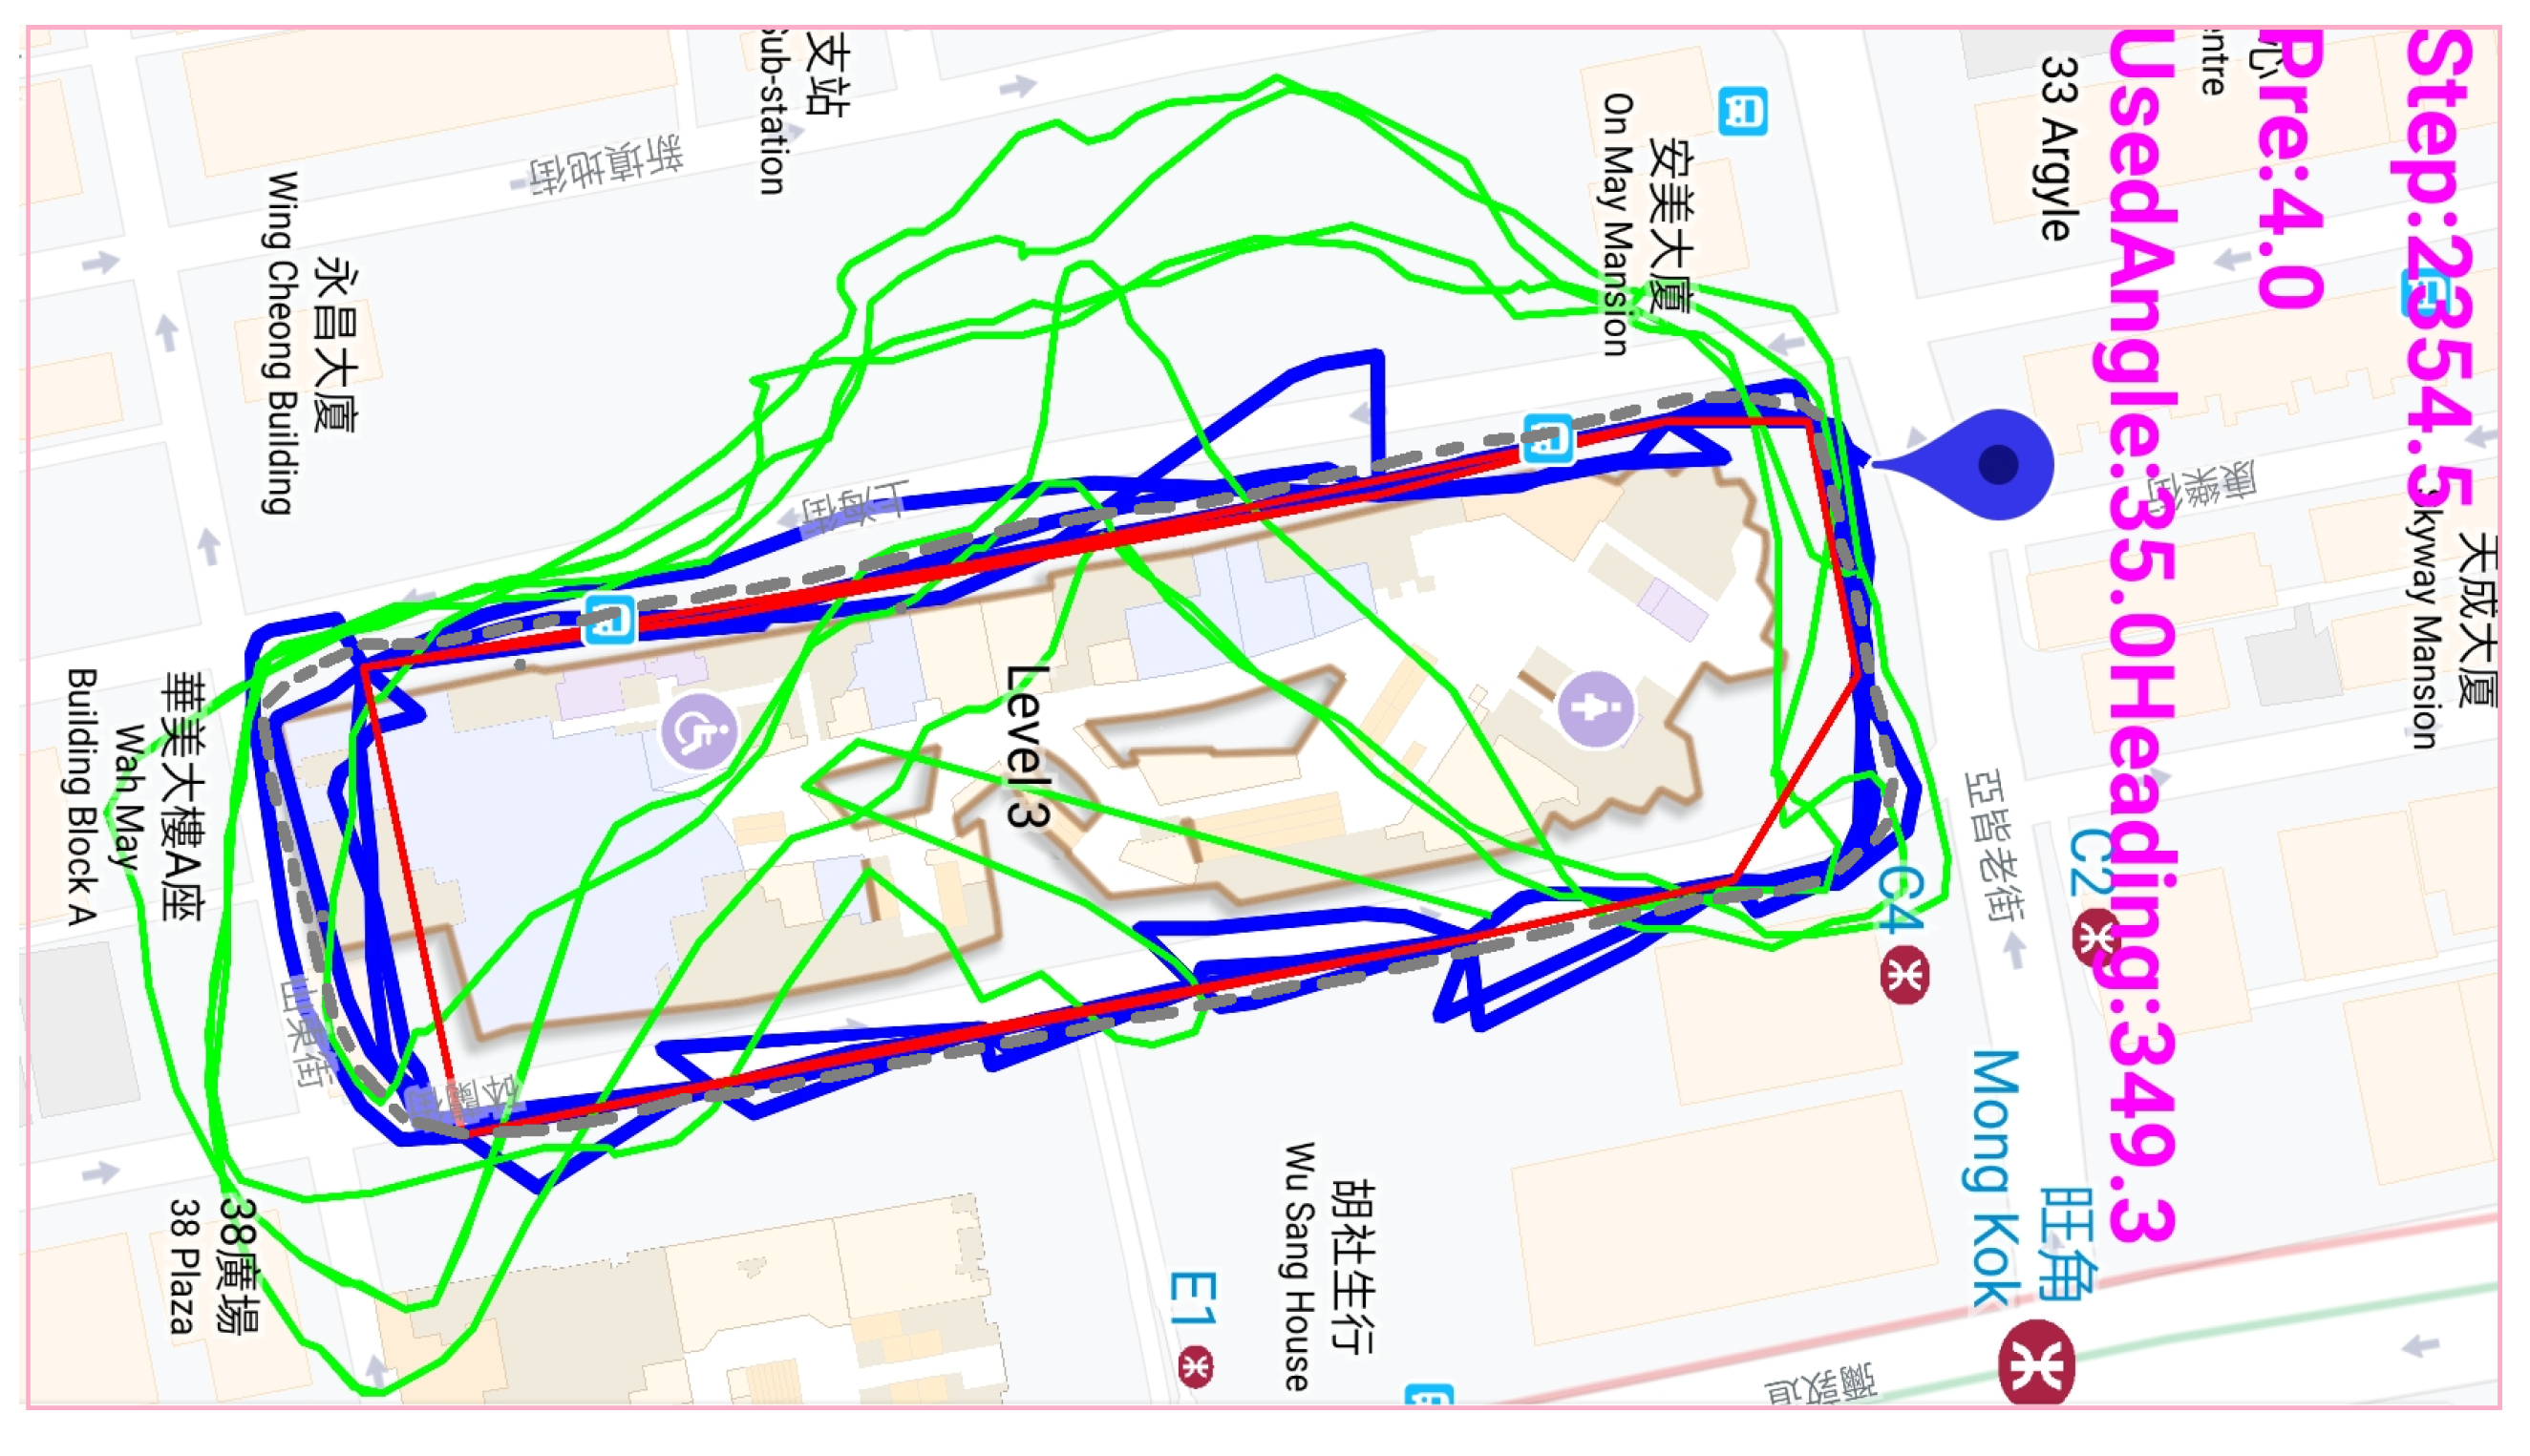
As shown in Figure 12 we plotted the internal GNSS positioning results (green line) and our fused position (blue line). The red line connects all the beacon installation locations. Our application also displays the ground truth for comparison. We interpolated the true trajectory coordinates using the lamp post locations. (The lamp posts’ coordinates can be downloaded from a government website https://www.landsd.gov.hk). The green line has a larger bias compared with the gray line and the blue line is close to the gray line (Figure 12). Moreover, in Argyle Street (north street) and Shandong Street (south street), GNSS navigation position has smaller biases compared with Shanghai Street (west street) and Portland Street (east street). This finding may be due to the fact that Shandong and Argyle Streets are wider and their sky is more open compared with Shanghai and Portland Streets.
3.4. Navigation Test without Beacon
In the previous section, we have presented a test case and validated the application using GNSS + PDR + beacon scheme to verify the positioning capability and stability of our algorithm and application. Installing beacons in every corner of streets is difficult and these beacons must be maintained continuously. Hence, from a realistic point of view, if our solution can still improve the positioning capability and stability without beacons, then it would be more valuable. Thus, we conducted two other tests in Mong Kok and Wanchai. This section elaborates the two tests.
We performed the two tests on March 13, 2019 in Mong Kok and Wanchai and we installed our application in Huawei P20. This time, we did not install any beacons. On the basis of our test plan, we needed to collect data in longer routes to verify long-range navigation capability without beacons. The designed test routes both exceeded 1600 m, crossing several crowded streets. The test routes were sidewalks, most were close to buildings or under buildings and most streets are extremely narrow, with width of no more than 30 m, even less. The surrounding buildings are higher than 50 m. In Wanchai test, our tester held a smart phone started from Wanchai Metro Station, walked along Jaffe and Hennessy Roads and went back to the starting point. In Mong Kong test, the tester started from Mong Kong Metro Station walked along Shanghai Street to Yau Ma Tei Metro Station and then went back along Nathan Road to Argyle Street. Some streets in the area of Mong Kok and Wanchai have a mix of open-sky and harsh environment. The two test fields are typically the busiest and most crowded areas of Hong Kong with many people and tall buildings. In the experiments, the tester also held a Huawei P20 and the walking direction and the smart phone heading were kept approximately similar. In the test process of walking, oscillation was inevitable; thus, the tester needed to avoid other pedestrians and attempted to avoid excessive vibrations to reduce attitude computation and step detection errors. Hence, in the two experiments, the tester also kept the phone approximately in horizontal when moving.
In Figure 13, the left and right pictures show Mong Kok and Wanchai test field environments, respectively. Both have many tall buildings and most streets are extremely narrow. The test fields (cyan markers) are typical harsh urban environments. PDR positioning accuracy depends on moving distance. Thus, we performed long-distance tests to verify our application positioning capability.
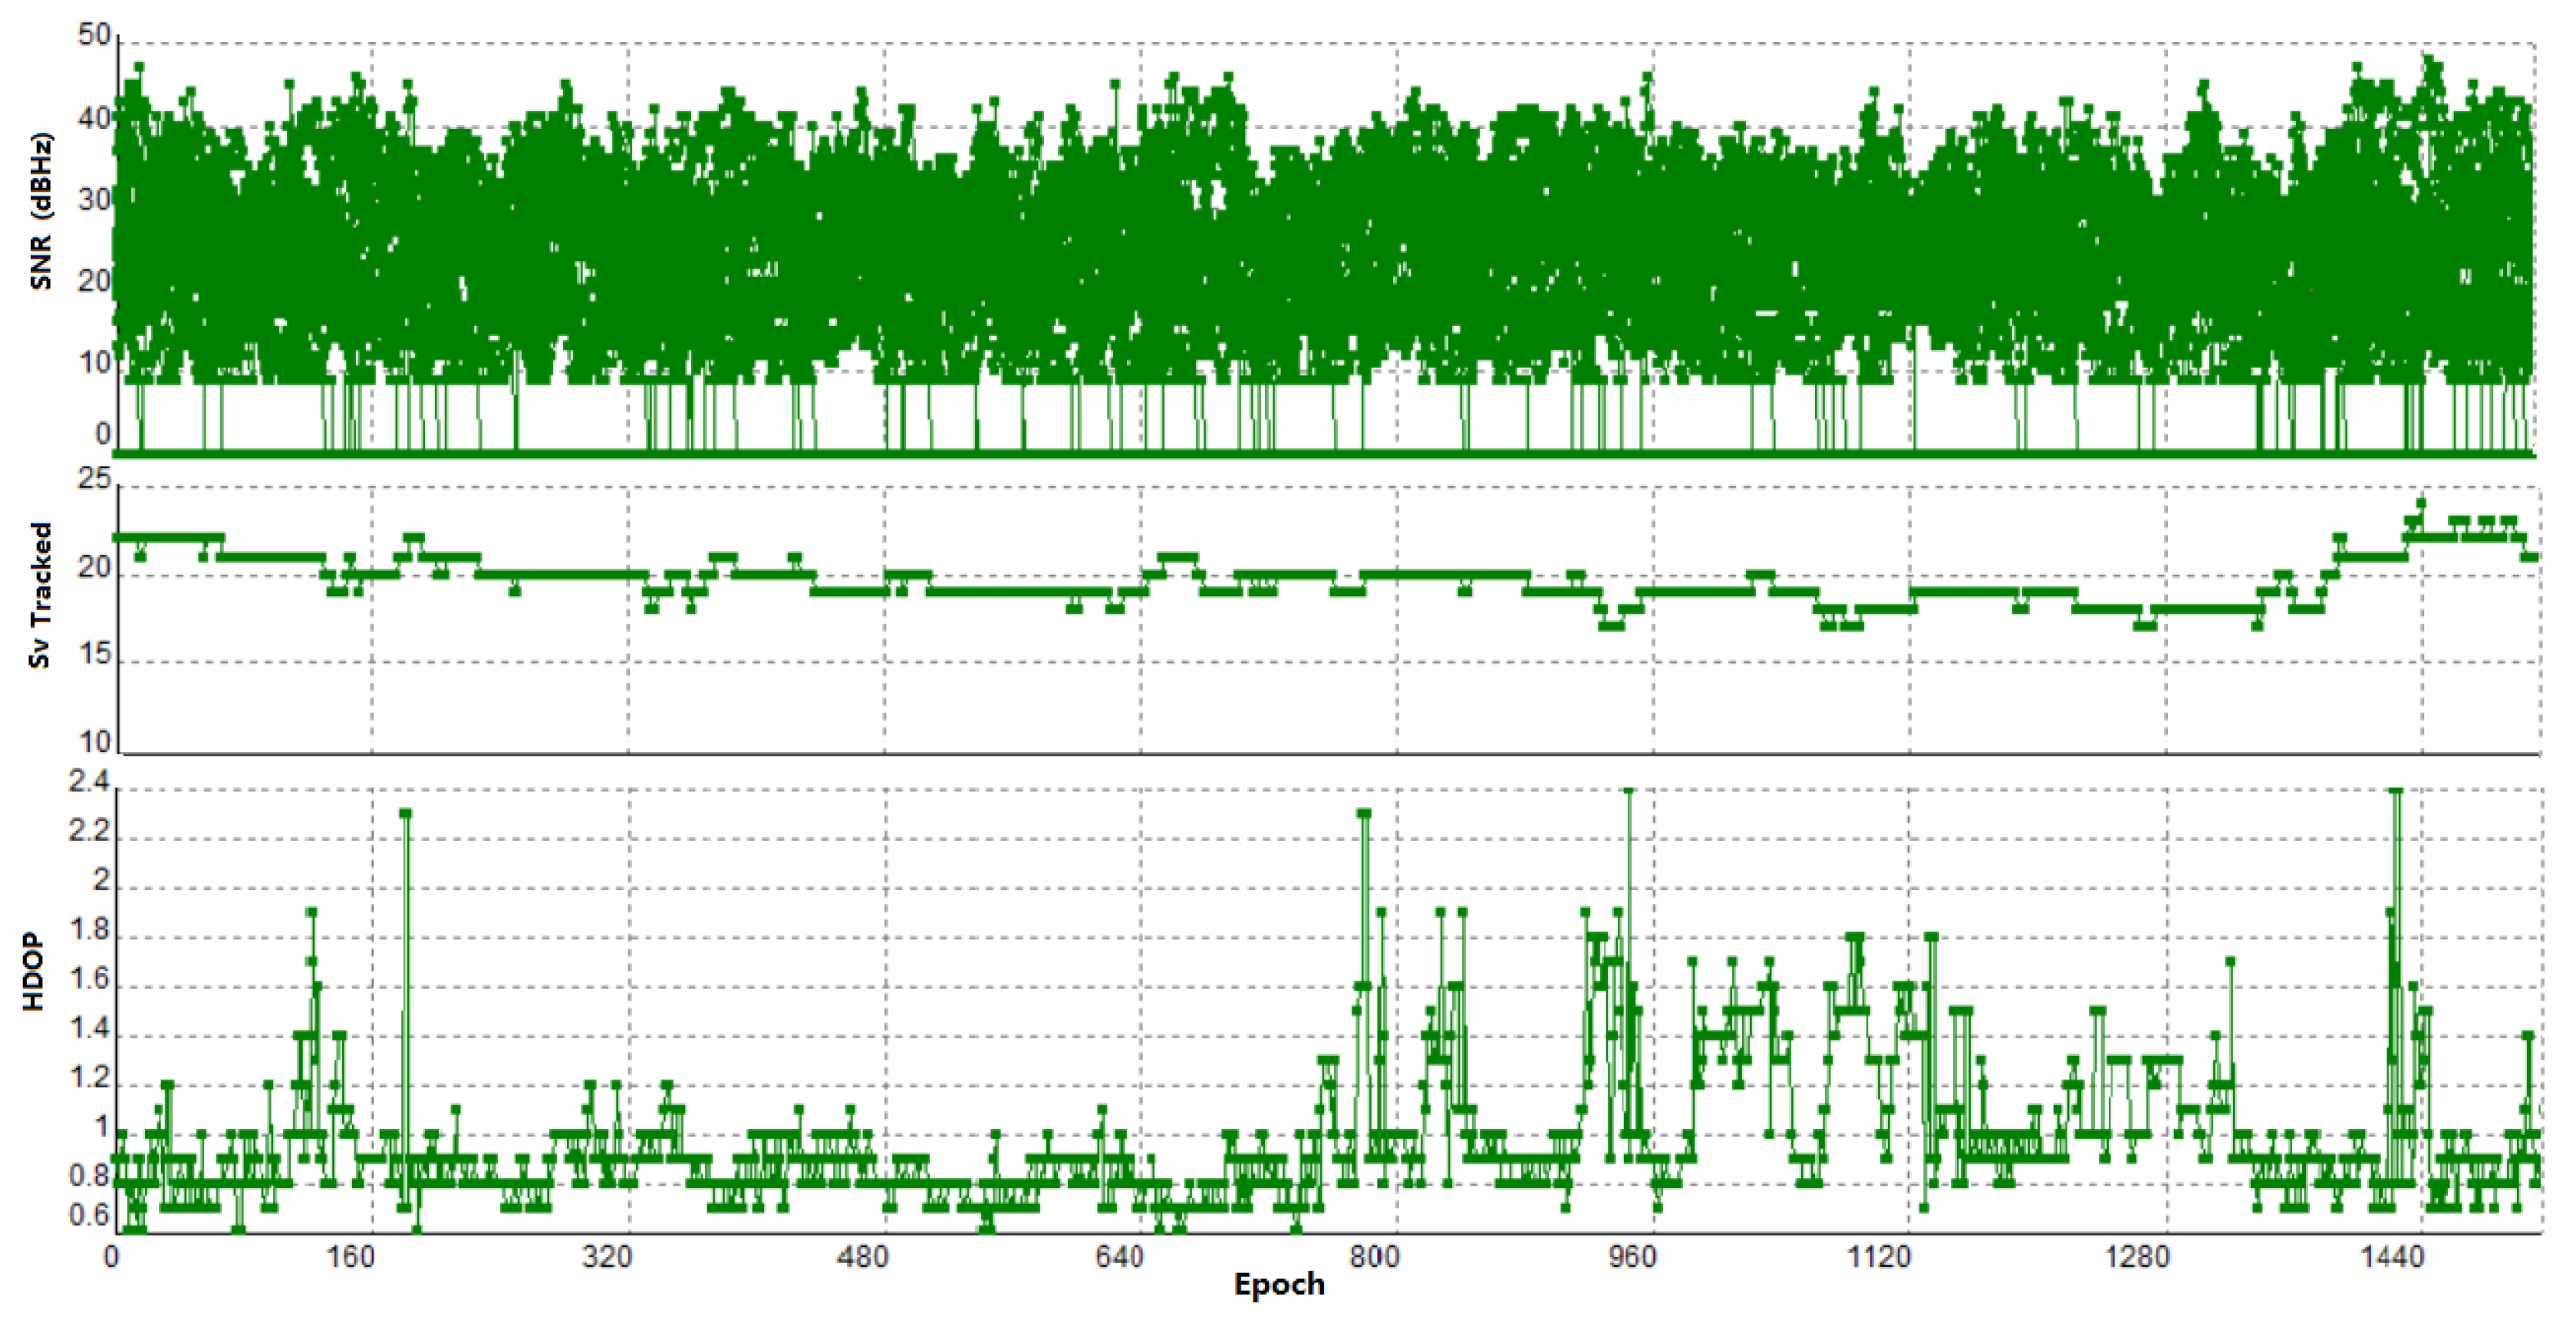
Figure 14 presents the smart phone internal GNSS observation information obtained from recorded NMEA messages. SNR is a direct indicator that describes signal strength. As shown in the figure, most satellites’ SNRs are below 40 dBHZ, which indicate weak signals. The tracked satellites usually exceed 18, which is sufficient for positioning. The statistics show stability; however, the actual positioning accuracy fluctuates. Most PDOPs of the epochs are below 1.8, which indicates remarkability.
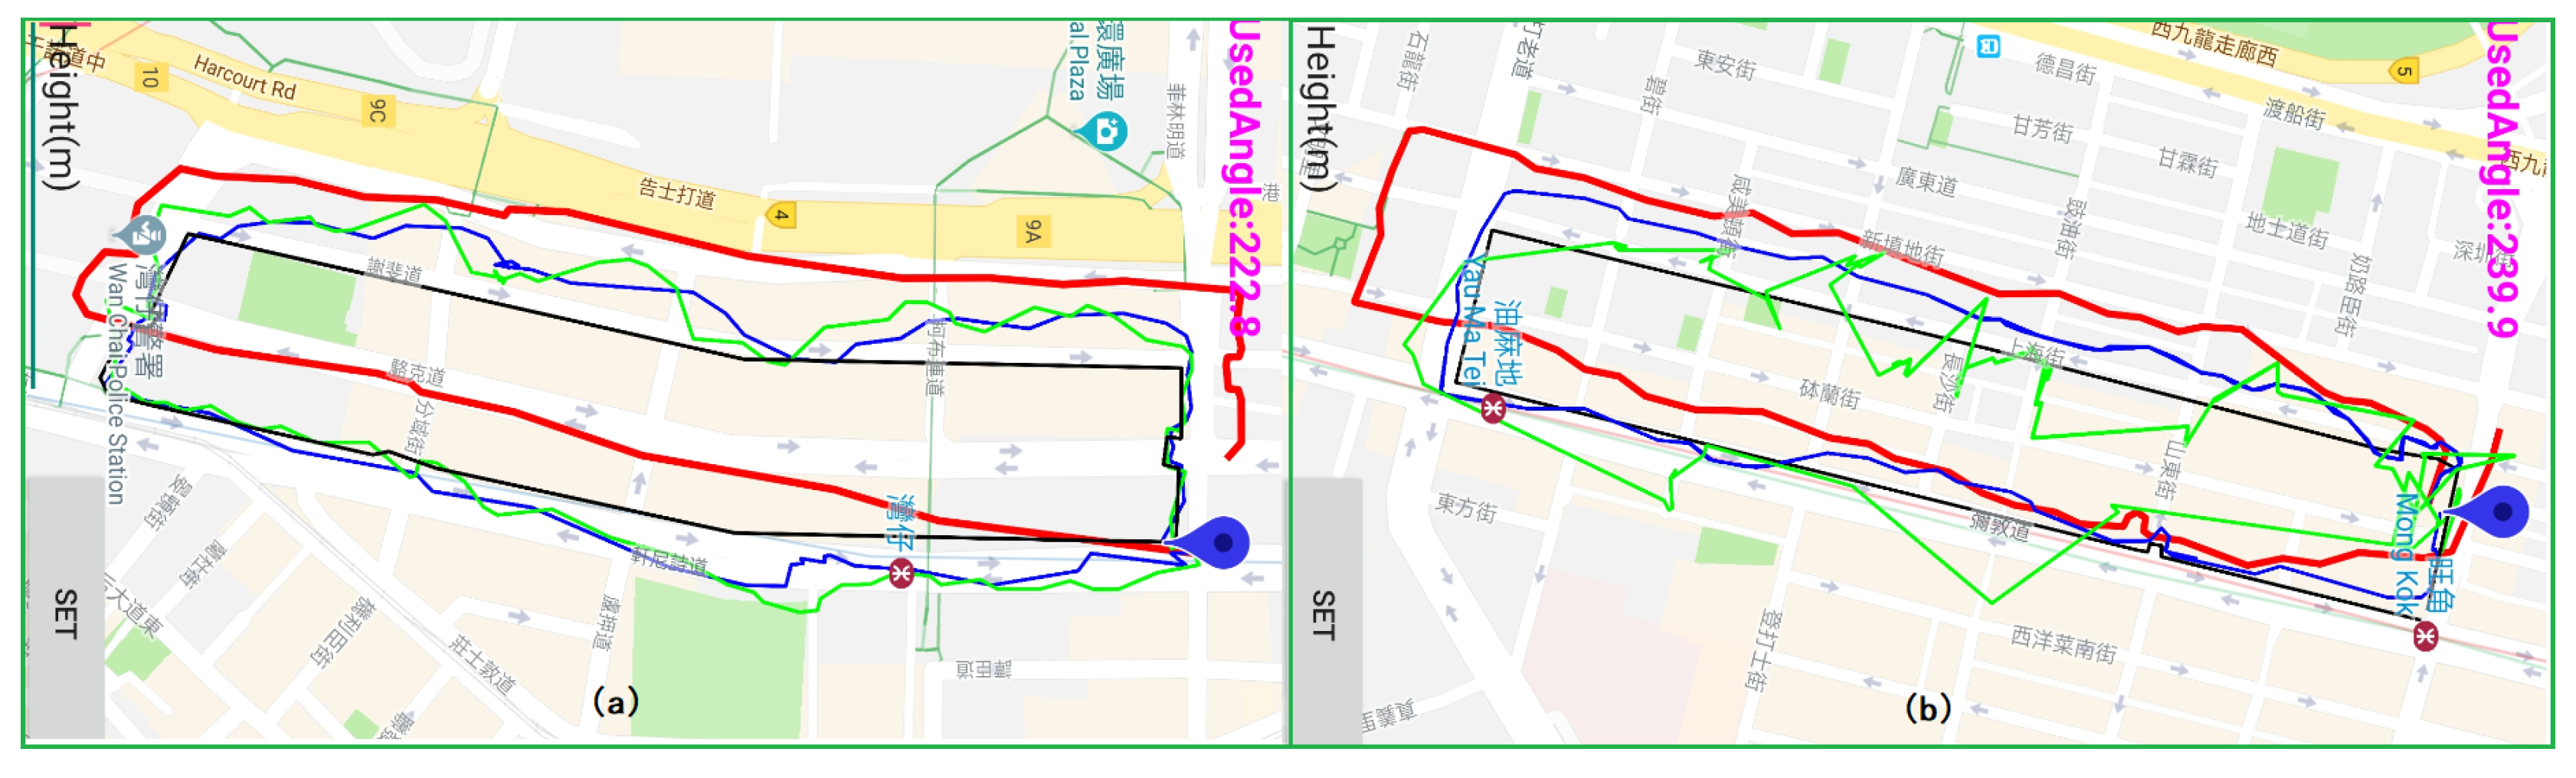
The test routes in Wanchai and Mong Kok exceed 1600 m and the tester walked smoothly along the main streets. Figure 15 presents the test results.
As shown in Figure 15, the fusion position (blue line) combined the PDR results (red line) and GNSS results (green line). The PDR positions have smaller fluctuations but have larger bias along the test route compared with the actual walking route (black line). Although some jumps exist in the GNSS positions, it still fluctuates along the actual walking route. Our fusion position used absolute positions obtained from GNSS and high-precision PDR movement. Thus, it reduced the absolute positioning bias and integrated PDR and GNSS positions together.
4. Discussion
4.1. Discussion of Heading Test
Heading is the key element of pedestrian navigation, in previous section, we present part of the results of two heading tests Figure 7 and Figure 8. In the two figures, there are only 300 epochs’ results, actually, there are more than 20,000 results collected in 10 min. In this section, we will present some statistics and deep analysis using the 10 min test data. Each of the two heading test cases contains static and kinematic test, we summarize the static and kinematic test results in Table 4 and Table 5 separately.
Table 4, it contains two groups of static test results, “3–2” is the south-north direction test, “1–2” is in east-west direction. From “3–2” statistical results, we can find the mean bias of Mate20 is in the about , actually no matter "Kalman filter", "First-order CF" or "Improved" algorithm, there is no obvious change, that means, these algorithms do not reduce the system error; the mean bias of AL10 smart phone is in the range ∼, there is no markedly improvement. In comparison with Mate20, the mean biases are larger; actually, AL10, the smart phone its sensors are worse than Mate20. Except mean bias, the RMSE statistical values, Mate20 are approximately 60% of AL10. “1–2” test, the situation is nearly same as “3–2”. STD, in some extent, it denotes the fluctuation of heading. In Figure 7 and Figure 8, from the graph (a) (c) (e) (g) of we can see blue is stable, red line and green line both reduce the fluctuation compared with cyan line. In addition, in Table 4, fusion algorithm has the minimum STD value, no matter “3–2” test or “1–2”. The STD values of “First-order CF” algorithm and “Kalman filter” are also reduced compared with the heading got from accelorometer and magnetometer.
Table 5 gives the statistical information of the two kinematic heading tests, mean bias is not reduced. While RMSEs are extensively reduced no matter “3–2” test or “1–2” test. We can see the RMES values of raw heading (got from accelorometer and magnetometer) are , , and , easy to find the RMSE values of the “Improved” algorithm, “Kalman filter” and “First-order CF” are all smaller. As for STD values, the situation of kinematic test is nearly same as static test, the three solutions reduce approximately 25∼35%. In general, the kinematic test results, whether STD or RMES, are larger than the static test results, which is reasonable, because there is usually large jitter during walking, which is more likely to produce much more errors.
We find no matter “First-order CF” “Kalman filter” or “Improved” algorithm, their heading estimation precision are all improved in some extent. In whole, compared with “First-order CF” and “Kalman filter”, the result of “Improved” is stable and has smaller fluctuation. As for heading estimation accuracy and system error, from our tests, we find they depend on several factors, such as the effect of cumulative gyroscope error, instability of accelerometer and magnetometer, test environment temperature fluctuation; so, from the algorithmic point of view, the improvement is limited. In this study, firstly, we use the proposed improved fusion algorithm to estimate smart phone heading in real time. While although heading precision is improved in a certain extent by the fusion model; when pedestrian walking, smart phone keeps swinging continuously, in addition, external environment interference, all of these will make smart phone produce big heading error. Thus, in our strategy, we also attempt to use beacon signal in recognizing pedestrian orientation to calibrate heading bias and compensate smart phone systematic heading error.
4.2. Discussion of Navigation Test
In validation section, we present two navigation experiments, one use GNSS + PDR + beacon scheme to verify the positioning capability and stability of our algorithm, the other one only use GNSS + PDR, in Figure 12 and Figure 15 we present the real-time navigation results and some comparison strategies, from these figures, we can see blue line shows better navigation capability; in following section, we will present some statistics about the two tests.
The CDF statistical graphs in Figure 16 show that in Portland and Shanghai Streets, our fused scheme obtains 80% positioning error below 15 m, whereas the internal GNSS positioning error is no more than 20% below 15 m. Meanwhile, in Argyle and Shandong Streets, our fused scheme improves to 80% below 10 m, whereas the internal GNSS positioning error is only 30% below 10 m. In addition, for further validation, a test without any beacon assistance was performed, Figure 17 presents the precision comparison graph.
We also calculated the positioning errors of different strategies and presented the statistical information. Figure 17 shows the CDF graph of the positioning error. From the figure, the fused solution improves the 10 m positioning error from 38% to nearly 60% and the 20 m positioning error from 55% to 80%.
From the above figures, Figure 16 and Figure 17, we can find that if GNSS + PDR + beacon scheme is used, the positioning precision of 20 m can reach 80%, the other one solution is without beacon, 20 m’ positioning precision is reduced to 60%. In addition, the maximum positioning error even exceeds 40 m. Based on the above description, we can see that beacon is useful in our scheme, GNSS + PDR + beacon fusion solution is better than GNSS + PDR. Both schemes GNSS + PDR + beacon and GNSS + PDR improve the capability and precision of pedestrian navigation to some extent.
5. Conclusions
An improved pedestrian navigation scheme is proposed in this study. The proposed navigation solution utilizes smart phone internal GNSS raw measurements (namely, pseudorange, carrier phase and NMEA messages), internal MEMS sensor measurements (including gyroscope, accelerometer, magnetometer and barometer) and external data sources (that is, beacons) to construct a comprehensive positioning solution. On the basis of the particular advantages of these positioning techniques and algorithms, we design an improved heading algorithm that uses gyroscope, accelerometer and magnetometer measurements comprehensively to reduce sensor cumulative errors and improve heading precision and stability. We classify the beacons into weak, middle and strong and design related algorithms for positioning and heading calibration on the basis of the beacon characteristics. Our fusion solution combines different heading types and reduces smart phone drift. In comparison with INS mechanization, we used a better solution by combining the PDR algorithm with beacon and GNSS/DGNSS positioning results, thereby obtaining a better fusion location. Moreover, on the basis of the traditional step length estimation method, we use a weak beacon to correct the step length and improve step length estimation accuracy. The entire system fully utilises PDR short-time stability and the advantages of GNSS and beacons to fuse an improved solution for long-time navigation. In the fusion procedure, we design algorithms to exclude large jumps in GNSS and adjust the weight when combining beacon and PDR information. In our fusion model, we also add moved distance scale factor as an estimation parameter, which should make our method more reasonable compared with those in previous studies. The improvements of the scheme make the pedestrian navigation system generally stable. In sum, we developed our algorithms as a real application, validated the improved heading solution, verified its positioning capability. Static and kinematic heading tests were executed in the two reference directions, they showed the superiority of improved solution. Field navigation tests were performed in Mong Kok and Waichai, which are typical urban canyon areas of Hong Kong. The two cases showed the improvements of the fusion navigation scheme and the positioning accuracy was improved. In the second test, although no beacons were used, our solution also reduced the positioning error evidently in the test routes of more than 1600 m.
Author Contributions
J.Y. wrote the manuscript and performed experiments; Y.L. helped develop the application; H.L. and J.W. participated in evaluating algorithms and field tests; W.C. proposed the fusion methodology; Q.Z. supervised the writing and review of the manuscript.
Funding
This research was funded by Chang’an University (Xi’an, China) through the project of Natural Science Foundation of China (No.: 41731066) and the project of National Key Research and Development Program of China (2018YFC1505100).
Acknowledgments
The authors would like to thank The Lands Departments of The Government of the Hong Kong Special Administrative Region of the People’s Republic of China for providing the coordinates of lamp posts from the website https://www.landsd.gov.hk/. In addition, thanks the website http://www.magnetic-declination.com/ provides the magnetic declination.
Conflicts of Interest
The authors declare no conflict of interest.
Abbreviations
The following abbreviations are used in this paper:
| LOT | Location of Things |
| GNSS | Global Navigation Satellite System |
| DGPS | Differential Global Positioning System |
| MEMS | Micro-electromechanical System Sensor |
| PDR | Pedestrian Dead Reckon |
| EKF | Extended Kalman Filter |
| PDOP | Position Dilution of Precision |
| VDOP | Vertical Dilution of Precision |
| HDOP | Horizontal Dilution of Precision |
| FFT | Fast Fourier Transform |
| RSSI | Radio Signal Strength Indication |
| 3D | Three-dimensional |
| LOS | Line-of-sight |
| NLOS | Non-line-of-sight |
| IGRF | International Geomagnetic Reference Field |
| NMEA | National Marine Electronics Association |
| SNR | Signal to Noise Ratio |
| UWB | Ultra Wideband |
| UKF | Unscented Kalman Filter |
| INS | Inertial Navigation System |
| PF | Particle Filter |
| API | Application Programming Interface |
| WGS84 | World Geodetic System 1984 |
| STD | Standard Deviation |
| RMSE | Root Mean Squared Error |
| RTK | Real-time Kinematic |
References
- Chen, R.; Chen, W.; Chen, X.; Zhang, X.; Chen, Y. Sensing strides using EMG signal for pedestrian navigation. GPS Solut. 2011, 15, 161–170. [Google Scholar] [CrossRef]
- Li, X.; Wang, J.; Liu, C. A Bluetooth/PDR Integration Algorithm for an Indoor Positioning System. Sensors 2015, 15, 24862–24885. [Google Scholar] [CrossRef] [PubMed] [Green Version]
- Sabatini, A.M. Kalman-filter-based orientation determination using inertial/magnetic sensors: Observability analysis and performance evaluation. Sensors 2011, 11, 9182–9206. [Google Scholar] [CrossRef]
- Zhang, S.; Yu, S.; Liu, C.; Yuan, X.; Liu, S. A Dual-Linear Kalman Filter for Real-Time Orientation Determination System Using Low-Cost MEMS Sensors. Sensors 2016, 16, 264. [Google Scholar] [CrossRef] [PubMed]
- Bergamini, E.; Ligorio, G.; Summa, A.; Vannozzi, G.; Cappozzo, A.; Sabatini, A. Estimating orientation using magnetic and inertial sensors and different sensor fusion approaches: accuracy assessment in manual and locomotion tasks. Sensors 2014, 14, 18625–18649. [Google Scholar] [CrossRef] [PubMed]
- Kang, X.; Huang, B.; Qi, G. A Novel Walking Detection and Step Counting Algorithm Using Unconstrained Smartphones. Sensors 2018, 18, 297. [Google Scholar] [CrossRef] [PubMed]
- Ilkovičová, L.; Kajánek, P.; Kopáčik, A. Pedestrian indoor positioning and tracking using smartphone sensors, step detection and map matching algorithm. In Proceedings of the International Symposium on Engineering Geodesy, Varaždin, Croatia, 20–22 May 2016; Volume 70, pp. 1–24. [Google Scholar]
- Zhao, Q.; Zhang, B.; Wang, J.; Feng, W.; Jia, W.; Sun, M. Improved method of step length estimation based on inverted pendulum model. Int. J. Distrib. Sens. Netw. 2017, 13. [Google Scholar] [CrossRef]
- Martino, L.; Read, J.; Elvira, V.; Louzada, F. Cooperative Parallel Particle Filters for on-Line Model Selection and Applications to Urban Mobility. Digit. Signal Process. 2017, 60, 172–185. [Google Scholar] [CrossRef]
- Mihaylova, L.; Angelova, D.; Honary, S.; Bull, D.R.; Canagarajah, C.N.; Ristic, B. Mobility Tracking in Cellular Networks Using Particle Filtering. IEEE Trans. Wirel. Commun. 2007, 6, 3589–3599. [Google Scholar] [CrossRef] [Green Version]
- Wang, Y.; Yang, X.; Zhao, Y.; Liu, Y.; Cuthbert, L. Bluetooth positioning using RSSI and triangulation methods. In Proceedings of the 2013 IEEE 10th Consumer Communications and Networking Conference (CCNC), Las Vegas, NV, USA, 11–14 January 2013; pp. 837–842. [Google Scholar]
- Kleeman, L. Optimal estimation of position and heading for mobile robots using ultrasonic Beacons and dead-reckoning. In Proceedings of the 1992 IEEE International Conference on Robotics and Automation, Nice, France, 12–14 May 1992; Volume 3, pp. 2582–2587. [Google Scholar]
- Viswanathan, S.; Srinivasan, S. Improved path loss prediction model for short range indoor positioning using bluetooth low energy. In Proceedings of the 2015 IEEE Sensors, Busan, Korea, 1–4 November 2015; pp. 1–4. [Google Scholar] [CrossRef]
- Wang, L.; Groves, P.D.; Ziebart, M.K. Smartphone Shadow Matching for Better Cross-street GNSS Positioning in Urban Environments. J. Navig. 2014, 68, 411–433. [Google Scholar] [CrossRef] [Green Version]
- Gowdayyanadoddi, N.S.; Curran, J.T.; Broumandan, A.; Lachapelle, G. A Ray-Tracing Technique to Characterize GPS Multipath in the Frequency Domain. Int. J. Navig. Obs. 2015, 2015, 983124. [Google Scholar] [CrossRef]
- Zhuang, Y.; Lan, H.; Li, Y.; El-Sheimy, N. PDR/INS/WiFi Integration Based on Handheld Devices for Indoor Pedestrian Navigation. Micromachines 2015, 6, 793–812. [Google Scholar] [CrossRef] [Green Version]
- Li, X.; Wei, D.; Lai, Q.; Xu, Y.; Yuan, H. Smartphone-based integrated PDR/GPS/Bluetooth pedestrian location. Adv. Space Res. 2017, 59, 877–887. [Google Scholar] [CrossRef]
- Li, W.W.; Iltis, R.A.; Win, M.Z. A smartphone localization algorithm using RSSI and inertial sensor measurement fusion. In Proceedings of the 2013 IEEE Global Communications Conference (GLOBECOM), Atlanta, GA, USA, 9–13 December 2013; pp. 3335–3340. [Google Scholar]
- Zhuang, Y.; Yang, J.; Li, Y.; Qi, L.; El-Sheimy, N. Smartphone-Based Indoor Localization with Bluetooth Low Energy Beacons. Sensors 2016, 16, 596. [Google Scholar] [CrossRef] [PubMed]
- Li, Y.; Zhuang, Y.; Lan, H.; Zhou, Q.; Niu, X.; El-Sheimy, N. A Hybrid WiFi/Magnetic Matching/PDR Approach for Indoor Navigation With Smartphone Sensors. IEEE Commun. Lett. 2016, 20, 169–172. [Google Scholar] [CrossRef]
- Sun, S.-L.; Deng, Z.-L. Multi-sensor optimal information fusion Kalman filter. Automatica 2004, 40, 1017–1023. [Google Scholar] [CrossRef]
- Ali, A.; Siddharth, S.; Syed, Z.; El-Sheimy, N. An improved personal dead-reckoning algorithm for dynamically changing smartphone user modes. In Proceedings of the 25th International Technical Meeting of the Satellite Division of the Institute of Navigation (ION GNSS 2012), Nashville, TN, USA, 17–21 September 2012. [Google Scholar]
- Masiero, A.; Guarnieri, A.; Pirotti, F.; Vettore, A. A Particle Filter for Smartphone-Based Indoor Pedestrian Navigation. Micromachines 2014, 5, 1012–1033. [Google Scholar] [CrossRef] [Green Version]
- Renaudin, V.; Susi, M.; Lachapelle, G. Step Length Estimation Using Handheld Inertial Sensors. Sensors 2012, 12, 8507–8525. [Google Scholar] [CrossRef]
- Shin, S.H.; Park, C.G.; Kim, J.W.; Hong, H.S.; Lee, J.M. Adaptive step length estimation algorithm using low-cost MEMS inertial sensors. In Proceedings of the Sensors Applications Symposium, San Diego, CA, USA, 6–8 February 2007. [Google Scholar]
- Chen, R.; Chu, T.; Liu, K.; Liu, J.; Chen, Y. Inferring Human Activity in Mobile Devices by Computing Multiple Contexts. Sensors 2015, 15, 21219–21238. [Google Scholar] [CrossRef] [Green Version]
- Lachapelle, G. Pedestrian navigation with high sensitivity GPS receivers and MEMS. Pers. Ubiquitous Comput. 2016, 11, 481–488. [Google Scholar] [CrossRef]
- Yang, F.; Xiong, J.; Liu, J.; Wang, C.; Li, Z.; Tong, P.; Chen, R. A Pairwise SSD Fingerprinting Method of Smartphone Indoor Localization for Enhanced Usability. Remote Sens. 2019, 11, 566. [Google Scholar] [CrossRef]
- Deng, Z.A.; Wang, G.; Hu, Y.; Wu, D. Heading Estimation for Indoor Pedestrian Navigation Using a Smartphone in the Pocket. Sensors 2015, 15, 21518–21536. [Google Scholar] [CrossRef] [PubMed]
- Kang, W.; Nam, S.; Han, Y.; Lee, S. Improved heading estimation for smartphone-based indoor positioning systems. In Proceedings of the Personal Indoor and Mobile Radio Communications (PIMRC), Sydney, Australia, 9–12 September 2012; pp. 2449–2453. [Google Scholar]
- Afzal, M.H.; Renaudin, V.; Lachapelle, G. Magnetic field based heading estimation for pedestrian navigation environments. In Proceedings of the 2011 International Conference on Indoor Positioning and Indoor Navigation, Guimaraes, Portugal, 21–23 September 2011; pp. 1–10. [Google Scholar]
- Yuan, X.; Yu, S.; Zhang, S.; Wang, G.; Liu, S. Quaternion-based unscented Kalman filter for accurate indoor heading estimation using wearable multi-sensor system. Sensors 2015, 15, 10872–10890. [Google Scholar] [CrossRef] [PubMed]
- Xie, L.; Yeng, C.S.; de Souza, C.E. Robust Kalman filtering for uncertain discrete-time systems. IEEE Trans. Autom. Control 1994, 39, 1310–1314. [Google Scholar]
- Tian, Z.; Zhang, Y.; Zhou, M.; Liu, Y. Pedestrian dead reckoning for MARG navigation using a smartphone. EURASIP J. Adv. Signal Process. 2014, 2014, 65. [Google Scholar] [CrossRef] [Green Version]
- Li, Y.; Zahran, S.; Zhuang, Y.; Gao, Z.; Luo, Y.; He, Z.; Pei, L.; Chen, R.; El-Sheimy, N. IMU/Magnetometer/Barometer/Mass-Flow Sensor Integrated Indoor Quadrotor UAV Localization with Robust Velocity Updates. Remote Sens. 2019, 11, 838. [Google Scholar] [CrossRef]
- Elloumi, W.; Guissous, K.; Chetouani, A.; Canals, R.; Leconge, R.; Emile, B.; Treuillet, S. Indoor navigation assistance with a Smartphone camera based on vanishing points. In Proceedings of the International Conference on Indoor Positioning and Indoor Navigation, Montbeliard-Belfort, France, 28–31 October 2013; pp. 1–9. [Google Scholar]
- Huang, C.; Liao, Z.; Zhao, L. Synergism of INS and PDR in self-contained pedestrian tracking with a miniature sensor module. IEEE Sens. J. 2010, 10, 1349–1359. [Google Scholar] [CrossRef]
- Gui, P.; Tang, L.; Mukhopadhyay, S. MEMS based IMU for tilting measurement: comparison of complementary and kalman filter based data fusion. In Proceedings of the 2015 10th IEEE Conference on Industrial Electronics and Applications (ICIEA 2015), Auckland, New Zealand, 15–17 June 2015; Institute of Electrical and Electronics Engineers (IEEE): Piscataway, NJ, USA, 2015; pp. 2004–2009. [Google Scholar]
- Yang, Y.; Huang, B.; Yang, R. An Energy Efficient Pedestrian Heading Estimation Algorithm using Smartphones. In Proceedings of the 2019 IEEE 43rd Annual Computer Software and Applications Conference (COMPSAC), Milwaukee, WI, USA, 15–19 July 2019; pp. 676–684. [Google Scholar]
- Stirling, R.; Fyfe, K.; Lachapelle, G. Evaluation of a New Method of Heading Estimation for Pedestrian Dead Reckoning Using Shoe Mounted Sensors. J. Navig. 2005, 58, 31–45. [Google Scholar] [CrossRef] [Green Version]
- Renaudin, V.; Combettes, C. Magnetic, Acceleration Fields and Gyroscope Quaternion (MAGYQ)-based attitude estimation with smartphone sensors for indoor pedestrian navigation. Sensors 2014, 14, 22864–22890. [Google Scholar] [CrossRef]
- Raza, M.; Chen, Z.; Rehman, S.U.; Wang, P.; Bao, P. Appearance based pedestrians’ head pose and body orientation estimation using deep learning. Neurocomputing 2018, 272, 647–659. [Google Scholar] [CrossRef]
Figure 1.
Three-axis accelerometer measurements. The black and green lines denote the accelerometer measurement time series in the X- and Y-directions, respectively; and the red line represents the accelerometer measurement in the Z-axis. The blue line indicates the comprehensive time series of the three axes, which is calculated using Formula (2).

Figure 2.
Step length adjustment strategy using a weak beacon. The pedestrian walks from weak beacon A (step number is W) to B (step number is M) and C (step number is N). From A to B, the pedestrian walks along the black line; from B to C, the pedestrian walks along the red line.
Figure 2.
Step length adjustment strategy using a weak beacon. The pedestrian walks from weak beacon A (step number is W) to B (step number is M) and C (step number is N). From A to B, the pedestrian walks along the black line; from B to C, the pedestrian walks along the red line.

Figure 3.
Beacon (strong, middle and weak) installation strategy and signal transmitting ranges. The three types of beacon are installed on each site.
Figure 3.
Beacon (strong, middle and weak) installation strategy and signal transmitting ranges. The three types of beacon are installed on each site.

Figure 4.
Received RSSI change situation. The blue, red and green lines denote the RSSI of the weak, strong and middle beacons, respectively. The signal is received by a smart phone and a pedestrian goes across the three sites. Each site is installed with one weak, one middle and one strong beacon.
Figure 4.
Received RSSI change situation. The blue, red and green lines denote the RSSI of the weak, strong and middle beacons, respectively. The signal is received by a smart phone and a pedestrian goes across the three sites. Each site is installed with one weak, one middle and one strong beacon.

Figure 5.
Workflow of the proposed multisensor fusion strategy based on Android smart phones.

Figure 6.
Left picture shows we measure the control point by RTK, the central picture presents the smart phone static test, the right picture shows the tester holds the smart phone in kinematic test.
Figure 6.
Left picture shows we measure the control point by RTK, the central picture presents the smart phone static test, the right picture shows the tester holds the smart phone in kinematic test.

Figure 7.
The four graphs show test results along the straight line 1−2; the cyan line denotes raw smart phone heading computed from accelerometer and magnetometer measurements; green, red and blue lines represent the smart phone heading processed by Kalman filter, first-order complementary filter, improved MEMS algorithm separately. (a) is Huawei Mate20 static test result, (b) is kinematic result. (c,d) are static and kinematic results of Huawei AL10 respectively.

Figure 8.
The four graphs show test results along the straight line 3–2; the cyan line denotes raw smart phone heading computed from accelerometer and magnetometer measurements; green, red and blue lines represent the smart phone heading processed by Kalman filter, First-order Complementary, improved MEMS algorithm separately. (a) is Huawei Mate20 static test result, (b) is kinematic result. (c,d) are static and kinematic results of Huawei AL10 respectively.

Figure 9.
(a) Test location and field surrounding environment. (b) Narrow test street with both sides filled with tall buildings. (c) Group of beacons installed on a lamp post. (d) Graph showing the tester hold the test phone P20.
Figure 9.
(a) Test location and field surrounding environment. (b) Narrow test street with both sides filled with tall buildings. (c) Group of beacons installed on a lamp post. (d) Graph showing the tester hold the test phone P20.

Figure 10.
Lamp post locations (red circles) where the beacons are installed, tester walking route (blue line) and beacon heading (green line). The numbers, such as ‘1339’, denote the code of the lamp post for distinguishing the group code of beacons.
Figure 10.
Lamp post locations (red circles) where the beacons are installed, tester walking route (blue line) and beacon heading (green line). The numbers, such as ‘1339’, denote the code of the lamp post for distinguishing the group code of beacons.

Figure 11.
(a) GNSS precision of smart phone reported by Android API. (b) Satellite number obtained from NMEA. (c) DOP information obtained from NMEA messages (blue, red and cyan denote PDOP, HDOP and VDOP, respectively).
Figure 11.
(a) GNSS precision of smart phone reported by Android API. (b) Satellite number obtained from NMEA. (c) DOP information obtained from NMEA messages (blue, red and cyan denote PDOP, HDOP and VDOP, respectively).

Figure 12.
The green, blue, gray and red lines represent the smart phone outputted GNSS position, the fused navigation position, the actual tester walking route and the connection of all installed beacon positions, respectively. The blue marker expresses the real-time navigation position using the hybrid positioning strategy.

Figure 13.
Test surrounding environment in Mong Kok (left) and Waichai (right).

Figure 14.
Smart phone internal GNSS observation information obtained from NMEA messages. The first graph shows the SNR values of satellites, the second graph shows the tracked satellite number of the smart phone and the third graph shows the HDOP series.
Figure 14.
Smart phone internal GNSS observation information obtained from NMEA messages. The first graph shows the SNR values of satellites, the second graph shows the tracked satellite number of the smart phone and the third graph shows the HDOP series.

Figure 15.
Field navigation test results in (a) Waichai and (b) Mong Kok. The black, blue, red and green lines represent the actual pedestrian walking route, the fused navigation position, pure PDR positions and the trajectory obtained from the smart phone internal GNSS positions, respectively. The blue marker denotes the real-time navigation location of the tester using the fused navigation algorithm.

Figure 16.
Cumulative distribution function (CDF) graph of the positioning error in (a) Portland and Shanghai Streets and (b) Argyle and Shandong Streets. The red and blue lines denote the smart phone internal GNSS and fused position, respectively.
Figure 16.
Cumulative distribution function (CDF) graph of the positioning error in (a) Portland and Shanghai Streets and (b) Argyle and Shandong Streets. The red and blue lines denote the smart phone internal GNSS and fused position, respectively.

Figure 17.
CDF graph of the positioning error. The green, red and blue lines denote the PDR result, the smart phone internal GNSS result and the fused strategy positioning result, respectively.
Figure 17.
CDF graph of the positioning error. The green, red and blue lines denote the PDR result, the smart phone internal GNSS result and the fused strategy positioning result, respectively.


Table 1.
Step length algorithms in previous studies.
| Formula | Parameters | Reference |
|---|---|---|
| H is the height and k is equals to 0.415 for male and 0.413. | Pratama | |
| and represents the maximum and minimum vertical acceleration values in a single stride, k is a constant model parameter. | Weinberg | |
| H and represents the height of the subject and step frequency and k is a model parameter that is tuned to 0.3139 for male and 0.2975 for female. | Tian | |
| is the acceleration measured on a sample in a single step and N is the number of samples corresponding to each step. | Kim | |
| and represents the step length and step frequency H is the height of the pedestrian which is manually inserted in this step model, a, b and c are model parameters for each person and can be calibrated by pre-training. | Ruizhi Chen | |
| h and represents the pedestrian height and step frequency a, b and c are pre-trained parameters. | Valerie Renaudin |
Table 2.
Related information of the hardware and software, Android smart phone and beacon application for the Mong Kok test.
Table 2.
Related information of the hardware and software, Android smart phone and beacon application for the Mong Kok test.
| Application | Beacon | Smart Phone (Huawei P20) |
|---|---|---|
 |  |  |
| Map: | Communication way: BLE 4.0 | Sensors: |
| Google Maps | Broadcast power: −30~−40 dBm | Gravity sensor |
| Operating system: | Ambient light sensor | Proximity sensor |
| Android | Broadcast Frequency: 100~10,000 ms | Front fingerprint sensor |
| Installed version: | Transmitting distance: 3~100 m | Hall sensor |
| >Android OS 4.3 | Supporting OS: | Gyroscope |
| Above iOS 7.0 and Android 4.3 | Compass | |
| Brand: Zhishi | Color temperature sensor | |
| GNSS: GPS, GLONASS and Beidou | ||
| Chip: | ||
| Huawei Kirin 970 CPU octa core | ||
| 4 × Cortex A73 2.36 GHz | ||
| 4 × Cortex A53 1.8 GHz | ||
| Memory: | ||
| GB RAM + 128 GB ROM | ||
| Operating system: Android™ 8.1 |
Table 3.
Beacon heading library for Mong Kok test.
| Start Lamp Post ID | End Lamp Post ID | Azimuth (deg) |
|---|---|---|
| 1339 | 1340 | 168.707 |
| 1340 | 1339 | 348.707 |
| 1340 | 1341 | 168.707 |
| 1341 | 1340 | 348.707 |
| 1341 | 1342 | 168.707 |
| 1342 | 1341 | 348.707 |
| 1342 | 1343 | 168.707 |
| 1343 | 1342 | 348.707 |
| 1343 | 1344 | 168.707 |
| 1344 | 1343 | 348.707 |
| 1350 | 1351 | 169.311 |
| 1351 | 1350 | 349.311 |
| 1351 | 1352 | 169.311 |
| 1352 | 1351 | 349.311 |
| 1353 | 1354 | 169.311 |
| 1354 | 1353 | 349.311 |
| 1350 | 1349 | 78.835 |
| 1349 | 1350 | 258.853 |
Table 4.
Heading statistical results of smart phone static test (Unit: deg).
| Test_Phone | Algorithm | 3–2 (−11.5) | 1–2 (87.97) | ||||
|---|---|---|---|---|---|---|---|
| Mean Bias | RMSE | STD | Mean Bias | RMSE | STD | ||
| AL10 | Improved | 6.11 | 6.14 | 0.59 | 3.16 | 3.19 | 0.46 |
| MagAccOrientation | 5.69 | 5.75 | 0.81 | 2.77 | 2.90 | 0.86 | |
| First-Order CF | 5.70 | 5.75 | 0.72 | 2.81 | 3.02 | 1.12 | |
| Kalman filter | 5.69 | 5.73 | 0.70 | 2.73 | 3.24 | 1.74 | |
| Mate20 | Improved | 3.26 | 3.34 | 0.73 | −2.27 | 2.28 | 0.25 |
| MagAccOrientation | 3.26 | 3.39 | 0.91 | −2.27 | 2.32 | 0.50 | |
| First-Order CF | 3.26 | 3.36 | 0.80 | −2.29 | 2.44 | 0.85 | |
| Kalman filter | 3.27 | 3.36 | 0.79 | −2.31 | 2.77 | 1.52 | |
Table 5.
Heading statistical results of smart phone kinematic test (Unit: deg).
| Test_Phone | Algorithm | 3–2 (−11.5) | 1–2 (87.97) | ||||
|---|---|---|---|---|---|---|---|
| Mean Bias | RMSE | STD | Mean Bias | RMSE | STD | ||
| AL10 | Improved | 5.97 | 6.82 | 3.48 | 4.72 | 5.65 | 3.11 |
| MagAccOrientation | 5.98 | 7 | 3.81 | 4.23 | 6.71 | 5.21 | |
| First-Order CF | 5.99 | 6.57 | 2.93 | 4.24 | 5.53 | 3.56 | |
| Kalman filter | 6 | 6.49 | 2.73 | 4.19 | 5.4 | 3.41 | |
| Mate20 | Improved | 1.18 | 3.56 | 3.41 | −1.5 | 3.11 | 2.72 |
| MagAccOrientation | 1.17 | 4.77 | 4.67 | −1.44 | 3.96 | 3.68 | |
| First-Order CF | 1.18 | 3.39 | 3.24 | −1.46 | 3.2 | 2.85 | |
| Kalman filter | 1.18 | 3.16 | 3 | −1.48 | 3.22 | 2.86 | |
© 2019 by the authors. Licensee MDPI, Basel, Switzerland. This article is an open access article distributed under the terms and conditions of the Creative Commons Attribution (CC BY) license (http://creativecommons.org/licenses/by/4.0/).
Share and Cite
MDPI and ACS Style
Ye, J.; Li, Y.; Luo, H.; Wang, J.; Chen, W.; Zhang, Q. Hybrid Urban Canyon Pedestrian Navigation Scheme Combined PDR, GNSS and Beacon Based on Smartphone. Remote Sens. 2019, 11, 2174. https://0-doi-org.brum.beds.ac.uk/10.3390/rs11182174
AMA Style
Ye J, Li Y, Luo H, Wang J, Chen W, Zhang Q. Hybrid Urban Canyon Pedestrian Navigation Scheme Combined PDR, GNSS and Beacon Based on Smartphone. Remote Sensing. 2019; 11(18):2174. https://0-doi-org.brum.beds.ac.uk/10.3390/rs11182174
Chicago/Turabian StyleYe, Junhua, Yaxin Li, Huan Luo, Jingxian Wang, Wu Chen, and Qin Zhang. 2019. "Hybrid Urban Canyon Pedestrian Navigation Scheme Combined PDR, GNSS and Beacon Based on Smartphone" Remote Sensing 11, no. 18: 2174. https://0-doi-org.brum.beds.ac.uk/10.3390/rs11182174
Note that from the first issue of 2016, this journal uses article numbers instead of page numbers. See further details here.