Satellite Remote Sensing of Precipitation and the Terrestrial Water Cycle in a Changing Climate


CNR-ISAC, via Gobetti 101, I-40129 Bologna, Italy
*
Author to whom correspondence should be addressed.
Remote Sens. 2019, 11(19), 2301; https://0-doi-org.brum.beds.ac.uk/10.3390/rs11192301
Submission received: 13 September 2019
/
Revised: 27 September 2019
/
Accepted: 30 September 2019
/
Published: 2 October 2019
(This article belongs to the Special Issue Precipitation and Water Cycle Measurements Using Remote Sensing)
Abstract
:The water cycle is the most essential supporting physical mechanism ensuring the existence of life on Earth. Its components encompass the atmosphere, land, and oceans. The cycle is composed of evaporation, evapotranspiration, sublimation, water vapor transport, condensation, precipitation, runoff, infiltration and percolation, groundwater flow, and plant uptake. For a correct closure of the global water cycle, observations are needed of all these processes with a global perspective. In particular, precipitation requires continuous monitoring, as it is the most important component of the cycle, especially under changing climatic conditions. Passive and active sensors on board meteorological and environmental satellites now make reasonably complete data available that allow better measurements of precipitation to be made from space, in order to improve our understanding of the cycle’s acceleration/deceleration under current and projected climate conditions. The article aims to draw an up-to-date picture of the current status of observations of precipitation from space, with an outlook to the near future of the satellite constellation, modeling applications, and water resource management.
1. Introduction
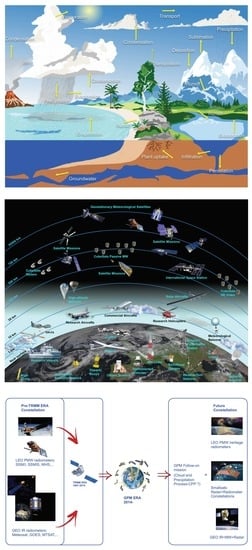
The common description of the water cycle, or hydrological cycle, as consisting of evaporation, condensation, and precipitation is too simple to account for the high degree of complexity of the involved phenomena. Several physical processes contribute significantly to determining the final balance (or local imbalance), such as water vapor transport, sublimation, surface runoff, soil moisture, infiltration, percolation, plant uptake, and groundwater flow [1,2,3], as detailed in Figure 1. Moreover, evaporation happens not only from the surface of water bodies, but also from clouds and falling precipitation. However, another element is completely overlooked in this description: human influence, a key factor which is imposing a change of perspective if we want to quantify water cycle changes in the changing climate of the Anthropocene age [4].
The processes behind the land–atmosphere–ocean system are strictly interconnected so that changes in one will induce changes on, and feedback from, the others [5]. The Intergovernmental Panel on Climate Change (IPCC) aims to quantify changes due to human and/or natural causes. Such a quantification is very complex and calls for adequate observations and modeling, since a complete and satisfactory appraisal of climate change cannot be reached without an in depth understanding of climate variability, which has not yet been comprehensively achieved in spite of the substantial progress made over the past few decades. Global climate drivers have a direct or indirect influence on the balance between incoming solar shortwave radiation (SWR) and outgoing longwave radiation (OLR). Thus, a correct understanding of global climate changes cannot be attained without knowing how energy is distributed and exchanged in the Earth’s atmosphere, ocean, land, and snow surfaces [6,7]. Specifically, it has been suggested that thermodynamics contribute to an increase in global precipitation, with surface warming at a rate of about 1.5% K−1; whether global precipitation will increase at rates closer to 1 or even to 3% K−1 will depend on radiative changes [8].
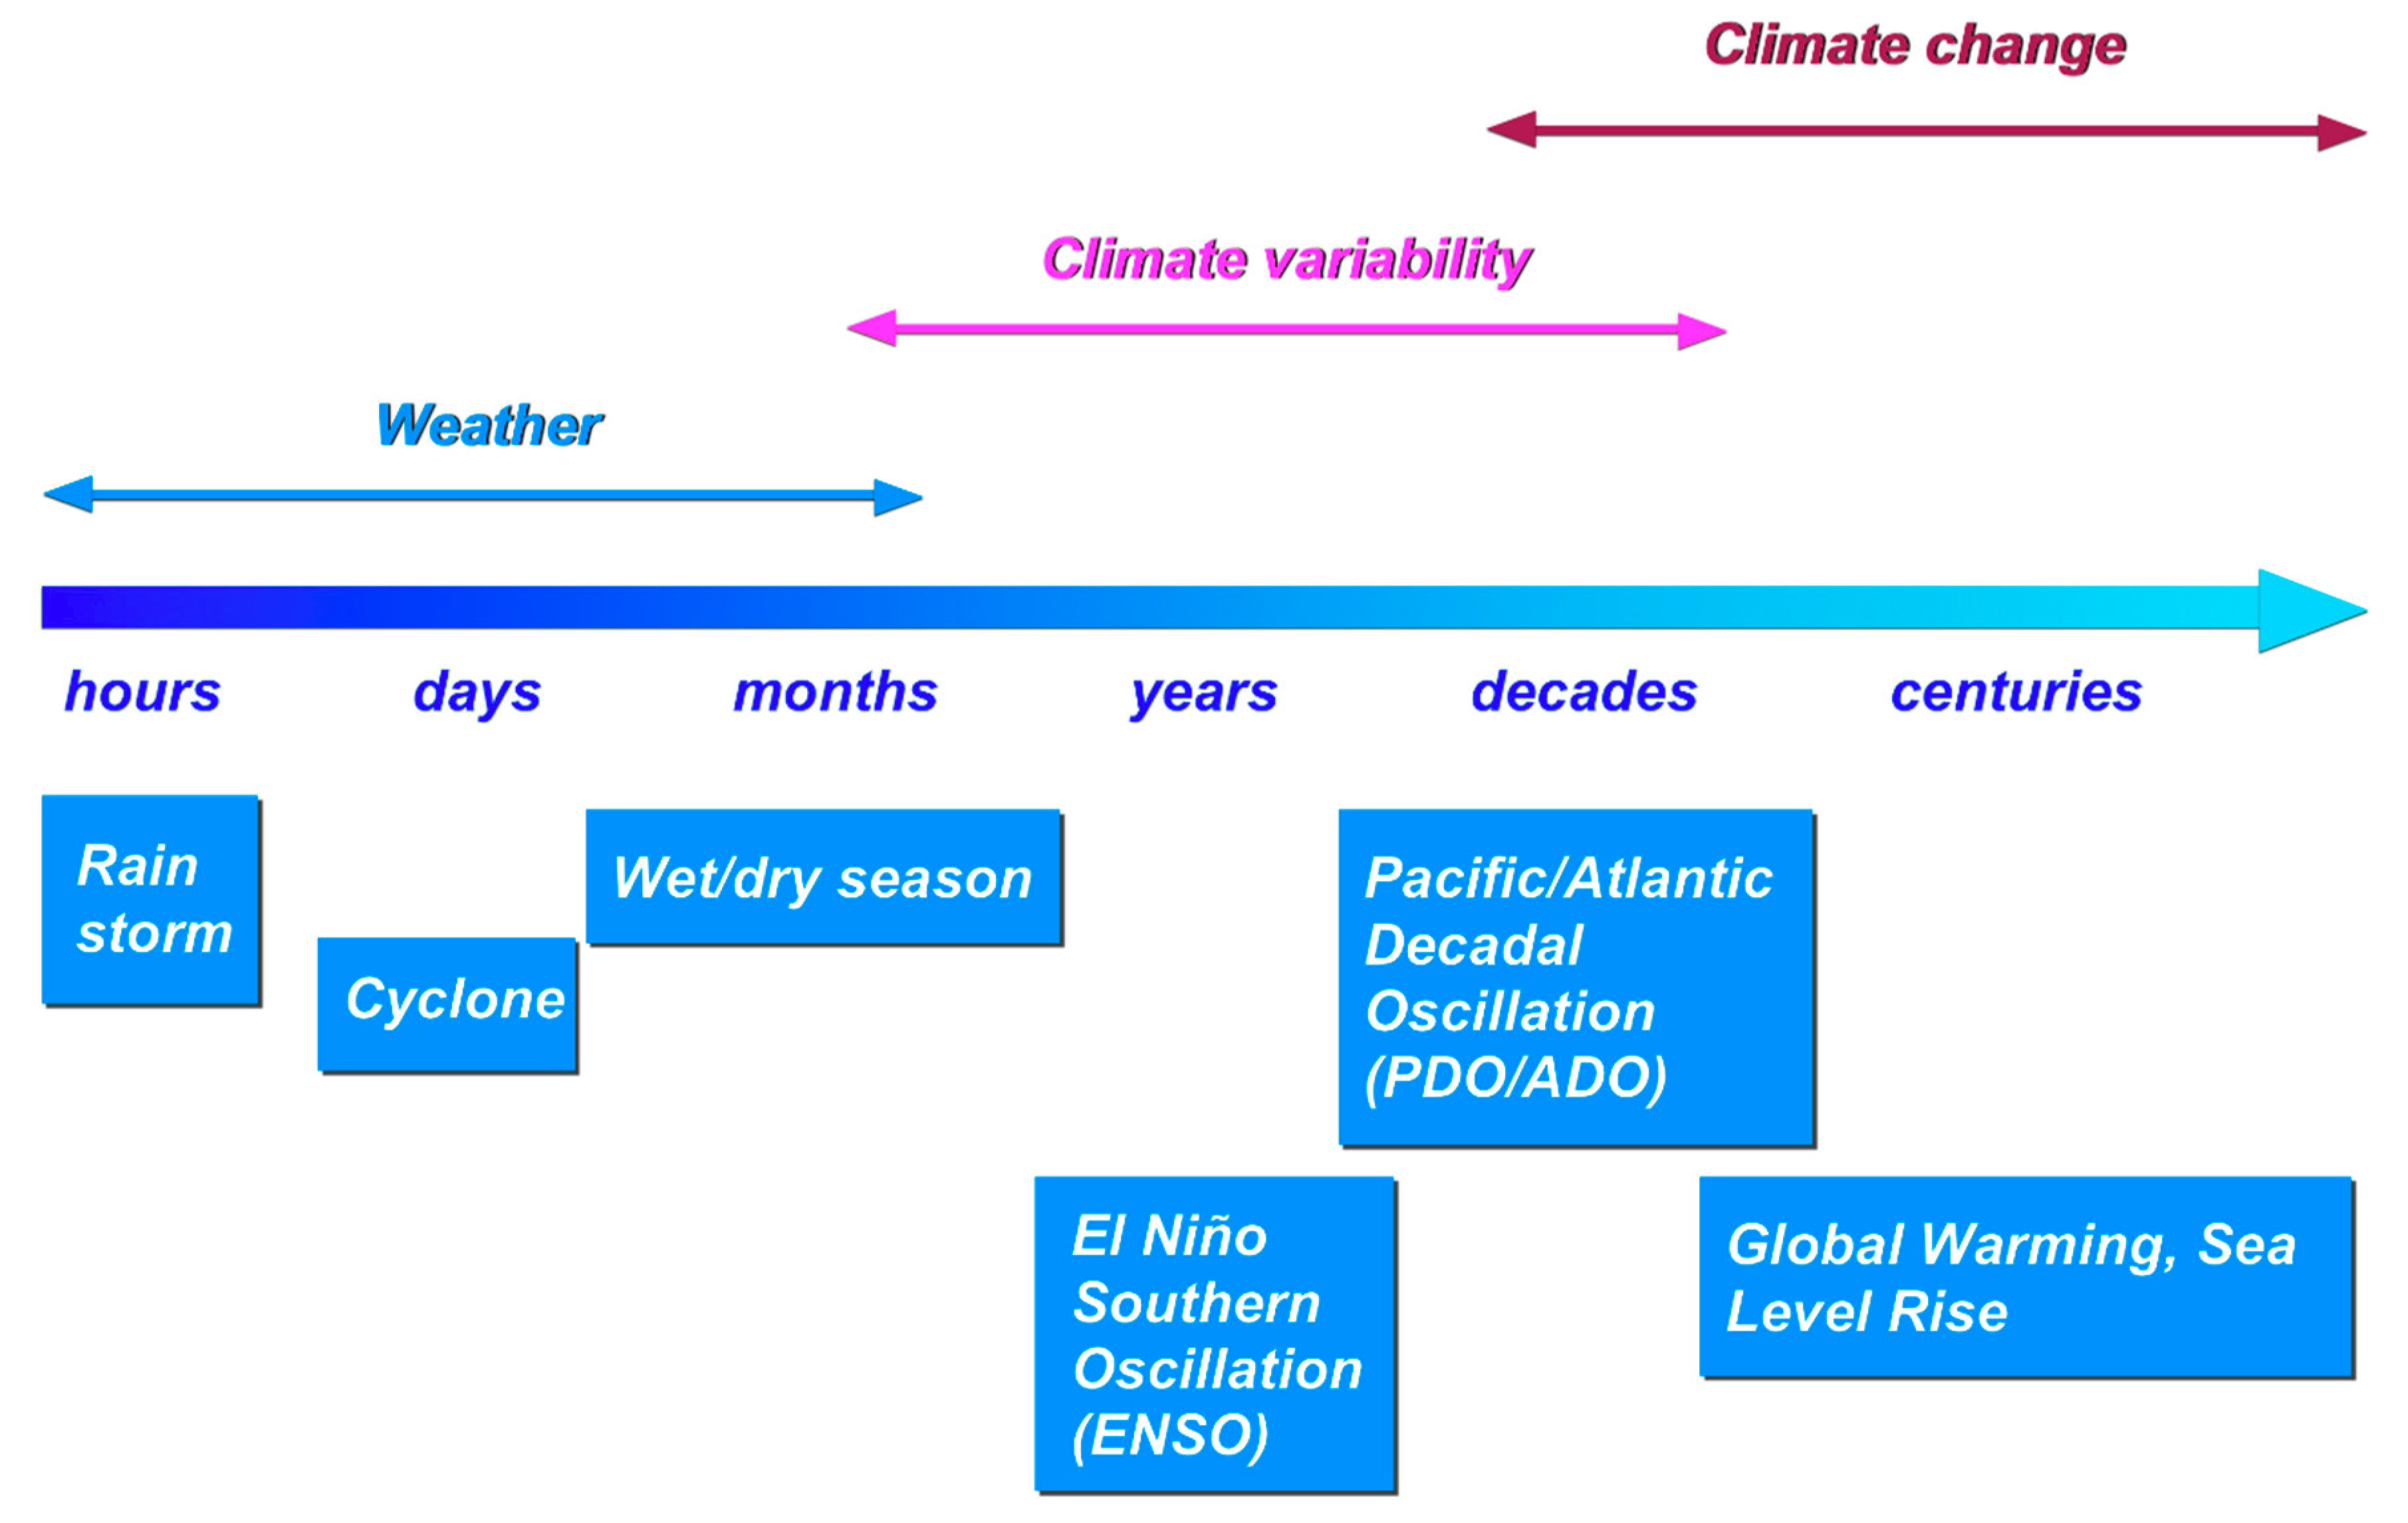
Clouds and precipitation, along with water vapor mass exchanges, play a substantial role in climate variability, at both the global and regional levels. They influence not only climate, but also weather at all scales, and determine water availability. The temporal scales from weather to climate change processes are very wide and encompass a variety of phenomena that are outlined in Figure 2. Aerosol particles released by human activities can also induce the formation of brighter clouds that are less efficient at releasing precipitation, thus leading to a weaker hydrological cycle [9].
Vegetation cover is significantly associated with the partitioning of the water balance. Changes in forest coverage (especially in the tropics) can have short- and long-term effects on this partitioning [10,11]. It seems that shifts from forest to savannah due to decreasing precipitation in the future are more likely to occur in regions with a precursory lower rainfall variability [12]. Moreover, the impacts of forests and forestation on hydrological services are now being recognized as fundamental in areas prone to erosion and floods, as well as those in need of adequate water supply management [13]. Forest and water interactions are now recognized as having potentially positive impacts on the supply and purity of available water resources, on the cross-continental transport of atmospheric moisture, on the cooling of terrestrial surfaces, on infiltration and groundwater recharge, on flood moderation, and on many other processes [14,15]. Terrestrial and aquatic ecosystems are influenced by, and influence, climate in many ways; thus climate change mechanisms may impact ecosystem biodiversity, structure, and function [16]. Note also that the global water cycle may also have played a critical role in the Earth’s history by circulating surface water into the deep mantle and back to the surface again [17].
A redesign of the water planetary boundary is essential if we are to consider how climate and living ecosystems respond to changes in the different forms of water on Earth: atmospheric water, soil moisture, groundwater and frozen water, and surface water [18]. The water cycle is, in reality, a human-water-coupled system, and thus, hydrology is increasingly forced to deal with socio-hydrological emergent issues [19] across different scales and places if it is to devise tools with which to predict the future trajectories of system behavior under changing hydroclimatic and/or socioeconomic conditions [20]. This includes the virtual water concept which was brought about by the globalization of agriculture and trade [21] and the exploitation of the intimate connections between ecohydrological processes and water-related ecosystem services [22]. Recent studies have demonstrated that humans modify the global water cycle, creating a water crisis for billions of individuals and many ecosystems worldwide [4,23]. However, such an influence is mostly absent from current depictions and perceptions.
Major challenges are associated with gathering sufficient knowledge of ecological systems for the identification of extreme ecological responses and the attribution of climate extremes as drivers of extreme ecological responses, defined as extreme climatic events (ECE) [24]. Consequently, modern hydrology is undergoing profound changes, becoming an Earth system science and adopting new holistic approaches, as opposed to the physical, fluid mechanics-based approaches of the past [25]. In fact, as Abbott et al. [4] point out, the fluid dynamics perspective of hydrological sciences adopted till now has generated great understanding, but has failed to protect ecosystems. Hydrological, geomorphological, ecological, and pedological processes, each operating at a different rate, are progressively more investigated to reach this goal. New questions are asked about the urban part of the water cycle [26] and about the role of vegetated land cover and associated ecohydrological processes in moderating the so-called urban dry island and maintaining a stable environment while planning massive urbanization [27]. These issues challenge our modeling capabilities, in view of using model outputs as decision-making tools [28].
Better observations and models are thus required to quantify the water cycle components and determine their changes, in particular accelerations and decelerations at the global and regional scales. In other words, improved observations, models, and data assimilation systems will help to close the scientific gaps in the understanding of water storage in the climate system, fluxes, and spatial-temporal variability [29], and will lead the way to improved hydrological predictions [30]. Modern sensors on satellite platforms are capable of observing some of the components of the water cycle, offering, for the first time, a quantitative picture of the mechanisms that are interlaced and often very complex in nature. Precipitation is one of the climate variables that greatly benefits from satellite observations. It is a fundamental component of the water cycle, and its intensity, duration, frequency, and phase are equally important as the total amounts [31,32]. The response of precipitation characteristics to global warming is a key research topic because of its influence on stress, due to an increase in dry and wet extremes and changes in interannual variability, with consequences on predictability of precipitation events [33]. A better understanding of this response will, in turn, provide feedback to the fundamental behavior of precipitation, especially in the tropics [34], and will help confirm the thermodynamic and dynamic mechanisms for the intensification of the hydrological cycle, which has been suggested by the models [35].
A review of the current status of the remote sensing of precipitation is presented in this paper; it seeks to identify some of the most obvious gaps in view of future satellite missions. Section 2 presents an overview of observations and modeling of the water cycle. Section 3 deals with satellite observations of precipitation. Prominent applications are described in Section 4, and future directions are summarized in Section 5.
2. The Water Cycle
Taking a land surface water balance perspective, the cycle can be described as
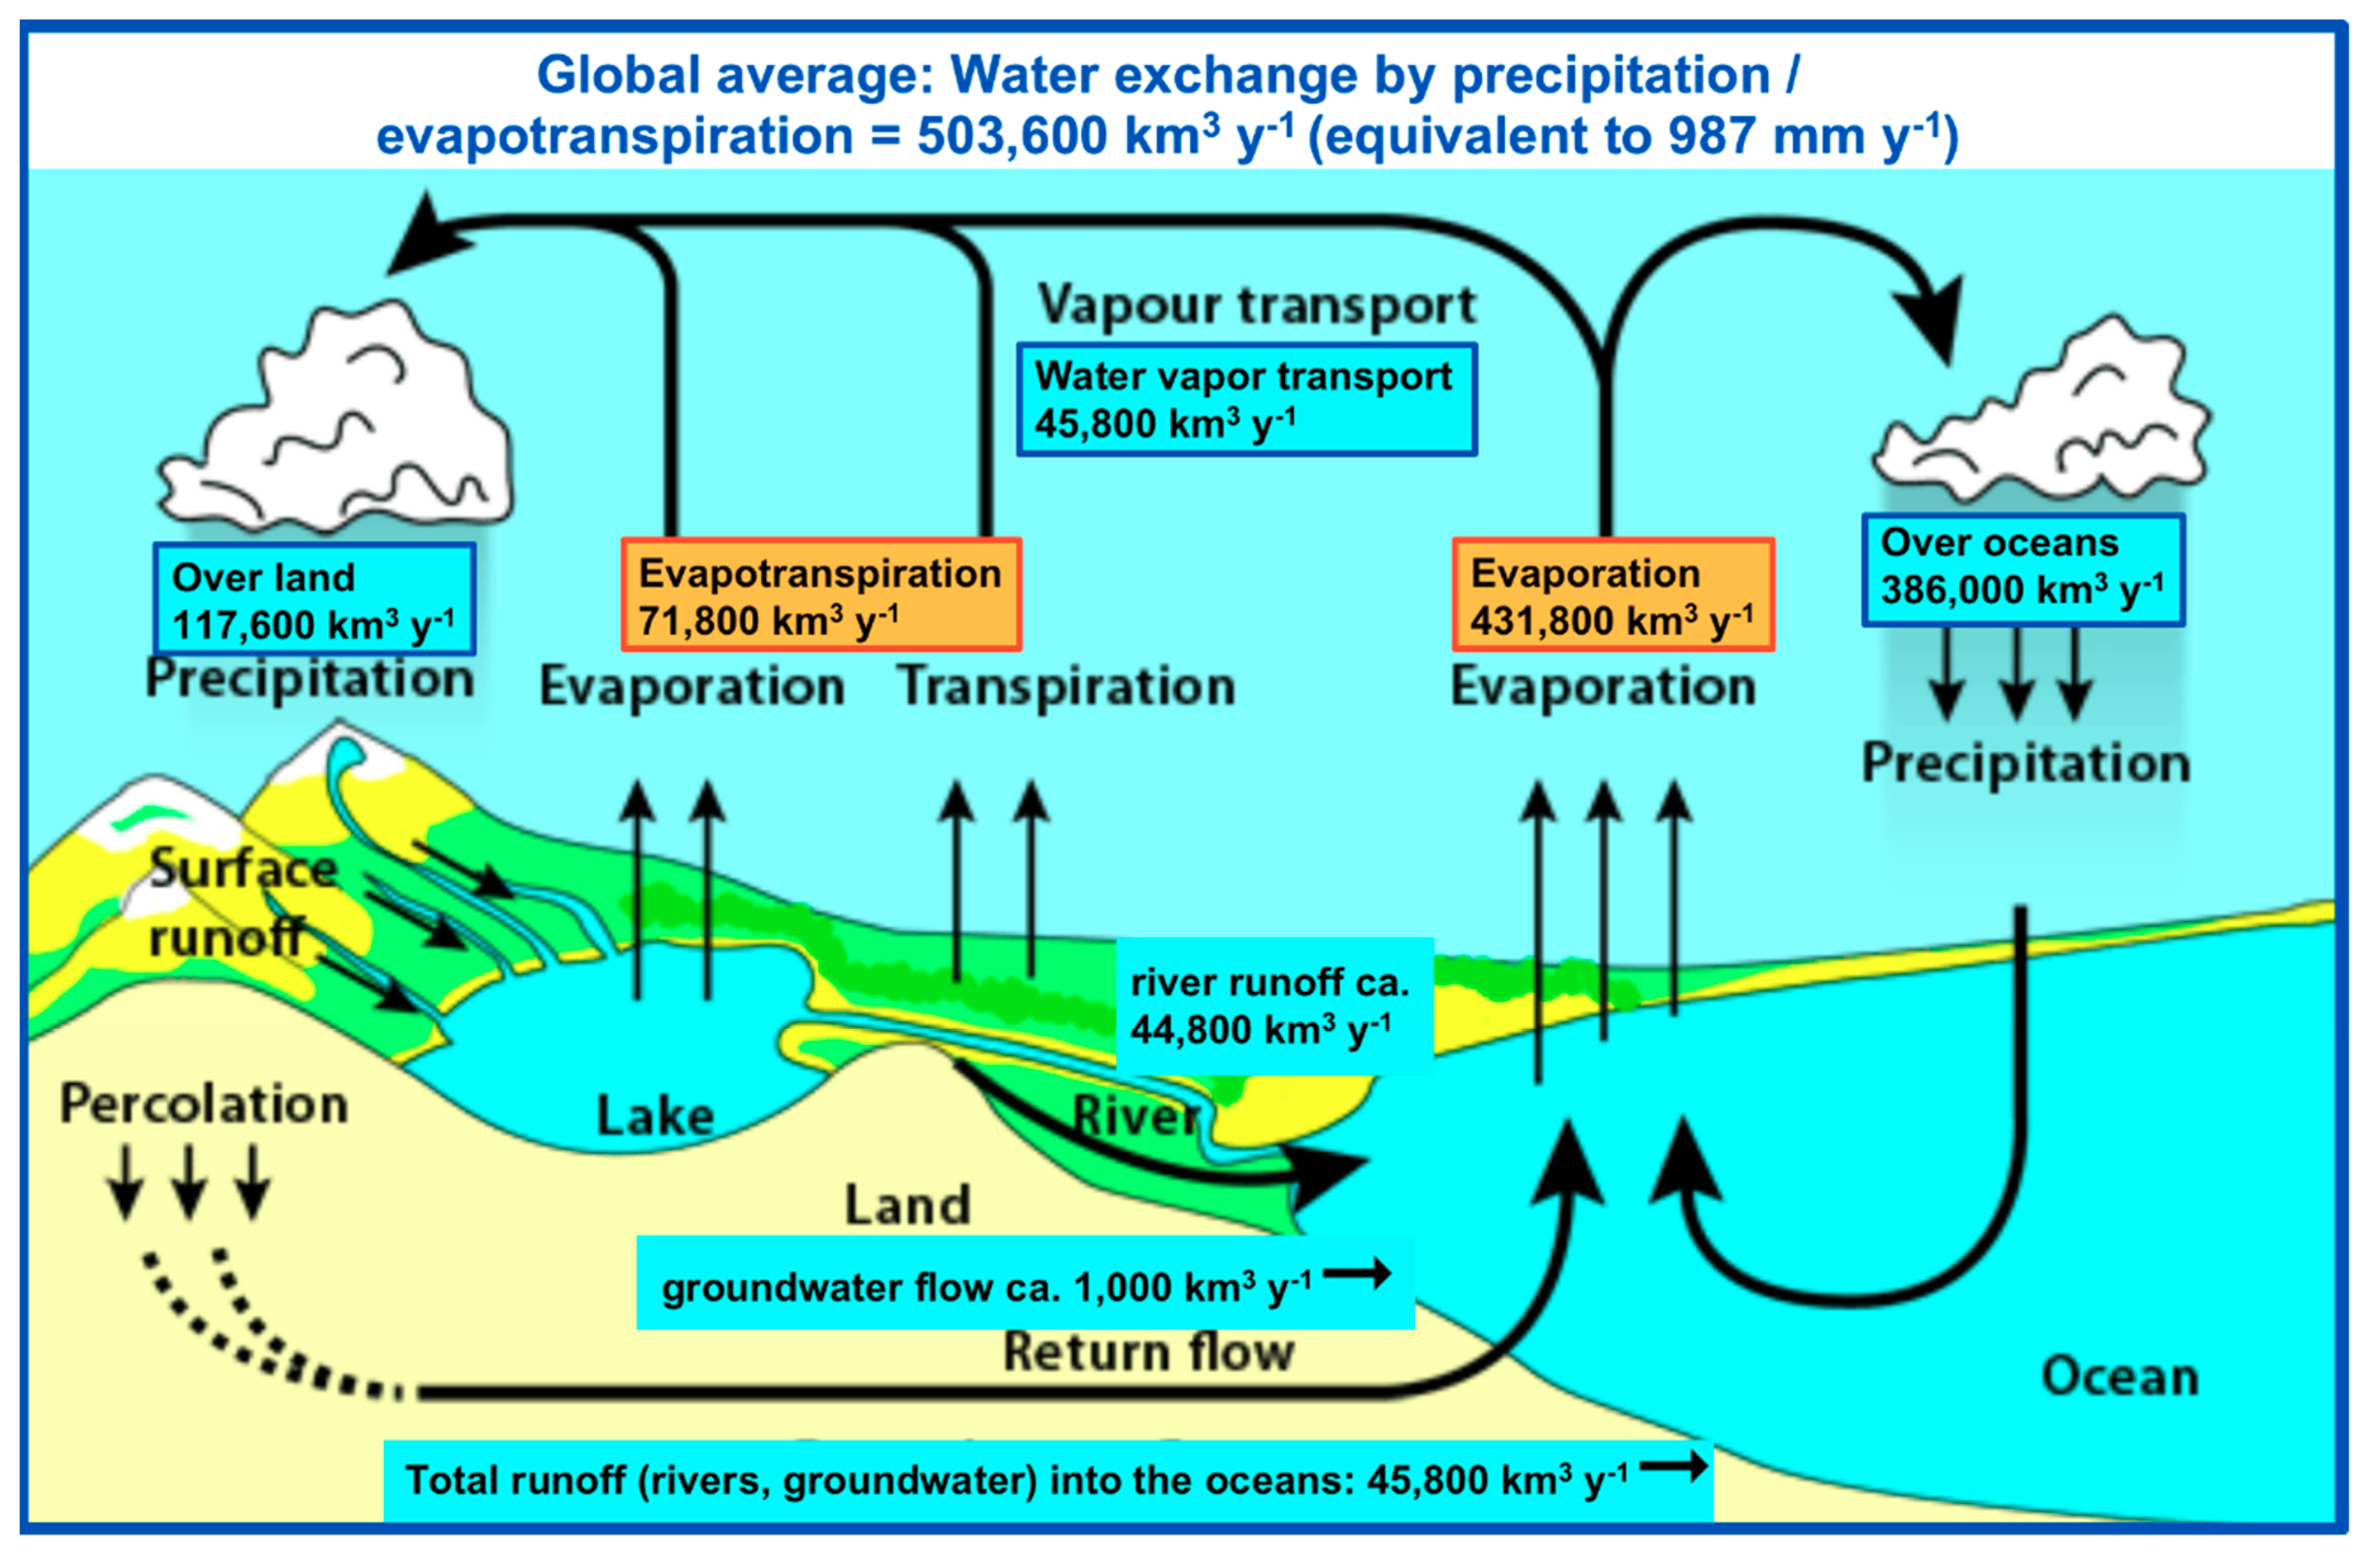
where is precipitation, evapotranspiration, runoff, and total storage (e.g., over a river basin). In reality, is a composite term, with the most important components being snow water equivalent, soil moisture, surface water (lakes, wetlands, reservoirs, rivers), and groundwater, with a separate mention to glaciers and ice sheets. This simple model tells us that the atmospheric moisture divergence is mostly compensated for by evapotranspiration and precipitation, since changes in atmospheric moisture storage are small. At the surface, is balanced by surface and sub-surface runoff and changes in soil moisture and groundwater.
Estimates of the global water budget and of its annual cycle using observations and model data are available in the literature [1,2,3,36,37], and an evaluation based on the recent climatology of the Global Precipitation Climatology Center (GPCC) is shown in Figure 3. Note the dominant role played by precipitation over land, but especially over oceans.
2.1. Observations
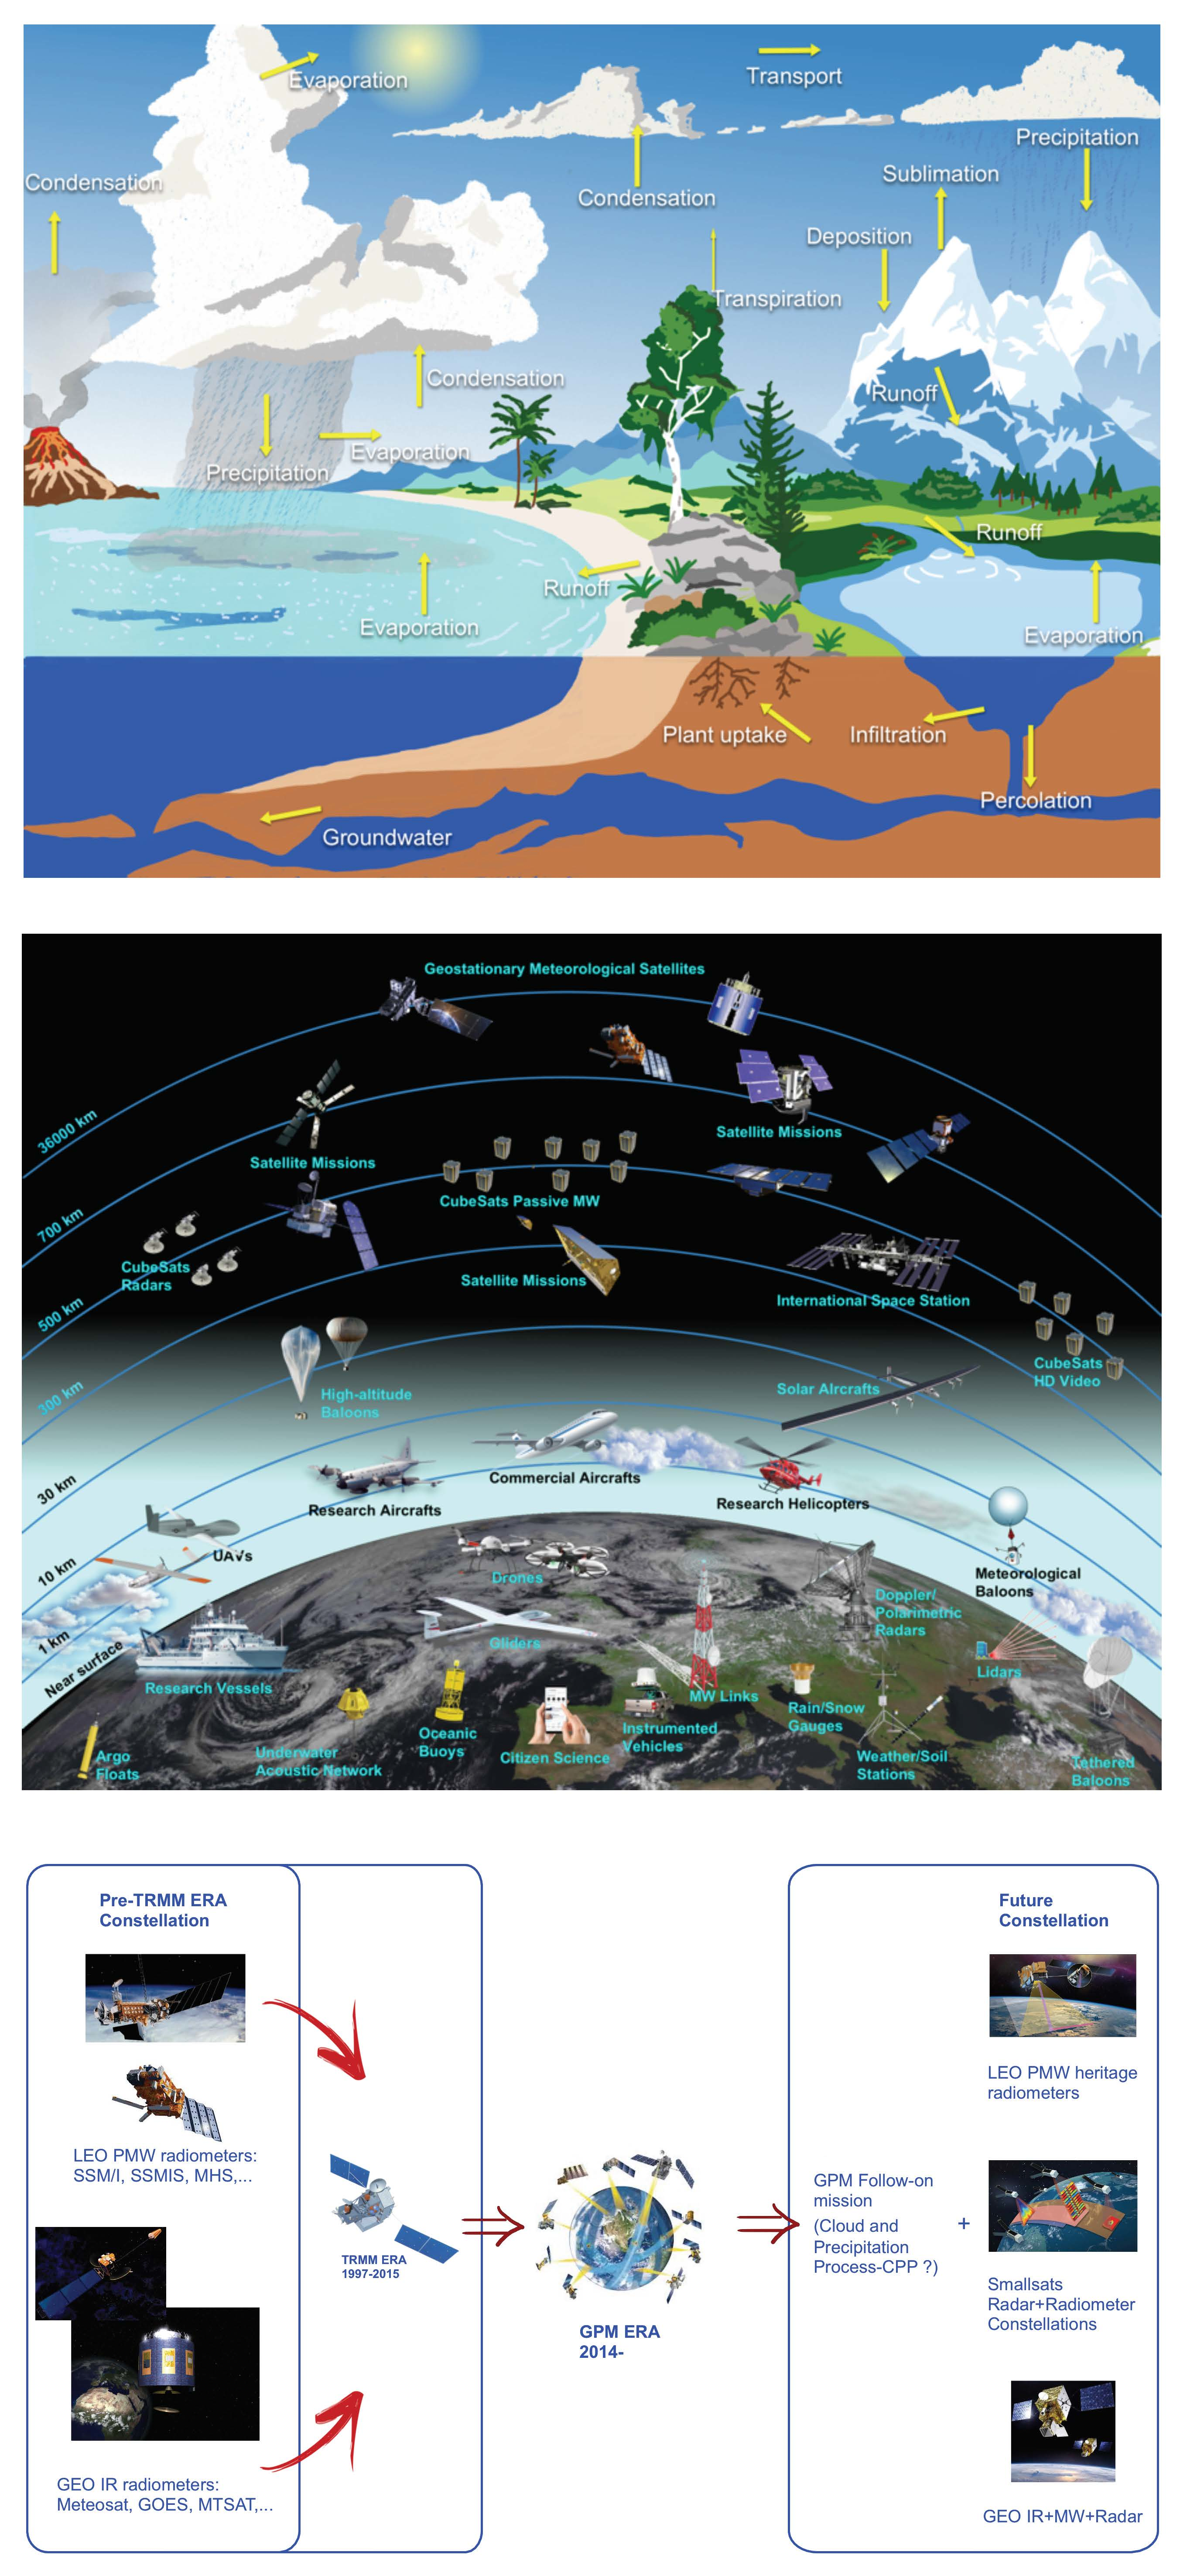
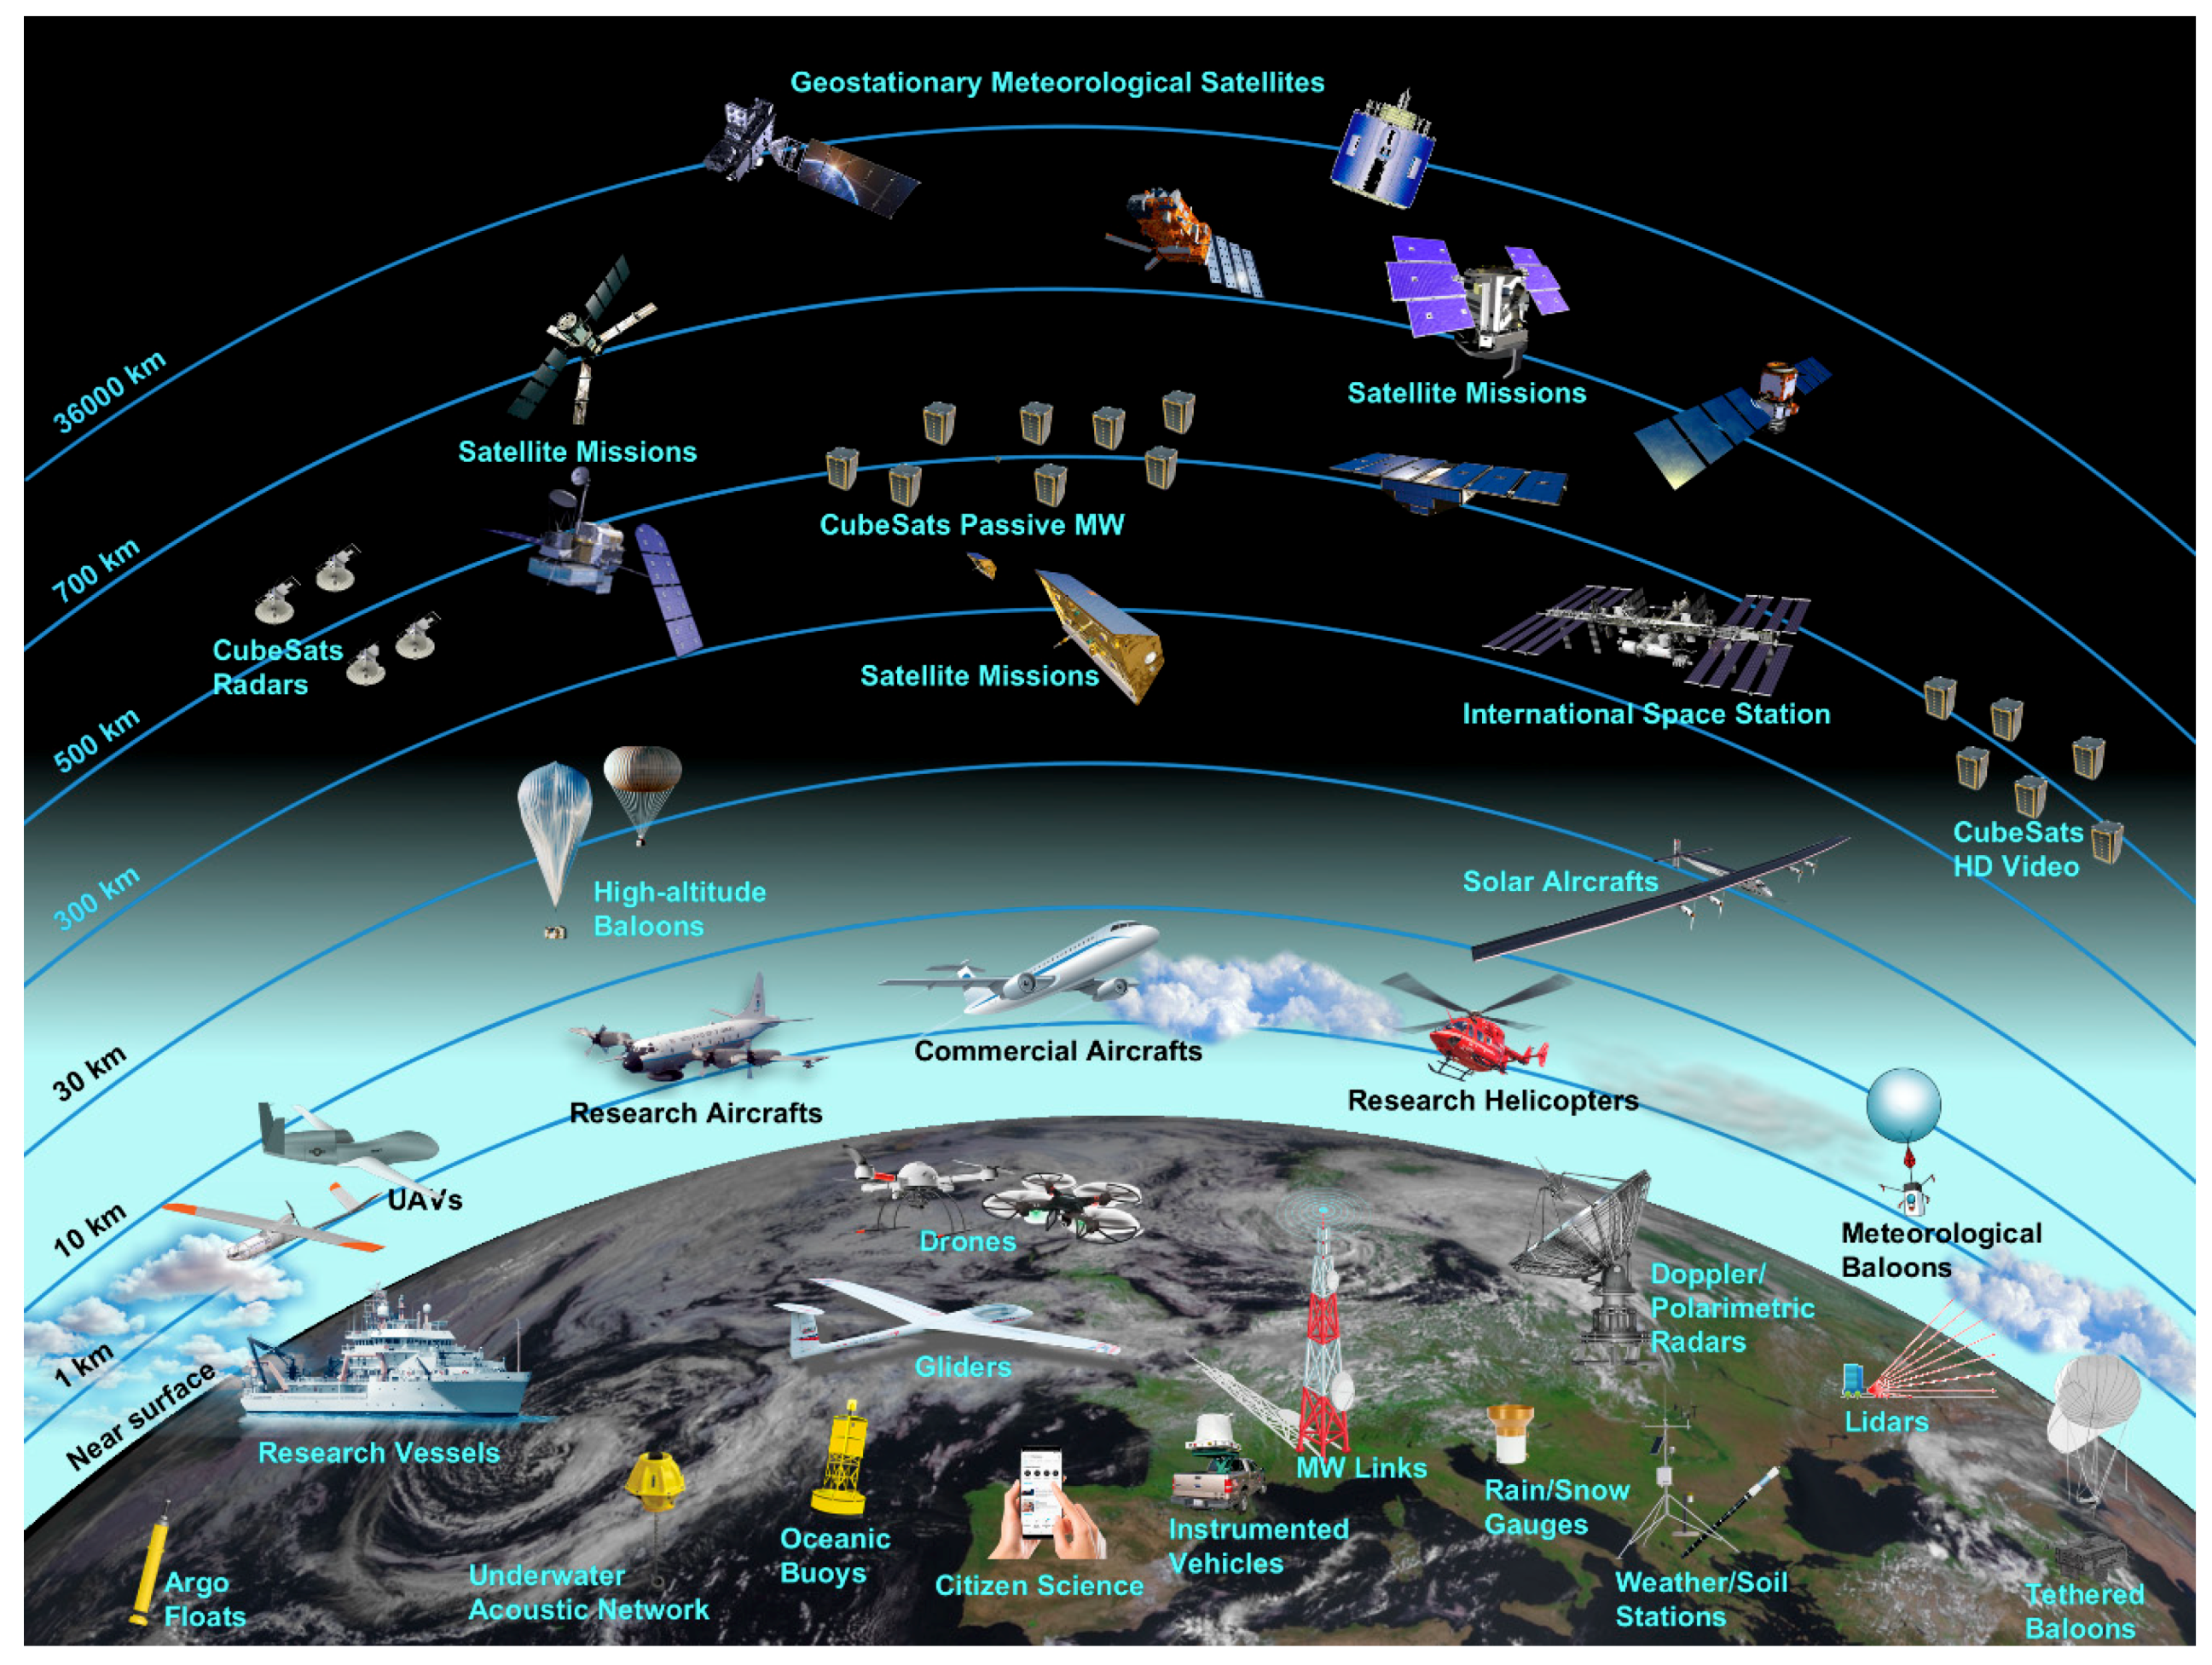
The investigation of the various climate processes requires the implementation and maintenance of a complex observation system with ground, airborne, and spaceborne components (Figure 4). Most of the sensors are already in place for meteorology, hydrology, and climatology, as documented by the Observing Systems Capability Analysis and Review (OSCAR, https://www.wmo-sat.info/oscar/, last accessed 27 May 2019) tool of the World Meteorological Organization (WMO), which defines the requirements for the observation of physical variables. The Global Climate Observing System (GCOS, https://gcos.wmo.int/en/home, last accessed 21 August 2019) maintains the definitions and observation needs [38] of the Essential Climate Variables (ECVs) required to systematically observe the Earth’s changing climate. Ground-based observations produce datasets for estimates of changes in the hydrological cycle and for deriving trends [39], but this happens only in limited areas of the world, where the observing networks are dense enough and ensure adequate quality standards.
In recent years, advances have taken place in our observational capabilities, especially in the remote sensing area, providing unprecedented contributions to advancing our understanding of the global hydrological cycle [40,41,42]. Moreover, initiatives and working groups have been established to take advantage of new observation technologies and to devise new observation methods with which to monitor the hydrological cycle [43,44]. While recognizing the limitations of current satellite observations, especially related to the validation and long-term stability of the datasets, there is general consensus on the need to maintain and improve our space-borne observational capabilities in view of quantifying the human influence on the water cycle [45,46]. In fact, recognition of the global nature of the water system comes with the awareness that human activities significantly and increasingly change the nature of the water cycle, thus threatening human health, economies, and biodiversity [47]. Note also that the hydrological cycle is potentially constrained by the carbon cycle and vice versa, and multiple observation sources can be used to constrain land surface models in order to mitigate bias from any single data type [48].
Closure experiments have been attempted, and are starting to produce convincing results based on satellite data [49,50,51], although closure has not yet been attained using satellite data alone. Rodell et al. [52] show that, in the majority of cases, the observed annual surface and atmospheric water budgets over the continents and oceans close with much less than a 10% residual, while observed residuals and optimized uncertainty estimates are considerably larger for monthly surface and atmospheric water budget closure, i.e., often ≥20% in North America, Eurasia, Australia and neighboring islands, and the Arctic and South Atlantic Oceans. Efforts to improve models integrating ground-based and remote sensing observations are critical to understand the behavior of the Earth system at the surface and sub-surface levels [53,54,55]. In this respect, it is essential that we fill observational gaps (e.g., due to the loss or replacement of satellite platforms) and discontinuities in the data records [49].
In particular, satellite observations are expected to significantly help in closing the water cycle in climatic hot spots where ground-based data are generally sparse. The following three examples are very significant.
- Mediterranean basin. In depth studies would be beneficial for filling the gaps in our understanding of the common characteristics of Mediterranean-type climates around the world and their variability and change [56]. Specifically, observational datasets [49,50] are providing new insights on long-term changes in the Mediterranean basin, in support of model projections predicting increasing temperatures and decreasing evapotranspiration and precipitation over the region by the middle of this century [57,58]. The most recent datasets are contributing to addressing the contribution of the Mediterranean Sea to climatological precipitation on one side, and extreme precipitation on the other [59].
- Arctic. Gaps in observations are particularly evident in the Arctic, where rapid changes in the hydrological cycle challenge our process understanding. Observations show that runoff is systematically larger (smaller) than precipitation increases (decreases), and thus, that quality observations need to resolve changes in evapotranspiration, and groundwater and permafrost storage [60]. Enhanced process understanding and modeling capabilities are starting to be able to better quantify the role of the atmosphere in the Arctic water cycle changes [61]. Uncertainties are still high in the determination of the large-scale freshwater cycle because of the sparseness of hydrographic data and insufficient information on sea-ice volume [62], as well as inadequate monitoring of precipitation, evapotranspiration, and river discharge fluxes [60,63]. Coordinated efforts in monitoring, modeling, and process studies on various scales are thus desirable at the interface between hydrology, atmosphere, ecology, resources, and oceans [64].
- High mountains. The melting of glaciers, and consequent intensification of the water cycle with greening ecosystems and increasing frequency of hazards, is closely linked to recent warming, especially over the Asian Third Pole, requiring investigations of every major component in the system, especially through improved observations [65]. Recent research efforts have attempted to evaluate the uncertainty of terrestrial water budget components over High Mountain Asia, which is significantly impacted by the uncertainty on the driving meteorology [66], and is of the utmost importance for the assimilation of the frozen components in land surface models [67].
Exploring water cycle mechanisms through remote sensing prompts us to take up the challenges presented by water resource management for sustainable development in areas with sparse in situ monitoring networks. Unprecedented opportunities are now available thanks to satellite-based services, although issues need to be addressed concerning accuracy, sampling, and continuity, together with the massive amount of new data [68]. Along with opportunities, the use of high-resolution satellite remote sensing data brings possible privacy concerns at the individual, institutional, and disciplinary levels that need adequate consideration [69].
The prevalence of the application of remote sensing to the study of water processes has increased substantially in recent times: Cui et al. [70] showed that the number of publications on this subject rose at an average of about 16% per year over the past 19 years. This means that most of the disciplines in this highly interdisciplinary field have strongly augmented their interest in remote sensing, from water resources to environmental science, geology, engineering, ecology, and agriculture. A vast amount of data has become available, opening de facto a new era of treating big data for the global water cycle: retrievals, time and space reconstruction, and scale conversion are foremost science topics that will contribute to advancing global hydrology and water security [71].
2.2. Modeling the Processes
It is essential to obtain robust and physically sound figures of the response of the water cycle to atmospheric warming. Accurate modeling is fundamental to disentangling the effects of radiative forcing by greenhouse gases on the water cycle components on the regional and global levels [37]. In particular, attention is to be paid to local changes in precipitation and its extremes that depend upon small changes in large-scale atmospheric circulation, as well as regional feedback mechanisms. Allan et al. [72] argue that climate modeling may have insufficient predictive capabilities to determine such responses at the scale required by impact models. This calls for the determination of robust, large-scale responses in the hydrological cycle across models [73], which is still not satisfactory, especially regarding the representation of clouds and microphysical processes, rainfall variability, and the influence of land–atmosphere coupling on rainfall patterns and their variability [74,75,76]. An increase in model spatial resolution, encouraged by enhanced computer power, would seem to be a reasonable way forward, but a recent study [77] showed that a straightforward resolution increase in global hydrological models is most likely not the best solution to improve discharge predictions, thus emphasizing the role of a better representation of processes and of improved parameterizations.
An acceleration of the water cycle is generally predicted by all models, but not enough is known of the physical mechanisms behind the phenomenon [78]. Precipitation does not tell the whole story of hydrological changes; in particular, it may obscure the fact that in a warmer world, more precipitation will lead to regions getting more rain, but others not getting enough to keep pace with the growing evaporative demand [79]. The use of drought indices has recently produced contradictory results concerning model outputs predicting that dry regions will become drier and wet regions wetter (the DDWW paradigm), showing that DDWW theory is more useful when only precipitation is considered, while proving less conclusive when also evapotranspiration and soil conditions are integrated [80].
Soil moisture memory seems to be large enough so that Diermeyer et al. [81] suggest that the real-time monitoring and accurate model initialization of land surfaces in forecast models could help improving medium-range weather and sub-seasonal climate forecasts. At the same time, surface ocean salinity observations have shown that the water cycle has amplified at less than the Clausius-Clapeyron (CC) rate following recent global warming, thus adding confidence to projections of the total water cycle change under greenhouse gases emission scenarios [82].
In this perspective, high-resolution estimates of the terrestrial water and energy storages are necessary to overcome the lack of reliable land–surface fields available globally and in near-real time. This requires the integration of data from advanced observing systems [83] and modeling community efforts, as in the case of the Global Land Data Assimilation System (GLDAS) [84], in order to make sense of the large amount of observation data which is available nowadays [85,86].
All authors point out several key limitations in the quantitative appraisal due to unrealistic model results and incomplete and unsatisfactory global observational datasets. However, the combination of ground-based and remote sensing data is considered a way to reduce sampling issues, both in space and, progressively, in time [1]. Note also that significant uncertainties are associated with state-of-the-art climate datasets when examining so-called “macroweather” (from a few months to a few decades) precipitation variability [87].
3. Satellite Measurement of Precipitation
A general improvement of the observational capabilities for the constant monitoring of precipitation will substantially contribute to the investigation of climate change processes. Measuring precipitation from space has been a key application of passive remote sensing since the early days of satellite meteorology in the 1960s.
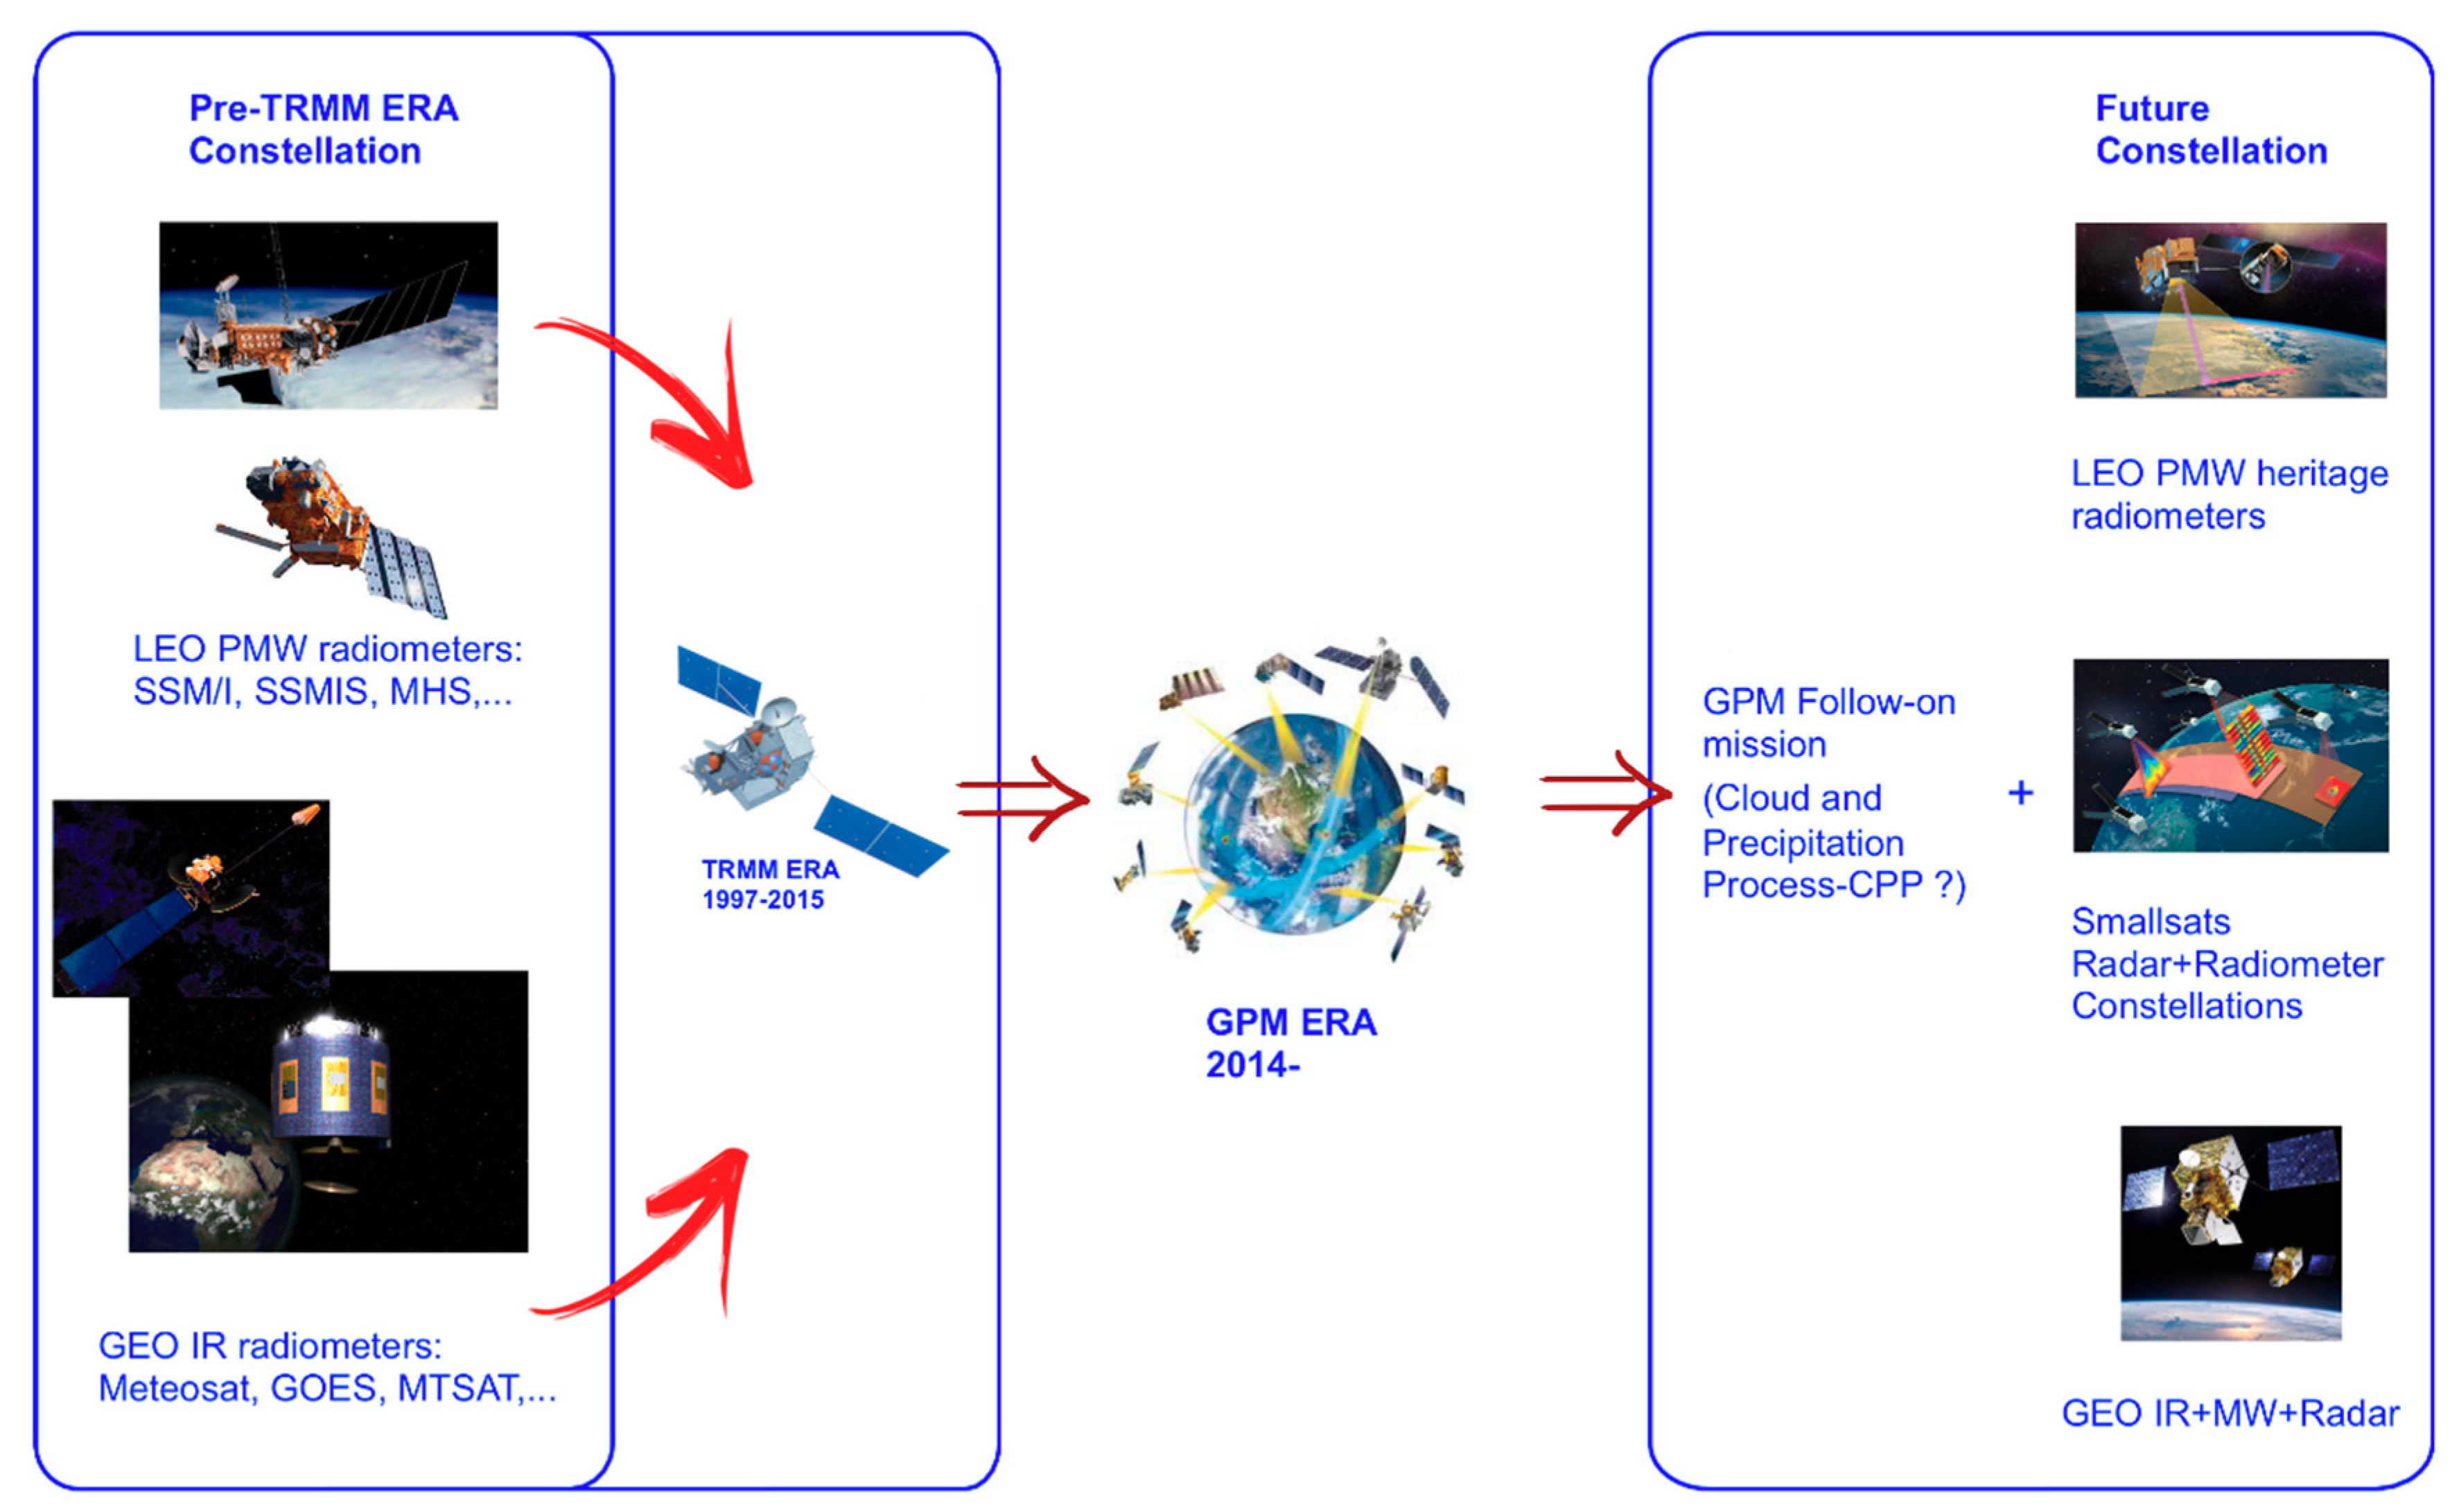
Several review articles deal with satellite precipitation measurements on various levels and from different perspectives [88,89,90,91,92,93,94,95,96,97]. Science principles, algorithms, initial validation efforts, and new missions were described in Levizzani et al. [98]. A new comprehensive presentation of the state of the art of satellite precipitation measurements is now being published, describing the status of observations and satellite programs, retrieval techniques, algorithms and sensors, and validation programs worldwide, as well as the observed characteristics of precipitation processes, and applications that have recently developed from the wealth of satellite precipitation products [99]. The evolution of satellite observational capabilities in recent times is shown in Figure 5. Hereafter, science and technology advancements and critical aspects of the available products are discussed.
The need for measuring precipitation from space stems from a few key considerations:
- Raingauges are not evenly distributed, and cover a very limited portion of the Earth [100]. However, global gridded products are available from a variety of sources, such as, for example, the GPCC [1], the Global Historical Climatology Network (GHCN, [101]), and the recent Rainfall Estimates on a Gridded Network (REGEN, [102]).
- Radar networks are generally deployed by developed countries (http://wrd.mgm.gov.tr/default.aspx?l=en, last accessed 21 August 2019). Datasets for water cycle studies are becoming available over limited areas, such as the Multi-Radar/Multi-Sensor System (MRMS; https://www.nssl.noaa.gov/projects/mrms/, last accessed 24 September 2019) developed by the National Oceanic and Atmospheric Administration (NOAA) National Severe Storms Laboratory (NSSL) [103], and the Nimrod data system for UK and Western Europe (https://catalogue.ceda.ac.uk/uuid/82adec1f896af6169112d09cc1174499, last accessed 25 September 2019) developed by the UK Met Office.
- Oceans are not fully covered, apart from scattered ship observations, buoys, and radars on small islands which have been made available through the International Comprehensive Ocean-Atmosphere Data Set (ICOADS, [104]), the Global Summary of the Day (GSOD, [105]), the Pacific Rainfall Database (PACRAIN, [106,107]), and ship-based measurement campaigns, such as the Ocean Rain And Ice-phase precipitation measurement Network (OceanRAIN, [108]).
3.1. Science and Technology Advances
3.1.1. Synergy of Sensors for Precipitation Estimates
“Measuring” precipitation from space is an indirect process that aims at retrieving precipitation from the passive or active remote sensing of radiation in a cloudy atmosphere. The scientific community has come a long way since the early estimates only from cloud top temperature thermal IR measurements linked to precipitation through cold cloud duration algorithms, or simply by linking temperature/height and precipitation potential. The launch of passive microwave (PMW) sensors in the 1980s brought the necessary information from within the cloud, as opposed to merely the cloud top. However, it was only in 1997, with the launch of the Tropical Rainfall Measuring Mission (TRMM) [109] with the first Precipitation Radar (PR), that active measurements introduced more direct information on the precipitation formation in clouds, providing a 3D description of the precipitation field. The PR demonstrated that cloud horizontal and vertical structure sensing is necessary to improve our ability to measure precipitation at the local and global levels through the use of passive and active microwave (MW) sensors. TRMM was followed by CloudSat in 2006 [110], and the by the Global Precipitation Measurement (GPM) mission in 2014, with the new Dual-frequency Precipitation Radar (DPR) [111].
The introduction of cloud and precipitation radars in space has opened the way to correcting errors deriving from the misidentification of cloudy and precipitating scenes on the one hand, and from the sensitivity of the radiative transfer model to cloud parameters on the other. Validation studies conducted over several decades have demonstrated that problems still arise in comparing satellite-derived precipitation products against those of ground radars when assessing their ability to represent the spatial variability of rainfall and precipitation intensity (e.g., [112]); differences in precipitation schemes and observation geometry are the basic reasons for this, and the advent of cloud radars and precipitation radars in space is narrowing the gap.
Nevertheless, significant problems are inherent to maintaining the actual constellation of PMW sensors in orbit [113], which is expensive and is affected by calibration problems between different instruments, or even between sensors of the same category. The radar constellation (two radars are in orbit at the time of writing) is rapidly evolving, and future missions hosting clouds and precipitation radars such as the Earth Clouds, Aerosol, and Radiation Explorer (EarthCARE, [114]) are planned. Doppler radar technology is not yet available in space, and this is the gap that the proposed Wind Velocity Radar Nephoscope (WIVERN, [115]) mission wants to fill, in order to provide global measurements of in-cloud winds using the Doppler-shifted radar returns from hydrometeors. At the same time, the continuous development of an observing strategy for precipitation is part of a wider strategy for maintaining the global constellation of “conventional” operational meteorological satellites through the combined efforts of governments, research institutions, and industry [116].
3.1.2. Precipitation Products
The quantitative investigation of the water cycle requires global precipitation products at the appropriate time scales. Several products are available and are used for global and regional studies and for the comparison/evaluation of model output. Since the TRMM era, global precipitation estimates from satellite have become more quantitative, thus filling gaps, especially in the tropics. Most datasets are nowadays gauge-corrected to ensure the necessary calibration; the most used for climate studies is the Global Precipitation Climatology Project (GPCP, [117]) dataset, which is the longest satellite precipitation record (40 years) based on IR and MW data. Mean values, variations, and trends during the satellite era have been computed from this dataset [118]. Global IR-based datasets cover reasonably long time spans, such as the Climate Hazards Center’s Infrared Precipitation with Stations (CHIRPS, [119]) and the Climate Prediction Center (CPC) Merged Analysis of Precipitation (CMAP, [120]). Among the merged IR/MW or MW-only products, it’s worth noting the Precipitation Estimation from Remotely Sensed Information using Artificial Neural Networks (PERSIANN, [121]), the CPC MORPHing technique (CMORPH, [122]), and the Global Satellite Mapping of Precipitation (GSMaP, [123]). Africa has always been an important target of precipitation estimation, given its relatively poor gauge and radar coverage; the same is true for the tropics, given their importance for global precipitation. Datasets over Africa include the Tropical Applications of Meteorology using SATellite data and ground-based observations (TAMSAT, [124]), the Africa Rainfall Climatology 2.0 (ARC2, [125]), and the Tropical Amount of Rainfall with Estimation of ERrors (TAPEER, [126]). The launch of GPM has initiated a community effort to transition from the TRMM Multi-satellite Precipitation Analysis (TMPA, [127]) to the Integrated Multi-satellitE Retrievals for GPM (IMERG, [128]).
More recently, the idea emerged to take full advantage of the complementary nature of gauge, radar, satellite, and reanalysis data. The Multi-Source Weighted-Ensemble Precipitation (MSWEP) merges gauges, satellite, and reanalysis data. It is now available at 0.25° [129] and 0.1° [130] spatial resolution, and is widely used for water cycle closure experiments. Another experimental merged dataset has been developed over China at 1-km resolution, and is based on high-density gauge observations, high-resolution weather radar quantitative precipitation estimation (QPE), and seamless satellite-based precipitation estimates [131].
3.1.3. Smallsat Sensor Constellations
The debate on how to qualitatively and quantitatively improve global precipitation monitoring is not confined to merely maintaining the present constellation in orbit. The number of PMW sensors is obviously a prerequisite for ensuring the necessary continuity of products in the future. However, costs are high, and the spatio-temporal coverage is hindered by the continual loss of spacecrafts due to aging. Thus, the community is at work to look beyond the GPM constellation which is now in orbit. In particular, the increasing miniaturization of sensors makes it possible to design satellite constellations at a fraction of the current cost of large satellites, and where any single member can easily be replaced when necessary. Moreover, the frequent sampling of the new sensor constellations is fundamental for better dynamic and thermodynamic characterization of precipitating clouds [132]. Smallsats and CubeSats are among the alternatives being explored with different payloads.
The Time-Resolved Observations of Precipitation structure and storm Intensity with a Constellation of Smallsats (TROPICS, [133]) mission was recently selected by the National Aeronautics and Space Administration (NASA), as part of the Earth Venture-Instrument (EVI-3) program. All-weather observations of 3D temperature and humidity, as well as cloud ice and precipitation at high temporal resolution (median refresh time better than 60 min) for investigating tropical cyclones, are the goals of the mission. The proposed Temporal Experiment for Storms and Tropical Systems (TEMPEST, [134]) mission consists of five 6U-Class nanosatellites observing at five millimeter-wave frequencies with a 5-min temporal sampling to observe the time evolution of clouds and the formation of precipitation.
The smallsats concept for precipitation monitoring is not only limited to PMW radiometers; the excellent performance of clouds and precipitation radars in space has initiated studies on low-cost, quick-turnaround platforms. The Jet Propulsion Laboratory (JPL) Ka-band RainCube [135] smallsat now in orbit is based on a half-meter parabolic antenna, and has already met all requirements through repeated observations of precipitation.
3.1.4. Evolution of Heritage Missions
Heritage missions will continue weather and climate monitoring from geostationary (GEO) and low Earth Orbit (LEO). GEO visible/infrared (VIS/IR) new sensors at very high spatial and temporal resolution are now enhancing the observational capabilities of clouds and precipitation systems [136,137,138]. The development of PMW sensors for GEO satellites has been ongoing for more than a decade [139], but the concept seems at the moment to have been superseded by the smallsat constellations. However, it may come back in the near future, as some countries are continuing feasibility studies.
LEO PMW missions are also evolving by adding additional high-frequency channels, especially for the observation of ice clouds [140]. The European Organization for the Exploitation of Meteorological Satellites (EUMETSAT) and the European Space Agency (ESA) will soon launch the EUMETSAT Polar System-Second Generation (EPS-SG) satellite, which will host the Ice Cloud Imager (ICI) with frequencies from 183 to 664 GHz. ICI will observe cirrus clouds, cloud ice water path, cloud ice effective radius, and cloud altitude, while at the same time providing vertical humidity profiles and vertical profiles of hydrometeors (cloud ice, graupel and snow), as well as water vapor. One more effort aimed at covering high latitude water cycle components is currently being undertaken by the European Union (EU) with its Copernicus Imaging Microwave Radiometry (CIMR, [141]), designed for monitoring the rapidly-changing Arctic environment; the sensor will also contribute to the existing constellation for precipitation measurement.
International organizations such as GCOS and the Global Ocean Observing System (GOOS; https://www.goosocean.org, last accessed 7 August 2019) have developed approaches to help coordinate existing efforts and the planning of future systems, but they lack the authority and funding necessary to establish and manage an observing system at the global scale. The Coordination Group for Meteorological Satellites (CGMS, https://www.cgms-info.org/index_.php/cgms/index, last accessed 7 August 2019) strives to match the strategies of the organizations that launch and maintain in orbit the meteorological satellite fleet worldwide. CGMS receives inputs and support from its International Precipitation Working Group (IPWG, http://ipwg.isac.cnr.it, last accessed 8 August 2019) [142].
3.1.5. Observing Precipitation through Other Water Cycle Components
Precipitation-oriented missions have to be combined with existing missions observing the other components of the water cycle. We will first mention ESA’s Soil Moisture Ocean Salinity (SMOS, [143]) mission, NASA’s Soil Moisture Active Passive (SMAP, [144]), and their follow-ons. PMW data are combined with data from scatterometers such as the Advanced SCATterometer (ASCAT) to produce global soil moisture data, such as the ESA Climate Change Initiative (CCI) soil moisture dataset [145]. Approaches have been proposed for measuring precipitation using variations of the soil moisture measured by these sensors to infer preceding rainfall amounts; the Soil Moisture to Rain (SM2RAIN, [146]) method is based on the inversion of the hydrological water balance for estimating rainfall.
A follow-on mission is essential for the Gravity Recovery and Climate Experiment (GRACE, [147,148,149]), which measured ground water levels from space for the first time. It provided data for the investigation of the effect of soil moisture on climate [150], and underscored the importance of considering water storage, along with water fluxes, to improve global models [151]. GRACE observations have also been found to be important for cold region assessments of precipitation products and the determination of proper gauge undercatch corrections [152,153]. Time series are now available with the necessary quality assessments [154]; this is especially important, as in situ data are often sparse or inaccurate (e.g., due to gauge undercatch) in cold regions.
Evapotranspiration is another key component that can be observed from space to produce global data sets such as the Global Land Evaporation Amsterdam Model (GLEAM, [155]) that separately estimates the different components of land evaporation, i.e., transpiration, bare-soil evaporation, interception loss, open-water evaporation, and sublimation. A recent study underlines the potential importance of nocturnal water loss from the surface into the atmosphere, which has been overlooked so far because of the absence of solar radiation to drive evapotranspiration [156]. The current tendency is to combine these spaceborne datasets with data from other sources, including ground based ones; the result are global gridded datasets such as the Derived Optimal Linear Combination Evapotranspiration (DOLCE, [157]) and the Linear Optimal Runoff Aggregate (LORA, [158]). On a smaller/national scale, the approach is very similar, and datasets at the catchment level are being proposed, combining all data sources, including satellite-based precipitation estimates; a notable example is the Catchment Attributes and MEteorology for Large-sample Studies-Chile (CAMELS-CL) dataset [159].
3.1.6. Future Observations of the Water Cycle as a Whole
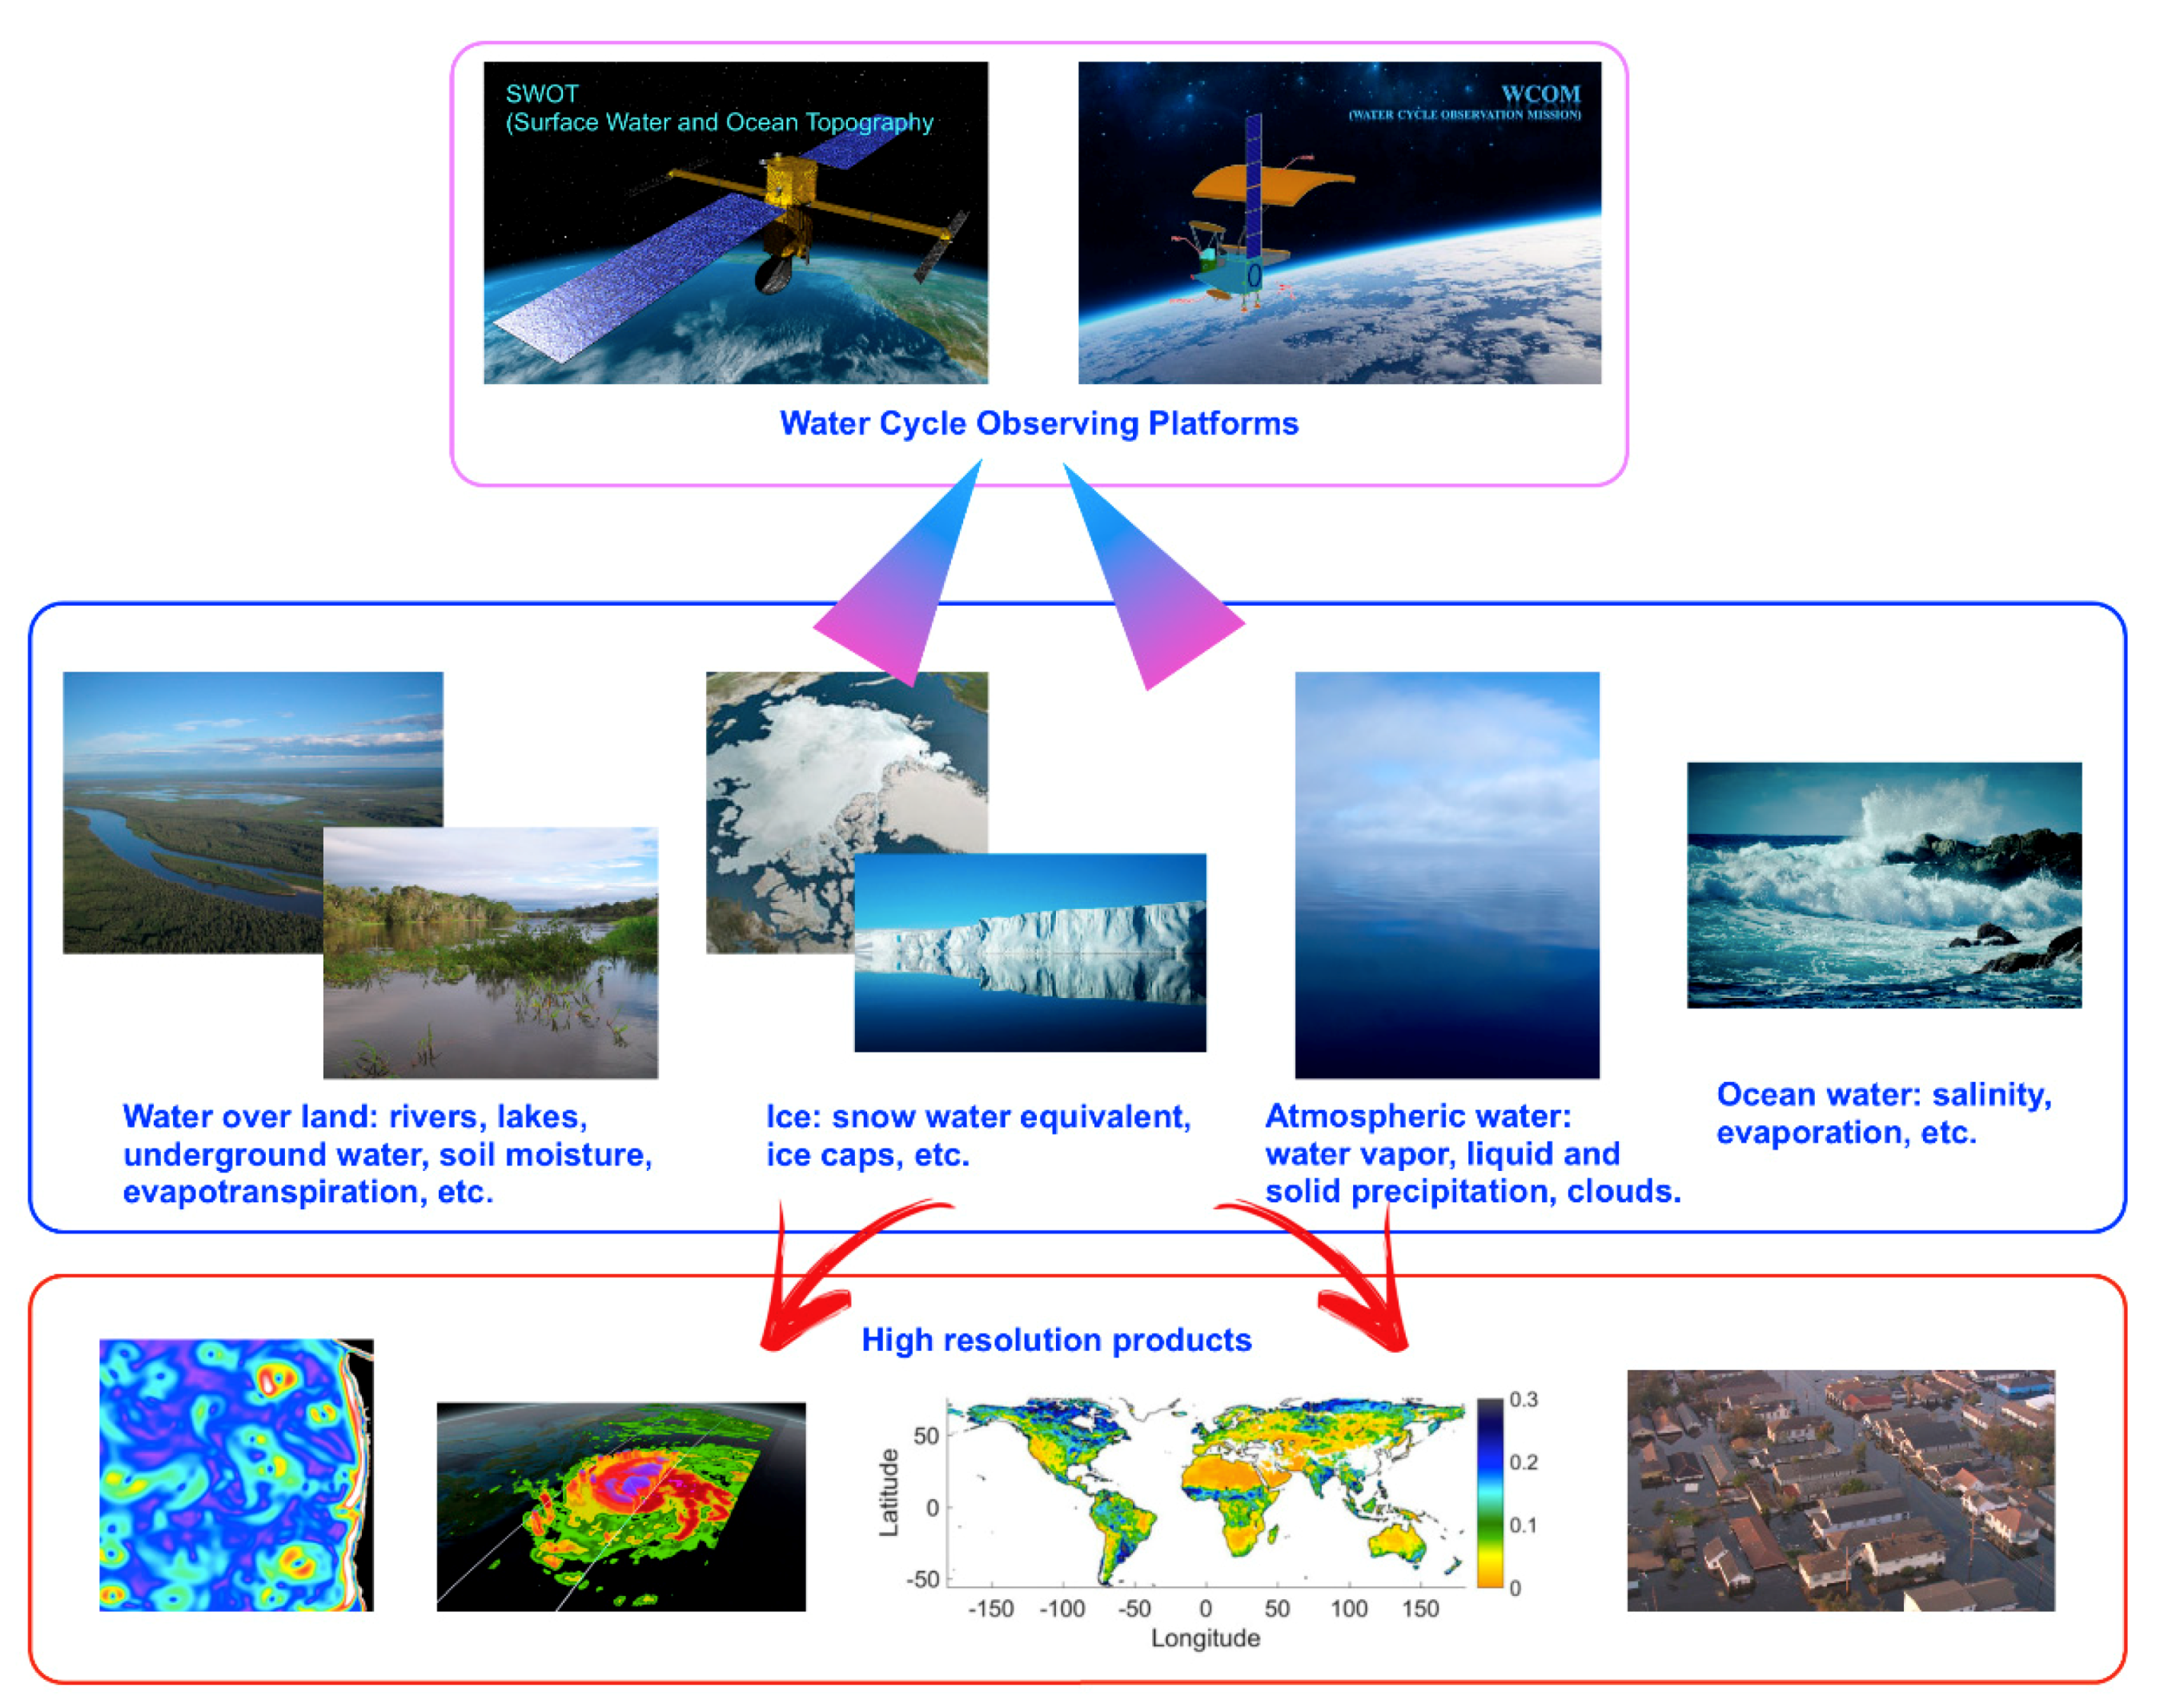
Broader-scoped missions are being planned for measuring several components of the water cycle at once and at very high spatial resolution (Figure 6). The Chinese candidate mission Water Cycle Observation Mission (WCOM, [160]) will host a three-instrument payload: (1) an L-S-C-band Fully-Polarized Interferometric synthetic aperture microwave Radiometer (FPIR), (2) a Polarized Microwave radiometric Imager (PMI), and (3) an X-Ku Dual-Frequency Polarized SCATterometer (DFPSCAT). The mission rationale is to acquire high accuracy and consistent measurements of key elements of the water cycle from space, including soil moisture, ocean salinity, freeze-thaw, and snow water equivalent, among other parameters. A satellite mission for surface water monitoring was first delineated by Alsdorf and Lettenmaier [161] and Alsdorf et al. [162], with very stringent characteristics: (i) a spatial resolution of ~100 m to resolve basin discharge; (ii) a few days’ temporal resolution to capture short flood events; and (iii) a vertical resolution of a few centimeters to measure the subtle height changes which are responsible for significant discharges. The concept successively evolved into the Surface Water and Ocean Topography (SWOT, https://swot.jpl.nasa.gov/home.htm, last accessed 8 August 2019) mission, which is planned to be launched in 2021.
3.2. Scientific and Technological Challenges
3.2.1. Observational Grand Challenges
A better translation from radiometric observations from space to physical properties is a prerequisite for a complete quantification of the hydrologic cycle components and their interactions [163]. Such “translation grammar” varies considerably from case to case, depending on the frequency of observations, timeliness, latency, spatial resolution, and uncertainty, which can hardly be addressed by a single mission; rather, they require several missions and/or constellations of sensors conceived for different applications. Thus, a complete understanding of precipitation structure, its changes, and links to the other water cycle components is still burdened by relevant science challenges.
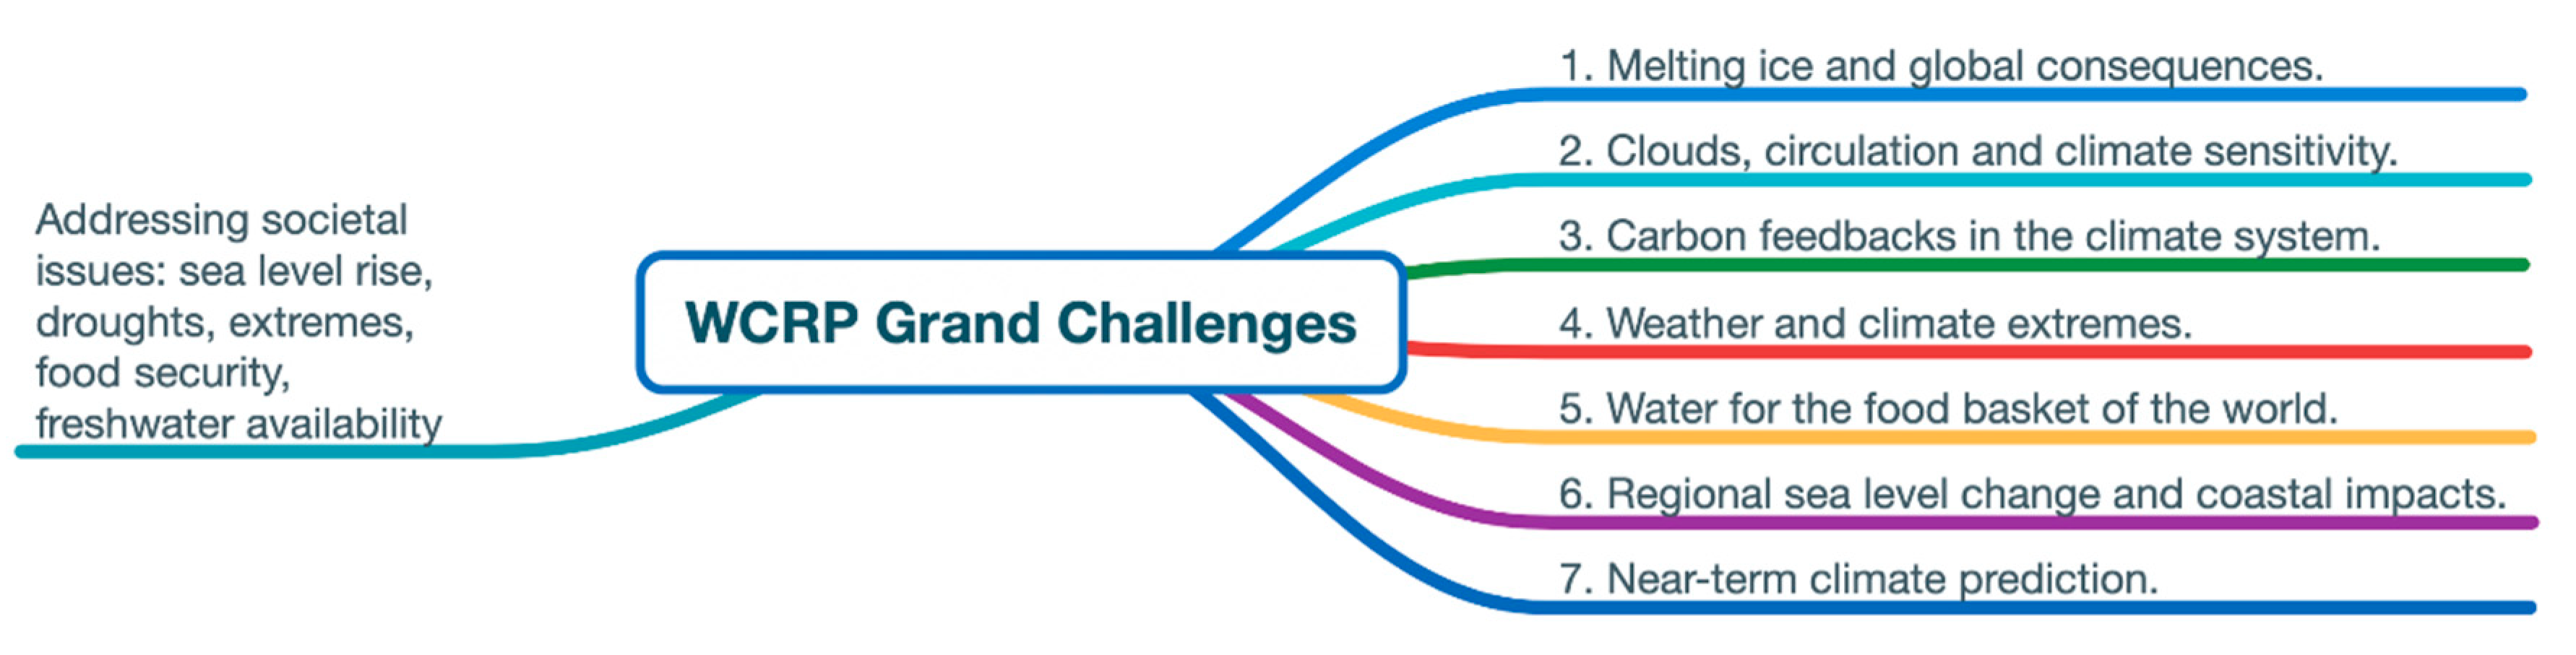
The first challenge concerns the design of the future satellite precipitation observing system as an essential component of a consistent climate observing system conceived for addressing sea level rise, droughts, floods, extreme events, food security, and freshwater availability in a changing climate. Whetherhead et al. [164] propose to give priority to the Grand Challenges of the World Climate Research Program (WCRP) (Figure 7): (1) melting ice and global consequences; (2) clouds, circulation and climate sensitivity; (3) carbon feedback in the climate system; (4) understanding and predicting weather and climate extremes; (5) water for the food baskets of the world; (6) regional sea-level change and coastal impacts; and (7) near-term climate prediction. Monitoring the Earth through satellite missions that are not part of an integrated global system is no longer possible, since interconnected climate processes require observations designed to contribute to a data system that enables better-quality projections of future scenarios. Precipitation is relevant to most of the seven challenges, and its global observation requires a coordinated worldwide effort. In particular, precipitation observations should help model development focused around processes that most affect storm tracks, tropical rain belts, and climate sensitivity [165]. Such an approach will help reducing model biases and uncertainties, while at the same time advancing the utility of global modeling. Answers to questions such as the future of the permafrost layers, or the dynamics of the terrestrial and ocean carbon sinks, depend on the magnitude of warming and the distribution of precipitation. Validation has become an integral part of model development due to the availability of global gridded products that support the evaluation of the next generation of climate models ([166]).
A study by Waliser et al. [167] on the water cycle description in the climate models of the IPCC Fourth Assessment Report (AR4) demonstrated good agreement in 20th century climate representations of quantities that have a relatively robust global observational basis, and that are physically unambiguous; rainfall and precipitable water are among such quantities. A poorer agreement was found for quantities that have a weak or incomplete global observation basis, such as snowfall and cloud liquid water. Awareness of the limitations of the precipitation datasets avoids jumping to wrong conclusions when assessing the various models, as argued by Tapiador et al. [96] in the case of IPCC AR5, which still acknowledged large observational uncertainties in precipitation observations for model validation.
3.2.2. Observing Snow and Ice
The retrieval of precipitation from space is still not effective in estimating the solid component both from radar and radiometers [168]; this is due to the difficulty of distinguishing between falling snow and snow/ice on the ground, and also to the sensitivity of active and passive sensors to snowfall below clouds. Note that the accuracy of ground measurements is not very high due to the technological limitations of sensors and to wind resuspension; intercomparison campaigns give some hope to improve over existing methods [169,170].
The first step toward the creation of global spaceborne snowfall algorithms is the determination of detection thresholds for the various active and passive sensor channel configurations as outlined by Skofronick-Jackson et al. [171]. The study showed the importance of the radar frequency (W-band against Ku- and Ka-bands) in the retrieval, the influence of cloud structure macrophysics on PMW channel detection capability, and the effects of snowflake microphysics (shape and density) on active and passive measurements. Previously, Kulie and Bennartz [172] found that near surface dry snowfall is characterized globally by extremely light reflectivity values (3–4 dBZe). Liu [173] used CloudSat’s CPR data to show that the CPR was indeed capable of detecting snow clouds and their vertical structure.
The GPM Microwave Imager (GMI) has new capabilities for the detection of snowfall, the retrieval of snow water paths (SWPs) [174], and the detection of near surface snowfall using the DPR [175], and is able to provide maps of global snowfall properties [176] (see an example in Figure 8). A quantification of the differences between CPR and DPR products [177] recently showed that the average snowfall rate from CPR is 43% higher than that observed by DPR, thus indicating that retrieval assumptions (microphysics and snow scattering properties) are quite different between the two algorithms. This is the key point for designing future snowfall algorithms and more accurate databases of the scattering properties of non-spherical cloud ice particles [178]. The community around the International Workshop on Space-based Snowfall Measurement (IWSSM), together with the IPWG, is working on this very important subject. The Snowport portal is a very helpful discussion forum (http://snowport.meteo.uni-koeln.de, last accessed 9 August 2019). Future developments will concentrate on triple-frequency radar technology [179,180,181].
Deep neural networks (DNN) are also being adopted as a viable alternative to merge together data from passive and active sensors at high latitudes [182]. This is accompanied by significant progress being made towards using PMW bands around 183 GHz for snowfall detection in Arctic conditions [183]. A better quantification of snowfall at high latitudes [184] and on a global scale [176] will also contribute to unravelling the controversy around the impact of Arctic warming on increased rainfall/snowfall [185] and, more generally, to explaining the differences in model projections between the southern and northern hemispheres and wet and dry regions [186]. It will also help examine the impact of excluding precipitating ice on atmospheric radiative fluxes and heating rates in climate models [187] and estimate the cooling flux from snow melting in the ocean [188].
An overlooked component of the precipitation system is freezing rain. GPM has recently made it possible to observe freezing rain features mostly occurring over northern hemispheric land in winter [189]. One more marginal contribution comes from falling hail. A few attempts have been made to detect hail events from PMW radiometers [190,191,192] and radars [193,194]. However, hail detection algorithms do not always perform correctly in all hailstorm situations.
3.2.3. Land Surface Emission
Accurate estimations of land surface emissivity (LSE) is another crucial issue for MW-based retrievals of precipitation over land and of atmospheric profiles, and for numerical weather prediction (NWP) model data assimilation. Without adequate maps of surface emissivity from observations or near-real-time LSE models, the retrievals of precipitation over land will always be affected by substantial errors, especially when using MW channels whose weighting functions peak close to the ground. Several groups have been working on this problem, and datasets are available (e.g., [195,196,197]). LSE models also exist for use in NWP applications, and are useful also for precipitation retrievals; two examples are the Tool to Estimate Land-Surface Emissivities at Microwave frequencies (TELSEM) [198] and the Ringerud et al. [199] model. Model evaluations through observations are being conducted [200,201,202] to ensure consistency and adequate error models for precipitation retrieval applications. One more aspect is the detection of cloud contamination in PMW measurements over land, which may adversely affect the quality of brightness temperature retrievals, especially in the presence of convective clouds and/or precipitation [203].
3.2.4. Precipitation over the Ocean
Precipitation retrievals over the ocean exploit more emission-based MW channels, since the emissivity of the water surface is rather homogeneous. A general qualitative agreement can be observed between the climatologies from the available products, which reproduce the major characteristics of the precipitation patterns over oceans [204]. However, quantitative disagreements occur globally, but also in terms of regional patterns, especially in regions of high precipitation; a better agreement is generally found in the northern hemisphere. There is an obvious lack of dedicated observations over the oceans to ensure a sufficient validation standard; limited observations are available on islands and on board ships. OceanRAIN [108] provided in situ, along-track, shipboard data of precipitation, evaporation, and the resulting freshwater flux at 1-min resolution over global oceans from June 2010 to April 2017 and is the first observation dataset of its kind. Studies on the frequency of precipitation occurrence over global oceans [205] are now being conducted to capture the seasonal cycle and investigate shortcomings in previous climatologies, such as the amount of trade cumulus precipitation, which appears to be higher than expected [206]. Moreover, it remains widely unknown how precipitation scales with sea surface temperature (SST), particularly at sub-daily resolution, though the oceans cover more than 70% of the Earth’s surface and receive 77% of precipitation [207]. Studies on the sensitivity of oceanic precipitation to SST are thus very important [208]. Finally, salinity changes resulting from long-term alternations between surface evaporation and precipitation are evident and need to be studied in depth [209]. Recent studies explore the freshening of sea water in the first centimeter caused by rainfall using SMOS and SMAP data, finding that, in the general, case salinity is restored within a few hours, while occasionally, the freshening may persist for 24 h or more [210].
3.2.5. Orographic Enhancement of Precipitation
Precipitation retrievals from space generally do not include correction for the orographic enhancement; this is a major error source. The physical mechanisms involved encompass fluid dynamics, thermodynamics, and microphysical cloud processes, as well as the larger-scale patterns of the atmospheric general circulation [211,212]. The necessary ingredient is the moisture-laden airflow towards a mountain, but a detailed knowledge of the orographically-modified flow is crucial for predicting the intensity, location, and duration of orographic precipitation [213,214]. The small-scale release of buoyant instability by the upslope flow has always been associated with precipitation enhancement in these cases, but Houze and Medina [215] show that cells may appear even if buoyant instability is weak or nonexistent, so that even a stable flow may form cells that will enhance precipitation over the windward slopes. From the satellite-based precipitation retrieval perspective, early attempts to cope with orographic corrections to real-time, high-resolution satellite rainfall rate distributions date back to 2002 [216]; furthermore, diagnostic models, driven by reanalysis data, were used shortly afterwards to improve satellite rainfall estimates in data-sparse regions [217]. More recently, specific campaigns were carried out in the coastal Chilean Andes region [218,219] and in the Southern Appalachian Mountains [220] dwelling on CloudSat and the Cloud-Aerosol Lidar and Infrared Pathfinder Satellite Observations (CALIPSO) instrument. These data have provided a deeper understanding of the microphysical processes leading to orographic enhancement. GPM has offered the opportunity of modeling low-level seeder-feeder interactions to address underestimations and missed detections in QPEs over complex terrains [221]. However, a specific implementation of an orographic/nonorographic rainfall classification scheme for MW radiometer data has, to date, only been implemented for the GSMaP products [222,223,224]. Studies have been conducted on small catchments to try to characterize the error structure, and have confirmed the difficulty of the problem, which remains open [225,226,227].
3.2.6. Observing Extremes
An important discussion concerns the capability of satellite precipitation products to capture extremes and their climatological cycles. Despite uncertainties in total precipitation changes, observations and climate models show robust increases in extreme daily precipitation averaged over both dry and wet regimes over the past six decades; climate projections for the rest of the century point to continued intensification of daily precipitation extremes [228] and the same indicate observations [229]. The CC scaling on temperature may turn out to provide a severe underestimate of observed changes in hourly rainfall extremes, with implications for assessing the impacts of extreme rainfall [230]. It also found that human-induced climate change likely increases the chances of the observed precipitation accumulations during hurricane landfall [231]. This induces wet and dry hydrological extremes, and a quantification of their global cooccurrence is crucial for disaster preparedness [232]. A specific study by Prat and Nelson [233] on the link between tropical cyclones (TC) and daily rainfall extremes using satellite observations has concluded that TCs account for an average of 3.5% ± 1% of the total number of rainy days over land areas experiencing cyclonic activity, regardless of the basin considered. In spite of the general agreement on extremes, their relative weight and expected increase in the future due to higher available moisture content, we still do not fully understand the relationship between the mean state of precipitation and intense precipitation frequency on the most recent climate scale [234]. Studies need to investigate changes in intensity, frequency, and trends, and their links to large-scale features [235]. The advent of satellite global precipitation products extending to high latitudes and of sufficient temporal length has given rise to studies on the occurrence of extremes and their global distribution, yielding findings on model and observation weaknesses [236]. Houze et al. [237] show that extremely intense, deep, convective storms occur often during the warm season (April–September) in the high-latitude continents, where the increase of surface temperature has been greatest, indicating that high-latitude, extreme convection could be more common in a continually warming world.
No single satellite precipitation product can be considered ideal for detecting extreme events. GPM IMERG is able to analyze extreme precipitation events (EPE) to derive their duration, areal coverage, total volume, and propagation [238]. AghaKouchak et al. [239] have demonstrated that all products tend to miss a significant volume of rainfall and to worsen their performance as the choice of extreme precipitation threshold increased. Resolution and accuracy limitations still persist in estimating extreme precipitation [240]. The definition of the accuracy in representing extreme rainfall events for varying time aggregation intervals is one more problem. A study of Mazzoglio et al. [241] concluded that satellite precipitation data guarantee good results when the rainfall aggregation interval is ≥12 h; a 24-h aggregation interval ensures a probability of detection >80%. At the same time, the results depend on the adopted spatial domain and require a multiscale approach to regional trend analysis [242]. Thus, more studies need to focus on capturing the fine time/space scale of extremes from satellite. The key problem is perhaps to disentangle the scale disparity between gridded and rain-gauge precipitation products and the short length of the available satellite records. In this direction, downscaling approaches appear to be a feasible avenue [243]. Satellite precipitation estimates are now contributing to our understanding of the role of major global moisture source regions in the occurrence of extreme monthly precipitation over the continents [244]. In particular, the study of atmospheric rivers (AR, [245,246,247]) as a major water vapor source will benefit from satellite observations [248], also in view of quantifying the role of ARs in fueling extreme events.
4. Applications Related to the Water Cycle
In spite of the numerous limitations of satellite precipitation products, their global coverage, relatively easy access, and documented data format have encouraged their use in a number of applications related to the water cycle. The increasing time span of space-based precipitation data records has given rise to applications that would otherwise not be conceivable, contributing to discoveries related to hydrological and land processes, climate, and ocean freshwater budget, and contributing to the possible solution of societal issues [249]. The planning of new satellite missions nowadays will have to meet end-user application requirements to inform policy and enhance decision-making at the local to global scales [250,251]. Let’s now briefly address some key applications of satellite data products that show the importance of this data source for science and society.
4.1. Assimilation and Validation in NWP Models
Meteorological applications of satellite precipitation data encompass assimilation into, and validation of, NWP models, verification of hurricane track predictions, and nowcasting of severe weather. Ten years ago, precipitation observations were thought to add little benefit to global weather forecasts. Nowadays, at the European Centre for Medium-range Weather Forecasts (ECMWF), satellite MW radiances sensitive to humidity, cloud, and precipitation provide around 20% of short-range forecast impact. This makes them one of the most important data sources, rivaling in impact with MW temperature sounding observations [252]. Satellite data assimilation is rapidly moving beyond the “clear-sky” approach that discards any observation affected by cloud, and operational forecasting centers assimilate cloud- and precipitation-affected radiances operationally [253]. Both 3D- and 4D-Var methods, together with hybrid methods, are applied to improve the initial model state with emphasis on the convective scale driven by the increasingly finer model spatial resolution [254]. As previously discussed, radiometrically-appropriate profiles of temperature, moisture, liquid cloud, and hydrometeors, as well as the surface emissivity spectrum and skin temperature, need to be derived from the inversion of the radiative transfer equation to improve on existing retrieval schemes. This is, for example, the scope of the Microwave Integrated Retrieval System (MiRS, [255]), developed by NOAA, which bridges the gap between retrieval and assimilation.
The efforts to validate satellite precipitation products and use them as validation tools of NWP model outputs have increased notably during the past decade. A cross comparison between the performance of satellite-derived estimates of precipitation occurrence, amount, and intensity, and model outputs shows that the former are more accurate during the warm season and at lower latitudes, where rainfall is essentially convective in nature [256]. NWP models perform better during the cold season, when non-convective precipitation dominates. Note that the verification and validation of models is strictly linked to space and time scales, and is thus very different for NWP and climate models [96,257]. While for climate-scale rainfall the requirement is that the algorithm provides a good estimate on average so that errors on shorter time and space scales are not relevant, the use of short-term precipitation estimates cannot tolerate such errors. Hydrologists, for example, need accurate estimates of the rain volume at the catchment scale, while the NWP community places more value in the correct rain location and type than to retrieving the correct amount. In this direction, an interesting and novel approach is the quantification of the uncertainties of GMI precipitation retrievals based on precipitation system properties, such as the size and intensity of the system, which helps in removing zonal and seasonal biases, thus confirming the importance of using the information on the whole precipitation systems instead of individual pixels in the precipitation retrieval [258].
4.2. Nowcasting
The application to nowcasting and short-term regional weather forecasting is an important further application area. NASA’s Short-term Prediction Research and Transition (SPoRT) Center [259] strives to provide products that enter the operational practice of the National Weather Service (NWS) in remote areas of the US. Flood, and especially flash flood monitoring and short-term forecasting is a key application which requires precipitation products at very short time intervals. The Hydro-Estimator (H-E, [260]) from NOAA has been in use since 2002, and makes available routine estimates every 15 min thanks to the fast repetition rate of GEO IR data. Rainfall totals at 1, 6, and 24 h are produced by NOAA’s Self-Calibrating Multivariate Precipitation Retrieval (SCaMPR, [261,262]) algorithm, combining GEO IR and LEO MW data for hydrological applications over the continental US. The algorithms of the Satellite Application Facility in Support to Operational Hydrology and Water Management (H SAF) of EUMETSAT are used in hydrological applications [263]. A separate topic is the improvement of rainfall potential and tracking of hurricanes. The ensemble Tropical Rainfall Potential (eTRaP) was developed to improve short-range forecasts of heavy rainfall in tropical cyclones [264] (https://www.ssd.noaa.gov/PS/TROP/etrap.html, last accessed 20 August 2019; see Figure 9). The assimilation of MW observations in NWP models is also improving weather prediction and the forecasting of tropical cyclone tracks and intensities [251].
4.3. Analysis of Precipitation Climatological Patterns
The discussion on the water cycle closure on the regional and global scales requires knowledge of sources and sinks of atmospheric moisture, both oceanic and terrestrial. This is particularly important, since changes in the intensity and location of sources can affect the distribution of continental precipitation in a changing climate [265]. The availability of satellite precipitation products contributes to shedding light on climatological precipitation patterns in climate hot spots, such as the Amazon forest. Molina et al. [266] have found that precipitation exponentially increases with distance from the ocean along wind streamlines flowing over forests, while it exponentially decreases downwind of the forests. Drier regions of the world, such as East Africa, are frequently affected by severe droughts that are strongly linked to the seasonal cycles, intraseasonal and interannual variability, and local geography [267]. Satellite precipitation products can significantly help in understanding trends and variability of rainfall in the area [268] and their links with SST and soil moisture [269]. Moreover, they are starting to contribute significantly to devising strategies for managing the increased demand of groundwater connected with drought episodes [270,271], and to identifying trends in Africa’s freshwater resources. [272] Changes in precipitation patterns under different future scenarios in the Hindu-Kush Karakoram Himalaya region are linked to the monsoon system. Palazzi et al. [273] have used satellite precipitation data, together with reanalyses and in situ gauge data, finding an increasing trend over the Himalaya during summer, associated with an increase in wet extremes and daily intensity and a decrease in the number of rainy days. The precipitation and moisture patterns over the Tibetan Plateau (previously identified as the “Third Pole”) have so far been poorly documented due to a scarcity of in situ observations over such an enormous area. Once again, satellite data help in investigating the seasonality and variability of precipitation together with reanalyses [274,275,276]. The continuous development of reanalysis datasets is encouraging this synergy of analysis and observation data and their intercomparison for a better quantification of the closure terms. The reanalysis datasets most used for global and regional water cycle research are those from the National Centers for Environmental Prediction (NCEP, [277]), the Japan Meteorological Agency (JMA, [278]), NASA, [279], and ECMWF [280]. The Twentieth Century Reanalysis (20CR, [281]) makes available a comprehensive global atmospheric circulation dataset with quantified uncertainties for validations of climate model simulations of the twentieth century on all time-scales.
4.4. Hydrology and Water Management
Serrat-Capdevila et al. [282] have identified several issues for the applicability of satellite precipitation data that are worthy of special attention: (1) error reduction at the source; (2) the availability of rapid observation updates and data assimilation; (3) consideration of additional rainfall system information; (4) local algorithm calibration; and (5) the evaluation of uncertainty or error in the estimates. Five years since the publication of this appraisal, we can safely say that most of these issues have been addressed, although not completely.
The community is producing results that are very promising for monitoring, planning, and designing infrastructures in poorly-gauged areas. Water security is one of the most critical issues in this context, and satellite remote sensing techniques are of particular importance for emerging regions with inadequate in situ gauge observations [283]. Research attention is to be focused on precipitation frequency, especially of extreme precipitation, to appropriately manage weather-related risks and in the design of hydraulic structures [284]. Spatially-distributed hydrologic modeling for water management is feasible for the large basins under the scenario of inadequate in situ data availability; satellite precipitation datasets provide the necessary skill for water balance studies on interannual and inter-seasonal scales [285,286]. Community models are being developed to simulate water resource availability considering human activities [287]. The utility of satellite observations through data assimilation for water resource monitoring can vary as a function of dominant hydrological processes. Opportunities for improvement are mainly related to the development of more accurate and higher spatial and temporal resolution precipitation products, and to the use of a wider range of remote sensing products in a priori model parameter estimation, model evaluation, and data assimilation [288]. The use of satellite precipitation products is prompting such approaches in poorly-gauged or ungauged regions through the use of intensity-duration-frequency (IDF) curves [289,290], which have mostly been used in small watersheds, and now need to be applied more widely. Hydrological applications also call for the availability of long-time records that are consistent across satellite platforms, and are specifically designed for hydrology. A recent example of such a dataset is the MW-based hydrological bundle climate data record (CDR), designed by NOAA [291] (https://www.ncdc.noaa.gov/cdr/atmospheric/hydrological-properties, last accessed 24 September 2019).
4.5. Hydrogeology
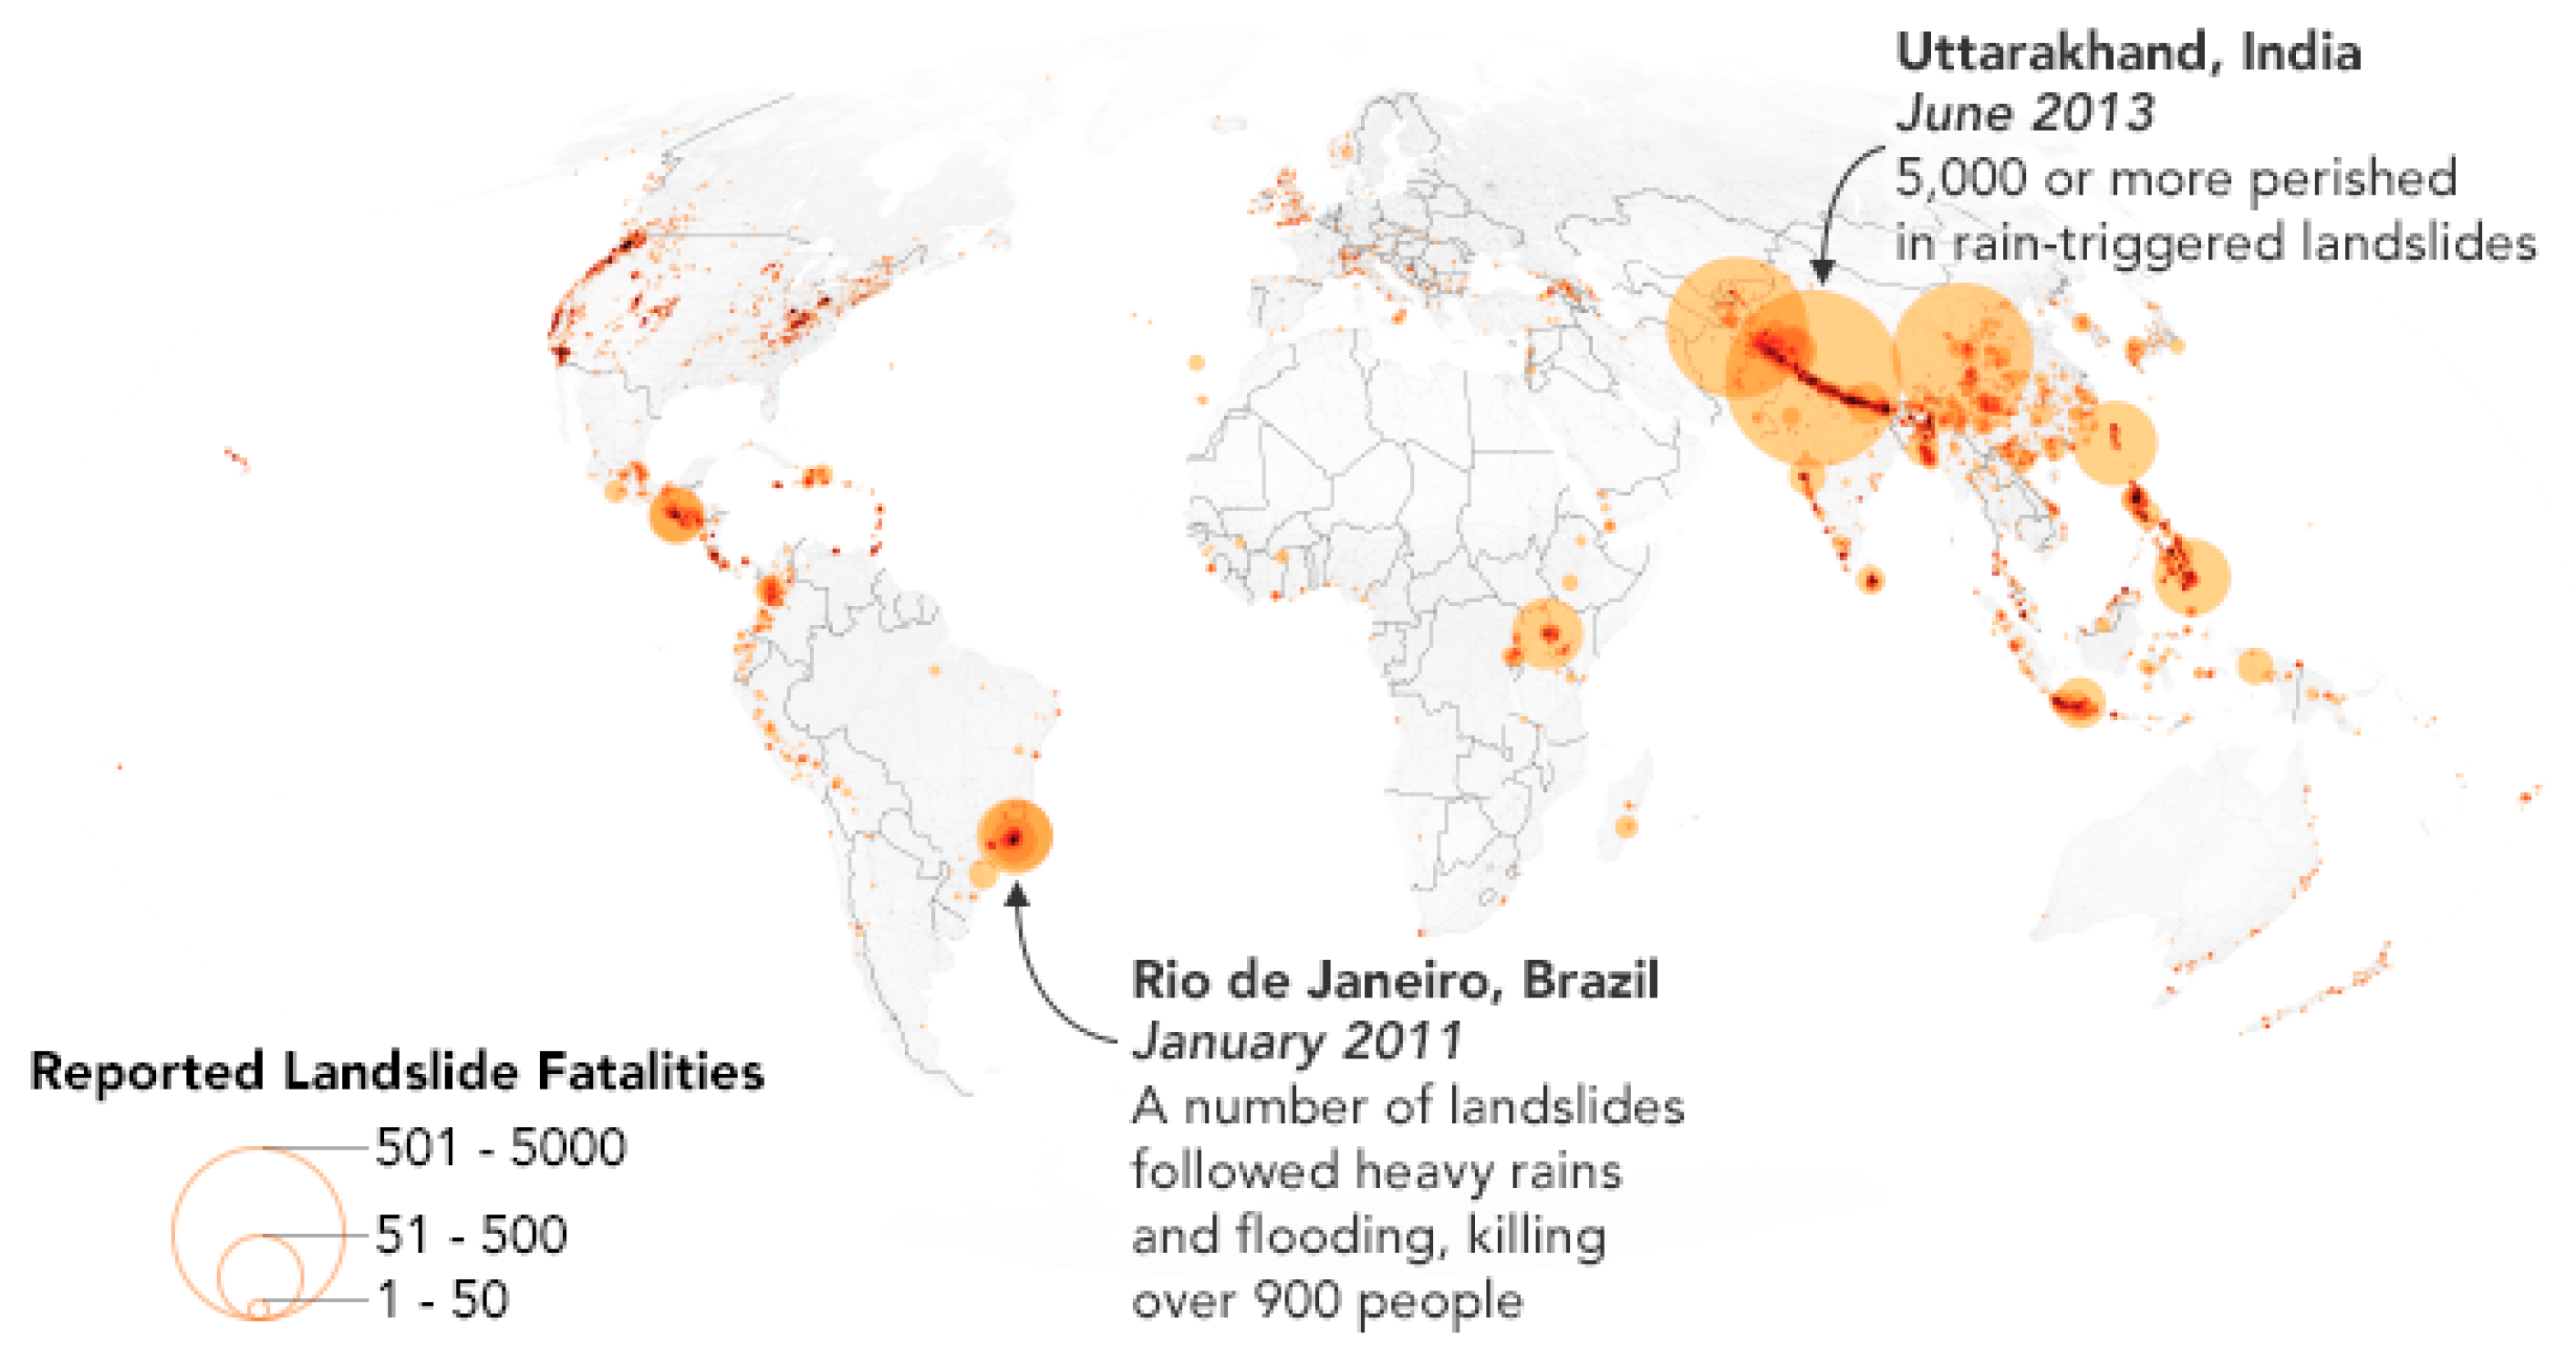
Storms with high-intensity, long-duration rainfall have a clear impact on the water cycle, and they often trigger rapidly-moving landslides, resulting in casualties and property damage. The monitoring of landslide-prone areas has normally been conducted through in situ geological mapping. However, satellite precipitation data makes it possible to conduct global-scale landslide hazard assessments. The potential of the TMPA product to advance our understanding of rainfall-triggered landslides, and also to investigate our predictive ability, was first explored by Hong et al. [292,293]. A stochastic algorithm was then developed to conduct near real-time estimates and forecasts of landslide-prone areas by combining a calculation of landslide susceptibility (derived from slope and soil characteristics) with satellite derived rainfall estimates [294]. A global landslide catalog (GLC) quantifies the relationship between landslide occurrence and climate variations [295,296] (see Figure 10). Moreover, satellite approaches are particularly effective in understanding and quantifying cascading hazard processes which are not necessarily induced by heavy rainfall only, but also from seismic activity or snow melt on vulnerable complex terrain [297].
Rainfall contributes also to soil erosion through its kinetic energy, which determines erosivity and is, in turn, greatly dependent on rainfall intensity. Satellite rainfall data contribute to erosivity mapping, especially in data sparse areas such as the African continent [298].
4.6. Food Security
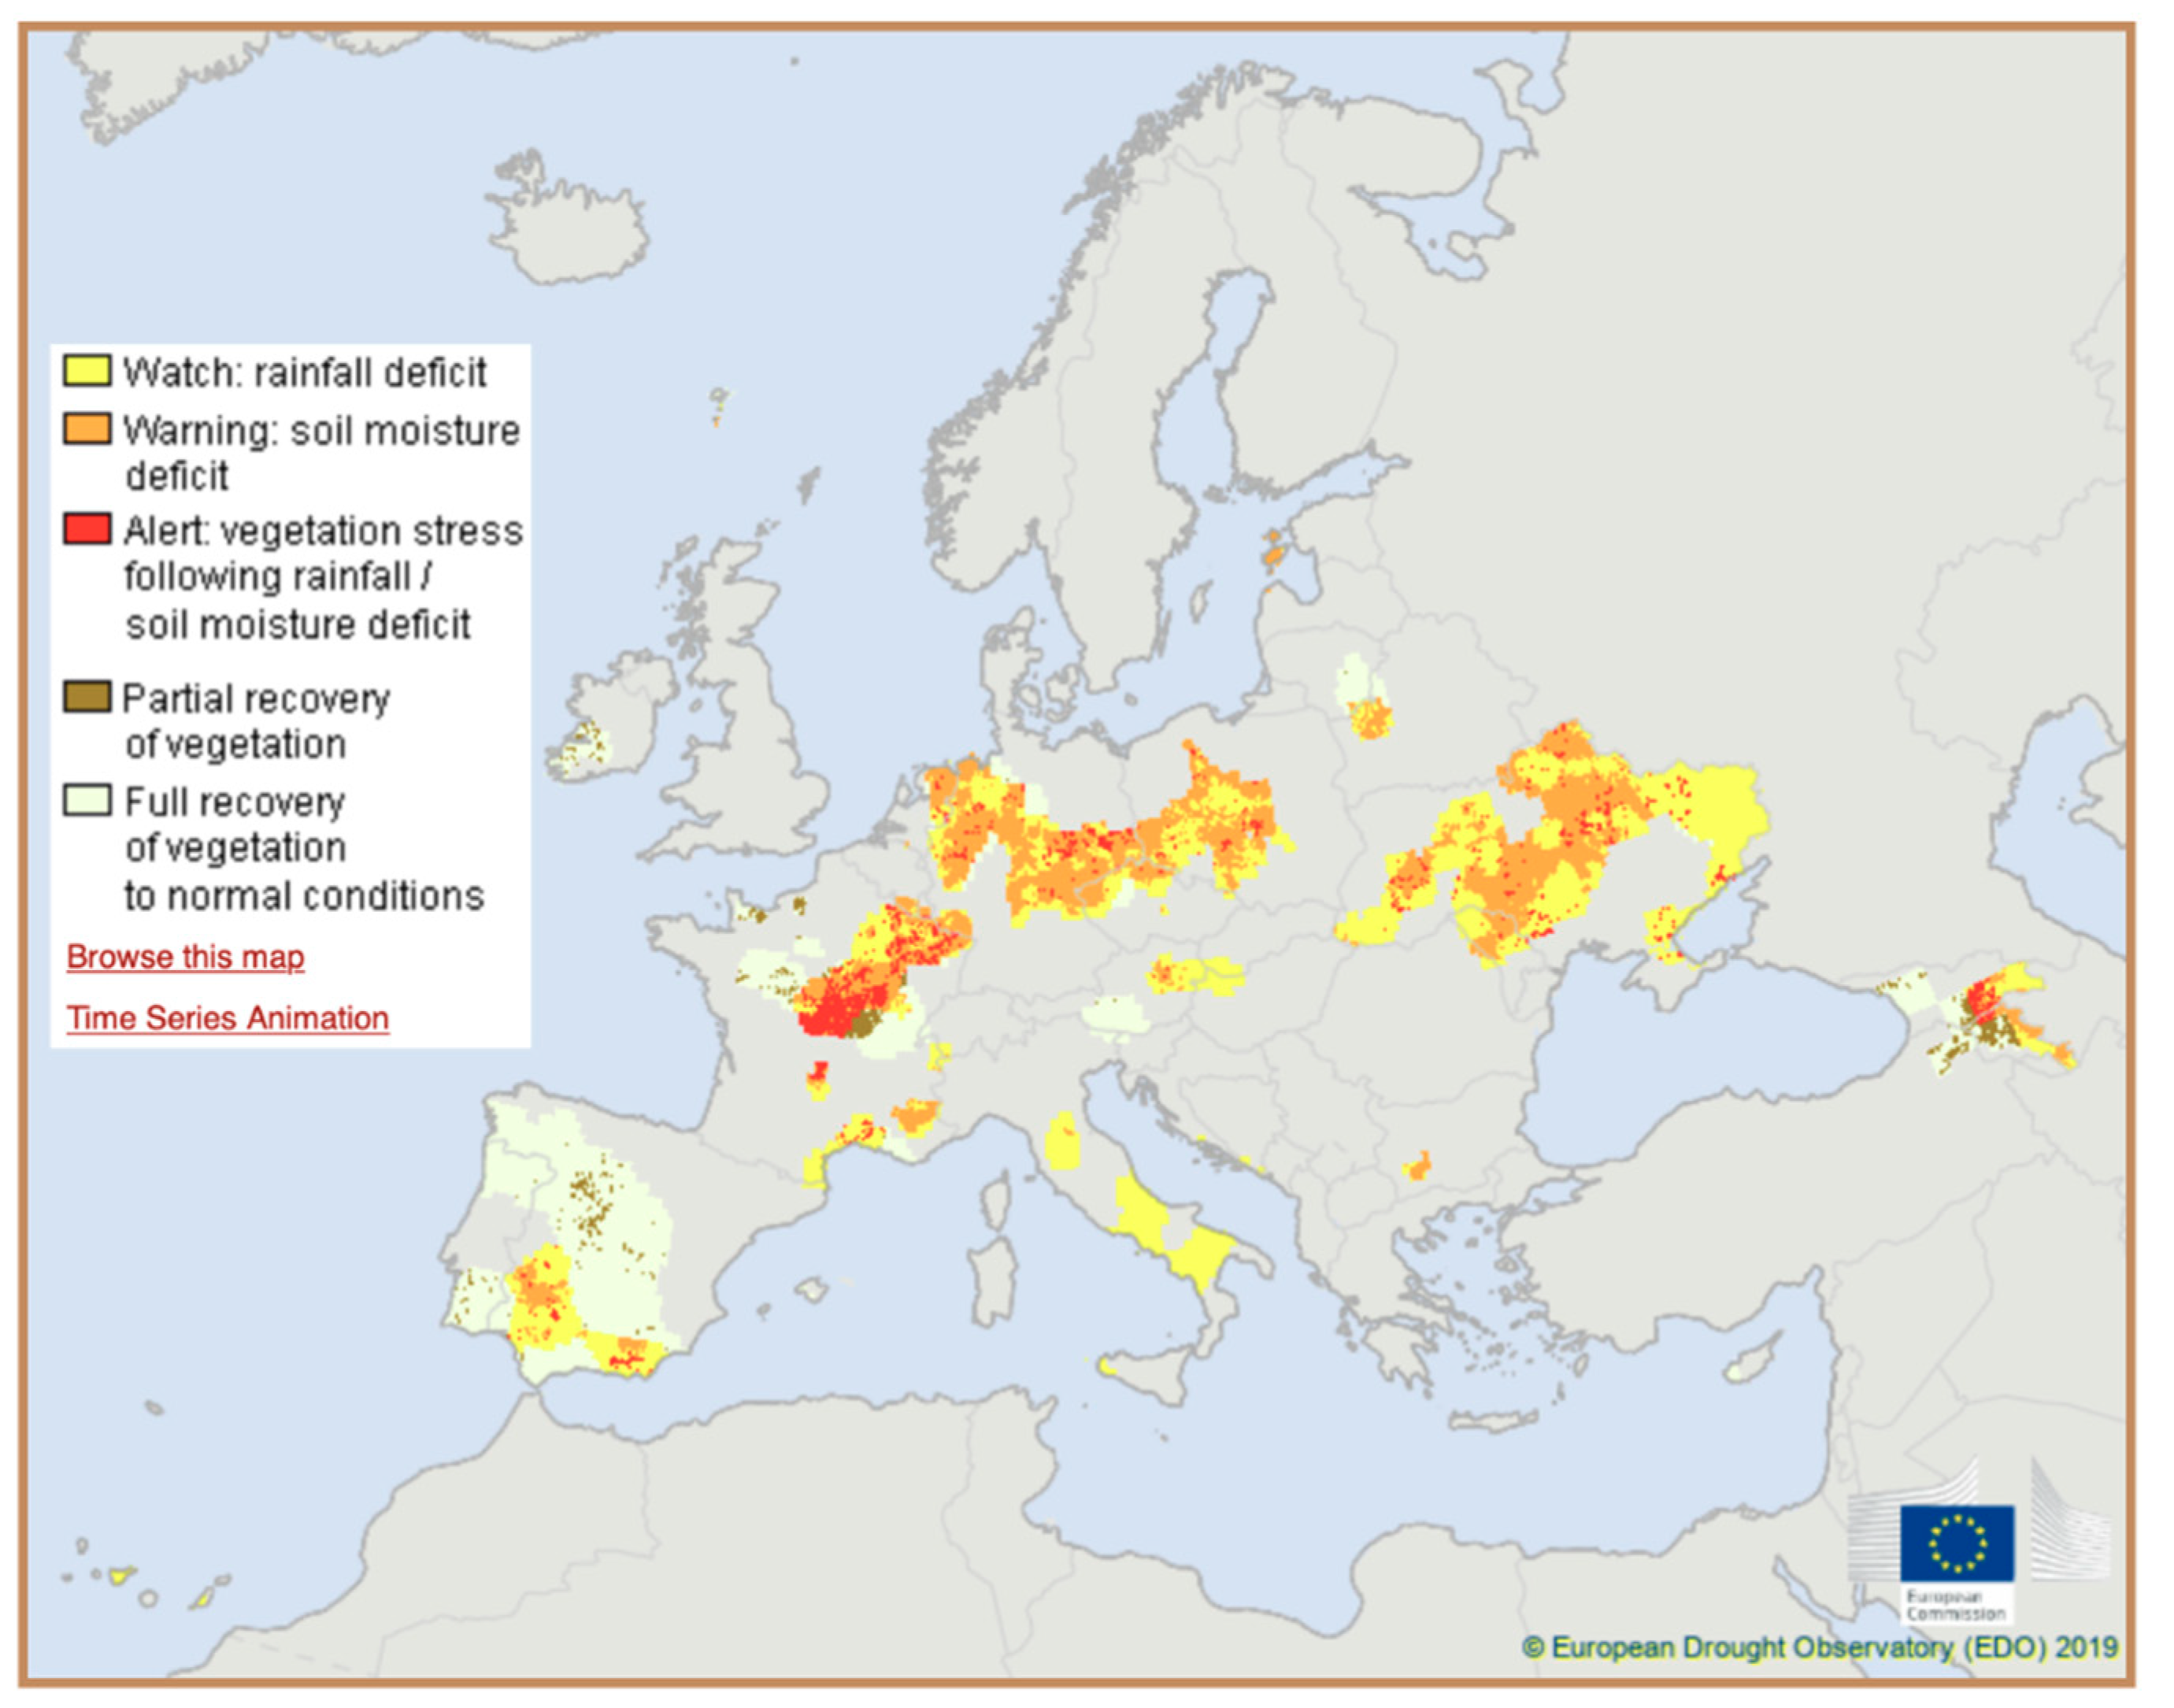
Water cycle changes influence the lives of millions of people affected by droughts who face a threat to their livelihoods. These people are heavily dependent on rainfed agriculture and livestock, especially in Africa, Central America, and Southwest Asia. The US Famine Early Warning System NETwork (FEWS NET; http://fews.net, last accessed 21 August 2019) provides guidance for effective humanitarian relief efforts, drawing information from many disciplines such as remote sensing (precipitation above all), climate predictions, agroclimatic monitoring, and hydrological modeling [299]. Climate services make available climate information, including precipitation data, that are often inaccessible to those who need them most. The collaboration between NASA and the US Agency for International Development has funded the SERVIR remote sensing initiative (https://www.nasa.gov/mission_pages/servir/index.html, last accessed 13 September 2019) to provide state-of-the-art, satellite-based Earth monitoring, imaging and mapping data, geospatial information, predictive models, and science applications to help improve environmental decision-making among developing nations in many parts of the world. The Enhancing National Climate Services (ENACTS; https://iri.columbia.edu/resources/enacts/, last accessed 21 August 2019) project of the International Research Institute for Climate and Society (IRI) [300] is an initiative to improve the availability, access, and use of climate information in Africa for the characterization of climate risks and to help with decision making. The recently-developed NASA Hydrological Forecasting and Analysis System (NHyFAS) has been applied to Southern Africa to support food insecurity early warning in the region [301]. In Europe, the Joint Programming Initiative (JPI) Water of the European Union deals with research to ensure the availability of water in sufficient quantities and of adequate quality as a pan-European and global environmental challenge (http://www.waterjpi.eu, last accessed 13 September 2019). The European Commission (EC) has launched numerous climate service projects under the umbrella of Copernicus (https://www.copernicus.eu/en, last accessed 20 August 2019), i.e., divided in atmosphere, marine, land, climate change, security, and emergency. The European Drought Observatory (EDO) [302] (Figure 11) is an example of such Copernicus initiatives (https://edo.jrc.ec.europa.eu/edov2/php/index.php?id=1000, last accessed 24 September 2019).
4.7. Public Health
Among societal needs, public health is of paramount importance. The GPM Disease Initiative (https://pmm.nasa.gov/disease-initiative, last accessed 11 September 2019) and its related vector-borne and water-related disease application campaign are an example of such new social projects. Vector-borne diseases (e.g., cholera, malaria, dengue fever, etc.), which are responsible for over 17% of all infectious diseases globally, strongly depend on the environmental conditions, water presence, and sanitation, all factors, which are often disrupted during extreme events [250,303]. Moreover, the spread and incidence of this type of disease can be affected by climate patterns, as shown by Moore et al. [304] for cholera in Africa. More generally, public concerns about the health effects of climate change have the potential to accelerate research and political action in a much more effective way than simple attention to carbon dioxide emissions alone [305,306].
5. Outlook
Research on the terrestrial water cycle is in a very early stage, and no firm conclusions can be drawn on the closure of the cycle at regional or global levels. Climate models all agree on the DDWW paradigm characterizing the future of the Earth’s climate. Storms (individual thunderstorms, extratropical rain or snow storms, or tropical cyclones) supplied with increased moisture produce more intense precipitation events. Moreover, warming induces more precipitation as rain instead of snow; snow, in turn, melts earlier, with increased runoff and risk of flooding in early spring and increased risk of drought in summer, especially over continental areas [307]. This suggests that climate change must already be considered in flood risk management [308]. Recent modeling results argue that concurrent soil drought and atmospheric aridity are greatly exacerbated by land–atmosphere feedback and soil moisture–precipitation feedback, amplifying precipitation and soil moisture deficits in most regions as derived from the Global Land-Atmosphere Climate Experiment (GLACE) Coupled Model Intercomparison Project phase 5 (CMIP5) [309,310,311,312].
All these results rely upon the support of a global observing system that continuously monitors the atmosphere, the continents, and the oceans with a unified perspective, improving over existing networks that were not originally designed for climate monitoring [61,62,66]. Satellite precipitation measurements have a key role in this scientific framework, and advances in the observing constellation are on their way as:
- the better quantification of high-latitude precipitation including snowfall;
- the improved accuracy in precipitation detection and intensity retrievals;
- the definition of error models for each satellite product;
- the creation of multi-satellite and multi-source global precipitation products.
At the same time, precipitation CDRs data need maintenance and a continuous launch of sensors that replace the old ones as they are decommissioned. This is crucial for climate observations which are based on long-time datasets. Smallsats may help with their low-cost strategy and light-weight payloads. The satellite precipitation community is at work to design the next generation of spacecrafts and sensors for clouds and precipitation monitoring [99]. Research efforts are devoted to solving the issues with retrieval algorithms that are discussed in Section 3.2.
However, this strategy is not sufficient, as satellite-derived products need to be compared and integrated with ground-based products and model outputs to produce global comprehensive analyses for assimilation and model verification. Hydrological model ensembles will, more and more, represent a tool for global water resource evaluations [313] and for the quantification of uncertainties [314] and their propagation [315] in the analysis of climate change impact on water resources. The assimilation of satellite precipitation estimates in the models can significantly improve the quality of the single model [72], and thus, increase the value of ensembles. In fact, a good performance of hydrological models in the historical period increases confidence in projected impacts under climate change and decreases the uncertainty of projections related to the hydrological models themselves [316]. Note that studies are necessary on the performance of satellite precipitation products when used as main forcing in a grid-based distributed hydrological model to assess streamflow in medium to large-scale river basins [317]. Satellite data are important, especially for land-surface model development regarding soil moisture, total terrestrial water storage, evapotranspiration, streamflow, and land surface temperature, among other variables [55,318]. An additional application concerns the investigation of surface sensible heat fluxes behind the mega-heatwaves that are projected to aggravate with the increase of subtropical droughts [319]; in this direction, satellite precipitation will ideally be used together with CDRs, like the recently-published Climate Hazards Center Infrared Temperature with Stations (CHIRTS) [320], and also with downscaled climate datasets that become available through open access [321].
In summary, satellite remote sensing of precipitation has the potential to considerably advance our understanding of the water cycle, and research has to be focused on answering the basic questions of the water cycle under climate change conditions, i.e., water vapor residence time in the atmosphere and recycling over the continents, precipitation more concentrated in extreme events, the increase of drought episodes in tropical and sub-tropical areas, and changes in the frequency and intensity of tropical cyclones [36]. The use of satellite data does not mean that ground-based data cease to be fundamental. However, recent surveys of available datasets show that the existence of no single satisfactory approach to the adjustment of gauge bias [322], poor spatial coverage, temporal inhomogeneity, and inadequate sharing of in situ observations are the key obstacles to obtaining more accurate estimates of terrestrial mean precipitation [323].
Keen attention must be paid to areas that are more affected by water scarcity, such as the African continent [324,325], where water shortages may concern 37% of the 2025 population (~600 million people) and 57% in 2050 (~1.4 billion people), under the hypothesis of a decrease in water resources by 10%. Concerning water management, Biswas and Tortajada [326] point out unambiguously that “countries will have to manage their water significantly better, because they will have no other choice”. Notably, data-scarce regions will need to rely on satellite data to help addressing such serious concerns.
Author Contributions
V.L. conceived the idea of the review and wrote the paper. E.C. contributed to the paper architecture and helped in writing.
Funding
This research received no external funding.
Acknowledgments
The authors are grateful to their home institution for allowing them to use time and facilities to complete the review. Two anonymous reviewers deserve gratitude for their helpful suggestions, which significantly contributed to improve the overall quality of the paper.
Conflicts of Interest
The authors declare no conflict of interest.
Acronyms
| AR | Atmospheric River |
| AR4 | IPCC 4th Assessment Report |
| AR5 | IPCC 5th Assessment Report |
| ARC2 | Africa Rainfall Climatology 2.0 |
| ASCAT | Advanced SCATterometer |
| CALIPSO | Cloud-Aerosol Lidar and Infrared Pathfinder Satellite Observations |
| CAMELS-CL | Catchment Attributes and MEteorology for Large-sample Studies-Chile |
| CC | Clausius-Clapeyron temperature scaling |
| CCI | Climate Change Initiative |
| CDR | Climate Data Record |
| CGMS | Coordination Group for Meteorological Satellites |
| CHIRPS | Climate Hazards Center’s Infrared Precipitation with Stations |
| CHIRTS | Climate Hazards Center Infrared Temperature with Stations |
| CIMR | Copernicus Imaging Microwave Radiometry |
| CMAP | CPC Merged Analysis of Precipitation |
| CMIP5 | Coupled Model Intercomparison Project phase 5 |
| CMORPH | CPC MORPHing technique |
| CPC | Climate Prediction Center |
| CPP | Cloud and Precipitation Process mission |
| DDWW | Dry regions to become Drier and Wet regions to become Wetter paradigm |
| DFPSCAT | Dual-Frequency Polarized SCATterometer |
| DNN | Deep Neural Networks |
| DOLCE | Derived Optimal Linear Combination Evapotranspiration |
| DPR | Dual-frequency Precipitation Radar |
| EarthCARE | Earth Clouds, Aerosol and Radiation Explorer |
| EC | European Commission |
| ECE | Extreme Climatic Event |
| ECMWF | European Centre for Medium-range Weather Forecasts |
| ECV | Essential Climate Variable |
| EDO | European Drought Observatory |
| ENACTS | Enhancing National Climate Services |
| EPE | Extreme Precipitation Event |
| EPS-SG | EUMETSAT Polar System-Second Generation |
| ESA | European Space Agency |
| eTRaP | ensemble Tropical Rainfall Potential |
| EU | European Union |
| EUMETSAT | European Organization for the Exploitation of Meteorological Satellites |
| FEWS NET | Famine Early Warning System NETwork |
| FPIR | Fully-Polarized Interferometric synthetic aperture microwave Radiometer |
| GCOS | Global Climate Observing System |
| GEO | Geosynchronous Earth Orbit |
| GHCN | Global Historical Climatology Network |
| GLACE | Global Land-Atmosphere Climate Experiment |
| GLC | Global Landslide Catalog |
| GLDAS | Global Land Data Assimilation System |
| GLEAM | Global Land Evaporation Amsterdam Model |
| GMI | GPM Microwave Imager |
| GOOS | Global Ocean Observing System |
| GPCC | Global Precipitation Climatology Center |
| GPCP | Global Precipitation Climatology Project |
| GPM | Global Precipitation Measurement mission |
| GRACE | Gravity Recovery and Climate Experiment |
| GSMaP | Global Satellite Mapping of Precipitation |
| GSOD | Global Summary of the Day |
| H-E | Hydro-Estimator |
| ICI | Ice Cloud Imager |
| ICOADS | International Comprehensive Ocean-Atmosphere Data Set |
| IDF | Intensity-Duration-Frequency curves |
| IMERG | Integrated Multi-satellitE Retrievals for GPM |
| IPCC | International Panel on Climate Change |
| IPWG | International Precipitation Working Group |
| IR | InfraRed |
| IRI | International Research Institute for Climate and Society |
| IWSSM | International Workshop on Space-based Snowfall Measurement |
| JMA | Japan Meteorological Agency |
| JPI | Joint Programming Initiative |
| JPL | Jet Propulsion Laboratory |
| LEO | Low Earth Orbit |
| LORA | Linear Optimal Runoff Aggregate |
| LSE | Land Surface Emissivity |
| MiRS | Microwave Integrated Retrieval System |
| MRMS | Multi-Radar/Multi-Sensor System |
| MSWEP | Multi-Source Weighted-Ensemble Precipitation |
| MW | MicroWave |
| NASA | National Aeronautics and Space Administration |
| NCEP | National Centers for Environmental Prediction |
| NHyFAS | NASA Hydrological Forecasting and Analysis System |
| NOAA | National Oceanic and Atmospheric Administration |
| NSSL | National Severe Storms Laboratory |
| NWP | Numerical Weather Prediction |
| NWS | National Weather Service |
| OceanRAIN | Ocean Rainfall And Ice-phase precipitation measurement Network |
| OLR | Outgoing Longwave Radiation |
| OSCAR | Observing Systems Capability Analysis and Review |
| PACRAIN | Pacific Rainfall Database |
| PERSIANN | Precipitation Estimation from Remotely Sensed Information using Artificial Neural |
| Networks | |
| PMI | Polarized Microwave radiometric Imager |
| PMW | Passive MW |
| PR | Precipitation Radar |
| QPE | Quantitative Precipitation Estimates |
| REGEN | Rainfall Estimates on a Gridded Network |
| SCaMPR | Self-Calibrating Multivariate Precipitation Retrieval |
| SMAP | Soil Moisture Active Passive |
| SMOS | Soil Moisture Ocean Salinity |
| SM2RAIN | Soil Moisture to Rain method |
| SPoRT | Short-term Prediction Research and Transition |
| SWOT | Surface Water and Ocean Topography mission |
| SWR | Short Wave Radiation |
| TAMSAT | Tropical Applications of Meteorology using SATellite data and ground-based observations |
| TAPEER | Tropical Amount of Rainfall with Estimation of Errors |
| TC | Tropical Cyclone |
| TELSEM | Tool to Estimate Land-Surface Emissivities at Microwave frequencies |
| TEMPEST | Temporal Experiment for Storms and Tropical Systems |
| TMPA | TRMM Multi-satellite Precipitation Analysis |
| TRMM | Tropical Rainfall Measuring Mission |
| TROPICS | Time-Resolved Observations of Precipitation structure and storm Intensity with a Constellation of Smallsats |
| VIS | Visible |
| WCOM | Water Cycle Observation Mission |
| WCRP | World Climate Research Program |
| WIVERN | Wind Velocity Radar Nephoscope |
| WMO | World Meteorological Organization |
| 20CR | Twentieth Century Reanalysis |
References
- Schneider, U.; Finger, P.; Meyer-Christoffer, A.; Rustemeier, E.; Ziese, M.; Becker, A. Evaluating the hydrological cycle over land using the newly-corrected precipitation climatology from the Global Precipitation Climatology Centre (GPCC). Atmosphere 2017, 8, 52. [Google Scholar] [CrossRef]
- Oki, T.; Kanae, S. Global hydrological cycles and world water resources. Science 2006, 313, 1068–1072. [Google Scholar] [CrossRef] [PubMed]
- Trenberth, K.E.; Smith, L.; Qian, T.; Dai, A.; Fasullo, J. Estimates of the global water budget and its annual cycle using observational and model data. J. Hydrometeorol. 2007, 8, 758–769. [Google Scholar] [CrossRef]
- Abbott, B.W.; Bishop, K.; Zarnetske, J.P.; Hannah, D.M.; Frei, R.J.; Minaudo, C.; Chapin, F.S., III; Krause, S.; Conner, L.; Ellison, D.; et al. A water cycle for the Anthropocene. Hydrol. Proc. 2019. [Google Scholar] [CrossRef]
- Denman, K.L.; Brasseur, G.; Chidthaisong, A.; Ciais, P.; Cox, P.M.; Dickinson, R.E.; Hauglustaine, D.; Heinze, C.; Holland, E.; Jacob, D.; et al. Couplings Between Changes in the Climate System and Biogeochemistry. In Climate Change 2007: The Physical Science Basis. Contribution of Working Group I to the Fourth Assessment Report of the Intergovernmental Panel on Climate Change; Solomon, S., Qin, D., Manning, M., Chen, Z., Marquis, M., Averyt, K.B., Tignor, M., Miller, H.L., Eds.; Cambridge Univ. Press: Cambridge, UK; New York, NY, USA, 2007; Available online: https://www.ipcc.ch/site/assets/uploads/2018/02/ar4-wg1-chapter7-1.pdf (accessed on 28 August 2019).
- Trenberth, K.E.; Fasullo, J.T.; Kiehl, J. Earth’s global energy budget. Bull. Am. Meteorol. Soc. 2009, 90, 311–324. [Google Scholar] [CrossRef]
- Loeb, N.G.; Wielicki, B.A.; Doelling, D.R.; Smith, G.L.; Keyes, D.F.; Kato, S.; Manalo-Smith, N.; Wong, T. Toward optimal closure of the Earth’s top-of-atmosphere radiation budget. J. Clim. 2009, 22, 748–766. [Google Scholar] [CrossRef]
- Siler, N.; Roe, G.H.; Armour, K.C.; Feldl, N. Revisiting the surface-energy-flux perspective on the sensitivity of global precipitation to climate change. Clim. Dyn. 2019, 53, 3983. [Google Scholar] [CrossRef]
- Ramanathan, V.; Crutzen, P.J.; Kiehl, J.T.; Rosenfeld, D. Aerosols, climate and the hydrological cycle. Science 2001, 294, 2119–2124. [Google Scholar] [CrossRef] [PubMed]
- Mercado-Bettín, D.; Salazar, J.F.; Villegas, J.C. Long-term water balance partitioning explained by physical and ecological characteristics in world river basins. Echohydrolgy 2019, 12, 2072. [Google Scholar] [CrossRef]
- Vergopolan, N.; Fisher, J.B. The impact of deforestation on the hydrological cycle in Amazonia as observed from remote sensing. Int. J. Remote Sens. 2016, 37, 5412–5430. [Google Scholar] [CrossRef]
- Ciemer, C.; Boers, N.; Hirota, M.; Kurths, J.; Müller-Hansen, F.; Oliveira, R.S.; Winkelmann, R. Higher resilience to climatic disturbances in tropical vegetation exposed to more variable rainfall. Nat. Geosci. 2019, 12, 174–179. [Google Scholar] [CrossRef]
- Bonnesoeur, V.; Locatelli, B.; Guariguata, M.R.; Ochoa-Tocachi, B.F.; Vanacker, V.; Mao, Z.; Stokes, A.; Mathez-Stiefel, S.-L. Impacts of forests and forestation on hydrological services in the Andes: A systematic review. For. Ecol. Manag. 2019, 433, 569–584. [Google Scholar] [CrossRef]
- Ellison, D. From Myth to Concept and Beyond–The BioGeoPhysical Revolution and the Forest-Water Paradigm; UNFF 13; UN: Geneva, Switzerland, 2018; p. 45. [Google Scholar] [CrossRef]
- Ellison, D.; Morris, C.E.; Locatelli, B.; Sheil, D.; Cohen, J.; Murdiyarso, D.; Gutierrez, V.; van Noordwijk, M.; Creed, I.F.; Pokorny, J.; et al. Trees, forests and water: Cool insights for a hot world. Glob. Environ. Chang. 2017, 43, 51–61. [Google Scholar] [CrossRef]
- Häder, D.-P.; Barnes, P.W. Comparing the impacts of climate change on the responses and linkages between terrestrial and aquatic ecosystems. Sci. Total Environ. 2019, 682, 239–246. [Google Scholar] [CrossRef] [PubMed]
- Korenaga, J.; Planavsky, N.J.; Evans, D.A.D. Global water cycle and the coevolution of the Earth’s interior and surface environment. Philos. Trans. R. Soc. A 2017, 375, 0393. [Google Scholar] [CrossRef] [PubMed]
- Gleeson, T.; Zipper, S.C.; Erlandsson, L.W.; Porkka, M.; Jaramillo, F.; Gerten, D.; Fetzer, I.; Cornell, S.E.; Piemontese, L.; Gordon, L.; et al. The water planetary boundary: A roadmap to illuminate water cycle modifications in the Anthropocene. Earth ArXiv 2019. [Google Scholar] [CrossRef]
- Konar, M.; Garcia, M.; Sanderson, M.R.; Yu, D.J.; Sivapalan, M. Expanding the scope and foundation of sociohydrology as the science of coupled human-water systems. Water Resour. Res. 2019, 55, 874–887. [Google Scholar] [CrossRef]
- Roobavannan, M.; Kandasamy, J.; Pande, S.; Vigneswaran, S.; Sivapalan, M. Role of sectoral transformation in the evolution of water management norms in agricultural catchments: A sociohydrologic modeling analysis. Water Resour. Res. 2017, 53, 8344–8365. [Google Scholar] [CrossRef]
- D’Odorico, P.; Carr, J.; Dalin, C.; Dell’Angelo, J.; Konar, M.; Laio, F.; Ridolfi, L.; Rosa, L.; Suweis, S.; Tamea, S.; et al. Global virtual water trade and the hydrological cycle: Patterns, drivers, and socio-environmental impacts. Environ. Res. Lett. 2019, 14, 053001. [Google Scholar] [CrossRef]
- Sun, G.; Hallema, D.; Asbjornsen, H. Ecohydrological processes and ecosystem services in the Anthropocene: A review. Ecol. Proc. 2017, 6, 35. [Google Scholar] [CrossRef]
- Abbott, B.W.; Bishop, K.; Zarnetske, J.P.; Minaudo, C.; Chapin, F.S., III; Krause, S.; Hannah, D.M.; Conner, L.; Ellison, D.; Godsey, S.E.; et al. Human domination of the global water cycle absent from depictions and perceptions. Nat. Geosci. 2019, 12, 533–540. [Google Scholar] [CrossRef]
- Smith, M.D. The ecological role of climate extremes: Current understanding and future prospects. J. Ecol. 2011, 99, 651–655. [Google Scholar] [CrossRef]
- Sivapalan, M. From engineering hydrology to Earth system science: Milestones in the transformation of hydrologic science. Hydrol. Earth Syst. Sci. 2018, 22, 1665–1693. [Google Scholar] [CrossRef]
- Marsalek, J.; Jimémez-Cisneros, B.; Karamouz, M.; Malmquist, P.-A.; Goldenfum, J.; Chocat, B. Urban Water Cycle Processes and Interactions; UNESCO Water Series; Taylor & Francis: Leiden, The Netherlands, 2008; p. 152. ISBN 978-0415453462. [Google Scholar]
- Hao, L.; Huang, X.; Qin, M.; Liu, Y.; Li, W.; Sun, G. Ecohydrological processes explain urban dry island effects in a wet region, Southern China. Water Resour. Res. 2018, 54, 6757–6771. [Google Scholar] [CrossRef]
- Peña-Guzmán, C.A.; Malgarejo, J.; Prats, D.; Torres, A.; Martínez, S. Urban water cycle simulation/management models: A review. Water 2017, 9, 285. [Google Scholar] [CrossRef]
- Lahoz, W.A.; De Lannoy, G.J.M. Closing the gaps in our knowledge of the hydrological cycle over land: Conceptual problems. Surv. Geophys. 2014, 35, 623–660. [Google Scholar] [CrossRef]
- Lettenmaier, D.P. Observational breakthroughs lead the way to improved hydrological predictions. Water Resour. Res. 2017, 53, 2591–2597. [Google Scholar] [CrossRef] [Green Version]
- Trenberth, K.E.; Dai, A.; Rasmussen, R.M.; Parsons, D.B. The changing character of precipitation. Bull. Am. Meteorol. Soc. 2003, 84, 1205–1218. [Google Scholar] [CrossRef]
- Trenberth, K.E.; Zhang, Y. How often does it rain? Bull. Am. Meteorol. Soc. 2018, 99, 289–298. [Google Scholar] [CrossRef]
- Giorgi, F.; Raffaele, F.; Coppola, E. The response of precipitation characteristics to global warming from climate projections. Earth Syst. Dyn. 2019, 10, 73–89. [Google Scholar] [CrossRef] [Green Version]
- Mathew, S.S.; Kumar, K.K. Characterization of the long-term changes in moisture, clouds and precipitation in the ascending and descending branches of the Hadley Circulation. J. Hydrol. 2019, 570, 366–377. [Google Scholar] [CrossRef]
- Chen, G.; Norris, J.; Neelin, J.D.; Lu, J.; Leung, R.; Sakaguchi, K. Thermodynamic and dynamic mechanisms for hydrological cycle intensification over the full probability distribution of precipitation events. J. Atmos. Sci. 2019, 76, 497–516. [Google Scholar] [CrossRef]
- Bengtsson, L. The global atmospheric water cycle. Environ. Res. Lett. 2010, 5, 025002. [Google Scholar] [CrossRef]
- Harding, R.; Best, M.; Blyth, E.; Hagemann, S.; Kabat, P.; Tallaksen, L.M.; Warnaars, T.; Wiberg, D.; Weedon, G.P.; van Lanen, H.; et al. WATCH: Current knowledge of the terrestrial global water cycle. J. Hydrometeorol. 2011, 12, 1149–1156. [Google Scholar] [CrossRef]
- GCOS. The Global Observing System for Climate: Implementation Needs; GCOS-200; WMO: Geneva, Switzerland, 2016; p. 315. Available online: https://gcos.wmo.int/en/gcos-implementation-plan (accessed on 13 August 2019).
- Groisman, P.Y.; Knight, R.W.; Karl, T.R.; Easterling, D.R.; Sun, B.; Lawrimore, J.H. Contemporary changes of the hydrological cycle over the contiguous United States: Trends derived from in situ observations. J. Hydrometeorol. 2004, 5, 64–85. [Google Scholar] [CrossRef]
- Lettenmaier, D.P.; Alsdorf, D.; Dozier, J.; Huffman, G.J.; Pan, M.; Wood, E.F. Inroads of remote sensing into hydrologic science during the WRR era. Water Resour. Res. 2015, 51, 7309–7342. [Google Scholar] [CrossRef]
- McCabe, M.F.; Rodell, M.; Alsdorf, D.E.; Miralles, D.G.; Uijlenhoet, R.; Wagner, W.; Lucieer, A.; Houborg, R.; Verhoest, N.E.C.; Franz, T.E.; et al. The future of Earth observation in hydrology. Hydrol. Earth Syst. Sci. 2017, 21, 3879–3914. [Google Scholar] [CrossRef] [Green Version]
- Rast, M.; Johannessen, J.; Mauser, W. Review of understanding of Earth’s hydrological cycle: Observations, theory and modelling. Surv. Geophys. 2014, 35, 491–513. [Google Scholar] [CrossRef]
- Su, Z.; Fernández-Prieto, D.; Timmermans, J.; Chen, X.; Hungershoefer, K.; Roebeling, R.; Schröder, M.; Schulz, J.; Stammes, P.; Wange, P.; et al. First results of the earth observation Water Cycle Multi-mission Observation Strategy (WACMOS). Int. J. Appl. Earth Obs. Geoinf. 2014, 26, 270–285. [Google Scholar] [CrossRef]
- Tauro, F.; Selker, J.; van de Giesen, N.; Abrate, T.; Uijlenhoet, R.; Porfiri, M.; Manfreda, S.; Caylor, K.; Moramarco, T.; Benveniste, J.; et al. Measurements and Observations in the XXI century (MOXXI): Innovation and multi-disciplinarity to sense the hydrological cycle. Hydrol. Sci. J. 2018, 63, 169–196. [Google Scholar] [CrossRef]
- Hegerl, G.C.; Black, E.; Allan, R.P.; Ingram, W.J.; Polson, D.; Trenberth, K.E.; Chadwick, R.S.; Arkin, P.A.; Balan Sarojini, B.; Becker, A.; et al. Challenges in quantifying changes in the global water cycle. Bull. Am. Meteorol. Soc. 2015, 96, 1097–1115. [Google Scholar] [CrossRef]
- Trenberth, K.E.; Anthes, R.A.; Belward, A.; Brown, O.B.; Habermann, T.; Karl, T.R.; Running, S.; Ryan, B.; Tanner, M.; Wielicki, B. Challenges of a sustained climate observing system. In Climate Science for Serving Society: Research, Modeling and Prediction Priorities; Asrar, G.R., Hurrell, J.W., Eds.; Springer: Dordrecht, The Netherlands, 2013; pp. 13–50. ISBN 978-94-007-6691-4. [Google Scholar] [CrossRef]
- Gleick, P.H.; Cooley, H.; Famiglietti, J.S.; Lettenmaier, D.P.; Oki, T.; Vörösmarty, C.J.; Wood, E.F. Improving understanding of the global hydrologic cycle-Observation and analysis of the climate system: The global water cycle. In Climate Science for Serving Society: Research, Modeling and Prediction Priorities; Asrar, G.R., Hurrell, J.W., Eds.; Springer: Dordrecht, The Netherlands, 2013; pp. 151–184. ISBN 978-94-007-6691-4. [Google Scholar] [CrossRef]
- Haverd, V.; Raupach, M.R.; Briggs, P.R.; Canadell, J.G.; Isaac, P.; Pickett-Heaps, C.; Roxburgh, S.H.; van Gorsel, E.; Viscarra Rossel, R.A.; Wang, Z. Multiple observation types reduce uncertainty in Australia’s terrestrial carbon and water cycles. Biogeosciences 2013, 10, 2011–2040. [Google Scholar] [CrossRef]
- Pellet, V.; Aires, F.; Mariotti, A.; Fernández-Prieto, D. Analyzing the Mediterranean water cycle via satellite data integration. In Meteorology and Climatology of the Mediterranean and Black Seas; Vilibić, I., Horvath, K., Palau, J., Eds.; Birkhäuser: Cham, Switzerland, 2019; Pageoph Topical Volumes; Volume 175, pp. 3909–3937. ISBN 978-3-030-11957-7. [Google Scholar] [CrossRef]
- Pellet, V.; Aires, F.; Munier, S.; Fernández-Prieto, D.; Jordá, G.; Dorigo, W.A.; Polcher, J.; Brocca, L. Integrating multiple satellite observations into a coherent dataset to monitor the full water cycle–Application to the Mediterranean region. Hydrol. Earth Syst. Sci. 2019, 23, 465–491. [Google Scholar] [CrossRef]
- Moreira, A.A.; Ruhoff, A.L.; Roberti, D.R.; de Arruda Souza, V.; Ribeiro da Rocha, H.; Dias de Paiva, R.C. Assessment of terrestrial water balance using remote sensing data in South America. J. Hydrol. 2019, 575, 131–147. [Google Scholar] [CrossRef]
- Rodell, M.; Beaudoing, H.K.; L’Ecuyer, T.S.; Olson, W.S.; Famiglietti, J.S.; Houser, P.R.; Adler, R.F.; Bosilovich, M.G.; Clayson, C.A.; Chambers, D.; et al. The observed state of the water cycle in the early twenty-first century. J. Clim. 2015, 28, 8289–8318. [Google Scholar] [CrossRef]
- Dirmeyer, P.A.; Gao, X.; Zhao, M.; Guo, Z.; Hanasaki, N. GSWP-2: Multimodel analysis and implications for our perception of the land surface. Bull. Am. Meteorol. Soc. 2006, 87, 1381–1398. [Google Scholar] [CrossRef]
- Balsamo, G.; Agusti-Panareda, A.; Albergel, C.; Arduini, G.; Beljaars, A.; Bidlot, J.; Blyth, E.; Bousserez, N.; Boussetta, S.; Brown, A.; et al. Satellite and in situ observations for advancing global Earth surface modelling: A review. Remote Sens. 2018, 10, 2038. [Google Scholar] [CrossRef]
- Orth, R.; Dutra, E.; Trigo, I.F.; Balsamo, G. Advancing land surface model development with satellite-based Earth observations. Hydrol. Earth Syst. Sci. 2017, 21, 2483–2495. [Google Scholar] [CrossRef] [Green Version]
- Seager, R.; Osborn, T.J.; Kushnir, Y.; Simpson, I.R.; Nakamura, J.; Liu, H. Climate variability and change of Mediterranean-type climates. J. Clim. 2019, 32, 2887–2915. [Google Scholar] [CrossRef]
- Mariotti, A. Recent changes in the Mediterranean water cycle: A pathway toward long-term regional hydroclimatic change? J. Clim. 2010, 23, 1513–1525. [Google Scholar] [CrossRef]
- Alpert, P.; Hemming, D.; Jin, F.; Kay, G.; Kitoh, A.; Mariotti, A. The hydrological cycle of the Mediterranean. In Regional Assessment of Climate Change in the Mediterranean; Navarra, A., Tubiana, L., Eds.; Springer: Dordrecht, The Netherlands, 2013; pp. 201–239. ISBN 978-94-007-5780-6. [Google Scholar] [CrossRef]
- Ciric, D.; Nieto, R.; Losada, L.; Drumond, A.; Gimeno, L. The Mediterranean moisture contribution to climatological and extreme monthly continental precipitation. Water 2018, 10, 519. [Google Scholar] [CrossRef]
- Bring, A.; Destouni, G. Relevance of hydro-climatic change projection and monitoring for assessment of water cycle changes in the Arctic. AMBIO 2011, 40, 361–369. [Google Scholar] [CrossRef] [PubMed]
- Vihma, T.; Screen, J.; Tjernström, M.; Newton, B.; Zhang, X.; Popova, V.; Deser, C.; Holland, M.; Prowse, T. The atmospheric role in the Arctic water cycle: A review on processes, past and future changes, and their impacts. J. Geophys. Res. Biogeosci. 2016, 121, 586–620. [Google Scholar] [CrossRef] [Green Version]
- Serreze, M.C.; Barrett, A.P.; Slater, A.G.; Woodgate, R.A.; Aagaard, K.; Lammers, R.B.; Steele, M.; Moritz, R.; Meredith, M.; Lee, C.M. The large-scale freshwater cycle of the Arctic. J. Geophys. Res. 2006, 111, C11010. [Google Scholar] [CrossRef]
- Rawlins, M.A.; Steele, M.; Holland, M.M.; Adam, J.C.; Cherry, J.E.; Francis, J.A.; Groisman, P.Y.; Hinzman, L.D.; Huntington, T.G.; Kane, D.L.; et al. Analysis of the Arctic system for freshwater cycle intensification: Observations and expectations. J. Clim. 2010, 23, 5715–5737. [Google Scholar] [CrossRef]
- Bring, A.; Fedorova, I.; Dibike, Y.; Hinzman, L.; Mård, J.; Mernild, S.H.; Prowse, T.; Semenova, O.; Stuefer, S.L.; Woo, M.-K. Arctic terrestrial hydrology: A synthesis of processes, regional effects, and research challenges. J. Geophys. Res. Biogeosci. 2016, 121, 621–649. [Google Scholar] [CrossRef]
- Yao, T.; Xue, Y.; Chen, D.; Chen, F.; Thompson, L.; Cui, P.; Koike, T.; Lau, W.K.M.; Lettenmaier, D.; Mosbrugger, V.; et al. Recent Third Pole’s rapid warming accompanies cryospheric melt and water cycle intensification and interactions between monsoon and environment: Multidisciplinary approach with observations, modeling, and analysis. Bull. Am. Meteorol. Soc. 2019, 100, 423–444. [Google Scholar] [CrossRef]
- Yoon, Y.; Kumar, S.V.; Forman, B.A.; Zaitchik, B.F.; Kwon, Y.; Qian, Y.; Rupper, S.; Maggioni, V.; Houser, P.; Kirschbaum, D.; et al. Evaluating the uncertainty of terrestrial water budget components over High Mountain Asia. Front. Earth Sci. 2019, 7, 120. [Google Scholar] [CrossRef]
- Xue, Y.; Houser, P.R.; Maggioni, V.; Mei, Y.; Kumar, S.V.; Yoon, Y. Assimilation of satellite-based snow cover and freeze/thaw observations over High Mountain Asia. Front. Earth Sci. 2019, 7, 115. [Google Scholar] [CrossRef]
- Sheffield, J.; Wood, E.F.; Pan, M.; Beck, H.; Coccia, G.; Serrat-Capdevila, A.; Verbist, K. Satellite remote sensing for water resources management: Potential for supporting sustainable development in data-poor regions. Water Resour. Res. 2018, 54, 9724–9758. [Google Scholar] [CrossRef]
- Zipper, S.C.; Whitney, K.S.; Deines, J.M.; Befus, K.M.; Bhatia, U.; Albers, S.J.; Beecher, J.; Brelsford, C.; Garcia, M.; Gleeson, T.; et al. Balancing open science and data privacy in the water sciences. Water Resour. Res. 2019. [Google Scholar] [CrossRef]
- Cui, X.; Guo, X.; Wang, Y.; Wang, X.; Zhu, W.; Shie, J.; Lin, C.; Gao, X. Application of remote sensing to water environmental processes under a changing climate. J. Hydrol. 2019, 574, 892–902. [Google Scholar] [CrossRef]
- Cui, Y.; Chen, X.; Gao, J.; Yan, B.; Tang, G.; Hong, Y. Global water cycle and remote sensing big data: Overview, challenge, and opportunities. Big Earth Data 2018, 2, 282–297. [Google Scholar] [CrossRef]
- Allan, R.P.; Liu, C.; Zahn, M.; Lavers, D.A.; Koukouvagias, E.; Bodas-Salcedo, A. Physically consistent responses of the global atmospheric hydrological cycle in models and observations. Surv. Geophys. 2014, 35, 533–552. [Google Scholar] [CrossRef]
- Held, I.M.; Soden, B.J. Robust responses of the hydrological cycle to global warming. J. Clim. 2006, 19, 5686–5699. [Google Scholar] [CrossRef]
- Martin, G.M. Quantifying and reducing uncertainty in the large-scale response of the water cycle. Surv. Geophys. 2014, 35, 553–575. [Google Scholar] [CrossRef]
- Sorooshian, S.; Hsu, K.-L.; Coppola, E.; Tomassetti, B.; Verdecchia, M.; Visconti, G. (Eds.) Hydrological Modelling and the Water Cycle; Springer: Dordrecht, The Netherlands, 2008; p. 302. ISBN 978-3642096648. [Google Scholar]
- Tang, Q.; Oki, T. Terrestrial Water Cycle and Climate Change–Natural and Human-Induced Impacts; AGU-Wiley: Washington, DC, USA, 2016; 236p, ISBN 978-1-118-97176-5. [Google Scholar]
- Benedict, I.; van Heerwaarden, C.C.; Weerts, A.H.; Hazeleger, W. The benefits of spatial resolution increase in global simulations of the hydrological cycle evaluated for the Rhine and Mississippi basins. Hydrol. Earth Syst. Sci. 2019, 23, 1779–1800. [Google Scholar] [CrossRef] [Green Version]
- Feng, G.-L.; Wu, Y.-P. Signal of acceleration and physical mechanism of water cycle in Xinjiang, China. PLoS ONE 2016, 11, e0167387. [Google Scholar] [CrossRef] [PubMed]
- Sherwood, S.; Fu, Q. A drier future? Science 2014, 343, 737–739. [Google Scholar] [CrossRef] [PubMed]
- Yang, T.; Ding, J.; Liu, D.; Wang, X.; Wang, T. Combined use of multiple drought indices for global assessment of dry gets drier and wet gets wetter paradigm. J. Clim. 2019, 32, 737–748. [Google Scholar] [CrossRef]
- Dirmeyer, P.A.; Schlosser, C.A.; Brubaker, K.L. Precipitation, recycling and land memory: An integrated analysis. J. Hydrometeorol. 2009, 10, 278–288. [Google Scholar] [CrossRef]
- Skliris, N.; Zika, J.D.; Nurser, G.; Josey, S.A.; Marsh, R. Global water cycle amplifying at less than the Clausius-Clapeyron rate. Sci. Rep. 2016, 6, 38752. [Google Scholar] [CrossRef] [PubMed] [Green Version]
- Wulfmeyer, V.; Turner, D.D.; Baker, B.; Banta, R.; Behrendt, A.; Bonin, T.; Brewer, W.A.; Buban, M.; Choukulkar, A.; Dumas, E.; et al. A new research approach for observing and characterizing land–atmosphere feedback. Bull. Am. Meteorol. Soc. 2018, 99, 1639–1667. [Google Scholar] [CrossRef]
- Rodell, M.; Houser, P.R.; Jambor, U.; Gottschalck, J.; Mitchell, K.; Meng, C.-J.; Arsenault, K.; Cosgrove, B.; Radakovich, J.; Bosilovich, M.; et al. The Global Land Data Assimilation System. Bull. Am. Meteorol. Soc. 2004, 85, 381–394. [Google Scholar] [CrossRef] [Green Version]
- Lahoz, W.; Khattatov, B.; Ménard, R. Data Assimilation–Making Sense of Observations; Springer: Dordrecht, The Netherlands, 2010; p. 302. ISBN 978-3-540-74702-4. [Google Scholar]
- Margulis, S.A.; Wood, E.F.; Troch, P.A. The terrestrial water cycle: Modeling and data assimilation across catchment scales. J. Hydrometeorol. 2006, 7, 309–311. [Google Scholar] [CrossRef]
- Nogueira, M. The sensitivity of the atmospheric branch of the global water cycle to temperature fluctuations at synoptic to decadal time-scales in different satellite- and model-based products. Clim. Dyn. 2019, 52, 617–636. [Google Scholar] [CrossRef]
- Kidd, C.; Levizzani, V.; Bauer, P. A review of satellite meteorology and climatology at the start of the twenty-first century. Prog. Phys. Geogr. 2009, 33, 474–489. [Google Scholar] [CrossRef]
- Kidd, C.; Levizzani, V.; Turk, F.J.; Ferraro, R.R. Satellite precipitation measurements for water resource monitoring. J. Am. Water Resour. Assoc. 2009, 45, 567–579. [Google Scholar] [CrossRef]
- Kidd, C.; Huffman, G.J. Global precipitation measurement. Meteorol. Appl. 2011, 18, 334–353. [Google Scholar] [CrossRef]
- Kidd, C.; Levizzani, V. Status of satellite precipitation retrievals. Hydrol. Earth Syst. Sci. 2011, 15, 1109–1116. [Google Scholar] [CrossRef] [Green Version]
- Michaelides, S.; Levizzani, V.; Anagnostou, E.N.; Bauer, P.; Kasparis, T.; Lane, J.E. Precipitation: Measurement, remote sensing, climatology and modeling. Atmos. Res. 2009, 94, 512–533. [Google Scholar] [CrossRef]
- Kidd, C.; Levizzani, V. Quantitative precipitation estimation from satellite measurements. In Extreme Hydroclimatic Events and Multivariate Hazards in a Changing Environment–A Satellite Approach; Maggioni, V., Massari, C., Eds.; Elsevier: Amsterdam, The Netherlands, 2019; pp. 3–39. ISBN 978-0-12-814899-0. [Google Scholar] [CrossRef]
- Tapiador, F.J.; Turk, F.J.; Petersen, W.; Hou, A.Y.; García-Ortega, E.; Machado, L.A.T.; Angelis, C.F.; Salio, P.; Kidd, C.; Huffman, G.J.; et al. Global precipitation measurement: Methods, datasets and applications. Atmos. Res. 2012, 104, 70–97. [Google Scholar] [CrossRef]
- Maggioni, V.; Meyers, P.C.; Robinson, M.D. A review of merged high-resolution satellite precipitation product accuracy during the Tropical Rainfall Measuring Mission (TRMM) era. J. Hydrometeorol. 2016, 17, 1101–1117. [Google Scholar] [CrossRef]
- Tapiador, F.J.; Navarro, A.; Levizzani, V.; García-Ortega, E.; Huffman, G.J.; Kidd, C.; Kucera, P.A.; Kummerow, C.D.; Masunaga, H.; Petersen, W.A.; et al. Global precipitation measurements for validating climate models. Atmos. Res. 2017, 197, 1–20. [Google Scholar] [CrossRef]
- Sun, Q.; Miao, C.; Duan, Q.; Ashouri, H.; Sorooshian, S.; Hsu, K.-L. A review of global precipitation data sets: Data sources, estimation, and intercomparisons. Rev. Geophys. 2018, 56, 79–107. [Google Scholar] [CrossRef]
- Levizzani, V.; Bauer, P.; Turk, F.J. Measuring Precipitation from Space-EURAINSAT and the Future; Springer: Dordrecht, The Netherlands, 2007; p. 722. ISBN 978-1-4020-5835-6. [Google Scholar]
- Levizzani, V.; Kidd, C.; Kirschbaum, D.B.; Kummerow, C.D.; Nakamura, K.; Turk, F.J. (Eds.) Satellite Precipitation Measurement; Springer Nature: Dordrecht, The Netherlands, 2019; in press. [Google Scholar]
- Kidd, C.; Huffman, G.J.; Becker, A.; Skofronick-Jackson, G.; Kirschbaum, D.; Joe, P.; Muller, C. So, how much of the Earth’s surface is covered by rain gauges? Bull. Am. Meteorol. Soc. 2015, 98, 69–78. [Google Scholar] [CrossRef] [PubMed]
- Menne, M.J.; Durre, I.; Vose, R.S.; Gleason, B.E.; Houston, T.G. An overview of the Global Historical Climatology Network-Daily Database. J. Atmos. Ocean. Technol. 2012, 29, 897–910. [Google Scholar] [CrossRef]
- Contractor, S.; Donat, M.G.; Alexander, L.V.; Ziese, M.; Meyer-Christoffer, A.; Schneider, U.; Rustemeier, E.; Becker, A.; Durre, I.; Vose, R.S. Rainfall Estimates on a Gridded Network (REGEN)–A global land-based gridded dataset of daily precipitation from 1950–2013. Hydrol. Earth Syst. Sci. Discuss. 2019. [Google Scholar] [CrossRef]
- Zhang, J.; Howard, K.; Langston, C.; Kaney, B.; Qi, Y.; Tang, L.; Grams, H.; Wang, Y.; Cocks, S.; Martinaitis, S.; et al. Multi-Radar Multi-Sensor (MRMS) quantitative precipitation estimation: Initial operating capabilities. Bull. Am. Meteorol. Soc. 2016, 97, 621–638. [Google Scholar] [CrossRef]
- Freeman, E.; Woodruff, S.D.; Worley, S.J.; Lubker, S.J.; Kent, E.C.; Angel, W.E.; Berry, D.I.; Brohan, P.; Eastman, R.; Gates, L.; et al. ICOADS Release 3.0: A major update to the historical marine climate record. Int. J. Climatol. 2017, 37, 2211–2237. [Google Scholar] [CrossRef]
- Lott, J.N.; Baldwin, R. The FCC integrated surface hourly database, a new resource of global climate data. In Proceedings of the 13th Symposium Global Change and Climate Variations, Orlando, FL, USA, 13–17 January 2002. [Google Scholar]
- Cook, W.E.; Green, J.S. gridded monthly rainfall estimates derived from historical atoll observations. J. Atmos. Ocean. Technol. 2019, 36, 671–687. [Google Scholar] [CrossRef]
- Green, J.S.; Klatt, M.; Morrissey, M.; Postawko, S. The Comprehensive Pacific Rainfall Database. J. Atmos. Ocean. Technol. 2008, 25, 71–82. [Google Scholar] [CrossRef]
- Klepp, C.; Michel, S.; Protat, A.; Burdanowitz, J.; Albern, N.; Kähnert, M.; Dahl, A.; Louf, V.; Bakan, S.; Buehler, S.A. OceanRAIN, a new in-situ shipboard global ocean surface-reference dataset of all water cycle components. Sci. Data 2018, 5, 122. [Google Scholar] [CrossRef] [PubMed]
- Kummerow, C.; Barnes, W.; Kozu, T.; Shiue, J.; Simpson, J. The Tropical Rainfall Measuring Mission (TRMM) sensor package. J. Atmos. Ocean. Technol. 1998, 15, 809–817. [Google Scholar] [CrossRef]
- Stephens, G.L.; Vane, D.G.; Boain, R.J.; Mace, G.G.; Sassen, K.; Wang, Z.; Illingworth, A.J.; O’Connor, E.J.; Rossow, W.B.; Durden, S.L.; et al. The CloudSat mission and the A-Train-A new dimension of space-based observations of clouds and precipitation. Bull. Am. Meteorol. Soc. 2002, 83, 1771–1790. [Google Scholar] [CrossRef]
- Hou, A.Y.; Kakar, R.K.; Neeck, S.; Azarbarzin, A.A.; Kummerow, C.D.; Kojima, M.; Oki, R.; Nakamura, K.; Iguchi, T. The Global Precipitation Measurement mission. Bull. Am. Meteorol. Soc. 2014, 95, 701–722. [Google Scholar] [CrossRef]
- Stephens, G.L.; Kummerow, C.D. The remote sensing of clouds and precipitation from space: A review. J. Atmos. Sci. 2007, 64, 3742–3765. [Google Scholar] [CrossRef]
- Huffman, G.J.; Ferraro, R.; Kidd, C.; Levizzani, V.; Turk, F.J. Requirements for a robust precipitation constellation. In Proceedings of the 14th Specialist Meeting on Microwave Radiometry and Remote Sensing of the Environment, MicroRad, Espoo, Finland, 11–14 April 2016. [Google Scholar] [CrossRef]
- Illingworth, A.J.; Barker, H.W.; Beljaars, A.; Ceccaldi, M.; Chepfer, H.; Clerbaux, N.; Cole, J.; Delanoë, J.; Domenech, C.; Donovan, D.P.; et al. The EarthCARE satellite: The next step forward in global measurements of clouds, aerosols, precipitation, and radiation. Bull. Am. Meteorol. Soc. 2015, 96, 1311–1332. [Google Scholar] [CrossRef]
- Illingworth, A.J.; Battaglia, A.; Bradford, J.; Forsythe, M.; Joe, P.; Kollias, P.; Lean, K.; Lori, M.; Mahfouf, J.-F.; Melo, S.; et al. WIVERN: A new satellite concept to provide global in-cloud winds, precipitation, and cloud properties. Bull. Am. Meteorol. Soc. 2018, 99, 1669–1687. [Google Scholar] [CrossRef]
- Schmetz, J.; Menzel, W.P. Evolution of meteorological satellites: Advancing capabilities and meeting user requirements. Weather Clim. Soc. 2015, 7, 309–320. [Google Scholar] [CrossRef]
- Adler, R.F.; Sapiano, M.; Huffman, G.J.; Wang, J.; Gu, G.; Bolvin, D.; Chiu, L.; Schneider, U.; Becker, A.; Nelkin, E.; et al. The Global Precipitation Climatology Project (GPCP) monthly analysis (New Version 2.3) and a review of 2017 global precipitation. Atmosphere 2018, 9, 138. [Google Scholar] [CrossRef] [PubMed]
- Adler, R.; Gu, G.; Sapiano, M.; Wang, J.; Huffman, G.J. Global precipitation: Means, variations and trends during the satellite era (1979-2014). Surv. Geophys. 2017, 38, 679–699. [Google Scholar] [CrossRef]
- Funk, C.; Peterson, P.; Landsfeld, M.; Pedreros, D.; Verdin, J.; Shukla, S.; Husak, G.; Rowland, J.; Harrison, L.; Hoell, A.; et al. The climate hazards infrared precipitation with stations—A new environmental record for monitoring extremes. Sci. Data 2015, 2, 66. [Google Scholar] [CrossRef] [PubMed]
- Xie, P.; Arkin, P.A. Global precipitation: A 17-year monthly analysis based on gauge observations, satellite estimates, and numerical model outputs. Bull. Am. Meteorol. Soc. 1997, 78, 2539–2558. [Google Scholar] [CrossRef]
- Nguyen, P.; Shearer, E.J.; Tran, H.; Ombadi, M.; Hayatbini, N.; Palacios, T.; Huynh, P.; Braithwaite, D.; Updegraff, G.; Hsu, K.; et al. The CHRS Data Portal, an easily accessible public repository for PERSIANN global satellite precipitation data. Sci. Data 2019, 6, 296. [Google Scholar] [CrossRef] [PubMed]
- Xie, P.; Joyce, R.; Wu, S.; Yoo, S.-H.; Yarosh, Y.; Sun, F.; Lin, R. Reprocessed, bias-corrected CMORPH global high-resolution precipitation estimates from 1998. J. Hydrometeorol. 2017, 18, 1617–1641. [Google Scholar] [CrossRef]
- Mega, T.; Ushio, T.; Matsuda, T.; Kubota, T.; Kachi, M.; Oki, R. Gauge-adjusted Global Satellite Mapping of Precipitation. IEEE Trans. Geosci. Remote Sens. 2019, 57, 1928–1935. [Google Scholar] [CrossRef]
- Maidment, R.I.; Grimes, D.; Black, E.; Tarnavsky, E.; Young, M.; Greatrex, H.; Allan, R.P.; Stein, T.; Nkonde, E.; Senkunda, S.; et al. A new, long-term daily satellite-based rainfall dataset for operational monitoring in Africa. Sci. Data 2017, 4, 63. [Google Scholar] [CrossRef]
- Novella, N.S.; Thiaw, W.M. African Rainfall climatology version 2 for famine early warning systems. J. Appl. Meteorol. Climatol. 2013, 52, 588–606. [Google Scholar] [CrossRef]
- Roca, R.; Taburet, N.; Lorant, E.; Chambon, P.; Alcoba, M.; Brogniez, E.; Cloché, S.; Dufour, C.; Gosset, M.; Guilloteau, C. Quantifying the contribution of the Megha-Tropiques mission to the estimation of daily accumulated rainfall in the Tropics. Q. J. R. Meteorol. Soc. 2018, 144, 49–63. [Google Scholar] [CrossRef]
- Huffman, G.J.; Bolvin, D.T.; Nelkin, E.J.; Wolff, D.B.; Adler, R.F.; Gu, G.; Hong, Y.; Bowman, K.P.; Stocker, E.F. The TRMM Multi-satellite Precipitation Analysis: Quasi-global, multi-year, combined-sensor precipitation estimates at fine scale. J. Hydrometeorol. 2007, 8, 38–55. [Google Scholar] [CrossRef]
- Huffman, G.J.; Bolvin, D.T.; Braithwaite, D.; Hsu, K.; Joyce, R.; Kidd, C.; Nelkin, E.J.; Sorooshian, S.; Tan, J.; Xie, P. NASA Global Precipitation Measurement (GPM) Integrated Multi-Satellite Retrievals for GPM (IMERG). Algorithm Theoretical Basis Document (ATBD) Version 06; NASA: Greenbelt, MD, USA, 2019; p. 34. Available online: https://docserver.gesdisc.eosdis.nasa.gov/public/project/GPM/IMERG_ATBD_V06.pdf (accessed on 26 August 2019).
- Beck, H.E.; van Dijk, A.I.J.M.; Levizzani, V.; Schellekens, J.; de Roo, A. MSWEP: 3-hourly 0.25° global gridded precipitation (1979-2014) by merging gauge, satellite, and reanalysis data. Hydrol. Earth Syst. Sci. 2017, 21, 589–615. [Google Scholar] [CrossRef]
- Beck, H.E.; Wood, E.F.; Pan, M.; Fisher, C.K.; Miralles, D.G.; van Dijk, A.I.J.M.; McVicar, T.R.; Adler, R.F. MSWEP V2 Global 3-Hourly 0.1° precipitation: Methodology and quantitative assessment. Bull. Am. Meteorol. Soc. 2019, 100, 473–500. [Google Scholar] [CrossRef]
- Shen, Y.; Hong, Z.; Pan, Y.; Yu, J.; Maguire, L. China’s 1 km merged gauge, radar and satellite experimental precipitation dataset. Remote Sens. 2018, 10, 264. [Google Scholar] [CrossRef]
- Haddad, Z.S.; Sy, O.; Hristova-Veleva, S.; Stephens, G.L. Derived observations from frequently sampled microwave measurements of precipitation. Part I: Relations to atmospheric thermodynamics. IEEE Trans. Geosci. Remote Sens. 2017, 55, 3441–3453. [Google Scholar] [CrossRef]
- Blackwell, W.J.; Braun, S.; Bennartz, R.; Velden, C.; De Maria, M.; Atlas, R.; Dunlon, J.; Marks, F.; Rogers, R.; Annane, B.; et al. An overview of the TROPICS NASA Earth Venture Mission. Q. J. R. Meteorol. Soc. 2018, 144, 16–26. [Google Scholar] [CrossRef] [Green Version]
- Reising, S.C.; Gaier, T.C.; Padmanabhan, S.; Lim, B.H.; Heneghan, C.; Kummerow, C.D.; Berg, W.K.; Chandrasekar, V.; Radhakrishnan, C.; Brown, S.T.; et al. An Earth Venture in-space technology demonstration mission for Temporal Experiment for Storms and Tropical Systems (Tempest). In Proceedings of the IGARSS, Valencia, Spain, 22–27 July 2018; pp. 6301–6303. [Google Scholar] [CrossRef]
- Peral, E.; Tanelli, S.; Statham, S.; Joshi, S.; Imken, T.; Price, D.; Sauder, J.; Chahat, N.; Williams, A. RainCube: The first ever radar measurements from a CubeSat in space. J Appl. Remote Sens. 2019, 13, 032504. [Google Scholar] [CrossRef]
- Goodman, S.J.; Gurka, J.; DeMaria, M.; Schmit, T.J.; Mostek, A.; Jedlovec, G.; Siewert, C.; Feltz, W.; Gerth, J.; Brummer, R.; et al. The GOES-R proving ground: Accelerating user readiness for the next-generation Geostationary Environmental Satellite System. Bull. Am. Meteorol. Soc. 2012, 93, 1029–1040. [Google Scholar] [CrossRef]
- Bessho, K.; Date, K.; Hayashi, M.; Ikeda, A.; Imai, T.; Inoue, H.; Kumagai, Y.; Miyakawa, T.; Murata, H.; Ohno, T.; et al. An introduction to Himawari-8/9—Japan’s new-generation Geostationary Meteorological Satellites. J. Meteorol. Soc. Jpn. 2016, 94, 151–183. [Google Scholar] [CrossRef]
- EUMETSAT. Meteosat Third Generation Facts and Figures; EUMETSAT: Darmstadt, Germany, 2019; 6p, Available online: https://www.eumetsat.int/website/wcm/idc/idcplg?IdcService=GET_FILE&dDocName=PDF_BR_PRGFS01_EN&RevisionSelectionMethod=LatestReleased&Rendition=Web (accessed on 26 August 2019).
- Gaier, T.; Kangaslahti, P.; Lambrigtsen, B.; Ramos-Perez, I.; Tanner, A.; McKague, D.; Ruf, C.; Flynn, M.; Zhang, Z.; Backhus, R.; et al. A 180 GHz prototype for a geostationary microwave imager/sounder-GEOSTAR-III. In Proceedings of the 2016 IEEE International Geoscience and Remote Sensing Symposium, Beijing, China, 10–15 July 2016. [Google Scholar] [CrossRef]
- Buehler, S.A.; Defer, E.; Evans, F.; Eliasson, S.; Mendrok, J.; Eriksson, P.; Lee, C.; Jiménez, C.; Prigent, C.; Crewell, S.; et al. Observing ice clouds in the submillimeter spectral range: The CloudIce mission proposal for ESA’s Earth Explorer 8. Atmos. Meas. Tech. 2012, 5, 1529–1549. [Google Scholar] [CrossRef]
- Donlon, C. Copernicus Imaging Microwave Radiometer (CIMR); ESA: Noordwijk, The Netherlands, 2019; p. 180. Available online: https://cimr.eu/sites/cimr.met.no/files/documents/CIMR-MRD-v2.0-20190305-ISSUED_0.pdf (accessed on 26 August 2019).
- Levizzani, V.; Kidd, C.; Aonashi, K.; Bennartz, R.; Ferraro, R.R.; Huffman, G.J.; Roca, R.; Turk, F.J.; Wang, N.-Y. The activities of the International Precipitation Working Group. Q. J. R. Meteorol. Soc. 2018, 144, 3–15. [Google Scholar] [CrossRef] [PubMed]
- Kerr, Y.H.; Waldteufel, P.; Wigneron, J.-P.; Delwart, S.; Cabot, F.; Boutin, J.; Éscorihuela, M.-J.; Font, J.; Reul, N.; Gruhier, C.; et al. The SMOS mission: New tool for monitoring key elements of the global water cycle. Proc. IEEE 2010, 98, 666–687. [Google Scholar] [CrossRef]
- Piepmeier, J.R.; Focardi, P.; Horgan, K.A.; Knuble, J.; Ehsan, N.; Lucey, J.; Brambora, C.; Brown, P.R.; Hoffman, P.J.; French, R.T.; et al. SMAP L-band microwave radiometer: Instrument design and first year on orbit. IEEE Trans. Geosci. Remote Sens. 2017, 55, 1954–1966. [Google Scholar] [CrossRef]
- Gruber, A.; Scanlon, T.; van der Schalie, R.; Wagner, W.; Dorigo, W. Evolution of the ESA CCI Soil Moisture Climate Data Records and their underlying merging methodology. Earth Syst. Sci. Data 2019, 11, 717–739. [Google Scholar] [CrossRef]
- Brocca, L.; Ciabatta, L.; Massari, C.; Moramarco, T.; Hahn, S.; Hasenauer, S.; Kidd, C.; Dorigo, W.; Wagner, W.; Levizzani, V. Soil as a natural raingauge: Estimating rainfall from global satellite soil moisture data. J. Geophys. Res. 2014, 119, 5128–5141. [Google Scholar] [CrossRef]
- Strassberg, G.; Scanlon, B.R.; Rodell, M. Comparison of seasonal terrestrial water storage variations from GRACE with groundwater-level measurements from the High Plains Aquifer (USA). Geophys. Res. Lett. 2007, 34, L14402. [Google Scholar] [CrossRef]
- Van Dijk, A.I.J.M.; Renzullo, L.J.; Wada, Y.; Tregoning, P. A global water cycle reanalysis (2003–2012) merging satellite gravimetry and altimetry observations with a hydrological multi-model ensemble. Hydrol. Earth Syst. Sci. 2014, 18, 2955–2973. [Google Scholar] [CrossRef]
- Tapley, B.D.; Watkins, M.M.; Flechtner, F.; Reigber, C.; Bettadpur, S.; Rodell, M.; Sasgen, I.; Famiglietti, J.S.; Landerer, F.W.; Chambers, D.P.; et al. Contributions of GRACE to understanding climate change. Nat. Clim. Chang. 2019, 9, 358–369. [Google Scholar] [CrossRef]
- Seneviratne, S.I.; Corti, T.; Davin, E.L.; Hirschi, M.; Jaeger, E.B.; Lehner, I.; Orlowsky, B.; Teuling, A.J. Investigating soil moisture-climate interactions in a changing climate: A review. Earth-Sci. Rev. 2010, 99, 125–161. [Google Scholar] [CrossRef]
- Scanlon, B.R.; Zhang, Z.; Rateb, A.; Sun, A.; Wiese, D.; Save, H.; Beaudoing, H.; Lo, M.H.; Müller-Schmied, H.; Döll, P.; et al. Tracking seasonal fluctuations in land water storage using global models and GRACE satellites. Geophys. Res. Lett. 2019, 46, 5254–5264. [Google Scholar] [CrossRef]
- Behrangi, A.; Gardner, A.S.; Reager, J.T.; Fisher, J.B. Using GRACE to constrain precipitation amount over cold moun- tainous basins. Geophys. Res. Lett. 2017, 44, 219–227. [Google Scholar] [CrossRef]
- Behrangi, A.; Gardner, A.S.; Reager, J.T.; Fisher, J.B.; Yang, D.; Huffman, G.J.; Adler, R.F. Using GRACE to estimate snowfall accumulation and assess gauge undercatch corrections in high latitudes. J. Clim. 2018, 31, 8689–8704. [Google Scholar] [CrossRef]
- Dahle, C.; Murböck, M.; Flechtner, F.; Dobslaw, H.; Michalak, G.; Neumayer, K.H.; Abrykosov, O.; Reinhold, A.; König, R.; Sulzbach, R.; et al. The GFZ GRACE RL06 monthly gravity field time series: Processing details and quality assessment. Remote Sens. 2019, 11, 2116. [Google Scholar] [CrossRef]
- Martens, B.; Miralles, D.G.; Lievens, H.; van der Schalie, R.; de Jeu, R.A.M.; Fernández-Prieto, D.; Beck, H.E.; Dorigo, W.A.; Verhoest, N.E.C. GLEAM v3: Satellite-based land evaporation and root-zone soil moisture. Geosci. Model Dev. 2017, 10, 1903–1925. [Google Scholar] [CrossRef]
- Padrón, R.S.; Gudmundsson, L.; Michel, D.; Seneviratne, S.I. Terrestrial water loss at night: Global relevance from observations and climate models. Hydrol. Earth Syst. Sci. Discuss. 2019. [Google Scholar] [CrossRef]
- Hobeichi, S.; Abramowitz, G.; Evans, J.; Ukkola, A. Derived Optimal Linear Combination Evapotranspiration (DOLCE): A global gridded synthesis ET estimate. Hydrol. Earth Syst. Sci. 2018, 22, 1317–1336. [Google Scholar] [CrossRef]
- Hobeichi, H.; Abramowitz, G.; Evans, J.; Beck, H.E. Linear Optimal Runoff Aggregate (LORA): A global gridded synthesis runoff product. Hydrol. Earth Syst. Sci. 2019, 23, 851–870. [Google Scholar] [CrossRef]
- Alvarez-Garreton, C.; Mendoza, P.A.; Boisier, J.P.; Addor, N.; Galleguillos, M.; Zambrano-Bigiarini, M.; Lara, A.; Puelma, C.; Cortes, G.; Garreaud, R.; et al. The CAMELS-CL dataset: Catchment attributes and meteorology for large sample studies–Chile dataset. Hydrol. Earth Syst. Sci. 2018, 22, 5817–5846. [Google Scholar] [CrossRef]
- Shi, J.; Dong, X.; Zhao, T.; Du, Y.; Liu, H.; Wang, Z.; Zhu, D.; Ji, D.; Xiong, C.; Jiang, L. The Water Cycle Observation Mission (WCOM): Overview. In Proceedings of the IGARSS, Beijing, China, 10–15 July 2016; IEEE: Piscataway, NJ, USA, 2016. [Google Scholar] [CrossRef]
- Alsdorf, D.E.; Lettenmaier, D.P. Tracking fresh water from space. Science 2003, 301, 1491–1494. [Google Scholar] [CrossRef]
- Alsdorf, D.E.; Rodriguez, E.; Lettenmaier, D.P. Measuring surface water from space. Rev. Geophys. 2007, 45. [Google Scholar] [CrossRef]
- Su, Z.; Roebeling, R.A.; Schulz, J.; Holleman, I.; Levizzani, V.; Timmermans, W.J.; Rott, H.; Mognard-Campbell, N.; de Jeu, R.; Wagner, W.; et al. Observation of hydrological processes using remote sensing. In Treatise on Water Science; Wilderer, P., Ed.; Academic Press: Oxford, UK, 2011; Volume 2, pp. 351–399. [Google Scholar] [CrossRef]
- Weatherhead, E.C.; Wielicki, B.A.; Ramaswamy, V.; Abbott, M.; Ackerman, T.P.; Atlas, R.; Brasseur, G.; Bruhwiler, L.; Busalacchi, A.J.; Butler, J.H.; et al. Designing the climate observing system of the future. Earth’s Future 2018, 6, 80–102. [Google Scholar] [CrossRef]
- Bony, S.; Stevens, B.; Frierson, D.M.; Jakob, C.; Kageyama, M.; Pincus, R.; Shepherd, T.G.; Sherwood, S.C.; Siebesma, P.; Sobel, A.H.; et al. Clouds, circulation and climate sensitivity. Nat. Geosci. 2015, 8, 261–268. [Google Scholar] [CrossRef]
- Voldoire, A.; Saint-Martin, D.; Sénési, S.; Decharme, B.; Alias, A.; Chevallier, M.; Colin, J.; Guérémy, J.-F.; Michou, M.; Moine, M.-P.; et al. Evaluation of CMIP6 DECK experiments with CNRM-CM6-1. J. Adv. Mod. Earth Syst. 2019, 11, 2177–2213. [Google Scholar] [CrossRef]
- Waliser, D.; Seo, K.-W.; Schubert, S.; Njoku, E. Global water cycle agreement in the climate models assessed in the IPCC AR4. Geophys. Res. Lett. 2007, 34, L16705. [Google Scholar] [CrossRef]
- Levizzani, V.; Laviola, S.; Cattani, E. Detection and measurement of snowfall from space. Remote Sens. 2011, 3, 145–166. [Google Scholar] [CrossRef]
- Rasmussen, R.; Baker, B.; Kochendorfer, J.; Meyers, T.; Landolt, S.; Fischer, A.P.; Black, J.; Thériault, J.M.; Kucera, P.; Gochis, D.; et al. How well are we measuring snow: The NOAA/FAA/NCAR winter precipitation test bed. Bull. Am. Meteorol. Soc. 2012, 93, 811–829. [Google Scholar] [CrossRef]
- Boudala, F.S.; Isaac, G.A.; Filman, P.; Crawford, R.; Hudak, D.; Anderson, M. Performance of emerging technologies for measuring solid and liquid precipitation in cold climate as compared to the traditional manual gauges. J. Atmos. Ocean. Technol. 2017, 34, 167–185. [Google Scholar] [CrossRef]
- Skofronick-Jackson, G.M.; Johnson, B.T.; Munchak, S.J. Detection thresholds of falling snow from satellite-borne active and passive sensors. IEEE Trans. Geosci. Remote Sens. 2013, 51, 4177–4189. [Google Scholar] [CrossRef]
- Kulie, M.S.; Bennartz, R. Utilizing space-borne radars to retrieve dry snowfall. J. Appl. Meteorol. 2009, 48, 2564–2580. [Google Scholar] [CrossRef]
- Liu, G. Deriving snow cloud characteristics from CloudSat observations. J. Geophys. Res. 2008, 113, D00A09. [Google Scholar] [CrossRef]
- Rysman, J.-F.; Panegrossi, G.; Sanò, P.; Marra, A.C.; Dietrich, S.; Milani, L.; Kulie, M.S. SLALOM: An all-surface snow water path retrieval algorithm for the GPM Microwave Imager. Remote Sens. 2018, 10, 1278. [Google Scholar] [CrossRef]
- Le, M.; Chandrasekar, V.; Biswas, S. An algorithm to identify surface snowfall from GPM DPR observations. IEEE Trans. Geosci. Remote Sens. 2017, 55, 4059–4071. [Google Scholar] [CrossRef]
- Adhikari, A.; Liu, C.; Kulie, M.S. Global distribution of snow precipitation features and their properties from three years of GPM observations. J. Clim. 2018, 31, 3731–3754. [Google Scholar] [CrossRef]
- Skofronick-Jackson, G.; Kulie, M.S.; Milani, L.; Munchak, S.J.; Wood, N.B.; Levizzani, V. Satellite estimation of falling snow: A Global Precipitation Measurement (GPM) Core Observatory perspective. J. Appl. Meteorol. Climatol. 2019, 58, 1429–1448. [Google Scholar] [CrossRef]
- Liu, G. A database of microwave single-scattering properties for nonspherical ice particles. Bull. Am. Meteorol. Soc. 2008, 89, 1563–1570. [Google Scholar] [CrossRef]
- Kneifel, S.; Kulie, M.S.; Bennartz, R. A triple-frequency approach to retrieve microphysical snowfall parameters. J. Geophys. Res. 2011, 116, D11203. [Google Scholar] [CrossRef]
- Kulie, M.S.; Hiley, M.J.; Bennartz, R.; Kneifel, S.; Tanelli, S. Triple frequency radar reflectivity signatures of snow: Observations and comparisons to theoretical ice particle scattering models. J. Appl. Meteorol. Climatol. 2014, 53, 1080–1098. [Google Scholar] [CrossRef]
- Kneifel, S.; von Lerber, A.; Tiira, J.; Moisseev, D.; Kollias, P.; Leinonen, J. Observed relations between snowfall microphysics and triple-frequency radar measurements. J. Geophys. Res. 2015, 120, 6034–6055. [Google Scholar] [CrossRef] [Green Version]
- Tang, G.; Long, D.; Behrangi, A.; Wang, C.; Hong, Y. Exploring deep neural networks to retrieve rain and snow in high latitudes using multisensor and reanalysis data. Water Resour. Res. 2018, 54, 8253–8278. [Google Scholar] [CrossRef]
- Edel, L.; Rysman, J.-F.; Claud, C.; Palerme, C.; Genthon, C. Potential of passive microwave around 183 GHz for snowfall detection in the Arctic. Remote Sens. 2019, 11, 2200. [Google Scholar] [CrossRef]
- Behrangi, A.; Christensen, M.; Richardson, M.; Lebsock, M.; Stephens, G.; Huffman, G.J.; Bolvin, D.; Adler, R.F.; Gardner, A.; Lambrigtsen, B.; et al. Status of high-latitude precipitation estimates from observations and reanalyses. J. Geophys. Res. 2016, 121, 4468–4486. [Google Scholar] [CrossRef] [PubMed]
- Bintanja, R. The impact of Arctic warming on increased rainfall. Sci. Rep. 2018, 8, 16001. [Google Scholar] [CrossRef] [PubMed]
- Behrangi, A.; Richardson, M. Observed high-latitude precipitation amount and pattern and CMIP5 model projections. Remote Sens. 2018, 10, 1583. [Google Scholar] [CrossRef]
- Waliser, D.E.; Li, J.-L.F.; L’Ecuyer, T.S.; Chen, W.-T. The impact of precipitating ice and snow on the radiation balance in global Clim. models. Geophys. Res. Lett. 2011, 38, L06802. [Google Scholar] [CrossRef]
- Duffy, G.; Bennartz, R. The role of melting snow in the ocean surface heat budget. Geophys. Res. Lett. 2018, 45, 9782–9789. [Google Scholar] [CrossRef]
- Adhikari, A.; Liu, C. Remote sensing properties of freezing rain events from space. J. Geophys. Res. 2019. [Google Scholar] [CrossRef]
- Ferraro, R.R.; Beauchamp, J.; Cecil, D.; Heymsfield, G. A prototype hail detection algorithm and hail climatology developed with the advanced microwave sounding unit (AMSU). Atmos. Res. 2015, 163, 24–35. [Google Scholar] [CrossRef] [Green Version]
- Marra, A.C.; Porcù, F.; Baldini, L.; Petracca, M.; Casella, D.; Dietrich, S.; Mugnai, A.; Sanò, P.; Vulpiani, G.; Panegrossi, G. Observational analysis of an exceptionally intense hailstorm over the Mediterranean area: Role of the GPM Core Observatory. Atmos. Res. 2017, 192, 72–90. [Google Scholar] [CrossRef]
- Ni, X.; Liu, C.; Cecil, D.J.; Zhang, Q. On the detection of hail using satellite passive microwave radiometers and precipitation radar. J. Appl. Meteorol. Climatol. 2017, 56, 2693–2709. [Google Scholar] [CrossRef]
- Mroz, K.; Battaglia, A.; Lang, T.J.; Cecil, D.J.; Tanelli, S.; Tridon, F. Hail-detection algorithm for the GPM core observatory satellite sensors. J. Appl. Meteorol. Climatol. 2017, 56, 1939–1957. [Google Scholar] [CrossRef]
- Mroz, K.; Battaglia, A.; Lang, T.J.; Tanelli, S.; Sacco, G.F. Global Precipitation Measuring Dual-Frequency Precipitation Radar observations of hailstorm vertical structure: Current capabilities and drawbacks. J. Appl. Meteorol. Climatol. 2018, 57, 2161–2178. [Google Scholar] [CrossRef]
- Turk, F.J.; Li, L.; Haddad, Z. A physically based soil moisture and microwave emissivity data set for Global Precipitation Measurement (GPM) applications. IEEE Trans. Geosci. Remote Sens. 2014, 52, 7637–7650. [Google Scholar] [CrossRef]
- Prakash, S.; Norouzi, H.; Azarderakhsh, M.; Blake, R.; Prigent, C.; Khanbilvardi, R. Estimation of consistent global microwave land surface emissivity from AMSR-E and AMSR2 observations. J. Appl. Meteorol. Climatol. 2018, 57, 907–919. [Google Scholar] [CrossRef]
- Wang, D.; Prigent, C.; Kilic, L.; Fox, S.; Harlow, C.; Jimenez, C.; Aires, F.; Grassotti, C.; Karbou, F. Surface emissivity at microwaves to millimeter waves over polar regions: Parameterization and evaluation with aircraft experiments. J. Atmos. Ocean. Technol. 2017, 34, 1039–1059. [Google Scholar] [CrossRef]
- Aires, F.; Prigent, C.; Bernardo, F.; Jimenez, C.; Saunders, R.; Brunel, P. A Tool to Estimate Land-Surface Emissivities at Microwave frequencies (TELSEM) for use in numerical weather prediction. Q. J. R. Meteorol. Soc. 2011, 137, 690–699. [Google Scholar] [CrossRef] [Green Version]
- Ringerud, S.; Kummerow, C.D.; Peters-Lidard, C.D. A semi-empirical model for computing land surface emissivity in the microwave region. IEEE Trans. Geosci. Remote Sens. 2015, 53, 1935–1946. [Google Scholar] [CrossRef]
- Ferraro, R.R.; Peters-Lidard, C.D.; Hernandez, C.; Turk, F.J.; Aires, F.; Prigent, C.; Lin, X.; Boukabara, S.-A.; Furuzawa, F.A.; Gopalan, K.; et al. An evaluation of microwave land surface emissivities over the continental United States to benefit GPM-era precipitation algorithms. IEEE Trans. Geosci. Remote Sens. 2013, 51, 378–398. [Google Scholar] [CrossRef]
- Prigent, C.; Liang, P.; Tian, Y.; Aires, F.; Moncet, J.-L.; Boukabara, S.A. Evaluation of modeled microwave land surface emissivities with satellite-based estimates. J. Geophys. Res. 2015, 120, 2706–2718. [Google Scholar] [CrossRef]
- Tian, Y.; Peters-Lidard, C.D.; Harrison, K.W.; You, Y.; Ringerud, S.; Kumar, S.; Turk, F.J. An examination of methods for estimating land surface microwave emissivity. J. Geophys. Res. 2015, 120, 11114–11128. [Google Scholar] [CrossRef]
- Favrichon, S.; Prigent, C.; Jimenez, C.; Aires, F. Detecting cloud contamination in passive microwave satellite measurements over land. Atmos. Meas. Tech. 2019, 12, 1531–1543. [Google Scholar] [CrossRef] [Green Version]
- Béranger, K.; Barnier, B.; Gulev, S.; Crepon, M. Comparing 20 years of precipitation estimates from different sources over the world ocean. Ocean Dyn. 2006, 56, 104–138. [Google Scholar] [CrossRef]
- Ellis, T.D.; L’Ecuyer, T.S.; Haynes, J.M.; Stephens, G.L. How often does it rain over the global oceans? The perspective from CloudSat. Geophys. Res. Lett. 2009, 36, L03815. [Google Scholar] [CrossRef]
- Haynes, J.M.; Stephens, G.L. Tropical oceanic cloudiness and the incidence of precipitation: Early results from CloudSat. Geophys. Res. Lett. 2007, 34, L09811. [Google Scholar] [CrossRef]
- Schmitt, R.W. Salinity and the global water cycle. Oceanography 2008, 21, 12–19. [Google Scholar] [CrossRef]
- Burdanowitz, J.; Buehler, S.A.; Bakan, S.; Klepp, C. The sensitivity of oceanic precipitation to sea surface temperature. Atmos. Chem. Phys. 2019, 19, 9241–9252. [Google Scholar] [CrossRef] [Green Version]
- Durack, P.J. Ocean salinity and the global water cycle. Oceanography 2015, 28, 20–31. [Google Scholar] [CrossRef]
- Supply, A.; Boutin, J.; Reverdin, G.; Vergely, J.-L.; Bellenger, H.; Katsumata, M. Variability of satellite sea surface salinity under rainfall. In Proceedings of the ESA Living Planet Symptem, Milano, Italy, 13–17 May 2019. [Google Scholar] [CrossRef]
- Roe, G.H. Orographic precipitation. Ann. Rev. Earth Planet. Sci. 2005, 33, 645–671. [Google Scholar] [CrossRef]
- Smith, R.B. Progress on the theory of orographic precipitation. In Special Paper 398: Tectonics, Climate and Landscape Evolution; Willett, S.D., Hovius, N., Brandon, M., Fisher, D., Eds.; Geol. Soc. of America: Boulder, CO, USA, 2006; pp. 1–16. ISBN 9780813723983. [Google Scholar] [CrossRef]
- Rotunno, R.; Houze, R.A., Jr. Lessons on orographic precipitation from the Mesoscale Alpine Programme. Q. J. R. Meteorol. Soc. 2007, 133, 811–830. [Google Scholar] [CrossRef]
- Kirshbaum, D.J.; Adler, B.; Kalthoff, N.; Barthlott, C.; Serafin, S. Moist orographic convection: Physical mechanisms and links to surface-exchange processes. Atmosphere 2018, 9, 80. [Google Scholar] [CrossRef]
- Houze, R.A., Jr.; Medina, S. Turbulence as a mechanism for orographic precipitation enhancement. J. Atmos. Sci. 2005, 62, 3599–3623. [Google Scholar] [CrossRef]
- Vicente, G.A.; Davenport, J.C.; Scofield, R.A. The role of orographic and parallax corrections on real time high resolution satellite rainfall rate distribution. Int. J. Remote Sens. 2002, 23, 221–230. [Google Scholar] [CrossRef]
- Funk, C.; Michaelsen, J. A simplified diagnostic model of orographic rainfall for enhancing satellite-based rainfall estimates in data-poor regions. J. Appl. Meteorol. 2004, 43, 1366–1378. [Google Scholar] [CrossRef]
- Viale, M.; Garreaud, R. Orographic effects of the subtropical and extratropical Andes on upwind precipitating clouds. J. Geophys. Res. 2015, 120, 4962–4974. [Google Scholar] [CrossRef]
- Massmann, A.K.; Minder, J.R.; Garreaud, R.D.; Kingsmill, D.E.; Valenzuela, R.A.; Montecinos, A.; Fults, S.L.; Snider, J.R. The Chilean Coastal Orographic Precipitation Experiment: Observing the influence of microphysical rain regimes on coastal orographic precipitation. J. Hydrometeorol. 2017, 18, 2723–2743. [Google Scholar] [CrossRef]
- Duan, Y.; Barros, A.P. Understanding how low-level clouds and fog modify the diurnal cycle of orographic precipitation using in situ and satellite observations. Remote Sens. 2017, 9, 920. [Google Scholar] [CrossRef]
- Arulraj, M.; Barros, A.P. Improving quantitative precipitation estimates in mountainous regions by modelling low-level seeder-feeder interactions constrained by Global Precipitation Measurement Dual-frequency Precipitation Radar measurements. Remote Sens. Environ. 2019, 231, 111213. [Google Scholar] [CrossRef]
- Shige, S.; Kida, S.; Ashikawa, H.; Kubota, T.; Aonashi, K. Improvement of TMI rain retrievals in mountainous areas. J. Appl. Meteorol. Climatol. 2013, 52, 242–254. [Google Scholar] [CrossRef]
- Yamamoto, M.K.; Shige, S. Implementation of an orographic/nonorographic rainfall classification scheme in the GSMaP algorithm for microwave radiometers. Atmos. Res. 2015, 163, 36–47. [Google Scholar] [CrossRef]
- Yamamoto, M.K.; Shige, S.; Yu, C.-K.; Cheng, L.-W. Further improvement of the heavy orographic rainfall retrievals in the GSMaP algorithm for microwave radiometers. J. Appl. Meteorol. Climatol. 2017, 56, 2607–2619. [Google Scholar] [CrossRef]
- Derin, Y.; Anagnostou, E.; Berne, A.; Borga, M.; Boudevillain, B.; Buytaert, W.; Chang, C.-H.; Delrieu, G.; Hong, Y.; Chia Hsu, Y.; et al. Multiregional satellite precipitation products evaluation over complex terrain. J. Hydrometeorol. 2016, 17, 1817–1836. [Google Scholar] [CrossRef]
- Bartsotas, N.S.; Anagnostou, E.N.; Nikolopoulos, E.I.; Kallos, G. Investigating satellite precipitation uncertainty over complex terrain. J. Geophys. Res. 2018, 123, 5346–5359. [Google Scholar] [CrossRef]
- Maggioni, V.; Nikolopoulos, E.I.; Anagnostou, E.N.; Borga, M. Modeling satellite precipitation errors over mountainous terrain: The influence of gauge density, seasonality, and temporal resolution. IEEE Trans. Geosci. Remote Sens. 2017, 55, 4130–4140. [Google Scholar] [CrossRef]
- Donat, M.G.; Lowry, A.L.; Alexander, L.V.; O’Gorman, P.A.; Mahe, N. More extreme precipitation in the world’s dry and wet regions. Nat. Clim. Chang. 2016, 6, 508–514. [Google Scholar] [CrossRef]
- Lehmann, J.; Coumou, D.; Frieler, K. Increased record-breaking precipitation events under global warming. Clim. Chang. 2015, 132, 501. [Google Scholar] [CrossRef]
- Guerreiro, S.B.; Fowler, H.J.; Barbero, R.; Westra, S.; Lenderink, G.; Blenkinsop, S.; Lewis, E.; Li, X.-F. Detection of continental-scale intensification of hourly rainfall extremes. Nat. Clim. Chang. 2018, 8, 803–807. [Google Scholar] [CrossRef]
- Risser, M.D.; Wehner, M.F. Attributable human-induced changes in the likelihood and magnitude of the observed extreme precipitation during Hurricane Harvey. Geophys. Res. Lett. 2017, 44, 12457–12464. [Google Scholar] [CrossRef]
- De Luca, P.; Messori, G.; Wilby, R.L.; Mazzoleni, M.; Di Baldassarre, G. Concurrent wet and dry hydrological extremes at the global scale. Earth Syst. Dyn. Discuss. 2019. in review. [Google Scholar] [CrossRef]
- Prat, O.P.; Nelson, B.R. On the link between tropical cyclones and daily rainfall extremes derived from global satellite observations. J. Clim. 2016, 29, 6127–6135. [Google Scholar] [CrossRef]
- Ricko, M.; Adler, R.F.; Huffman, G.J. Climatology and interannual variability of quasi-global intense precipitation using satellite observations. J. Clim. 2016, 29, 5447–5468. [Google Scholar] [CrossRef]
- Cavalcanti, I.F.A. Large scale and synoptic features associated with extreme precipitation over South America: A review and case studies for the first decade of the 21st century. Atmos. Res. 2012, 118, 27–40. [Google Scholar] [CrossRef]
- Marthews, T.R.; Blyth, E.M.; Martínez-de la Torre, A.; Veldkamp, T.I.E. A global scale evaluation of extreme events in the eartH2Observe project. Hydrol. Earth Syst. Sci. Discuss. 2019. [Google Scholar] [CrossRef]
- Houze, R.A., Jr.; Wang, J.; Fan, J.; Brodzik, S.; Feng, Z. Extreme convective storms over high-latitude continental areas where maximum warming is occurring. Geophys. Res. Lett. 2019, 46, 4059–4065. [Google Scholar] [CrossRef]
- Zhou, Y.; Nelson, K.; Mohr, K.I.; Huffman, G.J.; Levy, R.; Grecu, M. A spatial-temporal extreme precipitation database from GPM IMERG. J. Geophys. Res. 2019. [Google Scholar] [CrossRef]
- AghaKouchak, A.; Behrangi, A.; Sorooshian, S.; Hsu, K.; Amitai, E. Evaluation of satellite-retrieved extreme precipitation rates across the central United States. J. Geophys. Res. 2011, 116, D02115. [Google Scholar] [CrossRef]
- Zhang, A.; Xiao, L.; Min, C.; Chen, S.; Kulie, M.; Huang, C.; Liang, Z. Evaluation of latest GPM-Era high-resolution satellite precipitation products during the May 2017 Guangdong extreme rainfall event. Atmos. Res. 2019, 216, 76–85. [Google Scholar] [CrossRef]
- Mazzoglio, P.; Laio, F.; Balbo, S.; Boccardo, P.; Disabato, F. Improving an extreme rainfall detection system with GPM IMERG data. Remote Sens. 2019, 11, 677. [Google Scholar] [CrossRef]
- Libertino, A.; Ganora, D.; Claps, P. Evidence for increasing rainfall extremes remains elusive at large spatial scales: The case of Italy. Geophys. Res. Lett. 2019, 46, 7437–7446. [Google Scholar] [CrossRef]
- Zorzetto, E.; Marani, M. Downscaling of rainfall extremes from satellite observations. Water Resour. Res. 2019, 55, 156–174. [Google Scholar] [CrossRef]
- Nieto, R.; Ciric, D.; Vázquez, M.; Liberato, M.L.R.; Gimeno, L. Contribution of the main moisture sources to precipitation during extreme peak precipitation months. Adv. Water Resour. 2019, 131, 103385. [Google Scholar] [CrossRef]
- Zhu, Y.; Newell, R.E. A proposed algorithm for moisture fluxes from atmospheric rivers. Mon. Weather Rev. 1998, 126, 725–735. [Google Scholar] [CrossRef]
- Gimeno, L.; Nieto, R.; Vázquez, M.; Lavers, D.A. Atmospheric rivers: A mini-review. Front. Earth Sci. 2014, 2, 2. [Google Scholar] [CrossRef]
- Ralph, F.M.; Rutz, J.J.; Cordeira, J.M.; Dettinger, M.; Anderson, M.; Reynolds, D.; Schick, L.J.; Smallcomb, C. A scale to characterize the strength and impacts of atmospheric rivers. Bull. Am. Meteorol. Soc. 2019, 100, 269–289. [Google Scholar] [CrossRef]
- Wen, Y.; Behrangi, A.; Chen, H.; Lambrigtsen, B. How well were the early 2017 California Atmospheric River precipitation events captured by satellite products and ground-based radars? Q. J. R. Meteorol. Soc. 2018, 144, 344–359. [Google Scholar] [CrossRef]
- Kucera, P.A.; Ebert, E.E.; Turk, F.J.; Levizzani, V.; Kirschbaum, D.; Tapiador, F.J.; Loew, A.; Borsche, M. Precipitation from space: Advancing Earth system science. Bull. Am. Meteorol. Soc. 2013, 94, 365–375. [Google Scholar] [CrossRef]
- Kirschbaum, D.B.; Huffman, G.J.; Adler, R.F.; Braun, S.; Garrett, K.; Jones, E.; McNally, A.; Skofronick-Jackson, G.; Stocker, E.; Wu, H.; et al. NASA’s remotely-sensed precipitation: A reservoir for applications users. Bull. Am. Meteorol. Soc. 2017, 98, 1169–1184. [Google Scholar] [CrossRef]
- Skofronick-Jackson, G.; Petersen, W.A.; Berg, W.; Kidd, C.; Stocker, E.F.; Kirschbaum, D.B.; Kakar, R.; Braun, S.A.; Huffman, G.J.; Iguchi, T.; et al. The Global Precipitation Measurement (GPM) mission for science and society. Bull. Am. Meteorol. Soc. 2017, 98, 1657–1672. [Google Scholar] [CrossRef] [PubMed]
- Geer, A.J.; Baordo, F.; Bormann, N.; Chambon, P.; English, S.J.; Kazumori, M.; Lawrence, H.; Lean, P.; Lonitz, K.; Lupu, C. The growing impact of satellite observations sensitive to humidity, cloud and precipitation. Q. J. R. Meteorol. Soc. 2017, 143, 3189–3206. [Google Scholar] [CrossRef]
- Geer, A.; Lonitz, K.; Weston, P.; Kazumori, M.; Okamoto, K.; Zhu, Y.; Liu, E.; Collard, A.; Bell, W.; Migliorini, S.; et al. All-sky satellite data assimilation at operational weather forecasting centres. Q. J. R. Meteorol. Soc. 2018, 144, 1191–1217. [Google Scholar] [CrossRef]
- Gustafsson, N.; Janjić, T.; Schraff, C.; Leuenberger, D.; Weissman, M.; Reich, H.; Brousseau, P.; Montmerle, T.; Wattrelot, E.; Bučánek, A.; et al. Survey of data assimilation methods for convective scale numerical weather prediction at operational centres. Q. J. R. Meteorol. Soc. 2018, 144, 1218–1256. [Google Scholar] [CrossRef]
- Boukabara, S.A.; Garrett, K.; Chen, W.; Iturbide-Sanchez, F.; Grassotti, C.; Kongoli, C.; Chen, R.; Liu, Q.; Yan, B.; Weng, F.; et al. MiRS: An all-weather 1DVAR satellite data assimilation and retrieval system. IEEE Trans. Geosci. Remote Sens. 2011, 49, 3249–3272. [Google Scholar] [CrossRef]
- Ebert, E.E.; Janowiak, J.E.; Kidd, C. Comparison of near-real-time precipitation estimates from satellite observations and numerical models. Bull. Am. Meteorol. Soc. 2007, 88, 47–64. [Google Scholar] [CrossRef]
- Ebert, E.E. Methods for verifying satellite precipitation estimates. In Measuring Precipitation from Space-EURAINSAT and the Future; Levizzani, V., Bauer, P., Turk, F.J., Eds.; Springer: Dordrecht, The Netherlands, 2007; pp. 345–356. ISBN 978-1-4020-5835-6. [Google Scholar]
- Adhikari, A.; Liu, C.; Hayden, L. Uncertainties of the GPM Microwave Imager precipitation estimates related to precipitation system size and intensity. J. Hydrometeorol. 2019, 20, 1907–1923. [Google Scholar] [CrossRef]
- Jedlovec, G. Transitioning research satellite data to the operational weather community: The SPoRT paradigm. IEEE Geosci. Remote Sens. Mag. 2013, 1, 62–66. [Google Scholar] [CrossRef]
- Scofield, R.A.; Kuligowski, R.J. Status and outlook of operational satellite precipitation algorithms for extreme-precipitation events. Mon. Weather Rev. 2003, 18, 1037–1051. [Google Scholar] [CrossRef]
- Kuligowski, R.J. A self-calibrating real-time GOES rainfall algorithm for short-term rainfall estimates. J. Hydrometeorol. 2002, 3, 112–130. [Google Scholar] [CrossRef]
- Kuligowski, R.J.; Li, Y.; Zhang, Y. Impact of TRMM data on a low-latency, high-resolution precipitation algorithm for flash flood forecasting. J. Appl. Meteorol. Climatol. 2013, 52, 1379–1393. [Google Scholar] [CrossRef]
- Mugnai, A.; Casella, D.; Cattani, E.; Dietrich, S.; Di Paola, F.; Laviola, S.; Levizzani, V.; Panegrossi, G.; Sanò, P.; Biron, D.; et al. The precipitation products from the Hydrology SAF. Nat. Hazards Earth Syst. Sci. 2013, 13, 1959–1981. [Google Scholar] [CrossRef]
- Ebert, E.; Turk, M.; Kusselson, S.J.; Yang, J.; Seybold, M.; Keehn, P.R.; Kuligowski, R.J. Ensemble Tropical Rainfall Potential (eTRaP) forecasts. Weather Forecast. 2011, 26, 213–224. [Google Scholar] [CrossRef]
- Gimeno, L.; Stohl, A.; Trigo, R.M.; Dominguez, F.; Yoshimura, K.; Yu, L.; Drumond, A.; Durán-Quesada, A.M.; Nieto, R. Oceanic and terrestrial sources of continental precipitation. Rev. Geophys. 2012, 50, RG4003. [Google Scholar] [CrossRef]
- Molina, R.D.; Salazar, J.F.; Martínez, J.A.; Villegas, J.C.; Arias, P.A. Forest-induced exponential growth of precipitation along climatological wind streamlines over the Amazon. J. Geophys. Res. 2019, 124, 2589–2599. [Google Scholar] [CrossRef]
- Nicholson, S.E. Climate and climatic variability of rainfall over eastern Africa. Rev. Geophys. 2017, 55, 590–635. [Google Scholar] [CrossRef] [Green Version]
- Cattani, E.; Merino, A.; Gujarro, J.A.; Levizzani, V. East Africa rainfall trends and variability 1983-2015 using three long-term satellite products. Remote Sens. 2018, 10, 931. [Google Scholar] [CrossRef]
- Wenhaji Ndomeni, C.; Cattani, E.; Merino, A.; Levizzani, V. An observational study of the variability of East African rainfall with respect to sea surface temperature and soil moisture. Q. J. R. Meteorol. Soc. 2018, 144, 384–404. [Google Scholar] [CrossRef] [Green Version]
- Thomas, E.A.; Needoba, J.; Kaberia, D.; Butterworth, J.; Adams, E.C.; Oduor, P.; Macharia, D.; Mitheu, F.; Mugo, R.; Nagel, C. Quantifying increased groundwater demand from prolonged drought in the East African Rift Valley. Sci. Total Environ. 2019, 666, 1265–1272. [Google Scholar] [CrossRef] [PubMed]
- MacDonald, A.M.; Bell, R.A.; Kebede, S.; Azagegn, T.; Yehualaeshet, T.; Pichon, F.; Young, M.; McKenzie, A.A.; Lapworth, D.J.; Black, E.; et al. Groundwater and resilience to drought in the Ethiopian Highlands. Environ. Res. Lett. 2019, 14, 095003. [Google Scholar] [CrossRef]
- Ahmed, M.; Wiese, D.N. Short-term trends in Africa's freshwater resources: Rates and drivers. Sci. Total Environ. 2019, 695, 133843. [Google Scholar] [CrossRef]
- Palazzi, E.; von Hardenberg, J.; Provenzale, A. Precipitation in the Hindu-Kush Karakoram Himalaya: Observations and future scenarios. J. Geophys. Res. 2013, 118, 85–100. [Google Scholar] [CrossRef]
- Maussion, F.; Scherer, D.; Mölg, T.; Collier, E.; Curio, J.; Finkelnburg, R. Precipitation seasonality and variability over the Tibetan Plateau as resolved by the High Asia Reanalysis. J. Clim. 2014, 27, 1910–1927. [Google Scholar] [CrossRef]
- Tong, K.; Su, F.; Yang, D.; Zhang, L.; Hao, Z. Tibetan Plateau precipitation as depicted by gauge observations, reanalyses and satellite retrievals. Int. J. Climatol. 2014, 34, 265–285. [Google Scholar] [CrossRef]
- Tong, Y.; Yang, Y.; Han, Z.; Tang, G.; Maguire, L.; Chu, Z.; Hong, Y. Comprehensive evaluation of Ensemble Multi-Satellite Precipitation Dataset using the Dynamic Bayesian Model Averaging scheme over the Tibetan plateau. J. Hydrol. 2018, 556, 634–644. [Google Scholar] [CrossRef]
- Saha, S.; Moorthi, S.; Pan, H.-L.; Wu, X.; Wang, J.; Nadiga, S.; Tripp, P.; Kistler, R.; Woollen, J.; Behringer, D.; et al. The NCEP Climate Forecast System Reanalysis. Bull. Am. Meteorol. Soc. 2010, 91, 1015–1057. [Google Scholar] [CrossRef]
- Onogi, K.; Tsutsui, J.; Koide, H.; Sakamoto, M.; Kobayashi, S.; Hatsushika, H.; Matsumoto, T.; Yamazaki, N.; Kamahori, H.; Takahashi, K.; et al. The JRA-25 Reanalysis. J. Meteorol. Soc. Jpn. 2007, 85, 369–432. [Google Scholar] [CrossRef] [Green Version]
- Rienecker, M.M.; Suarez, M.J.; Gelaro, R.; Todling, R.; Bacmeister, J.; Liu, E.; Bosilovich, M.G.; Schubert, S.D.; Takacs, L.; Kim, G.-K.; et al. MERRA—NASA’s Modern-Era Retrospective Analysis for Research and Applications. J. Clim. 2011, 24, 3624–3648. [Google Scholar] [CrossRef]
- Uppala, S.M.; Kållberg, P.W.; Simmons, A.J.; Andrae, U.; Da Costa Bechtold, V.; Fiorino, M.; Gibson, J.K.; Haseler, J.; Hernandez, A.; Kelly, G.A.; et al. The ERA-40 re-analysis. Q. J. R. Meteorol. Soc. 2005, 131, 2961–3012. [Google Scholar] [CrossRef]
- Compo, G.P.; Whitaker, J.S.; Sardeshmukh, P.D.; Matsui, N.; Allan, R.J.; Yin, X.; Gleason, B.E., Jr.; Vose, R.S.; Rutledge, G.; Bessemoulin, P.; et al. The Twentieth Century Reanalysis Project. Q. J. R. Meteorol. Soc. 2011, 137, 1–28. [Google Scholar] [CrossRef]
- Serrat-Capdevila, A.; Valdes, J.B.; Stakhiv, E.Z. Water management applications for satellite precipitation products: Synthesis and recommendations. J. Am. Water Resour. Assoc. 2014, 50, 509–525. [Google Scholar] [CrossRef]
- Hong, Y.; Zhang, Y.; Khan, S.I. Hydrologic Remote Sensing: Capacity Building for Sustainability and Resilience; CRC Press: Boca Raton, FL, USA, 2016; p. 395. ISBN 9781498726665. [Google Scholar]
- Marra, F.; Nikolopoulos, E.I.; Anagnostou, E.N.; Bárdossy, A.; Morin, E. Precipitation frequency analysis from remotely sensed datasets: A focused review. J. Hydrol. 2019, 574, 699–705. [Google Scholar] [CrossRef]
- Siddique-E-Akbor, A.H.M.; Hossain, F.; Sikder, S.; Shum, C.K.; Tseng, S.; Yi, Y.; Turk, F.J.; Limaye, A. Satellite precipitation data–driven hydrological modeling for water resources management in the Ganges, Brahmaputra, and Meghna basins. Earth Interact. 2014, 18, 1–25. [Google Scholar] [CrossRef]
- Zhang, D.; Liu, X.; Bai, P.; Li, X.-H. Suitability of satellite-based precipitation products for water balance simulations using multiple observations in a humid catchment. Remote Sens. 2019, 11, 151. [Google Scholar] [CrossRef]
- Burek, P.; Satoh, Y.; Kahil, T.; Tang, T.; Greve, P.; Smilovic, M.; Guillaumot, L.; Wada, Y. Development of the Community Water Model (CWatM v1.04) A high-resolution hydrological model for global and regional assessment of integrated water resources management. Geosci. Model Dev. Discuss. 2019. [Google Scholar] [CrossRef] [Green Version]
- van Dijk, A.I.J.M.; Renzullo, L.J. Water resource monitoring systems and the role of satellite observations. Hydrol. Earth Syst. Sci. 2011, 15, 39–55. [Google Scholar] [CrossRef] [Green Version]
- Marra, F.; Morin, E.; Peleg, N.; Mei, Y.; Anagnostou, E.N. Intensity–duration–frequency curves from remote sensing rainfall estimates: Comparing satellite and weather radar over the eastern Mediterranean. Hydrol. Earth Syst. Sci. 2017, 21, 2389–2404. [Google Scholar] [CrossRef]
- Ombadi, M.; Nguyen, P.; Sorooshian, S.; Hsu, K. Developing intensity-duration-frequency (IDF) curves from satellite-based precipitation: Methodology and evaluation. Water Resour. Res. 2018, 54, 7752–7766. [Google Scholar] [CrossRef]
- Ferraro, R.R.; Nelson, B.R.; Smith, T.; Prat, O.P. The AMSU-based hydrological bundle climate data record—Description and comparison with other data sets. Remote Sens. 2018, 10, 1640. [Google Scholar] [CrossRef]
- Hong, Y.; Adler, R.F.; Huffman, G.J. Evaluation of the potential of NASA multi-satellite precipitation analysis in global landslide hazard assessment. Geophys. Res. Lett. 2006, 33, L22402. [Google Scholar] [CrossRef]
- Hong, Y.; Adler, R.F.; Huffman, G.J. Use of satellite remote sensing data in the mapping of global landslide susceptibility. Nat. Hazards 2007, 43, 245–256. [Google Scholar] [CrossRef] [Green Version]
- Kirschbaum, D.B.; Adler, R.F.; Hong, Y.; Lerner-Lam, A. Evaluation of a preliminary satellite-based landslide hazard algorithm using global landslide inventories. Nat. Hazards Earth Syst. Sci. 2009, 9, 673–686. [Google Scholar] [CrossRef] [Green Version]
- Kirschbaum, D.B.; Adler, R.F.; Hong, Y.; Hill, S.; Lerner-Lam, A. A global landslide catalog for hazard applications: Method, results, and limitations. Nat. Hazards 2010, 52, 561–575. [Google Scholar] [CrossRef]
- Kirschbaum, D.B.; Adler, R.F.; Adler, D.; Peters-Lidard, C.D.; Huffman, G.J. Global distribution of extreme precipitation and high-impact landslides in 2010 relative to previous years. J. Hydrometeorol. 2012, 13, 1536–1551. [Google Scholar] [CrossRef]
- Kirschbaum, D.; Watson, C.S.; Rounce, D.R.; Shugar, D.H.; Kargel, J.S.; Haritashya, U.K.; Amatya, P.; Shean, D.; Anderson, E.R.; Jo, M. The state of remote sensing capabilities of cascading hazards over High Mountain Asia. Front. Earth Sci. 2019, 7, 197. [Google Scholar] [CrossRef]
- Vrieling, A.; Sterk, G.; de Jong, S.M. Satellite-based estimation of rainfall erosivity for Africa. J. Hydrol. 2010, 395, 235–241. [Google Scholar] [CrossRef]
- Funk, C.; Shukla, S.; Thiaw, W.M.; Rowland, J.; Hoell, A.; McNally, A.; Husak, G.; Novella, N.; Budde, M.; Peters-Lidard, C.; et al. Recognizing the Famine Early Warning System NETwork–Over 30 years of drought early warning science advances and partnerships promoting global food security. Bull. Am. Meteorol. Soc. 2019, 100, 1011–1027. [Google Scholar] [CrossRef]
- Dinku, T.; Thomson, M.C.; Cousin, R.; del Corral, J.; Ceccato, P.; Hansen, J.; Connor, S.J. Enhancing National Climate Services (ENACTS) for development in Africa. Clim. Dev. 2018, 10, 664–672. [Google Scholar] [CrossRef]
- Shukla, S.; Arsenault, K.R.; Hazra, A.; Peters-Lidard, C.; Koster, R.D.; Davenport, F.; Magadzire, T.; Funk, C.; Kumar, S.; McNally, A.; et al. Improving early warning of drought-driven food insecurity in Southern Africa using operational hydrological monitoring and forecasting products. Nat. Hazards Earth Syst. Sci. Discuss. 2019. in review. [Google Scholar] [CrossRef]
- Vogt, J. The European Drought Observatory. In Proceedings of the IEEE 2011 GEOSS Workshop XL-Managing Drought through Earth Observation, Sydney, Australia, 10 April 2011. [Google Scholar] [CrossRef]
- Anyamba, A.; Small, J.L.; Britch, S.C.; Tucker, C.J.; Pak, E.W.; Reynods, C.A.; Crutchfield, J.; Linthicum, K.J. Recent weather extremes and impacts on agricultural production and vector-borne disease outbreak patterns. PLoS ONE 2014, 9, e92538. [Google Scholar] [CrossRef]
- Moore, S.M.; Azman, A.S.; Zaitchik, B.F.; Mintz, E.D.; Brunkard, J.; Legros, D.; Hill, A.; McKay, H.; Luquero, F.J.; Olson, D.; et al. El Niño and the shifting geography of cholera in Africa. Proc. Natl. Acad. Sci. USA 2017, 114, 4436–4441. [Google Scholar] [CrossRef]
- Watts, N.; Adger, W.N.; Agnolucci, P.; Blackstock, J.; Byass, P.; Cai, W.; Chaytor, S.; Colbourn, T.; Collins, M.; Cooper, A.; et al. Health and climate change: Policy responses to protect public health. Lancet 2015, 386, 1861–1914. [Google Scholar] [CrossRef]
- Parshley, L. Catching fever–Climate change is accelerating the spread of disease-and making it much harder to predict outbreaks. Sci. Am. 2018, 5, 58–61. [Google Scholar] [CrossRef]
- Trenberth, K.E. Changes in precipitation with climate change. Clim. Res. 2011, 47, 123–138. [Google Scholar] [CrossRef] [Green Version]
- Blöschl, G.; Hall, J.; Viglione, A.; Perdigão, R.A.P.; Parajka, J.; Merz, B.; Lun, D.; Arheimer, B.; Aronica, G.T.; Bilibashi, A.; et al. Changing climate both increases and decreases European river floods. Nature 2019, 573, 108–111. [Google Scholar] [CrossRef]
- van der Ent, R.J.; Savenije, H.H.G.; Schaefli, B.; Steele-Dunne, S.C. Origin and fate of atmospheric moisture over continents. Water Resour. Res. 2010, 46. [Google Scholar] [CrossRef] [Green Version]
- Zhou, S.; Williams, A.P.; Berg, A.M.; Cook, B.I.; Zhang, Y.; Hagemann, S.; Lorenz, R.; Seneviratne, S.I.; Gentine, P. Land–atmosphere feedbacks exacerbate concurrent soil drought and atmospheric aridity. Proc. Natl. Acad. Sci. USA 2019. [Google Scholar] [CrossRef]
- Taylor, C.M.; de Jeu, R.A.M.; Guichard, F.; Harris, P.P.; Dorigo, W.A. Afternoon rain more likely over drier soils. Nature 2012, 489, 423–426. [Google Scholar] [CrossRef] [Green Version]
- Guillod, B.P.; Orlowsky, B.; Miralles, D.G.; Teuling, A.J.; Seneviratne, S.I. Reconciling spatial and temporal soil moisture effects on afternoon rainfall. Nat. Commun. 2015, 6, 6443. [Google Scholar] [CrossRef]
- Schellekens, J.; Dutra, E.; Martínez-de la Torre, A.; Balsamo, G.; van Dijk, A.; Sperna Weiland, F.; Minvielle, M.; Calvet, J.-C.; Decharme, B.; Eisner, S.; et al. A global water resources ensemble of hydrological models: The eartH2Observe Tier-1 dataset. Earth Syst. Sci. Data 2017, 9, 389–413. [Google Scholar] [CrossRef]
- Velázquez, J.A.; Schmid, J.; Ricard, S.; Muerth, M.J.; Gauvin St-Denis, B.; Minville, M.; Chaumont, D.; Caya, D.; Ludwig, R.; Turcotte, R. An ensemble approach to assess hydrological models’ contribution to uncertainties in the analysis of climate change impact on water resources. Hydrol. Earth Syst. Sci. 2013, 17, 565–578. [Google Scholar] [CrossRef]
- Bhuiyan, M.A.E.; Nikolopoulos, E.I.; Anagnostou, E.N.; Polcher, J.; Albergel, C.; Dutra, E.; Fink, G.; Martínez-de la Torre, A.; Munier, S. Assessment of precipitation error propagation in multi-model global water resource reanalysis. Hydrol. Sci. J. 2019, 23, 1973–1994. [Google Scholar] [CrossRef] [Green Version]
- Krysanova, V.; Donnelly, C.; Gelfan, A.; Gerten, D.; Arheimer, B.; Hattermann, F.; Kundzewicz, Z.W. How the performance of hydrological models relates to credibility of projections under climate change. Hydrol. Sci. J. 2018, 63, 696–720. [Google Scholar] [CrossRef]
- Mazzoleni, M.; Brandimarte, L.; Amaranto, A. Evaluating precipitation datasets for large-scale distributed hydrological modelling. J. Hydrol. 2019, 578, 124076. [Google Scholar] [CrossRef] [Green Version]
- Ahi, G.O.; Jin, S. Hydrologic mass changes and their implications in Mediterranean-climate Turkey from GRACE measurements. Remote Sens. 2019, 11, 120. [Google Scholar] [CrossRef]
- Schumacher, D.L.; Keune, J.; van Heerwaarden, C.C.; Vilà-Guerau de Arellano, J.; Teuling, A.J.; Miralles, D.G. Amplification of mega-heatwaves through heat torrents fuelled by upwind drought. Nat. Geosci. 2019, 12, 712–717. [Google Scholar] [CrossRef]
- Funk, C.; Peterson, P.; Peterson, S.; Shukla, S.; Davenport, F.; Michaelsen, J.; Knapp, K.R.; Landsfeld, M.; Husak, G.; Harrison, L.; et al. A High-resolution 1983–2016 Tmax climate data record based on infrared temperatures and stations by the Climate Hazard Center. J. Clim. 2019, 32, 5639–5658. [Google Scholar] [CrossRef]
- Gebrechorkos, S.H.; Hülsmann, S.; Bernhofer, C. Statistically downscaled climate dataset for East Africa. Sci. Data 2019, 6, 31. [Google Scholar] [CrossRef]
- Bui, H.T.; Ishidaira, H.; Shaowei, N. Evaluation of the use of global satellite–gauge and satellite-only precipitation products in stream flow simulations. Appl. Water Sci. 2019, 9, 53. [Google Scholar] [CrossRef]
- Park, K.J.; Yoshimura, K.; Kim, H.; Oki, T. Chronological development of terrestrial mean precipitation. Bull. Am. Meteorol. Soc. 2017, 98, 2411–2428. [Google Scholar] [CrossRef]
- Hasan, E.; Tarhule, A.; Zume, J.T.; Kirstetter, P.-E. +50 years of terrestrial hydroclimatic variability if Africa’s transboundary waters. Sci Rep. 2019, 9, 12327. [Google Scholar] [CrossRef]
- Hasan, E.; Tarhule, A.; Hong, Y.; Moore, B., III. Assessment of physical water scarcity in Africa using GRACE and TRMM satellite data. Remote Sens. 2019, 11, 904. [Google Scholar] [CrossRef]
- Biswas, A.K.; Tortajada, C. Water crisis and water wars: Myths and realities. Int. J. Water Resour. Dev. 2019, 35, 727–731. [Google Scholar] [CrossRef]
Figure 1.
The terrestrial water cycle (or hydrological cycle) and its components.

Figure 2.
Temporal scales of weather and climate processes.

Figure 3.
Average water transport/exchange in km3 per year. Figure modified from [1].
Figure 3.
Average water transport/exchange in km3 per year. Figure modified from [1].

Figure 4.
The global observing system of the water cycle.

Figure 5.
Evolution of the satellite constellation for precipitation measurements.

Figure 6.
Concept of the planned missions for the global water cycle observation.

Figure 7.
WCRP Grand Challenges (https://www.wcrp-climate.org/grand-challenges/grand-challenges-overview, last accessed 27 September 2019).
Figure 7.
WCRP Grand Challenges (https://www.wcrp-climate.org/grand-challenges/grand-challenges-overview, last accessed 27 September 2019).

Figure 8.
GPM Core Observatory view of the “Nor’easter” winter storm on 2 March, 2018 over the Eastern US. Rainfall rates are shown in warm colors and snow-bearing clouds and falling snow in bluish colors. Courtesy of NASA (https://pmm.nasa.gov/extreme-weather/gpm-examines-snow-destructive-noreaster, last accessed 24 September 2019).

Figure 9.
24hr eTRaP quantitative precipitation forecast (QPF) from 15 independent ensemble members on 24 September 2019 for Tropical Storm Jerry over the Atlantic Ocean. Courtesy of NOAA-NESDIS (https://www.ssd.noaa.gov/PS/TROP/etrap.html?storm=JERRY, last accessed 24 September 2019).
Figure 9.
24hr eTRaP quantitative precipitation forecast (QPF) from 15 independent ensemble members on 24 September 2019 for Tropical Storm Jerry over the Atlantic Ocean. Courtesy of NOAA-NESDIS (https://www.ssd.noaa.gov/PS/TROP/etrap.html?storm=JERRY, last accessed 24 September 2019).

Figure 10.
Map of 2085 landslides with fatalities as reported in the Global Landslide Catalog. Courtesy of NASA Earth Observatory, using landslide susceptibility data provided by T. Stanley and D. Kirschbaum (https://pmm.nasa.gov/articles/help-create-largest-landslide-database, last accessed 24 September 2019) [294,295].

Figure 11.
Combined Drought Indicator in Europe for the first 10 days of September 2019. Courtesy of the European Drought Observatory (https://edo.jrc.ec.europa.eu/edov2/php/index.php?id=1000, last accessed 24 September 2019) [302].
Figure 11.
Combined Drought Indicator in Europe for the first 10 days of September 2019. Courtesy of the European Drought Observatory (https://edo.jrc.ec.europa.eu/edov2/php/index.php?id=1000, last accessed 24 September 2019) [302].

© 2019 by the authors. Licensee MDPI, Basel, Switzerland. This article is an open access article distributed under the terms and conditions of the Creative Commons Attribution (CC BY) license (http://creativecommons.org/licenses/by/4.0/).
Share and Cite
MDPI and ACS Style
Levizzani, V.; Cattani, E. Satellite Remote Sensing of Precipitation and the Terrestrial Water Cycle in a Changing Climate. Remote Sens. 2019, 11, 2301. https://0-doi-org.brum.beds.ac.uk/10.3390/rs11192301
AMA Style
Levizzani V, Cattani E. Satellite Remote Sensing of Precipitation and the Terrestrial Water Cycle in a Changing Climate. Remote Sensing. 2019; 11(19):2301. https://0-doi-org.brum.beds.ac.uk/10.3390/rs11192301
Chicago/Turabian StyleLevizzani, Vincenzo, and Elsa Cattani. 2019. "Satellite Remote Sensing of Precipitation and the Terrestrial Water Cycle in a Changing Climate" Remote Sensing 11, no. 19: 2301. https://0-doi-org.brum.beds.ac.uk/10.3390/rs11192301
Note that from the first issue of 2016, this journal uses article numbers instead of page numbers. See further details here.