Measuring Sand Dune Migration Rates with COSI-Corr and Landsat: Opportunities and Challenges


1
Department of Earth Sciences, University College London, 5 Gower Place, London WC1E 6BS, UK
2
Department of Earth and Planetary Sciences, Birkbeck, University of London, Malet Street, London WC1E 7HX, UK
*
Author to whom correspondence should be addressed.
Remote Sens. 2019, 11(20), 2423; https://0-doi-org.brum.beds.ac.uk/10.3390/rs11202423
Submission received: 20 September 2019
/
Accepted: 14 October 2019
/
Published: 18 October 2019
(This article belongs to the Special Issue Remote Sensing in Support of Aeolian Research)
Abstract
:It has been over a decade since COSI-Corr, the Co-Registration of Optically Sensed Images and Correlation, was first used to produce a raster map of sand dune movement, however, no studies have yet applied it to the full Landsat archive. The orthorectified and geolocated Landsat Level-1 Precision Terrain (L1TP) products offer the opportunity to simplify the COSI-Corr pre-processing steps, allowing an automated workflow to be devised. In the Bodélé Depression, Chad, this automated workflow has calculated average dune speeds of 15.83 m/year and an increase in dune movement of 2.56 m/year ±12.58 m/year from 1987 to 2009. However, this increase does not stem from a systematic increase in dune mobility. The fastest 25% of dunes from 1987 to 1998 reduced their speed by 18.16%. The overall increase stems from the acceleration of features previously moving under 13.30 m/year. While successfully applied to the Bodélé Depression, the automated workflow produces highly variable outputs when applied to the Grand Erg Oriental, Algeria. Variations within path/row scene pairings are caused by the use of mobile features, such as dune crests, as ground control points (GCPs). This has the potential to warp Landsat scenes during the L1TP processing, potentially obfuscating dune migration. Two factors appear to be crucial in determining whether a Landsat scene is suitable for COSI-Corr analysis. Firstly, dune mobility must exceed the misregistration criteria. Secondly, GPCs should be located on static features such as bedrock outcrops.

1. Introduction
Coupled with scarce water resources and poor land fertility, the encroachment of sand dunes remains a key hazard for the inhabitants of dryland desert areas [1]. With significant financial loss through the burial of agricultural land [2], the alteration of water supply pathways [3], and the incapacitation of transport networks [4], the economic impacts of sand encroachment further debilitate some of the poorest human populations on the planet [5]. Parts of the Sahara are already experiencing increased risks from sand dune migration accelerated by unsustainable development, over-cultivation, and poor irrigation practices [6]. As desert communities have seen the largest population growth rates compared to any other ecological habitat [7], the associated expansion of agricultural land-use is likely to force dryland populaces to inhabit increasingly unfavorable areas [8]. Understanding dune migration rates is therefore essential to determining the risk of sand encroachment to these communities.
Traditionally, aeolian geomorphologists have monitored dune migration with ground-based surveys. Such surveys have involved the measurement of dune displacements relative to fixed markers [9]; topographic surveys utilizing a clinometer and tape measure [10]; and the detection or trapping of moving grains along the dune surface [11,12]. These approaches have produced highly accurate measurements of dune celerity, but, due to the difficulty in scaling them across larger areas, the results are spatially restricted and represent only localised movement [13]. Such techniques also often fail to capture more complex changes in dune morphology [14].
The application of remote sensing to determine sand dune celerity offers an opportunity to address the issue of scaling. With the use of aerial imagery, sand dune interactions, migration rates, and changes in dune morphodynamics can be more readily determined across a larger area [15]. Remotely sensed studies of dune displacement have largely relied on the manual vectorisation of dune features, calculating movement using a “nose-to-nose” approach [16], or from dune outline changes [17]. However, the approaches are limited in their precision and accuracy, and tend to overestimate migration rates [18]. In more recent years, the personal bias of these methods has been addressed with automated vectorization. The Pairs of Source and Target Points [19] and Digital Shoreline Analysis System methods both remove user defined extractions and thus the subjectivity associated with manual measurements of dune displacement. However, their focus on dune crest extraction provides little information on morphological changes within the dune shape and sloss slope. This information could be captured more readily using a pixel-based methodology. An automated raster approach may thus provide a holistic quantification of sand dune mobility.
Studies of aeolian sand and dune movement in the Sahara are remarkably limited. The last complete record of sandflow in the Sahara was compiled in 1978 by Mainguet [20], with subsequent additional mapping of dune morphology by Breed et al. [21] in 1979. Since these records, contemporary studies in the Sahara have largely been limited to examining only individual, or a small number of dunes [22,23,24,25,26].
It has been over a decade since COSI-Corr, the Co-Registration of Optically Sensed Images and Correlation, was first applied to dune celerity in the Bodélé Depression [27], and it has been widely deployed across a number of terrestrial [14,27,28,29,30,31,32,33] and extraterrestrial dune fields [34,35,36,37]. COSI-Corr produces an automatic pixel-wise change detection between two orthorectified and precisely co-registered optical images and was originally designed to measure displacements from seismic activity [38]. Few studies have used COSI-Corr to correlate Landsat scenes with the majority of terrestrial applications using the higher resolution SPOT and/or ASTER imagery [14,27,28,30,31,33]. Although at a coarser resolution than the 2.5 m SPOT-5 imagery, the global catalog of 30 m resolution Landsat data is freely available and consists of an archive stretching back to 1972 [39]. In addition to this archival longevity, the pre-orthorectified and geolocated Landsat Level-1 Precision Terrain (L1TP) data products remove the requirement for the manual pre-processing steps of the COSI-Corr methodology. L1TP data products are the highest tier of Landsat geometric data quality and are offered for time-series analysis [40].
The continuity and extent of the Landsat imagery combined with the increased processing power and development of an automated analysis with COSI-Corr affords the opportunity to map dune mobility at a scale not previously attempted. This paper therefore seeks to demonstrate the opportunities the Landsat archive presents to sand dune migration studies in the Sahara. Section 2 will review previous investigations and discuss the current application of COSI-Corr to sand dune research. Section 3 uses this body of literature to design a robust COSI-Corr workflow for Landsat L1TP scenes and combines it with an innovate method for the automatic identification of dunes. Section 4 of this paper details the successful application of the COSI-Corr workflow, with the generation and spatio-temporal analysis of a `big dataset’ of sand dune mobility across the Bodélé Depression, Chad. The widespread application of the designed methodology is, however, limited. Section 5 details the variations in correlation outputs seen in the Grand Erg Oriental, Algeria. The correlations of scenes across the Grand Erg produce spatial artifacts that are resistant to post-processing rectification and result from Landsat L1TP georegistration errors. Section 6 discusses L1TP misregistration, its applicability to sand sea imagery, and the implications for producing a global database of dune mobility.
2. Previous Applications of COSI-Corr to Sand Dune Studies
COSI-Corr is a remote sensing technique that produces an automatic pixel-wise change detection between an orthorectified and precisely co-registered `master’ image and its subsequent post-event `slave’ image [38]. COSI-Corr uses a sophisticated change detection algorithm that operates in the frequency domain. This algorithm calculates the east/west (EW) and north/south (NS) components of the displacement, from which displacement vectors can be calculated [38]. A signal to noise ratio (SNR) map is also produced, detailing the confidence of the calculations. Whereas previous remote sensing approaches produced point-estimates of dune celerity [16,17], the raster maps produced by COSI-Corr preserve dune morphometric changes.
In comparison to studies of seismic displacement [41,42,43,44] and glacier creep [45,46,47], the application of COSI-Corr to determine dune celerity has been complicated by the smaller size and structural variability of the target features. Since the first application of COSI-Corr to measure sand dunes in the Bodélé Depression [27], a number of methodological and analytical advancements have been made. With suitably high resolution imagery, COSI-Corr can determine a range of migration rates across a given dune field [35]. This capability raises questions over the best practice to present dune celerity measurements.
The first proponents of applying COSI-Corr to measure aeolian processes, Vermeesch and Drake [27] calculated dune migration and sand flux in the Bodélé Depression, Chad. The study combined four ASTER images to determine changes in dune migration rates on the order of 1 month, 15 months, and 6.5 years. At the shortest time step, displacements as little as 5 m were measured. Seasonal variations were also evident, with increased rates of dune celerity witnessed during the windiest months. Vermeesch and Drake combined celerity results with a DEM created from a stereographic pair of ASTER 3N and V3B images to determine sand flux.
Following Vermeesch and Drake, Necsoiu et al. [28] sought to further address the uncertainties and limitations of COSI-Corr’s application to sand dune migration quantification. By combining SPOT-5 and ASTER imagery, dune celerity was determined across a 5 year time step for the subarctic Great Kobuk Sand Dunes in Kobuk Valley National Park, Alaska, USA. The study made two important methodological advancements concerning the correlation of images from different satellites and the propagation of noise in vector field calculations. Images with overlapping spectral ranges were found to produce fewer outliers and the lowest correlation noise over stable areas [28]. Overall, a linear mixing of ASTER Bands 1 and 2 that produced the smallest regressional differences to the Panchromatic SPOT image resulted in the best correlation outputs. While Vermeesh and Drake [27] used only ASTER imagery, the successful combination of scenes from different satellites allows a wider archive of imagery to be used. The second methodological advancement by Necsoiu et al. [28] involved the removal of positive bias from dune displacement measurements. When calculating the Euclidean norm, the Gaussian distribution of cross-correlation noise is transformed into a Rayleigh distribution, with solely positive values. Displacements over stable areas are therefore overestimated as the correlation noise, and converted into vectors with strictly positive magnitudes. By projecting the displacement vectors onto a local robust migration direction, correlation noise retains its Gaussian distribution and can be distinguished from areas of active movement. These methodological advancements allowed Nescoiu et al. to determine mean velocities of 1.15 m/year across the study area. The study achieved a level of noise ~1/18th of the pixel size (0.16 m/year), and matched well with previous calculations of dune migrations.
To overcome the lack of long-term meteorological records in the Bodélé Depression, Chad, Vermeesch and Leprince [29] created a 26-year time series of dune movement as a proxy for `windiness’. The study used a wide range of imagery, combining one Landsat 4, two SPOT-3, and four ASTER scenes from 1984 to 2010. Additionally, the scenes were co-located and orthorectified using Landsat 7 and a Shuttle Radar Topography Mission (SRTM) DEM. The scenes were passed through the COSI-Corr engine in chronological order. In terms of post-processing, attitude effects were removed by destriping, and pixels with a poor SNR or moving in an inconsistent direction were masked. The displacements were then warped back in time to a common reference and projected onto a robust migration direction. From this dataset, pixels with a total displacement near the modal dune displacement value (600 m) were selected. Dune mobility was found to be stable, changing less than 10% in 26 years (0.4% per year). The study concluded that there was no evidence that anthropogenic or natural climate change had altered the atmospheric circulation over the central Sahara at ground level [29].
Hermas et al. [14] sought to apply COSI-Corr to determine dune displacement over the northwest Sinai Peninsula, Egypt. The study used two 10 m SPOT-4 panchromatic images that were taken 229 days apart between May 2007 and January 2008. The post-processing differs to that of previous studies as pixels outside the arbitrary range of ±20 m were discarded as outliers and a non-local means filter was applied to reduce noise. The registration of the images was found to be 1/50th of the pixel size, with mean pixel displacements of 5.6 cm and 32.1 cm in the EW and NS components over stable areas. A robust migration direction was factored into measurements of displacement magnitudes. The results were then extrapolated to units of metres per year. The study [14] found dune areas were moving on average 7.7 m/year, with linear dune peaks moving 13.4 m/year. Taking transects along and perpendicular to the dune crest line, a significant variation between peaks and saddles along the same linear dune was determined [14]. Saddles were found to move relatively faster than the peaks, matching the estimated values of previous studies. The direction of movement was also found to be consistent with the wind regime direction and calculated sand dune drifting potential.
In conjunction with COSI-Corr, Scheidt and Lancaster [30] used the manual digitization of dunes and write memory function insertion (WMFI) to supplement and verify dune migration quantifications in the Sperrgebiet, Namibia from 2001 to 2009. With the use of seven ASTER 3N scenes and one AST14DMO ASTER pre-orthorectified product, the study was able to empirically determine the best technical workflow and investigate the effects of correlation parameters. The best window size was determined both quantitatively and qualitatively, with visual interpretations of dune geomorphologies and migration vectors combined with quantification of cross-correlation noise over stable areas. The best window size was determined in outputs that resulted in random-direction noise, with low magnitude vectors in stable areas. In the tests of optimal window size, the AST14DMO image was used. However, as only large dune migration vectors were detected, it was asserted that COSI-Corr results cannot be assured at the sub-pixel level using AST14DMO imagery. The resultant COSI-Corr outputs underwent destriping; directional and magnitude filtering; and were projected onto a robust migration direction. The results were divided by the time elapsed between the image acquisition dates and standardized to yearly measurements. To test the accuracy of the COSI-Corr produced celerity, 10 dunes were identified in the ASTER imagery and tacked manually from 2001 to 2009 using the WMFI technique. While COSI-Corr and WMFI results were closely related, COSI-Corr appeared to overestimate dune migration by 16%. Scheidt and Lancaster [30] found that the correlation engine struggled to accurately measure the migration of a dune which merged with an adjacent feature and was insensitive to small dunes. However, excluding these undetected small features, WMFI and COSI-Corr measurements were within 10 m/year, representing a difference of less than one ASTER pixel. COSI-Corr migration rates also compared well with historical records (after Enfordy-Younga, 1982). Dunes were found to have an average rate of movement between 7 and 32 m/year, with maximum rates of 18 to 83 m/year. Dune migration magnitudes were averaged across time steps to produce a map across the Sperrgebiet. The results showed areas of active sand dunes where sand is expected to feed into the Namib Sand Sea’s southern entry point. Dune migration vectors are largely due north, deviating 9° EW. While some consistent variations were present as dunes migrated around obstacles, year-to-year velocity variations were observed. Despite the total area of active dune fields in the Sperrgebiet remaining consistent throughout the study, areas with over 35 m/year movement were found to increase from 2007. This finding suggests an increase in sand transport and deflation in the Sperrgebiet [30].
Al-Ghamdi and Hermas [31] applied COSI-Corr to two SPOT-4 10 m panchromatic images of north-west Al-Lilth City, Saudi Arabia. The scenes were taken four months apart, from April 2010 to August 2010. Using a similar methodology to Hermas et al. [14], the net displacement of sand dunes in the study area was found to range from 0.0 to 17.0 m/month, with an average of 1.3 m/month. However, dune migration rates varied spatially across the study site, reflecting differing areas of dune morphologies and environmental settings. Individual, scattered barchans were found to have a higher migration rate compared to barchans occuring in small barchan fields. Additionally, along the same transect, barchan dunes were found to move, on average, twice as fast as transverse dunes. The vector displacement fields agreed well with the dominant prevailing wind direction. The findings of the study also highlighted the risks of dune migration in the area. They [31] found that agricultural areas were relatively safe from dune encroachment, but road networks and high power lines were found to be at risk.
Sam et al. [32] sought to estimate dune celerity and sand flux in the Barmer District of the Thar Desert, India. Using two Cartosat-1 scenes spaced 368 days apart, the study measured celerity and sand flux across a ~200 km2 area from March 2010 to 2011. The methodology significantly differs from previous studies. Firstly, pixels with a calculated SNR value less than 0.90 were given a displacement value of 0. The determination of dune displacement was also calculated using the Euclidean distance. Using this methodology, mean dune celerity was estimated to be 0.0034 m/day or 1.24 m/year. The study went on to determine sand flux in a similar method to Vermeesch and Drake [27]. To determine a base level, interdune pixels were identified as areas with movement below 0.90 m. As the majority of these interdune pixels were approximately 80 m in height, this value was subtracted from the DEM to determine dune heights. Sand flux was then calculated by multiplying the dune height above the base level by the dune celerity. Mean sand flux was estimated to be 0.0156 or 5.60 m3/m/year. However, with a co-registration accuracy of 0.70 pixels and a root mean square error (RMSE) of 1.60 m, mean dune movement was found to fall within cross-correlation errors. This finding suggests there is no apparent movement of sand dunes within the study time frame. A survey of the field site showed the area was stabilized with habitation and arid vegetation [32]. Despite negative results, the study was the first to apply COSI-Corr to Cartosat-1 imagery.
Al-Mutiry et al. [33] used two 10 m resolution SPOT-4 Panchromatic images to estimate dune migration rates in Irq Al-Rethmah, north Riyadh City from 2006 to 2009. The methodology follows that of previous studies [14,31] and projects movement onto a robust migration direction. The average displacement of all sand accumulations was calculated as 1.3 m across the 850-day period. While annual migration rates were found to range between 0.0 to 8.9 m/year, average values varied by location. Areas occupied by recent active dunes on the western periphery of Irq-Rethamh were found to have the highest average migration rate of 0.72 m/year. In comparison, sand sheet areas were found to have the lowest average celerity of 0.35 m/year. Dunes were found to represent a potential hazard to recreational facilities, farms, and roads located in west Irq Al-Rethmah. The study also compared dune migration directions to a 26-year record of wind direction. In winter, spring, and autumn months, the frequency of southern and northern winds is largely balanced. The movement of dunes in a southern direction was found to reflect the more frequent northern winds during summer. Overall, the study found that measured migration rates were much lower than other records of dune movements across Saudi Arabia. However, a direct comparison is hard to make as previous studies used ground-based in-situ methods, focused on different spatial areas and/or reflect historic measurements.
The methodology used for the identification and analysis of dunes differs between the aforementioned studies. The capability to determine changes within the dune shape raises questions over the best practice to present dune celerity measurements. Reporting the maximum and mean celerity across a manually defined dune area [30] works best in areas with high contrast between the dune and bedrock. The method is also advocated as providing a more nuanced representation that remains comparable to traditional records. Despite this, the required level of user input inhibits the scaling of this method. Studies at larger spatial scales instead forego manual dune boundary extractions and report distributions of net celerity values [28,32,33]. However, the inclusion of non-dune areas leads to greatly reduced average migration speeds [33]. While some studies have removed interdune pixels [32] or separated stable dune areas [28] from the reported distributions, a standard approach is yet to be harmonized in the literature. A possible solution to this trade-off between spatial scale and meaningful dune extraction is devised in the next section.
3. Defining a COSI-Corr Workflow for Landsat
3.1. Landsat Specifications
For each Landsat path/row over the Saharan sand seas, three cloudless Landsat Level-1 Precision Terrain (L1TP) scenes were obtained in decadal timesteps approximately centred around 1985, 1995, and 2005. As COSI-Corr outputs displacements relative to the pre-event ‘master’ scene, correlating multiple chronological pairings requires complex backtracking algorithms to identify changes in individual features [29]. However, by standardising the master scene over two time steps, dune movement can be co-located using a forward-looking (~1995 to ~2005) and backward-looking (~1995 to ~1985) coupling.
The L1TP scenes were radiometrically calibrated to top of atmosphere reflectance. Landsat Band 4 (0.777–0.90 m) was chosen due to its spectral similarity to the recommended [48] ASTER Band 3N (0.76–0.86 m). ASTER 3N and V3B can be used to form a stereoscopic scene which, when combined with celerity measurements, can be used to calculate sand flux. Although sand flux is not calculated in this paper, the spectral similarity between Landsat Band 4 and ASTER 3N affords a more direct comparison to previous studies [27,30]. Future work using this methodological approach would also benefit from the additional archival access afforded by ASTER, especially in areas where L1TP products may be unsuitable to use (see Section 5.2). The blending of Landsat Band 4 and Aster 3N scenes would result in fewer outliers and less noisy correlation outputs [28].
3.2. Determining Correlation Parameters
COSI-Corr calculates displacement within a window of [2n × 2n] pixels. The window size is the most critical parameter to determine when tuning the COSI-Corr engine [49]. Larger window sizes increase the precision of the correlation, but smaller sizes are more sensitive to localized movement. COSI-Corr allows for multiple window sizes to be applied and will automatically select the smallest window within a given range that results in a successful correlation [48]. To determine the most appropriate window sizes to apply to the paired Landsat scenes, COSI-Corr correlation window parameters were varied systematically for one forward-looking L1TP pairing over the Bodélé Depression (path/row 181/048; Table 1). In a similar methodology to Scheidt and Lancaster [30], the optimum window size was determined as resulting in the lowest residual displacements over stable areas and the highest average signal to noise ratio (SNR) value.
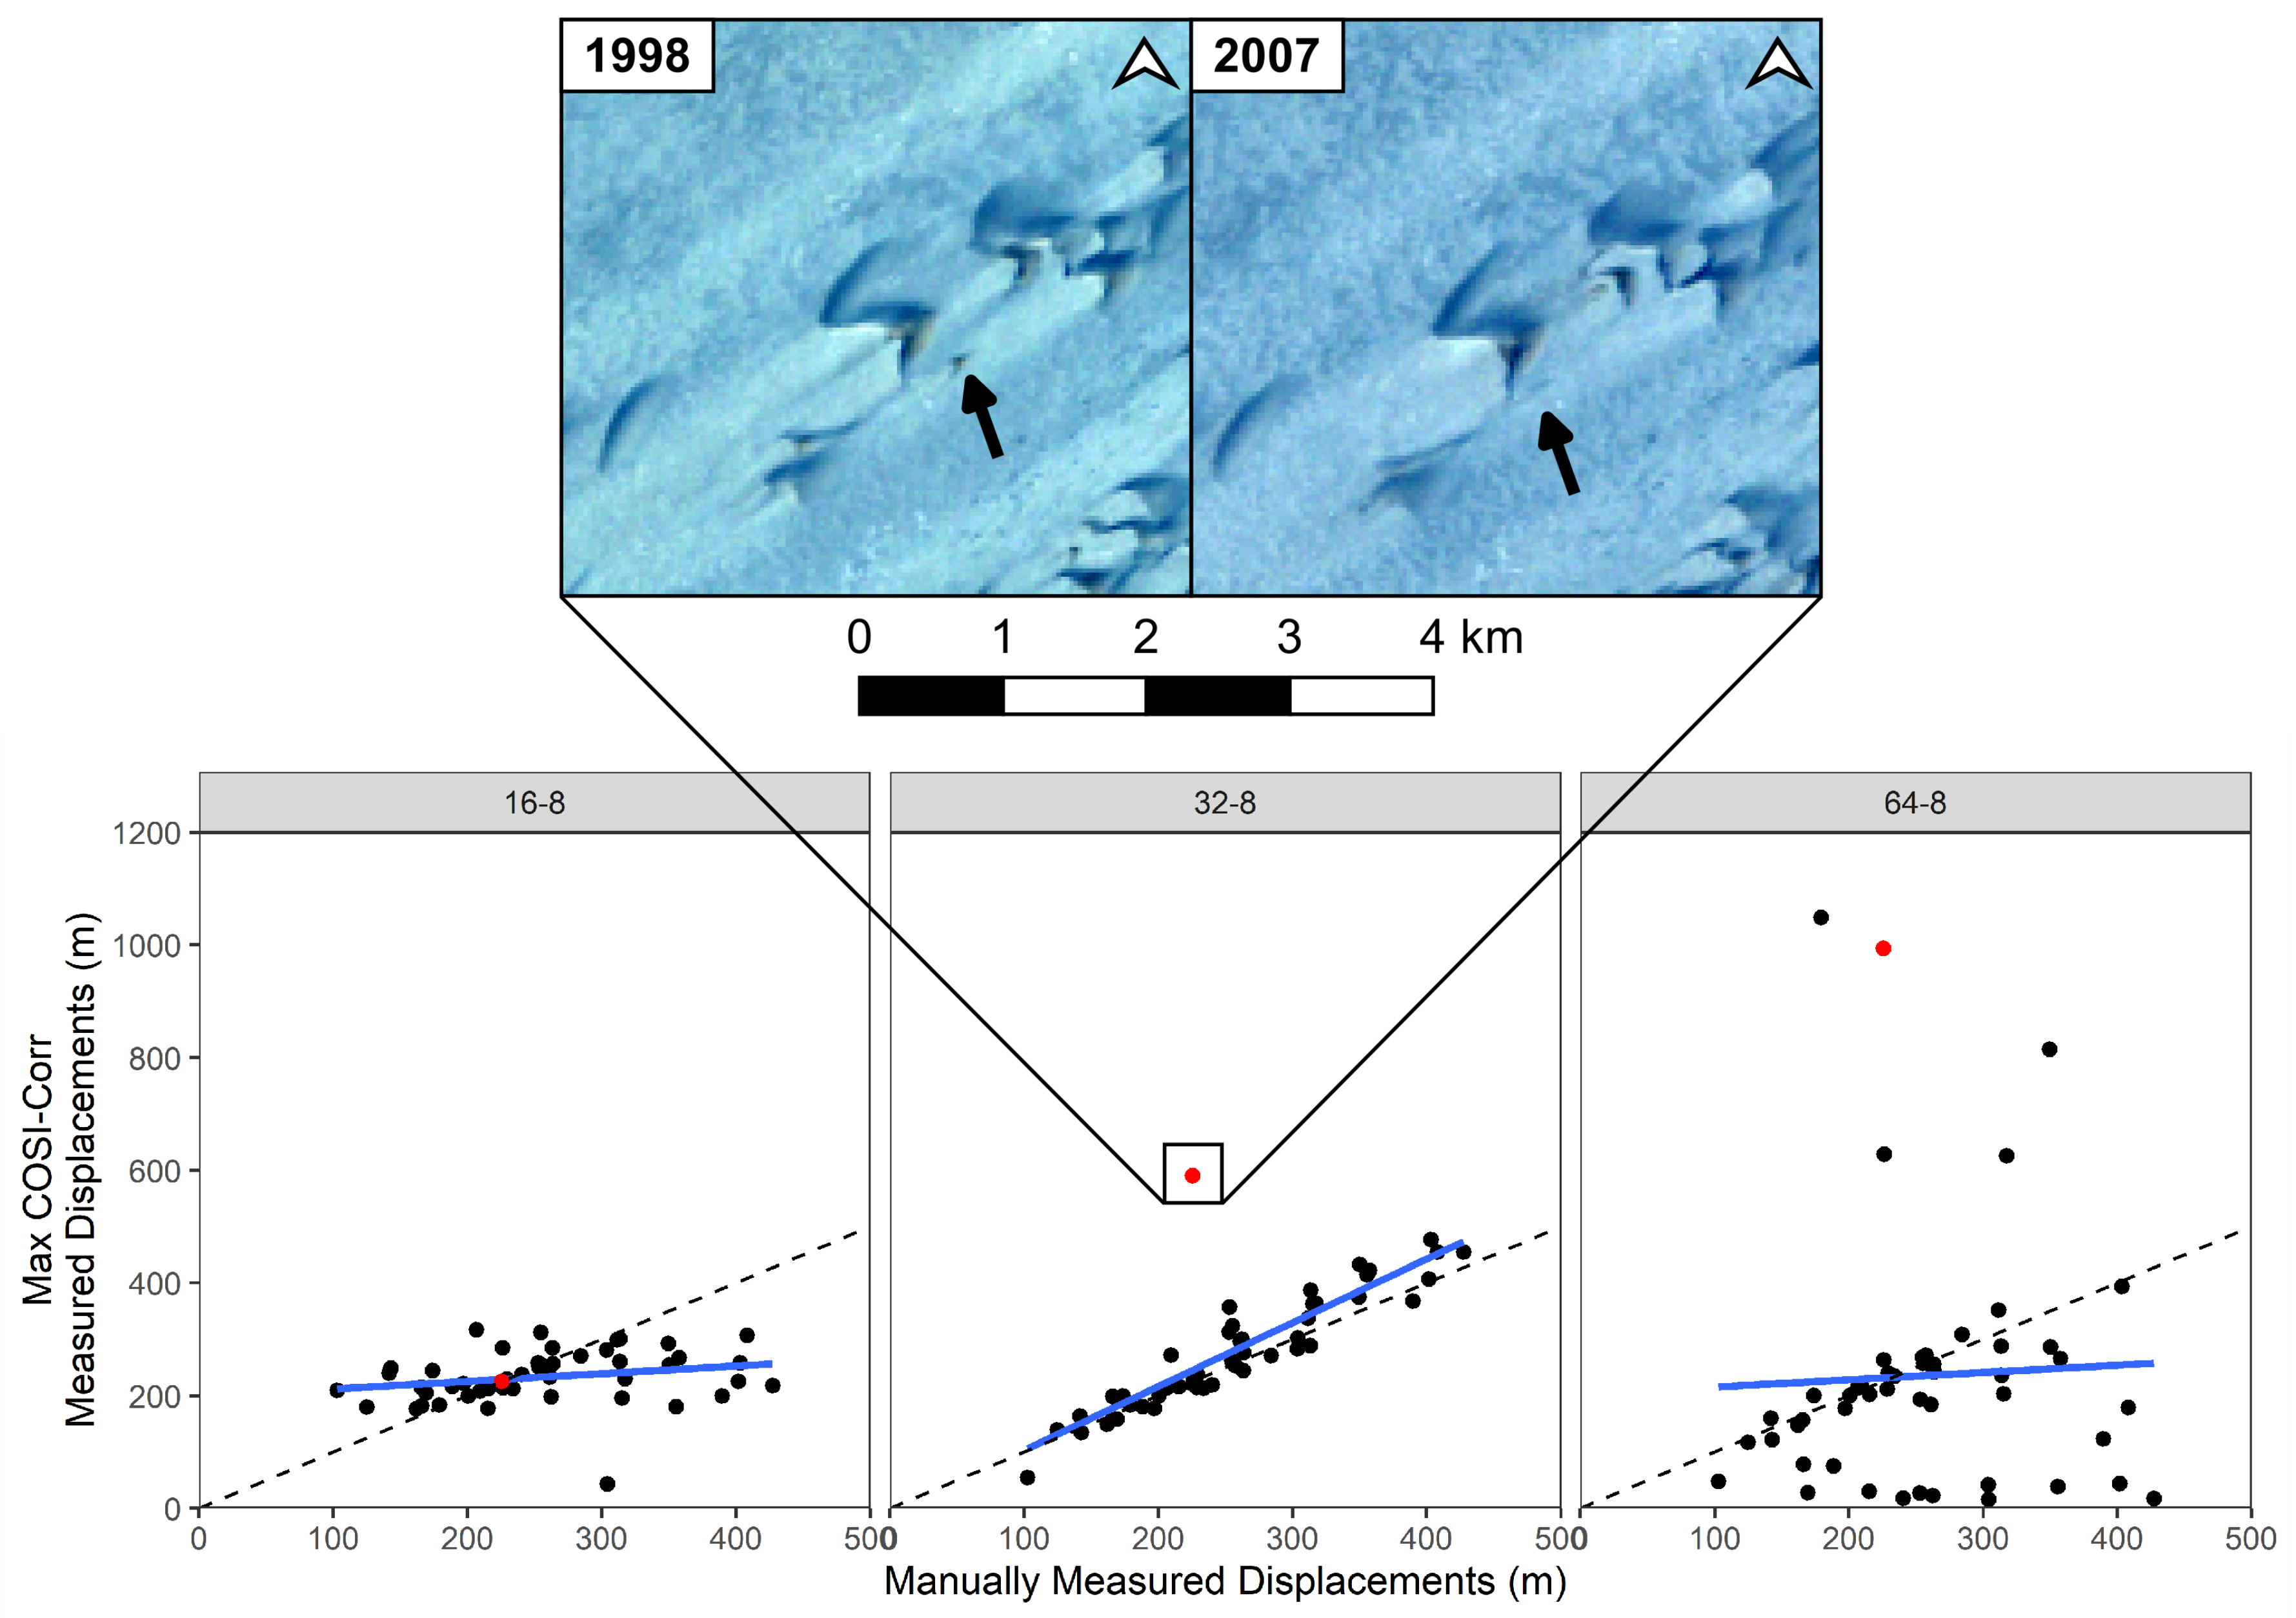
For stable areas, the window size of 64 to 8, 32 to 8, and 16 to 8 resulted in equally low residual displacements and high average SNRs. To determine which of these windows best capture dune movements, 50 dunes were randomly selected and manually vectorized. The maximum Euclidean displacement of the COSI-Corr outputs for these dunes were extracted and compared to manually measured maximum displacements (Figure 1).
The 16 to 8 window sizes proved to be too small to successfully resolve the highest displacements, limiting measurements of dune movement to below 350 m. Conversely, the larger 64 to 8 window parameter failed to detect the movement of 26% of the identified dunes. The majority of these missed dunes were small in size, with an area less than 0.01 km. In contrast, the 32 to 8 windows best matched manual measurements, despite the tendency of COSI-Corr to overestimate dune movement at the highest speeds. The dunes with the largest difference between observed and calculated displacements were found to have complex morphological changes. In the 32 to 8 output, sand dunes that merged with other features, separated from sand drift to a discrete dune unit, or were in the process of arm separation had the greatest difference between measurements. In these cases some variation can be expected between observed and measured displacements due to the high level of subjectivity in determining maximum movements. While, COSI-Corr has previously been found to overestimate dune displacement by 16% [30], the use of a 32 to 8 window parameter on Landsat imagery results in a much lower mean overestimation of 9%.
3.3. Calculating Annual Migration Rates
Using a window size of 32-8, a step size of 1, four robustness iterations and a mask threshold of 0.90, the paired forward- and backward-looking scenes were passed through the batch COSI-Corr frequency correlation engine. Pixels with an SNR ratio below 0.90 were masked and the resultant maps were trimmed to a standard size. Celerity measurements were calculated by dividing the displacement magnitudes by the difference in Julian Days between the image pairings, and standardizing the result to a 365-day year. While the forward- and backward-looking correlation pairings co-locate celerity outputs, the pairing structure reverses the direction of movement in the backward-looking correlation output. To correct the direction of dune movement, the EW and NS components of the backward-looking correlation were reflected around 0. From these outputs, pixelwise displacements were calculated using the robust migration direction method from Nesciou et al. [28] with a 5 × 5 median window.
3.4. Averaging Dune Celerity Estimates
COSI-Corr operates on raster images that consist of pixels. Landsat 4–5 pixels are 30 × 30 m in size, so that most dunes are covered by multiple pixels. Using a 1-pixel step size of the correlation window then produces multiple celerity estimates per dune. These estimates must somehow be averaged in order to extract dune statistics from the data. Previous studies have used the ordinary arithmetic mean to estimate the average of COSI-Corr results (Section 2). However this can lead to counter-intuitive results, as we will now illustrate with some simple synthetic examples. First consider the following set of celerity estimates:
where zeros mark the interdunes and positive values mark the dune pixels (in m/year). The arithmetic mean of the dune celerities is 1.75 m/year. Now let us express the same celerities in units of slowness (year/m) instead of speed (m/year):
then the arithmetic mean slowness is 0.66 year/m. This is equivalent to a celerity of 1.51 m/year, which is 15% lower than the arithmetic mean celerity calculated earlier.
The counter-intuitive dependence on the measurement units disappears when we use the geometric rather than arithmetic mean. In this case, the geometric mean celerity is 1.62 m/year and the geometric mean slowness is 0.62 year/m. It is easy to see that 1.62 = 1/0.62, which is an altogether more satisfying result than before. For this reason the geometric rather than arithmetic mean is used as a means of averaging celerities in the remainder of this paper.
In addition to the magnitude of the displacement, the migration direction is a second statistic of interest. Like the celerity, the direction is also estimated multiple times from each dune, and it is of some interest to quantify the dispersion between these estimates. Previous studies have used the standard deviation to estimate the dispersion of COSI-Corr results.
For example, consider two correlation estimates, corresponding to migration directions of 1 and , respectively. So both estimates are indicating northward migration of the dune. However the arithmetic mean of the directional estimates is 180, suggestion an average southerly migration. The standard deviation of the two estimates is 179, which is unreasonably high. This simple example shows that `normal’ statistics do not apply in directional data space.
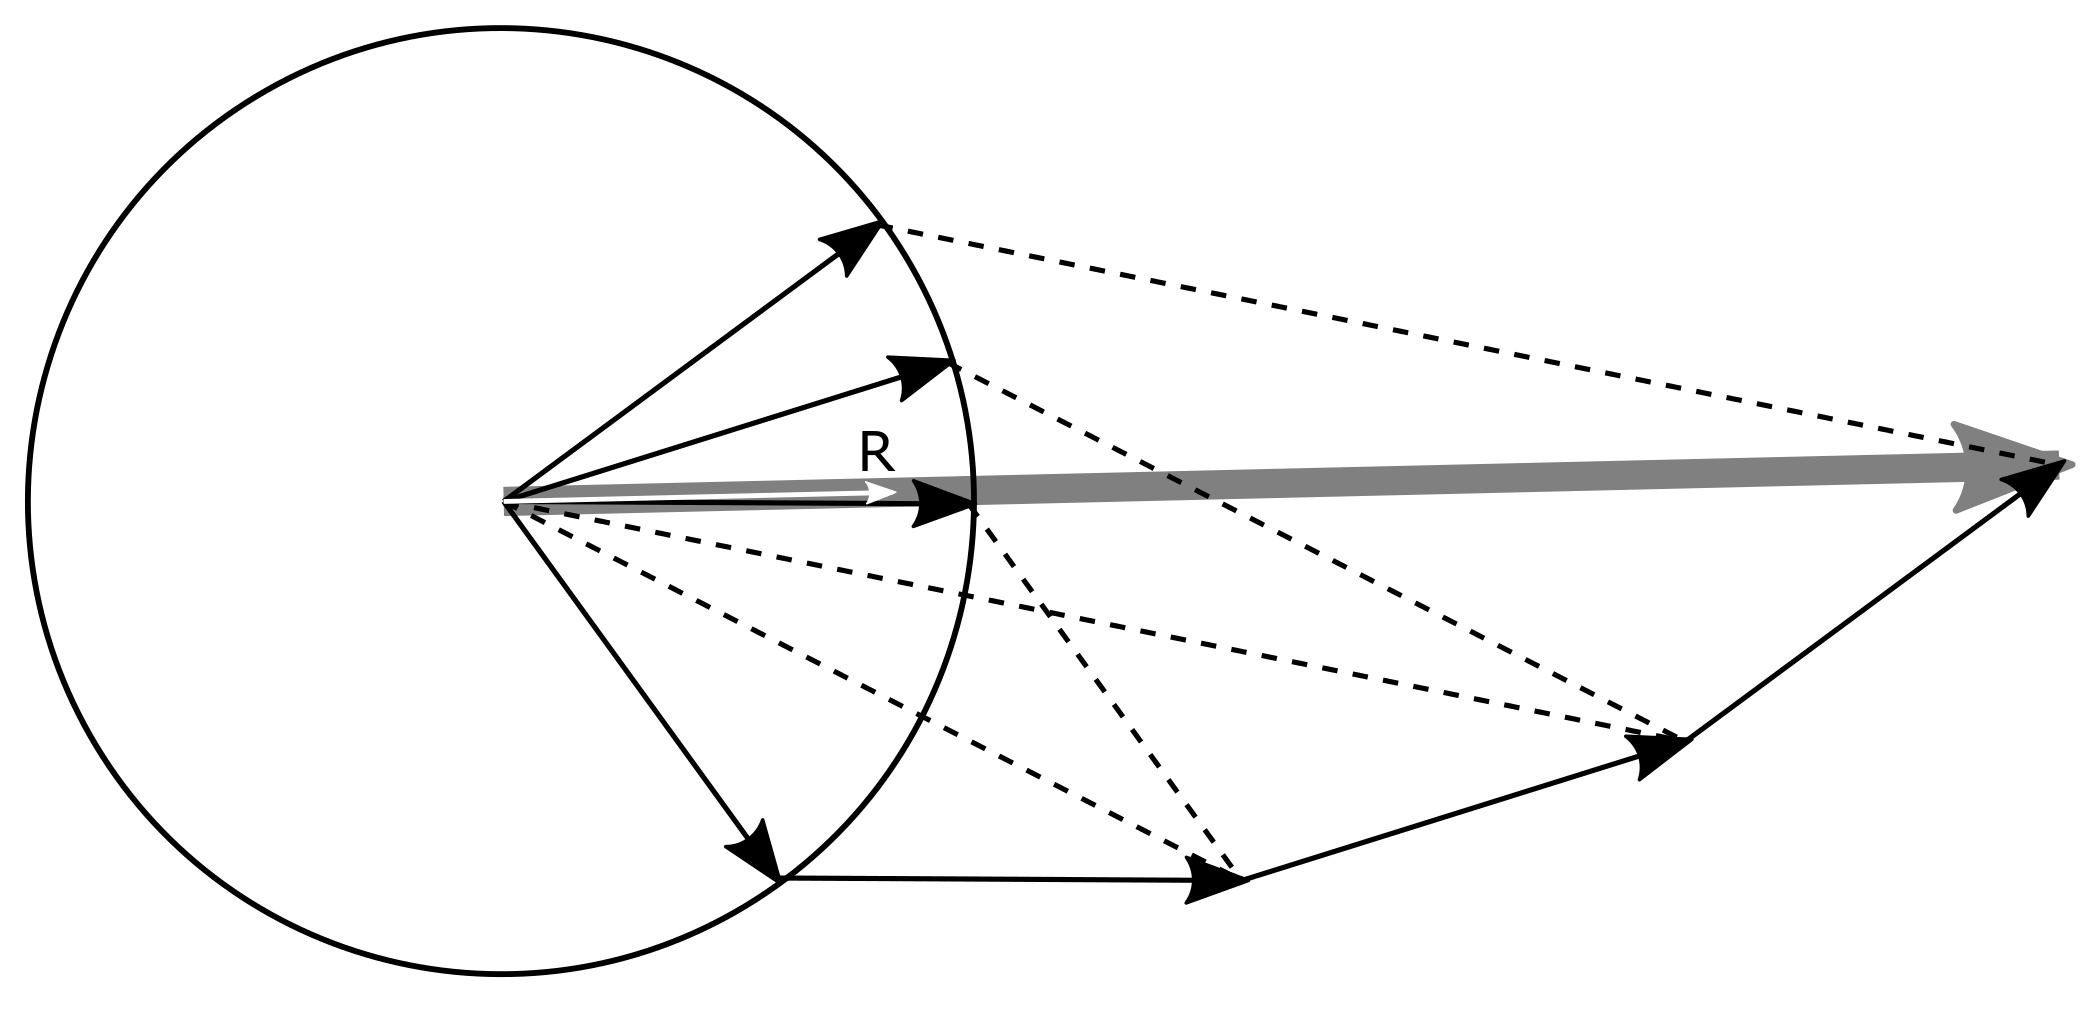
More reasonable results are obtained by vector addition (Figure 2). Consider n migration directions (in degrees or radians). Then the average migration direction is defined as:
and the angular concentration R as:
R ranges from 0 to 1, where a value closer to unity indicates greater directional similarity between correlation pairings. For example, in the aforementioned two-pixel example, the average of and is , with a concentration parameter of . In contrast, the average of and is , with a concentration parameter of . Thus, vector averaging yields far more intuitive results than the arithmetic mean and standard deviation, and will therefore be used in the remainder of this paper.
3.5. Automatic Identification of Dune Areas
In this study, the forward-looking and corrected backward-looking angles were used, n therefore equals 2. Combining R with a pixel-wise comparison of dune movement between correlations, dune pixels can be extracted automatically from COSI-Corr outputs.
To test the effectiveness of this dune identification technique, a `training’ dataset was created using Landsat path/row 183/048 over the Bodélé Depression. A random selection of 250 dunes were manually digitised and used to extract 27,862 `dune’ pixels from the COSI-Corr outputs. An equal number of base pixels were then randomly sampled from within a manually defined base area. With the presence of a diatomitic crust in the Bodélé Depression scenes, a similar process was used to extract `crust’ pixels. R and celerity threshold values were then systematically varied and the number of correct classifications recorded. The most appropriate threshold values were determined as those that correctly identified the largest percentage of sand dune pixels while masking the majority of base and crust areas.
By removing pixels that had a celerity less than 1 m/year in either correlation pairing and an R value less than 0.5, 98.15% of the surviving pixels were correctly identified as sand dunes. These thresholded pixels identified 98.80% of the total number of dunes in the training dataset, avoiding 99.11% of crust pixels and 99.99% of base pixels. A value of R greater than 0.5 equates to a directional difference of less than 120.
When applied to Landsat scenes, an R value of 0.5 was found to successfully distinguish sandy features from the bedrock and diatomitic crust. The resultant dataset included discrete dunes, protodunes, and sand patches. However, by using a tighter definition of directional consistency, the resultant datasets increasingly reflect more established discrete features. An R value of 0.985 (directional difference of 20) was found to produce a dataset which identified discrete dunes yet excluded base areas, upwind sand patches, and protodunes.
Both directional consistency threshold values were therefore applied to the L1TP scene correlations to produce two complementary datasets. Firstly, an overall analysis of aeolian activity was determined using the lower threshold of . Secondly, a subset of this dataset which contains the more established aeolian features were extracted using the higher threshold of . A 3 × 3 median filter was applied to the resultant boolean masks to further reduce the number of interdune pixels being mis-identified as dunes. The identified dune pixels were polygonized and used to extract celerity values using zonal statistics.
3.6. Data Extraction
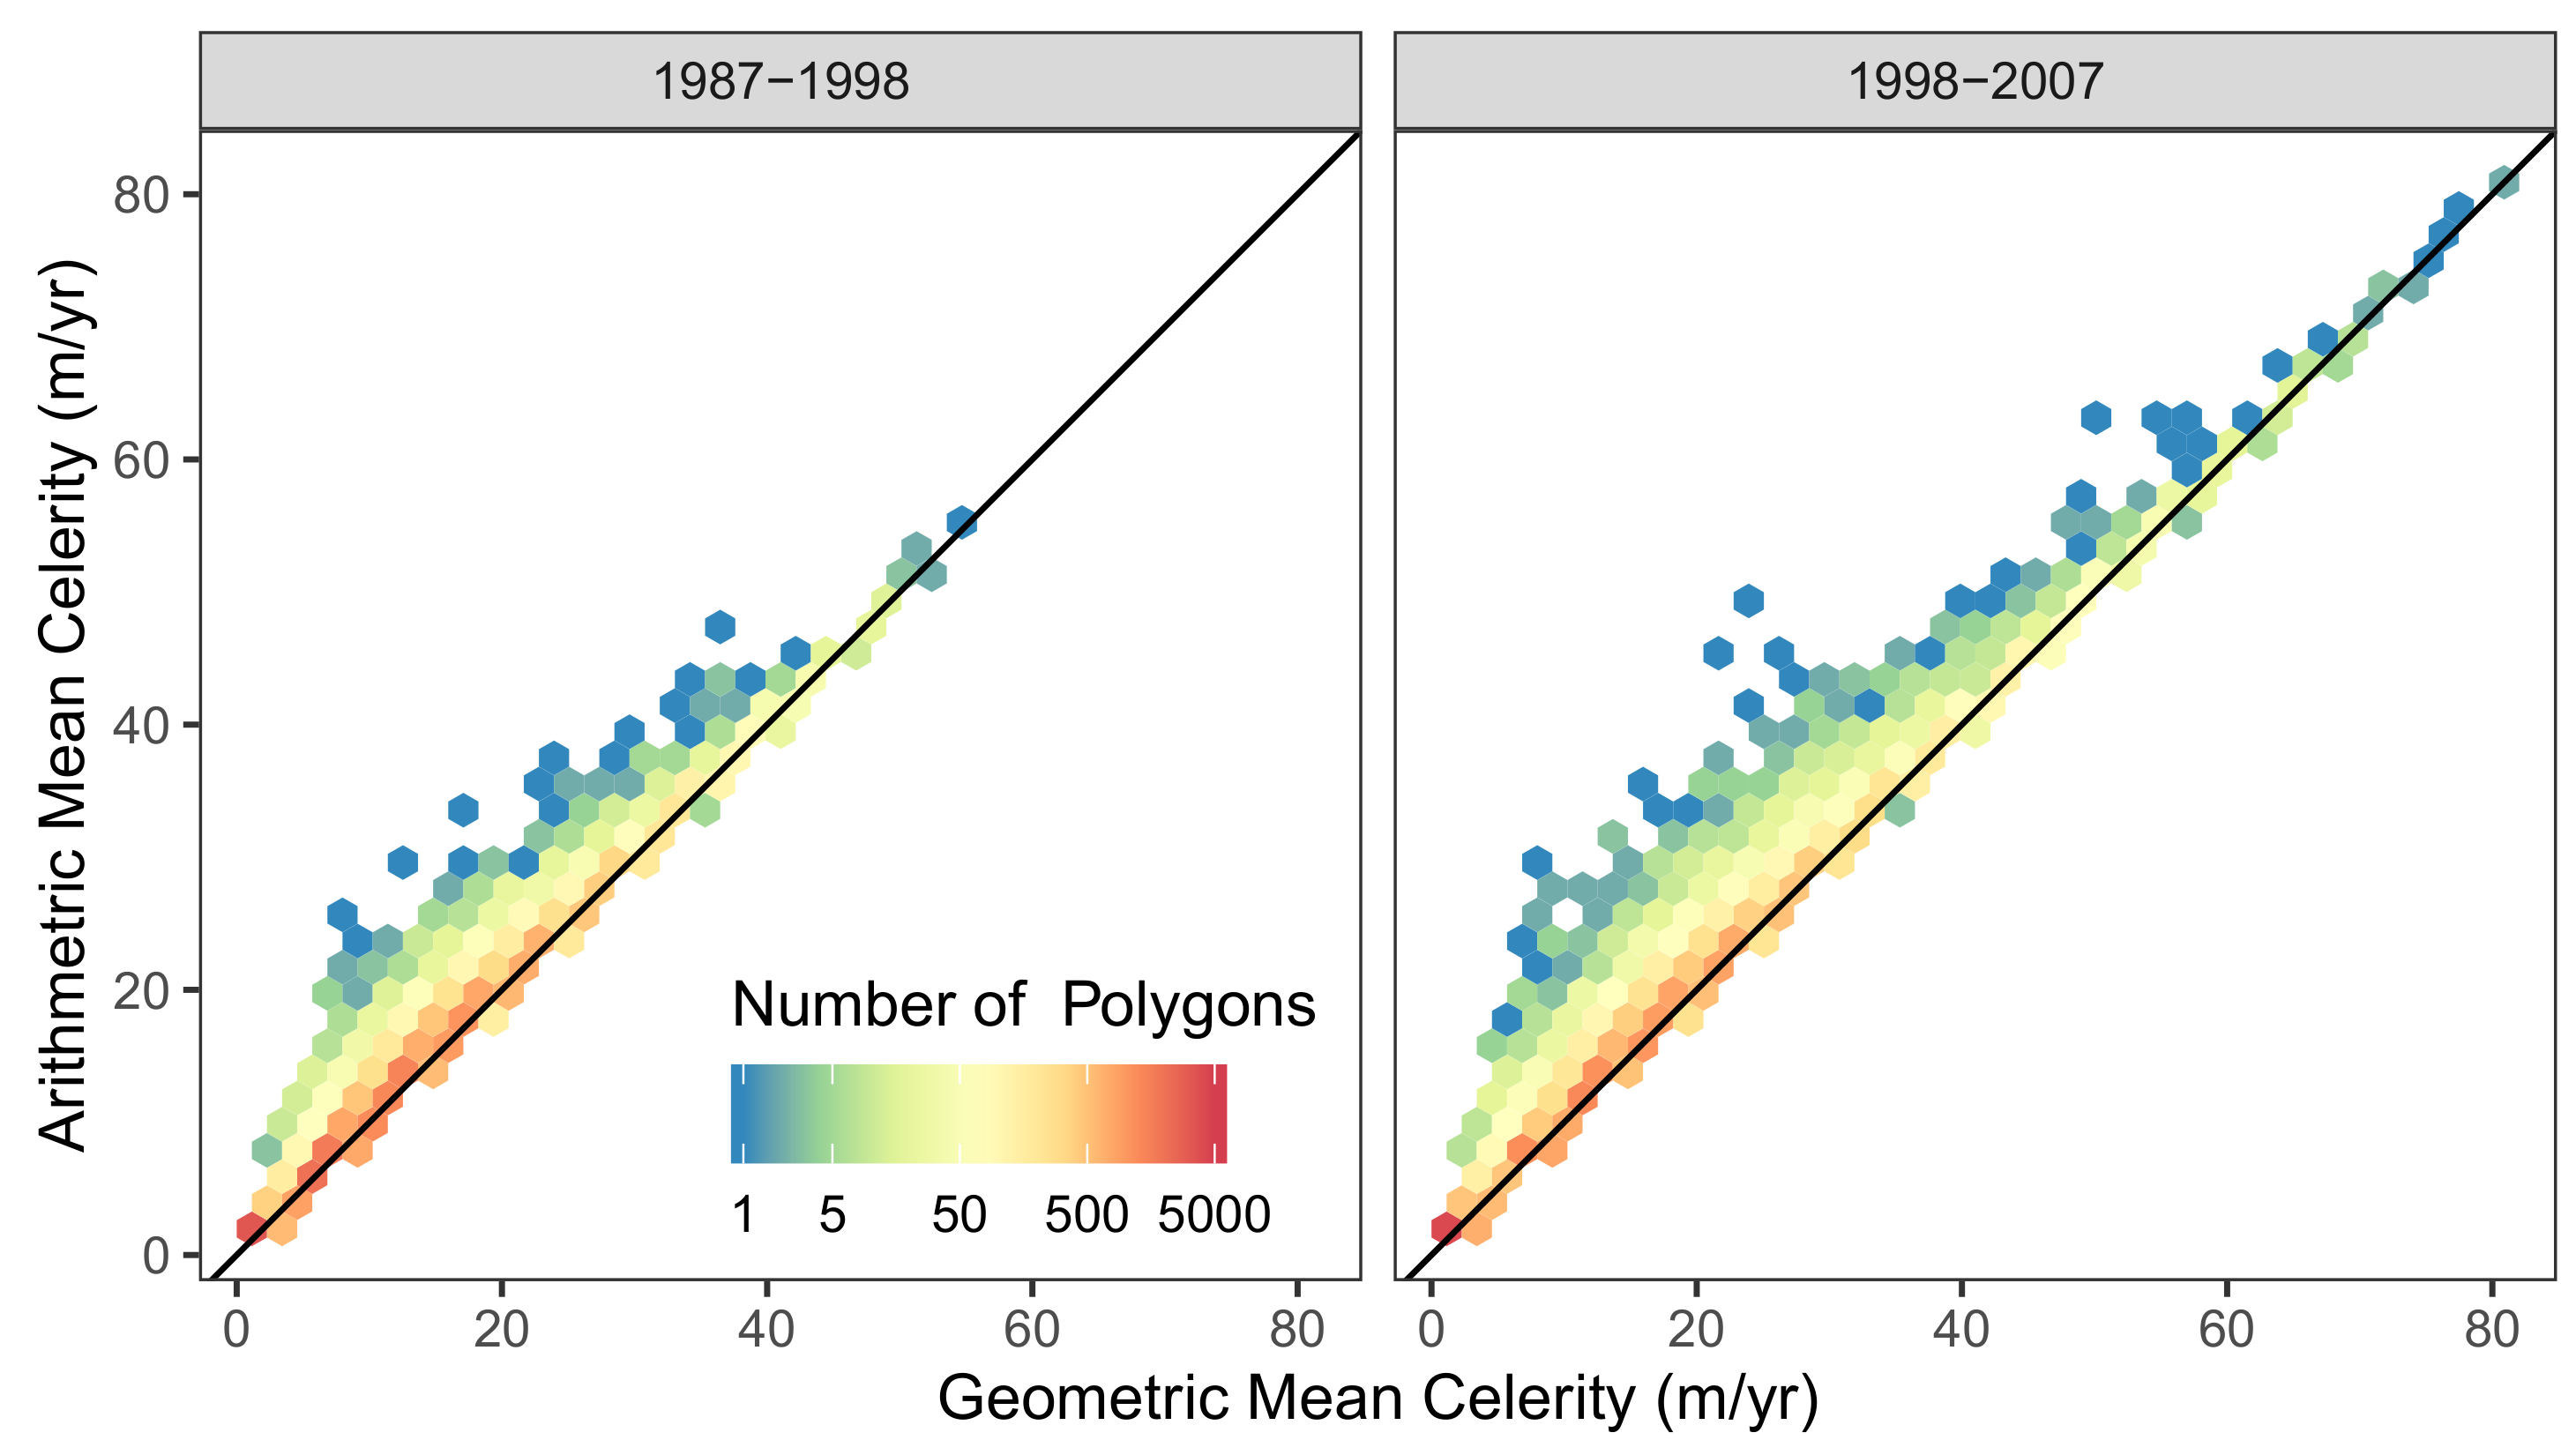
The polygonization of contiguous dune pixels in this study forgoes user intensive manual extractions and produces an automated digitization of dune areas. This method produces a noticeable difference between dune migration measurements produced by the arithmetic and geometric mean (Figure 3). In practice, while the arithmetic mean was found to produce a median overestimation of only 1.39%, it had a maximum overestimation of 24.59 m/year when compared to the geometric mean.
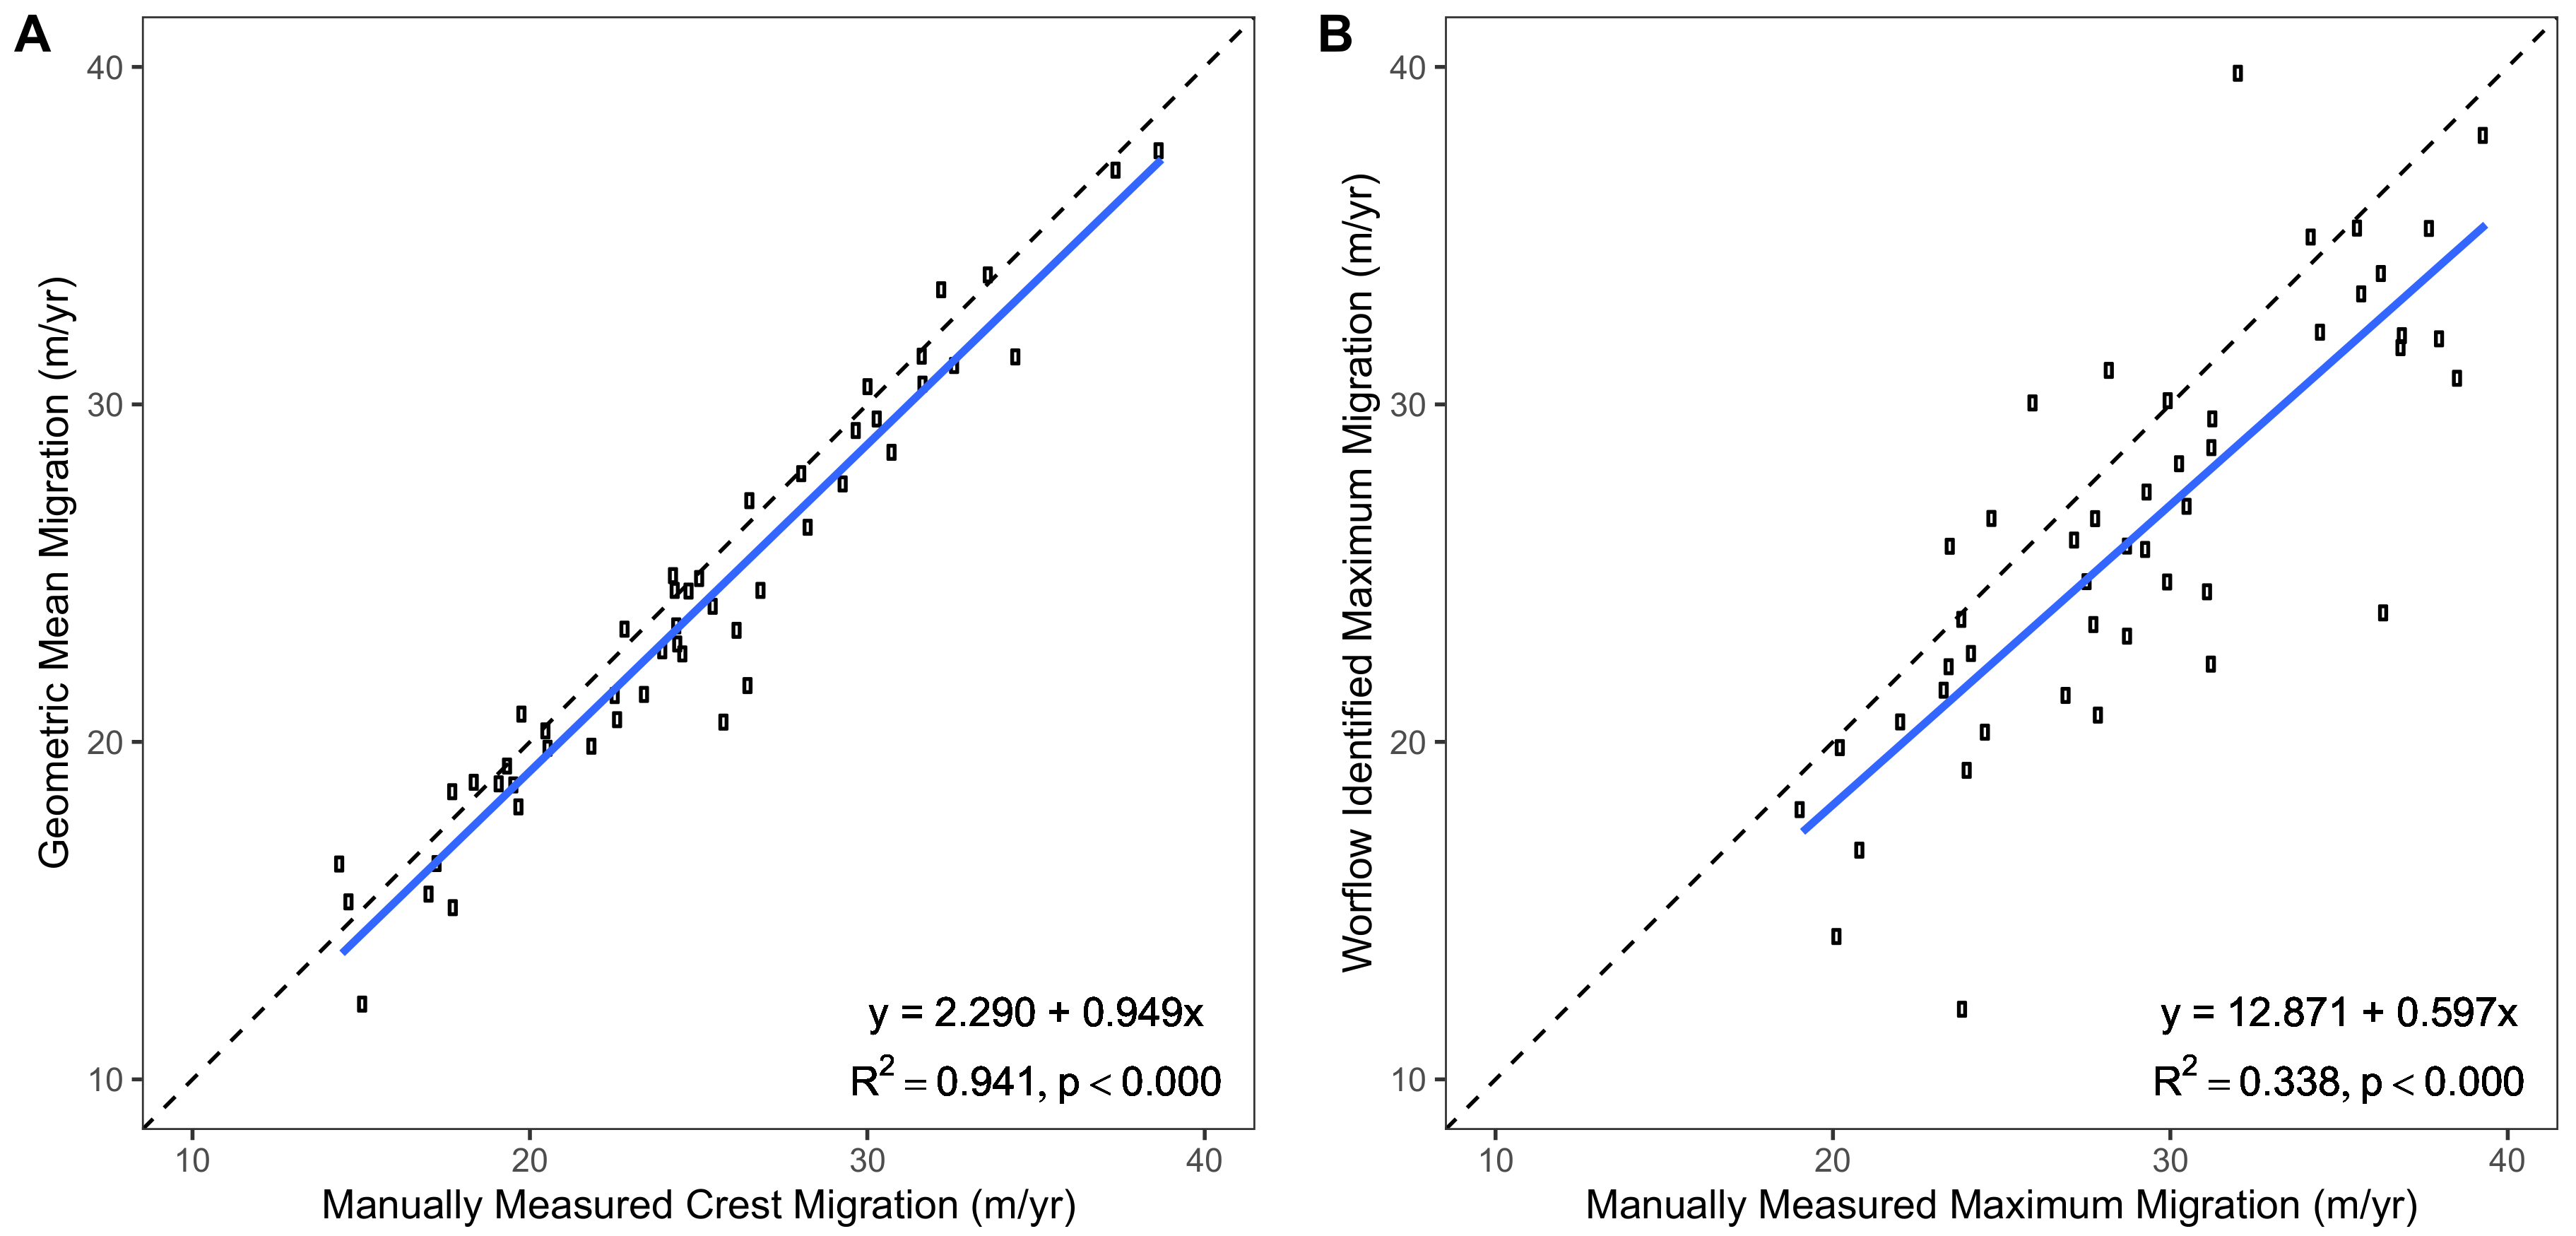
To determine the most appropriate metric to represent dune celerity in this study, 50 dunes were manually measured and the results compared against the workflow’s identified dune celerity values (Figure 4). Despite the coarse 30 m resolution of the Landsat imagery, COSI-Corr extractions using the geometric mean were found to closely resemble manual measurements at the dune crest ( = 0.941, p < 0.000). A larger variation is evident between calculated and manually measured maximum celerity values ( = 0.338, p = 0.000). The geometric mean celerity value within each identified dune polygon was therefore calculated and used to compile a `big dataset’ of dune mobility.
4. Application to the Bodélé Depression
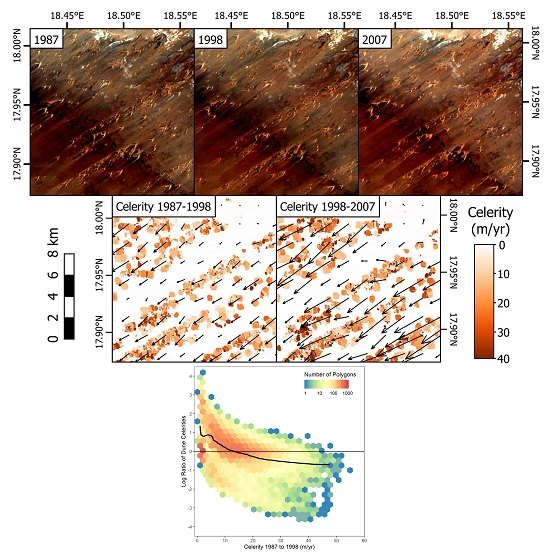
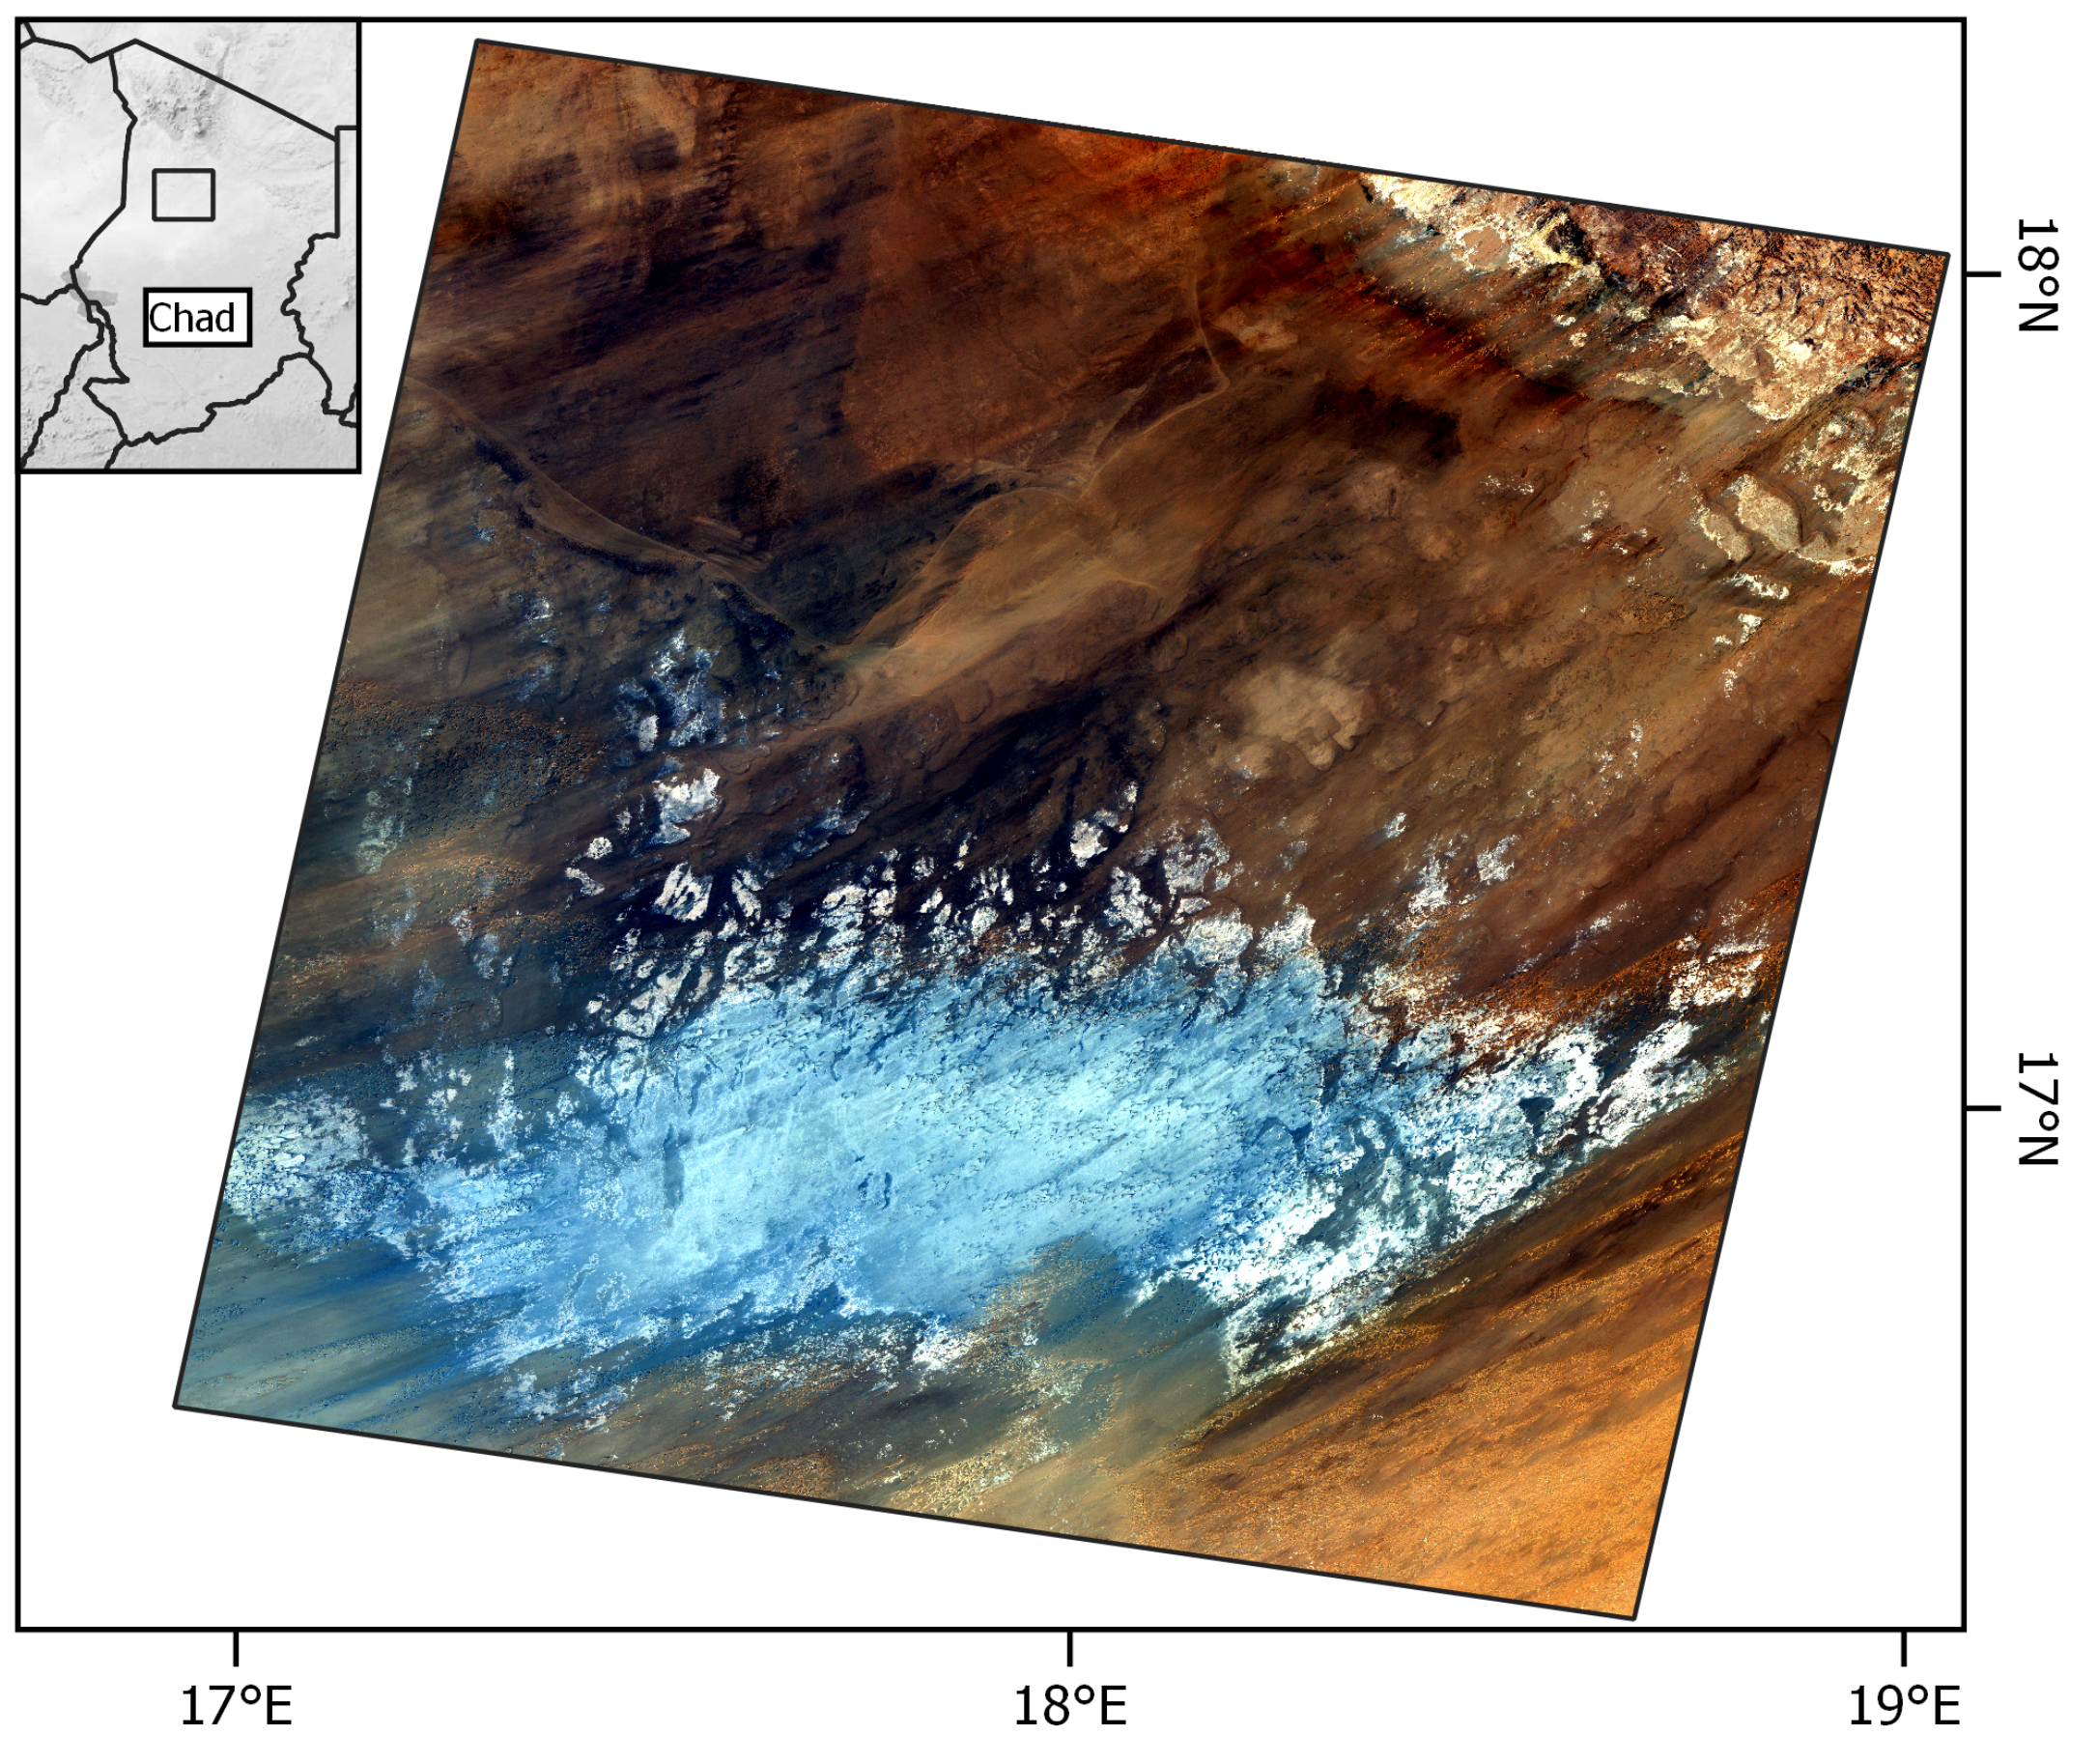
The Bodélé Depression (Figure 5) in Chad is a 133,532 km elongated palaeolake noted for its importance as a global source of mineral dust [50] and as a natural aeolian laboratory [51]. Low-density diatomite flakes left over from the dessication of Lake Megachad are mobilised by strong winds, producing some of the fastest moving dunes in the world [51,52]. Dune activity in the Depression has previously been studied using ASTER imagery [27], and a combination of Landsat, ASTER, and SPOT images [29]. This provides a basis from which to compare the benefits of applying COSI-Corr to a dataset of solely Landsat scenes. The Bodélé Depression is contained in Landsat WRS-2 path/row 183/048. The path/row files passed through the COSI-Corr workflow are shown in Table 2. A subset of the output is shown in Figure 6.
From 1987 to 2009, 4.89% (1516 km) of path/row 183/048 had consistent aeolian activity. Over this time period, the majority of identified sandy features migrated between 6.45 and 17.32 m/year, with a median celerity of 11.81 m/year. Established dunes make up 40.78% of the area of these sandy features. The majority of these dunes move at rates between 10.66 and 20.93 m/year, with a median mobility of 15.83 m/year. The maximum average movement was calculated at 67.60 m/year. While this value is higher than previous studies of dune celerity in the region [29], the discrepancy can be explained by the greater level of overlap between correlated scenes when using Landsat L1TP products. This increased spatial coverage affords a larger study area to be analysed in one correlation, providing a larger population of sand dunes available to study and, therefore, a more holistic record of dune mobility.
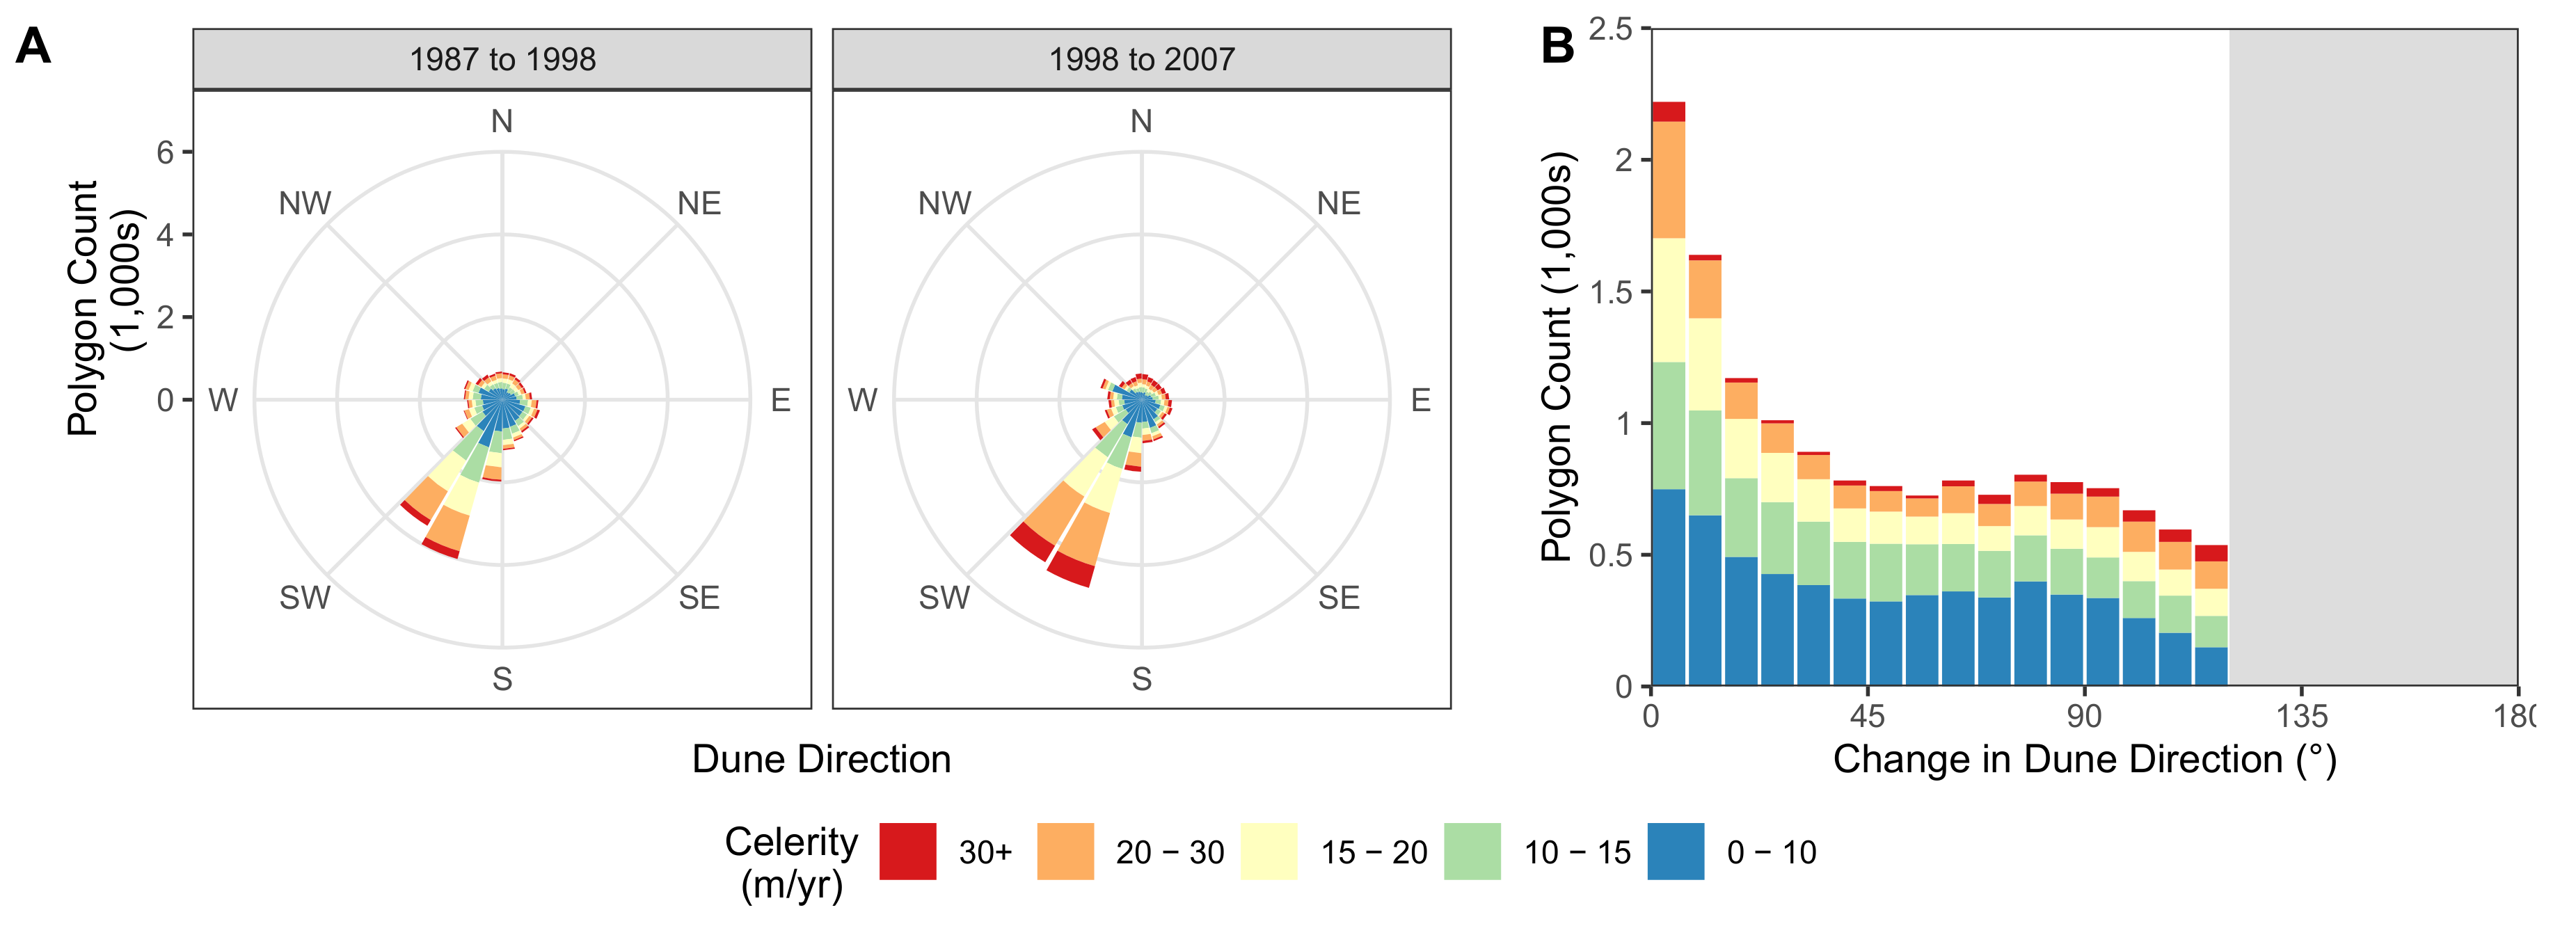
Aeolian activity in the Bodélé Depression from 1987 to 2009 shows a strong SW-SSW direction (Figure 7), consistent with previously measured wind vectors [53]. The overall direction of the dunes remained largely unchanged through time, moving from an average direction of 208.30° to 204.69°. When analysed individually, the sandy features of the Bodélé Depression appear to have very changeable directions. From 1987 to 2009 the active areas of aeolian transport had a median directional change of 39.26°. This variation is driven by changes in protodunes and sandy patches, as established dunes have a smaller median directional change of 5.29°. Previous studies have associated such directional variability with complex wind regimes [54] or seasonal changes in the prevailing wind direction [55]. Additionally, asymmetric extension within the polygonized shapes would manifest as a change in rotational geometry. However, these morphological interactions are unlikely to explain the presence of polygons with directional changes greater than 90°. Instead, COSI-Corr may be misidentifying sand patch movement or struggling to correlate morphological changes within sand patches. Further investigation is therefore required to determine the extent to which these large directional shifts may be a result of imprecise correlation, wind regime change, natural protodune variation, or a combination of all three factors.
Whereas previous research in the area has been unable to detect changes in dune speeds through time [29], this study has found that aeolian activity has accelerated by an average of 2.56 ± 12.58 m/year going into the 21st century (Figure 8). This change has seen a larger proportion of features moving over 20 m, and an increase in the maximum identified dune migration rate from 53.39 (1987 to 1998) to 81.66 m/year (1998 to 2009).
The identified increase in celerity is evenly distributed across the Bodélé scene, with no clustering to indicate a spatial relationship. Analysing the celerity change through time (Figure 9), the overall acceleration of aeolian activity has not been caused by an increase in the fastest moving features. Indeed, the fastest 25% of dunes decreased in speed by an average of 18.16% from 1987 to 1998. Instead, the increase in aeolian activity has been driven by an acceleration of features that were previously moving at rates under 13.30 m/year.
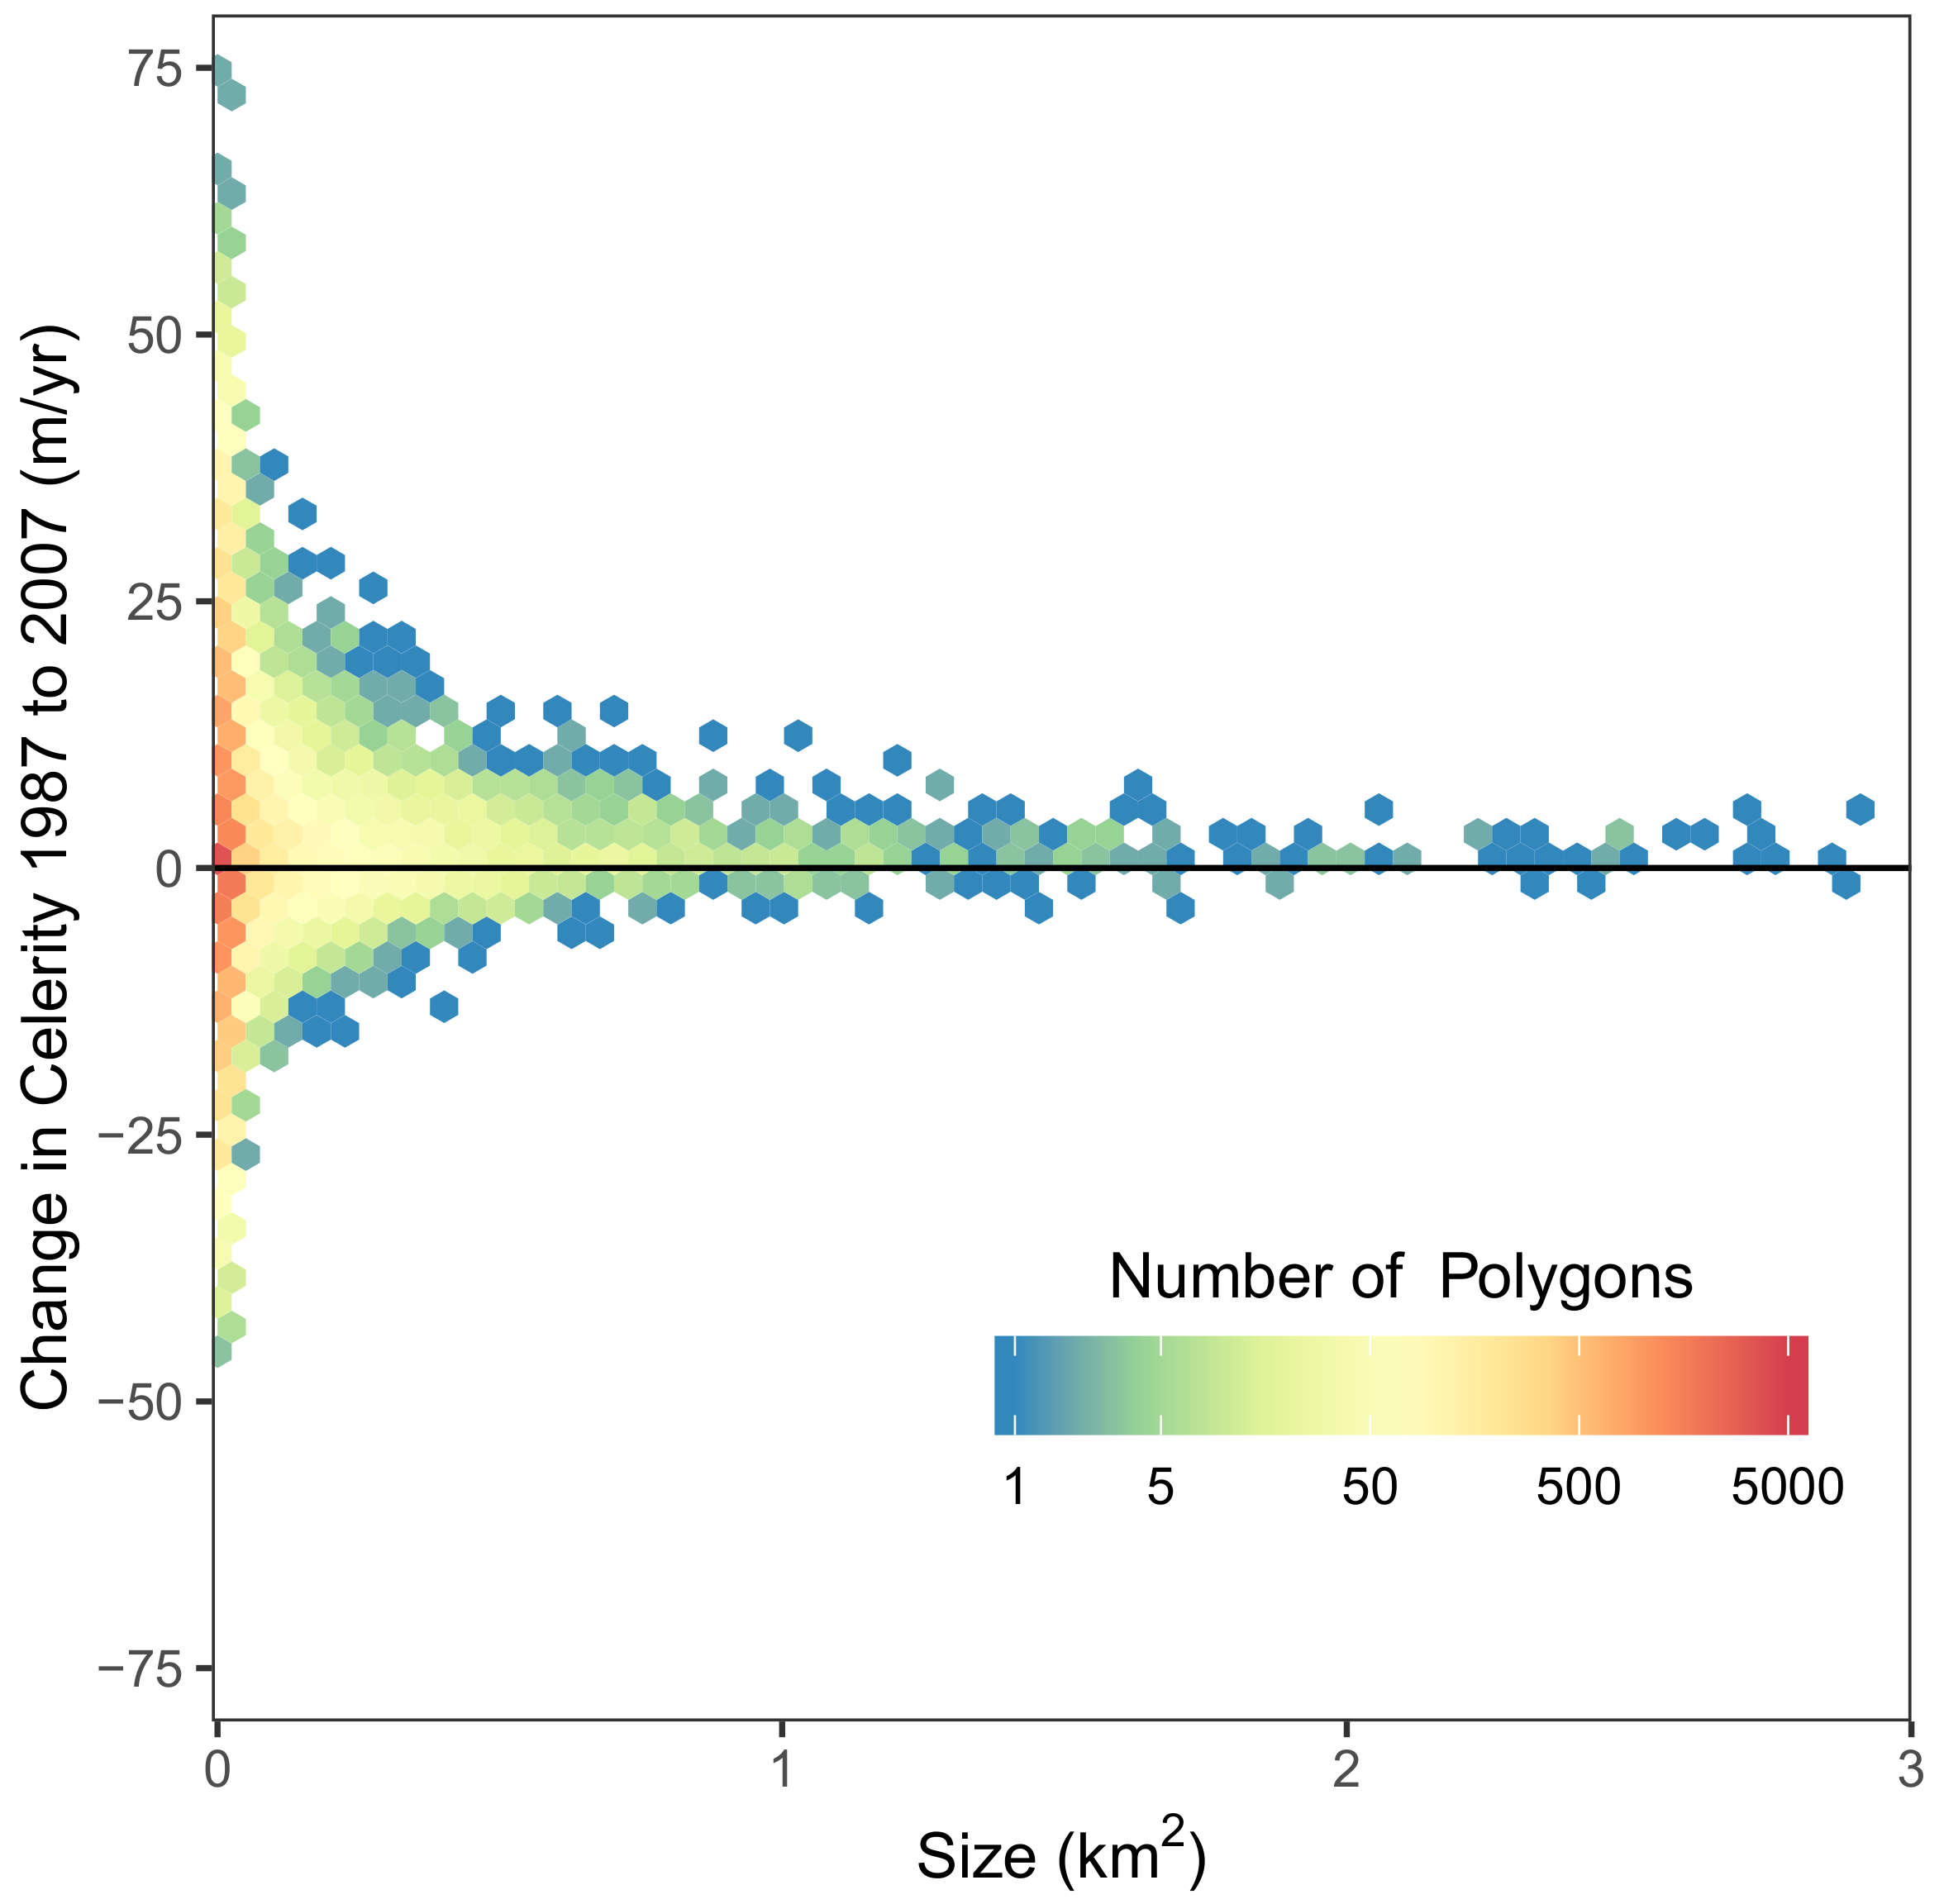
The inability of fast moving dunes to maintain a consistent speed at first seems contrary to an overall increase in aeolian activity in the area. However, this transience in mobility over a 20 year time period supports numerical models detailing the exchange of mass between dunes within a barchan field [56,57]. This net transfer of material between dunes would manifest in a dynamic migration record at the individual dune scale, but be characterized by an overall stable record of mobility across the entire dune field. The transformations in dune shape associated with an exchange of mass is, however, not something that can be easily distinguished from the workflow’s results. Indeed, the dataset is constrained by the requirement for pixels to be moving at speed in a constant direction in both correlations to be identified as a dune. This produces a static dune size which does not change through time. Nonetheless, the relationship between dune size and celerity change (Figure 10) can be used to infer morphological transformations. Here, smaller dunes are found to have extremely variable celerities, experiencing both the largest accelerations and the biggest decreases in their speeds. Meanwhile, larger dunes tend towards an overall acceleration, suggesting some extent of dune disintegration. The overall increase in aeolian activity and the deterioration of the largest dunes suggest that the Bodélé Depression may have experienced a slight increase in wind speeds moving into the 21st century. However, the magnitude of this increase is obfuscated by the exchange of mass within the study site, resulting in a high standard deviation.
The finding that aeolian activity in the Bodélé Depression is characterised by individually transient celerities emphasizes the importance for a large and unbiased sampling strategy. The dynamic interplay found by this investigation would not be captured by a localized ground-based or individual dune study.
5. Application to the Grand Erg Oriental
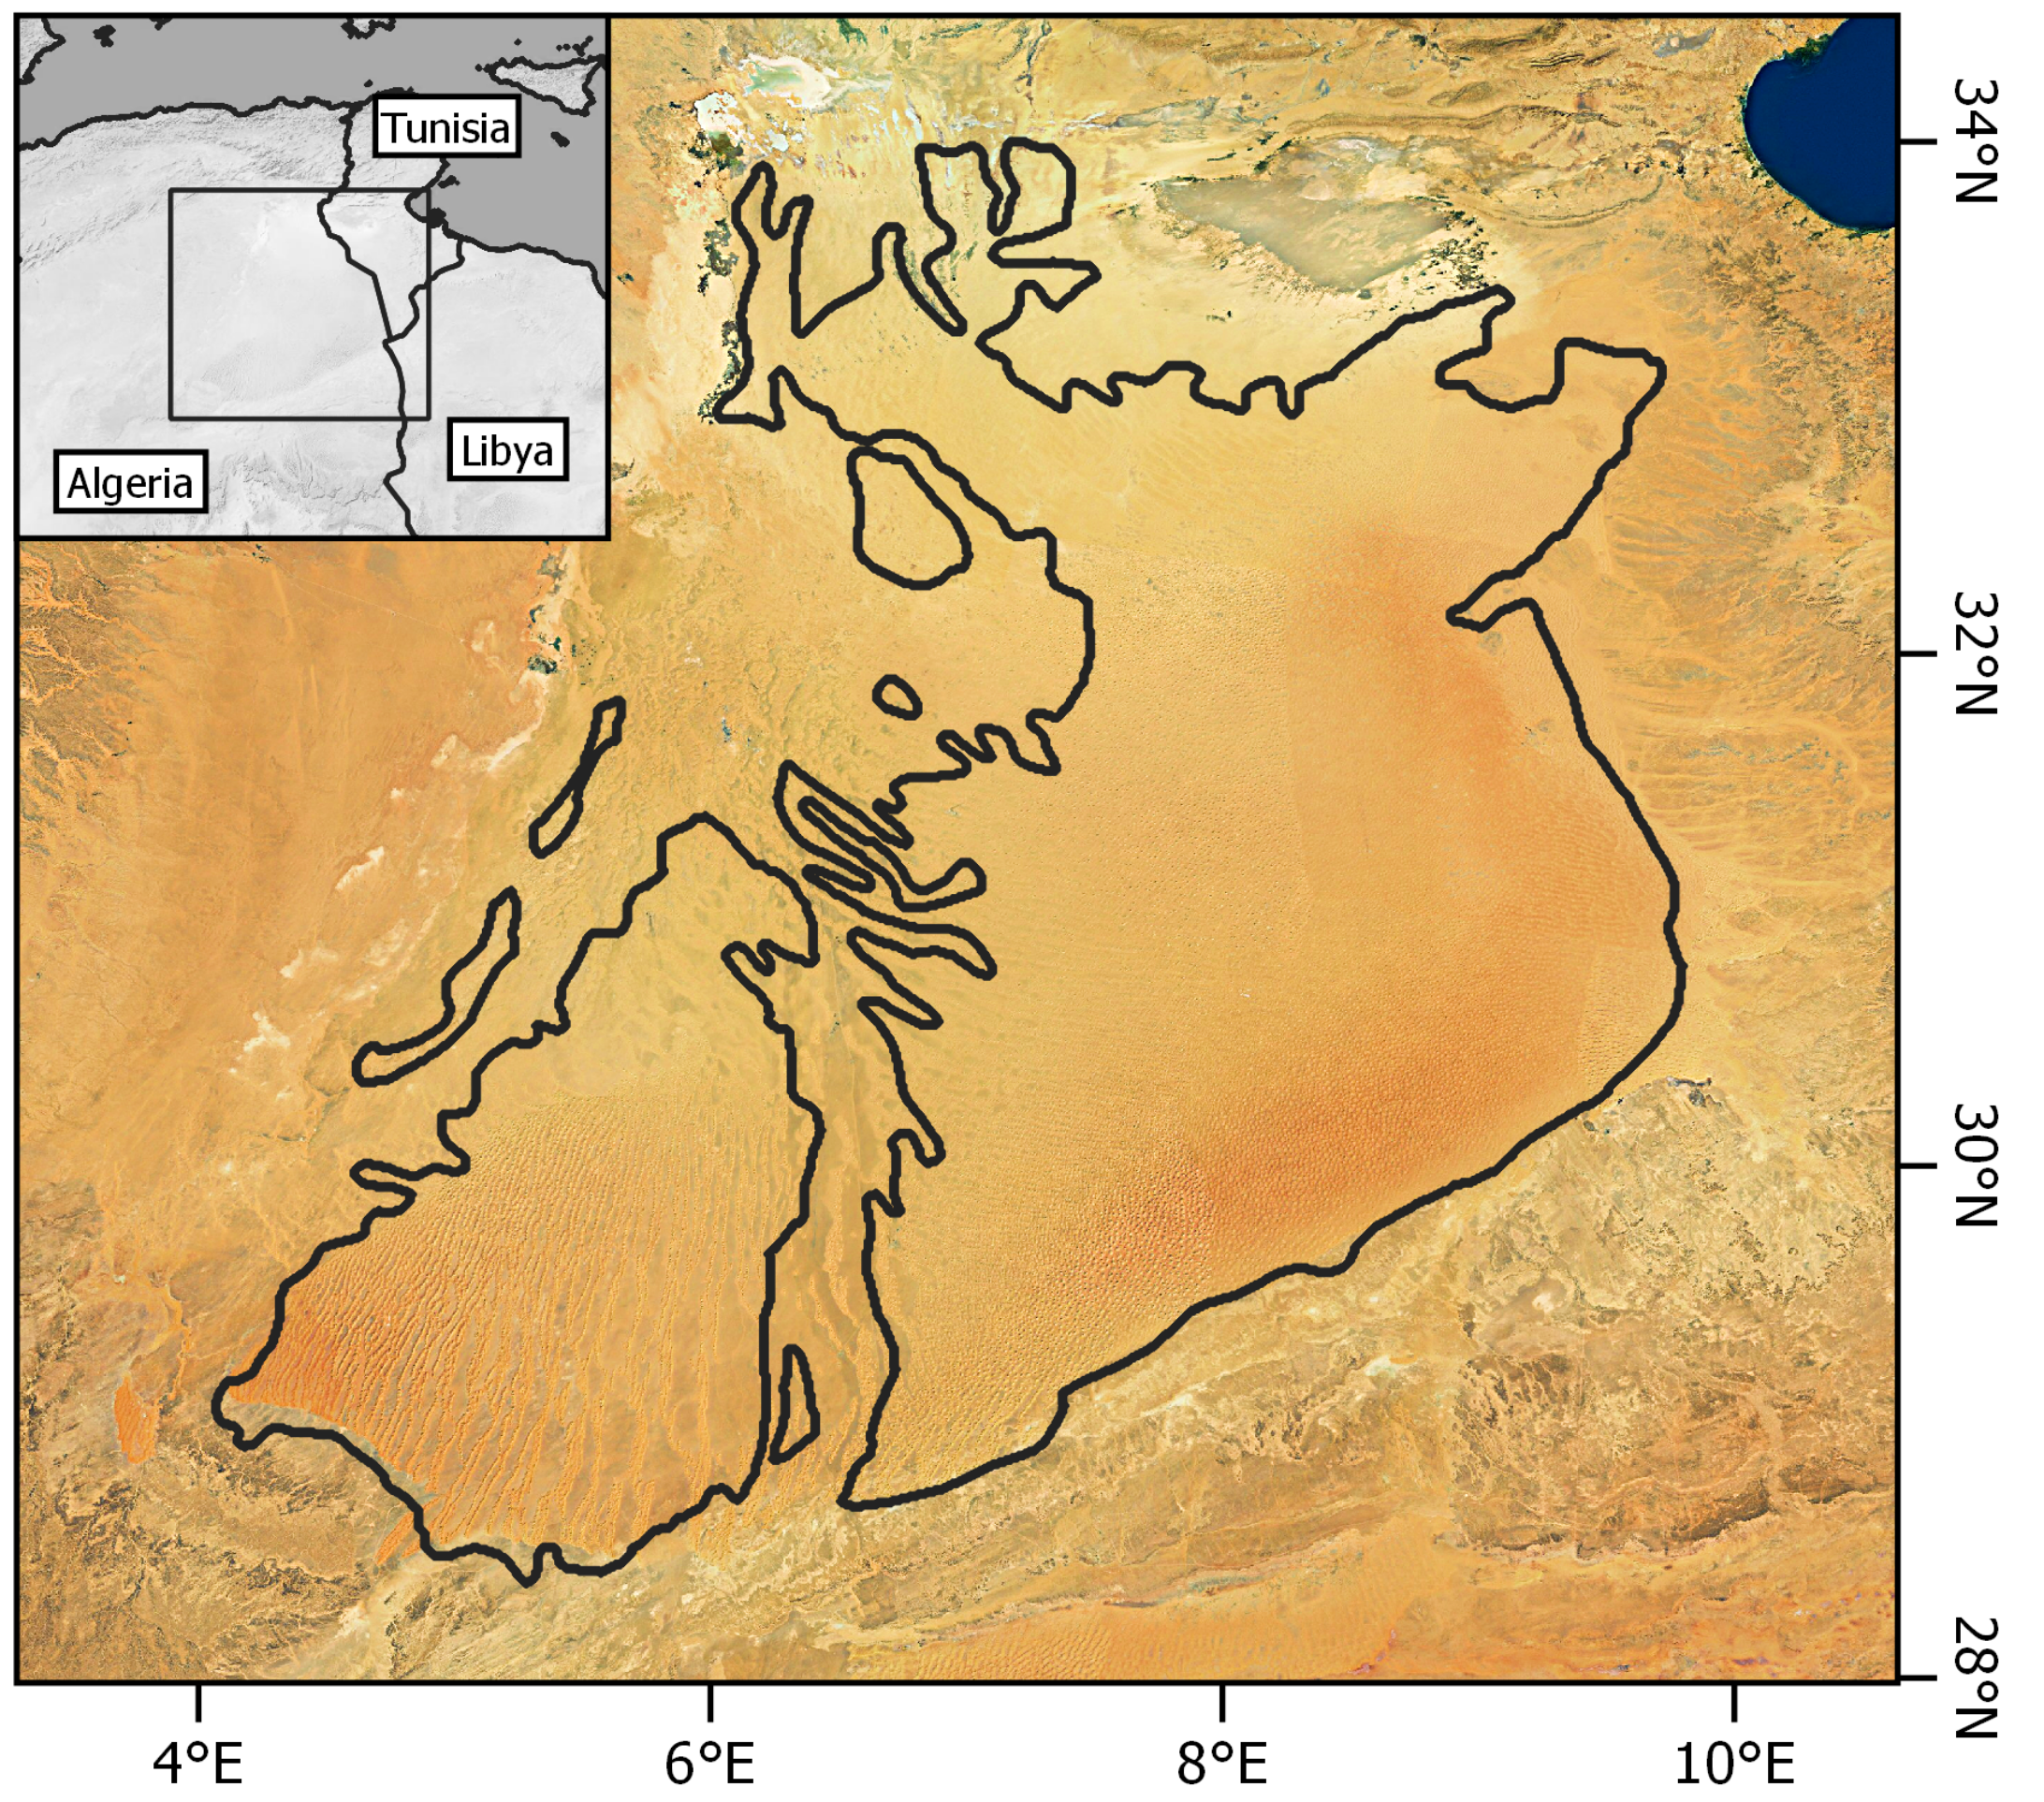
Situated between Algeria and Tunisia, the Grand Erg Oriental (Figure 11) extends over an area of 192,000 km and consists of barchanoid, compound, and star dunes [21]. The area is dominated by south-westerly winds [58] and a morphometric analysis shows a pattern of increasing dune heights from the north to the south of the Grand Erg, ranging from 2–230 m [59]. The Grand Erg is described as an active area of aeolian activity [60].
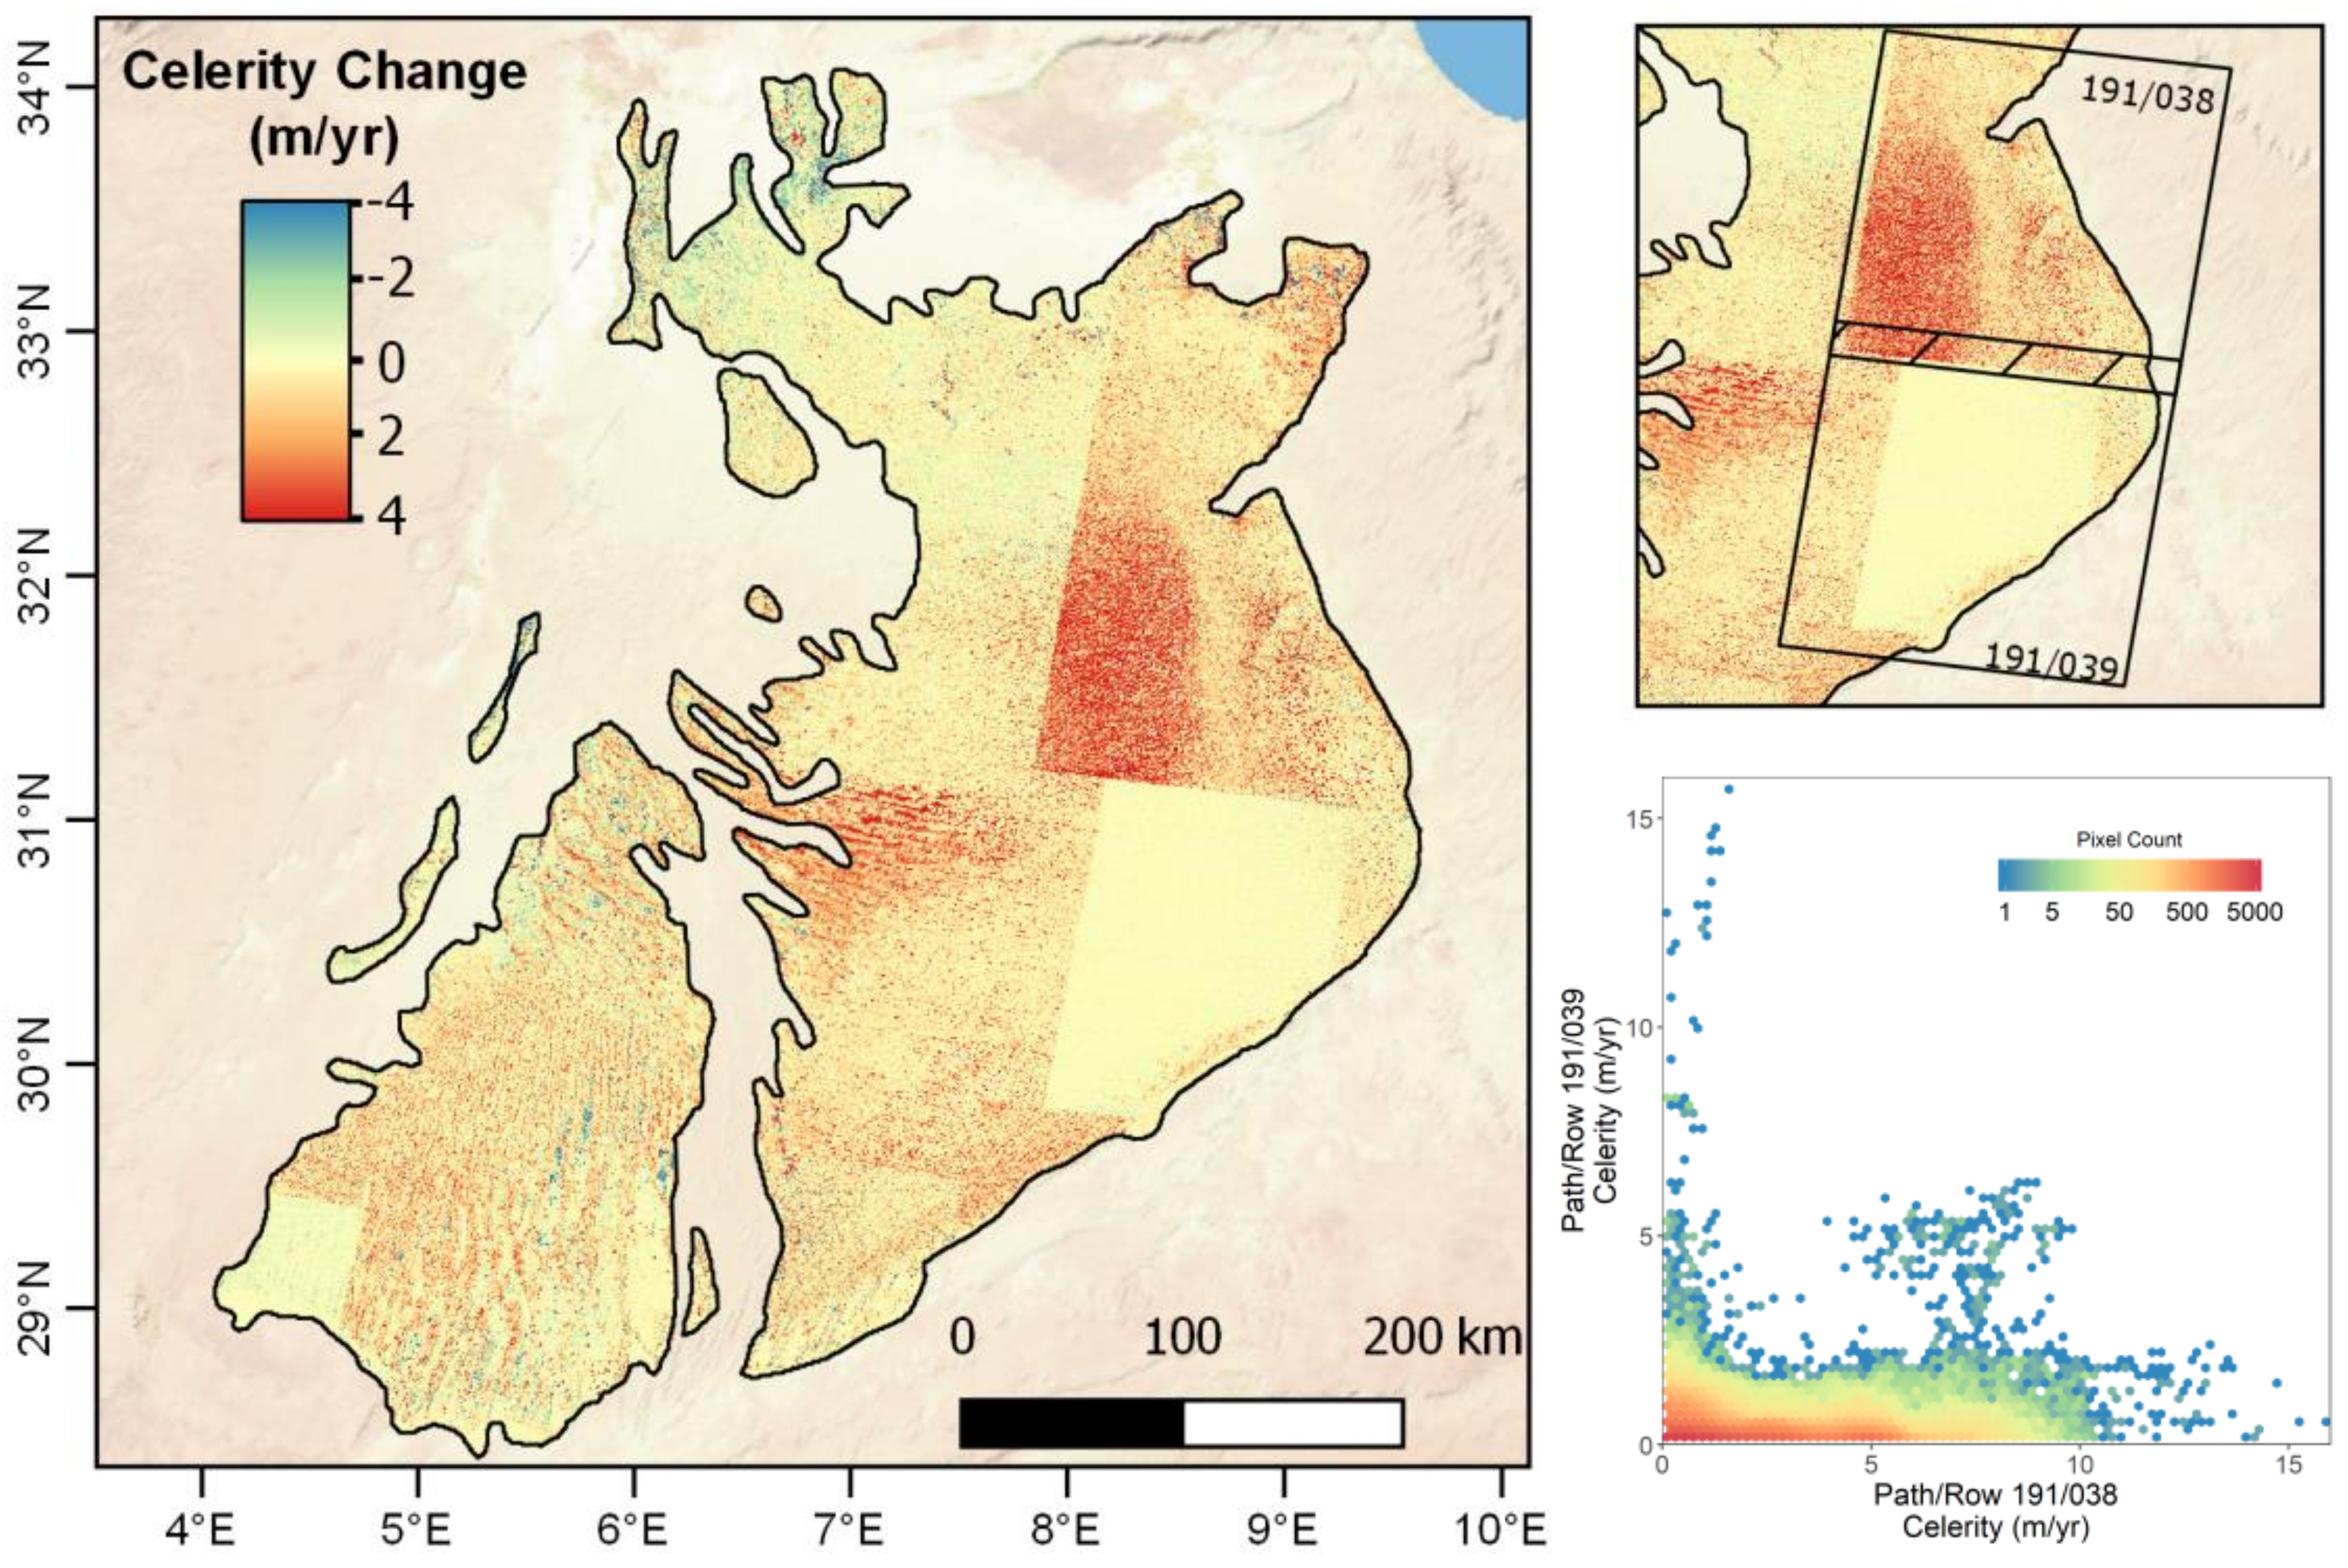
Although successful when applied to one path/row in the Bodélé Depression, applying the methodology to scenes covering the Grand Erg Oriental proves problematic. COSI-Corr celerity changes for the Landsat path/rows covering the Grand Erg are shown in Figure 12. Clear variations are seen between neighbouring scenes with poor agreements between some overlapping areas.
In the following paragraphs, we will first explore some conventional post-processing approaches to remove the misfits between the correlations. We will show that these all fail to capture the observed artifacts. Then we will show that the problem lies at a deeper level, and that the georegistration processing of the Landsat scenes are flawed.
5.1. Attempts at Artifact Rectification and Reproduction
The detrending tool provided by the COSI-Corr toolkit was applied to the scenes to remove the artifacting. However, the tool was unable to fully remove erroneous displacements in interdune areas. An ad hoc fix was then attempted by determining a three dimensional residual plane of best fit between a chosen scene and its neighbours. Removing these residuals produced a better agreement between scenes, but led to the propagation of errors when systematically applied.
With the inability to automatically rectify erroneous COSI-Corr outputs, alternative Landsat L1TP scenes were obtained. For each of the 22 WRS-2 path/rows that cover the Grand Erg Oriental, five cloudless L1TP scenes were sourced with acquisition dates close to 1985, 1995, and 2005. These scenes were paired to create 25 forward-looking and 25 backward-looking correlations for each path/row. These correlations underwent the same post-processing workflow as the Bodélé scenes. Pixels over marine and lacustrine features were removed using a water-bodies mask.
The results show significant variations across all path/row pairings, both within and between master-scene groupings (Example shown in Figure 13). While some divergence may be expected when standardising celerity across non-uniform temporal steps, inter-annual and seasonal variations are unlikely to produce such large spatial discrepancies at a decadal time scale. Variations within COSI-Corr outputs can be caused by differences in feature composition between the two input scenes, including differing shadow lengths, the creation of urban infrastructure, the presence of cloud, vegetation cover, and/or snow cover [62]. While most of these inhibiting factors are absent or neglible in desert environments, the scenes were manually screened to ensure no dust plumes, clouds, or vegetation cover change were present. Moreover, as the range of celerity estimates shows no significant relationship with differences in azimuth (R = 0.093, p = 0.139), sun elevation (R = 0.114, p = 0.1099), Earth-Sun distance pairings (R = 0.072, p = 0.194), or a multiple linear regression of all three variables (R = 0.203, p = 0.181), the variations seen cannot be solely attributable to scene acquisition parameters.
5.2. On the Selection of Ground Control Points for Landsat L1TP
The disagreement between correlations exhibits clear spatial gradients. Similar patterns emerge within master pairings, ranging from a strong NW-SE ramp to a more subtle undulating N-S pattern. Although Landsat L1TP products are offered as suitable for pixel-level time series analysis [63], the presence of spatial variations within path/row pairings unrelated to their collection and ancillary data suggests imprecise orthorectification. A classification of the dataset’s ground control points (GCPs) are shown in Table 3. On average, 66.32% of the GCPs used for path/row 191/039 georegistration are located on sandy features, including 16.76% located directly on a dune crest. GCPs are used to register all Landsat data products to the Global Land Survey (GLS) geometric framework and to determine georegistration and orthorectification accuracy [40]. GCPs located on moving dune crests would therefore have the potential to warp Landsat scenes during L1TP processing, potentially obfuscating dune movement.
While the misregistration variance was not found to be statistically associated with the number of ground control points located on dune crests, the location of the GCPs was found to parallel the spatial variations in the COSI-Corr outputs. For path/row 191/039, the stratified distribution of GCPs apparent in some scenes proves to be insensitive to mobile dunes (Figure 14). However, variations are also present in scenes that have less structured GCP sampling. Using creeping sand dunes as a stationary reference point has the potential to produce a sub-pixel warp that would be resistant to rectification using the COSI-Corr detrending tool or an ad-hoc plane of best fit.
In comparison, no GCPs were located on dunes in the Bodélé Depression and the resultant correlations did not result in identifiable warping. Two factors appear to be crucial in determining whether a Landsat L1TP scene is suitable for COSI-Corr analysis. Firstly, dune mobility must exceed the misregistration criteria. Dune displacement greater than 2.4 m/year would be required to be detectable between the shortest intervals in the reference GLS datasets. Secondly, GCPs should be located on stationary, distinguishable features. In sand seas, this proves problematic as often the only discernible features are mobile dune crests and the sand sea boundary. Landsat scenes that partially or fully consist of sand sea areas would therefore be at a high risk of having unsuitable GCPs selected. Manual screening of GCPs may be required to ensure only bedrock and/or stable topographic features have been selected.
The inability for scenes over the Grand Erg Oriental to be precisely co-located hinders the wider verification of the designed COSI-Corr workflow. Due to the prevalence of barchan dunes in the training dataset, the efficacy of the automated dune identification process may struggle when applied to a diverse range of dune morphologies. The lower threshold of directional consistency may therefore be more relevant to the identification of dunes formed under non-uniform wind directions.
6. Discussion
In summary, optical correlation of Landsat imagery yields results that are consistent with previous studies in the Bodélé Depression. Indeed, Landsat offers two main advantages over other satellite systems. Firstly, the standardized acquisition of Landsat scenes affords a greater overlap between image pairings, allowing larger dune areas to be studied in one correlation. Landsat images are also more suitable for correlation due to the similar acquisition parameters and frequency of revisits. Furthermore, the relatively long archive, since 1972, allows us to detect the movement of slow moving dunes despite the low resolution of the sensor. Secondly, the high standard of orthorectification in most of the L1TP scenes removes the requirement for user-internsive, manual image pre-processing, expediting the displacement quantification workflow in areas such as the Bodélé Depression. However, the application of COSI-Corr to Landsat is not without its limitations.
The imprecise orthorectification evident in scenes that cover the Grand Erg Oriental shows the limitations of a widespread application of the designed COSI-Corr workflow. Landsat L1TP scenes are processed to the highest tier of Landsat data quality and are produced with a maximum image-to-image georegistration tolerance of ≤12 m root mean square error [40]. The successful application of COSI-Corr to Landsat imagery is therefore determined by the sensitivity of Landsat georegistration, and by extension, the mobility of sand dunes in the subject scene. Misregistration is likely when a dune’s displacement fails to exceed 12 m from its position within the reference dataset (currently 2010, 2005, 2000, 1990, 1975). With the increasing frequency of reference GLS datasets, dune movement is less likely to overcome the image misregistration threshold criteria. Moreover, the use of moving dunes as stationary tie points may invalidate the sensitivity of the current misregistration metric. Where GCPs are solely located on sandy features, as long as dune creep is consistent and the variation between dune crest displacements is not in excess of 12 m, the misregistration would not be identified. This was evident in some correlation pairings in the Grand Erg Oriental where misregistrations larger than 24 m were recorded.
The geometric correction of Landsat scenes is an active area of research [64]. Most notably, the issues faced with GCP selection draw many parallels to the georegistration of oceanic Landsat scenes [65]. The relatively fast movement of waves and infrequency of sufficiently large islands renders large swathes of oceanic imagery unable to be georegistered. While significantly slower, it is evident sand dunes pose similar challenges and should be viewed as mobile, rather than stationary, features. The inability to determine sand dune celerity over the Grand Erg Oriental does not invalidate the designed COSI-Corr workflow, but exemplifies the limitations of applying the correlation engine to Landsat L1TP scenes containing slow moving dunes.
7. Conclusions
This study sought to demonstrate the opportunities the Landsat archive presents to sand dune migration studies using COSI-Corr. A robust workflow was designed, automating scene correlations and dune detection for the pre-orthorectified and geolocated Landsat L1TP scenes. In comparison to previous studies, the removal of manual pre-processing and the greater overlap between correlated scenes allows for a less user-intensive workflow which results in a larger record of dune celerity. The widespread application of this COSI-Corr workflow to determine global rates of dune mobility is, however, limited. Although successfully applied to the fast moving sand dunes of the Bodélé Depression, we were unable to track the slow moving dunes of the Grand Erg Oriental due to the inaccuracy of Landsat L1TP georegistration. The use of mobile sand dunes as stationary ground control points during L1TP scene processing was found to produce significant warping in the imagery over the Grand Erg. To avoid this warping, scenes must have appropriate stationary ground control points selected. Moreover, scenes that are wholly comprised of slow-moving dunes are at high risk of invalidating the L1TP misregistration identification criteria. The workflow could therefore only be applied globally to accurately detect movement above the misregistration threshold of Landsat L1TP products.
While orthorectification issues have been identified with Landsat L1TP imagery, the extent of disagreement between manually orthorectified scenes has not been similarly explored in the current literature. Future work applying COSI-Corr to large-scale investigations of dune migration would benefit from comparing celerity values between neighboring scenes. More broadly, studies that analyse a time-series of L1TP scenes should be aware of the pixel to sub-pixel misregistration evident across sand seas that this investigation has found.
Author Contributions
Conceptualization, P.V.; Methodology, T.B. and P.V.; software, T.B. and P.V.; investigation, T.B.; data curation, T.B.; writing—original draft preparation, T.B.; writing—review and editing, T.B., P.V., and C.S.B.; visualization, T.B.; supervision, P.V. and C.S.B.
Funding
This work was supported by the Natural Environment Research Council through grant NE\L002485\1.
Conflicts of Interest
The authors declare no conflict of interest. The funders had no role in the design of the study; in the collection, analyses, or interpretation of data; in the writing of the manuscript, or in the decision to publish the results.
Abbreviations
The following abbreviations are used in this manuscript:
| COSI-Corr | The Co-Registration of Optically Sensed Imagery |
| DEM | Digital Elevation Model |
| GCP | Ground Control Point |
| GLS | Global Land Survey |
| L1TP | Level-1 Precision Terrain |
| SRTM | Shuttle Radar Topography Mission |
References
- Ghadiry, M.; Shalaby, A.; Koch, B. A new GIS-based model for automated extraction of Sand Dune encroachment case study: Dakhla Oases, western desert of Egypt. Egypt. J. Remote Sens. Space Sci. 2012, 15, 53–65. [Google Scholar] [CrossRef] [Green Version]
- Effat, H.A.; Hegazy, M.N.; Haack, B. Mapping sand dunes risk related to their terrain characteristics using SRTM data and cartographic modeling. J. Land Use Sci. 2011, 6, 231–243. [Google Scholar] [CrossRef]
- Hamdan, M.A.; Refaat, A.A.; Abdel Wahed, M. Morphologic characteristics and migration rate assessment of barchan dunes in the Southeastern Western Desert of Egypt. Geomorphology 2016, 257, 57–74. [Google Scholar] [CrossRef]
- Han, Z.; Wang, T.; Sun, Q.; Dong, Z.; Wang, X. Sand harm in Taklimakan Desert highway and sand control. J. Geogr. Sci. 2008, 13, 45–53. [Google Scholar] [CrossRef]
- Varghese, N.; Singh, N.P. Linkages between land use changes, desertification and human development in the Thar Desert Region of India. Land Use Policy 2016, 51, 18–25. [Google Scholar] [CrossRef]
- Elhaja, M.E.; Csaplovics, E.; Abdelkareem, O.E.A.; Adam, H.E.; El, A.; Khalifa, K.S.O.; Ibrahim, K.A.; Eltahir, M.E.S. Land use land cover changes detection in White Nile State, Sudan using remote sensing and GIS techniques. Int. J. Environ. Monit. Prot. 2017, 4, 14–19. [Google Scholar]
- Safriel, U.; Adeel, Z. Ecosystems and human well-being: Current State and Trends, Chapter 22: Dryland Systems. In Ecosystems and Human Well-Being: Current State and Trends: Findings of the Condition and Trends Working Group; Island Press: Washington, DC, USA, 2005; pp. 625–662. [Google Scholar]
- Abdel Kawy, W.A.M.; Abou El-Magd, I.H. Use of satellite data and GIS for assessing the agricultural potentiality of the soils South Farafra Oasis, Western Desert, Egypt. Arab. J. Geosci. 2013, 6, 2299–2311. [Google Scholar] [CrossRef]
- Livingstone, I. A twenty-one-year record of surface change on a Namib linear dune. Earth Surf. Process. Landf. 2003, 28, 1025–1031. [Google Scholar] [CrossRef]
- Hesp, P.A.; Martinez, M.L.M. Transverse dune trailing ridges and vegetation succession. Geomorphology 2008, 99, 205–213. [Google Scholar] [CrossRef]
- Hilton, M.; Nickling, B.; Wakes, S.; Sherman, D.; Konlechner, T.; Jermy, M.; Geoghegan, P. An efficient, self-orienting, vertical-array, sand trap. Aeolian Res. 2017, 25, 11–21. [Google Scholar] [CrossRef]
- Nield, J.M.; Wiggs, G.F.S.; Baddock, M.C.; Hipondoka, M.H.T. Coupling leeside grainfall to avalanche characteristics in aeolian dune dynamics. Geology 2017, 45, 271–274. [Google Scholar] [CrossRef] [Green Version]
- Livingstone, I.; Wiggs, G.F.S.; Weaver, C.M. Geomorphology of desert sand dunes: A review of recent progress. Earth Sci. Rev. 2007, 80, 239–257. [Google Scholar] [CrossRef]
- Hermas, E.S.; Leprince, S.; El-Magd, I.A. Retrieving sand dune movements using sub-pixel correlation of multi-temporal optical remote sensing imagery, northwest Sinai Peninsula, Egypt. Remote Sens. Environ. 2012, 121, 51–60. [Google Scholar] [CrossRef]
- Hugenholtz, C.H.; Levin, N.; Barchyn, T.E.; Baddock, M.C. Remote sensing and spatial analysis of aeolian sand dunes: A review and outlook. Earth Sci. Rev. 2012, 111, 319–334. [Google Scholar] [CrossRef]
- Bailey, S.; Bristow, C. Migration of parabolic dunes at Aberffraw, Anglesey, north Wales. Geomorphology 2004, 59, 165–174. [Google Scholar] [CrossRef]
- Yao, Z.Y.; Wang, T.; Han, Z.W.; Zhang, W.M.; Zhao, A.G. Migration of sand dunes on the northern Alxa Plateau, Inner Mongolia, China. J. Arid Environ. 2007, 70, 80–93. [Google Scholar] [CrossRef]
- Levin, N.; Ben-Dor, E. Monitoring sand dune stabilization along the coastal dunes of Ashdod-Nizanim, Israel, 1945–1999. J. Arid Environ. 2004, 58, 335–355. [Google Scholar] [CrossRef]
- Dong, P. Automated measurement of sand dune migration using multi-temporal lidar data and GIS. Int. J. Remote Sens. 2015, 36, 5426–5447. [Google Scholar] [CrossRef]
- Mainguet, M. The influence of trade winds, local air-masses and topographic obstacles on the aeolian movement of sand particles and the origin and distribution of dunes and ergs in the Sahara and Australia. Geoforum 1978, 9, 17–28. [Google Scholar] [CrossRef]
- Breed, C.S.; Fryberger, S.G.; Andrews, S.; McCauley, C.; Lennartz, F.; Geber, D.; Horstman, K. Regional studies of sand seas using LANDSAT (ERTS) imagery. In A Study of Global Sand Seas; McKee, E., Ed.; United States Geological Survey; U.S. Government Printing Office: Washington, DC, USA, 1979; Volume 1052, pp. 305–398. [Google Scholar]
- Haynes, C.V. Bagnold’s Barchan: A 57-Yr Record of Dune Movement in the Eastern Sahara and Implications for Dune Origin and Paleoclimate Since Neolithic Times. Quat. Res. 1989, 32, 153–167. [Google Scholar] [CrossRef]
- Ould Ahmedou, D.; Ould Mahfoudh, A.; Dupont, P.; Ould El Moctar, A.; Valance, A.; Rasmussen, K.R. Barchan dune mobility in Mauritania related to dune and interdune sand fluxes. J. Geophys. Res. 2007, 112, F02016. [Google Scholar] [CrossRef]
- Hereher, M.E. Sand movement patterns in the Western Desert of Egypt: an environmental concern. Environ. Earth Sci. 2010, 59, 1119–1127. [Google Scholar] [CrossRef]
- Lorenz, R.D.; Gasmi, N.; Radebaugh, J.; Barnes, J.W.; Ori, G.G. Dunes on planet Tatooine: Observation of barchan migration at the Star Wars film set in Tunisia. Geomorphology 2013, 201, 264–271. [Google Scholar] [CrossRef] [Green Version]
- Bristow, C. Bounding surfaces in a Barchan dune: Annual cycles of deposition? Seasonality or erosion by superimposed bedforms? Remote Sens. 2019, 11, 965. [Google Scholar] [CrossRef]
- Vermeesch, P.; Drake, N. Remotely sensed dune celerity and sand flux measurements of the world’s fastest barchans (Bodélé, Chad). Geophys. Res. Lett. 2008, 35, 1–6. [Google Scholar] [CrossRef]
- Necsoiu, M.; Leprince, S.; Hooper, D.M.; Dinwiddie, C.L.; McGinnis, R.N.; Walter, G.R. Monitoring migration rates of an active subarctic dune field using optical imagery. Remote Sens. Environ. 2009, 113, 2441–2447. [Google Scholar] [CrossRef]
- Vermeesch, P.; Leprince, S. A 45-year time series of dune mobility indicating constant windiness over the central Sahara. Geophys. Res. Lett. 2012, 39. [Google Scholar] [CrossRef] [Green Version]
- Scheidt, S.P.; Lancaster, N. The application of COSI-Corr to determine dune system dynamics in the southern Namib Desert using ASTER data. Earth Surf. Process. Landf. 2013, 38, 1004–1019. [Google Scholar] [CrossRef]
- Al-Ghamdi, K.; Hermas, E. Assessment of dune migration hazards against landuse northwest Al-lith City, Saudi Arabia, using multi-temporal satellite imagery. Arab. J. Geosci. 2015, 8, 11007–11018. [Google Scholar] [CrossRef]
- Sam, L.; Gahlot, N.; Prusty, B.G. Estimation of dune celerity and sand flux in part of West Rajasthan, Gadra area of the Thar Desert using temporal remote sensing data. Arab. J. Geosci. 2015, 8, 295–306. [Google Scholar] [CrossRef]
- Al-Mutiry, M.; Hermas, E.; Al-Ghamdi, K.; Al-Awaji, H. Estimation of dune migration rates north Riyadh City, KSA, using SPOT 4 panchromatic images. J. Afr. Earth Sci. 2016, 124, 258–269. [Google Scholar] [CrossRef]
- Bridges, N.T.; Ayoub, F.; Avouac, J.P.; Leprince, S.; Lucas, A.; Mattson, S. Earth-like sand fluxes on Mars. Nature 2012, 485, 339–342. [Google Scholar] [CrossRef] [PubMed] [Green Version]
- Ayoub, F.; Avouac, J.P.; Newman, C.; Richardson, M.; Lucas, A.; Leprince, S.; Bridges, N. Threshold for sand mobility on Mars calibrated from seasonal variations of sand flux. Nat. Commun. 2014, 5, 5096. [Google Scholar] [CrossRef] [PubMed] [Green Version]
- Silvestro, S.; Vaz, D.A.; Yizhaq, H.; Esposito, F. Dune-like dynamic of Martian Aeolian large ripples. Geophys. Res. Lett. 2016, 43, 8384–8389. [Google Scholar] [CrossRef] [Green Version]
- Bridges, N.T.; Sullivan, R.; Newman, C.E.; Navarro, S.; van Beek, J.; Ewing, R.C.; Ayoub, F.; Silvestro, S.; Gasnault, O.; Le Mouélic, S.; et al. Martian aeolian activity at the Bagnold Dunes, Gale Crater: The view from the surface and orbit. J. Geophys. Res. Planets 2017, 122, 2077–2110. [Google Scholar] [CrossRef]
- Leprince, S.; Barbot, S.; Ayoub, F.; Avouac, J.P. Automatic and precise orthorectification, coregistration, and subpixel correlation of satellite images, application to ground deformation measurements. IEEE Trans. Geosci. Remote Sens. 2007, 45, 1529–1558. [Google Scholar] [CrossRef]
- Wulder, M.A.; White, J.C.; Loveland, T.R.; Woodcock, C.E.; Belward, A.S.; Cohen, W.B.; Fosnight, E.A.; Shaw, J.; Masek, J.G.; Roy, D.P. The global Landsat archive: Status, consolidation, and direction. Remote Sens. Environ. 2016, 185, 271–283. [Google Scholar] [CrossRef] [Green Version]
- Gutman, G.; Huang, C.; Chander, G.; Noojipady, P.; Masek, J.G. Assessment of the NASA–USGS Global Land Survey (GLS) datasets. Remote Sens. Environ. 2013, 134, 249–265. [Google Scholar] [CrossRef]
- Hollingsworth, J.; Leprince, S.; Ayoub, F.; Avouac, J.P. Deformation during the 1975-1984 Krafla rifting crisis, NE Iceland, measured from historical optical imagery. J. Geophys. Res. Solid Earth 2012, 117. [Google Scholar] [CrossRef] [Green Version]
- Avouac, J.P.; Ayoub, F.; Wei, S.; Ampuero, J.P.; Meng, L.; Leprince, S.; Jolivet, R.; Duputel, Z.; Helmberger, D. The 2013, Mw 7.7 Balochistan earthquake, energetic strike-slip reactivation of a thrust fault. Earth Planet. Sci. Lett. 2014, 391, 128–134. [Google Scholar] [CrossRef] [Green Version]
- Milliner, C.W.D.; Dolan, J.F.; Hollingsworth, J.; Leprince, S.; Ayoub, F.; Sammis, C.G. Quantifying near-field and off-fault deformation patterns of the 1992 M w 7.3 Landers earthquake. Geochem. Geophys. Geosyst. 2015, 16, 1577–1598. [Google Scholar] [CrossRef]
- Zinke, R.; Hollingsworth, J.; Dolan, J.F.; Van Dissen, R. Three-Dimensional Surface Deformation in the 2016 M W 7.8 Kaikōura, New Zealand, earthquake from optical image correlation: Implications for strain localization and long-term evolution of the Pacific-Australian plate boundary. Geochem. Geophys. Geosyst. 2019, 20, 1609–1628. [Google Scholar] [CrossRef]
- Scherler, D.; Leprince, S.; Strecker, M.R. Glacier-surface velocities in alpine terrain from optical satellite imagery—Accuracy improvement and quality assessment. Remote Sens. Environ. 2008, 112, 3806–3819. [Google Scholar] [CrossRef]
- Heid, T.; Kääb, A. Evaluation of existing image matching methods for deriving glacier surface displacements globally from optical satellite imagery. Remote Sens. Environ. 2012, 118, 339–355. [Google Scholar] [CrossRef]
- Singh, K.K.; Singh, D.K.; Negi, H.S.; Kulkarni, A.V.; Gusain, H.S.; Ganju, A.; Babu Govindha Raj, K. Temporal Change and Flow Velocity Estimation of Patseo Glacier, Western Himalaya, India. Curr. Sci. 2018, 114, 776. [Google Scholar] [CrossRef]
- Ayoub, F.; Leprince, S.; Avouac, J.-P. User’s Guide to COSI-CORR Co-registration of Optically Sensed Images and Correlation; California Institute of Technology: Pasadena, CA, USA, 2009; pp. 1–49. [Google Scholar]
- Le Bivic, R.; Allemand, P.; Quiquerez, A.; Delacourt, C. Potential and limitation of SPOT-5 ortho-image correlation to investigate the cinematics of landslides: The example of “Mare à Poule d’Eau” (Réunion, France). Remote Sens. 2017, 9, 106. [Google Scholar] [CrossRef]
- Abouchami, W.; Näthe, K.; Kumar, A.; Galer, S.J.; Jochum, K.P.; Williams, E.; Horbe, A.M.; Rosa, J.W.; Balsam, W.; Adams, D.; et al. Geochemical and isotopic characterization of the Bodélé Depression dust source and implications for transatlantic dust transport to the Amazon Basin. Earth Planet. Sci. Lett. 2013, 380, 112–123. [Google Scholar] [CrossRef]
- Vermeesch, P. Solitary wave behavior in sand dunes observed from space. Geophys. Res. Lett. 2011, 38, 17–19. [Google Scholar] [CrossRef]
- Bristow, C.S.; Drake, N.; Armitage, S. Deflation in the dustiest place on Earth: The Bodélé Depression, Chad. Geomorphology 2009, 105, 50–58. [Google Scholar] [CrossRef]
- Washington, R.; Todd, M.C. Atmospheric controls on mineral dust emission from the Bodélé Depression, Chad: The role of the low level jet. Geophys. Res. Lett. 2005, 32, 1–5. [Google Scholar] [CrossRef]
- Ping, L.; Narteau, C.; Dong, Z.; Zhang, Z.; Courrech du Pont, S. Emergence of oblique dunes in a landscape-scale experiment. Nat. Geosci. 2014, 7, 99–103. [Google Scholar] [CrossRef]
- Ewing, R.C.; McDonald, G.D.; Hayes, A.G. Multi-spatial analysis of aeolian dune-field patterns. Geomorphology 2015, 240, 44–53. [Google Scholar] [CrossRef]
- Hersen, P.; Andersen, K.H.; Elbelrhiti, H.; Andreotti, B.; Claudin, P.; Douady, S. Corridors of barchan dunes: Stability and size selection. Phys. Rev. E 2004, 69, 011304. [Google Scholar] [CrossRef] [PubMed] [Green Version]
- Elbelrhiti, H.; Claudin, P.; Andreotti, B. Field evidence for surface-wave-induced instability of sand dunes. Nature 2005, 437, 720–723. [Google Scholar] [CrossRef]
- Crouvi, O.; Amit, R.; Enzel, Y.; Gillespie, A.R. Active sand seas and the formation of desert loess. Quat. Sci. Rev. 2010, 29, 2087–2098. [Google Scholar] [CrossRef]
- Telbisz, T.; Keszler, O. DEM-based morphometry of large-scale sand dune patterns in the Grand Erg Oriental (Northern Sahara Desert, Africa). Arab. J. Geosci. 2018, 11, 382. [Google Scholar] [CrossRef]
- Lancaster, N. Dune Morphology and Dynamics. In Geomorphology of Desert Environments; Parsons, A.J., Abrahams, A.D., Eds.; Springer Netherlands: Dordrecht, The Netherlands, 2009; pp. 557–595. [Google Scholar] [CrossRef]
- FAO; IIASA; ISRIC; JRC. Harmonized World Soil Database (Version 1.2); Technical Report; FAO: Rome, Italy; IIASA: Laxenburg, Austria, 2012. [Google Scholar]
- Leprince, S.; Berthier, E.; Ayoub, F.; Delacourt, C.; Avouac, J.P. Monitoring earth surface dynamics with optical imagery. Eos 2008, 89, 1–2. [Google Scholar] [CrossRef]
- USGS. Landsat Collection 1 Level 1; USGS: Reston, VA, USA, 2017; p. 26. [Google Scholar]
- Lane, G.J.; Goresen, P.; Slater, R. Repairing Landsat satellite imagery using deep machine learning techniques. SMU Data Sci. Rev. 2019, 2, 1–17. [Google Scholar]
- Liu, Y.; Hu, C.; Dong, Y.; Xu, B.; Zhan, W.; Sun, C. Geometric accuracy of remote sensing images over oceans: The use of global offshore platforms. Remote Sens. Environ. 2019, 222, 244–266. [Google Scholar] [CrossRef]
Figure 1.
Maximum Co-Registration of Optically Sensed Images and Correlation (COSI-Corr) and manually measured displacements (m) for 50 randomly selected dunes from 1998 to 2007. A line of best fit is shown in blue and a 1:1 dotted reference line is shown in black. True colour composites show the location of the largest overestimation of COSI-Corr using the 32-8 window (highlighted in red).

Figure 2.
An average direction (grey arrow) is obtained by taking the vector sum of four angular measurements (black arrows). Scaling by the number of measurements (white arrow) yields a measure of concentration ().
Figure 2.
An average direction (grey arrow) is obtained by taking the vector sum of four angular measurements (black arrows). Scaling by the number of measurements (white arrow) yields a measure of concentration ().

Figure 3.
The overestimation of the arithmetic mean in comparison to the geometric mean for automatically measured dune migration in the Bodélé Depression from years 1987–1998 and 1998–2007.
Figure 3.
The overestimation of the arithmetic mean in comparison to the geometric mean for automatically measured dune migration in the Bodélé Depression from years 1987–1998 and 1998–2007.

Figure 4.
A comparison of (A) manually measured dune celerity at the dune crest and the workflow identified geometric mean celerity; and (B) manually measured maximum dune celerity and the workflow identified maximum celerity for 50 randomly selected dunes from 1998 to 2007.
Figure 4.
A comparison of (A) manually measured dune celerity at the dune crest and the workflow identified geometric mean celerity; and (B) manually measured maximum dune celerity and the workflow identified maximum celerity for 50 randomly selected dunes from 1998 to 2007.

Figure 5.
Location of path/row 183/048 and a true colour composite of the Bodélé Depression.

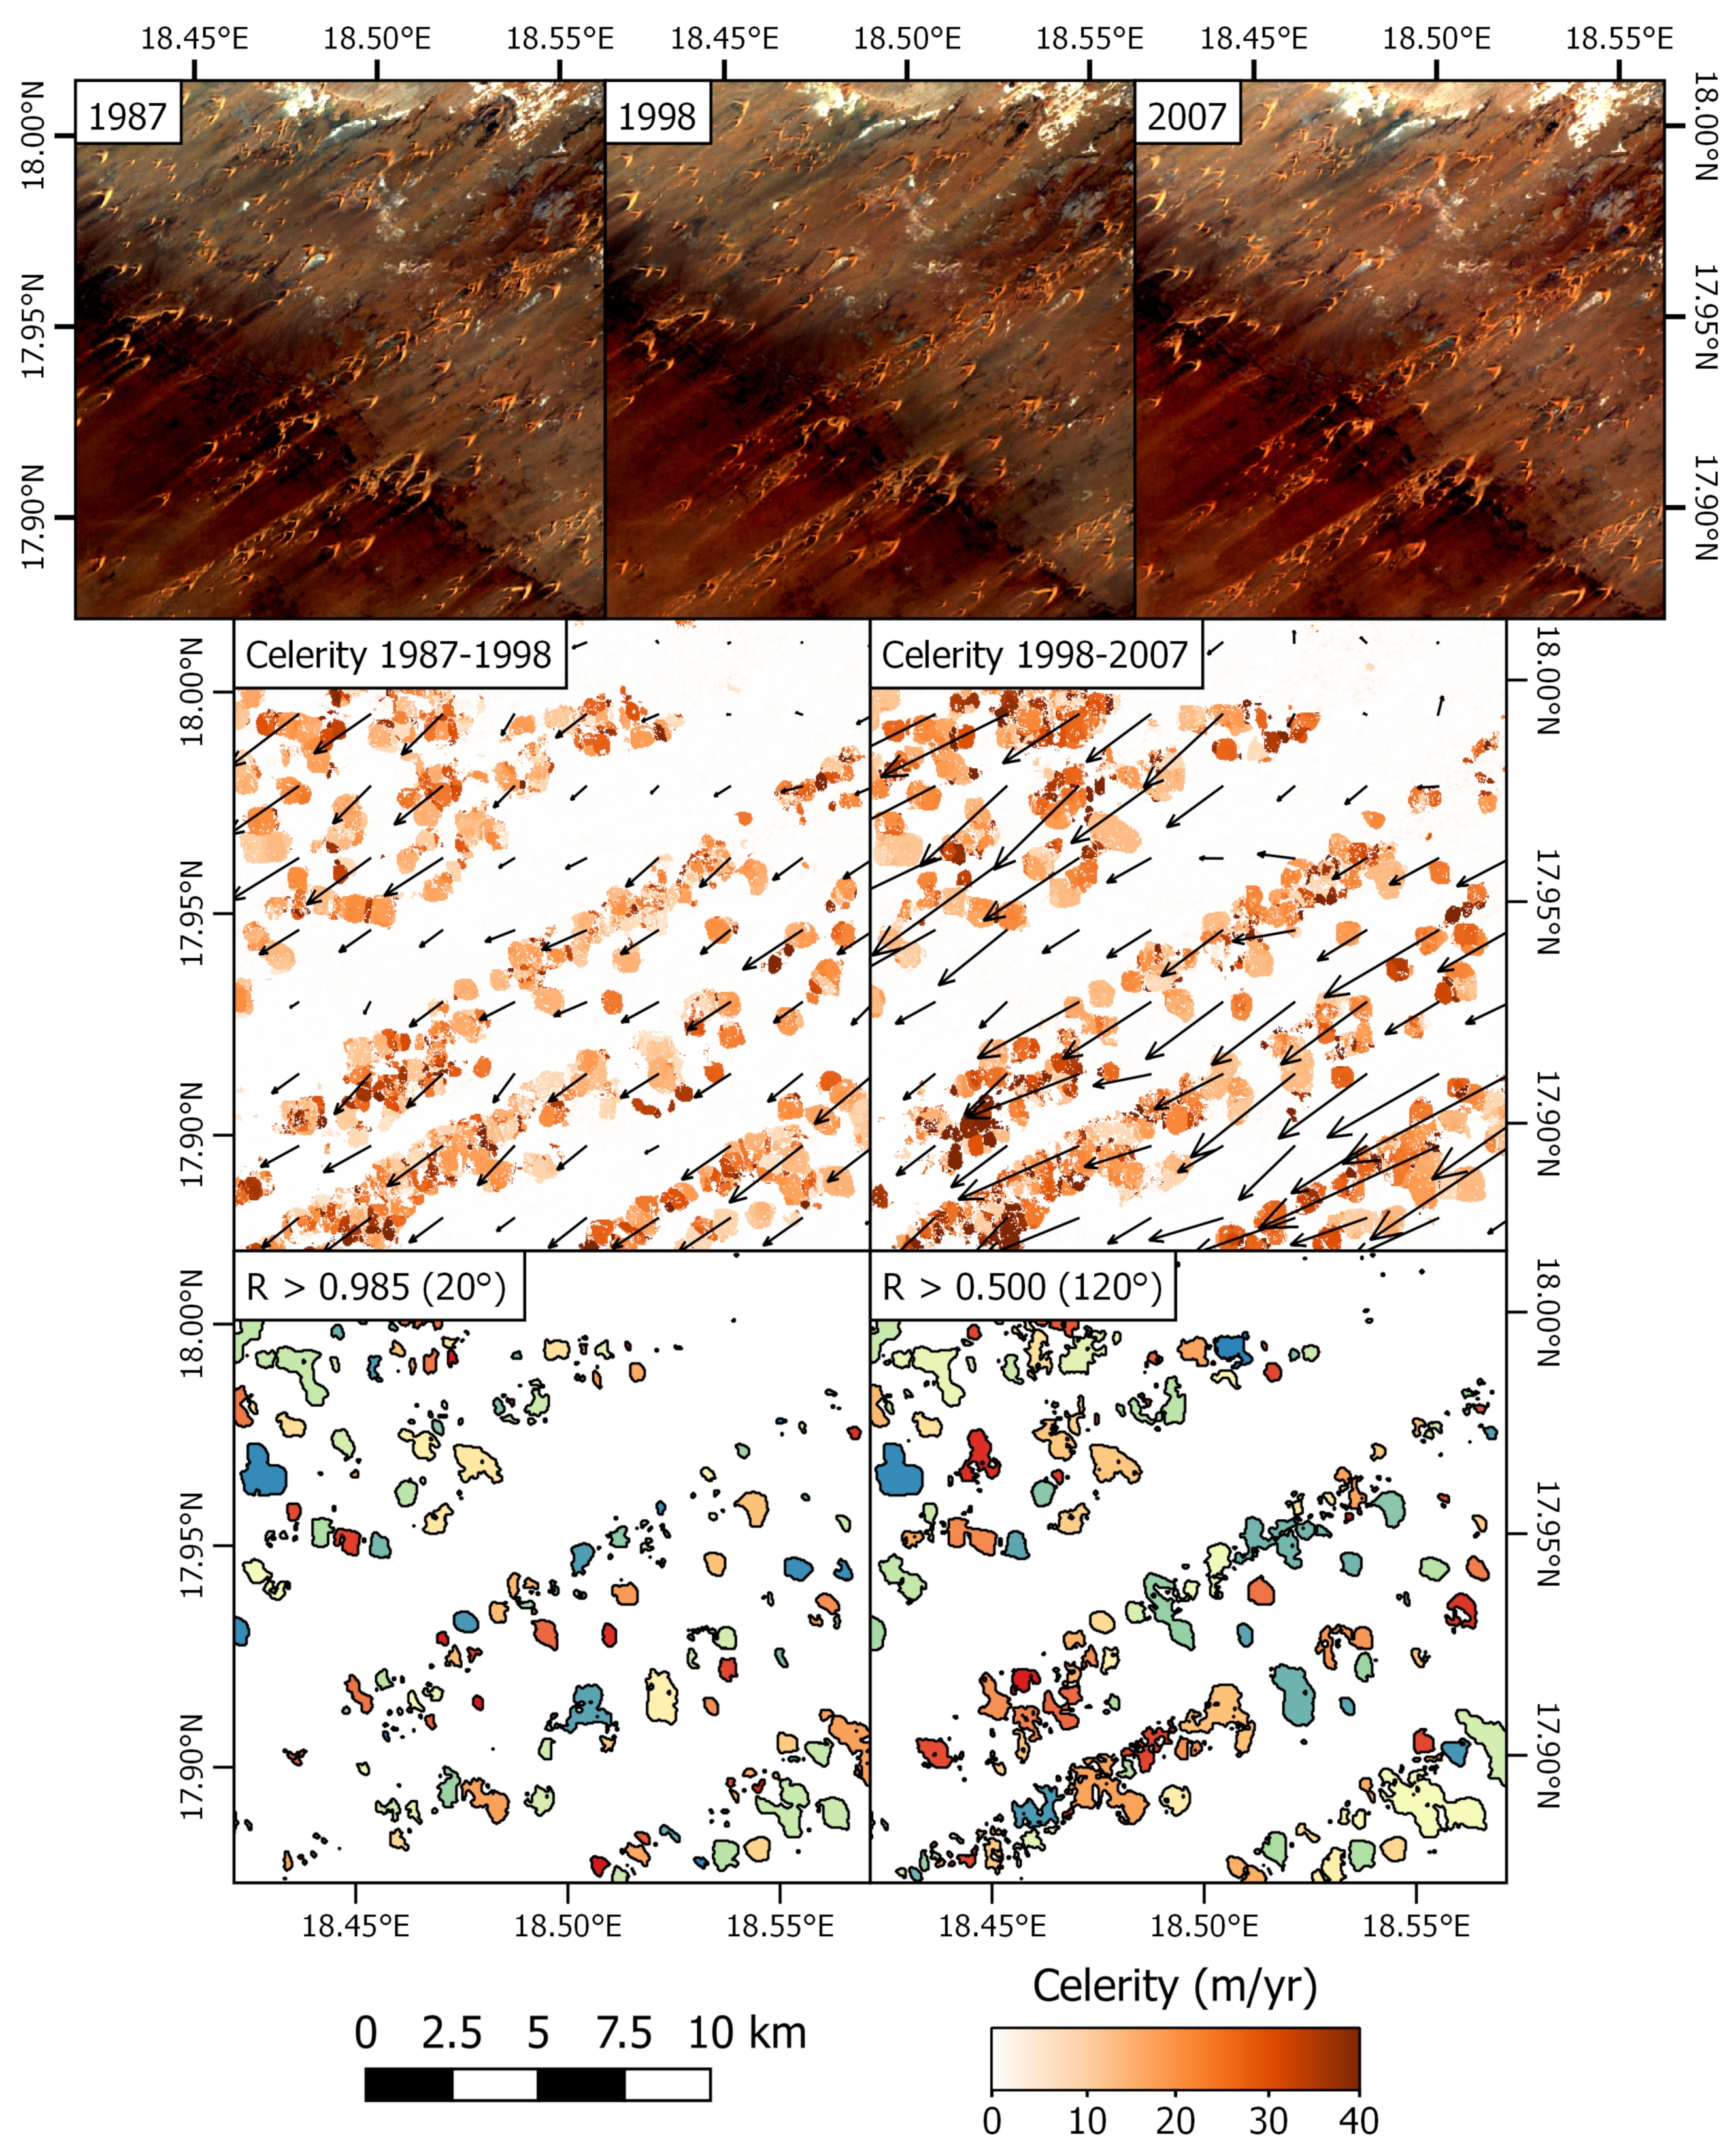
Figure 6.
A subset of the COSI-Corr workflow outputs including true colour composites of the 1987, 1998, and 2007 scenes; the resultant celerity maps and vector fields for the 1987–1998 and 1998–2007 correlations; and the polygonization of the raster outputs using two thresholds of directional consistency, R > 0.985 and R > 0.500.

Figure 7.
The (A) direction and (B) change in direction of aeolian activity in the Bodélé Depression from 1987 to 2007 (R > 0.500).
Figure 7.
The (A) direction and (B) change in direction of aeolian activity in the Bodélé Depression from 1987 to 2007 (R > 0.500).

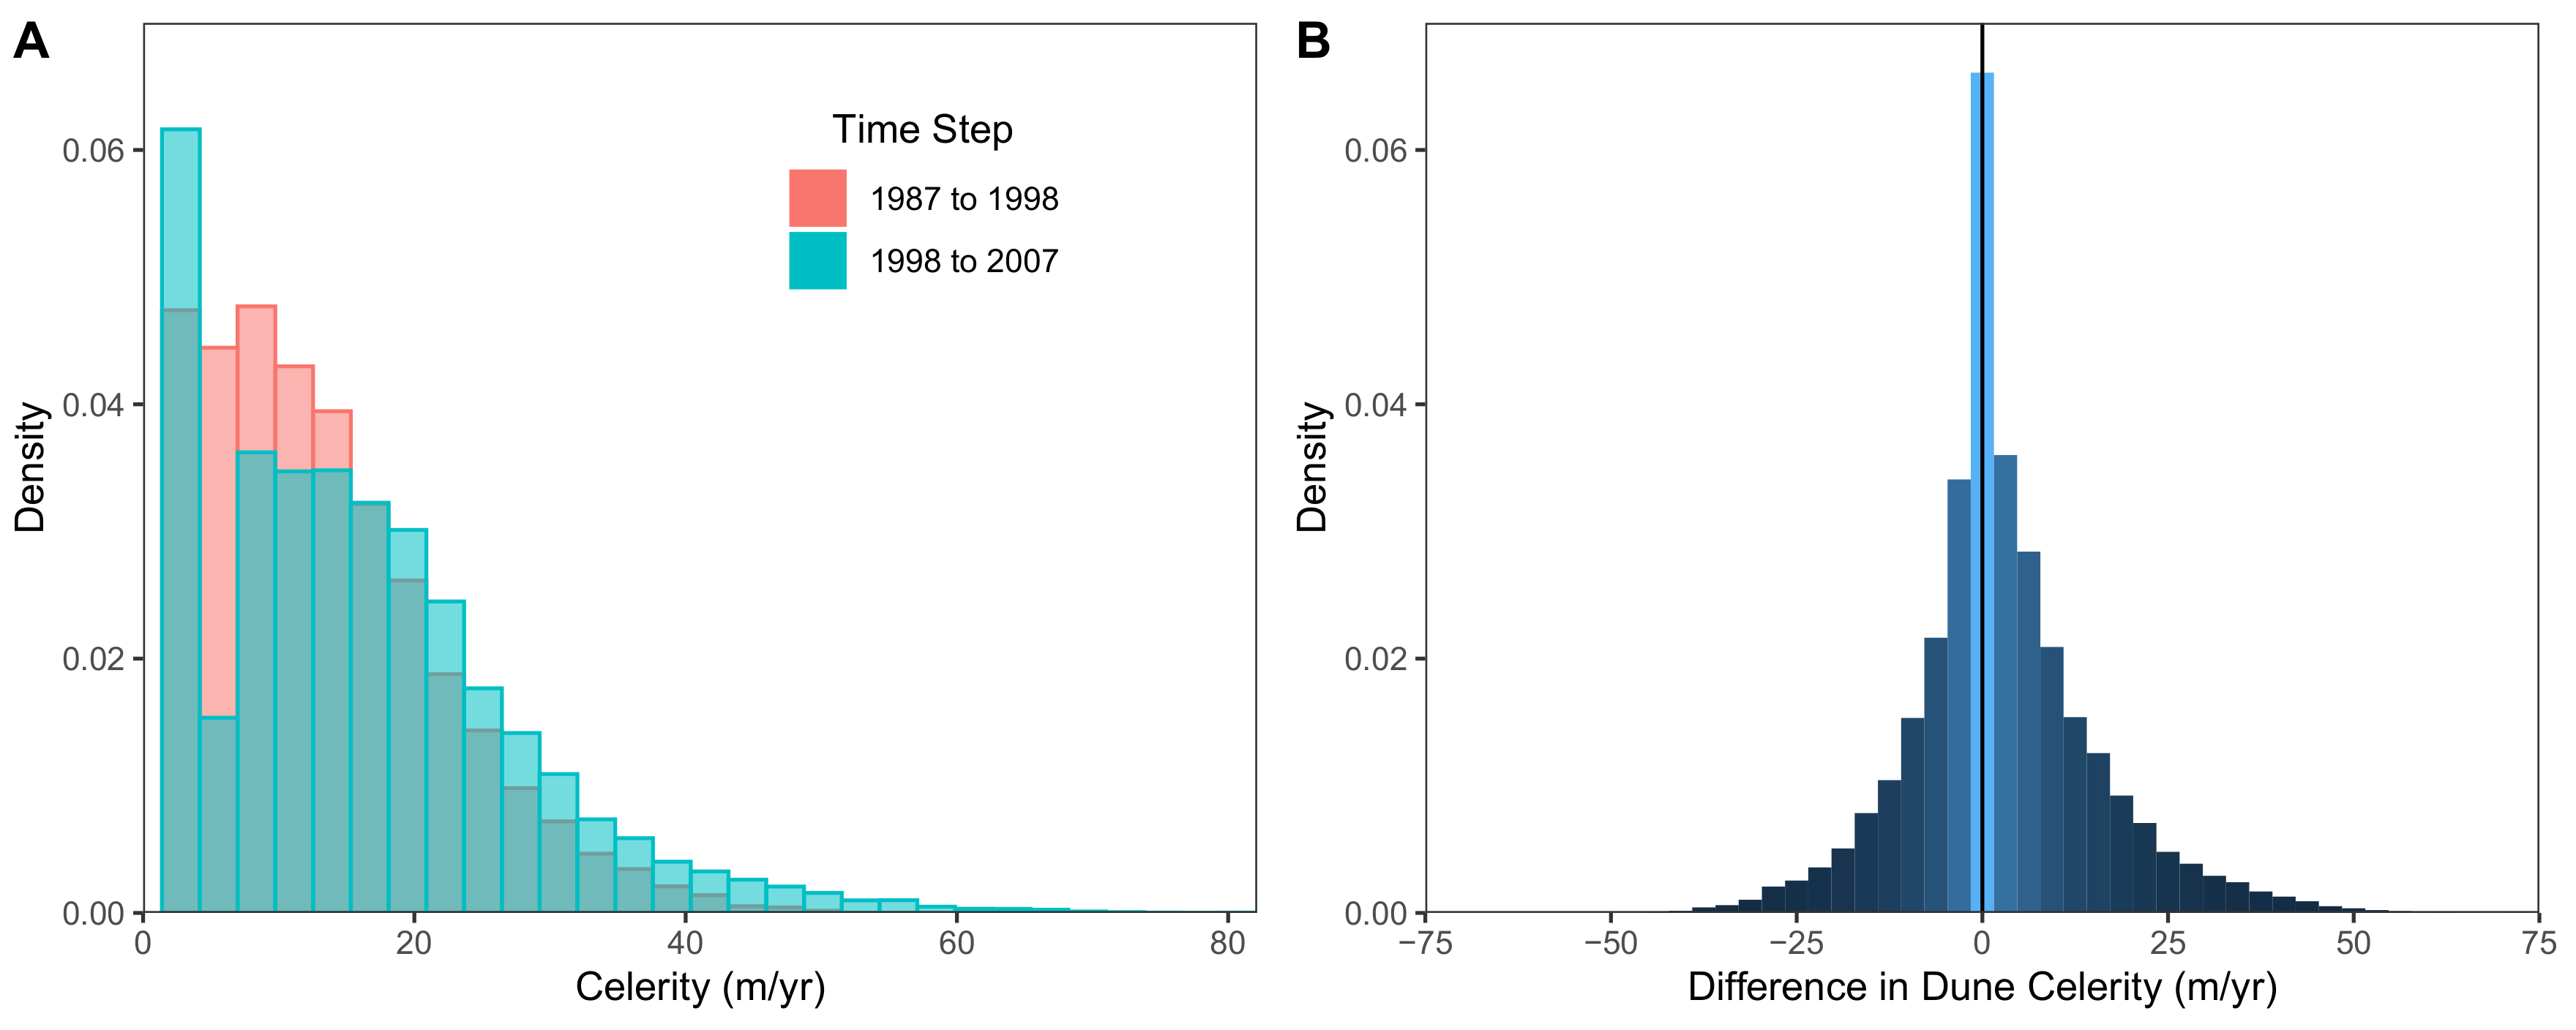
Figure 8.
Histograms of (A) identified dune celerity (m/year) between the two correlation timesteps and (B) the difference in dune celerity (m/year) from 1987 to 2007 for identified dunes across the Bodélé Depression.
Figure 8.
Histograms of (A) identified dune celerity (m/year) between the two correlation timesteps and (B) the difference in dune celerity (m/year) from 1987 to 2007 for identified dunes across the Bodélé Depression.

Figure 9.
Density scatterplots showing (A) identified dune celerity (m/year) between the two correlation timesteps and (B) the log ratio of dune celerities indicating the magnitude of change for each identified feature from its starting speed in 1987 to 1998 (m/year). Positive numbers indicate a greater magnitude of acceleration while negative numbers indicate a greater magnitude of deceleration. A running mean is shown in black.

Figure 10.
The relationship between identified dune size and change in celerity from 1987 to 1998 (m/year).
Figure 10.
The relationship between identified dune size and change in celerity from 1987 to 1998 (m/year).

Figure 11.
The location and extent of the Grand Erg Oriental [61].
Figure 11.
The location and extent of the Grand Erg Oriental [61].

Figure 12.
Change in celerity across the Grand Erg Oriental from year ~1985 to ~2005. Note the apparent abrupt changes between Landsat scenes, especially evident between path/row 191/039 and 191/038. The difference in celerity between the overlapping sections of these path/rows is also shown.
Figure 12.
Change in celerity across the Grand Erg Oriental from year ~1985 to ~2005. Note the apparent abrupt changes between Landsat scenes, especially evident between path/row 191/039 and 191/038. The difference in celerity between the overlapping sections of these path/rows is also shown.

Figure 13.
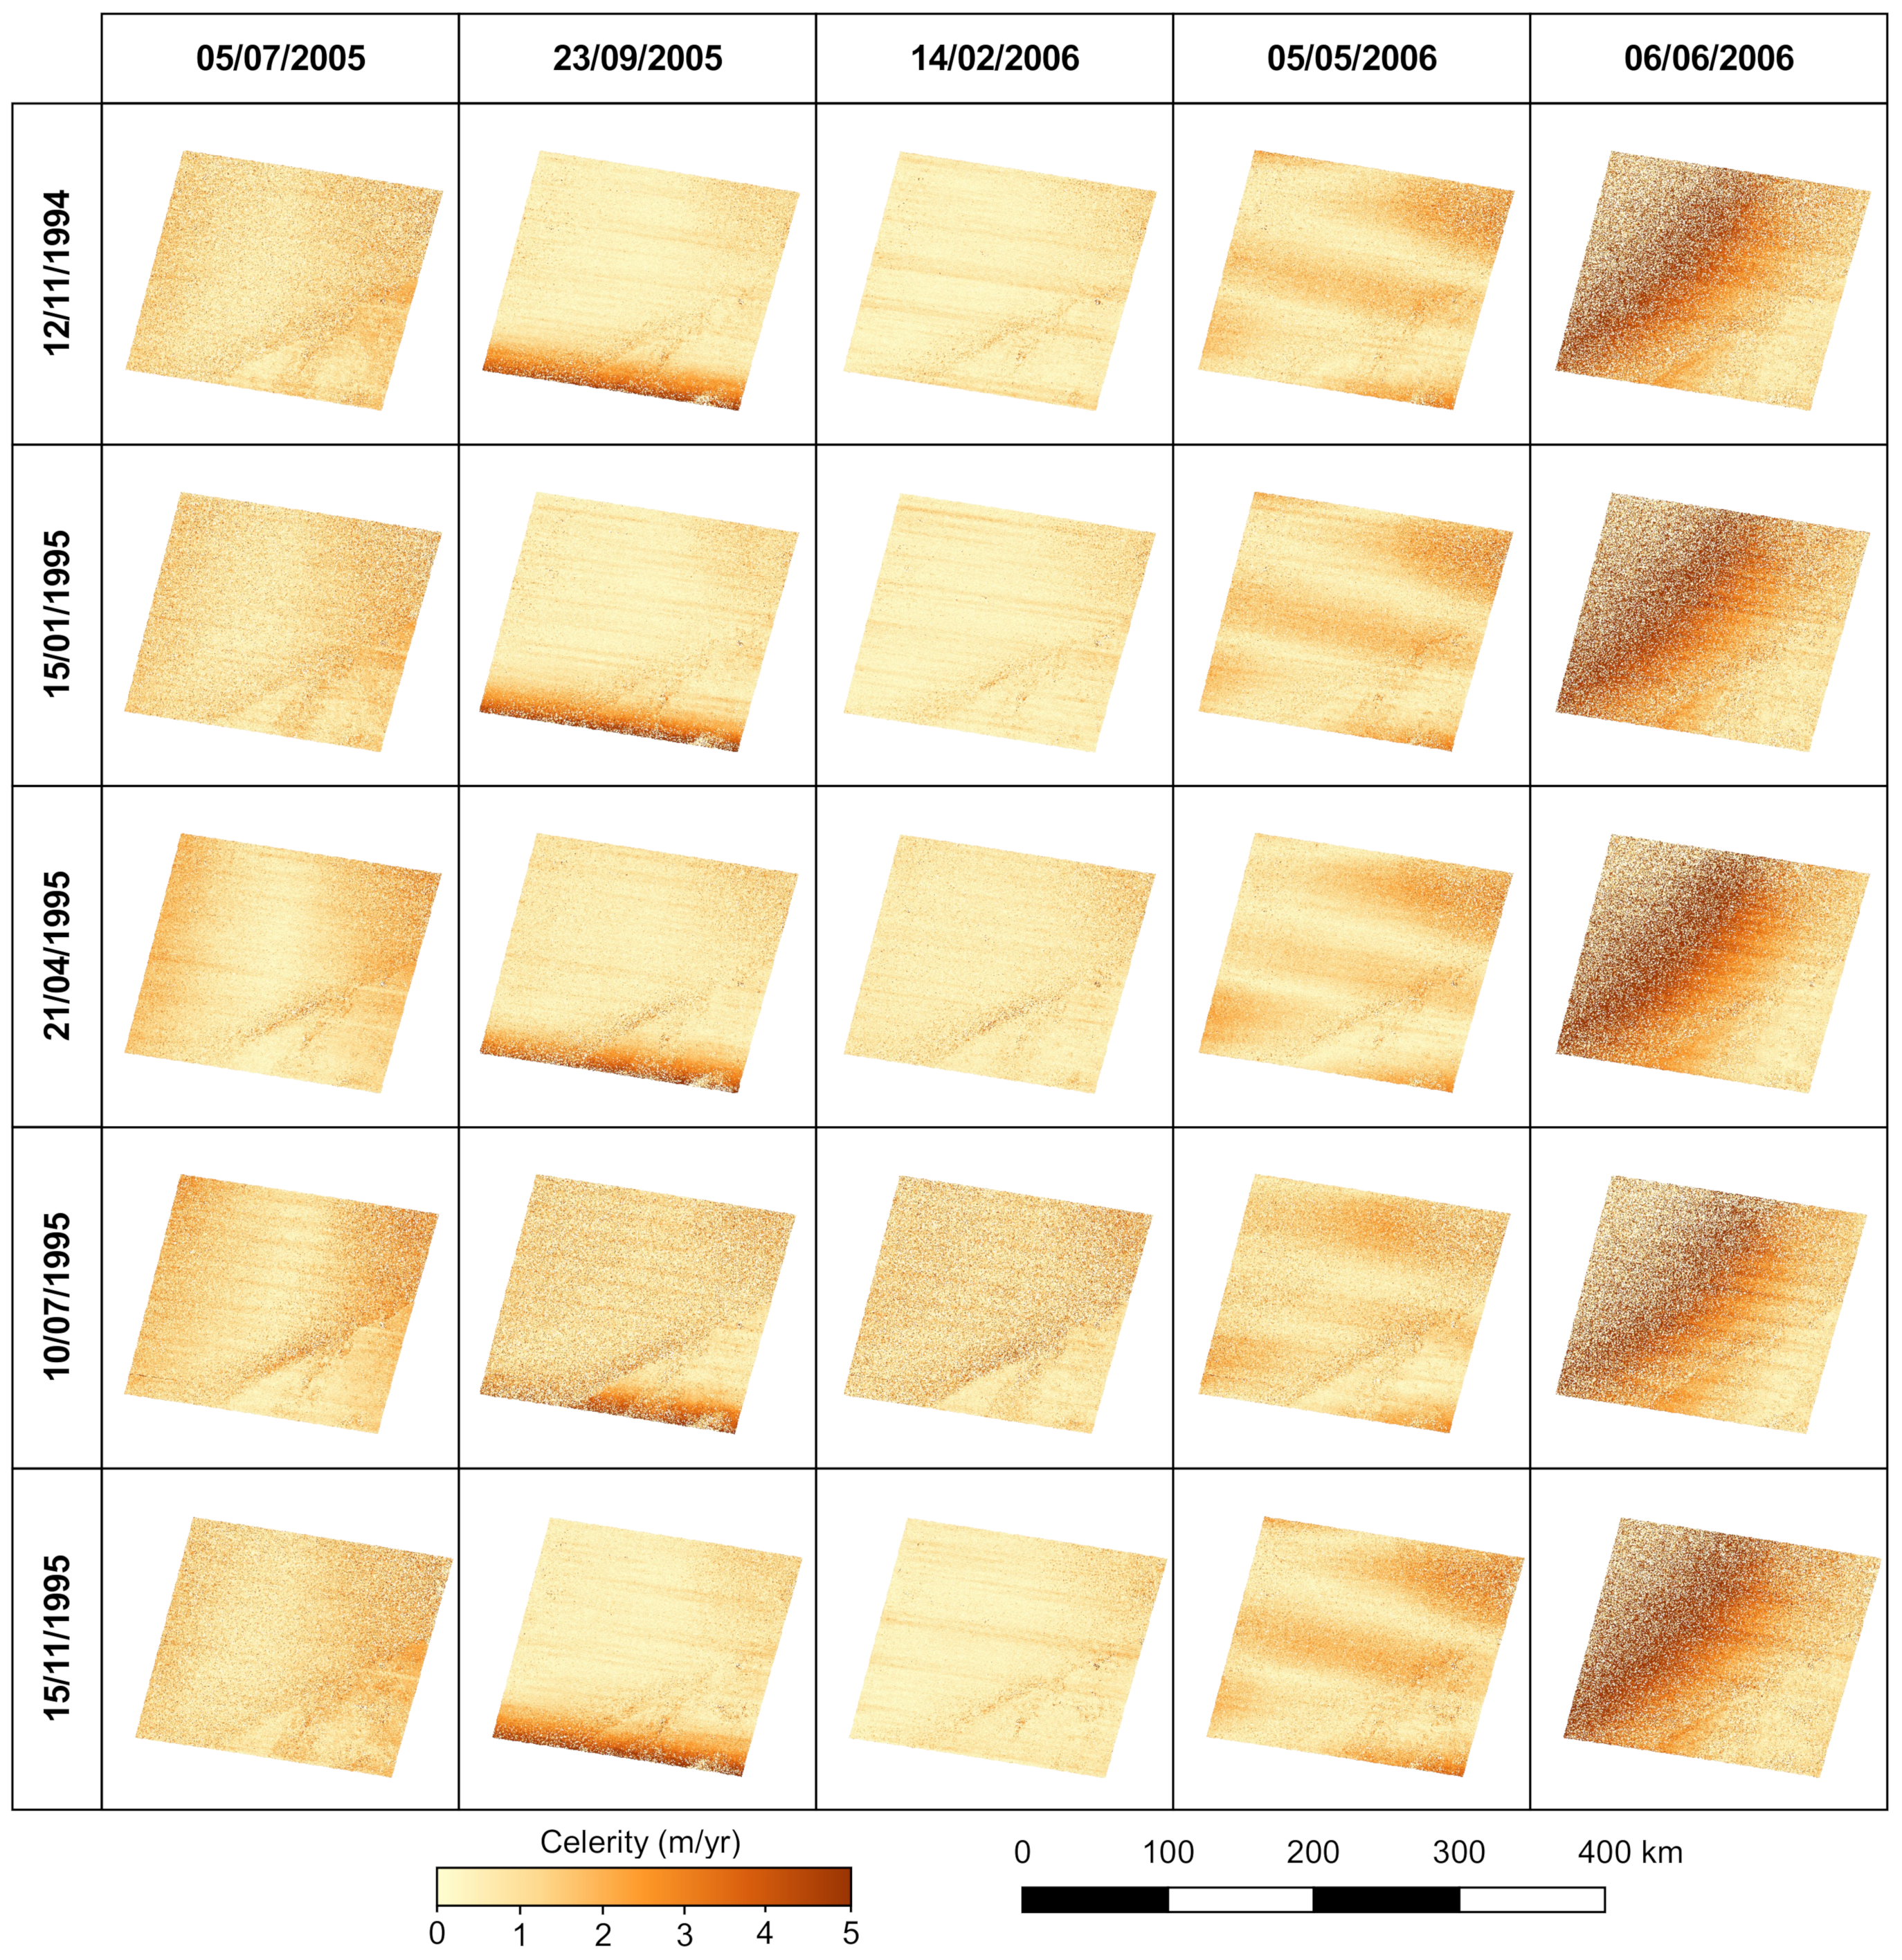
Celerity results for 25 correlation pairings from year ~1995 to ~2005 for path/row 191/039.
Figure 13.
Celerity results for 25 correlation pairings from year ~1995 to ~2005 for path/row 191/039.

Figure 14.
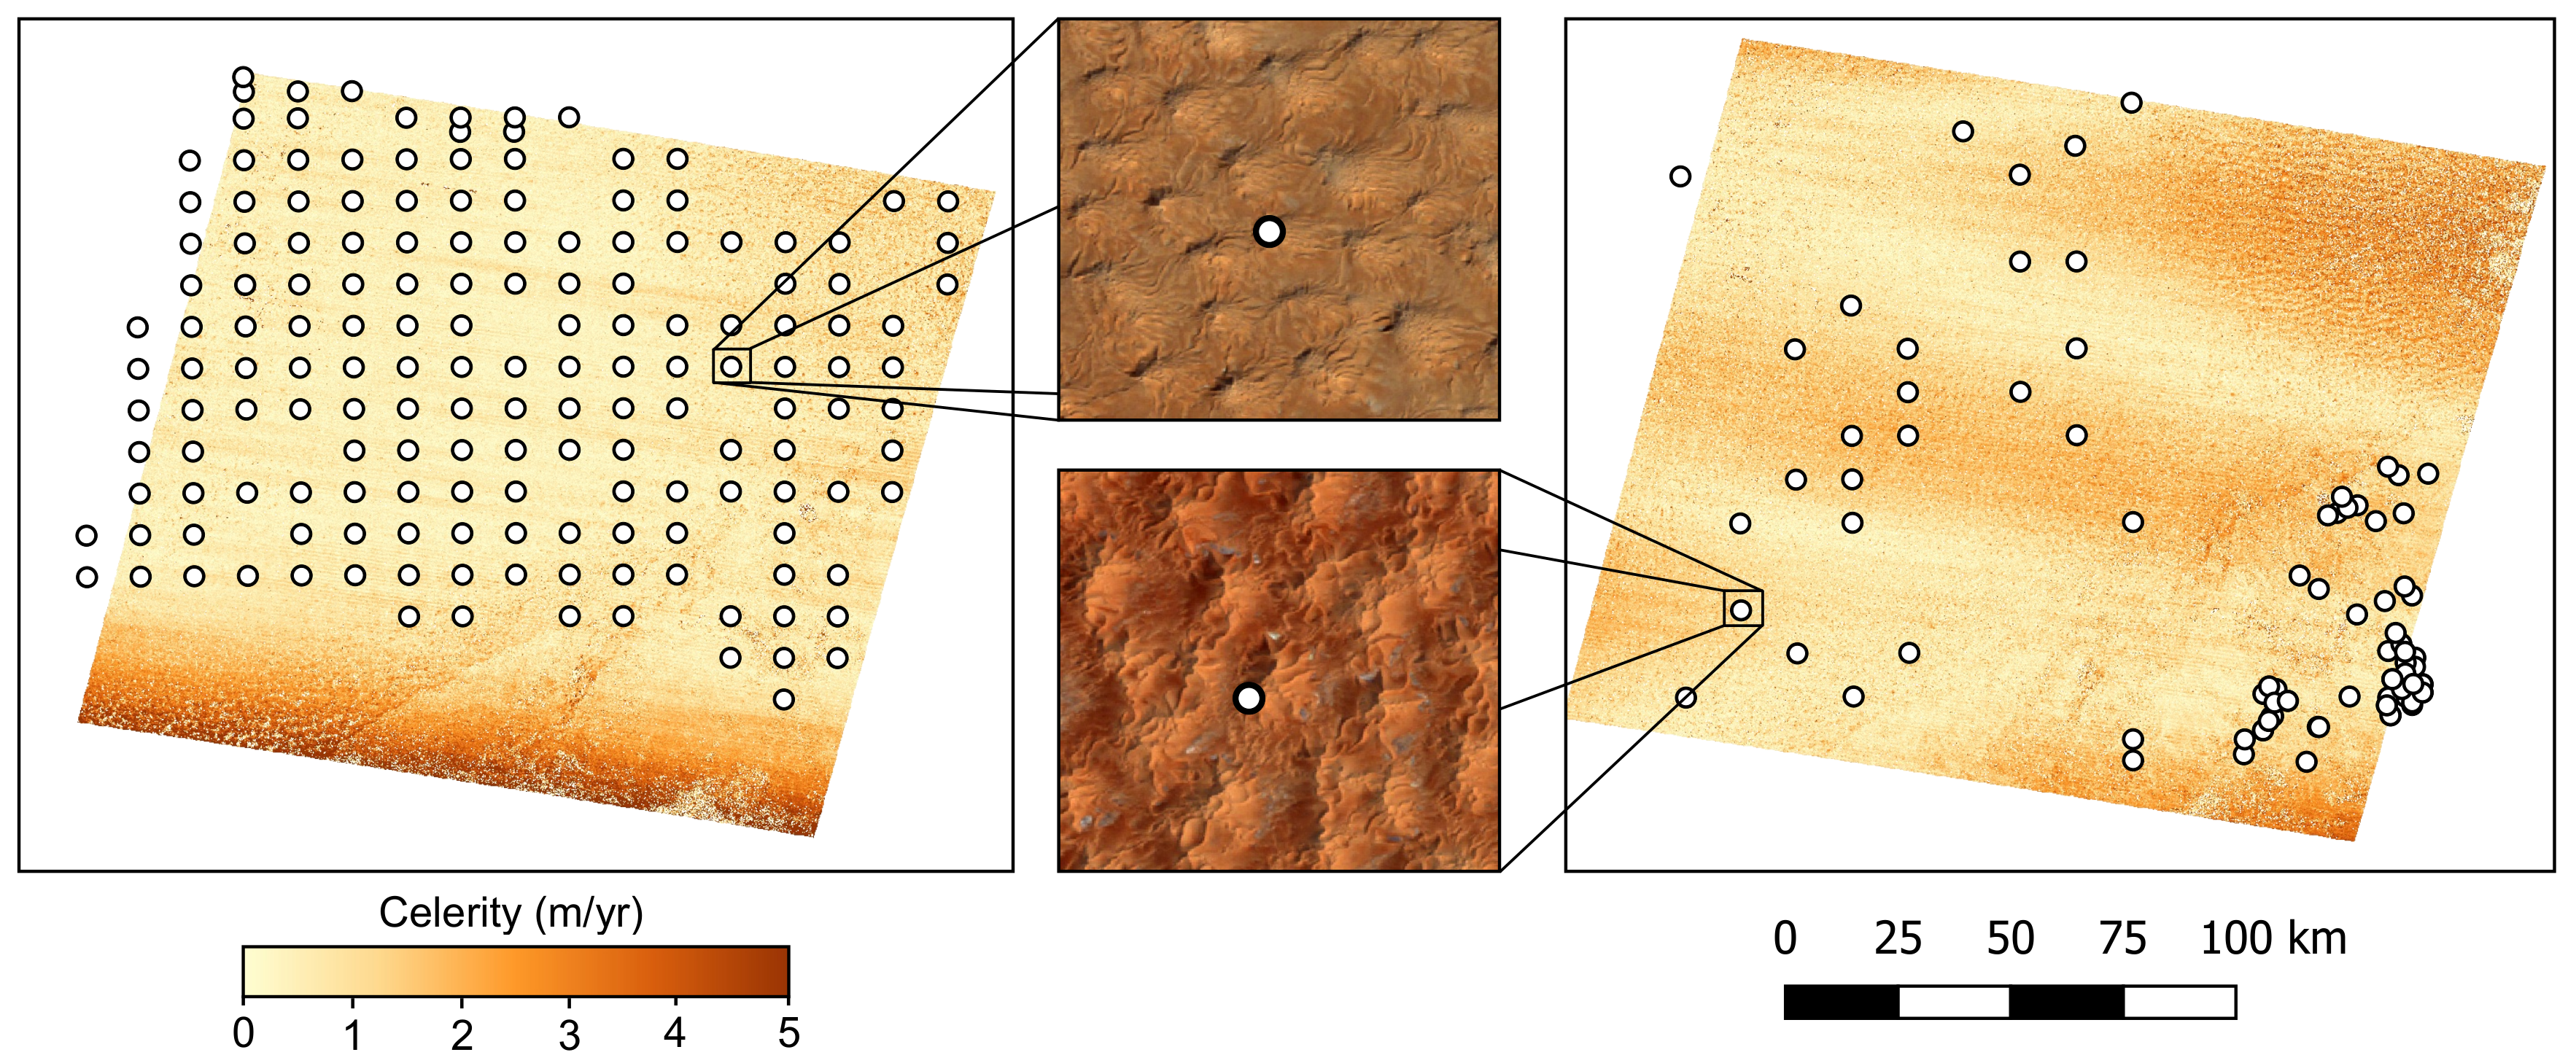
Celerity results for correlations with master scene 15/11/1995 and (Left) 23/09/1995 and (Right) 05/05/2006. Ground control point locations are shown for the post-event scenes with example true colour composites showing their locations on sand dunes.
Figure 14.
Celerity results for correlations with master scene 15/11/1995 and (Left) 23/09/1995 and (Right) 05/05/2006. Ground control point locations are shown for the post-event scenes with example true colour composites showing their locations on sand dunes.


Table 1.
Residual displacements over stables areas for different window size parameters using path/row 183/048. East/west (EW) and north/south (NS).
Table 1.
Residual displacements over stables areas for different window size parameters using path/row 183/048. East/west (EW) and north/south (NS).
| Initial | Final | Median EW | Median NS | Mean |
|---|---|---|---|---|
| Window Size | Window Size | Displacement (m) | Displacement (m) | Signal to Noise Ratio |
| 64 | 64 | 0.426 | −1.448 | 0.987 |
| 64 | 32 | 0.419 | −1.390 | 0.987 |
| 64 | 16 | 0.389 | −0.969 | 0.989 |
| 64 | 8 | 0.005 | −0.009 | 1.000 |
| 32 | 32 | 0.423 | −1.386 | 0.986 |
| 32 | 16 | 0.401 | −0.952 | 0.989 |
| 32 | 8 | 0.005 | −0.009 | 1.000 |
| 16 | 16 | 0.398 | −0.927 | 0.988 |
| 16 | 8 | 0.005 | −0.009 | 1.000 |
Table 2.
Landsat scenes used to analyse sand dune celerity in the Bodélé Depression path/row 183/048.
Table 2.
Landsat scenes used to analyse sand dune celerity in the Bodélé Depression path/row 183/048.
| Acquisition Date | Acquisition Time | Sun | Sun | |
|---|---|---|---|---|
| Landsat Product ID | (dd/mm/yyy) | (hh:mm) | Azimuth | Elevation |
| LT05_L1TP_183048_19870117_20170215_01_T1 | 17/01/1987 | 08:30 | 135.07 | 37.43 |
| LT05_L1TP_183048_19981201_20161222_01_T1 | 01/12/1998 | 08:50 | 145.14 | 42.87 |
| LT05_L1TP_183048_20070124_20180120_01_T1 | 24/01/2007 | 09:06 | 141.07 | 43.76 |
Table 3.
Classification of scene ground control points (GCPs) used for each correlation pairing for path/row 191/039.
Table 3.
Classification of scene ground control points (GCPs) used for each correlation pairing for path/row 191/039.
| Master Scene | Slave Scene | Bedrock | Bedrock | Topographic | Infrastructure | Edge of | Sand | Sand | Sandy | Unclassified | Total |
|---|---|---|---|---|---|---|---|---|---|---|---|
| (dd/mm/yyy) | (dd/mm/yyy) | Features | Interdune | Features | Sand Sea | Dune | Dune Crest | Interdune | GCPs | ||
| 12/11/1994 | 05/07/2005 | 41 | 2 | 34 | 6 | 9 | 45 | 63 | 68 | 19 | 287 |
| 12/11/1994 | 23/09/2005 | 31 | 5 | 1 | 8 | 15 | 76 | 113 | 115 | 14 | 378 |
| 12/11/1994 | 14/02/2006 | 51 | 5 | 2 | 7 | 18 | 84 | 119 | 131 | 18 | 435 |
| 12/11/1994 | 05/05/2006 | 39 | 3 | 34 | 6 | 12 | 47 | 66 | 76 | 21 | 304 |
| 12/11/1994 | 06/06/2006 | 34 | 2 | 17 | 6 | 9 | 42 | 60 | 65 | 15 | 250 |
| 15/01/1995 | 05/07/2005 | 47 | 3 | 34 | 6 | 9 | 45 | 65 | 67 | 18 | 294 |
| 15/01/1995 | 23/09/2005 | 37 | 6 | 1 | 8 | 15 | 76 | 115 | 114 | 13 | 385 |
| 15/01/1995 | 14/02/2006 | 57 | 6 | 2 | 7 | 18 | 84 | 121 | 130 | 17 | 442 |
| 15/01/1995 | 05/05/2006 | 45 | 4 | 34 | 6 | 12 | 47 | 68 | 75 | 20 | 311 |
| 15/01/1995 | 06/06/2006 | 40 | 3 | 17 | 6 | 9 | 42 | 62 | 64 | 14 | 257 |
| 21/04/1995 | 05/07/2005 | 36 | 3 | 34 | 3 | 6 | 36 | 50 | 47 | 14 | 229 |
| 21/04/1995 | 23/09/2005 | 26 | 6 | 1 | 5 | 12 | 67 | 100 | 94 | 9 | 320 |
| 21/04/1995 | 14/02/2006 | 46 | 6 | 2 | 4 | 15 | 75 | 106 | 110 | 13 | 377 |
| 21/04/1995 | 05/05/2006 | 34 | 4 | 34 | 3 | 9 | 38 | 53 | 55 | 16 | 246 |
| 21/04/1995 | 06/06/2006 | 29 | 3 | 17 | 3 | 6 | 33 | 47 | 44 | 10 | 192 |
| 10/07/1995 | 05/07/2005 | 35 | 1 | 35 | 2 | 5 | 21 | 33 | 29 | 14 | 175 |
| 10/07/1995 | 23/09/2005 | 25 | 4 | 2 | 4 | 11 | 52 | 83 | 76 | 9 | 266 |
| 10/07/1995 | 14/02/2006 | 45 | 4 | 3 | 3 | 14 | 60 | 89 | 92 | 13 | 323 |
| 10/07/1995 | 05/05/2006 | 33 | 2 | 35 | 2 | 8 | 23 | 36 | 37 | 16 | 192 |
| 10/07/1995 | 06/06/2006 | 28 | 1 | 18 | 2 | 5 | 18 | 30 | 26 | 10 | 138 |
| 15/11/1995 | 05/07/2005 | 43 | 3 | 34 | 5 | 9 | 44 | 64 | 62 | 19 | 283 |
| 15/11/1995 | 23/09/2005 | 33 | 6 | 1 | 7 | 15 | 75 | 114 | 109 | 14 | 374 |
| 15/11/1995 | 14/02/2006 | 53 | 6 | 2 | 6 | 18 | 83 | 120 | 125 | 18 | 431 |
| 15/11/1995 | 05/05/2006 | 41 | 4 | 34 | 5 | 12 | 46 | 67 | 70 | 21 | 300 |
| 15/11/1995 | 06/06/2006 | 36 | 3 | 17 | 5 | 9 | 41 | 61 | 59 | 15 | 246 |
© 2019 by the authors. Licensee MDPI, Basel, Switzerland. This article is an open access article distributed under the terms and conditions of the Creative Commons Attribution (CC BY) license (http://creativecommons.org/licenses/by/4.0/).
Share and Cite
MDPI and ACS Style
Baird, T.; Bristow, C.S.; Vermeesch, P. Measuring Sand Dune Migration Rates with COSI-Corr and Landsat: Opportunities and Challenges. Remote Sens. 2019, 11, 2423. https://0-doi-org.brum.beds.ac.uk/10.3390/rs11202423
AMA Style
Baird T, Bristow CS, Vermeesch P. Measuring Sand Dune Migration Rates with COSI-Corr and Landsat: Opportunities and Challenges. Remote Sensing. 2019; 11(20):2423. https://0-doi-org.brum.beds.ac.uk/10.3390/rs11202423
Chicago/Turabian StyleBaird, Thomas, Charlie S. Bristow, and Pieter Vermeesch. 2019. "Measuring Sand Dune Migration Rates with COSI-Corr and Landsat: Opportunities and Challenges" Remote Sensing 11, no. 20: 2423. https://0-doi-org.brum.beds.ac.uk/10.3390/rs11202423
Note that from the first issue of 2016, this journal uses article numbers instead of page numbers. See further details here.