Article

Assessment of Portable Chlorophyll Meters for Measuring Crop Leaf Chlorophyll Concentration

1
Ottawa Research and Development Centre, Agriculture and Agri-Food Canada, Ottawa, ON K1A 0C6, Canada
2
Department of Geography and Planning, University of Toronto, Toronto, ON M5S 3G3, Canada
3
College of Agriculture, Yangzhou University, Yangzhou 225009, China
*
Authors to whom correspondence should be addressed.
Remote Sens. 2019, 11(22), 2706; https://0-doi-org.brum.beds.ac.uk/10.3390/rs11222706
Submission received: 16 October 2019 / Revised: 7 November 2019 / Accepted: 13 November 2019 / Published: 19 November 2019
(This article belongs to the Special Issue Remote Sensing for Precision Nitrogen Management)

Abstract

:
Accurate measurement of leaf chlorophyll concentration (LChl) in the field using a portable chlorophyll meter (PCM) is crucial to support methodology development for mapping the spatiotemporal variability of crop nitrogen status using remote sensing. Several PCMs have been developed to measure LChl instantaneously and non-destructively in the field, however, their readings are relative quantities that need to be converted into actual LChl values using conversion functions. The aim of this study was to investigate the relationship between actual LChl and PCM readings obtained by three PCMs: SPAD-502, CCM-200, and Dualex-4. Field experiments were conducted in 2016 on four crops: corn (Zea mays L.), soybean (Glycine max L. Merr.), spring wheat (Triticum aestivum L.), and canola (Brassica napus L.), at the Central Experimental Farm of Agriculture and Agri-Food Canada in Ottawa, Ontario, Canada. To evaluate the impact of other factors (leaf internal structure, leaf pigments other than chlorophyll, and the heterogeneity of LChl distribution) on the conversion function, a global sensitivity analysis was conducted using the PROSPECT-D model to simulate PCM readings under different conditions. Results showed that Dualex-4 had a better performance for actual LChl measurement than SPAD-502 and CCM-200, using a general conversion function for all four crops tested. For SPAD-502 and CCM-200, the error in the readings increases with increasing LChl. The sensitivity analysis reveals that deviations from the calibration functions are more induced by non-uniform LChl distribution than leaf architectures. The readings of Dualex-4 can have a better ability to restrict these influences than those of the other two PCMs.

Graphical Abstract

1. Introduction

Estimation of plant traits using remote sensing data, such as leaf nitrogen concentration, leaf chlorophyll concentration (LChl) and leaf area index (LAI), is important for mapping the spatiotemporal variability of crop and soil conditions, and modeling crop nutrient balance, and crop productivity [1,2,3]. LChl is the main light-harvesting pigment that determines leaf photosynthetic capacity, and it is highly influenced by nitrogen fertilization [4,5,6]. Furthermore, incorporating LChl into process-based crop models could improve model performance [7,8]. LChl varies with leaf positions, species, crop types, crop growth stages and crop managements [7,9,10]; thus, knowledge on the spatiotemporal variability of LChl is important to understand the status of crop growth condition and productivity [8,11,12].
A number of studies have investigated the potential of remote sensing data in estimating LChl using statistical or physical based approaches [13,14,15]. There has been rapid development in new satellite sensors, such as multispectral satellite sensors with red-edge (680–750 nm) reflectance measurements (e.g., Sentinel-2 and VENµS) [16,17], the VNIR-SWIR hyperspectral satellite sensors (e.g., HyspIRI and EnMAP) [18,19], and the multi- and hyperspectral imaging systems mounted on a UAV system [19]. In particular, these sensors possess the red-edge or hyperspectral reflectance that is highly sensitive to changes in LChl [4]. This allows for improved accuracy for LChl estimation from remote sensing data at different spatial scales. Accurate in situ LChl measurements are essential for developing and validating remote-sensing LChl estimation models.
Destructive and non-destructive methods are often used for LChl measurement. Both methods rely on measured light absorption/transmission to determine LChl [2,20,21]. Conventionally, destructive measurement is conducted using a wet-chemical method in a lab setting [4,22]. Leaves are harvested from the plant and chlorophyll is extracted using organic solvents (e.g., acetone, methanol, ethanol, dimethyl sulphoxide (DMSO), or N-dimethyl formamide (DMF) [4,22,23]. A spectrophotometer, a fluorometer, or a high-performance liquid chromatography (HPLC) is often used to measure light absorptions at a few wavelength ranges [4,23], which are then used to determine LChl. The lab-based approach is costly, labour intensive and time consuming. In addition, destructive sampling does not allow for tracking the temporal dynamics of LChl of the same leaves [5].
Non-destructive methods provide a cost-efficient way for frequent measurement of LChl over a large area [2,9,10]. Studies have found that spectral indices derived from light absorbance or reflectance at the visible and near infrared (NIR) regions have good correlations with LChl [24,25,26,27] and can be used to develop non-destructive methods for LChl measurements [27,28]. Portable chlorophyll meters (PCMs), such as the SPAD-502/501 (Soil Plant Analysis Development (SPAD) chlorophyll meter, Konica–Minolta, Inc., Osaka, Japan), the CCM-200 (CCM-200 plus Chlorophyll Content Meter, Opti-Sciences, Inc., Hudson, NH), and the Dualex-4 (Dualex Scientific+TM Polyphenol & Chlorophyll Meter, FORCE-A, Orsay, France), have been developed for non-destructive measurements of LChl and nitrogen in the field [2,29,30]. The readings from the PCMs (meter reading) are relative quantities that need to be converted to actual LChl. The transformation equations are usually established using meter readings and lab-measured LChl of the same leaf area [21,29,30,31,32]. For instance, Markwell et al. [21] developed a widely used exponential equation to estimate LChl from SPAD-502 readings, and Cerovic et al. [29] subsequently developed a generic conversion function for SPAD-502 readings based on more data collected in different studies (e.g., Markwell et al. [21], Richardson et al. [30] and Marenco et al. [33]).
It should be noted that factors other than LChl may also influence the light transmittance of a leaf, such as leaf structure, water content and leaf pigment distribution [2,34,35]. Environmental factors such as light intensity can also affect light transmittance of a leaf, resulting in measurement errors of LChl [36,37]. Influences on light transmittance can be categorized into two groups [38,39,40]. The first is the detour effect (light scattering), caused primarily by non-chlorophyll components (e.g., leaf architecture and dry matter), which can result in an increase in the path length of light inside a leaf [41]. The sieve effect occurs when light passes through leaf tissues without being absorbed, thereby decreasing total absorption [39,40,42]. The distribution of chlorophyll molecules within a leaf is usually non-uniform, associated with the structural organization of the grana within the chloroplasts, chloroplasts within the cells, and cells within the tissue layers [43,44]. Furthermore, the influences on light transmittance vary with wavelength. Since different PCMs are developed based on different wavelengths, they may be impacted differently by different factors. Large uncertainties have been reported when converting meter readings into LChl using a general conversion function for different crops [29,39]. An in depth understanding of the mechanisms for the PCMs is useful for improving protocols to obtain high-quality in situ LChl measurements. However, it is difficult to consider the impacts from all leaf/canopy and environmental factors through field experiments. Using a leaf radiative transfer model to simulate the complex light transmission processes inside a leaf may provide a solution [14,35,43]. This study, therefore, was designed to address the following: (1) the performances of different PCMs in estimating actual LChl, (2) the relationships between PCM reading and the actual LChl, (3) the sources of errors in PCM measurements based on simulations of light transmission in a leaf using radiative transfer model, and (4) the potential of deriving a generic conversion equation for a specific PCM. To address these, an experiment was conducted to collect PCM readings of corn (Zea mays L.), spring wheat (Triticum aestivum L.), soybean (Glycine max L. Merr.) and canola (Brassica napus L.) using the three aforementioned instruments (SPAD-502, CCM-200 and Dualex-4) at the Central Experimental Farm (CEF) of Agriculture and Agri-Food Canada (AAFC) in Ottawa, during the 2016 growing season.

2. Materials and Methods

2.1. Theoretical Basis of Portable Chlorophyll Meters

A portable chlorophyll meter measures the light transmittance of a leaf at two different wavelengths, the index band and the reference band. The index band resides in a chlorophyll absorption region, whereas the reference band is located in the NIR region. There is generally no light absorption in the reference band, which is used to compensate for mechanical differences caused by leaf structure, such as leaf thickness or/and leaf density [24,27,45].
The SPAD-502 (Konica–Minolta, Inc., Osaka, Japan) is the earliest and most widely used PCM. It quantifies LChl based on the difference of light transmittance between the NIR band (centered at 940 nm with a full-width at half magnitude (FWHM) of about 10 nm) and the red band (centered at 650 nm with FWHM of about 30 nm). The reading is formulated as [21,40]:
S P A D = k [ log ( I 940 I 940 ) log ( I 650 I 650 ) ] + c = k [ log ( T 940 ) log ( T 650 ) ] + c
where k and c are calibration coefficients, I 940 and I 650 are transmitted light intensities at respective wavelengths, I 940 and I 650 are light intensities of the LED light sources, and T 940 and T 650 are light transmittances through the leaf. SPAD-502 has a 6 mm2 (2 mm × 3 mm) measurement aperture. The claimed accuracy of the SPAD-502 reading is within ±1.0 unit for a range of 0 to 50 under normal conditions. The value may be less accurate when the reading is greater than 50.
The CCM-200 PCM (Opti-Sciences, Inc., Hudson, NH, USA, Apogee Instruments 2011) measures a chlorophyll content index (CCI)—the ratio of leaf light transmittance between the wavelength of 931 and 653 nm ( T 931 and T 653 ) ([39]:
C C I = I 931 / I 931 I 653 / I 653 = T 931 T 653
where, I 931 and I 653 are the measured leaf light transmission intensities at respective wavelengths, and I 931 and I 653 are the light intensities of the LED light source centered at 931 (FWHM about 25 nm) and 653 nm (FWHM about 50 nm), respectively. Calibration is required every time the instrument is turned on. The CCM-200 has a sensing aperture of 71 mm2 (9.5 mm diameter). The readings of CCM-200 range from 0 to 200, with a resolution of ±1.0 CCI units.
The Dualex-4 Scientific (FORCE-A, Orsay, France) is a new-generation polyphenol and chlorophyll meter that measures the leaf chlorophyll index (Chl), the flavonol index (Flav), the anthocyanin index (Anth) and nitrogen balance index (NBI) [29,46]. Flav and Anth are relative measures of flavonol and anthocyanins’ concentration, respectively [46,47,48]. NBI is the ratio between Chl and Flav, corresponding to LChl corrected by dry leaf mass per unit area. Calculation of Chl uses a red-edge band centered at 710 nm and an NIR band centered at 850 nm. The reason for using a red-edge band is that indices based on the red-edge and the NIR wavelength have better sensitivity to chlorophyll concentration than the indices based on the red and NIR wavelengths [28,31,49]. Its circular sensing aperture has a diameter of 5 mm (~20 mm2). The Chl readings range from 5 to 80 µg cm−2. The function of Chl [29] is:
C h l = k   ( I 850 / I 850 I 710 / I 710 1 ) + c = k ( T 850 T 710 1 ) + c
where k is the calibration coefficient to obtain leaf chlorophyll concentration in the unit of µg cm−2, and c is a constant for correcting the potential bias of the model. Instrument calibration is required prior to use and is done with no sample in the measuring head.

2.2. Leaf Chlorophyll Concentration Measurement

Field experiments were conducted at the Central Experimental Farm (45.38° N, 75.71° W, Figure 1) in Ottawa, Ontario, Canada, which included a field experiment and a greenhouse experiment. Field sampling for corn, soybean, canola and spring wheat was conducted three times during the growing season on 21 June, 7 July and 4 August 2016. Measurements of LChl for corn and soybeans were collected from a rotation experiment field with eight rotation patterns. The field was divided into 48 strips, each about 9 m wide and 17 m long. All the corn plots received three levels of nitrogen (N) fertilizer (0, 100 and 200 kg N ha−1) with six replications for each level of N application. Soybean was not fertilized. LChl were measured at the plots of continuous cropping with corn or soybean. Canola was planted in a field adjacent to the rotation field (Figure 1). The field was divided into two sections for two different experiments. The first experiment was designed to test eight rates of N application on two canola varieties (InVigor L140P and InVigor 5440), each with four replicates. Each plot was 4.0 m wide by 6.0 m long. The second experiment was designed to test 12 combinations of different rates of N and Sulphur application, with three rates of N (0, 75, 150 kg ha−1) and four rates of Sulphur (0, 10, 20, 40 kg ha−1). Each treatment had four replicates, resulting in a total of 48 plots with the same size as the first experiment. In this study, LChl was measured at plots receiving five levels of N application (0, 50, 100, 150 and 200 kg N ha−1) in the first experiment, and plots receiving 75 kg N ha−1 and four rates of Sulphur (0, 10, 20, 40 kg ha−1) in the second experiment. The spring wheat field was adjacent to the canola field (Figure 1). The field was treated with uniform nitrogen fertilization (150 kg N ha−1). LChl was measured at 8 randomly selected plots.
In the greenhouse, canola was seeded on 2 May 2016. Five rates of N (0, 50, 75, 100, and 150 kg N ha−1) were applied with six replications per treatment to examine the response of crop growth to N application. There were a total of 30 pots with a size of 15 cm in diameter and 15 cm in depth. The soil used was a mixture of one-half sand and one-half potting soil to create soil N deficient. The pots were placed on a bench 1 m above the ground, with a distance of 10 cm from each other. The greenhouse was controlled at 25–15 °C day/night temperature and with a 16 h photoperiod. Plants received both natural light, and light from fluorescence lamps with an intensity of 300 µmol m−2 s−1 during cloudy periods. Chlorophyll measurements using PCMs and leaf sampling were conducted on 30 May and 16 June 2016, corresponding to the plant’s growth stage, with 5–6 leaves and early flowering, respectively.
A total of 220 plants were selected from the two experiments and from different dates (Table 1). For each plant, a fully expanded leaf from the top, usually the second leaf, was selected for measurement. Multiple readings were taken for a leaf depending on its size, and the average reading was used as the representative value for the meter reading of each leaf. In detail, four to five readings were taken for soybean and canola at the middle portion of the leaf and on two sides of the main rib (avoiding the midrib and veins). For spring wheat, six to eight readings were taken at the two sides of the main rib. Measurements with eight to ten readings for corn leaves were taken between the midrib and the leaf margin about 20 cm from the stalk. Readings were taken at the same area on the leaf for the three instruments.
For destructive sampling, four to six discs (1.09 cm2) were clipped from the same leaf at the same area where readings were taken using the three PCMs. Leaf discs were placed into a 15 mL plastic tube and kept cool. In the laboratory, the samples were stored in liquid nitrogen at −80 °C before further processing. For chemical determination of pigment concentration, the samples from each site were placed in 10 mL of ethanol solution (96%, v/v) and incubated at room temperature in the dark for four days until leaf samples turned white completely. The solution for each site was put in three cuvettes, and light absorption was measured for each cuvette using a Varian Cary 100 Bio UV-Visible Spectrophotometer (Thermo Electron Corporation, Madison, WI, USA) at three wavelengths: 665, 649 and 470 nm. Chlorophyll a (Chla), chlorophyll b (Chlb) and total carotenoid concentrations (Car) were calculated using the following equations (Lichtenthaler et al. [22]):
C h l a ( μ g   cm 2 ) = ( 13.95 A 665 6.88 A 649 ) × V / T L A
C h l b ( μ g   cm 2 ) = ( 24.96 A 649 7.32 A 665 ) × V / T L A
L C h l ( μ g   cm 2 ) = ( 6.63 A 665 + 18.08 A 649 ) × V / T L A
C a r ( μ g   cm 2 ) = ( 1000 A 470 2.05 C h l a 114.8 C h l b ) / 245 × V / T L A
where A is the measured absorbance at different wavelengths given by the subscript (in nm); TLA is the total leaf area (cm2) used, and V is the amount of ethanol (solvent, mL). The total chlorophyll concentration (LChl) was the sum of Chla and Chlb. The composition of LChl (Chla/Chlb ratio) was also calculated. Values for the three cuvettes of a site were averaged to obtain pigment concentrations for the site.

2.3. Statistical Analysis

Among the 220 samples collected, 194 samples were retained for analysis. The other 26 samples were excluded, as their measured absorbance at 649 nm was wrong (>1 absorbance unit). To identify the difference in leaf pigment traits among the four crops, statistical indicators, including the average, the minimum, the maximum, and the coefficient of variance (CV), of the meter readings and leaf pigments’ concentrations were derived separately. Flav, Anth, and NBI, derived from the Dualex-4, were also analyzed. Correlations among leaf pigment concentrations determined from the lab, and linear or nonlinear regressions between meter readings and leaf pigment concentration (LChl and Car) were then analyzed, respectively. The purpose of this analysis was to investigate whether other pigments impacted on the conversion functions from optical reading to the actual LChl.

2.4. Sensitivity Analysis

Leaf reflectance and transmittance can be simulated using a leaf radiative transfer mode, by taking into consideration LChl as well as interference factors (e.g, leaf structure and leaf pigments other than LChl) [14,34,35,43]. PCM is developed based on sensing technologies through spectral measurements. The PROSPECT-D [14], the newest version of the PROSPECT leaf optical model, was used. The model simulates leaf directional–hemispherical reflectance and transmittance in the spectral range 400–2500 nm using a set of leaf parameters, such as leaf anthocyanins (Canth), chlorophyll and carotenoid concentration, leaf water concentration (Cw), leaf dry matter concentration (Cm), and leaf structure parameter (Ns) [14,35].
To evaluate the detour effect, leaf–light transmittance was simulated using the PROSPECT-D model. Leaf brown pigment (Cbp) was given a value of zero, as the analysis was performed on green leaves only. Except for a constant value assigned to LChl, the other variables (Ns, Cw, Car, Cm and Canth) were varied in a range determined from field measurements and the literature studies [7,14,35], following a uniform distribution (Table 2). Light transmittances at wavelengths centered at 940, 931, 850, 710, 653, and 650 nm were then simulated. The spectral response functions of the LEDs used in the PCMs [50,51,52] were also considered. A global sensitivity analysis (GSA) was conducted to determine the contribution variation for each leaf parameter, using the SIMLAB (Simulation Environment for Sensitivity and Uncertainty Analysis, http://simlab.jrc.ec.europa.eu/) software. Detailed information on the variance-based GSA and its application in the simulation of PROSPECT model can be found in the studies of Dong et al. [53] and Liu et al. [54].
To investigate the sieve effects, the approach proposed by Uddling et al. [38] was used in the PROSPECT-D simulations. It is assumed that the variation in actual LChl within the measured area follows a normal distribution around the average value of LChl (µ). The standard deviation (σ) of LChl was set within the range 10–50% of µ in steps of 10% of µ. The average LChl (µ) was varied from 10 to 80 µg cm−2 with steps of 5 µg cm−2. For simplicity, other variables were given constant values obtained from field measurements (e.g., Car) or the literature studies (e.g., Ns, Cm and Canth) (Table 2). For instance, Car was assigned as 8.04 g cm−2, as that is the mean value of Car obtained in our in situ measurements, and Ns was 1.55 as an average value of cereal crops [35,54]. The variations in the log ( T 940 / T 650 ) (Equation (1)), the ( T 931 / T 653 ) (Equation (2)) and the ( T 850 / T 710 1 ) (Equation (3)) responses to different degrees of heterogeneity of leaf chlorophyll concentration distribution were then analyzed.

3. Results

3.1. Variability of LChl

Statistics of meter readings and lab pigment concentration measurements for four crops together are given in Table 3. Readings by CCM-200 (CCM-200-CCI) had a wider range and larger variation (CV = 46.3%, 8.7–80.3) than those of SPAD-502 (CV = 18.3%, 25.5–70.3) and Dualex-4 (Dualex-4-Chl, CV = 22.5%, 22.1–61.0). Large variations were also observed in Flav (CV = 42.5%), Anth (CV = 46.3%) and NBI (CV = 65.3%) of Dualex-4. For lab chemical measurements, the absolute pigment concentration ranged from 25.6 to 83.6 µg cm−2 for LChl (µ = 48.4 µg cm−2 and CV = 25.3%) and 3.6 to 13.3 µg cm−2 for Car (CV = 28.0%). These suggest that the variability of the SPAD-502 readings and the Dualex-4-Chl readings was closer to the variability of actual LChl than that of the CCM-200-CCI. For the LChl composition, Chla (19.9 to 62.8 µg cm−2) was generally greater than Chlb (4.6 to 21.1 µg cm−2), with a ratio (Chla/Chlb) between 2.2 and 4.6 (µ = 3.3, CV = 14.4%). Car generally constituted about 14% of the sum of LChl and Car, as all selected leaves were in dark-green.
Leaves of the four crops were different, according to the statistical characteristics of lab pigment concentration measurements in each crop (Figure 2). Chla/Chlb of corn, with a mean value of 4.0 and range of 3.2–4.6, was higher than that of the other three crops, and Chla/Chlb for canola, spring wheat and soybean crops were close to each other. Spring wheat had a larger mean value of pigment concentrations (LChl, Chla, Chlb and Car) than other crops (Figure 2). Soybean had lower variation (CV = 15.4% for LChl and 11.5% for Car) than the other three crops (Table A1). Pigment concentrations of canola in the greenhouse were apparently lower than that of canola in the field. Similar differences can be found in the Flav index of Dualex-4 between the greenhouse canola (Flav = 0.3) and the field canola (Flav = 1.7) (Table A1). This may reflect the great difference in light conditions between field and greenhouse, as the Flav index of Dualex-4 is an indicator of light intensity [36,47,56].
CCM-200 readings showed the largest variability for any specific crop (Table A1 and Figure 2). Figure 2f–h show that average values of meter readings by each PCM were different among the four crops. The relative differences of average values among the four crops for the SPAD-502 readings were similar to those of the CCM-200-CCI, but were different from those of Dualex-4-Chl. The averages of Dualex-4-Chl for the four crops showed similar relative differences to actual LChl (Figure 2b).

3.2. Correlation among Leaf Pigment Concentrations

Examination of the correlation between Chla, Chlb, LChl and Car is helpful to understand the potential impact of other pigments on the conversion of PCM readings into actual LChl. Figure 3 shows that there were strong linear correlations among leaf pigment concentrations determined by lab chemical method. The linear regression between Chla and Chlb for corn (C4 plant) was different from that of the other three crops (C3 plant), showing a greater Chla/Chlb. In comparison, the relationship between the Car and LChl was more universal among the four crops, and both Chla and Chlb had a strong correlation with Car.

3.3. Estimation of Pigment Concentration from PCM Readings

Figure 4 shows that both Car and LChl had a strong linear or nonlinear correlation with PCM readings. In general, the best regression model is nonlinear for SPAD-502 and CCM-200, but is linear for Dualex-4. It was observed that different crops had different relationships between SPAD-502 and CCM-200 readings and actual pigment concentrations (Table 4). Except for Dualex-4, errors of estimates in both LChl and Car increased with the increasing value of meter readings. For the same level of actual LChl (and Car), SPAD-502 and CCM-200 had lower readings for spring wheat and soybean than for corn and canola. The R2 values for SPAD-502 (R2 = 0.48 for LChl and R2 = 0.40 for Car) were larger than those for CCM-200-CCI (R2 = 0.40 for LChl and R2 = 0.33 for Car), suggesting that the readings of SPAD-502 were better at restricting interference from other factors (e.g., leaf architectures) than CCM-200-CCI. The actual LChl values higher than 60 μg cm−2 for corn and canola could not be well estimated from CCM-200-CCI. Dualex-4-Chl was the best PCM for consistent measurements of LChl for all the four crops (R2 = 0.74). A generic function was possible for converting Dualex-4-Chl readings into actual LChl for the four crops, with an average accuracy of 87%.

3.4. Relationship of Meter Reading Averages and Deviations

Multiple readings were taken per plant sample using the PCMs, from which the average and the standard deviation can be derived for each sample plant. Figure 5 shows the relationship between the averages and the standard deviations of the PCM readings. The results of the greenhouse canola are shown as an example, using SPAD-502 measurements. The standard deviation generally increased for both SPAD-502 and CCM-200-CCI readings which suggests that the sources of measured error of the two instruments increased with actual LChl. However, the standard deviation in the Dualex-4-Chl readings was smaller and did not show an apparent increasing trend.

3.5.1. Influence of Leaf Parameters

Results from the global sensitivity analysis (GSA) in Table 5 indicate that variability of light transmittance is primarily affected by LChl and Ns for the index band and by Ns and Cm for the reference band. Compared with the index band used in Dualex-4-CCI (710 nm), light transmittance in the index band used by both SPAD-502 (650 nm) and CCM-200-CCI (653 nm) is more sensitive to LChl, especially low LChl. Ns contributed >90% of the light transmittance variability for the reference band. Increasing Ns could increase light interaction probability within a leaf, and thereby boost light absorption and reduce light transmittance [14,40,57,58]. Increasing Cm would yield similar results but at a lower level. The impact of other parameters on light transmittance variability, including Car, Canth and Cw, were relatively small.
Table 5 also shows that the ratio between NIR and VIS transmittance can suppress the interaction effects of leaf structure (e.g., Ns and Cm) on meter readings. The effect is more apparent for T850/T710 in Dualex-4-Chl. The influence of leaf parameters on T940/T650 used in SPAD-502 is not different from that on T931/T653 used in CCM-200. This is because the center wavelengths of the two bands used in SPAD-502 are close to that used in the CCM-200. However, it is important to note that the logarithmic transformation of T940/T650 used in the SPAD-502 instrument reduces the influence of Ns and other parameters, and thereby improves its sensitivity to LChl measurement, compared with the ratio of T940/T650 and the ratio of T931/T653. Compared to CCM-200 and Dualex-4, this increases the sensitivity of SPAD-502 to LChl. The meter readings of Dualex-4 are more sensitive to LChl compared with that of CCM-200.
Further analysis (Figure 6) showed that the variability of PCM readings caused by other interference factors (Ns, Cw, Car, Cm and Canth) increases with LChl, consistent with the studies by Uddling et al. [38] and Nauš et al. [40]. The result in Figure 6(d) shows that log(T940/T650) used in SPAD-502 could have the best performance in reducing the influences of light scattering caused by interference factors (e.g., leaf structure), especially at a high LChl. The change in CV was more stable for Dualex-4 (T850/T710; 12.21–21.35%) and SPAD-502 (log (T940/T650); 7.66–12.21%). However, the change in CV for SPAD-502 (log (T940/T650)) was generally lower than for Dualex-4 (T850/T710).

3.5.2. The Influence of Non-Uniform LChl Distribution

Figure 7 shows that the impact of non-uniform distribution of LChl on meter readings becomes more apparent with increasing LChl. Meter readings decrease with increasing heterogeneity of LChl distribution, in particular at high LChl values. This is more apparent for CCM-200 and less apparent for Dualex-4. The readings of Dualex-4 were the least affected by the non-uniform distribution of LChl, as the sensitivity of LChl to light transmission at 710 nm was weaker than at the red wavelengths (Table 5).

4. Discussion

The four crops were selected to explore the capability of the three PCMs for crop LChl measurement. Leaf pigment contents were different among the four crops (Figure 2 and Table A1). In particular, the composition of LChl (i.e., Chla/Chlb ratio, Table A1) was obviously different between C4 plants (corn) and C3 plants (spring wheat, canola and soybean) because of their difference in photosynthesis pathways [39,56,59,
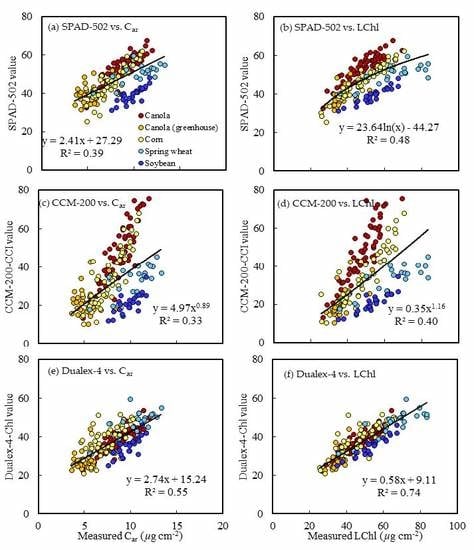
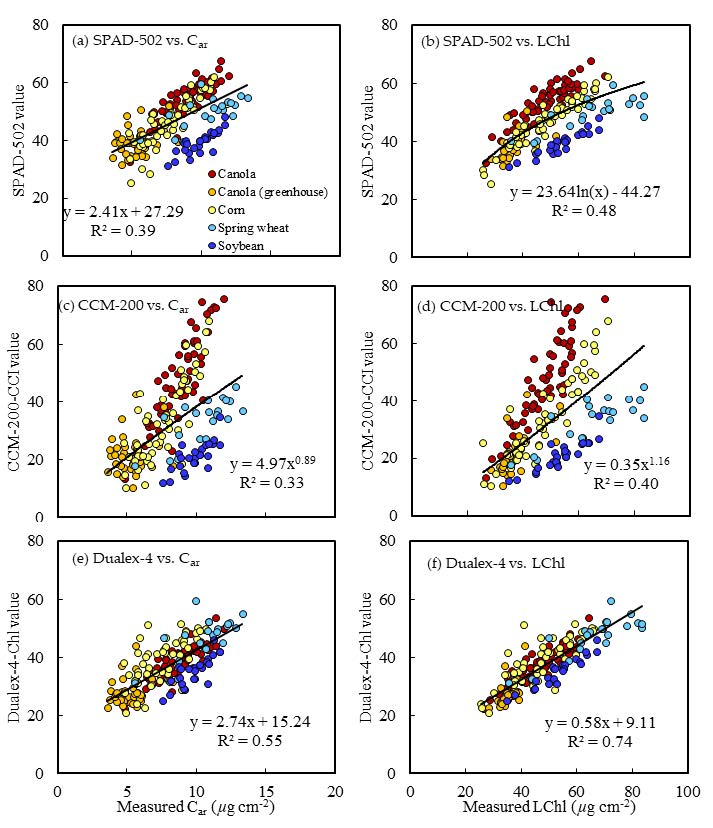
60]. Actual LChl, especially high LChl, had a larger linear correlation coefficient with the Dualex-4-Chl readings than with the SPAD-502 and the CCM-200-CCI for an individual crop and for the four crops combined (Table 4). Both SPAD-502 and CCM-200-CCI tend to have a nonlinear relationship with actual LChl, as they are sensitive to LChl at low LChl rates but are easily saturated at high LChl rates [61]. These results are consistent with the results from Cerovic et al. [29] and Casa et al. [32], in which Dualex-4-Chl performed better than the other two instruments. More importantly, there is a greater potential to develop a generic calibration function for LChl estimates of the four crops using Dualex-4-Chl than using SPAD-502 and CCM-200-CCI. Dualex-4 could be more accurate and applicable than the other two PCMs in measuring LChl over a wide, dynamic range using a generic conversion function. Time and effort taken to recalibrate the concversion fuction for different crops would be largely reduced by using the Dualex-4 compared to the other two PCMs. Moreover, Dualex-4 has lower uncertainties at high LChl rates (Figure 5 and Figure 7). LChl generally shows an increasing trend during the vegetative stage, and reaches its maximum at the peak growing stage, which is an improtant inditor for asessing crop nitrogen uptake and crop yield [7,62]. Thus, Dualex-4 might be a better PCM to accuartely measure LChl at the peak growth stage.
Sensitivity analysis using the PROSPECT-D model simulation revealed that the leaf structure parameter (Ns) had a strong impact on the variability of PCM readings. The literature showed similar results; PCM readings were significantly affected by leaf internal architecture such as leaf thickness, specific leaf mass, and leaf succulence [12,27,33,58,63]. Variability in the leaf structure parameter greatly influenced light interactions within the leaf, resulting in significant changes in light transmittance in the VIS and NIR ranges [27,35,
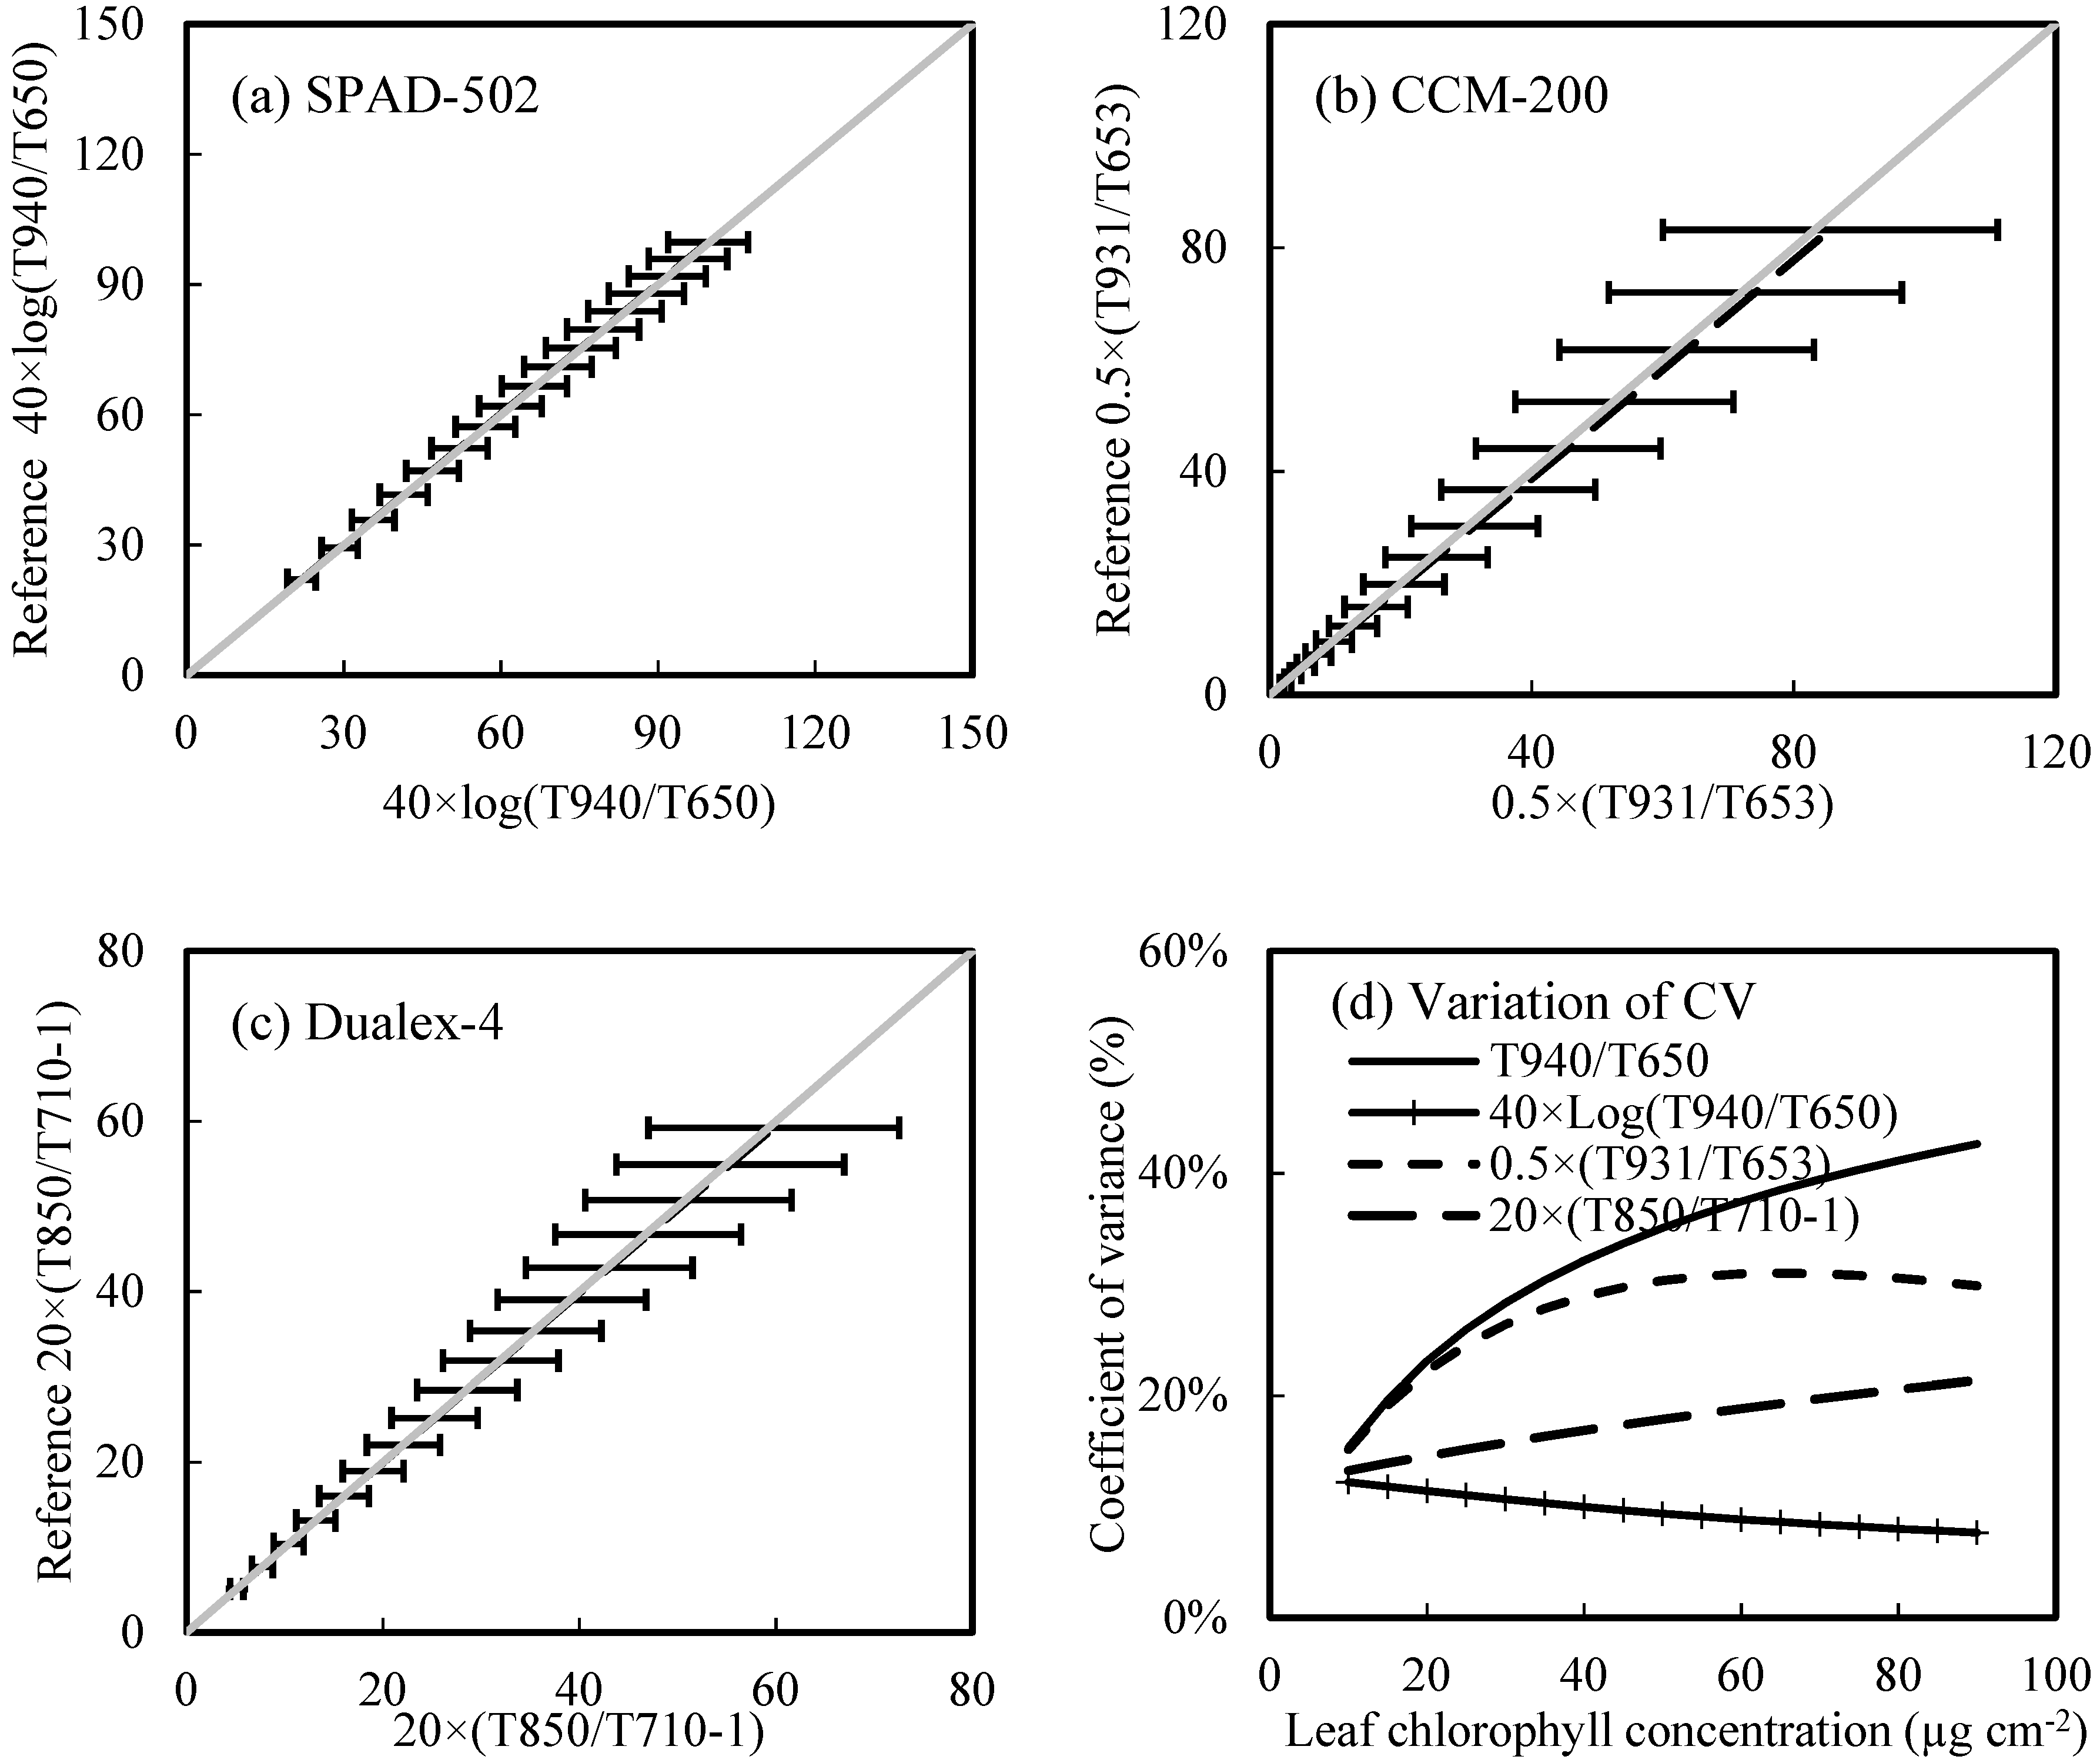
57]. Our study showed that the influence of leaf structure parameters was different on both the reference and the index bands. The influence of the parameters on the index band (710 nm) for Dualex-4-Chl was much greater than for SPAD-502 (650 nm) and CCM-200-CCI (653 nm), while the influence of the parameters on the reference band was comparable for all three PCMs (Table 5). The influence of multiple scattering of light by leaf tissues could be further reduced by taking a simple ratio of NIR to VIS transmittance [26,27,39,58,64]. The ratio of T850/T710 was better to restrict the influence of leaf structure parameters than T940/T650 and T937/T653. The logarithmic function applied to the ratio of 940/650 can restrict the influence of leaf structure parameters, especially at high LChl, and improve the sensitivity to C
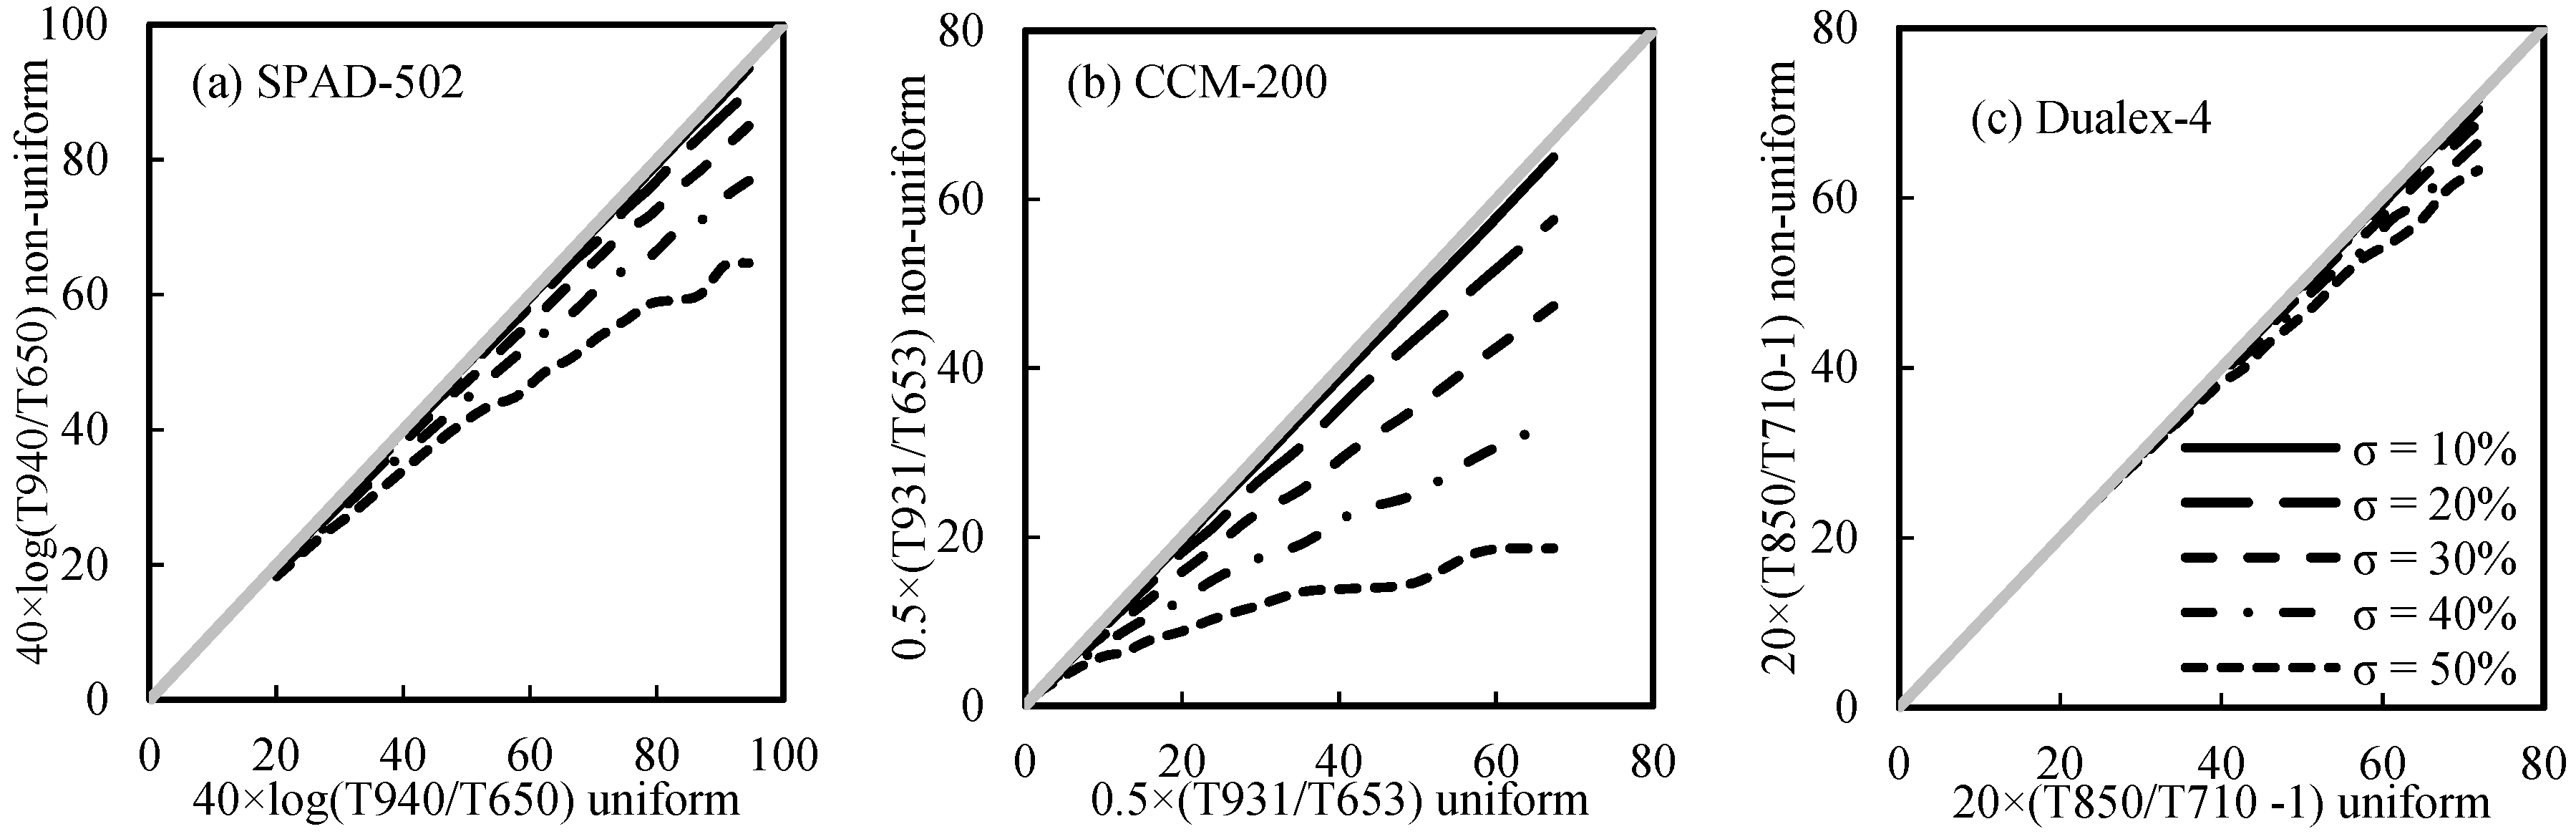
ab. However, the overall ability of the three PCMs to reduce the impacts was limited (<15%), and their difference was small. The non-uniform distribution of LChl within the measured area was another important factor influencing the variation of PCM readings. The sensing area of CCM-200 (71 mm2) is much larger than the sensing area of SPAD-502 (6 mm2) and Dualex-4 (20 mm2), hence CCM-200 can be more susceptible to greater non-uniformity in LChl distribution. In particular, CCM-200-CCI had larger variations at high LChl, compared with SPAD-200 and Dualex-4 (Figure 4), which is consistent with the observations of Padilla et al. [65]. Our simulation, using the method by Uddling et al. [38], showed that CCM-200-CCI was most sensitive to the degree of non-uniformity of the LChl distribution, especially when LChl was high (Figure 7). Increased heterogeneity of LChl distribution across leaf area can result in an increased light transmittance and decreased light absorption at the red wavelengths [38]. Although similar wavelengths are employed in both SPAD-502 and CCM-200-CCI, the variability of SPAD-502 readings is not largely influenced by the heterogeneity distribution of LChl within the measured area. This could be attributed to the logarithmic transformation used in the SPAD-502, which helps reduce the divergence of non-uniform distribution of LChl [39]. Dualex-4-Chl was the best at restricting the influence of the non-uniform LChl distribution. The data in this study showed that the meter readings for both SPAD-502 and CCM-200 had crop-specific relationships with LChl (Figure 4). In particular, the deviations apparently increased at high rates of LChl. In addition, the errors of meter readings within the measured area increased with increasing LChl (Figure 5). The results in both Figure 4 and Figure 5 are more consistent with Figure 7 than with Figure 6, suggesting that uncertainty in PCM readings was more due to non-uniform distribution of LChl than to leaf structure parameters. The studies of Parry et al. [39] and Richardson et al. [30] also showed that the non-uniform distribution of LChl at high LChl had an apparent influence on both SPAD-502 and CCM-200 readings. Previous studies [20,63] found that the heterogeneity of the pigment distribution was greater for leaves with a higher pigment content, as leaves with high chlorophyll concentration tend to have a high chlorophyll density in chloroplasts, rather than develop more chloroplasts [20].
The variations of light intensity can greatly influence chloroplast movement inside a leaf [37,40,43,66]. This can lead to variations of leaf optical properties (reflectance, absorbance and fluorescence) for the same amount of LChl, and therefore difference in PCM readings. Nauš et al. [40] found that the movement of chloroplast from the cell walls perpendicular to the incident light (face position) to the cell walls parallel to the incident light (the side position) could induce approximately 35% of the difference in SPAD-502 readings. Padilla et al. [36] reported that measurement time in day determines light intensity and can have a strong impact on SPAD-502 and CCM-200 readings. The ratio of Chla/Chlb was considered to be an indicator of light intensity that has strong influence on chloroplast movement [56,67]. Strong relationships between the Chla/Chlb ratio and SPAD-502 readings were observed by Netto et al. [67] and Li et al. [63]; however, we did not find similar relationships between the Chla/Chlb ratio and PCM readings in the present study, similar to the result obtained by Parry et al. [39]. The large difference in light conditions between the field and the greenhouse for canola was revealed by the Flav index of Dualex-4 measurements, which was another indicator of light intensity [36,47,56]. In addition, the chloroplast movement is closely linked with the combined effects of light scattering (detour effect) and non-uniform chlorophyll distribution (sieve effect) [40,43,66]. For instance, Nauš et al. [40] reported that the impact of chloroplast movement on the relationship between SPAD readings and actual LChl was different between old and young tobacco leaves with different leaf structures (e.g., leaf area mass and leaf thickness). Our study results indirectly support this finding. In particular, the variability of the CCM-200-CCI readings was greatly affected by both light scattering and non-uniform LChl distribution. More recently, Stuckens et al. [68] developed a Dorsiventral Leaf Model (DLM) to simulate leaf radiative transfer by considering the influence of leaf asymmetry that is modeled by assigning non-uniform distributions of pigments, water and dry matter to palisade and mesophyll layers and by simulating different amounts of light diffusion for adaxial and abaxial leaf surfaces. Baránková et al. [43] developed a Simple Explicitly Non-Linear Empirical model for Leaf Optical Properties (SENLELOP model) to investigate the influence of chloroplast movement on the optical properties of green tobacco leaves. In future studies, a specially designed field experiment integrated with the SENLELOP model, DLM, or other, similar models, could lead to an improved understanding of the mechanistic relationship between optical readings and LChl.

5. Conclusions

In this study, we evaluated the performances of three commonly used portable chlorophyll meters (SPAD-502, CCM-200 and Dualex-4) in measuring the leaf chlorophyll concentration (LChl) of four different crops. Analyses were conducted based on field measurements of four crops (corn, soybean, spring wheat and canola), to explore the relationships between the actual LChl measured in the lab and readings from the portable chlorophyll meters (PCM). Simulation of leaf transmittance using the PROSPECT-D model was used to further explore the driving factors of light transmission on the used wavelengths, including leaf pigments other than chlorophyll, leaf internal structure, and the heterogeneity of LChl distribution. Major conclusions can be drawn as follows:
(1)
SPAD-502 and CCM-200 readings of this study had larger dynamic ranges than Dualex-4 readings. The sources of error for both SPAD-502 and CCM-220 readings increased with increasing LChl, whereas they were relatively stable for Dualex-4;
(2)
Relationships between SPAD-502 and CCM-200 readings and the actual LChl were more sensitive to crop type than the relationships between Dualex-4 and LChl;
(3)
The sieve effect (caused by the heterogeneity of LChl distribution) would have more influence on PCM readings than the detour effect (caused by leaf parameters, such as leaf pigments and leaf internal structure) does. The ratio of light transmittance between the index and reference bands used in the Dualex-4-Chl was generally better at minimizing the interference factors;
(4)
Our results suggest that Dualex-4 is a better choice for collecting LChl measurements for different crops in the field, compared with the SPAD-502 and the CCM-200.

Author Contributions

Conceptualization, J.S. and J.L.; methodology, T.D., J.S., J.M.C., and J.L.; formal analysis, T.D., J.S., J.M.C., J.L. and B.Q.; investigation, T.D., J.S., J.M.C., J.L. and B.Q.; writing—original draft preparation, T.D.; writing—review and editing, all authors (T.D., J.S., J.M.C., J.L., B.Q., B.M., M.J.M., C.Z., Y.L., Y.S., H.P., G.Z.); supervision, J.S., J.M.C., and J.L.; project administration, J.S., and J.M.C.

Funding

This work was supported by Agriculture and Agri-Food Canada’s Lang Productivity (#1130) and Crop Harvest Monitoring (#1313) projects, as well as the Canadian Space Agency grant (#17SUSOARTO).

Acknowledgments

The authors thank the anonymous reviewers for the constructive criticism to improve the quality of the manuscript.

Conflicts of Interest

The authors declare no conflict of interest.

Appendix A

Table A1. Statistics of leaf pigment content measurements by crop type (canola, corn, soybean and spring wheat).
Crop TypesMeanCV (%) aRange (Min–Max) b
Canola (Field, n = 57)Chlorophyll meterSPAD-50253.912.532.8–67.8
CCM-200-CCI47.232.113.4–75.8
Dualex-4-Chl38.715.822.3–58.8
Dualex-4-Flav1.713.31.1–2.0
Dualex-4-Anth0.150.40.0–0.1
Dualex-4-NBI24.123.711.6–36.6
Lab chemical measurementCar (µg cm−2)8.718.74.8–12.0
Chla (µg cm−2)36.418.420.0–52.6
Chlb (µg cm−2)12.019.26.4–16.6
Chla/Chlb ratio3.16.62.7–3.8
LChl (µg cm−2)48.618.426.4–69.2
Canola (Greenhouse, n = 41)Chlorophyll meterSPAD-50241.113.431.8–53.6
CCM-200-CCI23.034.38.7–46.9
Dualex-4-Chl31.221.122.8–52.9
Dualex-4-Flav0.319.30.2–0.5
Dualex-4-Anth0.131.90.0–0.1
Dualex-4-NBI90.712.265.6–122.5
Lab chemical measurementCar (µg cm−2)5.319.43.6–8.3
Chla (µg cm−2)27.614.919.9–40.2
Chlb (µg cm−2)9.616.67.8–15.9
Chla/Chlb ratio2.99.52.2–3.3
LChl (µg cm−2)30.337.011.4–53.2
Corn (n = 52)Chlorophyll meterSPAD-50246.718.425.5–62.2
CCM-200-CCI34.542.620.4–68.2
Dualex-4-Chl39.220.921.1–52.4
Dualex-4-Flav1.422.40.7–1.8
Dualex-4-Anth0.133.40.0–0.2
Dualex-4-NBI30.329.512.4–53.8
Lab chemical measurementCar (µg cm−2)7.722.14.8–10.9
Chla (µg cm−2)38.624.120.8–56.5
Chlb (µg cm−2)9.724.04.6–14.0
Chla/Chlb ratio4.05.83.2–4.6
LChl (µg cm−2)49.025.125.6–70.5
Soybean (n = 25)Chlorophyll meterSPAD-50239.310.231.4–48.3
CCM-200-CCI21.123.812.1–34.7
Dualex-4-Chl35.314.225.0–46.2
Dualex-4-Flav1.478.21.2–1.7
Dualex-4-Anth0.140.70.0–0.1
Dualex-4-NBI24.112.416.8–29.9
Lab chemical measurementCar (µg cm−2)9.811.57.6–11.6
Chla (µg cm−2)41.315.327.2–51.8
Chlb (µg cm−2)12.215.97.7–15.9
Chla/Chlb ratio3.44.43.0–3.8
LChl (µg cm−2)53.215.434.9–67.3
Spring wheat (n = 20)Chlorophyll meterSPAD-50250.810.839.7–59.6
CCM-200-CCI34.523.217.7–47.5
Dualex-4-Chl47.816.931.2–61.0
Dualex-4-Flav1.28.21.1–1.5
Dualex-4-Anth0.148.40.0–0.1
Dualex-4-NBI38.919.625.1–56.6
Lab chemical measurementCar (µg cm−2)10.518.95.5–13.3
Chla (µg cm−2)49.820.626.3–62.8
Chlb (µg cm−2)15.522.99.2–21.1
Chla/Chlb ratio3.26.32.9–3.6
LChl (µg cm−2)64.427.032.3–97.8
a CV (%) is the coefficient of variation, as the ratio of the standard error to the average value (n = 195); b Min and Max are the minimum and the maximum values, respectively.

References

  1. Corti, M.; Cavalli, D.; Cabassi, G.; Marino Gallina, P.; Bechini, L. Does remote and proximal optical sensing successfully estimate maize variables? A review. Eur. J. Agron. 2018, 99, 37–50. [Google Scholar] [CrossRef]
  2. Padilla, F.M.; Gallardo, M.; Peña-Fleitas, M.T.; De Souza, R.; Thompson, R.B. Proximal optical sensors for nitrogen management of vegetable crops: A review. Sensor 2018, 18, 2083. [Google Scholar] [CrossRef] [PubMed]
  3. Dong, T.; Shang, J.; Liu, J.; Qian, B.; Jing, Q.; Ma, B.; Huffman, T.; Geng, X.; Sow, A.; Shi, Y.; et al. Using RapidEye imagery to identify within-field variability of crop growth and yield in Ontario, Canada. Precis. Agric. 2019, 20, 1231–1250. [Google Scholar] [CrossRef]
  4. Croft, H.; Chen, J.M. Leaf Pigment Content. In Comprehensive Remote Sensing; Liang, S., Ed.; Elsevier: Oxford, UK, 2018; pp. 117–142. [Google Scholar]
  5. Blackburn, G.A. Hyperspectral remote sensing of plant pigments. J. Exp. Bot. 2007, 58, 855–867. [Google Scholar] [CrossRef] [PubMed]
  6. Houlès, V.; Guérif, M.; Mary, B. Elaboration of a nitrogen nutrition indicator for winter wheat based on leaf area index and chlorophyll content for making nitrogen recommendations. Eur. J. Agron. 2007, 27, 1–11. [Google Scholar] [CrossRef]
  7. Houborg, R.; Cescatti, A.; Migliavacca, M.; Kustas, W. Satellite retrievals of leaf chlorophyll and photosynthetic capacity for improved modeling of GPP. Agric. For. Meteorol. 2013, 177, 10–23. [Google Scholar] [CrossRef]
  8. Houborg, R.; McCabe, M.F.; Cescatti, A.; Gitelson, A.A. Leaf chlorophyll constraint on model simulated gross primary productivity in agricultural systems. Int. J. Appl. Earth Obs. Geoinf. 2015, 43, 160–176. [Google Scholar] [CrossRef]
  9. Gitelson, A.A.; Peng, Y.; Viña, A.; Arkebauer, T.; Schepers, J.S. Efficiency of chlorophyll in gross primary productivity: A proof of concept and application in crops. J. Plant Physiol. 2016, 201, 101–110. [Google Scholar] [CrossRef]
  10. Zhang, Q.; Cheng, Y.-B.; Lyapustin, A.I.; Wang, Y.; Gao, F.; Suyker, A.; Verma, S.; Middleton, E.M. Estimation of crop gross primary production (GPP): fAPARchl versus MOD15A2 FPAR. Remote Sens. Environ. 2014, 153, 1–6. [Google Scholar] [CrossRef]
  11. Escobar-Gutiérrez, A.J.; Combe, L. Senescence in field-grown maize: From flowering to harvest. Field Crop. Res. 2012, 134, 47–58. [Google Scholar] [CrossRef]
  12. Shah, S.H.; Houborg, R.; McCabe, M.F. Response of Chlorophyll, Carotenoid and SPAD-502 Measurement to Salinity and Nutrient Stress in Wheat (Triticum aestivum L.). Agronomy 2017, 7, 61. [Google Scholar] [CrossRef]
  13. Daughtry, C.; Walthall, C.; Kim, M.; De Colstoun, E.B.; McMurtrey, J. Estimating corn leaf chlorophyll concentration from leaf and canopy reflectance. Remote Sens. Environ. 2000, 74, 229–239. [Google Scholar] [CrossRef]
  14. Féret, J.-B.; Gitelson, A.; Noble, S.; Jacquemoud, S. PROSPECT-D: Towards modeling leaf optical properties through a complete lifecycle. Remote Sens. Environ. 2017, 193, 204–215. [Google Scholar] [CrossRef]
  15. Houborg, R.; McCabe, M.F. Adapting a regularized canopy reflectance model (REGFLEC) for the retrieval challenges of dryland agricultural systems. Remote Sens. Environ. 2016, 186, 105–120. [Google Scholar] [CrossRef]
  16. Drusch, M.; Del Bello, U.; Carlier, S.; Colin, O.; Fernandez, V.; Gascon, F.; Hoersch, B.; Isola, C.; Laberinti, P.; Martimort, P. Sentinel-2: ESA’s optical high-resolution mission for GMES operational services. Remote Sens. Environ. 2012, 120, 25–36. [Google Scholar] [CrossRef]
  17. Shang, J.; Liu, J.; Ma, B.; Zhao, T.; Jiao, X.; Geng, X.; Huffman, T.; Kovacs, J.M.; Walters, D. Mapping spatial variability of crop growth conditions using RapidEye data in Northern Ontario, Canada. Remote Sens. Environ. 2015, 168, 113–125. [Google Scholar] [CrossRef]
  18. Transon, J.; d’Andrimont, R.; Maugnard, A.; Defourny, P. Survey of hyperspectral earth observation applications from space in the sentinel-2 context. Remote Sens. 2018, 10, 157. [Google Scholar] [CrossRef]
  19. Aasen, H.; Honkavaara, E.; Lucieer, A.; Zarco-Tejada, P.J. Quantitative Remote Sensing at Ultra-High Resolution with UAV Spectroscopy: A Review of Sensor Technology, Measurement Procedures, and Data Correction Workflows. Remote Sens. 2018, 10, 1091. [Google Scholar] [CrossRef]
  20. Castelli, F.; Contillo, R.; Miceli, F. Non-destructive Determination of Leaf Chlorophyll Content in Four Crop Species. J. Agron. Crop Sci. 1996, 177, 275–283. [Google Scholar] [CrossRef]
  21. Markwell, J.; Osterman, J.C.; Mitchell, J.L. Calibration of the Minolta SPAD-502 leaf chlorophyll meter. Photosynth. Res. 1995, 46, 467–472. [Google Scholar] [CrossRef]
  22. Lichtenthaler, H.K.; Wellburn, A.R. Determinations of total carotenoids and chlorophylls a and b of leaf extracts in different solvents. Analysis 1983, 603, 142–196. [Google Scholar] [CrossRef]
  23. Minocha, R.; Martinez, G.; Lyons, B.; Long, S. Development of a standardized methodology for quantifying total chlorophyll and carotenoids from foliage of hardwood and conifer tree species. Can. J. For. Res. 2009, 39, 849–861. [Google Scholar] [CrossRef]
  24. Gitelson, A.A.; Gritz, Y.; Merzlyak, M.N. Relationships between leaf chlorophyll content and spectral reflectance and algorithms for non-destructive chlorophyll assessment in higher plant leaves. J. Plant Physiol. 2003, 160, 271–282. [Google Scholar] [CrossRef] [PubMed]
  25. Lichtenthaler, H.K.; Gitelson, A.; Lang, M. Non-destructive determination of chlorophyll content of leaves of a green and an aurea mutant of tobacco by reflectance measurements. J. Plant Physiol. 1996, 148, 483–493. [Google Scholar] [CrossRef]
  26. Datt, B. Remote Sensing of Chlorophyll a, Chlorophyll b, Chlorophyll a+b, and Total Carotenoid Content in Eucalyptus Leaves. Remote Sens. Environ. 1998, 66, 111–121. [Google Scholar] [CrossRef]
  27. Sims, D.A.; Gamon, J.A. Relationships between leaf pigment content and spectral reflectance across a wide range of species, leaf structures and developmental stages. Remote Sens. Environ. 2002, 81, 337–354. [Google Scholar] [CrossRef]
  28. Ciganda, V.; Gitelson, A.; Schepers, J. Non-destructive determination of maize leaf and canopy chlorophyll content. J. Plant Physiol. 2009, 166, 157–167. [Google Scholar] [CrossRef]
  29. Cerovic, Z.G.; Masdoumier, G.; Ghozlen, N.B.; Latouche, G. A new optical leaf-clip meter for simultaneous non-destructive assessment of leaf chlorophyll and epidermal flavonoids. Physiol. Plant. 2012, 146, 251–260. [Google Scholar] [CrossRef]
  30. Richardson, A.D.; Duigan, S.P.; Berlyn, G.P. An evaluation of noninvasive methods to estimate foliar chlorophyll content. New Phytol. 2002, 153, 185–194. [Google Scholar] [CrossRef]
  31. Steele, M.R.; Gitelson, A.A.; Rundquist, D.C. A comparison of two techniques for nondestructive measurement of chlorophyll content in grapevine leaves. Agron. J. 2008, 100, 779–782. [Google Scholar] [CrossRef]
  32. Casa, R.; Castaldi, F.; Pascucci, S.; Pignatti, S. Chlorophyll estimation in field crops: An assessment of handheld leaf meters and spectral reflectance measurements. J. Agric. Sci. 2015, 153, 876–890. [Google Scholar] [CrossRef]
  33. Marenco, R.A.; Antezana-Vera, S.A.; Nascimento, H.C.S. Relationship between specific leaf area, leaf thickness, leaf water content and SPAD-502 readings in six Amazonian tree species. Photosynthetica 2009, 47, 184–190. [Google Scholar] [CrossRef]
  34. Jacquemoud, S.; Baret, F. PROSPECT: A model of leaf optical properties spectra. Remote Sens. Environ. 1990, 34, 75–91. [Google Scholar] [CrossRef]
  35. Féret, J.-B.; François, C.; Asner, G.P.; Gitelson, A.A.; Martin, R.E.; Bidel, L.P.; Ustin, S.L.; Le Maire, G.; Jacquemoud, S. PROSPECT-4 and 5: Advances in the leaf optical properties model separating photosynthetic pigments. Remote Sens. Environ. 2008, 112, 3030–3043. [Google Scholar] [CrossRef]
  36. Padilla, F.M.; de Souza, R.; Peña-Fleitas, M.T.; Grasso, R.; Gallardo, M.; Thompson, R.B. Influence of time of day on measurement with chlorophyll meters and canopy reflectance sensors of different crop N status. Precis. Agric. 2019, 20, 1087–1106. [Google Scholar] [CrossRef] [Green Version]
  37. Higa, T.; Wada, M. Chloroplast avoidance movement is not functional in plants grown under strong sunlight. PlantCell Environ. 2016, 39, 871–882. [Google Scholar] [CrossRef] [PubMed]
  38. Uddling, J.; Gelang-Alfredsson, J.; Piikki, K.; Pleijel, H. Evaluating the relationship between leaf chlorophyll concentration and SPAD-502 chlorophyll meter readings. Photosynth. Res. 2007, 91, 37–46. [Google Scholar] [CrossRef]
  39. Parry, C.; Blonquist, J.; Bugbee, B. In situ measurement of leaf chlorophyll concentration: Analysis of the optical/absolute relationship. Plant Cell Environ. 2014, 37, 2508–2520. [Google Scholar] [CrossRef]
  40. Nauš, J.; Prokopová, J.; Řebíček, J.; Špundová, M. SPAD chlorophyll meter reading can be pronouncedly affected by chloroplast movement. Photosynth. Res. 2010, 105, 265–271. [Google Scholar] [CrossRef]
  41. McClendon, J.H.; Fukshansky, L. On the interpretation of absorption spectra of leaves-II. The non-absorbed ray of the sieve effect and the mean optical pathlength in the remainder of the leaf. Photochem. Photobiol. 1990, 51, 211–216. [Google Scholar] [CrossRef]
  42. McClendon, J.H.; Fukshansky, L. On the interpretation of absorption spectra of leaves–I. Introduction and the correction of leaf spectra for surface reflection. Photochem. Photobiol. 1990, 51, 203–210. [Google Scholar] [CrossRef]
  43. Baránková, B.; Lazár, D.; Nauš, J. Analysis of the effect of chloroplast arrangement on optical properties of green tobacco leaves. Remote Sens. Environ. 2016, 174, 181–196. [Google Scholar] [CrossRef]
  44. Barton, C.V. A theoretical analysis of the influence of heterogeneity in chlorophyll distribution on leaf reflectance. Tree Physiol. 2001, 21, 789–795. [Google Scholar] [CrossRef] [PubMed] [Green Version]
  45. Ustin, S.L.; Gitelson, A.A.; Jacquemoud, S.; Schaepman, M.; Asner, G.P.; Gamon, J.A.; Zarco-Tejada, P. Retrieval of foliar information about plant pigment systems from high resolution spectroscopy. Remote Sens. Environ. 2009, 113, S67–S77. [Google Scholar] [CrossRef] [Green Version]
  46. Goulas, Y.; Cerovic, Z.G.; Cartelat, A.; Moya, I. Dualex: A new instrument for field measurements of epidermal ultraviolet absorbance by chlorophyll fluorescence. Appl. Opt. 2004, 43, 4488–4496. [Google Scholar] [CrossRef]
  47. Overbeck, V.; Schmitz, M.; Tartachnyk, I.; Blanke, M. Identification of light availability in different sweet cherry orchards under cover by using non-destructive measurements with a Dualex™. Eur. J. Agron. 2018, 93, 50–56. [Google Scholar] [CrossRef]
  48. Meyer, S.; Cerovic, Z.G.; Goulas, Y.; Montpied, P.; Demotes-Mainard, S.; Bidel, L.P.R.; Moya, I.; Dreyer, E. Relationships between optically assessed polyphenols and chlorophyll contents, and leaf mass per area ratio in woody plants: A signature of the carbon–nitrogen balance within leaves? Plant Cell Environ. 2006, 29, 1338–1348. [Google Scholar] [CrossRef]
  49. Schepers, J.S.; Blackmer, T.M.; Wilhelm, W.W.; Resende, M. Transmittance and Reflectance Measurements of CornLeaves from Plants with Different Nitrogen and Water Supply. J. Plant Physiol. 1996, 148, 523–529. [Google Scholar] [CrossRef] [Green Version]
  50. Apogee Instruments, I. CCM-200 plus Chlorophyll Meter, Product Manual; Apogee Instruments, Inc.: Logan, UT, USA, 2011. [Google Scholar]
  51. Konica, M. Spad 502 Plus Chlorophyll Meter, Product Manual; Konica Minolta: Chiyoda, Japan, 2011. [Google Scholar]
  52. Raymond Hunt, E.; Daughtry, C.S. Chlorophyll meter calibrations for chlorophyll content using measured and simulated leaf transmittances. Agron. J. 2014, 106, 931–939. [Google Scholar] [CrossRef] [Green Version]
  53. Dong, T.; Liu, J.; Shang, J.; Qian, B.; Ma, B.; Kovacs, J.M.; Walters, D.; Jiao, X.; Geng, X.; Shi, Y. Assessment of red-edge vegetation indices for crop leaf area index estimation. Remote Sens. Environ. 2019, 222, 133–143. [Google Scholar] [CrossRef]
  54. Liu, J.; Pattey, E.; Jégo, G. Assessment of vegetation indices for regional crop green LAI estimation from Landsat images over multiple growing seasons. Remote Sens. Environ. 2012, 123, 347–358. [Google Scholar] [CrossRef]
  55. Houborg, R.; Anderson, M.; Daughtry, C. Utility of an image-based canopy reflectance modeling tool for remote estimation of LAI and leaf chlorophyll content at the field scale. Remote Sens. Environ. 2009, 113, 259–274. [Google Scholar] [CrossRef]
  56. Fritschi, F.B.; Ray, J.D. Soybean leaf nitrogen, chlorophyll content, and chlorophyll a/b ratio. Photosynthetica 2007, 45, 92–98. [Google Scholar] [CrossRef]
  57. Jacquemoud, S.; Verhoef, W.; Baret, F.; Bacour, C.; Zarco-Tejada, P.J.; Asner, G.P.; François, C.; Ustin, S.L. PROSPECT+ SAIL models: A review of use for vegetation characterization. Remote Sens. Environ. 2009, 113, S56–S66. [Google Scholar] [CrossRef]
  58. Serrano, L. Effects of leaf structure on reflectance estimates of chlorophyll content. Int. J. Remote Sens. 2008, 29, 5265–5274. [Google Scholar] [CrossRef]
  59. Larcher, W. Physiological Plant Ecology: Ecophysiology and Stress Physiology of Functional Groups; Springer: Berlin, Germany, 2003. [Google Scholar]
  60. Kouril, R.; Ilík, P.; Naus, J.; Schoefs, B. On the limits of applicability of spectrophotometric and spectrofluorimetric methods for the determination of chlorophyll a/b ratio. Photosynth. Res. 1999, 62, 107–116. [Google Scholar] [CrossRef]
  61. Gitelson, A.; Solovchenko, A. Non-invasive quantification of foliar pigments: Possibilities and limitations of reflectance- and absorbance-based approaches. J. Photochem. Photobiol. B Biol. 2018, 178, 537–544. [Google Scholar] [CrossRef]
  62. Dong, T.; Liu, J.; Qian, B.; Jing, Q.; Croft, H.; Chen, J.; Wang, J.; Huffman, T.; Shang, J.; Chen, P. Deriving maximum light use efficiency from crop growth model and satellite data to improve crop biomass estimation. IEEE J. Sel. Top. Appl. Earth Obs. Remote Sens. 2016, 10, 104–117. [Google Scholar] [CrossRef]
  63. Li, J.; Yang, J.; Fei, P.; Song, J.; Li, D.; Ge, C.; Chen, W. Responses of rice leaf thickness, SPAD readings and chlorophyll a/b ratios to different nitrogen supply rates in paddy field. Field Crop. Res. 2009, 114, 426–432. [Google Scholar]
  64. Gitelson, A.A.; Merzlyak, M.N. Signature analysis of leaf reflectance spectra: Algorithm development for remote sensing of chlorophyll. J. Plant Physiol. 1996, 148, 494–500. [Google Scholar] [CrossRef]
  65. Padilla, F.M.; de Souza, R.; Peña-Fleitas, M.T.; Gallardo, M.; Giménez, C.; Thompson, R.B. Different responses of various chlorophyll meters to increasing nitrogen supply in sweet pepper. Front. Plant Sci. 2018, 9, 1752. [Google Scholar] [CrossRef] [PubMed] [Green Version]
  66. Davis, P.A.; Caylor, S.; Whippo, C.W.; Hangarter, R.P. Changes in leaf optical properties associated with light-dependent chloroplast movements. PlantCell Environ. 2011, 34, 2047–2059. [Google Scholar] [CrossRef] [PubMed]
  67. Netto, A.T.; Campostrini, E.; Oliveira, J.G.d.; Bressan-Smith, R.E. Photosynthetic pigments, nitrogen, chlorophyll a fluorescence and SPAD-502 readings in coffee leaves. Sci. Hortic. 2005, 104, 199–209. [Google Scholar] [CrossRef]
  68. Stuckens, J.; Verstraeten, W.W.; Delalieux, S.; Swennen, R.; Coppin, P. A dorsiventral leaf radiative transfer model: Development, validation and improved model inversion techniques. Remote Sens. Environ. 2009, 113, 2560–2573. [Google Scholar] [CrossRef]
Figure 1. Location of the four sampling fields in the Central Experimental Farm, Ottawa, Ontario, Canada; background satellite imagery (9 June 2018) obtained from the Google Earth Pro.
Remotesensing 11 02706 g001
Figure 2. Mean value and standard value in four crops for Car (a), LChl (b), Chla (c), Chlb, (d) Chla/Chlb ratio (e), SPAD-502 (f), Dualex-4-CCI (g) and CCM-200 (h).
Remotesensing 11 02706 g002
Figure 3. Scatterplots showing the linear relationship between leaf pigments in four different crops for (a) leaf chlorophyll a (Chla) vs. leaf chlorophyll b (Chlb), (b) leaf chlorophyll concentration (Chla+Chla, LChl) vs. leaf carotenoid concentration (Car), (c) Chla vs. Car and (d) Chlb vs. Ca.
Remotesensing 11 02706 g003
Figure 4. Scatterplots showing linear relationships between leaf carotenoid concentration (Car, µ cm−2), leaf chlorophyll concentration (LChl, µ cm−2) and meter readings for SPAD-502, Dualex-4 and CCM-200 in four different crops.
Remotesensing 11 02706 g004
Figure 5. Relationship between meter readings and standard deviation error of measurements for SPAD-502, CCM-200 and Dualex-4; the meter reading was the average value of 4–5 readings of each leaf sample and the standard deviation value was derived from these readings; the standard deviation for SPAD-502 was only recorded for the canola in the Greenhouse.3.5. Factors Affecting Meter Readings.
Remotesensing 11 02706 g005
Figure 6. Uncertainty of the readings (shown by the error bars) due to interference factors other than leaf chlorophyll for the three instruments (ac) and the relative error as a function of leaf chlorophyll concentration (d). The solid gray lines represent the 1:1 relationship (no impact from other factors). Parameters of the PROSPECT-D simulation are given in Table 2.
Remotesensing 11 02706 g006
Figure 7. Influence of non-uniform distribution of leaf chlorophyll concentration on the readings of portable chlorophyll meters: (a) SPAD-502; (b) CCM-200; (c) Dualex-4; the solid gray lines (1:1 line) represent the change of light transmittance under the same amount of leaf chlorophyll concentration with uniform distribution. Parameters of the PROSPECT-D simulation are shown in Table 2.
Remotesensing 11 02706 g007
Table 1. Description of the total number of samples for chlorophyll content measurement in each crop type.
Crop TypeSeeding DateMay 30June 16June 21July 07August 04Total
Experiment 1CornMay 18--19181855
SoybeanMay 12 691025
Spring wheatApril 27--79623
CanolaMay 6 3027Harvested57
Experiment 2 (greenhouse)CanolaMay 23030---60
Total-3030626434220
Table 2. Summary of PROSPECT-D parameters used to simulate leaf transmittance.
VariableConstantRangeStepReference
Leaf structure parameter, Ns1.551.0–2.80.2[35]
Leaf chlorophyll concentration, LChl (µg cm−2)48.3910–805Field collection
Leaf carotenoid concentration, Car (µg cm−2)8.043.6–12.61.0Field collection
Leaf water concentration, Cw (g cm−2)0.01130.004–0.040.004[35]
Leaf dry matter concentration, Cm (g cm−2)0.00530.0017–0.01370.00133[35]
Leaf anthocyanin concentration, Canth (µg cm−2)1.00–14.01.4[14]
Leaf brown pigment, Cbp0.0--[55]
Table 3. Statistics of leaf pigment concentration measurements of four crops (corn, soybean, spring wheat and canola), using three portable chlorophyll meters and lab chemical methods.
LChlTypesMeanCV (%) aMin bMax b
Portable chlorophyll meterSPAD-50246.618.325.567.8
CCM-200-CCI33.146.38.775.8
Dualex-4-Chl 37.422.622.161.0
Dualex-4-Flav1.242.50.22.0
Dualex-4-Anth 0.146.30.00.2
Dualex-4-NBI41.165.311.6122.5
Lab chemical measurementCar (µg cm−2)8.028.03.613.3
Chla (µg cm−2)37.126.019.962.8
Chlb (µg cm−2)11.325.94.621.1
Chla/Chlb ratio3.314.42.24.6
LChl (µg cm−2)48.425.325.683.6
a CV is the coefficient of variation, as the ratio of the standard error to the average value (n = 195); b Min and Max are the minimum and the maximum values, respectively.
Table 4. Regression analysis between readings from the handheld chlorophyll meters (meter reading, (x) and lab-measured leaf carotenoid and chlorophyll concentration (y); RMSE (µg cm−2) is the root–mean–square error.
Handheld Chlorophyll MeterLeaf Chlorophyll ConcentrationLeaf Carotenoid Concentration
RegressionR2RMSERegressionR2RMSE
CanolaSPAD-502y = 0.88x + 1.550.774.51y = 0.21x − 2.780.800.99
CCM-200-CCIy = 0.45x + 27.250.755.93y = 0.11x + 3.300.781.30
Dualex-4-Chly = 1.14x + 4.280.833.86y = 0.26x − 1.520.751.11
CornSPAD-502y = 1.31x − 13.020.903.68y = 0.17x − 0.470.740.93
CCM-200-CCIy = 0.72x + 23.180.815.04y = 0.10x + 4.300.680.99
Dualex-4-Chly = 1.21x + 0.370.696.33y = 0.14x + 1.940.461.27
SoybeanSPAD-502y = 1.91x − 21.710.882.79y = 0.23x + 0.710.680.63
CCM-200-CCIy = 8.53x0.600.843.44y = 3.22x0.370.590.72
Dualex-4-Chly = 1.55x − 1.200.902.56y = 0.18x + 3.450.640.66
Spring wheatSPAD-502y = 10.71e0.04x0.668.88y = 2.54e0.03x0.481.48
CCM-200-CCIy = 4.58x0.760.747.57y = 1.20x0.620.581.28
Dualex-4-Chly =1.52x − 5.570.725.12y = 0.19x + 1.760.521.01
All cropsSPAD-502y = 18.29e0.02x0.489.31y = 0.16x + 0.470.391.75
CCM-200-CCIy = 14.49x0.340.4010.12y = 2.18x0.370.331.88
Dualex-4-Chly = 1.27x + 1.110.746.25y = 0.20x + 0.510.551.48
Table 5. Results of the global sensitivity analysis (GSA). The first order index derived from the GSA represents the contribution of a parameter (Ns, LChl, Car, Cw, Cm and Canth in the first row) to a variable (T650, T653 etc. in the second column), and the interaction effects of all the parameters.
NsLChlCarCwCmCanthInteractions
Index bandT650 (SPAD-502)11.3679.730.000.000.010.008.90
T653 (CCM-200)12.0079.310.000.000.020.008.67
T710 (Dualex-4)42.5755.960.000.000.330.001.14
Reference bandT940 (SPAD-502)95.740.000.000.353.530.000.38
T931 (CCM-200)95.720.000.000.383.520.000.38
T850 (Dualex-4)95.850.000.000.013.750.000.39
RatioT940/T65011.3774.130.000.010.050.0014.44
Log(T940/T650) (SPAD-502)7.5091.680.000.010.030.000.78
(T931/T653) (CCM-200) 10.8179.960.000.020.050.009.16
(T850/T710) (Dualex-4)10.9184.390.000.000.170.004.53
Note: Ns: leaf structure parameter; LChl (µ cm−2): leaf chlorophyll concentration; Car (µ cm−2): leaf carotenoid concentration; Cw (µ cm−2): leaf water concentration; Cm (µ cm−2): leaf dry matter concentration and Canth (µ cm−2): leaf anthocyanin concentration.

