Urban Land Use and Land Cover Classification Using Multisource Remote Sensing Images and Social Media Data

1
Guangdong Provincial Key Laboratory of Urbanization and Geo-simulation, School of Geography and Planning, Sun Yat-sen University, Guangzhou 510275, China
2
School of Resources and Environment, Academician Laboratory for Urban and Rural Spatial Data Mining of Henan Province, Henan University of Economics and Law, Zhengzhou 450000, China
*
Author to whom correspondence should be addressed.
Remote Sens. 2019, 11(22), 2719; https://0-doi-org.brum.beds.ac.uk/10.3390/rs11222719
Submission received: 9 October 2019
/
Revised: 14 November 2019
/
Accepted: 14 November 2019
/
Published: 19 November 2019
(This article belongs to the Special Issue Applications of RS and GIS Integration in Natural Resources and Environmental Science)
Abstract
:Land use and land cover (LULC) are diverse and complex in urban areas. Remotely sensed images are commonly used for land cover classification but hardly identifies urban land use and functional areas because of the semantic gap (i.e., different definitions of similar or identical buildings). Social media data, “marks” left by people using mobile phones, have great potential to overcome this semantic gap. Multisource remote sensing data are also expected to be useful in distinguishing different LULC types. This study examined the capability of combined multisource remote sensing images and social media data in urban LULC classification. Multisource remote sensing images included a Chinese ZiYuan-3 (ZY-3) high-resolution image, a Landsat 8 Operational Land Imager (OLI) multispectral image, and a Sentinel-1A synthetic aperture radar (SAR) image. Social media data consisted of the hourly spatial distribution of WeChat users, which is a ubiquitous messaging and payment platform in China. LULC was classified into 10 types, namely, vegetation, bare land, road, water, urban village, greenhouses, residential, commercial, industrial, and educational buildings. A method that integrates object-based image analysis, decision trees, and random forests was used for LULC classification. The overall accuracy and kappa value attained by the combination of multisource remote sensing images and WeChat data were 87.55% and 0.84, respectively. They further improved to 91.55% and 0.89, respectively, by integrating the textural and spatial features extracted from the ZY-3 image. The ZY-3 high-resolution image was essential for urban LULC classification because it is necessary for the accurate delineation of land parcels. The addition of Landsat 8 OLI, Sentinel-1A SAR, or WeChat data also made an irreplaceable contribution to the classification of different LULC types. The Landsat 8 OLI image helped distinguish between the urban village, residential buildings, commercial buildings, and roads, while the Sentinel-1A SAR data reduced the confusion between commercial buildings, greenhouses, and water. Rendering the spatial and temporal dynamics of population density, the WeChat data improved the classification accuracies of an urban village, greenhouses, and commercial buildings.
1. Introduction
Land use and land cover (LULC) change is an essential component of environmental change [1,2]. The main trend of LULC change over the past few decades is widespread urbanization, which is especially unprecedented in developing countries under rapid population growth and resource consumption [2]. LULC information is the key to various models and applications, such as climate change [3], ecology [4], agriculture [5], and water quality [6]. LULC has become increasingly diverse and complex in urban areas, especially in areas undergoing rapid urban development and renewal. As urban LULC information plays an important role in urban planning, sustainable development, and rational use and development of land resources [7,8], accurate LULC classification in urban areas has become a hot research topic recently.
Land cover (LC) refers to the biophysical properties of the Earth’s surface, whereas land use (LU) denotes the human purpose or intention applied to these attributes [9]. Optical remote sensing data, such as Landsat, have been widely used in LC classification based on the spectral, spatial, and textural characteristics of the observed targets [10]. Synthetic aperture radar (SAR) images have also been used in LC classification [11,12]. LU classification is generally performed on the basis of high-resolution remotely sensed imagery that can clearly show the boundaries of different types of buildings [13]. However, with rapid economic development, urban LULC has become increasingly complex and diverse. High accuracy of LULC classification is difficult to attain using single-source remote sensing data. Some studies have combined optical and SAR data to improve LC classification accuracy [14,15]. Ban et al. [16] used QuickBird multispectral images and RADARSAT SAR data for LC classification and found that the classification accuracy of several LC categories could be improved by more than 19%. The potential of combining multisource remote sensing data for LU classification accuracy, however, remains to be demonstrated.
Although the combination of multisource remote sensing data is promising for improving urban LULC classification accuracy, such a combination still experiences difficulties in classifying urban LU because of the problem of “semantic gap” (i.e., different definitions of similar or identical buildings) [17,18]. The advent of urban big data may provide an unprecedented opportunity to overcome the semantic problem encountered by traditional remote sensing techniques. Urban big data is a massive amount of dynamic and static data generated from the subjects and objects, including various urban facilities, organizations, and individuals, which have been being collected and collated by city governments, public institutions, enterprises, and individuals using a new generation information technologies [19]. Urban big data describe not only the physical domain of real objects (buildings, cars, roads, and so on) but also the social domain of urban residents in real space. Therefore, they have been increasingly used for characterizing different urban spaces.
2. Related Work
Several studies on the use of a variety of urban big data, such as buses, subway card data, taxi data, and points of interest (POIs), have been conducted to depict urban centers and classify different types of buildings [20,21]. Hu et al. [20] used OpenStreetMap, POIs, and Landsat 8 images to identify LU types, and their results provided more details on the spatial pattern compared with those on the LU map issued by the Beijing Municipal Government. Chen et al. [21] assessed the diversity of urban functions at a community level using hourly WeChat user density data, POIs, and QuickBird images with 17,231 building objects and found that heterogeneity existed even in similar urban functional clusters, and concentric spatial structures were present in urban villages that appeared to be disorderly. Purves and Hollenstein [22] found that geo-referenced and tagged metadata on Flickr were associated with eight million images and could be used to explore the community boundaries.
Among various urban big data, social media data indicate people’s mobility and behavior and demonstrate particular advantages in characterizing types of communities and urban spaces. Birkin et al. [23] analyzed 136 keywords from 9323 Twitter users in Leeds and divided the results into six activity and behavior patterns, which were related to different types of communities. Wakamiya et al. [24] used geotagged Twitter data to analyze the temporal and spatial activity patterns of large-scale populations and analyzed the activity characteristics of different urban spaces. Xu et al. [25] proposed an automatic LC classification by using geo-tagged field photos and deep learning, achieving an accuracy of as high as 76.24%. Liu et al. [26] conducted the LU classification of Guangzhou Haizhu District by using nighttime lighting data and microblog data, achieving an overall accuracy of 86.5%.
Although social media data have great potential to address the semantic gap problem challenging traditional remote sensing, limited studies have been conducted to map urban LULC based on the synergy of social media data and remote sensing images, especially multisource remote sensing data. To fill in this gap, this study investigated the capability of combing multisource remote sensing images with social media data for urban LULC classification and examined the contribution of each data set to the classification. Urban LULC classification was performed by combining a Chinese ZiYuan-3 (ZY-3) high-resolution image, a Landsat 8 Operational Land Imager (OLI) multispectral image, a Sentinel-1A SAR data, and WeChat user density data. The urban LULC types included vegetation, bare land, road, water, urban village, greenhouses, and residential, commercial, industrial, and educational buildings. An object-based classification method was proposed for the LULC classification. First, a multiresolution segmentation technique was performed on the ZY-3 high-resolution image to delineate land parcels. Second, decision tree algorithms were used to select the optimal features from the combined data for urban LULC classification. Third, the final classification was conducted using random forest algorithms based on the selected features. The LULC classification results obtained with different combinations of data sets were assessed and discussed, and concluding remarks were then provided.
3. Study Area and Data
3.1. Study Area
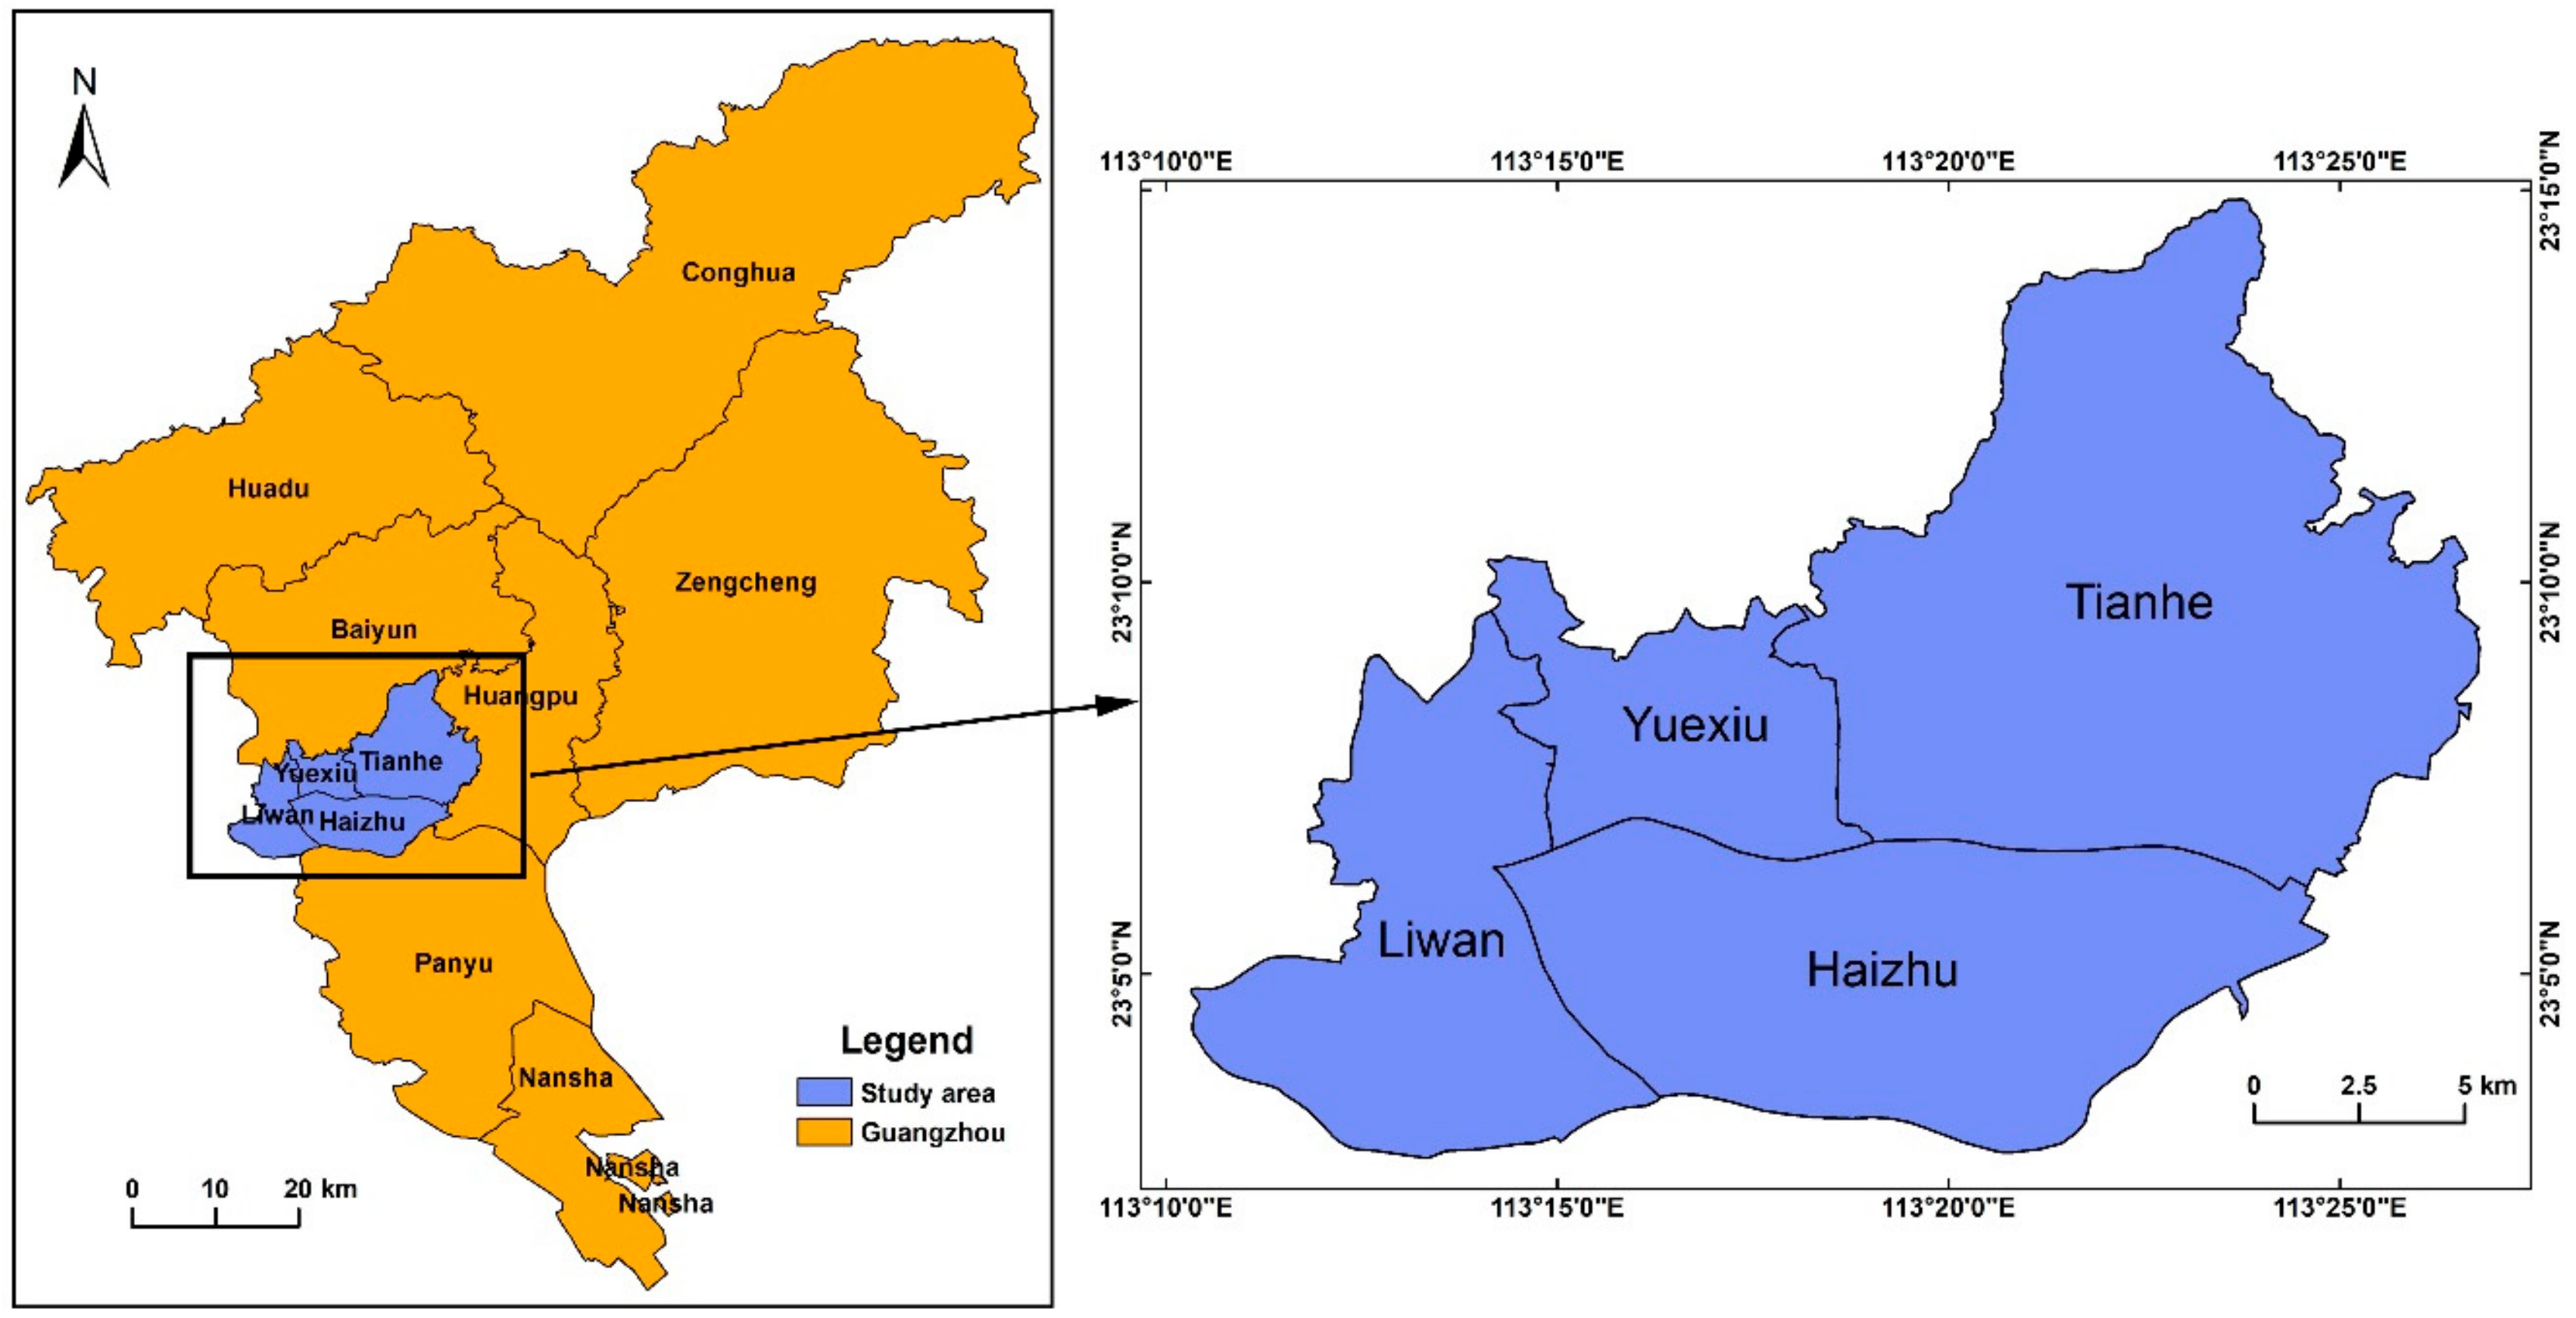
This study focused on the urban center of Guangzhou, which is the gateway city of South China. The urban center of Guangzhou includes the Yuexiu, Tianhe, Haizhu, and Liwan districts (Figure 1). The area of the urban center is 279.63 km2, and the population is 5,237,900 [27]. Compared with the other regions of Guangzhou, the urban center features more various LULC types and higher population density. Therefore, this area is an ideal site for exploring the potential of multisource remote sensing images and social media data in LULC classification.
3.2. Remote Sensing and Social Media Data
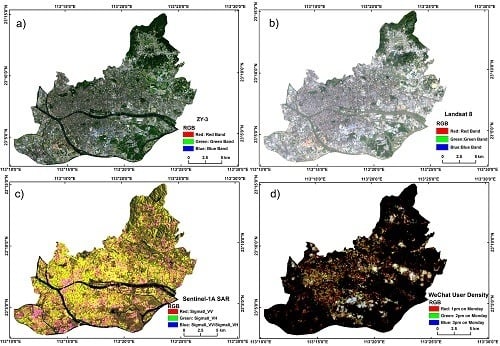
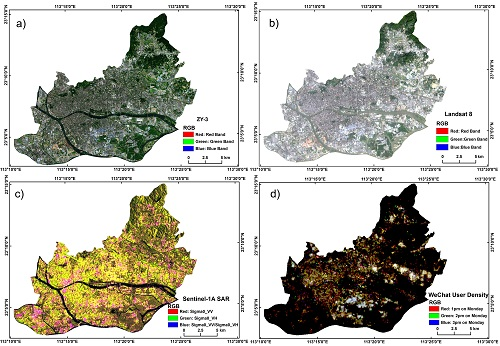
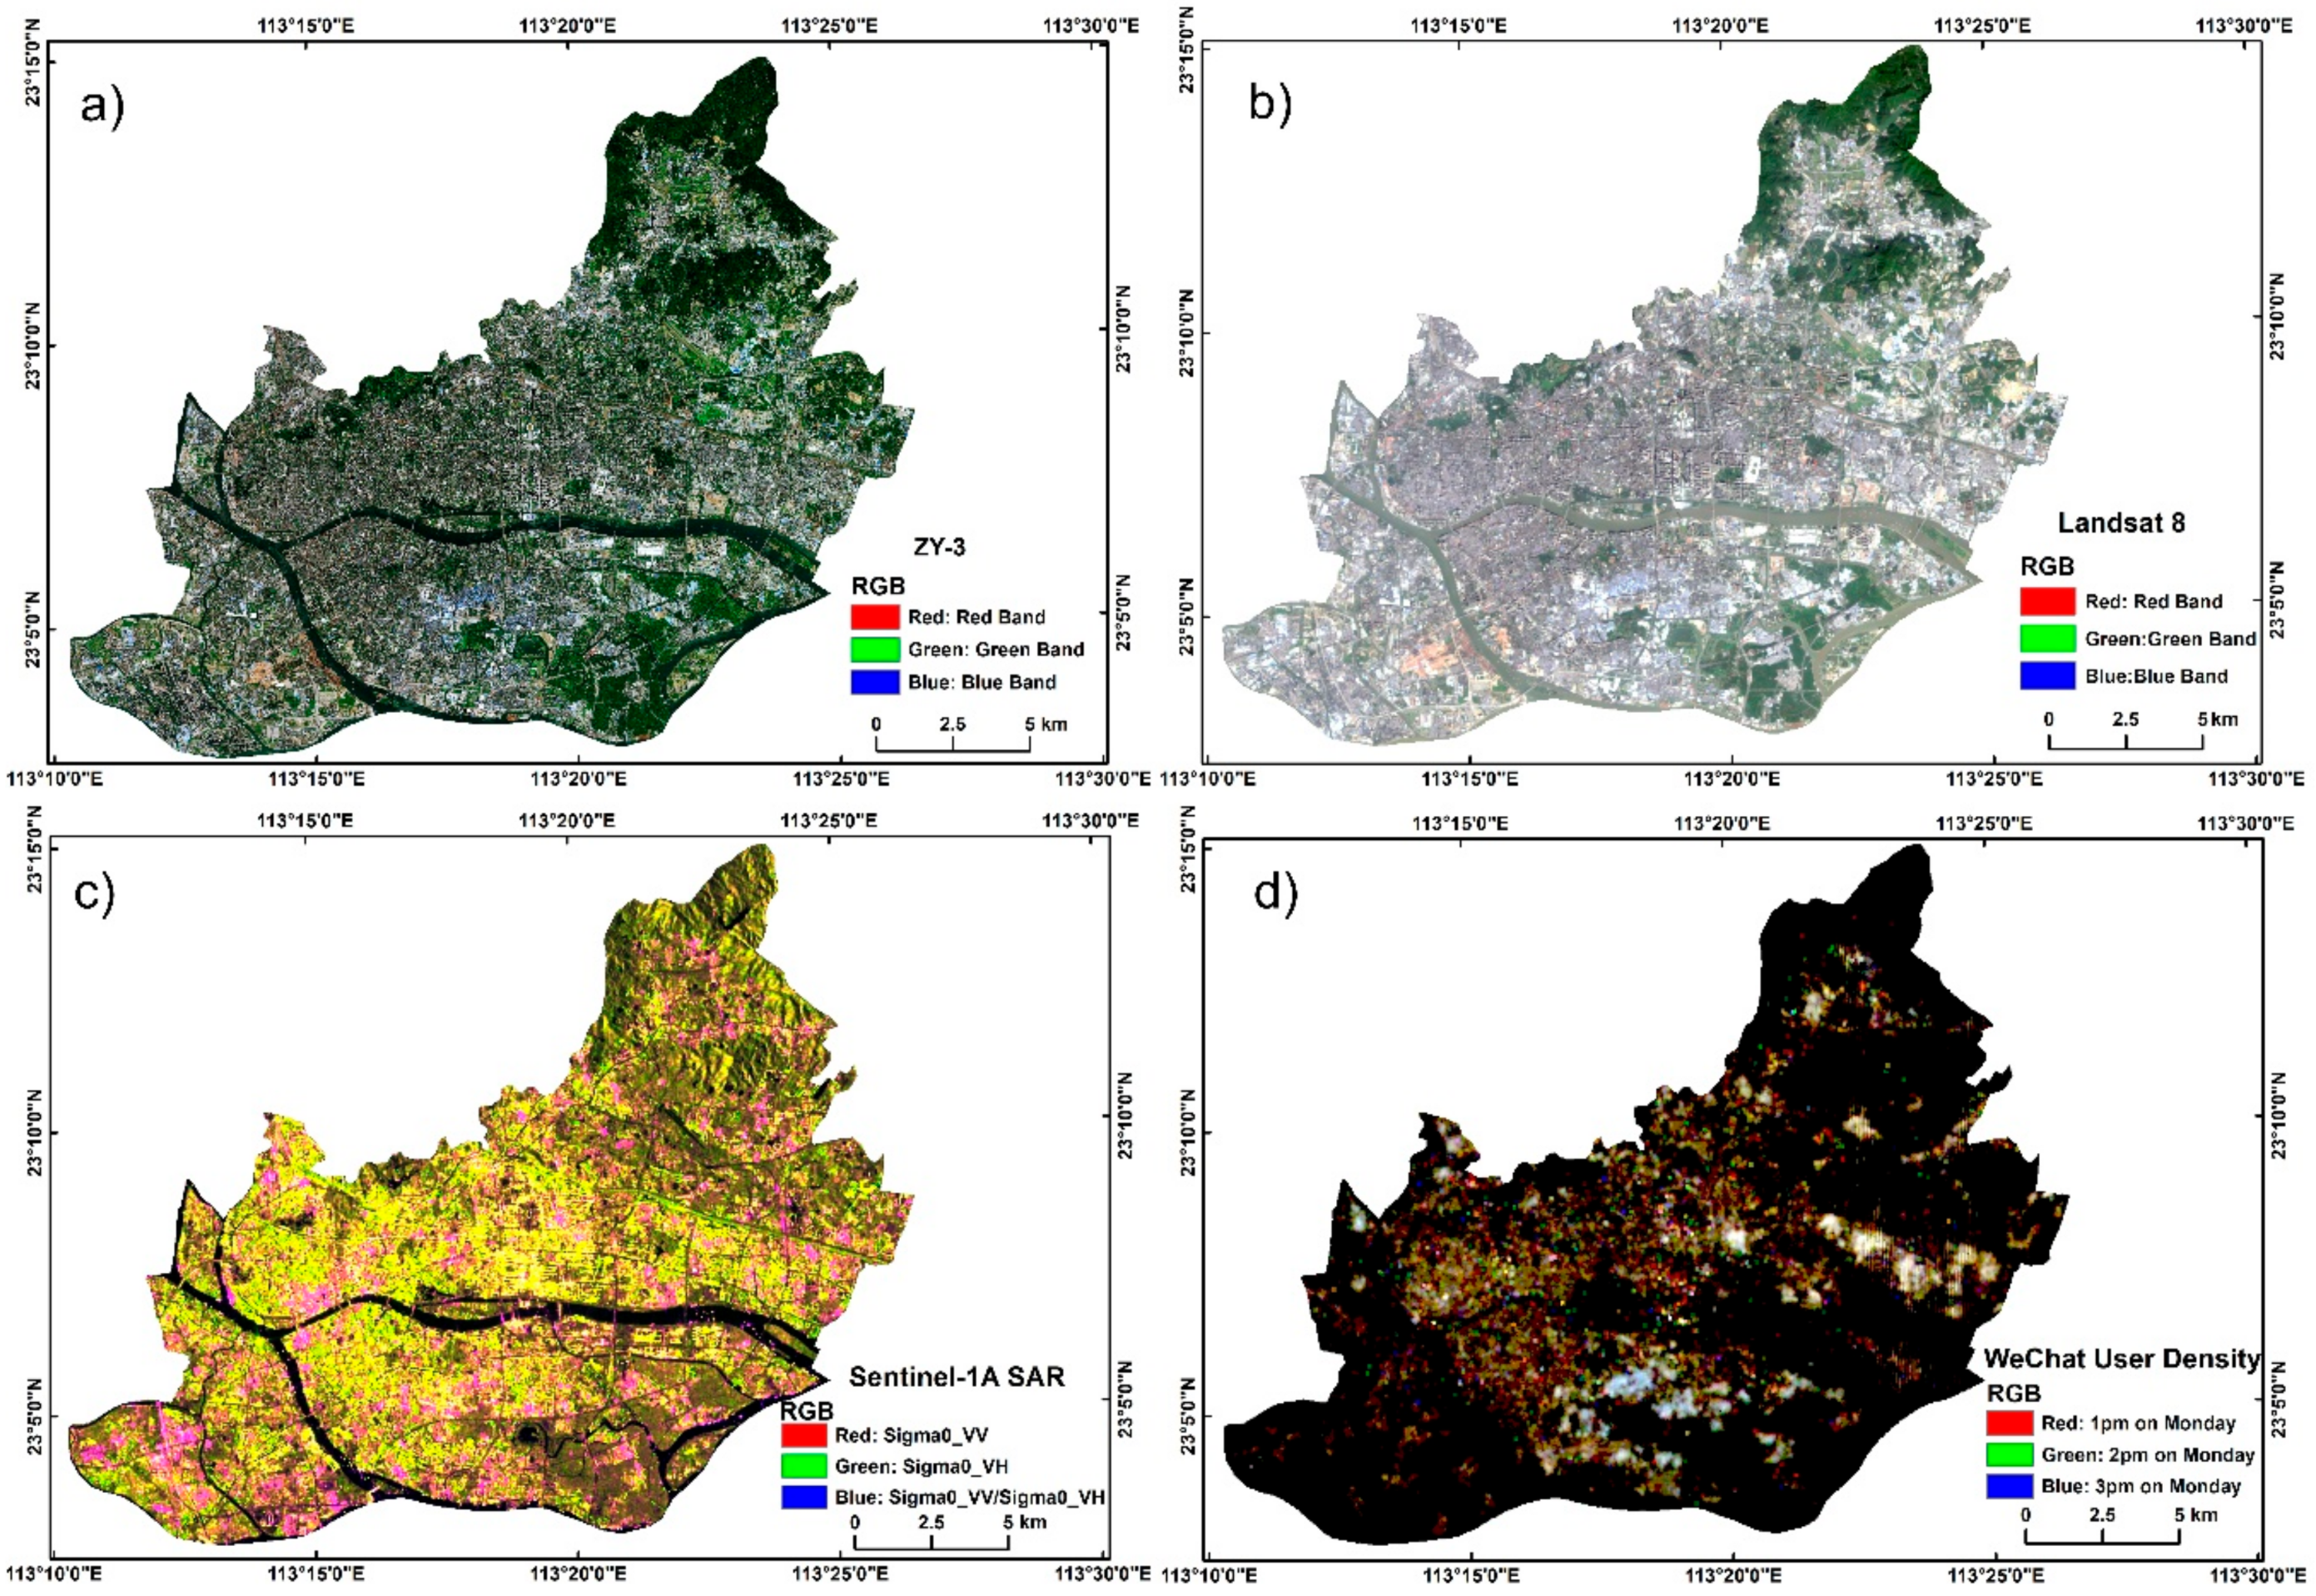
This study used four data sets, including a high-resolution ZY-3 image, a Landsat 8 OLI multispectral image, a Sentinel-1A SAR image, and WeChat user density data, for urban LULC classification (Figure 2). All the data sets were collected in 2015 with a time difference of less than half a year, during which the LULC in the study area slightly changed. Table 1 lists the main specifications of the four data sets. The ZY-3 image was acquired on April 14, 2015. It consisted of three bands, namely, red, green, and blue, with a spatial resolution of approximately 3 meters. The Landsat 8 image was acquired on October 18, 2015, consisting of 7 multispectral bands with a spatial resolution of 30 meters and 1 panchromatic band with a spatial resolution of 15 meters. This study only used the multispectral bands of the Landsat 8 image. Sentinel-1A carries an advanced C-band SAR sensor that can transmit and receive vertical (V) and horizontal (H) polarizations. The Sentinel-1A SAR image was obtained on June 27, 2015 and included two channels that corresponded to VV and VH polarizations. The resolution of the SAR image was 10 meters [28].
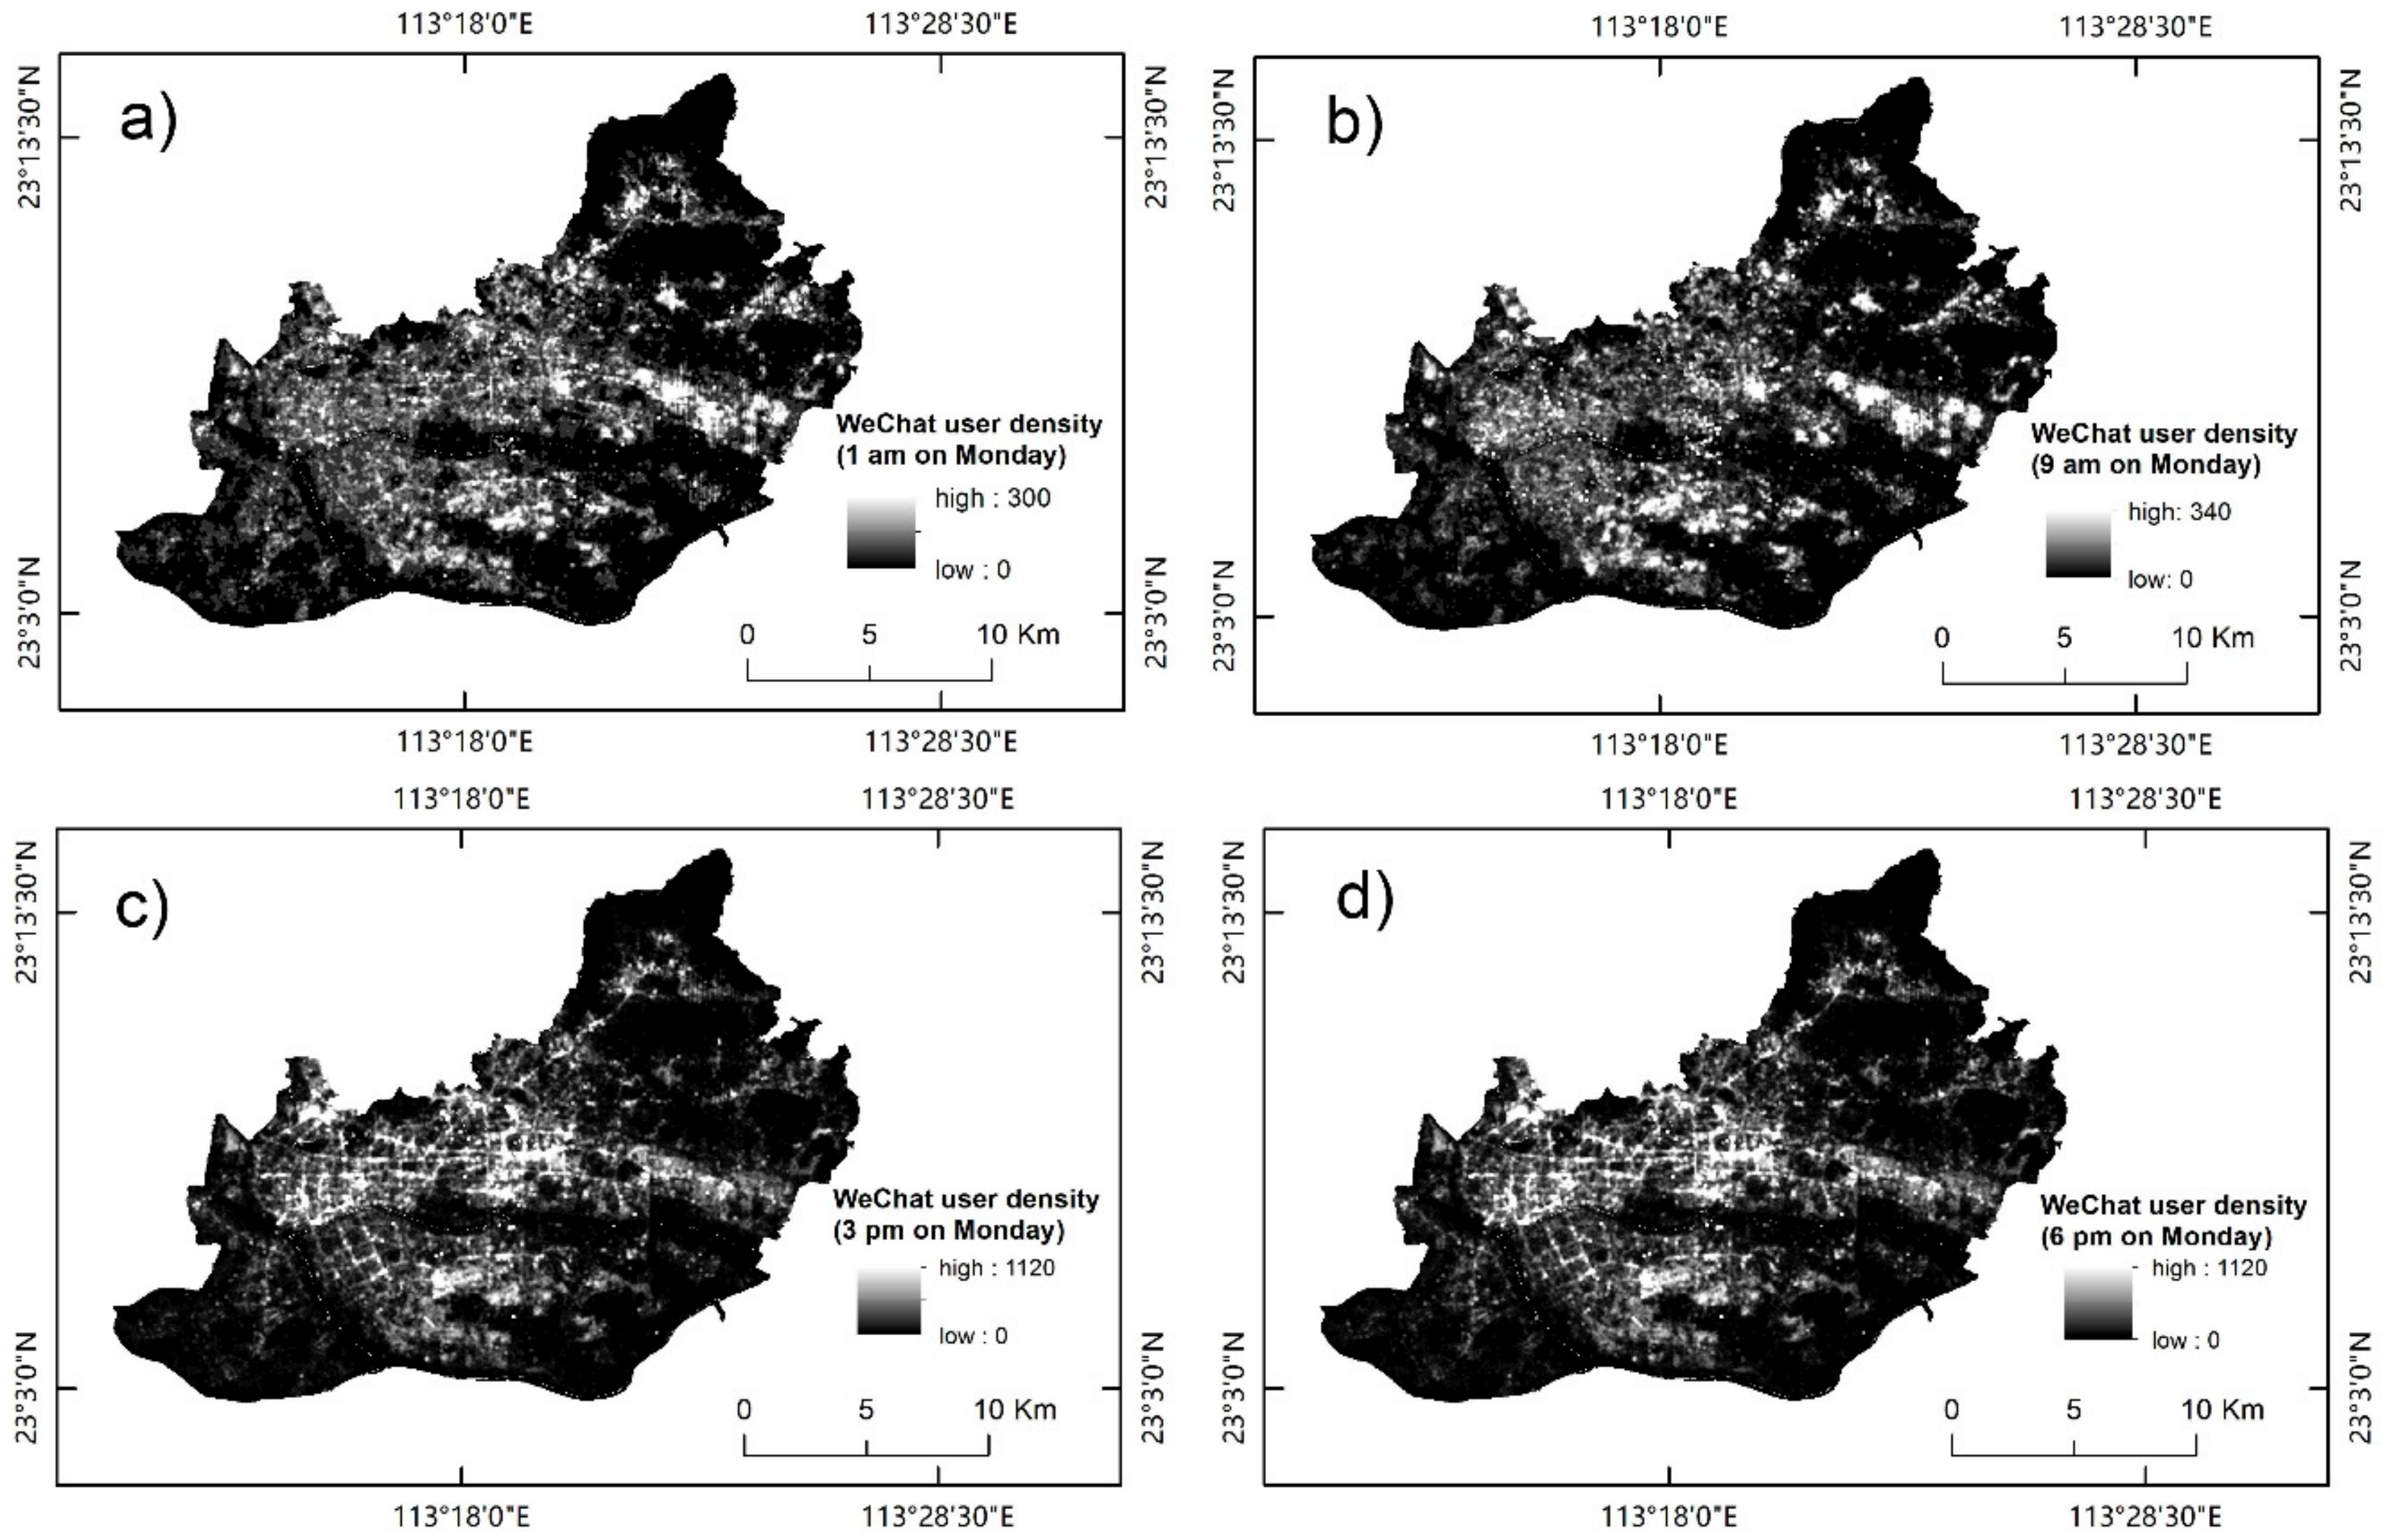
WeChat is a ubiquitous messaging and payment app in China, with more than one billion people registered and 700 million active users. WeChat can automatically record and upload the locations of users to its servers without requiring any manual operation. Therefore, users cannot fabricate their locations. However, such locations cannot be collected if the users switch off their smartphones. The private information of WeChat users is confidential. Thus, individuals who change their settings and become invisible cannot be identified. Based on the user location data, WeChat provides location-based services. One of the popular location-based services is an online real-time user density map, from which we obtained the data for this study. The online map has a raster format with a spatial resolution of 25 meters, and the value of each cell indicates the relative number of users in the actual area corresponding to this cell. This study used a web-based crawler to obtain data from the online user density map based on the Easygo application program interface provided by WeChat [29]. The obtained data were points corresponding to the cells of the WeChat user density map. These points contained information on the time, location, and a relative number of users. Hourly WeChat user density data were collected for a week (from June 15 to 21, 2015). Kernel density analysis was performed to produce raster images based on these point data. Eventually, an image with a total of 168 channels (24 hours for 7 days) and a spatial resolution of 25 meters was created for this study (Figure 3). This image could indicate the temporal and spatial variation of population density, given that WeChat is used by most people in the study area.
3.3. Ground Truth Data
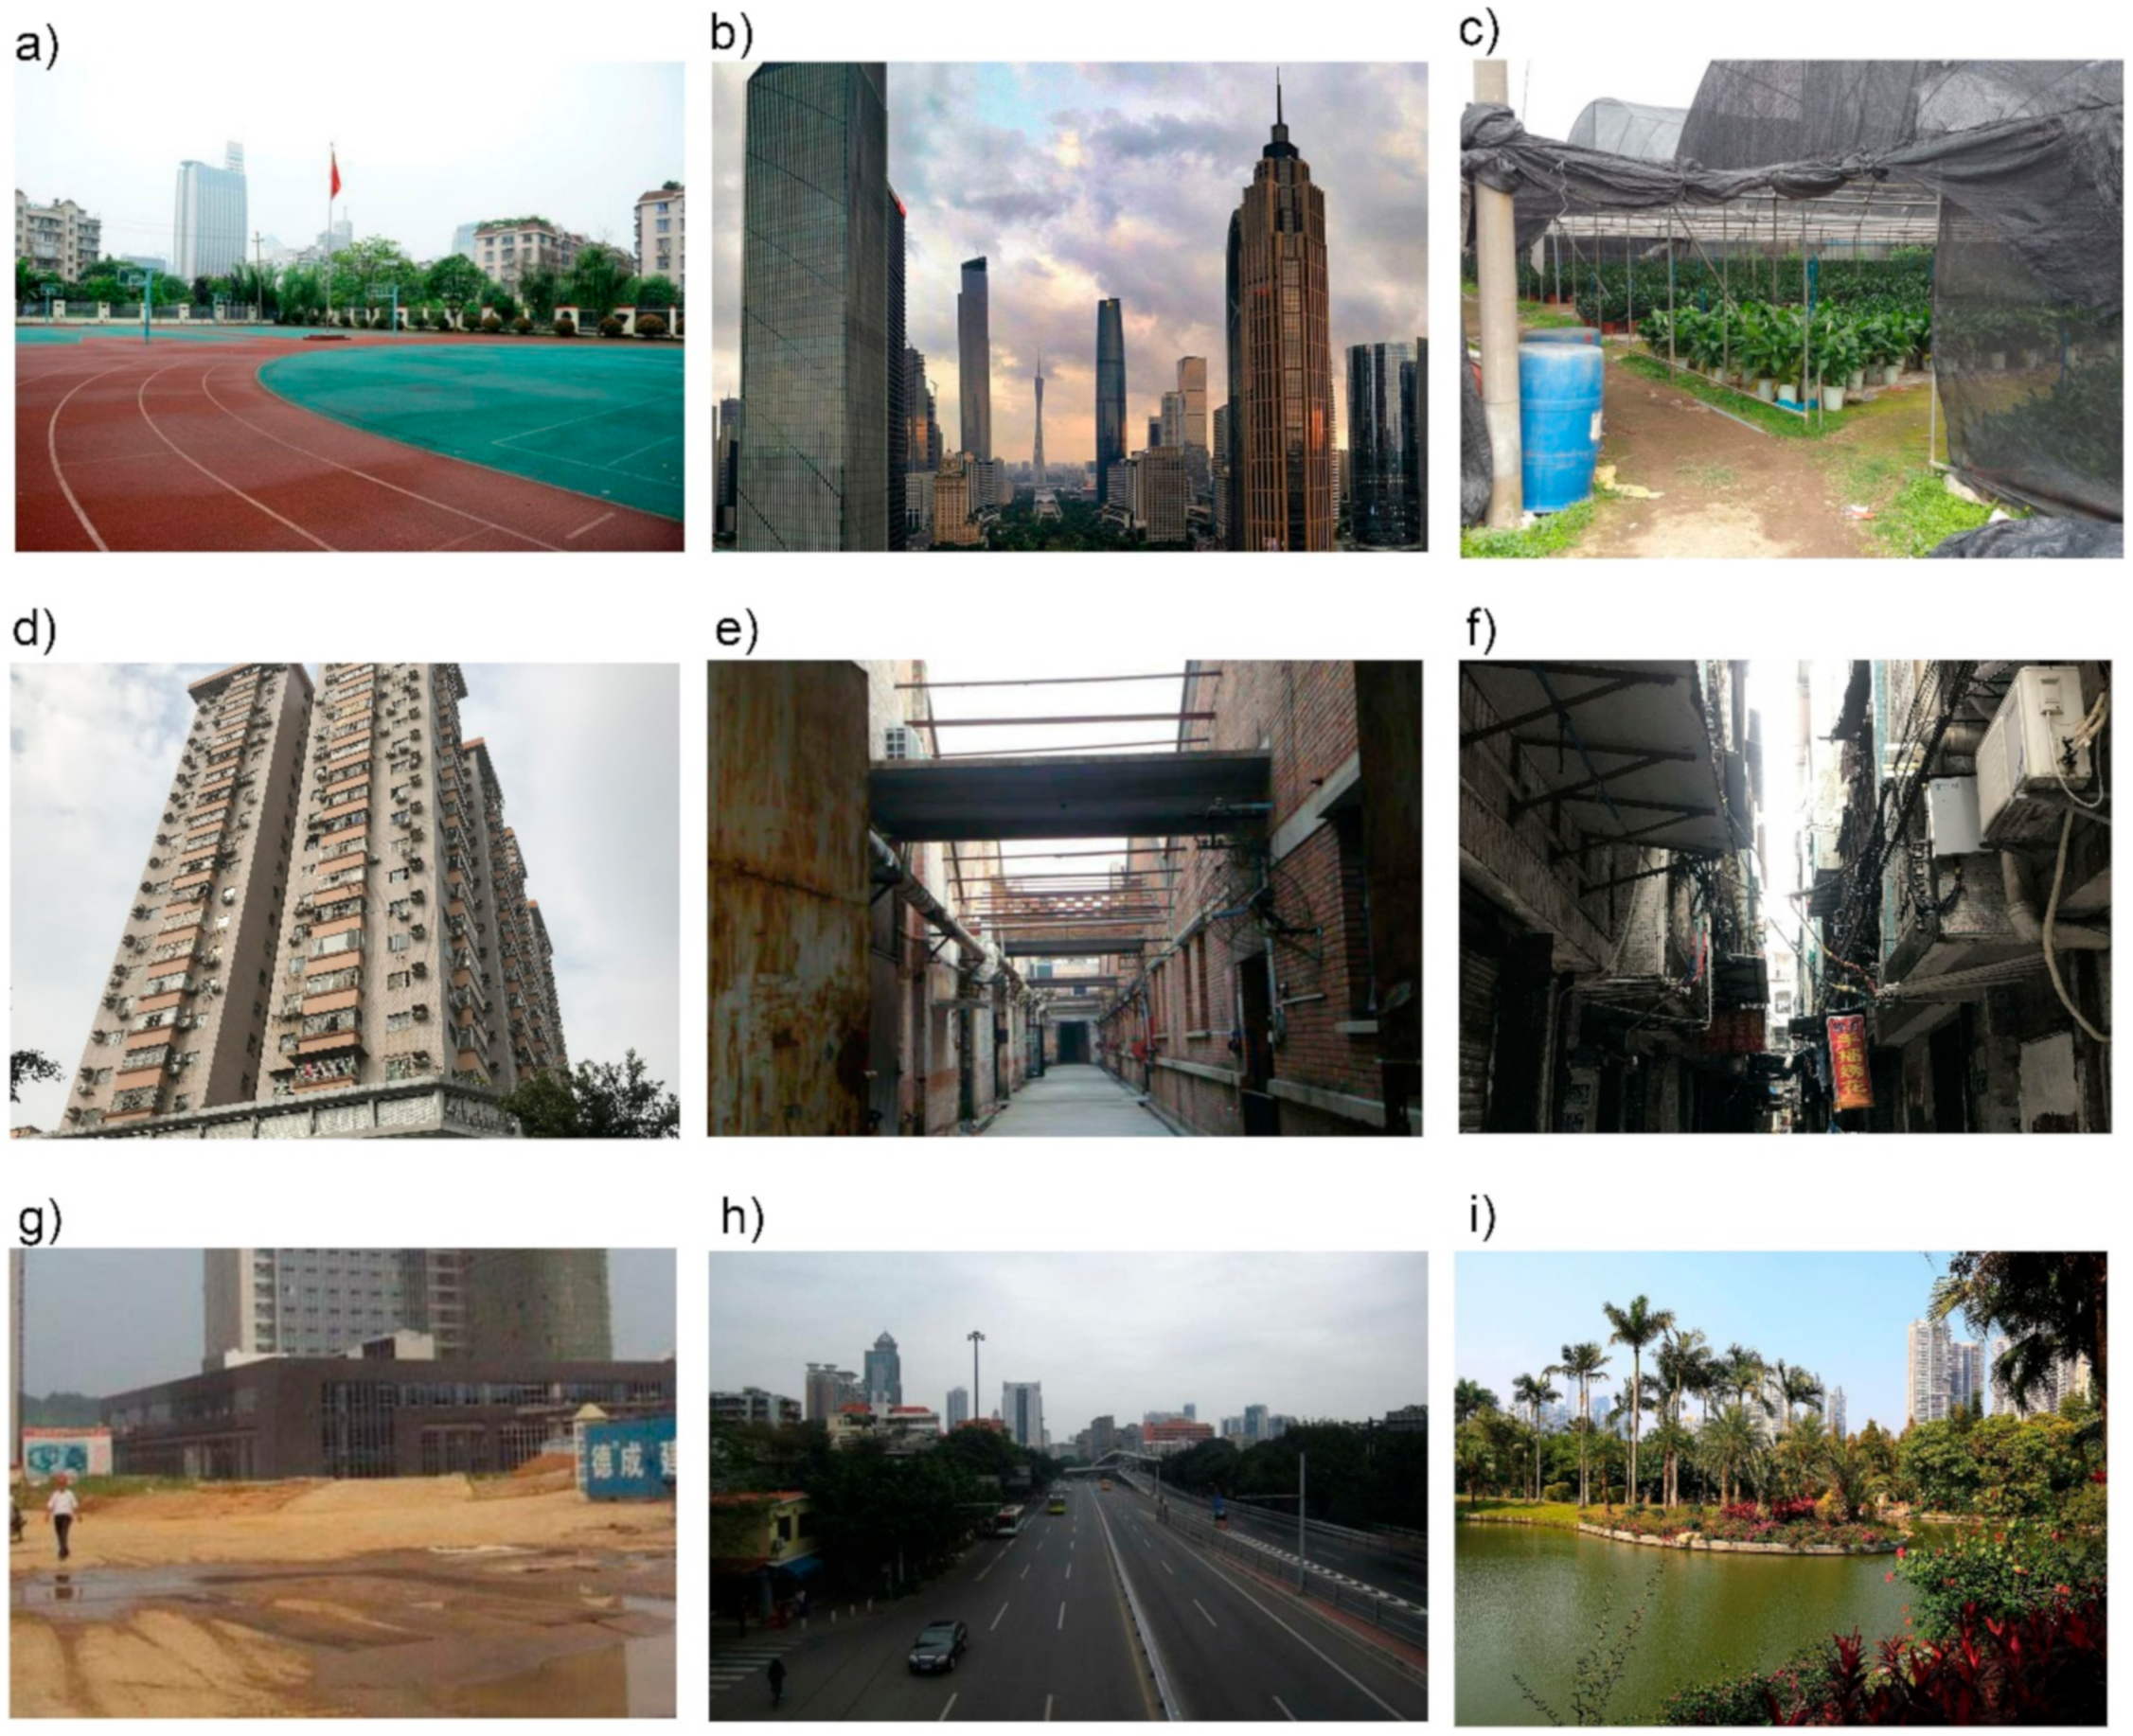
The urban LULC types in the study area were categorized into 10 types, which were vegetation, bare land, road, water, urban village, residential building, commercial building, industrial building, educational building, and greenhouses (Table 2). An urban village is a unique phenomenon in rapidly urbanizing areas in China. It is characterized by a large building area, a high-volume ratio, and a large amount of mixed public space, which is a special urban scene. Residential buildings refer to unit and apartment houses. Commercial buildings refer to sites occupied by commercial, tourism, and recreational activities, such as shopping malls, office buildings, theaters, and clubs. Industrial buildings are industrial production and ancillary facilities for direct industrial production services. Educational buildings refer to buildings and support facilities required for education, including elementary schools, junior high schools, and university campuses. Greenhouses are mainly set up for the flower cultivation in the Liwan District of Guangzhou. Samples were selected across the typical LULC classes through the visual interpretation of high-resolution Google Earth images and filed investigation. Sample plots were delineated from the ZY-3 image on the basis of the visual interpretation of high-resolution Google Earth images. Subsequently, fieldwork was conducted on November 10, 2018, to verify the sample plots of the different building types (i.e., urban village, residential, commercial, industrial, and educational buildings) (Figure 4). We interviewed local people about the historical change of each sample site to ensure that only those that did not undergo change during 2015–2018 were selected as samples. Finally, a total of 1823 samples were selected on the basis of the cluster sampling method [30] (Figure 5). The number of samples of each LULC type was approximately 200, except for greenhouses, commercial buildings, and educational buildings, which were less than the other LULC classes in the study area. All samples were randomly divided into two groups for training and verification purposes (Table 2).
4. Methodology
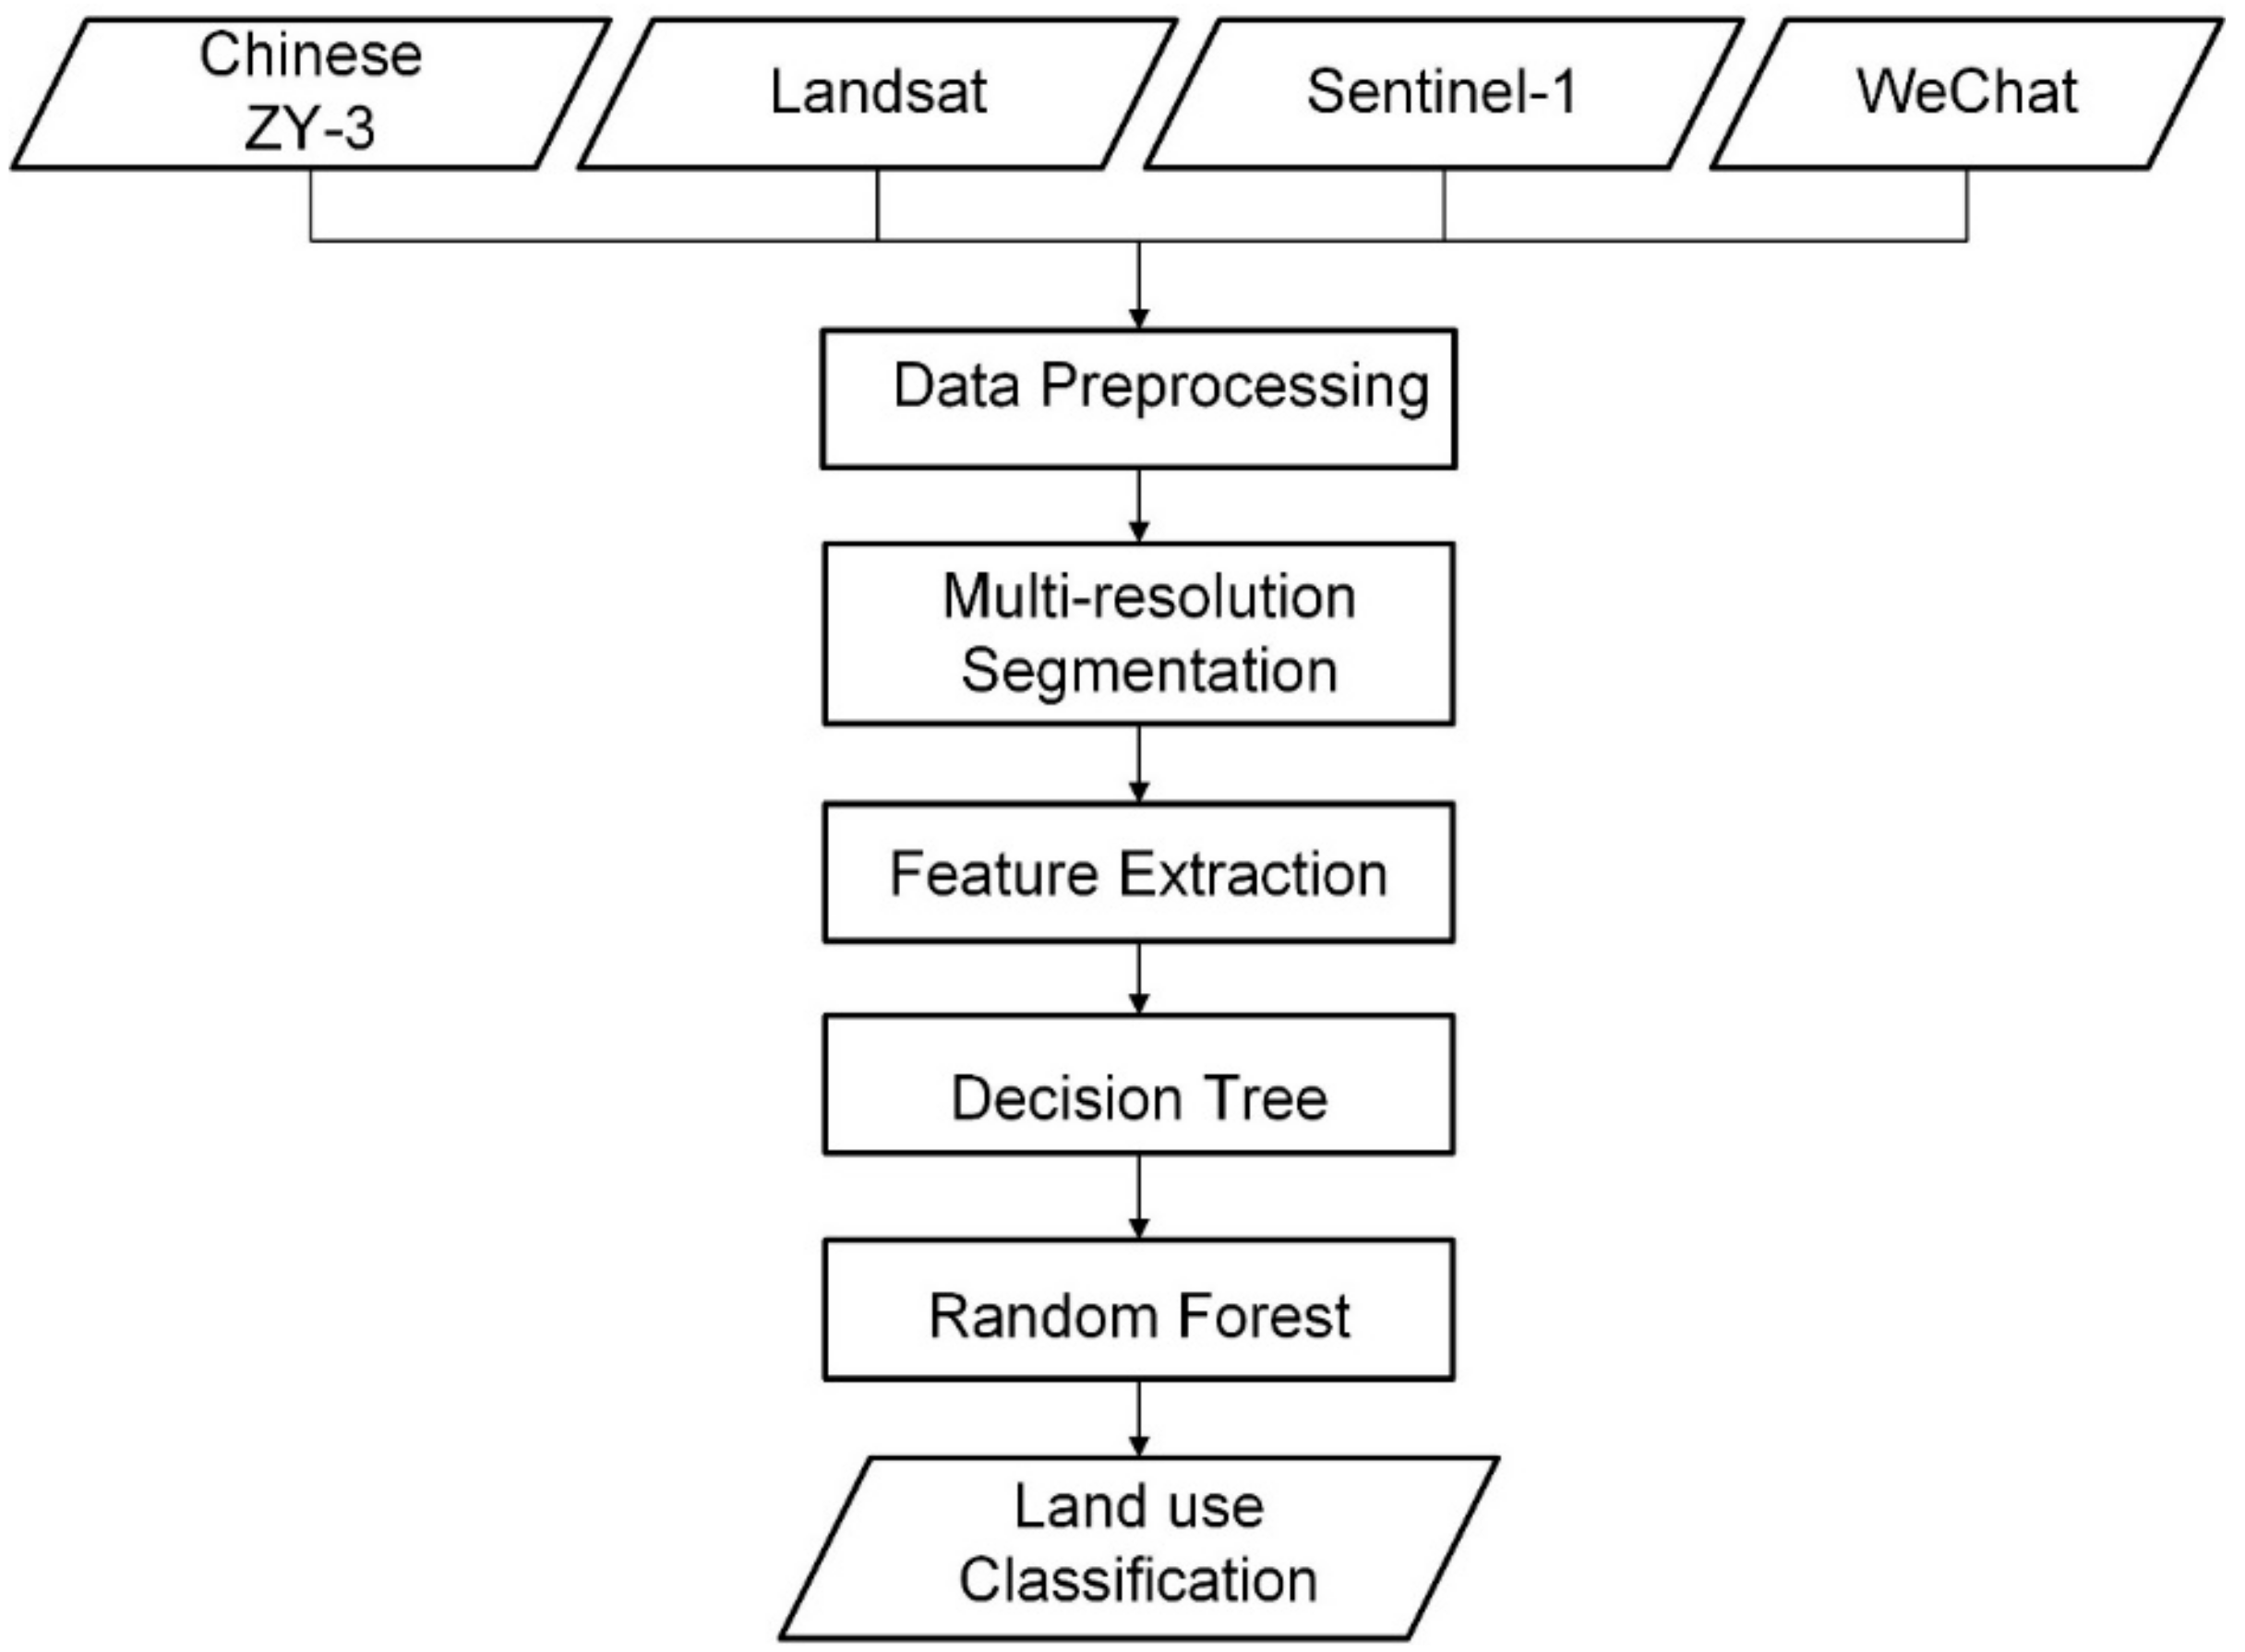
A method integrating object-based image analysis, decision tree algorithms, and random forest algorithms was used for LULC classification on the basis of the combination of multisource remote sensing data and WeChat data. As shown in Figure 6, the method mainly consisted of four steps, namely, (1) multiresolution segmentation of ZY-3 high-resolution image to delineate land parcels, (2) extraction of various features from all the data sets for the land parcels, (3) feature selection using decision tree algorithms, and (4) LULC classification using random forest algorithms.
4.1. Data Preprocessing
The preprocessing of Landsat 8 data included radiation correction and atmospheric correction. After converting the values recorded by the sensor into absolute radiance, the dark pixel method was used for atmospheric correction. The SAR image preprocessing mainly included radiometric calibration, image filtering, and terrain correction, which were performed with the SNAP software [31]. The purpose of the radiometric calibration was to convert the original digital number (DN) values of SAR images into backscattering coefficients, which were only associated with the backscattering characteristics of the observed targets. The inherent coherent noise in SAR images affects the quality of the image and image classification. The Lee sigma filter was used to remove the coherence noise because it could preserve subtle details of the ground objects [32]. Radar remote sensing is based on side-view imaging. Thus, the image distortion is larger when the distance sensor is farther. This study used the Shuttle Radar Topography Mission (SRTM) digital elevation model to perform distance Doppler topographic correction to compensate for the geometric distortion caused by the terrain changes or sensor tilt.
4.2. Object-Based Image Analysis
An object-based approach was used for the LULC classification that was based on multisource remote sensing images and WeChat data. The main advantages of object-based classification included not only the extraction and utilization of various textural and geometric features to support the classification but also the suppression of the speckle noise in the SAR image [11]. In addition, the classification was based on land parcels instead of pixels; thus, it was suitable for images with different spatial resolutions [33,34,35]. The delineation of land parcels was essential for object-based LULC classification. The multiresolution segmentation algorithm [33] was used to delineate land parcels from the ZY-3 image, which possessed the highest spatial resolution among all the remote sensing images and clearly depicted the boundaries of different land parcels at a building scale (Figure 7). In this study, all the LULC classifications were performed on the basis of the land parcels delineated from the ZY-3 image.
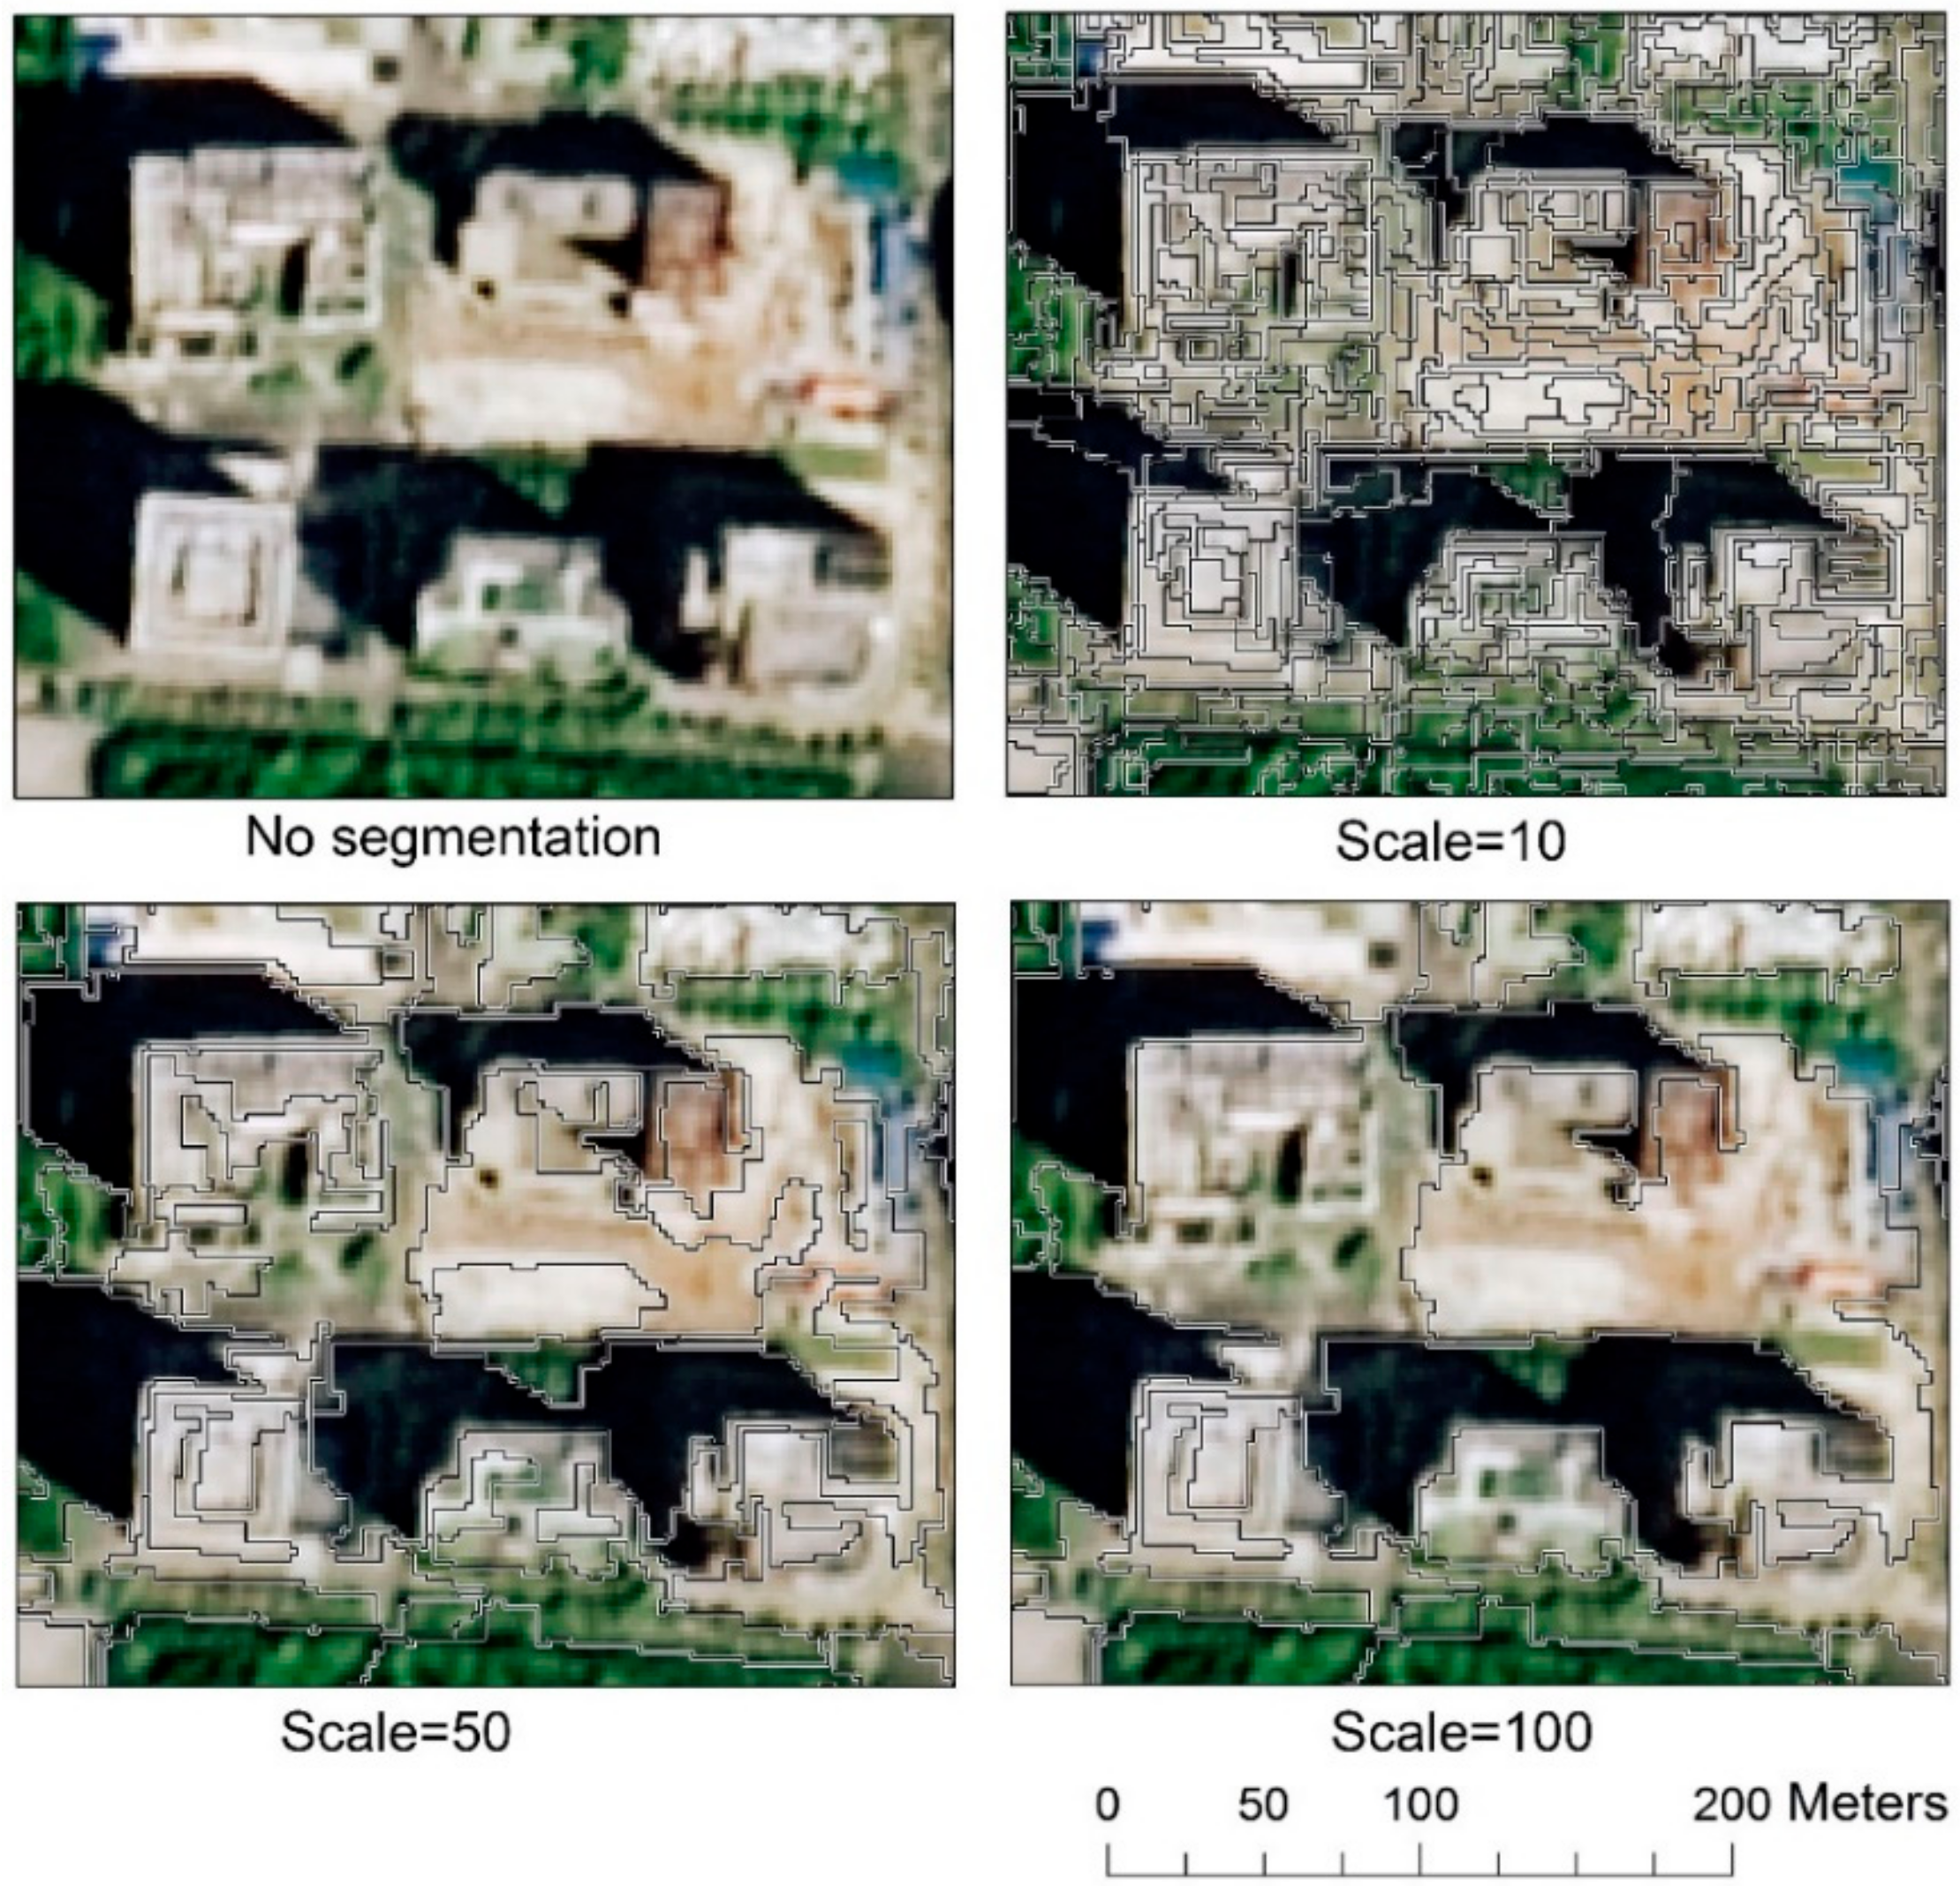
The multiresolution segmentation algorithm is a bottom-up optimization processing algorithm, during which adjacent objects are merged continuously and the defined heterogeneity is minimally increased. When the minimum growth exceeds the threshold defined by the scale parameter, the segmentation stops [12,33]. This study adopted the trial-and-error strategy and human visual interpretation to find the optimal scale parameter [34]. The segmentation results obtained with the different scale parameters are shown in Figure 7. When the scale parameter was 10, a building was split into multiple objects. When the scale parameter was 100, different land parcels were merged into one object. When the scale parameter was set as 50, land parcels were delineated accurately. For example, the buildings under construction and bare land, shown in Figure 7, were accurately delineated at a scale parameter of 50. Therefore, this study performed multiresolution segmentation with a scale parameter of 50.
Various features were extracted from the multisource remote sensing images and WeChat data for land parcels by using the eCognition software. The primary features were the mean values extracted from all the image channels. The mean value of the image object at an image channel is given by the following:
where is the mean value of the image object, is the pixel value of the ith pixel in the object, and n represents the total number of pixels in the object.
The textural information in high-resolution remote sensing images can improve LULC classification accuracy [31,34]. Textural features extracted based on gray-level co-occurrence matrix (GLCM) are commonly used for image classification [35,36,37]. Therefore, we extracted seven gray-level co-occurrence matrix (GLCM) features from the ZY-3 image, namely, homogeneity, contrast, dissimilarity, entropy, mean, StdDev, and correlation for LULC classification.
Geometry features, such as area, length/width, density, asymmetry, and shape index, were also extracted from land parcels to support LULC classification. The shape index is defined as follows:
where l is the boundary length of the object, and a is the area of the object.
4.3. Feature Selection Using Decision Tree Algorithms
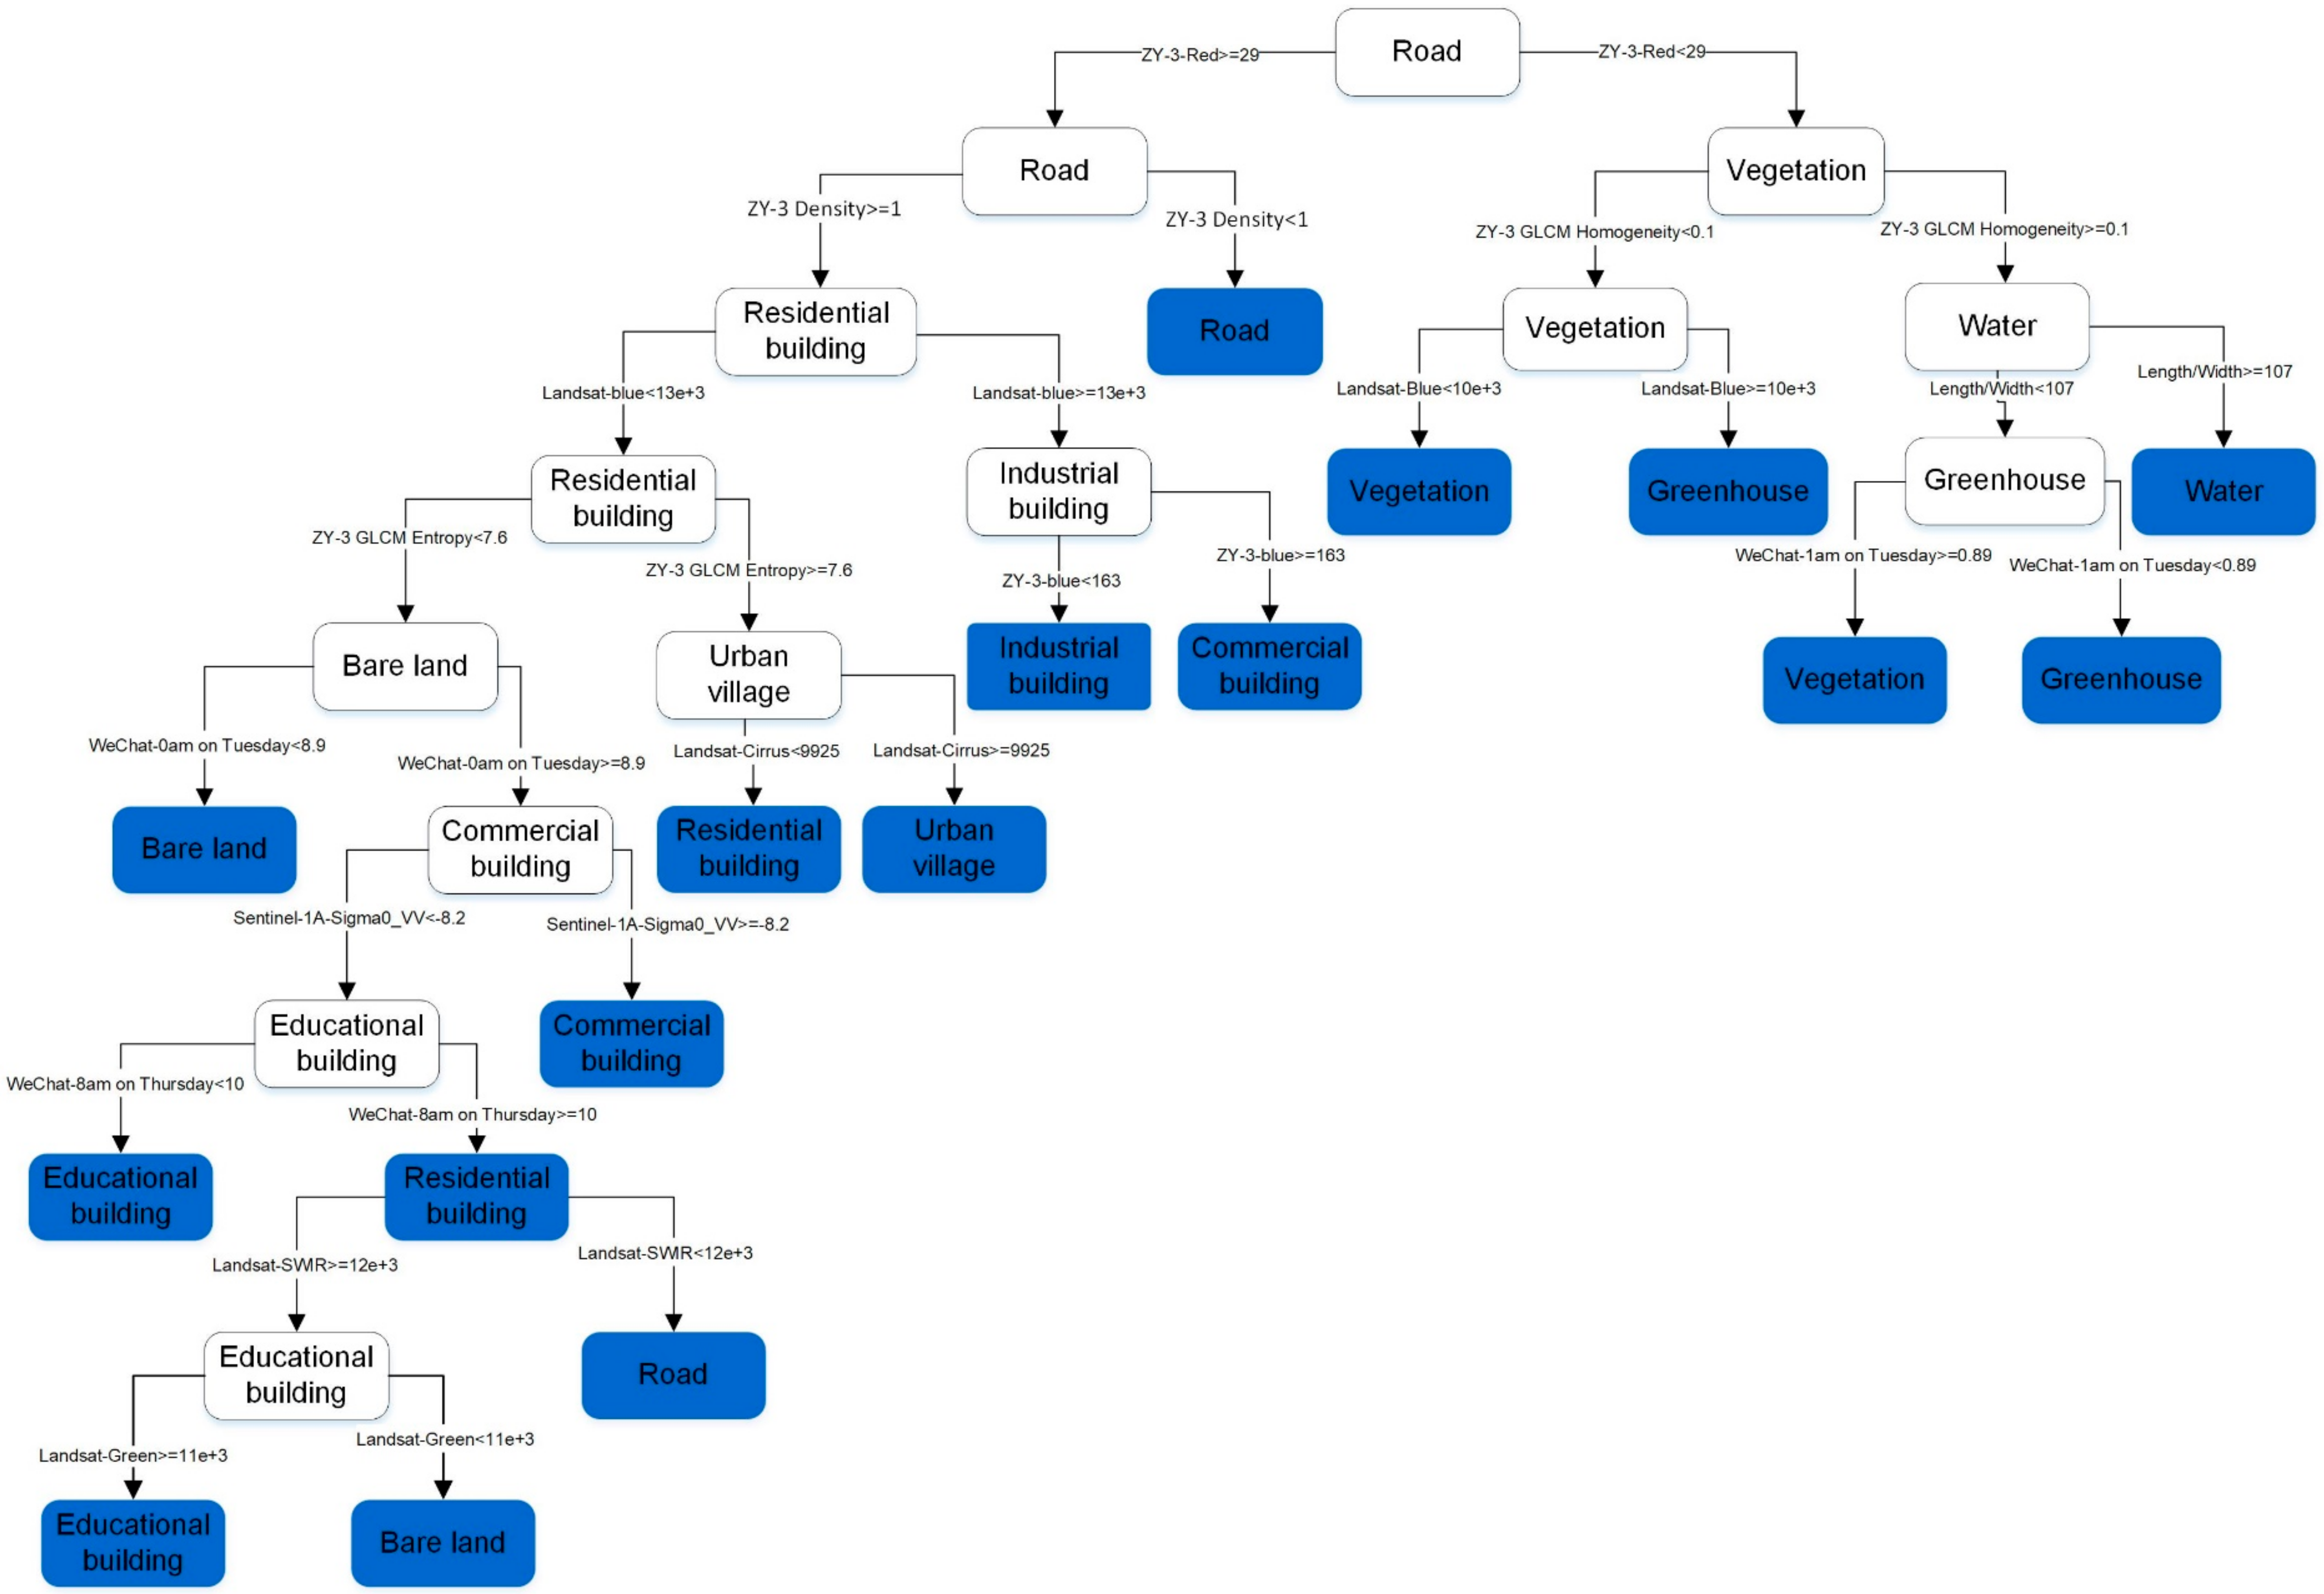
There were so many features extracted for land parcels that integrating them into the LULC classification was unfeasible. Moreover, redundant and irrelevant features could degrade the performance of classifiers. Feature selection was necessary to achieve feasible classification and minimize the effects of redundant and irrelevant features. Decision tree algorithms are instance-based induction learning methods that can extract the classification model of a tree from the given disordered training samples, with the information gain as the feature selection criterion [38]. The information gain of each feature in the training data set is calculated, and the feature with the largest information gain is considered the node feature. Child nodes are constructed on the basis of the different features, and a decision tree is constructed by recursively dividing each feature. Therefore, decision tree algorithms were used to select the optimal features for the LULC classification. In addition, decision tree algorithms could provide clear and intuitive classification rules, with which the contribution of different data sets to the classification could be easily interpreted. Figure 8 shows the decision tree constructed for the LULC classification using the multisource remote sensing images and WeChat data.
4.4. LULC Classification Using Random Forests
Random forests are a joint prediction model composed of multiple decision trees, which are independent of each other [39]. Assuming a dataset with a total of R features for classification, random forests can build n decision trees based on different random combinations of r features (r is far less than R) or a different random sample of the data. A total of n results can be obtained using the n decision trees for identifying the LULC type of an image object. The final LULC type of this image object is determined by calculating the votes for each LULC type and obtaining the most frequent one. In this manner, random forests are very stable even if new data are introduced in the dataset. Random forests do not easily overfit when averaging several trees. Compared with the decision tree algorithm or support vector machines, the random forest algorithm can achieve higher accuracy in LULC classification [40,41]. Therefore, random forests were used to perform LULC classification based on the features selected by decision tree algorithms.
5. Results
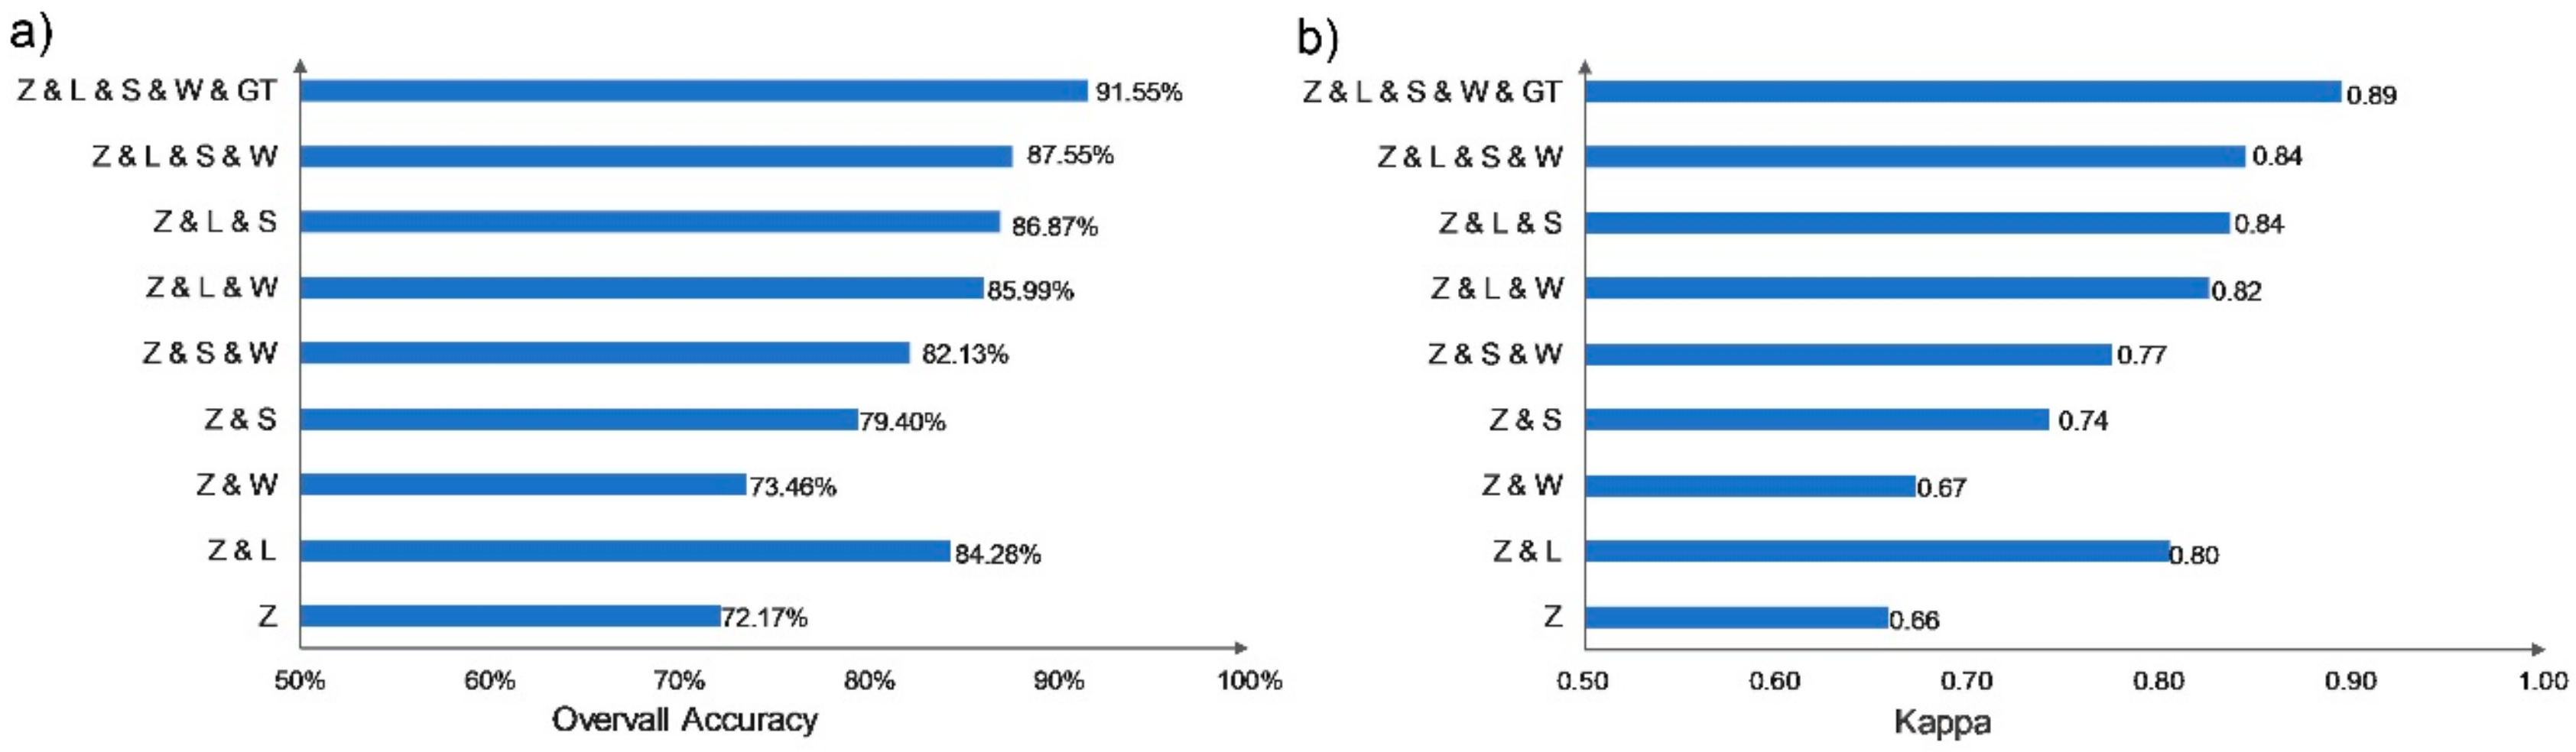
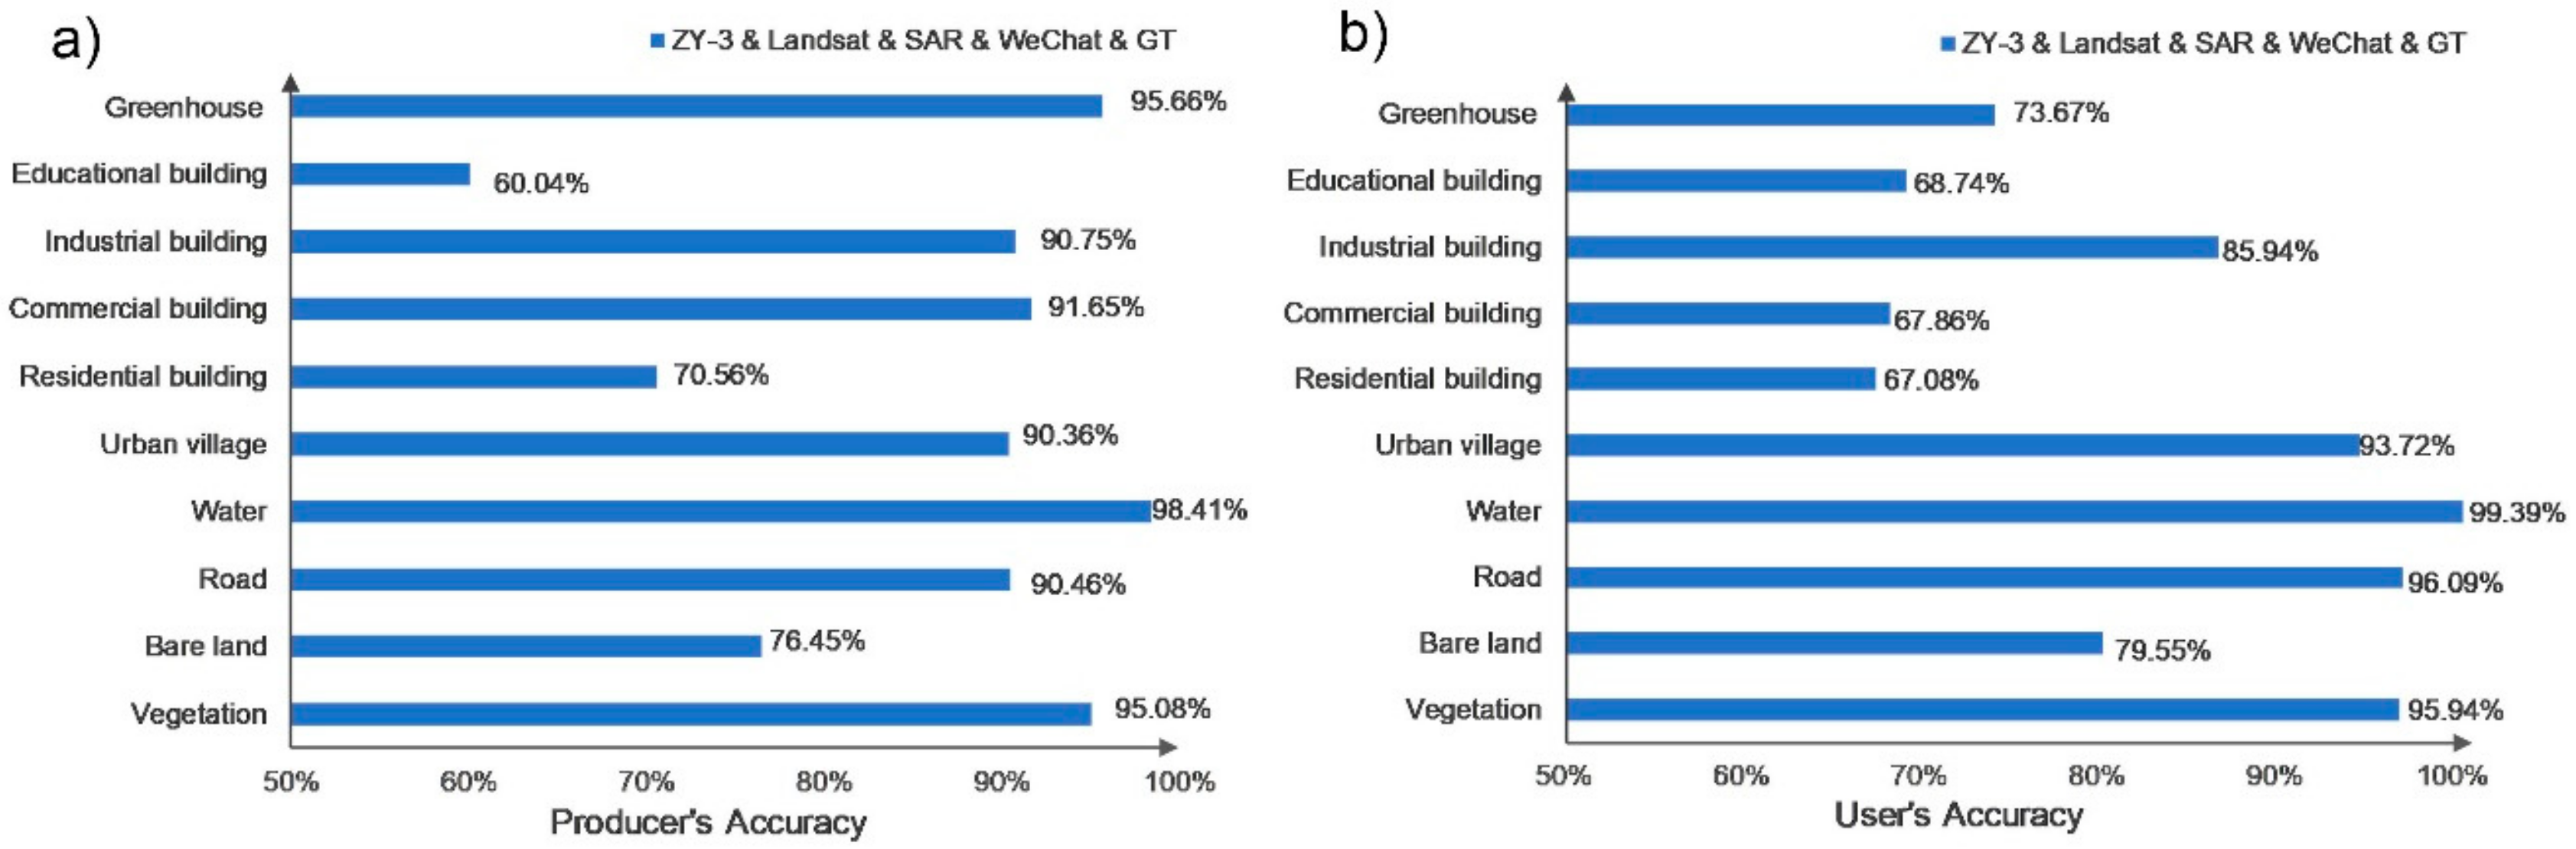
The different combinations of ZY-3, Landsat 8, SAR, and WeChat data were tested in the urban LULC classification. Given that the ZY-3 high-resolution image allowed for the accurate delineation of land parcels, all the classifications were performed based on the image objects delineated from the ZY-3 image (i.e., the segmentation result of ZY-3 image). The overall accuracies and kappa values of the different scenarios are shown in Figure 9. Among all the combinations, the combination of the four data sets (Landsat 8, ZY-3, SAR, and WeChat) produced the highest overall accuracy and kappa value, which were 87.55% and 0.84, respectively. The overall accuracy and kappa value were further improved to 91.55% and 0.89, respectively, by incorporating the textural and spatial features of ZY-3, which included length/width, density, homogeneity, and entropy, to the classification (Figure 9). Figure 10 shows the producer’s accuracy (PA) and the user’s accuracy (UA) attained by the combination of all data sets and textural and spatial features of ZY-3 data. The average PA and UA of water, road, bare land, and vegetation were 90.1% and 92.74%, respectively. The average PA and UA of built-up areas (greenhouses, educational buildings, industrial buildings, commercial buildings, residential buildings, urban villages) were 83.17% and 76.17%, respectively. The PA and UA of the urban village reached 90.36% and 93.72%, respectively.
5.1. Contribution of Landsat 8 OLI Data to LULC Classification
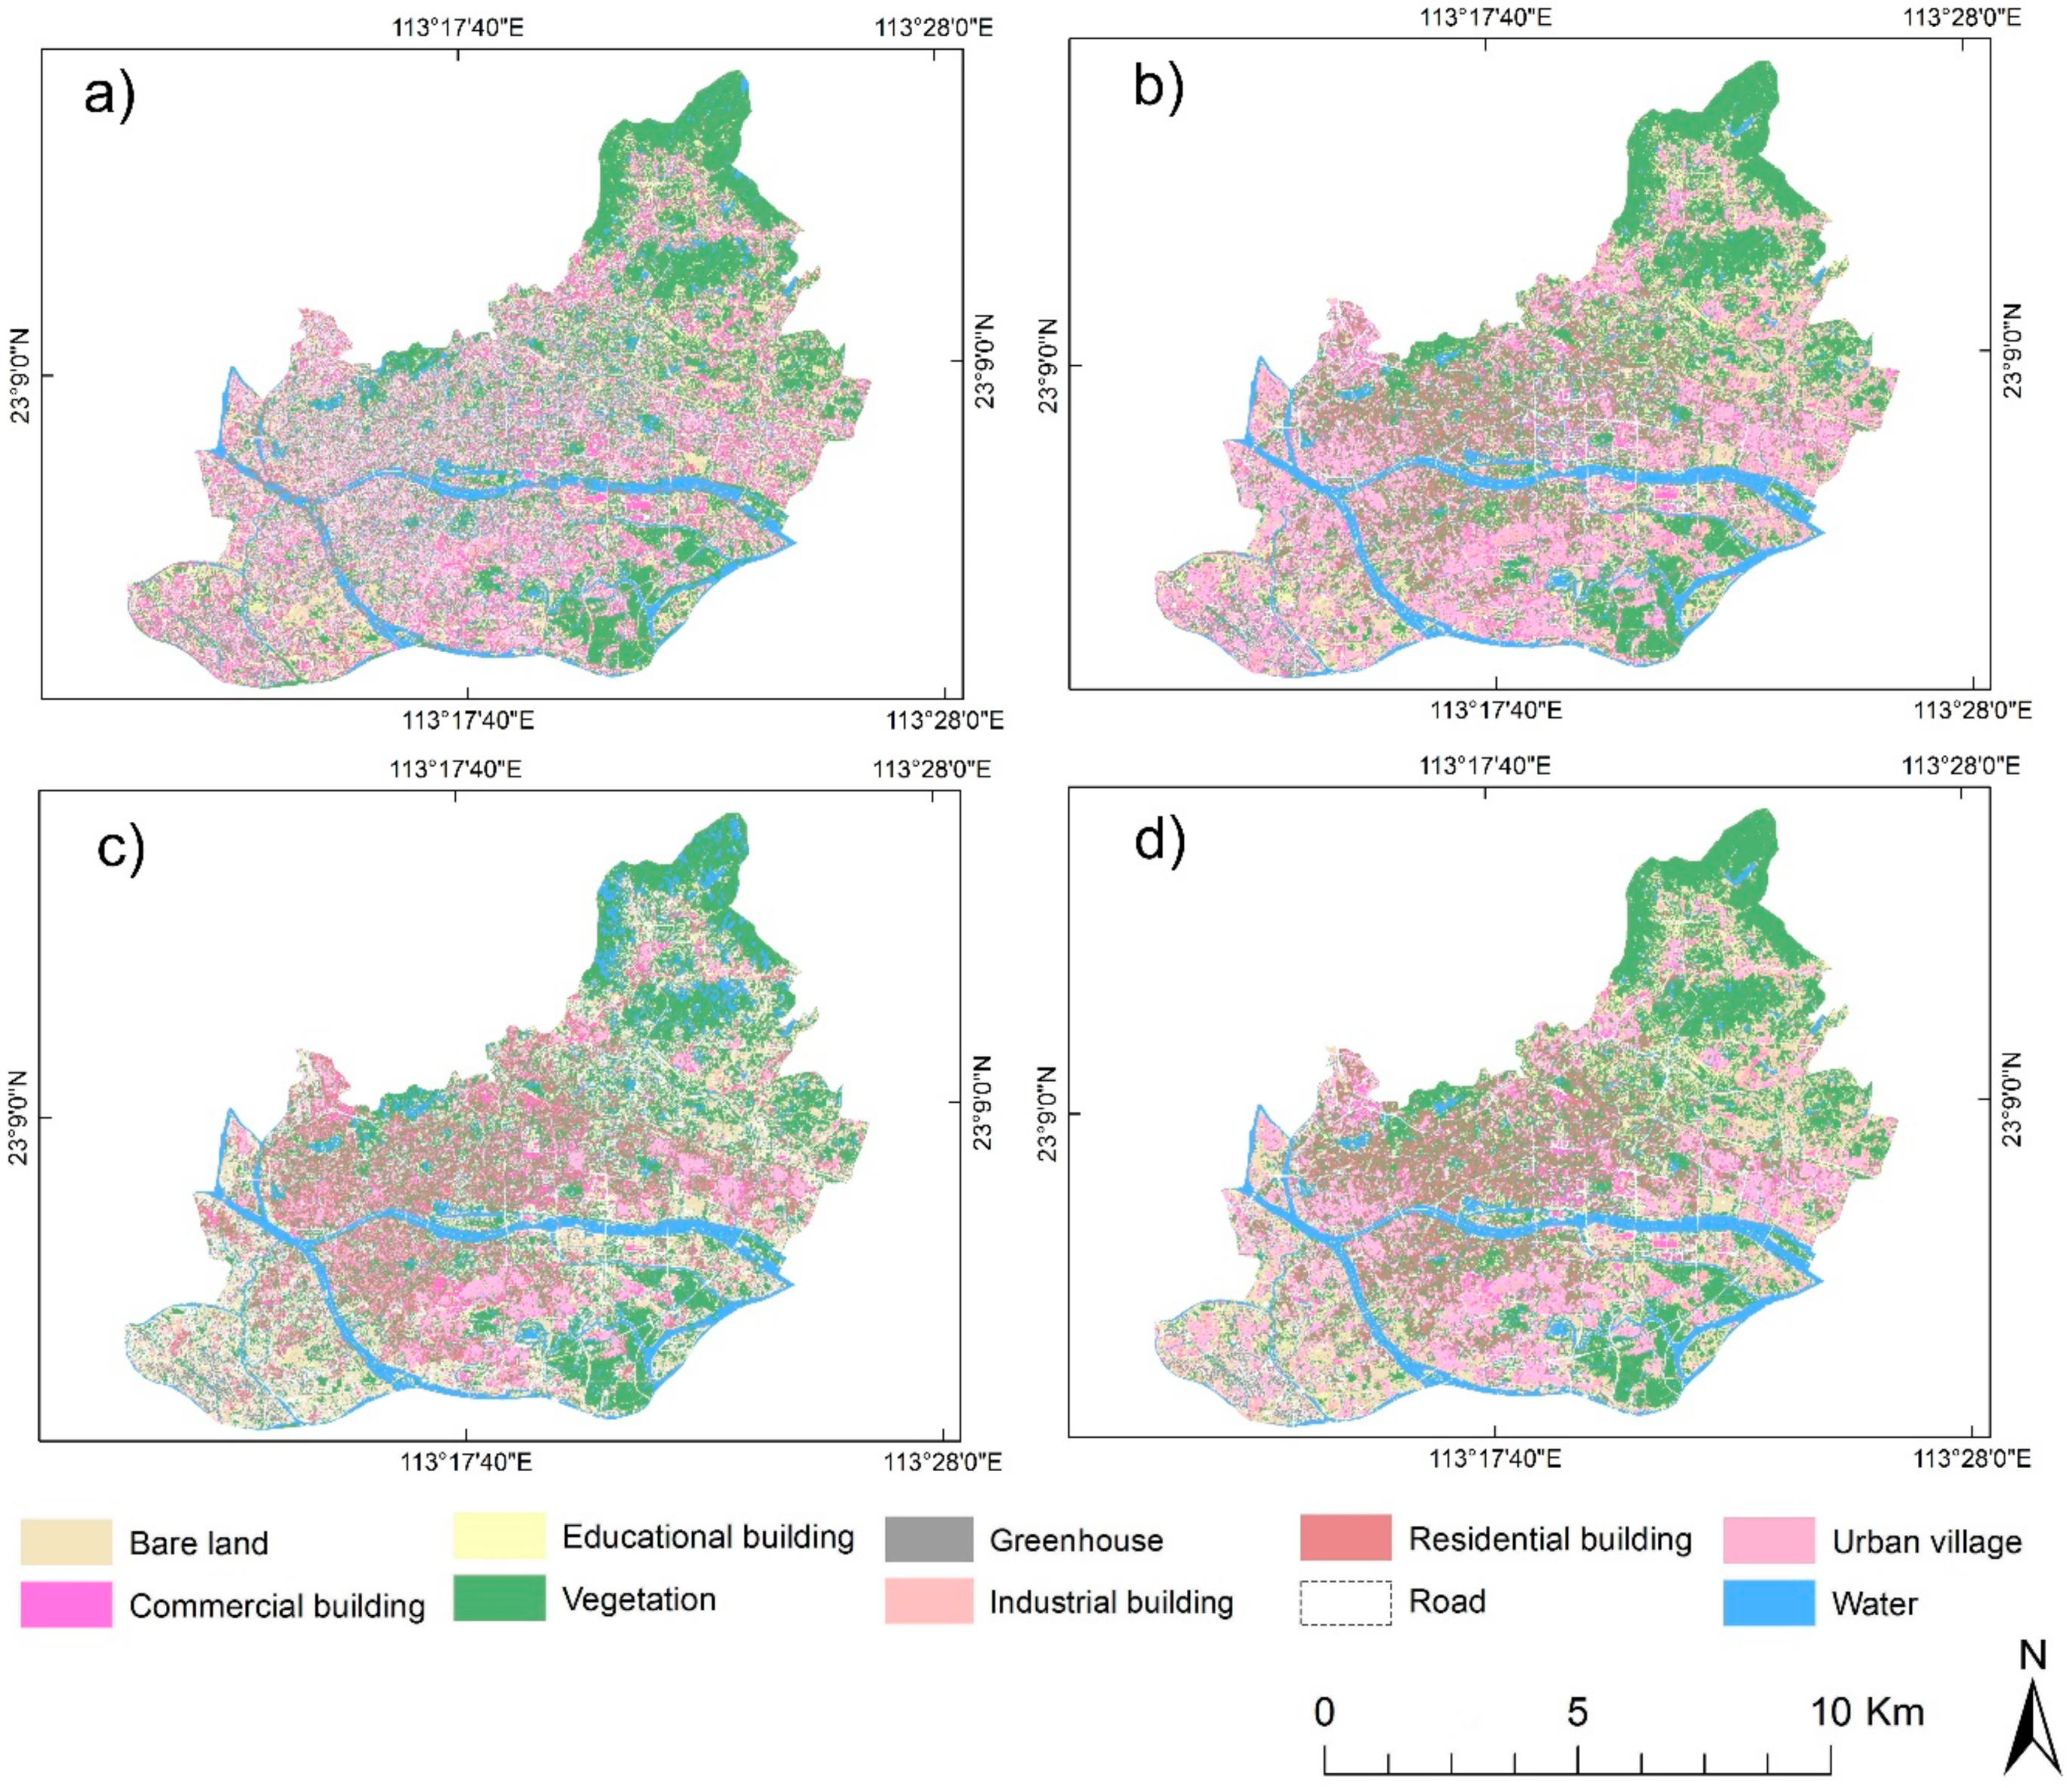
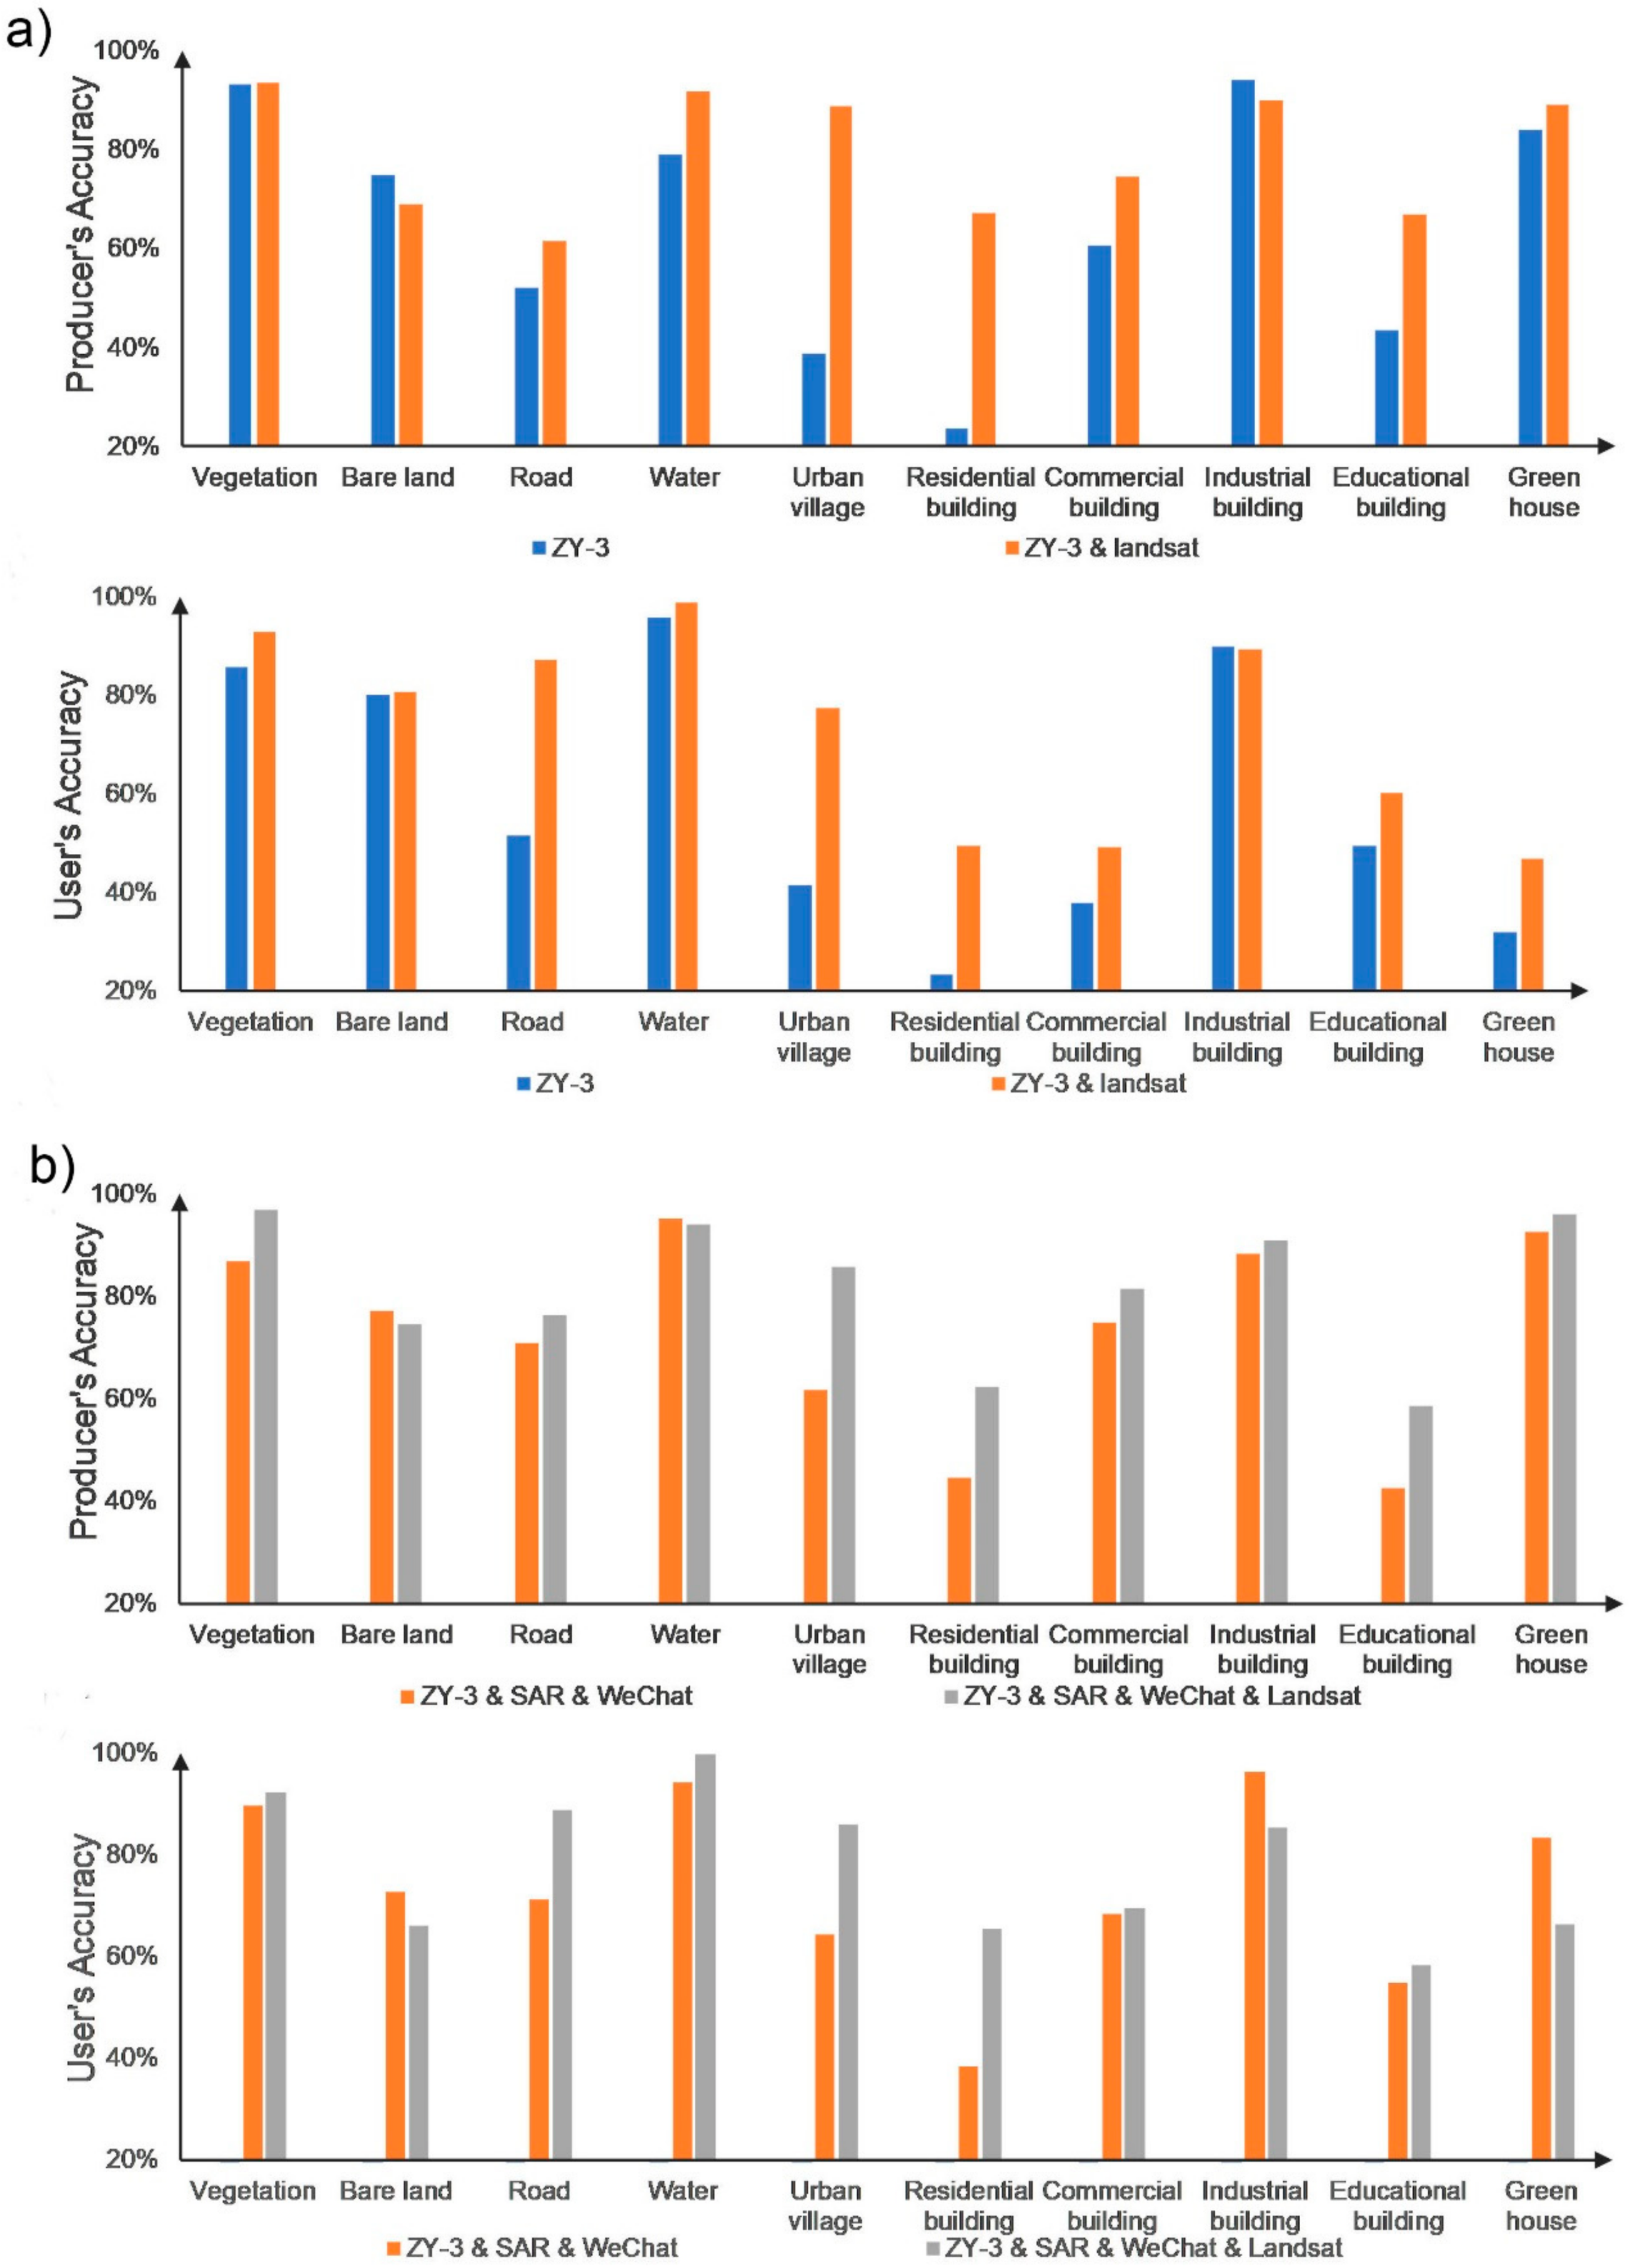
The contribution of Landsat 8 multispectral data to LULC classification was investigated by analyzing the LULC classification accuracy variation caused by the exclusion of Landsat 8 data. (Figure 11). Compared with the sole use of ZY-3 data, the combination of ZY-3 and Landsat 8 data increased the overall accuracy and kappa value by 12.11% and 0.14, respectively (Figure 9). As shown in Figure 12, the addition of Landsat 8 data increased the PA and UA for nearly all the LULC types, especially for the urban village, residential, commercial, and educational buildings, and roads. Further investigation was conducted on the contribution of Landsat 8 data to LULC classification when ZY-3, SAR, and WeChat data were used in the classification (Figure 11). Compared with the classification using all the data sets, the overall accuracy and kappa value decreased by 5.42% and 0.07, respectively, by excluding the Landsat 8 image (Figure 9). The decrease in classification accuracy caused by the removal of the Landsat 8 image was more significant than that caused by the removal of SAR or WeChat data (Figure 9). As shown in Figure 12, the addition of Landsat 8 image improved the classification accuracies of most LULC types, especially for vegetation, road, water, urban village, residential buildings, commercial buildings, and educational buildings. The results indicated that the Landsat 8 image contributed to the LULC classification even when the SAR and WeChat data were used.
5.2. Contribution of WeChat Data to LULC Classification
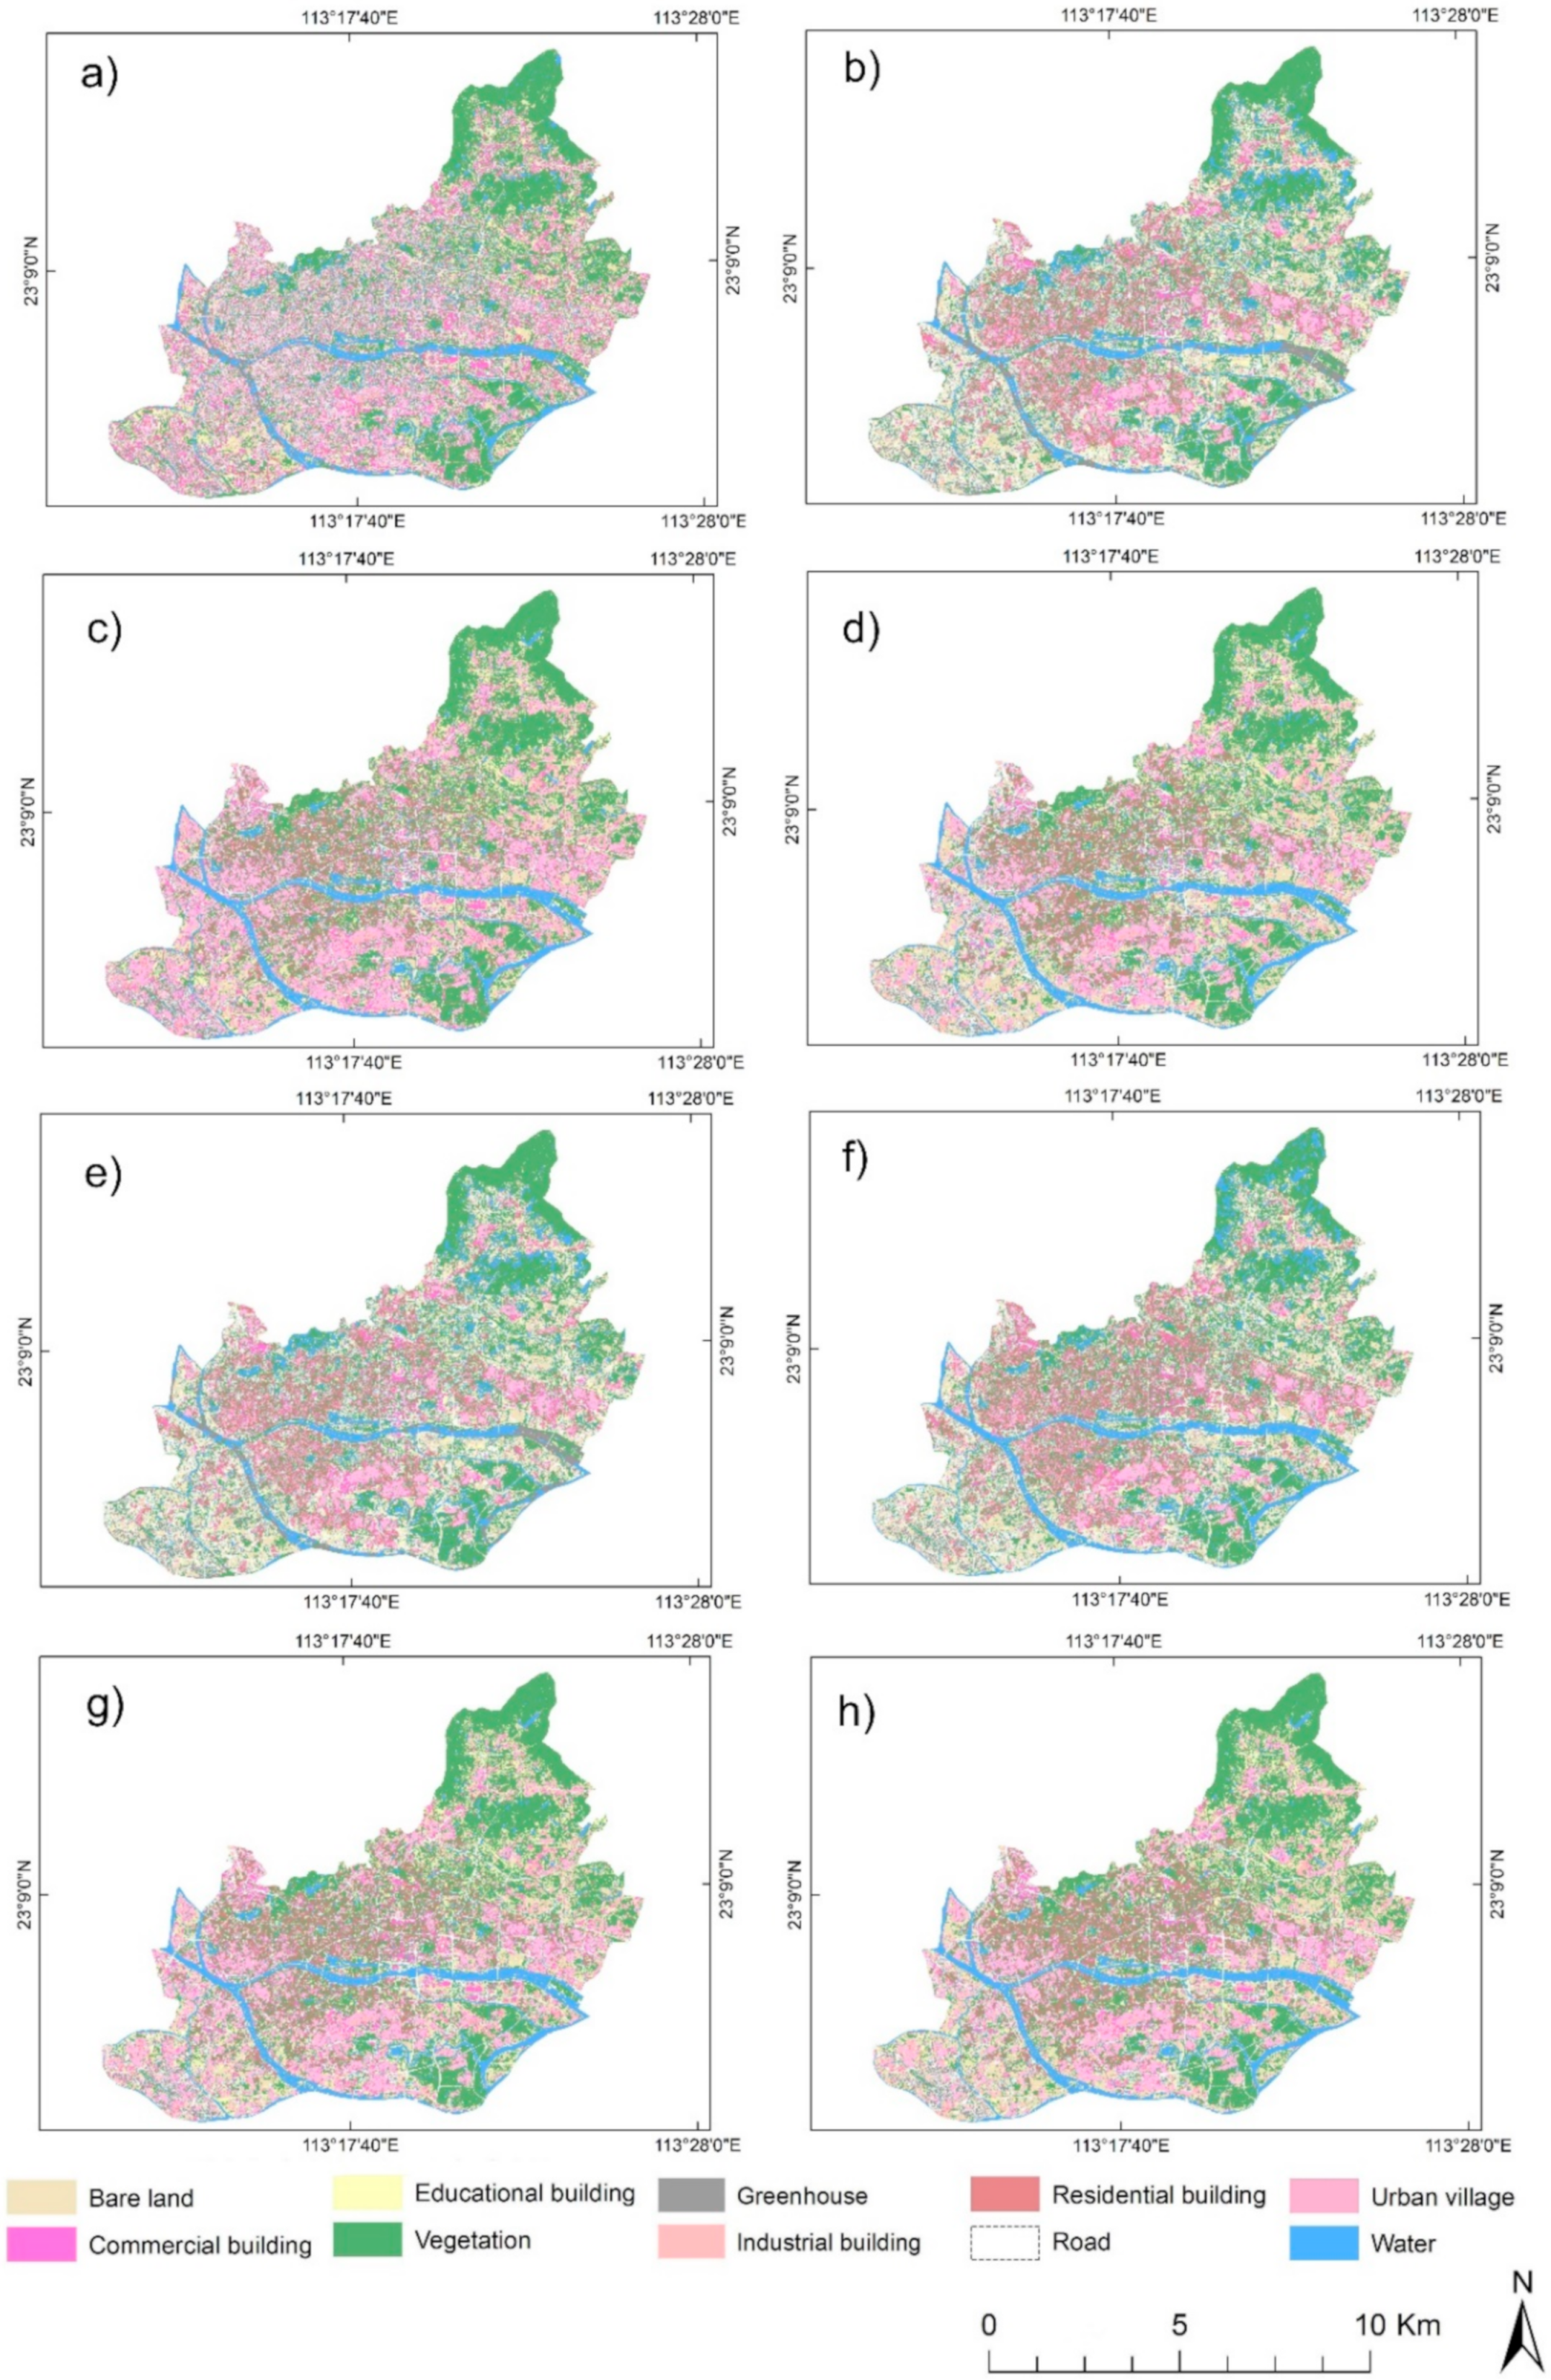
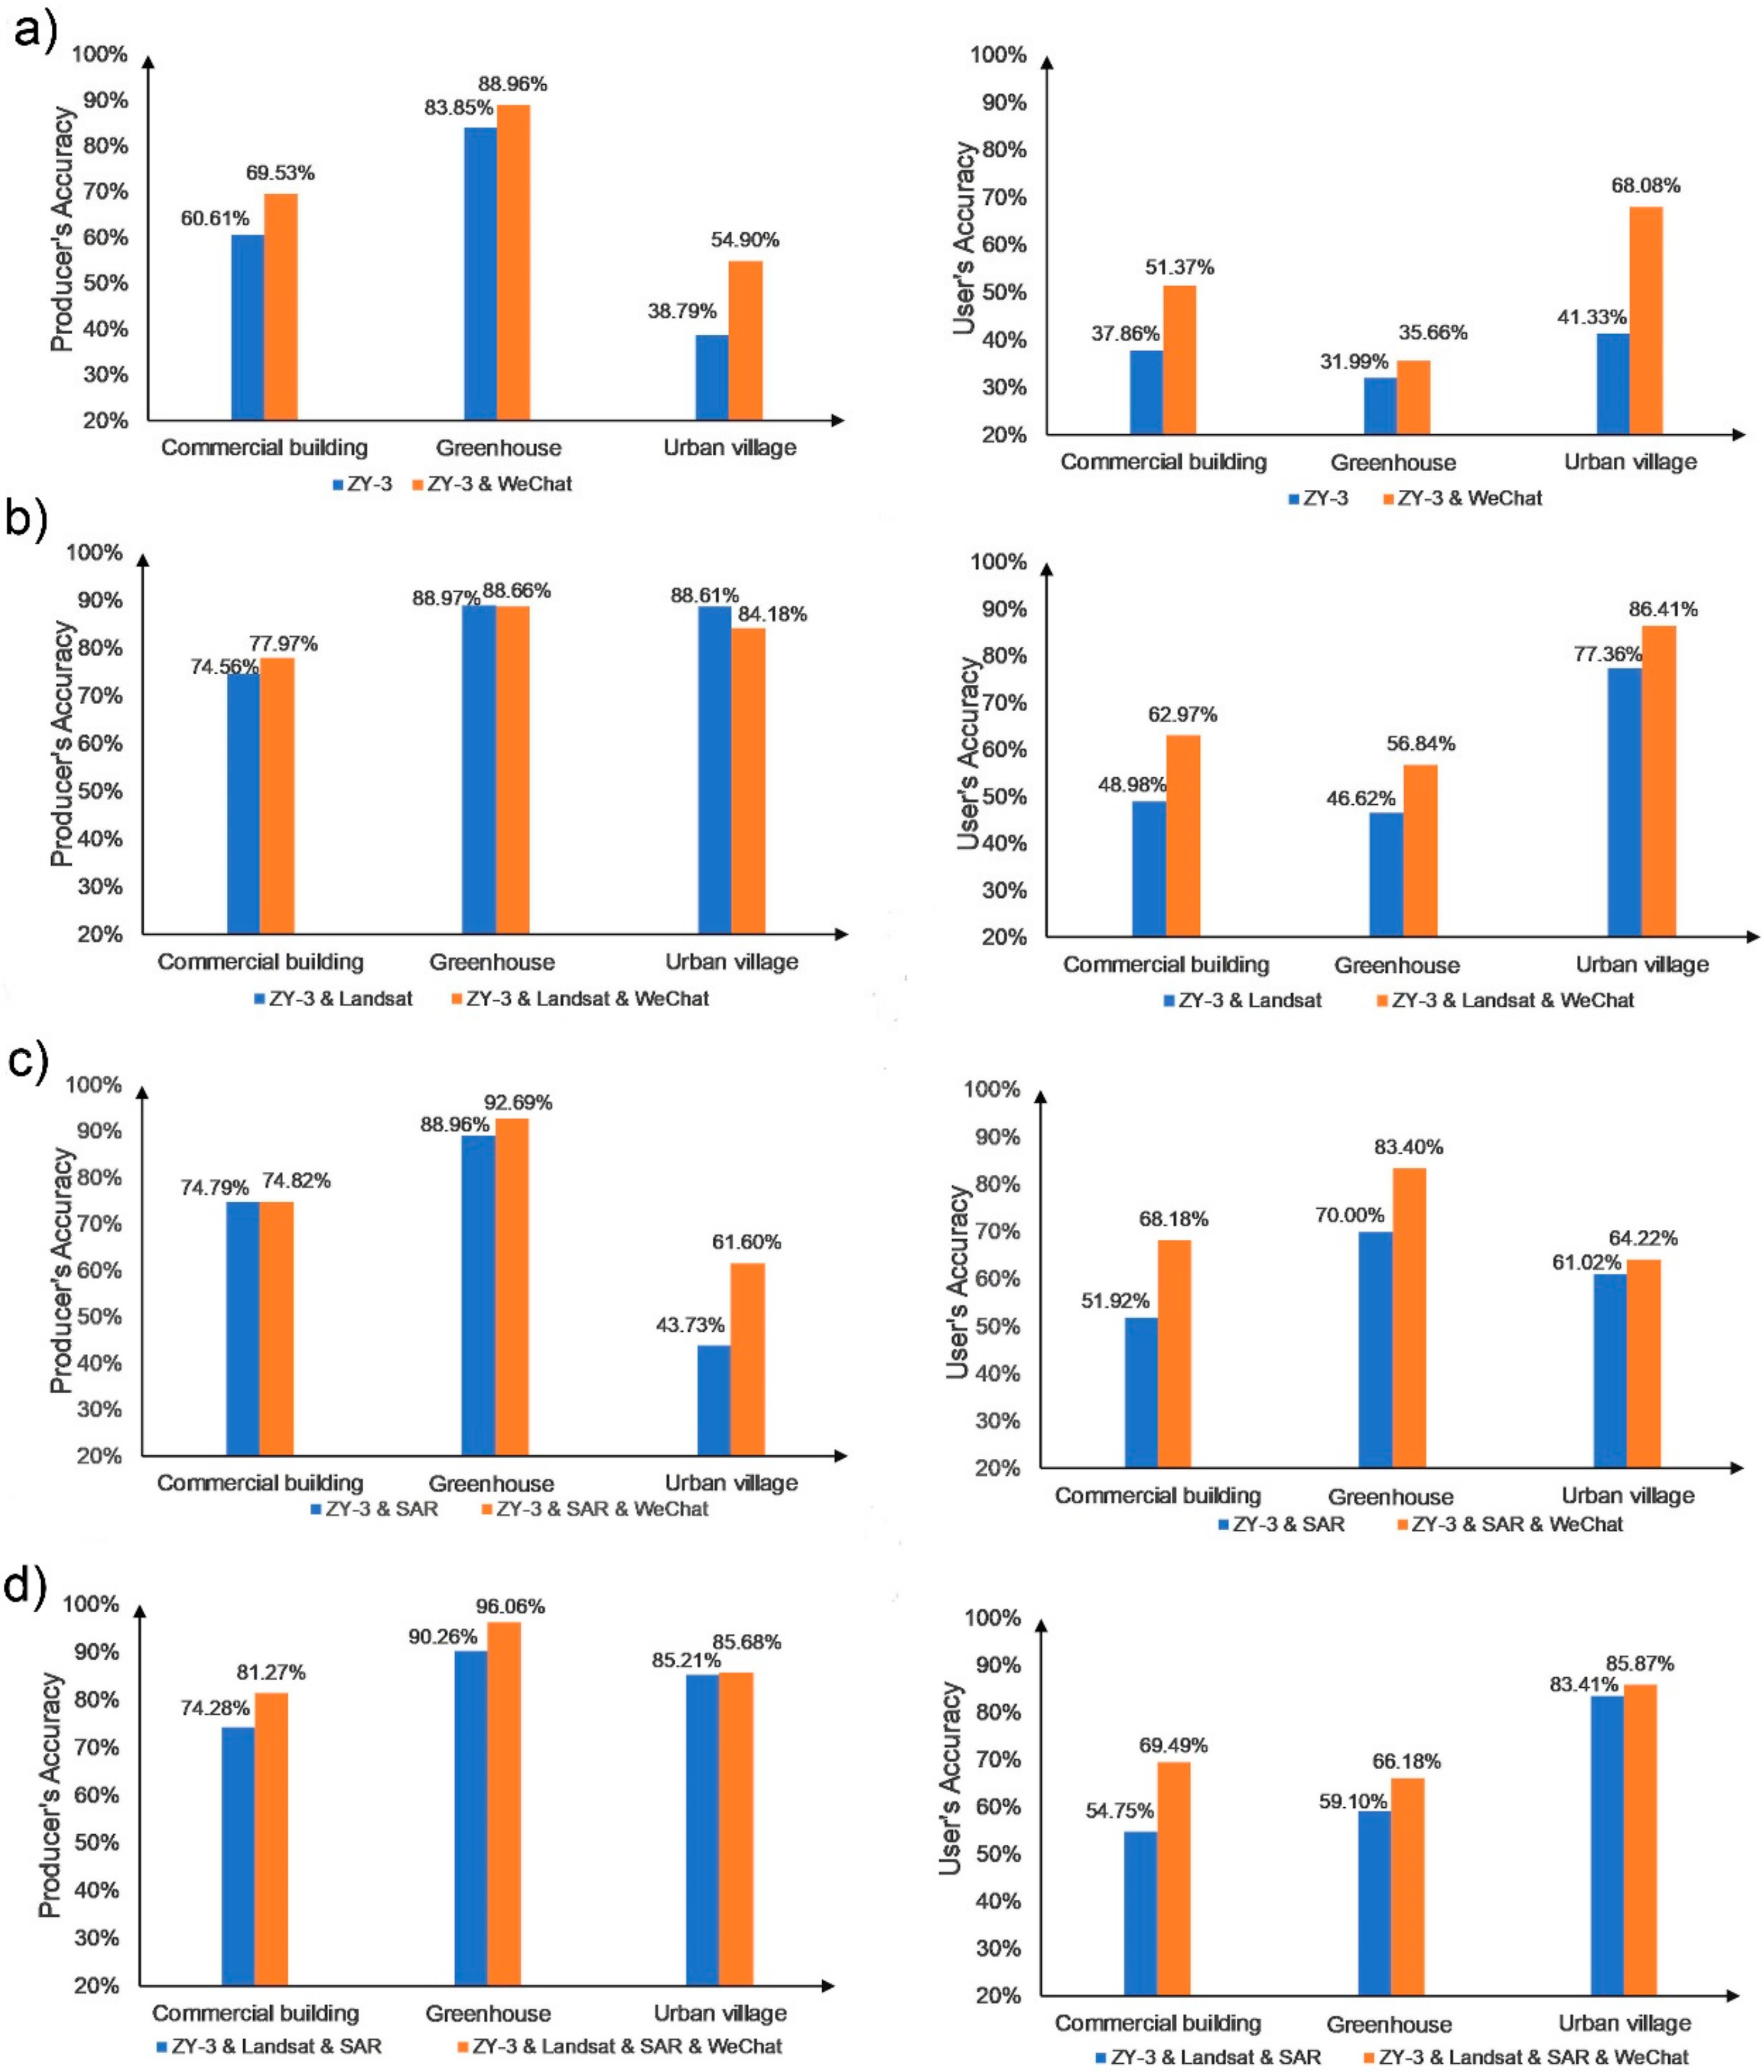
The contribution of WeChat data to LULC classification was examined by comparing the LULC classifications involving the WeChat data with those excluding the WeChat data (Figure 13). Figure 14 shows the improvement achieved by combining the WeChat data with optical data. Compared with the sole use of ZY-3 data, the addition of WeChat data improved the PA and UA of commercial buildings, greenhouses, and urban villages. The PA of commercial buildings, greenhouses, and urban villages improved by 8.92%, 5.11%, and 16.11%, respectively, and the UA of commercial buildings, greenhouses, and urban villages increased by 13.51%, 3.67%, and 26.75%, respectively. In comparison with the use of ZY-3 and Landsat 8 images, the addition of WeChat data also increased the classification accuracies of commercial buildings, greenhouses, and urban villages. The PA of commercial buildings increased by 3.41%, and the UA of commercial buildings, greenhouses, and urban villages increased by 13.99%, 10.22%, and 9.05%, respectively. Compared with the use of the ZY-3 and SAR images, the addition of WeChat data increased the PA of commercial buildings, greenhouses, and urban villages by 0.03%, 3.73%, and 17.87%, respectively, and improved the UA of commercial buildings, greenhouses, and urban villages by 16.26%, 13.40%, and 3.20%, respectively. The addition of WeChat data still improved the classification accuracies of commercial buildings, greenhouses, and urban villages even when Landsat 8, ZY-3, and SAR data were used together. The PA of these three LULC types increased by 6.99%, 5.80%, and 0.47%, respectively, and their UA improved by 14.47%, 7.08%, and 2.46%, respectively. The results indicated that the WeChat data were useful in distinguishing between different types of buildings, especially for commercial buildings, greenhouses, and urban villages. However, the improvement created by the WeChat data might not be well demonstrated by the increase in overall accuracy and kappa value (Figure 9) because of the relatively small number of validation samples of greenhouse and commercial buildings.
5.3. Contribution of SAR Data to LULC Classification
The LULC classification results obtained without using the SAR data were compared with those obtained using the SAR data to examine the contribution of SAR data to the classification (Figure 15). The addition of SAR data improved the PA and UA of water, commercial buildings, and greenhouses (Figure 16). We found that the improvements were mainly because of the ability of SAR data to distinguish between shadows, water, and greenhouses. Compared with the use of the ZY-3 image alone, the combination of SAR and ZY-3 data improved the PA and UA of water, commercial buildings, and greenhouses by 14.98% and 0.45%, 14.18% and 14.06%, and 5.11% and 38.01%, respectively. Similar improvements were also achieved by integrating the SAR data with ZY-3 and Landsat 8 OLI data. Compared with the use of ZY-3 and WeChat data, the combination of SAR, ZY-3, and WeChat data also increased the PA and UA of water, commercial buildings, and greenhouses, especially for water, whose PA and UA were improved by 18.36% and 3.56%, respectively. For the LULC classification using ZY-3, Landsat 8 OLI, and WeChat data, the addition of SAR data still increased the classification accuracies of water, commercial buildings, and greenhouses.
6. Discussion
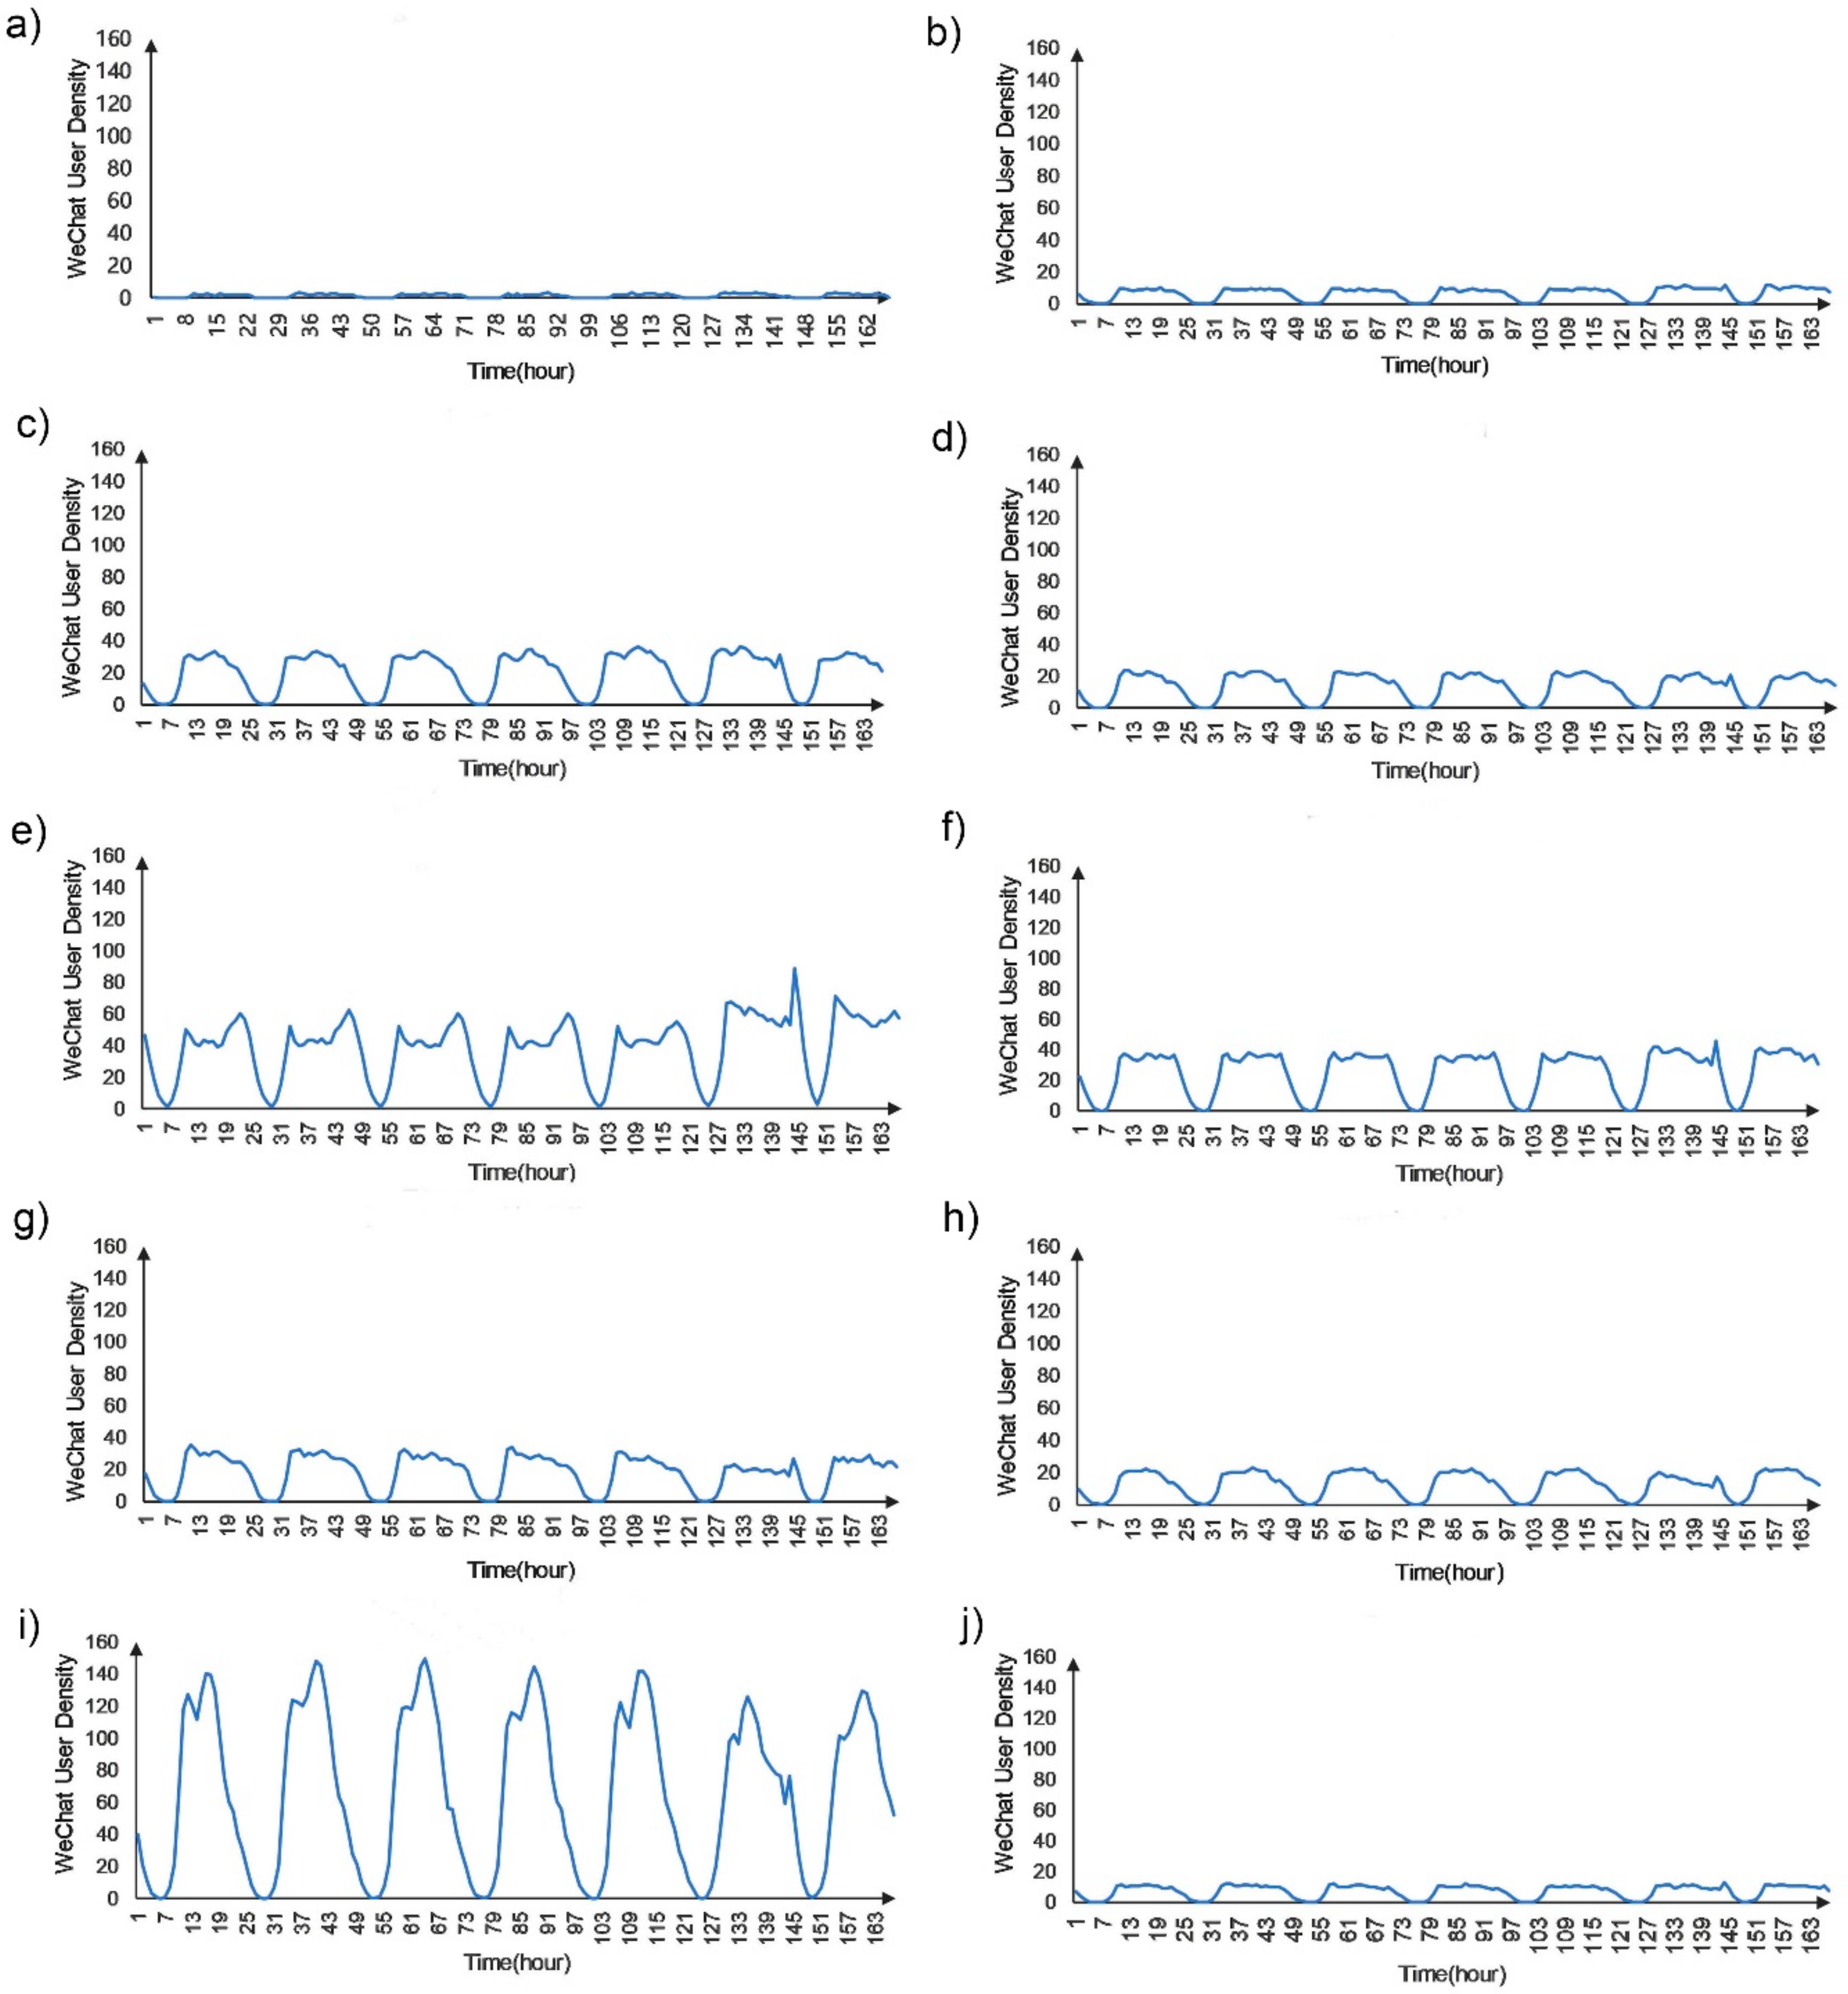
Differing from traditional remote sensing data that obtain the spectral, physical, and geometrical information of ground targets, WeChat data rendered the spatial and temporal dynamics of population density. Using the WeChat data, we investigated the temporal variation in population density in different LULC types (Figure 17). The investigation found that (1) the daily variation of population density of each LULC type is similar, but the patterns of temporal population density variation of the different LULC types are quite different; (2) the population density of greenhouses is the lowest among all the LULC types probably because rare people go to greenhouses, except for working farmers; (3) the population density of water is also low but slightly higher on nonroutine days. This condition may be due to the cruise in Guangzhou, which is a popular tourism item in nonroutine days; (4) the population density of urban villages and residential buildings on routine days is lower than that on nonroutine days, whereas the population density of educational and industrial buildings on routine days is higher than that on nonroutine days. This is probably because people have to work or study on routine days and tend to stay at home during nonroutine days; (5) the population density of commercial buildings is much higher than that of the other LULC types. People may like shopping, eating, entertaining, and hanging out in commercial buildings (e.g., shopping malls). These findings indicate that the temporal variation in population density is different in different LULC types.
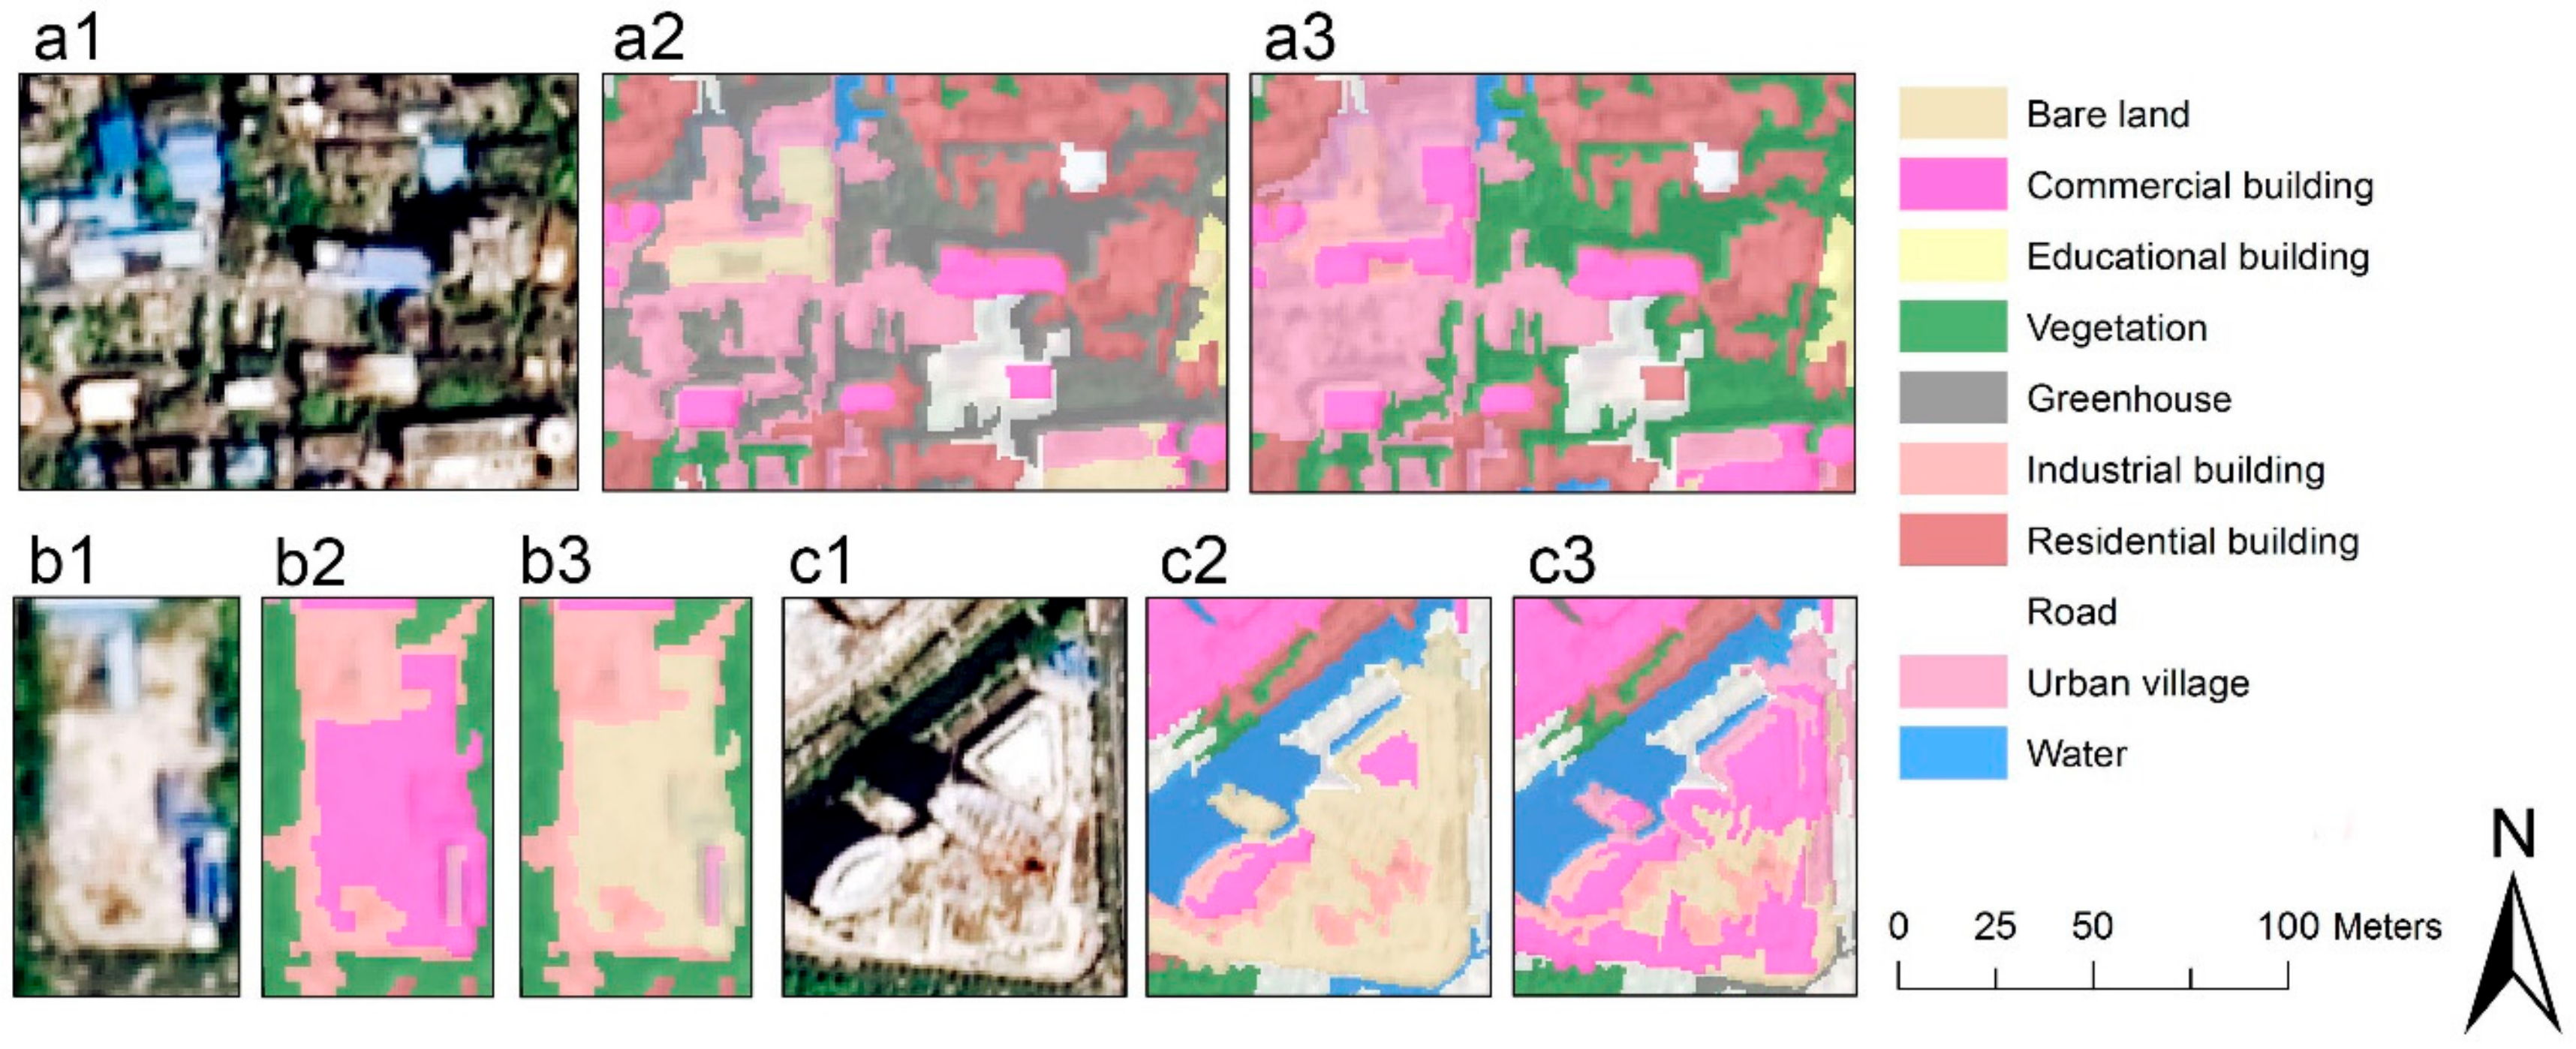
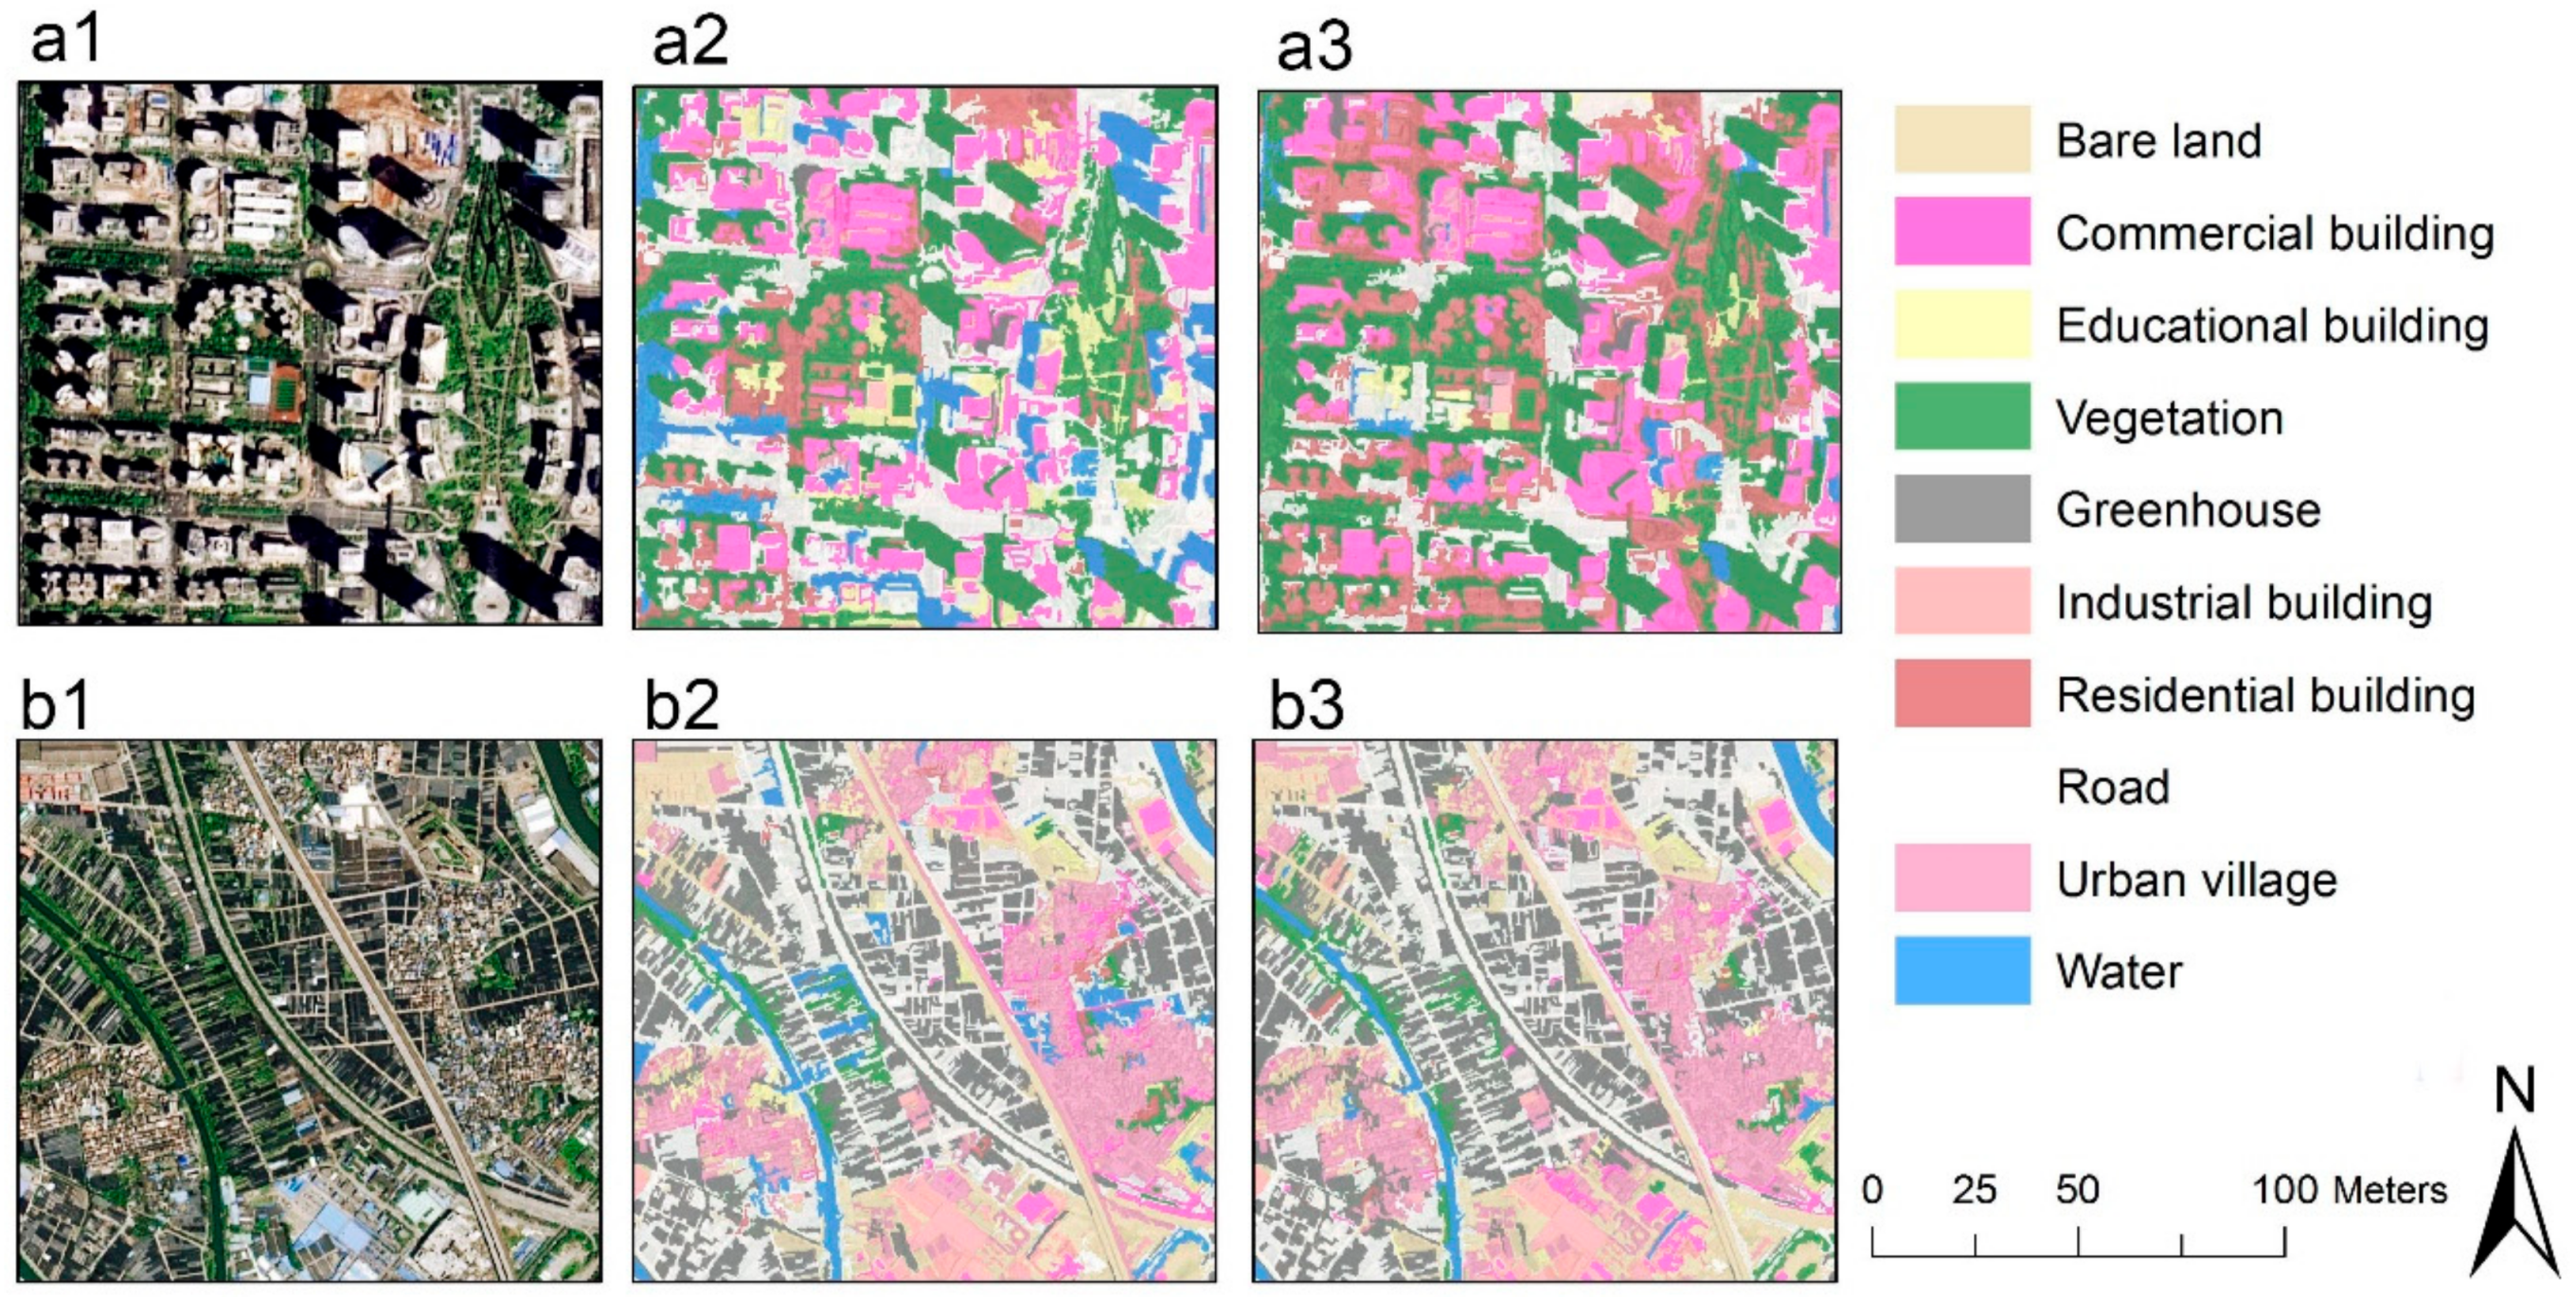
As WeChat data reveal the spatial and temporal dynamics of population density, they can be considered a complementary social sensing view on human activity-based urban space to remote sensing images. As shown in Figure 18a2, vegetation was confused with greenhouses in the LULC classifications without using the WeChat data. The addition of WeChat data reduced the confusion between greenhouses and vegetation because the population density in urban areas covered by vegetation was higher than that in greenhouses. This result complies with common sense that people are fond of hanging out in green spaces of urban areas, whereas only a few farmers have to work in greenhouses. The use of WeChat data also reduced the confusion between bare lands and commercial buildings (Figure 18b3,c3). Compared with the bare land, commercial buildings are full of people; therefore, the WeChat data played a vital role in distinguishing between commercial buildings and bare land. Therefore, combining WeChat data with remote sensing images, were particularly helpful in improving the classification accuracies of greenhouses, vegetation, bare land, and commercial buildings, especially those under construction.
As one of the most developed cities in China, Guangzhou features towering high-rise buildings, thereby creating shadows in urban areas. These shadow areas were easily confused with water and greenhouses in the LULC classification using ZY-3 or Landsat 8 OLI optical images because of the similar spectral reflectance. Figure 19a1 shows the central business district of Guangzhou, where each building is accompanied by a shadow with a spectral reflectance similar to water in the ZY-3 image. Figure 19b1 illustrates the Liwan District in Guangzhou, which is known as the “millennial flower town” because of having flower cultivation as the primary industry. The greenhouses for raising flowers in Figure 19b1 featured a low spectral reflectance, which is generally confused with water. Water, commercial buildings, and greenhouses exhibited substantial different backscattering characteristics in the SAR image because the SAR backscatter is sensitive to the geometrical and geophysical properties of the ground targets. Water bodies were dark areas in the SAR image because of the specular reflection. The shadow areas in dense urban areas were greatly reduced because of the complex multiple reflectance between the buildings and the ground [42]. SAR could penetrate greenhouses to interact with vegetation. Thus, the greenhouses were similar to vegetation in the SAR image. Therefore, the addition of SAR data greatly reduced the confusion among water, commercial buildings, and greenhouses.
7. Conclusions
This study investigated the capability of the combination of multisource remote sensing images and social media data in urban LULC classification. A ZY-3 high-resolution optical image, a Landsat 8 OLI multispectral image, a Sentinel-1A polarimetric SAR image, and WeChat user density data were used. The different combinations of these four data sets were assessed for the LULC classification that involved vegetation, bare land, road, water, urban village, residential buildings, commercial buildings, industrial buildings, educational buildings, and greenhouses. Among these combinations, the combination of all data sets achieved the highest overall accuracy and kappa value, which were 87.55% and 0.84, respectively. The overall accuracy and kappa value were further improved to 91.55% and 0.89, respectively, by integrating the textural and spatial features extracted from the ZY-3 high-resolution image. Results showed that the combination of multisource remote sensing images and social media data could improve the accuracy of LULC classification.
The contribution of each data set to the LULC classification was examined. The ZY-3 high-resolution image was essential for urban LULC classification to delineate different land parcels accurately. Compared with the sole use of a ZY-3 image, the addition of Landsat 8 data improved the overall accuracy and kappa value by 12.11% and 0.14, respectively. The addition of Landsat 8 multispectral data improved the PA and UA of nearly all the LULC classes, especially for vegetation, road, water, urban village, and residential, commercial, and educational buildings. However, the combination of ZY-3 and Landsat 8 images still had difficulties in accurately distinguishing between the different building types. The WeChat data represented the temporal variation in population density, which showed different patterns between various urban LU types. Therefore, the addition of WeChat data was useful in classifying different building types, especially for discriminating between commercial buildings and bare land and between greenhouses and building shadows. Compared with the use of the ZY-3 image alone, the addition of WeChat data improved the PA and UA of commercial buildings, greenhouses, urban villages by 8.92% and 13.51%, 5.11% and 3.67%, and 16.11% and 26.75%, respectively.
This study also found that water, greenhouse, and shadows were easily confused with each other in the LULC classification based on the optical remote sensing images (i.e., ZY-3 and Landsat 8 OLI images). However, water, commercial buildings, and greenhouses exhibited different backscattering characteristics in the SAR image because the SAR backscatter was sensitive to the geometrical and geophysical properties of ground targets. The confusion among water, commercial buildings, and greenhouses was greatly reduced by the addition of SAR data. Compared with the use of a ZY-3 image alone, the combination of ZY-3 and SAR images improved the PA and UA of water and greenhouses by 14.98% and 0.45% and by 5.11% and 38.01%, respectively.
The future study will be carried out on the use of multisource remote sensing and social media data for the LULC classification involving mix LU and multi-functional buildings, which were not considered in this study. Moreover, the utility of other big data, such as POIs, bus data, and taxi data, will be examined in the future study.
Author Contributions
Y.S. and Z.Q. conceived and designed the experiments. Y.S. performed the experiments and analyzed the results. Z.Q. provided funding and supervised the study. Y.S. and Z.Q. wrote the main manuscript. X.L. and N.N. provided suggestions and comments. H.Z. aided the field investigation and revised the manuscript.
Funding
This research was funded by the National Key R&D Program of China [Grant No. 2017YFA0604403], the Natural Science Foundation of the Guangdong Province of China [Grant No. 2016A030313230], the National Natural Science Foundation of China [Grant No. 41601445], and the Young Scholar Research Fund of Sun Yat-sen University [Grant No. 16lgpy05].
Acknowledgments
We would like to gratefully thank the anonymous reviewers for their insightful and helpful comments to improve the manuscript.
Conflicts of Interest
The authors declare no conflict of interest.
References
- Foley, J.A.; DeFries, R.; Asner, G.P.; Barford, C.; Bonan, G.; Carpenter, S.R.; Chapin, F.S.; Coe, M.T.; Daily, G.C.; Gibbs, H.K.; et al. Global consequences of land use. Science 2005, 309, 570–574. [Google Scholar] [CrossRef] [PubMed]
- Fan, F.L.; Weng, Q.H.; Wang, Y.P. Land use and land cover change in Guangzhou, China, from 1998 to 2003, based on Landsat TM/ETM+ imagery. Sensors 2007, 7, 1323–1342. [Google Scholar] [CrossRef]
- Torbick, N.; Lusch, D.; Qi, J.; Moore, N.; Olson, J.; Ge, J.L. Developing land use/land cover parameterization for climate–land modelling in East Africa. Int. J. Remote Sens. 2006, 27, 4227–4244. [Google Scholar] [CrossRef]
- Aydinoglu, A.C.; Yomralioglu, T.; Inan, H.I.; Sesli, F.A. Managing land use/cover data harmonized to support land administration and environmental applications in Turkey. Sci. Res. Essays 2010, 5, 275–284. [Google Scholar] [CrossRef]
- Yemefack, M.; Bijker, W.; De Jong, S.M. Investigating relationships between Landsat-7 ETM+ data and spatial segregation of LULC types under shifting agriculture in southern Cameroon. Int. J. Appl. Earth Obs. Geoinf. 2006, 8, 96–112. [Google Scholar] [CrossRef]
- Zhang, Y.Z.; Wang, Y.F.; Wang, Y.P.; Xi, H.Y. Investigating the Impacts of Landuse-landcover (LULC) Change in the Pearl River Delta Region on Water Quality in the Pearl River Estuary and Hong Kong’s Coast. Remote Sens. 2009, 1, 1055–1064. [Google Scholar] [CrossRef]
- Liu, X.; Hu, G.; Chen, Y.; Li, X.; Xu, X.; Li, S.; Pei, F.; Wang, S. High-resolution multi-temporal mapping of global urban land using Landsat images based on the Google Earth Engine Platform. Remote Sens. Environ. 2018, 209, 227–239. [Google Scholar] [CrossRef]
- Liu, X.; Liang, X.; Li, X.; Xu, X.; Ou, J.; Chen, Y.; Li, S.; Wang, S.; Pei, F. A future land use simulation model (FLUS) for simulating multiple land use scenarios by coupling human and natural effects. Landsc. Urban Plan. 2017, 168, 94–116. [Google Scholar] [CrossRef]
- Lambin, E.F.; Turner, B.L.; Geist, H.J.; Agbola, S.B.; Angelsen, A.; Bruce, J.W.; Coomes, O.T.; Dirzo, R.; Fischer, G.; Folke, C.; et al. The causes of land-use and land-cover change: Moving beyond the myths. Glob. Environ. Chang. Hum. Policy Dimens. 2001, 11, 261–269. [Google Scholar] [CrossRef]
- Lu, D.; Weng, Q. Use of impervious surface in urban land-use classification. Remote Sens. Environ. 2002, 102, 146–160. [Google Scholar] [CrossRef]
- Wegmuller, U.; Strozzi, T.; Bitelli, G. Validation of ERS differential SAR interferometry for land subsidence mapping: The Bologna case study. In Proceedings of the IEEE 1999 International Geoscience and Remote Sensing Symposium, IGARSS’99, Hamburg, Germany, 28 June–2 July 1999; Volume 2, pp. 1131–1133. [Google Scholar]
- Qi, Z.X.; Yeh, A.G.O.; Li, X.; Lin, Z. A novel algorithm for land use and land cover classification using RADARSAT-2 polarimetric SAR data. Remote Sens. Environ. 2012, 118, 21–39. [Google Scholar] [CrossRef]
- Luo, H.; Lin, L.; Zhu, H.; Kuai, X.; Zhang, Z.; Liu, Y. Land Cover Extraction from High Resolution ZY-3 Satellite Imagery Using Ontology-Based Method. ISPRS Int. J. Geo-Inf. 2016, 5, 31. [Google Scholar] [CrossRef]
- Amarsaikhan, D.; Blotevogel, H.H.; Genderen, J.L.V.; Ganzorig, M.; Gantuya, R.; Nergui, B. Fusing high-resolution SAR and optical imagery for improved urban land cover study and classification. Int. J. Image Data Fusion 2010, 1, 83–97. [Google Scholar] [CrossRef]
- Solberg, A.H.S.; Jain, A.K.; Taxt, T. Multisource classification of remotely sensed data: Fusion of Landsat TM and SAR images. IEEE Trans. Geosci. Remote Sens. 1994, 32, 768–778. [Google Scholar] [CrossRef]
- Ban, Y.F.; Hu, H.T.; Rangel, I.M. Fusion of Quickbird MS and RADARSAT SAR data for urban land-cover mapping: Object-based and knowledge-based approach. Int. J. Remote Sens. 2010, 31, 1391–1410. [Google Scholar] [CrossRef]
- Liu, C.; Song, G. A method of measuring the semantic gap in image retrieval: Using the information theory. In Proceedings of the International Conference on Image Analysis & Signal Processing, Hubei, China, 21–23 October 2011. [Google Scholar] [CrossRef]
- Bahmanyar, R. Measuring the semantic gap using a Communication Channel model. In Proceedings of the IEEE International Conference on Image Processing, Melbourne, Australia, 15–18 September 2013; pp. 4377–4381. [Google Scholar]
- Pan, Y.; Tian, Y.; Liu, X.; Gu, D.; Hua, G. Urban big data and the development of city intelligence. Engineering 2016, 2, 171–178. [Google Scholar] [CrossRef]
- Hu, T.; Yang, J.; Li, X.; Gong, P. Mapping Urban Land Use by Using Landsat Images and Open Social Data. Remote Sens. 2016, 8, 151. [Google Scholar] [CrossRef]
- Chen, Y.M.; Liu, X.P.; Li, X.; Liu, X.J.; Yao, Y.; Hu, G.H.; Xu, X.C.; Pei, F.S. Delineating urban functional areas with building-level social media data: A dynamic time warping (DTW) distance based k-medoids method. Landsc. Urban Plan. 2017, 160, 48–60. [Google Scholar] [CrossRef]
- Purves, R.; Hollenstein, L. Exploring place through user-generated content: Using Flickr to describe city cores. J. Spat. Inf. Sci. 2010, 1, 21–48. [Google Scholar] [CrossRef]
- Birkin, M.; Harland, K.; Malleson, N. The Classification of Space-Time Behaviour Patterns in a British City from Crowd-Sourced Data. In Proceedings of the International Conference on Computational Science and Its Applications, Ho Chi Minh City, Vietnam, 24–27 June 2013; Springer: Berlin/Heidelberg, Germany, 2013; pp. 179–192. [Google Scholar]
- Wakamiya, S.; Lee, R.; Sumiya, K. Urban Area Characterization Based on Semantics of Crowd Activities in Twitter. In Proceedings of the International Conference on Geospatial Semantics, Brest, France, 12–13 May 2011; pp. 108–123. [Google Scholar]
- Xu, G.; Zhu, X.; Fu, D.J.; Dong, J.W.; Xiao, X.M. Automatic land cover classification of geo-tagged field photos by deep learning. Environ. Model. Softw. 2017, 91, 127–134. [Google Scholar] [CrossRef]
- Liu, X.P.; He, J.L.; Yao, Y.; Zhang, J.B.; Liang, H.L.; Wang, H.; Hong, Y. Classifying urban land use by integrating remote sensing and social media data. Int. J. Geogr. Inf. Sci. 2017, 31, 1675–1696. [Google Scholar] [CrossRef]
- Guangzhou Statistics Bureau. Available online: http://www.gzstats.gov.cn/ (accessed on 28 February 2018).
- Amitrano, D.; Cecinati, F.; Martino, G.D.; Iodice, A.; Riccio, D.; Ruello, G. Sentinel-1 Multitemporal SAR Products. In Proceedings of the Geoscience & Remote Sensing Symposium, Milan, Italy, 26–31 July 2015. [Google Scholar] [CrossRef]
- Shen, L.F.; Wang, Y.; Zhang, C.; JIANG, D.R.; Li, H. Relationship between built environment of rational pedestrian catchment areas and URT commuting ridership: Evidence from 44 URT stations in Beijing. J. Geogr. Sci. 2018, 73, 2423–2439. (In Chinese) [Google Scholar]
- Wallington, E.D. Field Methods in Remote Sensing. Photogramm. Rec. 2005, 20, 179–180. [Google Scholar] [CrossRef]
- Suresh, G.; Gehrke, R.; Wiatr, T.; Hovenbitzer, M. Synthetic Aperture Radar (Sar) Based Classifiers for Land Applications in Germany. Int. Arch. Photogramm. 2016, 41, 1187–1193. [Google Scholar] [CrossRef]
- Yommy, A.S.; Liu, R.; Wu, S. SAR Image Despeckling Using Refined Lee Filter. In Proceedings of the International Conference on Intelligent Human-machine Systems & Cybernetics, Hangzhou, China, 26–27 August 2015. [Google Scholar] [CrossRef]
- Rahman, M.R.; Saha, S.K. Multi-resolution Segmentation for Object-based Classification and Accuracy Assessment of Land Use/Land Cover Classification using Remotely Sensed Data. J. Indian Soc. Remote Sens. 2008, 36, 189–201. [Google Scholar] [CrossRef]
- Zhou, Y.N.; Feng, L.; Chen, Y.H.; Li, J. Object-Based Land Cover Mapping using Adaptive Scale Segmentation from ZY-3 Satellite images. In Proceedings of the 2017 IEEE International Geoscience and Remote Sensing Symposium (IGARSS), Fort Worth, TX, USA, 23–28 July 2017; pp. 63–66. [Google Scholar]
- Hernandez, I.E.R.; Shi, W.Z. A Random Forests classification method for urban land-use mapping integrating spatial metrics and texture analysis. Int. J. Remote Sens. 2018, 39, 1175–1198. [Google Scholar] [CrossRef]
- Coburn, C.A.; Roberts, A.C.B. A multiscale texture analysis procedure for improved forest stand classification. Int. J. Remote Sens. 2004, 25, 4287–4308. [Google Scholar] [CrossRef]
- Mallinis, G.; Koutsias, N.; Tsakiri-Strati, M.; Karteris, M. Object-based classification using Quickbird imagery for delineating forest vegetation polygons in a Mediterranean test site. ISPRS J. Photogramm. 2008, 63, 237–250. [Google Scholar] [CrossRef]
- Pal, M.; Mather, P.M. An assessment of the effectiveness of decision tree methods for land cover classification. Remote Sens. Environ. 2003, 86, 554–565. [Google Scholar] [CrossRef]
- Pal, M. Random forest classifier for remote sensing classification. Int. J. Remote Sens. 2005, 26, 217–222. [Google Scholar] [CrossRef]
- Rodriguez-Galiano, V.F.; Chica-Olmo, M.; Abarca-Hernandez, F.; Atkinson, P.M.; Jeganathan, C. Random Forest classification of Mediterranean land cover using multi-seasonal imagery and multi-seasonal texture. Remote Sens. Environ. 2012, 121, 93–107. [Google Scholar] [CrossRef]
- Adam, E.; Mutanga, O.; Odindi, J.; Abdel-Rahman, E.M. Land-use/cover classification in a heterogeneous coastal landscape using RapidEye imagery: Evaluating the performance of random forest and support vector machines classifiers. Int. J. Remote Sens. 2014, 35, 3440–3458. [Google Scholar] [CrossRef]
- Vassileva, M.; Nascetti, A.; Giuliotonolo, F.; Boccardo, P. Unsupervised flood extent detection from SAR imagery applying shadow filtering from SAR simulated image. In Proceedings of the Geoscience & Remote Sensing Symposium, Milan, Italy, 26–31 July 2015. [Google Scholar]
Figure 1.
The study area for urban land use and land cover (LULC) classification.

Figure 2.
Multisource remote sensing images and WeChat data for urban LULC classification. (a) ZY-3 high-resolution image. (b) Landsat 8 OLI multispectral image. (c) Sentinel-1A SAR image. (d) WeChat user density data.
Figure 2.
Multisource remote sensing images and WeChat data for urban LULC classification. (a) ZY-3 high-resolution image. (b) Landsat 8 OLI multispectral image. (c) Sentinel-1A SAR image. (d) WeChat user density data.

Figure 3.
Hourly WeChat user density images created using the kernel density analysis. (a) 1 am on Monday. (b) 9 am on Monday. (c) 3 pm on Monday. (d) 6 pm on Monday.
Figure 3.
Hourly WeChat user density images created using the kernel density analysis. (a) 1 am on Monday. (b) 9 am on Monday. (c) 3 pm on Monday. (d) 6 pm on Monday.

Figure 4.
Typical LULC classes in the study area. (a) educational building. (b) commercial building. (c) greenhouse. (d) residential building. (e) industrial building. (f) urban village. (g) bare land. (h) road. (i) water and vegetation.
Figure 4.
Typical LULC classes in the study area. (a) educational building. (b) commercial building. (c) greenhouse. (d) residential building. (e) industrial building. (f) urban village. (g) bare land. (h) road. (i) water and vegetation.

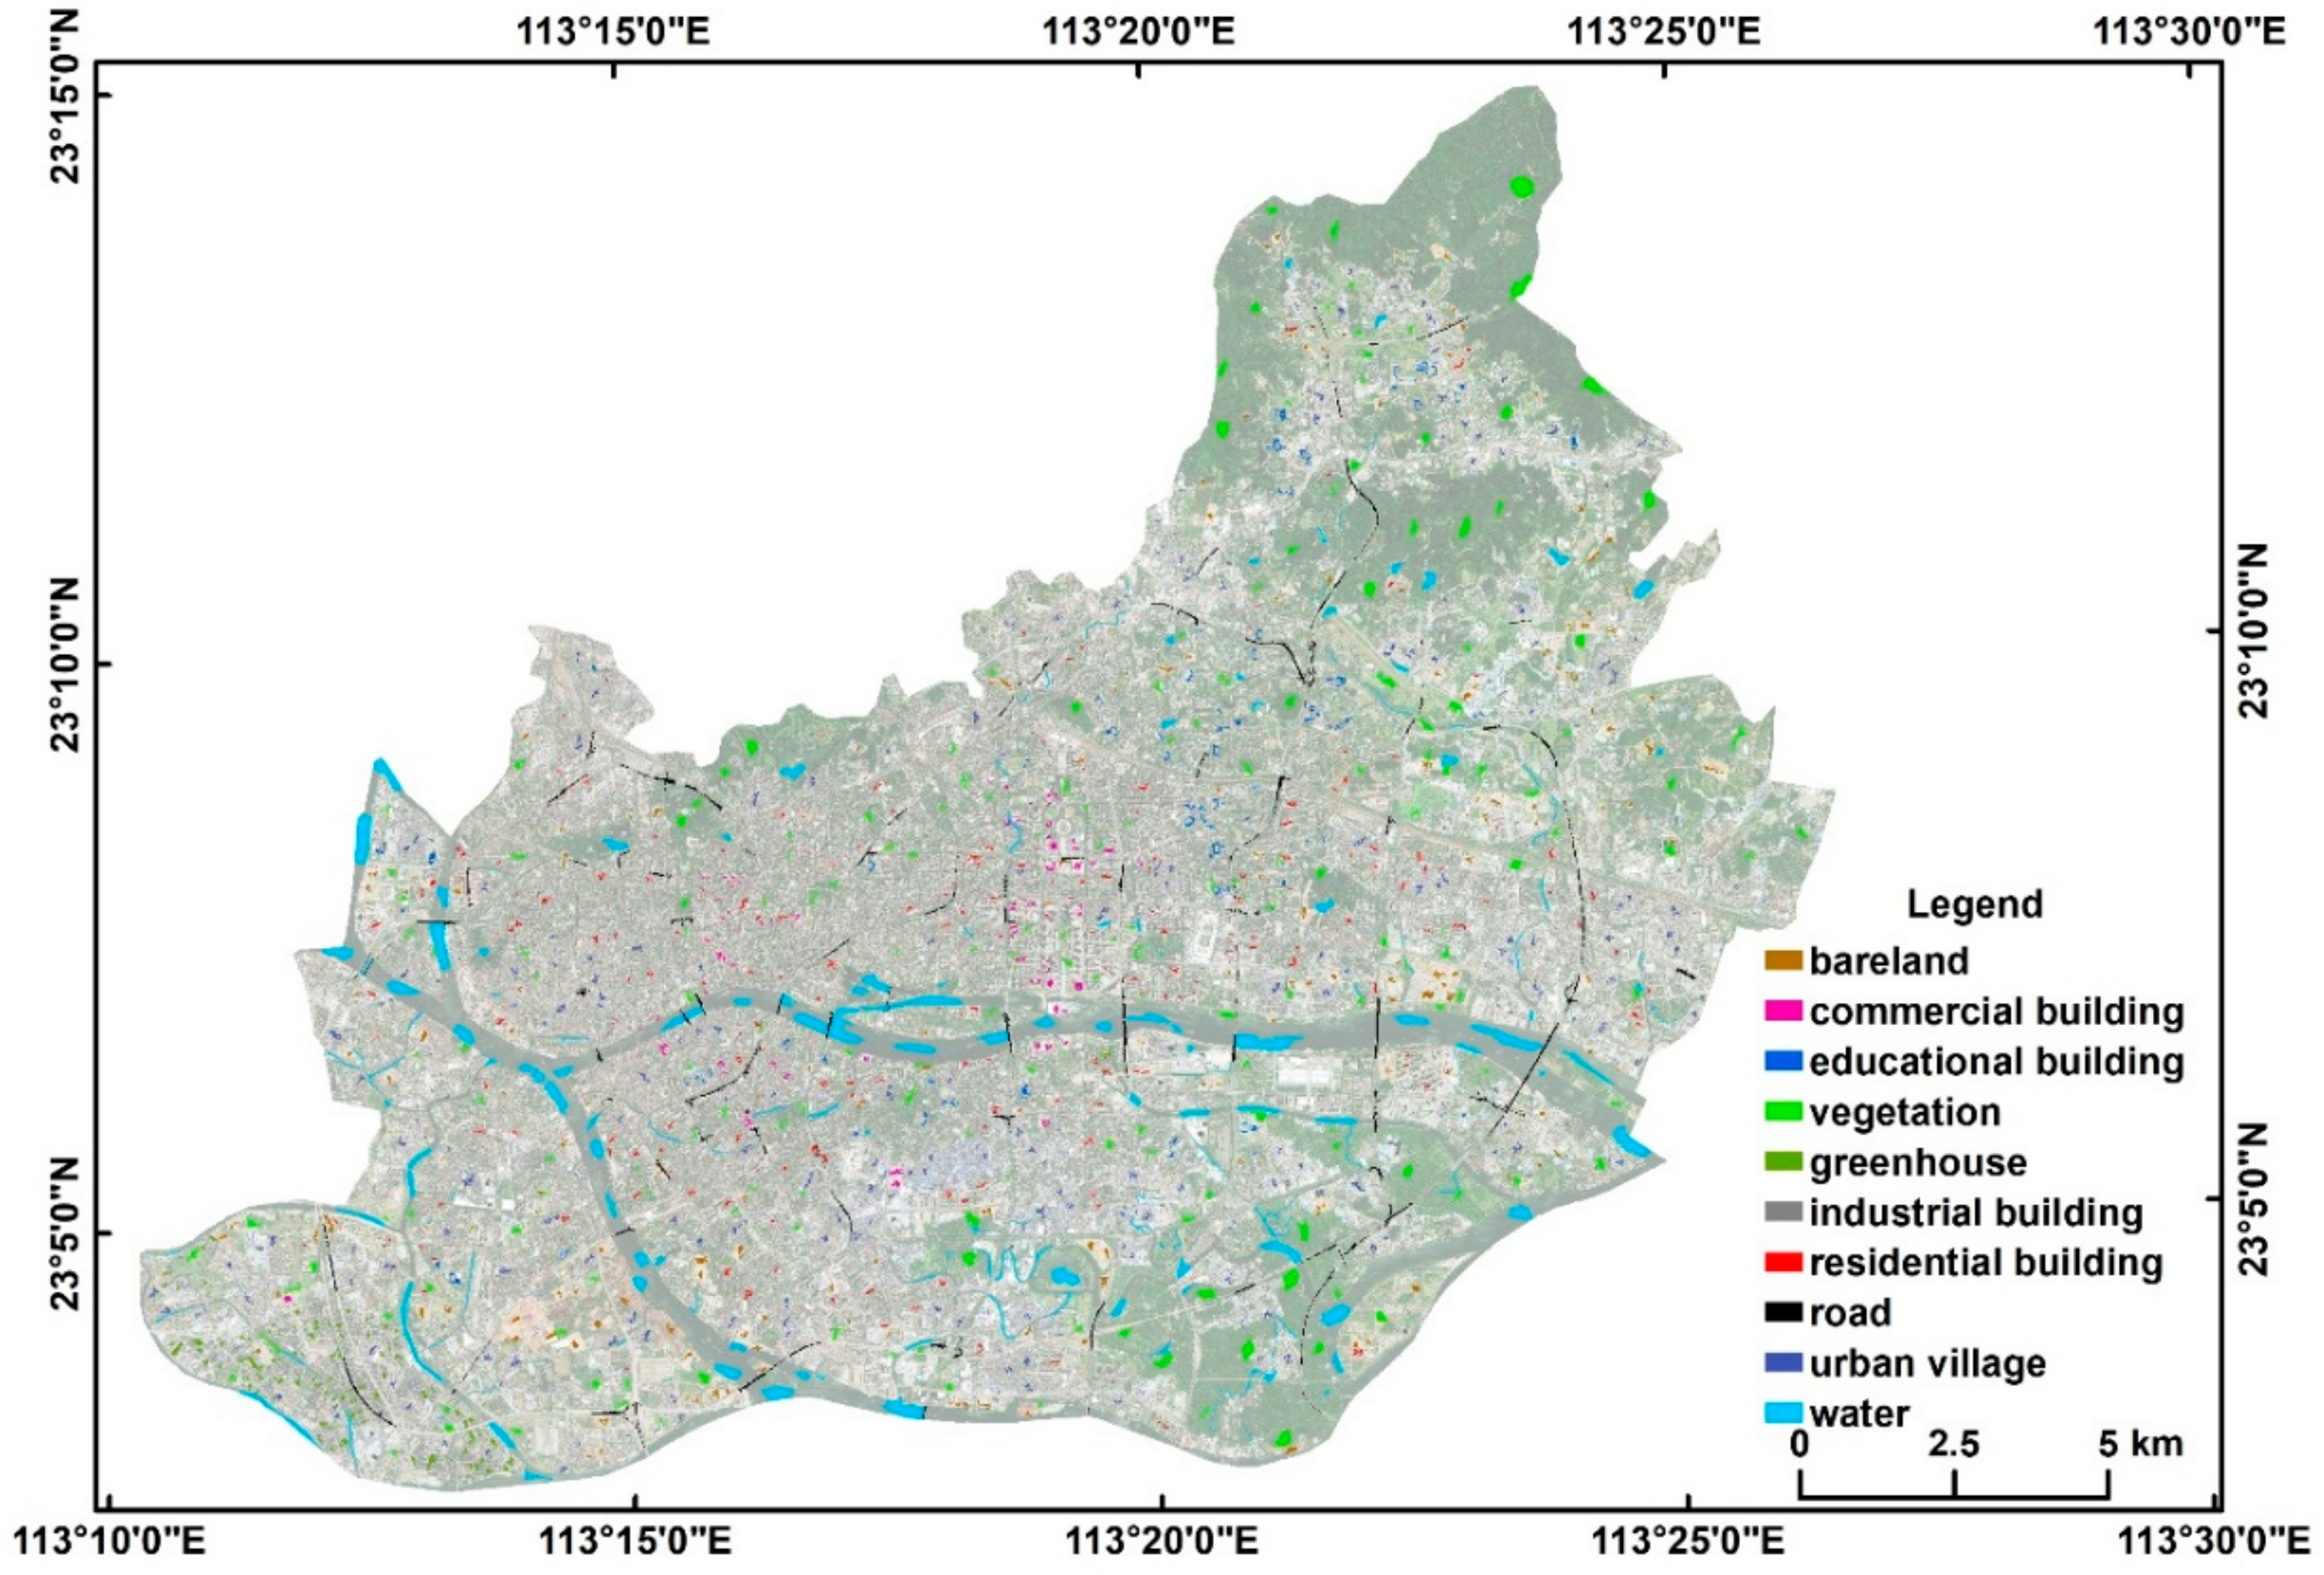
Figure 5.
Samples collected across typical LULC classes in the study area.

Figure 6.
Scheme of LULC classification using multisource remote sensing images and WeChat data.

Figure 7.
Segmentation of the ZiYuan-3 (ZY-3) image with different scale parameters.

Figure 8.
Decision tree constructed for the LULC classification using the multisource remote sensing images and WeChat data.
Figure 8.
Decision tree constructed for the LULC classification using the multisource remote sensing images and WeChat data.

Figure 9.
(a) overall accuracies and (b) kappa values achieved by the different combinations of ZY-3, Landsat 8, Sentinel-1A SAR, and WeChat data (Note: Z: ZY-3; L: Landsat 8; S: Sentinel-1A SAR; W: WeChat; GT: Geometry and textural features of ZY-3).
Figure 9.
(a) overall accuracies and (b) kappa values achieved by the different combinations of ZY-3, Landsat 8, Sentinel-1A SAR, and WeChat data (Note: Z: ZY-3; L: Landsat 8; S: Sentinel-1A SAR; W: WeChat; GT: Geometry and textural features of ZY-3).

Figure 10.
(a) producer’s accuracy and (b) user’s accuracy of each LULC class attained using ZY-3, Landsat 8, Sentinel-1A SAR, WeChat, and geometry and texture feature of ZY-3 image.
Figure 10.
(a) producer’s accuracy and (b) user’s accuracy of each LULC class attained using ZY-3, Landsat 8, Sentinel-1A SAR, WeChat, and geometry and texture feature of ZY-3 image.

Figure 11.
LULC classification results obtained using (a) ZY-3 image, (b) ZY-3 and Landsat images, (c) ZY-3 image, Sentinel-1 A SAR image, and WeChat data, and (d) ZY-3 image, Sentinel-1 A SAR image, WeChat data, and Landsat 8 OLI image.
Figure 11.
LULC classification results obtained using (a) ZY-3 image, (b) ZY-3 and Landsat images, (c) ZY-3 image, Sentinel-1 A SAR image, and WeChat data, and (d) ZY-3 image, Sentinel-1 A SAR image, WeChat data, and Landsat 8 OLI image.

Figure 12.
Improvements in the producer’s and user’s accuracies of various LULC classes made by the addition of Landsat 8 image in comparison with the use of (a) ZY-3 image and (b) ZY-3 image, Sentinel-1 A SAR image, and WeChat data.
Figure 12.
Improvements in the producer’s and user’s accuracies of various LULC classes made by the addition of Landsat 8 image in comparison with the use of (a) ZY-3 image and (b) ZY-3 image, Sentinel-1 A SAR image, and WeChat data.

Figure 13.
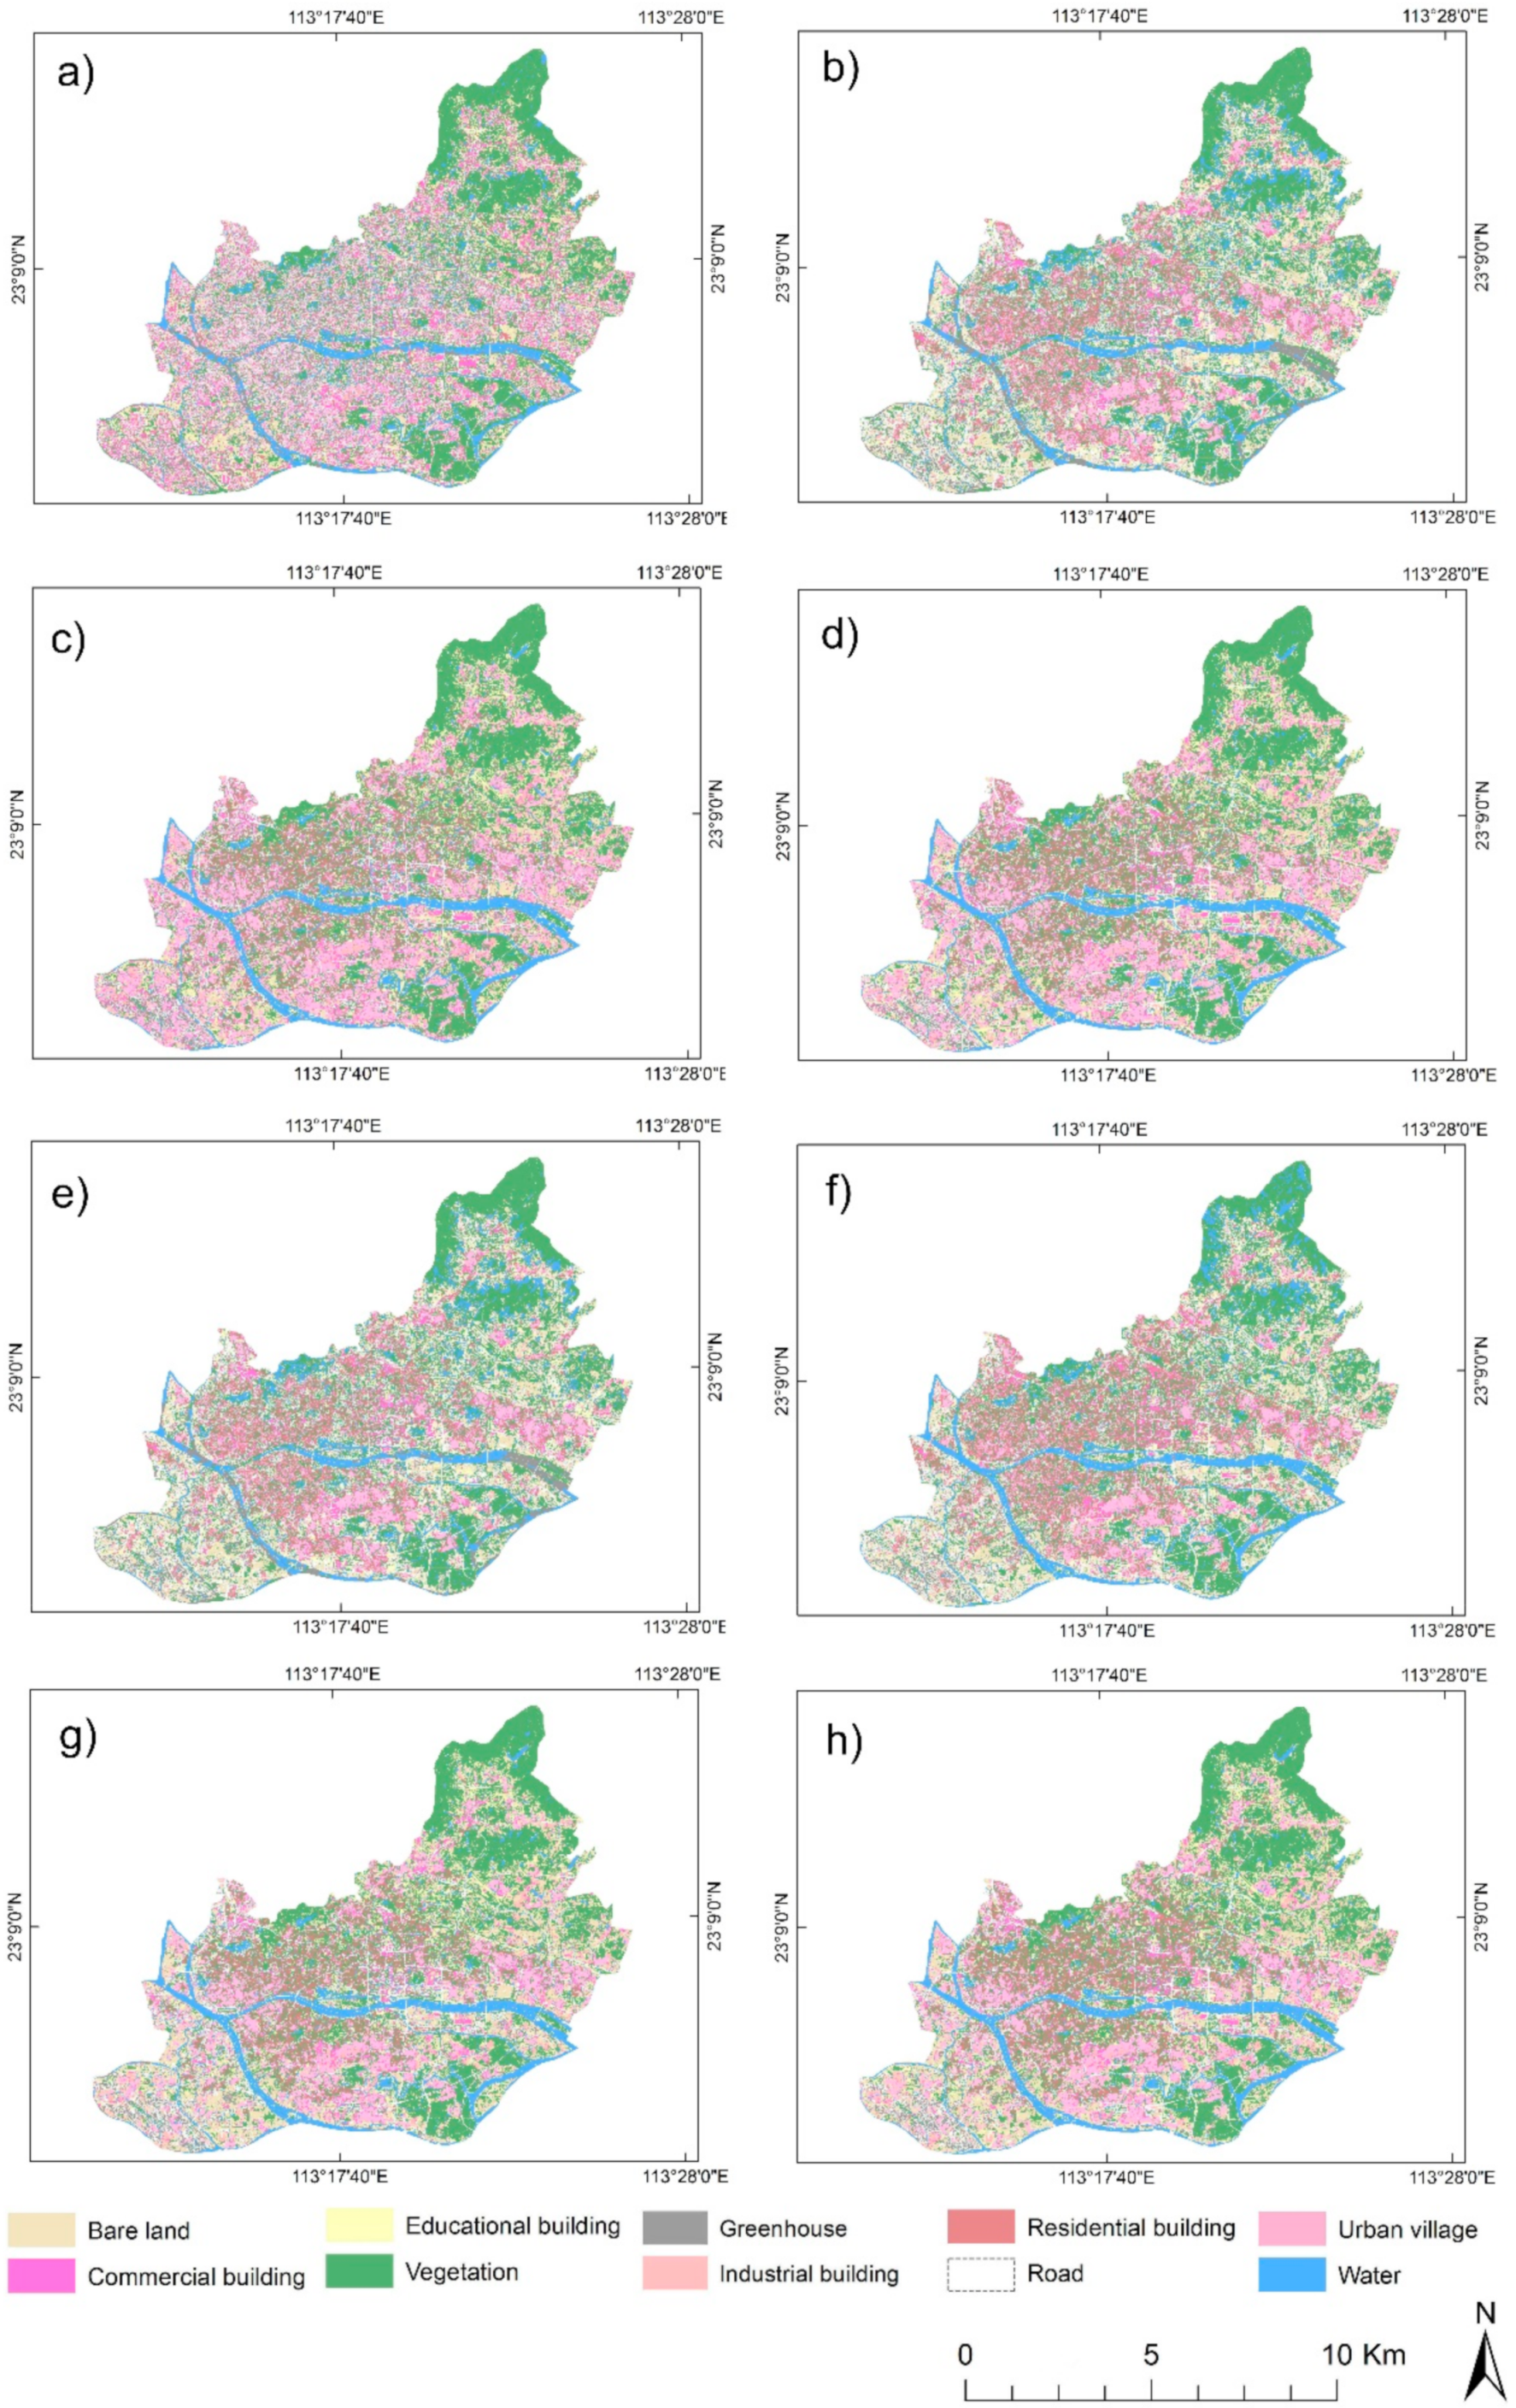
LULC classification results obtained using (a) ZY-3 image, (b) ZY-3 image and WeChat data, (c) ZY-3 and Landsat 8 OLI images, (d) ZY-3 image, Landsat 8 OLI image, and WeChat data, (e) ZY-3 and Sentinel-1 A SAR images, (f) ZY-3 image, Sentinel-1 A SAR image, and WeChat data, (g) ZY-3, Landsat 8 OLI, and Sentinel-1 A SAR images, (h) ZY-3 image, Landsat 8 OLI image, Sentinel-1 A SAR image, and WeChat data.
Figure 13.
LULC classification results obtained using (a) ZY-3 image, (b) ZY-3 image and WeChat data, (c) ZY-3 and Landsat 8 OLI images, (d) ZY-3 image, Landsat 8 OLI image, and WeChat data, (e) ZY-3 and Sentinel-1 A SAR images, (f) ZY-3 image, Sentinel-1 A SAR image, and WeChat data, (g) ZY-3, Landsat 8 OLI, and Sentinel-1 A SAR images, (h) ZY-3 image, Landsat 8 OLI image, Sentinel-1 A SAR image, and WeChat data.

Figure 14.
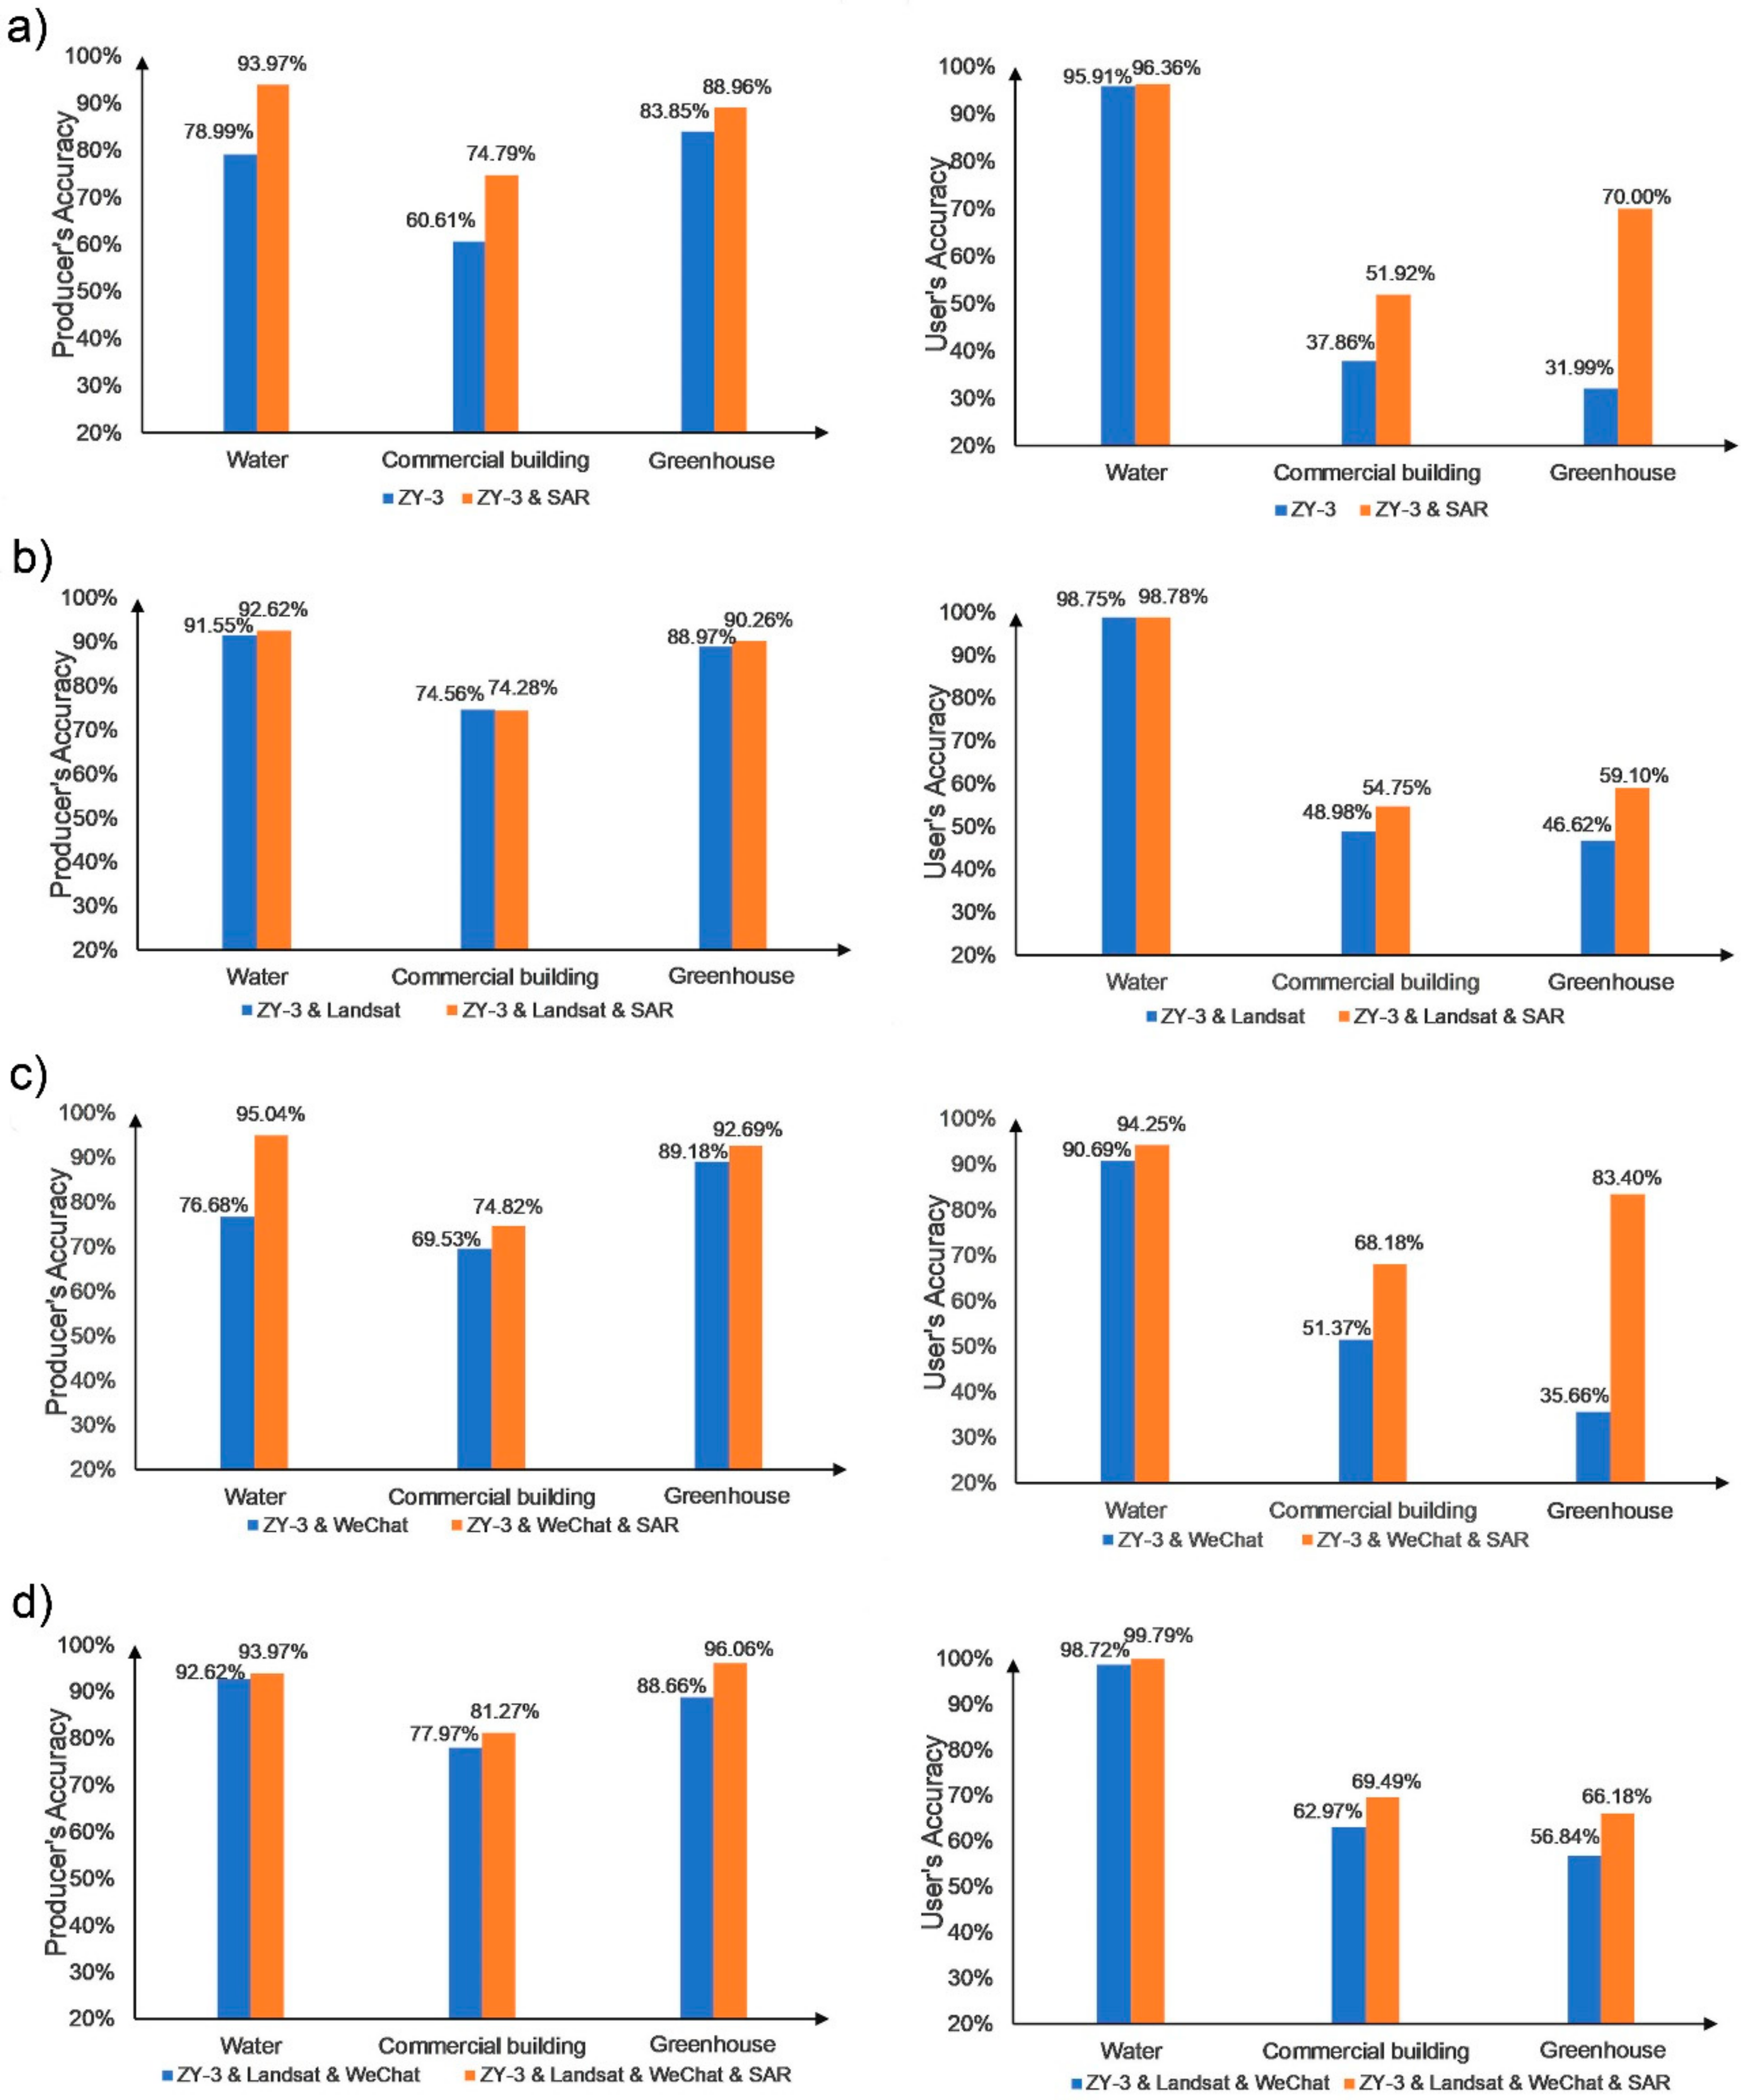
Improvements in the producer’s and user’s accuracies of commercial building, greenhouse, and urban village made by the addition of WeChat data in comparison with the use of (a) ZY-3 image, (b) ZY-3 and Landsat 8 OLI images, (c) ZY-3 and Sentinel-1 A SAR images, and (d) ZY-3, Landsat 8 OLI, and Sentinel-1 A SAR images.
Figure 14.
Improvements in the producer’s and user’s accuracies of commercial building, greenhouse, and urban village made by the addition of WeChat data in comparison with the use of (a) ZY-3 image, (b) ZY-3 and Landsat 8 OLI images, (c) ZY-3 and Sentinel-1 A SAR images, and (d) ZY-3, Landsat 8 OLI, and Sentinel-1 A SAR images.

Figure 15.
LULC classification results obtained using (a) ZY-3 image, (b) ZY-3 and Sentinel-1 A SAR images, (c) ZY-3 and Landsat 8 OLI images, (d) ZY-3, Landsat 8 OLI, and Sentinel-1 A SAR images, (e) ZY-3 image and WeChat data, (f) ZY-3 image, WeChat data, and Sentinel-1 A SAR image, (g) ZY-3 image, Landsat 8 OLI image, and WeChat data, (h) ZY-3 image, Landsat 8 OLI image, WeChat data, and Sentinel-1 A SAR image.

Figure 16.
Improvements in the producer’s and user’s accuracies of water, commercial building, and greenhouse made by the addition of Sentinel-1 A SAR image in comparison with the use of (a) ZY-3 image, (b) ZY-3 and Landsat 8 OLI images, (c) ZY-3 image and WeChat data, and (d) ZY-3 image, Landsat 8 OLI image, and WeChat data.

Figure 17.
Temporal variation in WeChat user density over a week in (a) greenhouse, (b) water, (c) road, (d) vegetation, (e) urban village, (f) residential buildings, (g) educational buildings, (h) industrial buildings, (i) commercial buildings, and (j) bare land.
Figure 17.
Temporal variation in WeChat user density over a week in (a) greenhouse, (b) water, (c) road, (d) vegetation, (e) urban village, (f) residential buildings, (g) educational buildings, (h) industrial buildings, (i) commercial buildings, and (j) bare land.

Figure 18.
(a1,b1,c1) ZY-3 images; (a2,b2,c2) LULC classification results obtained using ZY-3, Landsat 8, and Sentinel-1A SAR; (a3,b3,c3) LULC classification results obtained using ZY-3, Landsat 8, Sentinel-1A SAR, and WeChat.
Figure 18.
(a1,b1,c1) ZY-3 images; (a2,b2,c2) LULC classification results obtained using ZY-3, Landsat 8, and Sentinel-1A SAR; (a3,b3,c3) LULC classification results obtained using ZY-3, Landsat 8, Sentinel-1A SAR, and WeChat.

Figure 19.
(a1,b1) ZY-3 images; (a2,b2) LULC classification results obtained using ZY-3, Landsat 8, and WeChat; (a3,b3) LULC classification results obtained using ZY-3, Landsat 8, Sentinel-1A SAR, and WeChat.
Figure 19.
(a1,b1) ZY-3 images; (a2,b2) LULC classification results obtained using ZY-3, Landsat 8, and WeChat; (a3,b3) LULC classification results obtained using ZY-3, Landsat 8, Sentinel-1A SAR, and WeChat.


Table 1.
Multisource remote sensing images and WeChat data for urban land use and land cover (LULC) classification.
Table 1.
Multisource remote sensing images and WeChat data for urban land use and land cover (LULC) classification.
| Data | Time | Spatial Resolution | Number of Image Channels |
|---|---|---|---|
| ZY-3 | April 14, 2015 | 2 m | 3 (Blue, Green, Red) |
| Landsat 8 OLI | October 18, 2015 | 30 m | 7 (Coastal/Aerosol, Blue, Green, Red, NIR, SWIR1, Cirrus) |
| Sentinel-1A SAR | June 27, 2015 | 10 m | 2 (VV, VH) |
| June 15–21, 2015 | 25 m | 168 (hourly WeChat user density maps) |
Note: ZY-3: ZiYuan-3; OLI: Operational Land Imager; SAR: Synthetic aperture radar; NIR: Near infrared; SWIR: Short-wave infrared; V: Vertical polarization; H: Horizontal polarization.
Table 2.
A number of samples selected for each LULC type.
| LULC Types | Total | Training | Validation | |||
|---|---|---|---|---|---|---|
| Plots | Pixels | Plots | Pixels | Plots | Pixels | |
| Water | 203 | 1,203,589 | 101 | 588,520 | 102 | 615,069 |
| Urban village | 182 | 252,273 | 91 | 129,170 | 91 | 123,103 |
| Road | 237 | 349,157 | 119 | 174,948 | 118 | 174,209 |
| Residential building | 208 | 140,306 | 104 | 67,933 | 104 | 72,373 |
| Industrial building | 202 | 131,728 | 101 | 60,303 | 101 | 71,425 |
| Greenhouse | 115 | 95,698 | 57 | 50,764 | 58 | 44,934 |
| Vegetation | 212 | 663,925 | 106 | 350,264 | 106 | 313,661 |
| Educational building | 131 | 193,093 | 65 | 96,773 | 66 | 96,320 |
| Commercial building | 132 | 115,849 | 61 | 75,427 | 71 | 40,422 |
| Bare land | 201 | 242,854 | 100 | 121,110 | 101 | 121,744 |
© 2019 by the authors. Licensee MDPI, Basel, Switzerland. This article is an open access article distributed under the terms and conditions of the Creative Commons Attribution (CC BY) license (http://creativecommons.org/licenses/by/4.0/).
Share and Cite
MDPI and ACS Style
Shi, Y.; Qi, Z.; Liu, X.; Niu, N.; Zhang, H. Urban Land Use and Land Cover Classification Using Multisource Remote Sensing Images and Social Media Data. Remote Sens. 2019, 11, 2719. https://0-doi-org.brum.beds.ac.uk/10.3390/rs11222719
AMA Style
Shi Y, Qi Z, Liu X, Niu N, Zhang H. Urban Land Use and Land Cover Classification Using Multisource Remote Sensing Images and Social Media Data. Remote Sensing. 2019; 11(22):2719. https://0-doi-org.brum.beds.ac.uk/10.3390/rs11222719
Chicago/Turabian StyleShi, Yan, Zhixin Qi, Xiaoping Liu, Ning Niu, and Hui Zhang. 2019. "Urban Land Use and Land Cover Classification Using Multisource Remote Sensing Images and Social Media Data" Remote Sensing 11, no. 22: 2719. https://0-doi-org.brum.beds.ac.uk/10.3390/rs11222719
Note that from the first issue of 2016, this journal uses article numbers instead of page numbers. See further details here.