Article

Hydrologic Evaluation of TRMM and GPM IMERG Satellite-Based Precipitation in a Humid Basin of China

1
State Key Laboratory of Hydrology-Water Resources and Hydraulics Engineering, Hohai University, Nanjing 210098, China
2
Joint Innovation Center for Modern Forestry Studies, College of Biology and the Environment, Nanjing Forestry University, Nanjing 210037, China
3
Institute of Surface-Earth System Science, Tianjin University, Tianjin 300072, China
4
School of Atmospheric Sciences, and Guangdong Province Key Laboratory for Climate Change and Natural Disaster Studies, Sun Yat-sen University, Guangzhou 510275, China
5
Lancaster Environment Centre, Lancaster University, Lancaster LA1 4YQ, UK
*
Author to whom correspondence should be addressed.
Submission received: 31 December 2018 / Revised: 15 February 2019 / Accepted: 15 February 2019 / Published: 19 February 2019

Abstract

:
Tropical Rainfall Measurement Mission (TRMM) is one of the most popular global high resolution satellite-based precipitation products with a goal of measuring precipitation over the oceans and tropics. However, in recent years, the TRMM mission has come to an end. Its successor, Global Precipitation Measurement (GPM) mission was launched to measure the earth’s precipitation structure, with an aim to improve upon the TRMM project. Both of the precipitation products have their own strengths and weaknesses in resolution, accuracy, and availability. The aim of this study is to evaluate the hydrologic utilization of the TRMM and GPM products in a humid basin of China. The main findings of this study can be summarized as follows: (1) 3B42V7 generally outperforms 3B42V6 in terms of hydrologic performance. Meanwhile, 3B42RTV7 significantly outperforms 3B42RTV6, and showed close performance with the bias-adjusted TRMM Multi-satellite Precipitation Analysis (TMPA) products. (2) The GPM showed better agreement with gauge observation than the TMPA products with lower RB and higher correlation coefficient (CC) values at different time scales. (3) The VIC hydrological model generally outperformed the XAJ hydrological model with lower RB, higher Nash–Sutcliffe Coefficient of Efficiency (NSCE) and CC values; though the 3B42RTV6 and 3B42RTV7 showed higher CC values in simulating the streamflow hydrograph by using the VIC and XAJ hydrological models. It can be found that the conceptual hydrological model was enough for the hydrologic evaluation of TRMM and GPM IMERG satellite-based precipitation in a humid basin of China. This study provides a reference for the comparison of multiple models on watershed scale.

1. Introduction

Precipitation is one of the key input data for various hydrological models. The accuracy of precipitation is vital to improve hydrological simulation [1,2]. Ground-based measurement networks (radar or rain gauge) are either sparse in both time and space or do not exist at all due to the climatic conditions, human geography, and other limited conditions [3]. Remote sensing technologies potentially provide a solution to developing spatially distributed estimates of precipitation at the watershed scale. Various methods for estimating rain rates from satellite images have been proposed, from several bands of the eletro-magnetic spectrum [4].
More recently, several satellite-based precipitation products have been emerged to provide uninterrupted precipitation time series with quasi-global coverage. These satellite-based precipitation products provide an unprecedented opportunity for hydro-meteorological applications and climate studies [5,6]. Tropical Rainfall Measurement Mission (TRMM) is probably one of the most popular products with the specific goal of measuring precipitation over the oceans and tropics [7]. TRMM was launched in 1997 with its mission scheduled to last just a few years and the TRMM Multi-satellite Precipitation Analysis (TMPA) was upgraded from version 6 (V6) to version 7 (V7) in May 2012. Many studies have reported on the improvement of Version-7 TMPA over earlier Version-6 [8,9]. For example, Chen [6] thought that 3B42V7 clearly improved upon 3B42V6 over China in terms of daily mean precipitation; Yong et al. [10] reported that 3B42RTV7 represented a substantial improvement over 3B42RTV6 with respect to the systematic bias in the low-latitude Mishui basin; Liu [8] found that 3B42V7 detected more rain events than 3B42V6 in June, July, and August along with December, January and February; Jiang et al. [11] revealed that the 3B42RTV7 and 3B42V7 precipitation products had better performance in estimating precipitation in the Ganjiang River basin; Fei et al. [12] indicated that 3B42V7 was better than 3B42V6 at seasonally and monthly scales. Nevertheless, Chen et al. [6] discovered that the 3B42V7 precipitation product showed a slightly downgraded performance at daily scale in the Qinghai-Tibetan plateau.
Now the TRMM mission has come to an end, however, observation of hurricanes and precipitation from space will not end after TRMM. The Global Precipitation Measurement (GPM) mission was launched in February 2014 to improve upon the TRMM project. Since the precipitation measurement by the GPM platform was very similar to its predecessor TRMM, the development of GPM algorithms to improve precipitation retrievals can be addressed through the lessons learnt from the former TRMM mission in terms of precipitation retrievals and its associated uncertainty [13]. Tang et al. [14] evaluated the GPM Day-1 IMERG version 4 (IMERG v4) and TRMM 3B42 v7 products over Mainland China from April to December 2014 at the hourly time scale. Chen [15] compared the GPM version 5 (IMERG v5) and the TMPA (3B42 v7) over a semi-humid to humid climate transition area (Huaihe River basin) from 2015 to 2017 and both satellite precipitation products showed a high pearson correlation coefficient (r, above 0.89) with gauge observations. Omranian and Sharif [16] evaluated the GPM (IMERG) satellite precipitation products over the lower Colorado River basin, Texas, USA and they found all IMERG products performed better when the temporal and spatial resolutions were downscaled. Omranian et al. [17] investigated the Hurricane Harvey and the devastating rainfall to the Houston, Texas, USA during 25–29 August 2017, and the results indicated that the performance of IMERG product was satisfactory in detecting the spatial variability of the storm.
The satellite precipitation products have been widely applied in the hydrologic and related communities [18]. The hydrologic evaluation of TRMM 3B42 products has also been conducted, such as Tobin and Bennett [19] compared the performance of gauge observations and 3B42V6 data by using the SWAT hydrological modeling in South Texas and northern Mexico; Jiang et al. [5] employed the semi-distributed Xin’anjiang model to evaluate three widely used satellite precipitation products (TMPA 3B42V6, TMPA 3B42RT, and CMORPH) in South China and found that these satellite precipitation products have better performance in the streamflow simulation; Xue et al. [20] explored the improvements of the 3B42V7 algorithm relative to its predecessor 3B42V6 using the Coupled Routing and Excess Storage (CREST) hydrologic model in the mountainous Wangchu basin of Bhutan, and found that the 3B42V7 algorithm demonstrates a significant upgrade from 3B42V6 in precipitation accuracy, thus improving its potential hydrological utility. However, the application of satellite data for hydrological applications was still very limited [21], especially, the comparison of different hydrological models was overlooked in evaluating the satellite-based precipitation products.
Although the evaluation of TMPA and GPM satellite precipitation products has been recently investigated in many areas, their hydrological applications in a river basin are still limited. Therefore, the objectives are to (1) evaluate the TMPA and GPM precipitation products at a typical humid climate zone which is extremely vulnerable to floods and droughts [22,23,24]; and (2) compare the TMPA and GPM hydrologic performance of by using VIC and XAJ hydrological model to provide insight into model selection for supporting water resources management in a humid river basin. This work might be beneficial to the improvement of monitoring, modeling, and forecasting techniques in extreme precipitation and streamflow using satellite precipitation products.

2. Materials and Methods

2.1. Study Area

The Ganjiang River is one of the biggest tributaries of the Poyang Lake River basin. The drainage area is about 83,500 km2, accounting for 51% of the Poyang Lake River basin. The topography in this basin is complex and the elevation ranges from 2 to 2120 m above sea level. Low hills lie in the central part of the basin while alluvial plains govern the lower reaches (Figure 1). The Ganjiang River basin is controlled by the subtropical humid monsoon climate and receives approximately 1400–1800 mm of precipitation per year. The heaviest rainfall occurs in the plum rain season between April and June, while monsoon and typhoon rainstorms frequently occur between July and September.

2.2. Data

TMPA satellite rainfall products (3B42 3B42RTV6, 3B42 3B42RTV7, 3B42 3B42V6 and 3B42 3B42V7) and GPM precipitation products were used in this study (Table 1). The TMPA datasets used in this study were downloaded from the NASA website (http://trmm.gsfc.nasa.gov/). It has a high temporal (3 h) and spatial (0.25° × 0.25°) resolution. The 3B42 TMPA dataset is available in two versions: a research-quality product (3B42) released 10–15 days after each month, covering the global latitude belt from 60°N to 60°S and a near-real-time product (3B42 RT), which is released approximately 9 h after real-time with the coverage of the latitude belt from 50°N to 50°S. The main difference between the two versions is the use of the rain gauge data for bias correction, which are unavailable in real-time [25]. The 3B42RT uses the TRMM Combined Instrument (TCI) dataset, which includes the TRMM precipitation radar (PR) and TRMM Microwave Imager (TMI), to calibrate precipitation estimates derived from available Low Earth Orbit (LEO) microwave (MW) radiometers. The 3B42 adjusts the monthly accumulations of the 3-h fields from 3B42RT based on a monthly gauge analysis, including the GPCP 1° × 1° monthly rain gauge analysis and the Climate Assessment and Monitoring System (CAMS) 0.5° × 0.5° monthly rain gauge analysis [6].
Global Precipitation Measurement (GPM) is a new generation of precipitation products based on TRMM. Compared with the previous satellite precipitation data, GPM has a larger coverage along with higher spatial and temporal resolution [26]. GPM can also capture micro precipitation and solid precipitation more accurately, which is of great significance to the study of precipitation in middle and high latitudes [27]. The GPM-era precipitation product Integrated Multi-satellite Retrievals (IMERG) is the Level 3 multi-satellite precipitation algorithm of GPM. IMERG combines intermittent precipitation estimates from monthly gauge precipitation data, all constellation microwave sensors, and IR-based observations from geosynchronous satellites. IMERG is executed in near real-time and provides two precipitation estimate data options: Early and Late [28]. Early option has a 4-h lag and late provides a 12-h lag. The early option precipitation estimate data was used in this research.
Observed precipitation data comes from 35 rain gauge stations in the Ganjiang River basin during 2003–2015. And the stream flow observations at Waizhou hydrological station were used as the outlet of Ganjiang River basin in this study (Figure 1).

2.3. Hydrological Model

Xin’anjiang Model

The Xin’anjiang model, developed in 1973 and published in 1980, is a semi-distributed conceptual rainfall-runoff model [29]. It uses sub-catchments as primary hydrologic units, allowing the spatial patterns of inputs to be taken into account at the sub-catchment level. The model has been successfully and widely applied in all major river basins in China since its initial development in the 1970s. The XAJ model has a larger number of parameters. There is a clear need to have an effective and efficient method to obtain parameters from measurable quantities of watershed characteristics. The water balance of XAJ is described using the following equation:
S t + W t = S 0 + W 0 + i = 1 t ( R d a y Q s u r f E a Q l a t Q g w )
where W t is areal mean tension water storage, which includes the storage capacities of three conceptual soil layers (i.e., upper, lower, and deepest layer), and S t is the areal mean free water storage capacity. After calculating the total runoff, three components including surface runoff Q s u r f , groundwater contribution Q g w and contribution to lateral flow Q l a t are separated. By applying the Muskingum Method to successive sub-reaches, flood routing from sub-basin outlets to the total basin outlet is achieved [29].

VIC Model

The VIC model was originally developed jointly at the University of Washington and Princeton University. It is a macroscale hydrology model used to simulate various hydrologic variables as well as kinetic energy variables such as soil moisture, snowmelt, direct runoff, baseflow, and various heat flux. One of the most distinguishing features of the VIC model is that both water and surface energy budgets are resolved within each grid cell at each time step. In this study, version VIC 4.1.2 was used for the offline simulation [30].

2.4. Statistical Method

Relative bias (Bias), correlation coefficient (CC), and root mean square error (RMSE) were used to measure the differences between the four satellite products. The Bias (%) was used to measure the agreement between the averaged value of gauge data and observed data. The CC was used to assess the linearity of the correlated datasets and the RMSE was used to measure the average error magnitude. For the evaluation of hydrology skills, the indexes Bias, CC, and RMSE were also used to assess the performance of simulated stream flow. Furthermore, the Nash–Sutcliffe Coefficient of Efficiency (NSCE) was used to quantify the performance of the XAJ and VIC hydrological models. The FAR gives the fraction of spurious events among all the events satellites detect [31,32]. The POD indicates the fraction of precipitation events that were correctly detected, whereas the CSI denotes the number of correct forecasts of a rain event, divided by the total of the hits, false alarms and misses [33]. They were defined by the following equations as Table 2 [16,20,26]:
The Kolmogorov–Smirnov test (K–S test) was used in this paper. In statistics, the K–S test is a method of calibration, which compares a frequency distribution with a theoretical distribution or two observational distributions. Its original hypothesis H0: the distributions of two data sets are the same or in accord with the theoretical distribution. If the actual observed value D > Dn, H0 is rejected, the H0 hypothesis is accepted [34,35]
The Kriging interpolation method was used to resample the observed precipitation and GPM products as the TMPA spatial resolution (0.25°) to make them comparable.

3. Results

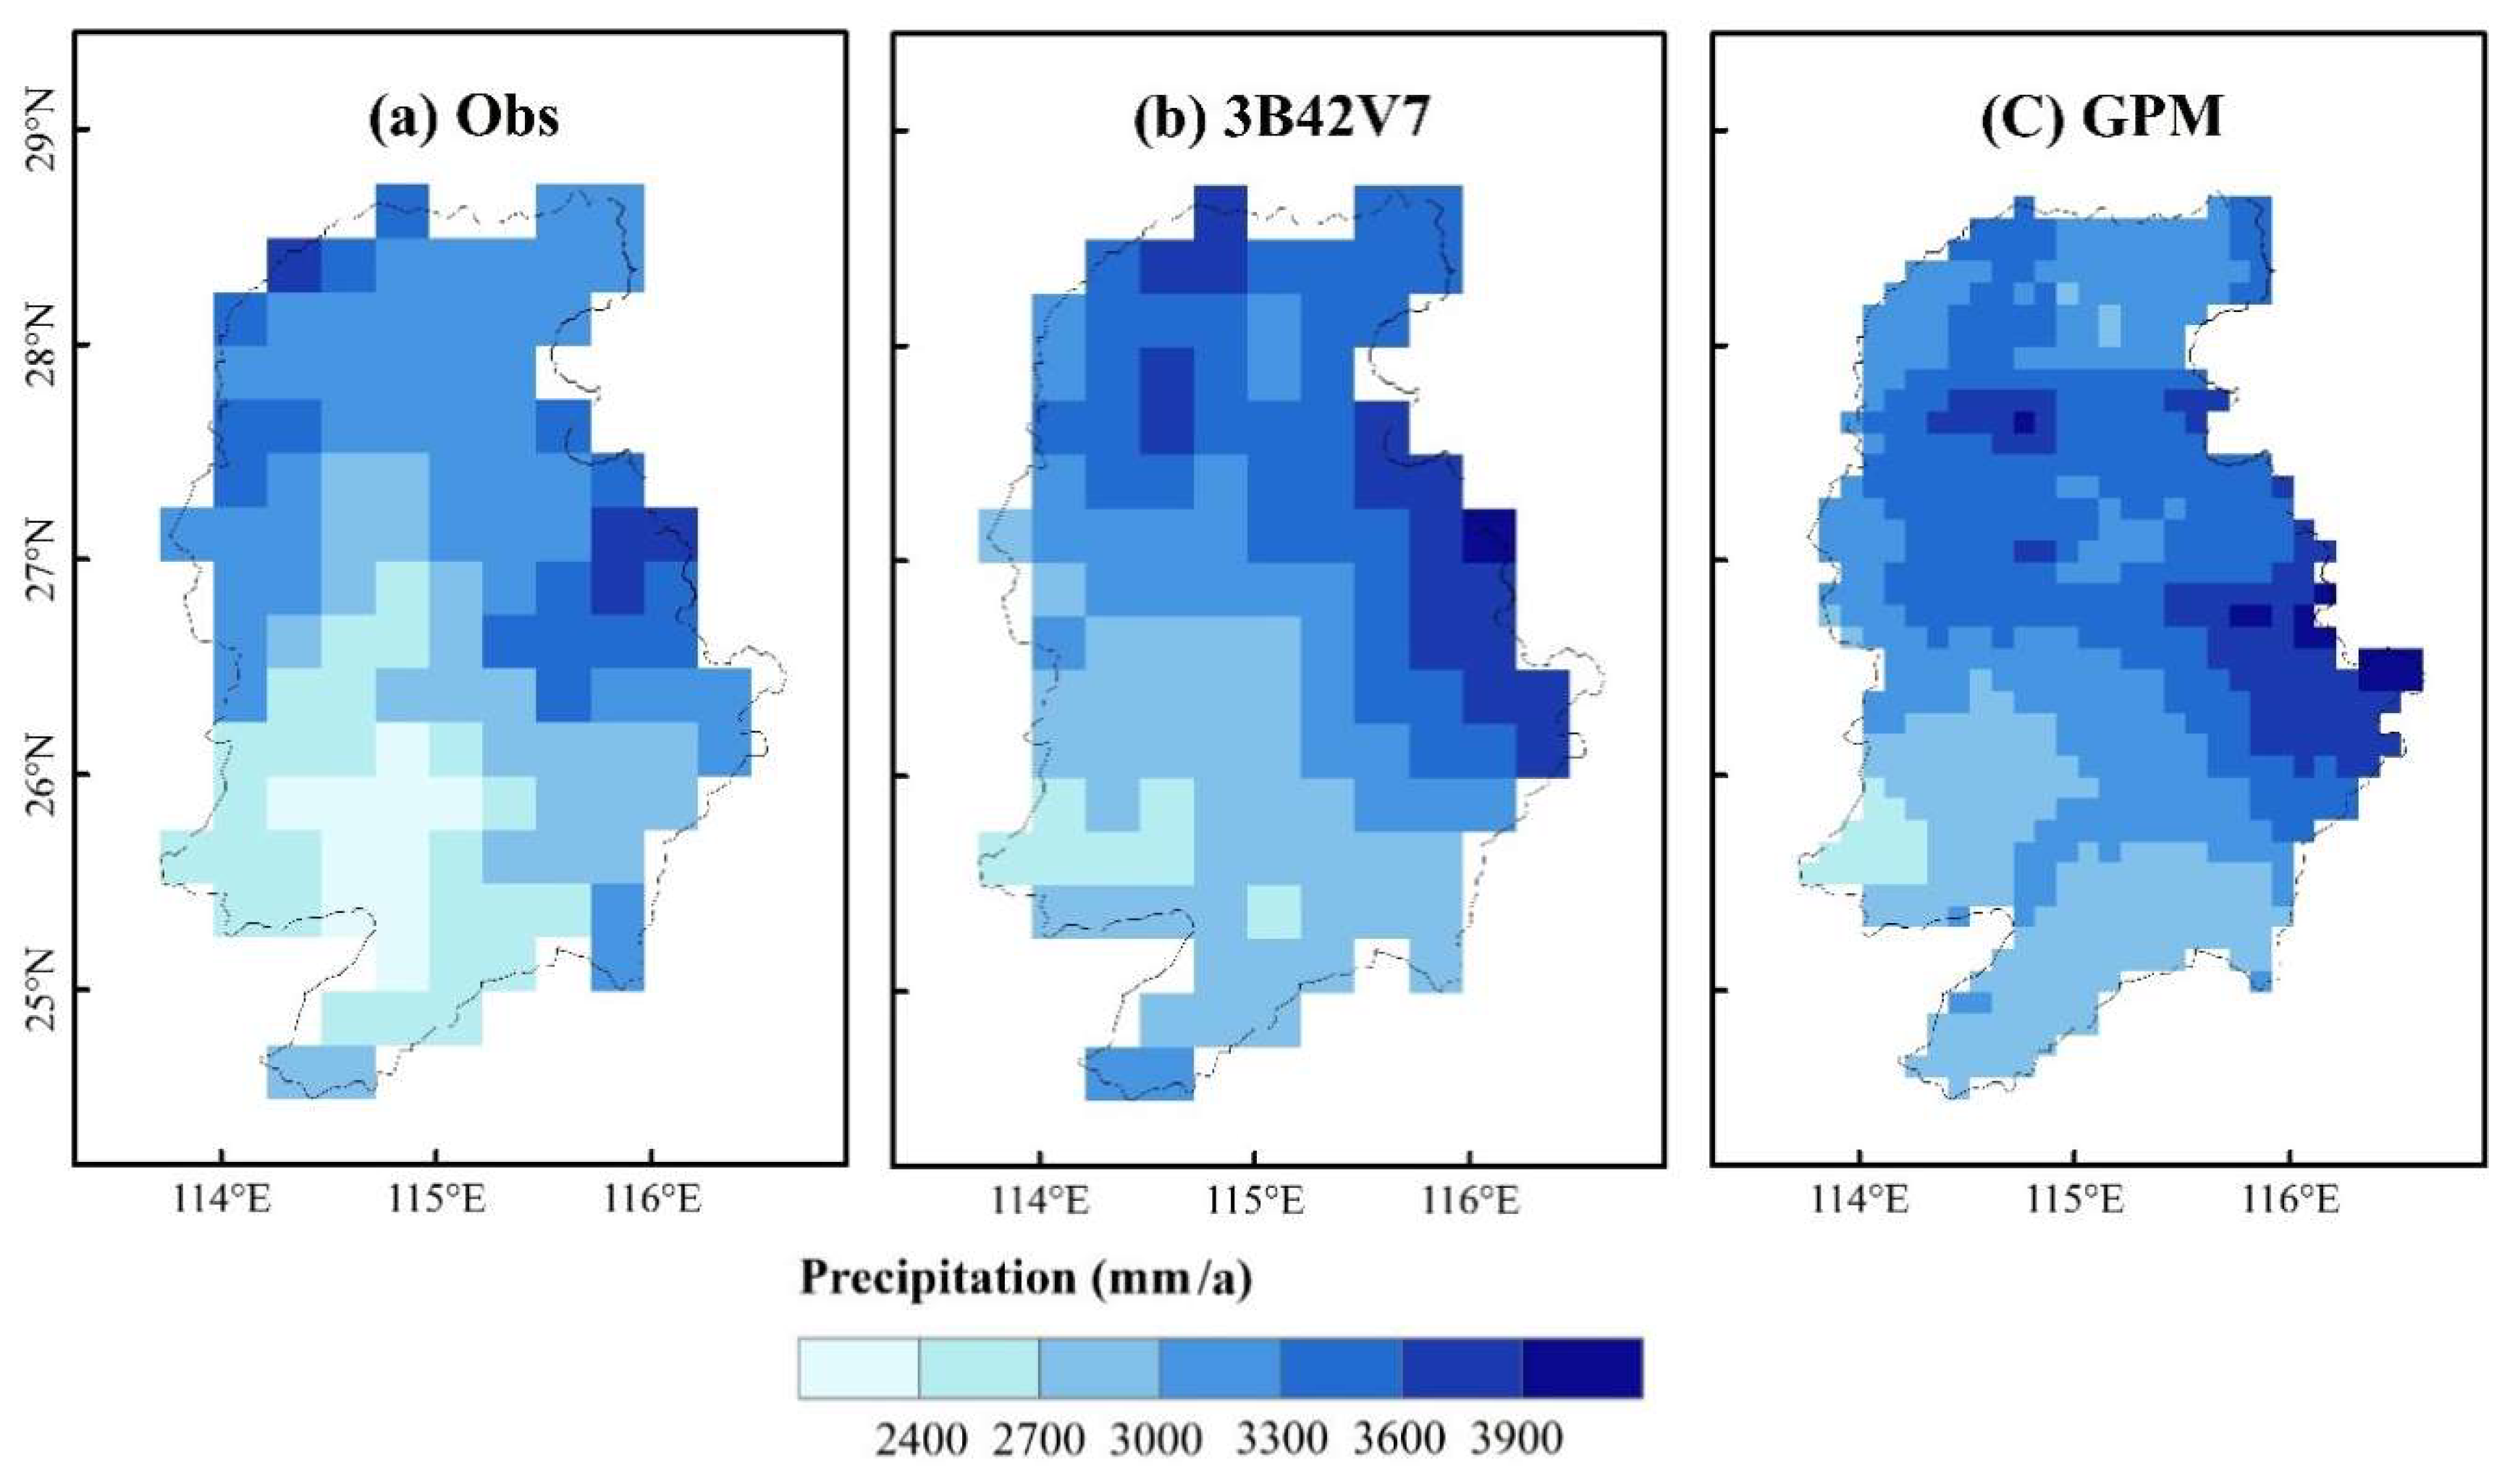
3.1. Evaluation of TRMM Precipitation Products

The spatial distribution of annual mean precipitation over the Ganjiang River basin derived from the observation and four TMPA products were analyzed during the period of 2003 to 2010 (Figure 2). It can be seen that the observed annual mean precipitation decreased from the south and west (>1951 mm) to the east and central of the Ganjiang River basin (<1250 mm) (Figure 2a). However, the annual mean precipitation has been significantly undervalued for the 3B42RTV6 product, and it was clear that 3B42RTV7 was significantly improved upon than 3B42RTV6 for the whole basin (Figure 2d,e). As for 3B42V6 and 3B42V7, both of them showed great improvement over real-time products for the precipitation estimation. It was clear that the 3B42V6 and 3B42V7 had good performance in the southern and western edge areas of the basin (Figure 2b,c). Therefore, the bias-adjusted TMPA products 3B42V6 and 3B42V7 showed better agreement with gauge observation than the unadjusted counterparts 3B42RTV6 and 3B42RTV7, especially in capturing the spatial pattern of multi-year precipitation, and temporal pattern of timing, probability distribution of occurrence, and volume. The 3B42V6 and 3B42V7 agreed well with gauge observation with lower RB and high CC at monthly scale. It can be seen that lower annual mean precipitation appeared in the middle reaches of the Ganjiang River basin based on the observed precipitation. However, this “basin” pattern phenomenon did not appear in the TMPA products. This may be a consequence of 3B42V6, 3B42V7 and 3B42RTV7 overestimating the precipitation in the middle reaches of the Ganjiang River basin (Figure 2b,c,e).
The comparison between the GPM and 3B42V7 over the Ganjiang River basin from 2014 to 2015 was shown in Figure 3. Similar results can be found that the observed annual mean precipitation decreased from the north to the east and lower precipitation areas mainly distributed in the central and southwestern basin. The 3B42V7 overestimated annual mean precipitation in the north and east of Ganjiang River basin while GPM overestimated the precipitation in the east and central regions of the Ganjiang River basin. The 3B42V7 and GPM products generally captured the spatial pattern of precipitation over the Ganjiang River basin, and the GPM agreed better with gauge observation than that of the 3B42V7 at daily scale.
The annual mean TMPA and observed precipitation at different time scales in the Ganjiang River basin from 2003 to 2010 were shown in Figure 4. It can be seen that all of the four TRMM products showed good performance at daily, monthly and annual time scales. However, the 3B42RTV6 product underestimated the monthly precipitation obviously and the product of 3B42RTV7 overestimated the monthly precipitation slightly. As for the annual time scale, it has been greatly underestimated by the 3B42RTV6 precipitation product (Figure 4c). This phenomenon was similar to that of the daily time scale. In addition, it can be found that the TMPA precipitation got its maximum value between May and July, and reached its minimum value around December during the period of 2003 to 2010.
The correlations between the TMPA and observed precipitation has been analyzed in Table 3. It can be seen that all of the TMPA products slightly overestimated the precipitation, except for the 3B42RTV6, which strikingly underestimates the precipitation by 24.15% at the daily time scale. The RMSE and CC value were 5.98 mm and 0.72 for the 3B42RTV6 product, respectively. In addition, the RB, RMSE and CC values were 3.60%, 5.56 mm, and 0.80 for the 3B42V6 product in the Ganjiang River basin, respectively. The 3B42RTV7 showed better performance with high CC (0.79), low RMSE (5.69mm), and low RB value (2.97%). And the 3B42V7 had much better performance with higher CC (0.82), lower RMSE with the value of 5.24 mm, and lower RB (2.95%). Generally, the 3 B42V7 product performed much better than other TMPA products in terms of RB, RMSE, and CC. When it came to the monthly scale, the 3B42RTV6 underestimated the precipitation by 26.25% as a whole. However, the 3B42RTV7 showed much bettr than that of 3B42RTV6 with slight underestimation by 0.30% as a whole. The 3B42RTV6 and 3B42RTV7 showed good correlations with the gauged precipitation, but the 3B42RTV7 had better performance with higher CC (0.90 vs. 0.86) and better RMSE (1.63 mm vs. 1.96 mm). From the monthly statistics of satellite rainfall products (Table 3), the 3B42V6 was observed to achieve all the best indexes of RB (0.01%) and CC (0.95) except RMSE (1.04 mm), and the 3B42V7 was found to attain all the best indexes of RMSE (1.00 mm) and CC (0.95) except RB (1.06%). Overall, 3B42V6 and 3B42V7 perform better than 3B42RTV6 and 3B42RTV7.
Figure 5 showed the daily and monthly precipitation time series for the GPM, 3B32V7, and observed precipitation in the Ganjiang River basin from May 2014 to October 2015. It can be found that there was a good relationship between the GPM and observed precipitation products at daily and monthly scales. Similar results can also be found between the 3B42V7 and observed precipitation. Both of the 3B42V7 and GPM precipitation products were close to that of gauge observations with high CC value at daily and monthly time scale. In addition, there was only small magnitude of overestimation 1.90% and when it came to the monthly scale 1.34% for 3B42V7 and GPM, respectively. Although the RB value of GPM was better than 3B42V7, the RMSE of GPM was higher than that of 3B42V7 (17.08 mm vs. 16.29 mm).
The statistical indices (POD, CSI, and FAR) at the daily time scale for different rainfall thresholds are shown in Figure 6. High values of POD and CSI at rainfall rates from 0.5–10.0 mm/day indicated that TMPA precipitation products had better performance (Figure 6a,b). The POD and CSI value decreased with the rainfall rate increasing, and the FAR increased at the same time which revealed the limitation of TMPA products for detecting heavy rainfall events (Figure 6a–c). Therefore, it can be found that all the TRMM products except 3B42RTV6 showed good performance in detecting precipitation in the Ganjiang River basin, especially for rainfall rates of 0.5–10.0 mm/day. Higher POD and CSI values at 0.5–5.0 mm/day rainfall rates can be found in Figure 6. This phenomenon revealed that both GPM and 3B42V7 precipitation products performed much better at these rainfall rates. However, the 3B42V7 product showed better performance than the GPM product in detecting precipitation in the Ganjiang River basin, especially at rainfall rates from 0.5–6.0 mm/day. Above all, the 3B42V7 showed the best performance for the detecting precipitation events in the Ganjiang River basin.

3.2. Hydrologic Model Calibration

The MOCOM-UA algorithm was used in this paper to calibrate the XAJ and VIC hydrologic models’ parameter automatically. The method is an effective and efficient methodology for solving the multiple-objective global optimization problem which is an extension of the successful SCE-UA single-objective global optimization algorithm [36]. The XAJ and VIC model Calibrated paraments and calibrated values in Ganjiang River Basin were shown in Table 4 and Table 5, respectively.
Table 5 showed the calibrated parameters and calibrated values in Ganjiang River basin. The B, Ws, Ds, Dsmax, d0, d1 and d2 were 0.236, 0.533, 0.481, 13.748, 0.300, 2.430 and 0.533, respectively.
Figure 7 compared the simulated streamflow forced by rain gauge data with the observed streamflow in terms of time series plots at daily scales. The calibration period was selected from 2003 to 2004 and the simulation period was selected from 2005 to 2010. The results showed that both models were good at simulating the daily hydrograph in this basin and the VIC model has a better effect than the XAJ hydrological model. It can be found that a general agreement existed between the observed and simulated streamflow. However, the simulated streamflow consistently underestimates the peaks, especially in the simulation period and in relatively low flow seasons as well (Figure 7a,b).

3.3. Hydrologic Model Simulation

The estimated streamflow by VIC hydrological model as well as XAJ hydrological model driven by observed precipitation and TMPA products of the Ganjiang River basin was shown in Figure 8. It was noted that the simulated streamflow by the VIC hydrological model driven by 3B42V6 and 3B42V7 agreed well with that of observed precipitation with high CC values (0.88 and 0.89), high NSCE (0.78 and 0.79) and low RB (0.13% and 0.99%), respectively. Therefore, the 3B42V7 products were better than 3B42V6 for the streamflow simulation when using the VIC hydrological model. However, the RB, NSCE and CC values were 28.15%, 0.66 and 0.88 by using the XAJ hydrological model driven by the 3B42V7 product in the Ganjiang River basin, respectively. It was clearly that the VIC hydrological model demonstrated better performance than the XAJ hydrological model with a higher NSCE value except for the 3B42RTV6 product.
The VIC hydrological model was used to evaluate the 3B42V7 and GPM products hydrologic utility in the Ganjiang River basin during the period March 2014 to June 2015. As was shown in Figure 9, the patterns of the simulated streamflow based on the 3B42V7 and GPM precipitation data by using VIC hydrological model in the Ganjiang River basin were similar to that of the observed streamflow. However, the simulated streamflow consistently underestimated the peaks between 12 June 2014 and 12 December 2014, especially in the period from 12 June 2014 and 12 September 2014. Overall, a good agreement existed between the observed and simulated series in the daily time scales.
Cumulative probabilities of precipitation and streamflow in the Ganjiang River basin were shown in Figure 10. The results showed that the cumulative probabilities of precipitation in the Ganjiang River basin for the 3B42RTV7, 3B42V6, and 3B42V7 products were higher than that of observed precipitation, while the cumulative probability of precipitation for the 3B42RTV6 was lower than that of the observed precipitation. It indicated that the cumulative probabilities of streamflow simulation driven by TMPA products were higher than that of the observed precipitation in the Ganjiang River basin by using the XAJ hydrological model. Generally, the cumulative probabilities of streamflow by the VIC hydrological model driven by the observed precipitation, 3B42RTV7, 3B42V6 and 3B42V7 were similar to that of the observed streamflow in the Ganjiang River basin. Meanwhile, the cumulative probability of precipitation by the VIC hydrological model driven by 3B42RTV6 was much lower than that of observation. Moreover, the differences between the observed and simulated probability distributions were significant by using the Kolmogorov–Smirnov statistic method (p < 0.05).
The statistical indices (POD, CSI, and FAR) for different streamflow thresholds of the VIC and XAJ models were shown in Figure 11. High values of POD and CSI at streamflow from 2000–6000 m3/s indicated that VIC model driven by TRMM precipitation products performed better (Figure 11a,b). However, there was a poor performance for the 3B42RTV6 precipitation in the streamflow simulation by using the VIC model. The POD and CSI values decreased obviously while the FAR increased as the streamflow getting bigger and bigger, which indicated the limited capability of VIC model driven by 3B42RTV7, 3B42V6 and 3B42v7 for detecting large streamflow (Figure 11a–c). The relatively higher POD and CSI also revealed that all the TRMM products showed good performance in simulating streamflow in the humid basin of China except 3B42RTV6 by using the VIC model, especially for streamflow rates of 2000–6000 m3/s. As was shown in Figure 11, there was a good performance in simulating streamflow in the Ganjiang River basin, especially for the streamflow from 2000–7000 m3/s. It also can be found that both the GPM and 3B42V7 precipitation products performed well in simulating extreme streamflow in this basin by using VIC hydrologic model, especially for the streamflow simulation from 2000–5000 m3/s. However, the product of 3B42V7 performed much better than the GPM product in detecting extreme streamflow events, especially for the streamflow 0f 2000–7000 m3/s (Figure 11g–i).

4. Discussion

Satellite precipitation products have played an important role in hydro-relation applications by hydrologic modelers, climate searchers and scientists in other scientific communities [5,8,18]. The upgrade of TMPA from 3B42V6 to 3B42V7 provides the users with higher-quality QPE products that were better in applications. In this paper, we found that the upgraded 3B42V7 TMPA precipitation products, including research product and the real-time product, showed distinct improvement over previous 3B42V6 counterparts in a humid basin (Ganjiang River basin). This conclusion was the same as many other researches [37]. For example, Huang et al. [38] revealed that 3B42V7 and 3B42RTV7 have higher precipitation estimation accuracy than 3B42V6 and 3B42RTV6. Fei et al. [12] revealed that 3B42V6 and 3B42V7 agreed well with the actual annual rainfall at the year scale in humid southern China, while the two products had poor performance at the day and month scale. Zhu et al. [39] demonstrated that the two 3B42 products agreed better with gauge precipitation data than the two products of 3B42RT. Fei et al. [12] and Huang et al. [38] indicated that the 3B42V7 product has the highest precipitation estimation accuracy, which could understand the complex hydrological process better, while the product of 3B42RTV7 showed a greater improvement than 3B42RTV6.
The success of 3B42V7 TMPA casts a confidence vote for the TMPA developers in developing higher resolution QPE products with observations from the GPM that was launched in February of 2014. In this paper, the GPM precipitation products showed better agreement with gauge observation than the 3B42V7, which agreed fairly with gauge observations with lower RB (1.34%) and higher CC (0.99) at monthly scale. However, there were no significant advantages for the GPM precipitation product than that of the 3B42V7, which was different to previous studies [37,40]. The reason may be that the GPM IMERG data were resampled to the same spatial resolution by using the Kriging interpolation method (0.25°) to make them comparable. The potential errors would possibly be introduced during the resampling procedure. Other researchers have made similar findings, for example, Chen Cheng et al. [15] investigated the impact of the initial (0.25°) and the interpolated (0.1°) TRMM data had different performances at multiple scales, and they thought there might be a typical scale mismatch issue between point-based rain gauge data and the gridded precipitation products, therefore the comparison of different interpolation methods is necessary to obtain higher precision for precipitation. Omranian [16] also studied the impact of temporal and spatial downscaling of different satellite products (near/post-real-time) on their accuracy and they found that the GPM satellite rainfall products showed better performance when the temporal and spatial resolutions were downscaled.
The accuracy of precipitation is important for the improvement of hydrological simulation [1,2]. The hydrologic performance of TMPA and GPM IMERG satellite-based precipitation were evaluated by using the VIC and XAJ hydrological models in the Ganjiang River basin of China. This paper compared the streamflow simulated by the XAJ and VIC hydrological models using satellite products. It can be found that the simulated streamflow driven by the products of 3B42RTV7 (V7) performed better than the 3B42RTV6 (V6). And the VIC hydrological model outperformed the XAJ hydrological model with lower RB, higher NSCE, and higher CC values. Although the VIC and XAJ hydrological models can be used in the streamflow simulation in the Ganjiang River basin, the streamflow simulated by the VIC hydrological model driven by the 3B42V7 underestimated by 0.99%, and it overestimated the streamflow by 23.16% driven by XAJ hydrological model. As a whole, the 3B42V7 TMPA precipitation products, especially the real-time product 3B42RTV7, showed better potentials than that of 3B42RTV6 (V6) in hydrology utility. Some researches obtained the same conclusion [11,38]. Huang et al. [38] and Chen et al. [25] found that the product of 3B42RTV7 performed better than the 3B42RTV6 product in the hydrological simulation as well. The 3B42RTV7 and 3B42V7 products could simulate the streamflow well by utilizing the VIC and XAJ hydrological model, respectively [11]. Different spatial and temporal resolutions can also change the accuracy of the satellite products and subsequently alter the accuracy of the hydrological simulation. Therefore, the TRMM-era satellite rainfall products still have limitations in terms of resolution and accuracy in the complex areas, especially for the mountainous [21,41,42].
Estimating precipitation accurately is very important due to their susceptibility to hazards [43]. Hence, caution should be kept in the minds of TMPA users for hydrological modeling and natural hazards modeling and monitoring when TMPA products are used as inputs. Mei and Anagnostou [43] indicated the products of 3B42V6 and 3B42V7 performed better in quantifying and detecting hazards. Jiang et al. [11] revealed that the 3B42RTV7 and 3B42V7 products showed nice performance in estimating extreme precipitation in the Ganjiang River basin. Omranian et al. [18] found that the GPM product could reconstruct precipitation and recognize the spatial variability of the storm well. Prakash et al. [44] also indicated that the product of GPM performed much better than the TRMM products in detecting heavy rainfall in India. As for the hydrologic utilization, Jiang et al. [11] used the VIC hydrological model to simulate the streamflow in the Ganjiang River basin, and discovered that 3B42RTV7/3B42V7 precipitation products perform nicely in the extreme streamflow estimation in this basin. Tang et al. [14] and Wang et al. [45] revealed that the GPM showed better hydrological performance than the product of 3B42V7 at the mid-latitude and high-latitude, along with relatively dry climate regions. However, Chen et al. [13] found that the 3B42RTV7 product presented a slight downgraded performance than the product of 3B42RTV6 at the daily scale. Both of the TMPA and GPM precipitation products have their own strengths and weakness and different models perform differently in the streamflow simulation [46]. It was expected that the 3B42RTV7 (V7) and GPM IMERG will further improve the QPE products for hydro-meteorological applications such as floods and landslide.

5. Conclusions

This study evaluated four widely used global high-resolution satellite precipitation products against gauge observations and higher resolution QPE products with observations from GPM over the Ganjiang River basin. Numerous satellite precipitation validation studies have been implemented with an aim to give both products’ users and algorithm developers the information about the quality of satellite precipitation estimates. The main findings of this study can be summarized as follows:
(1)
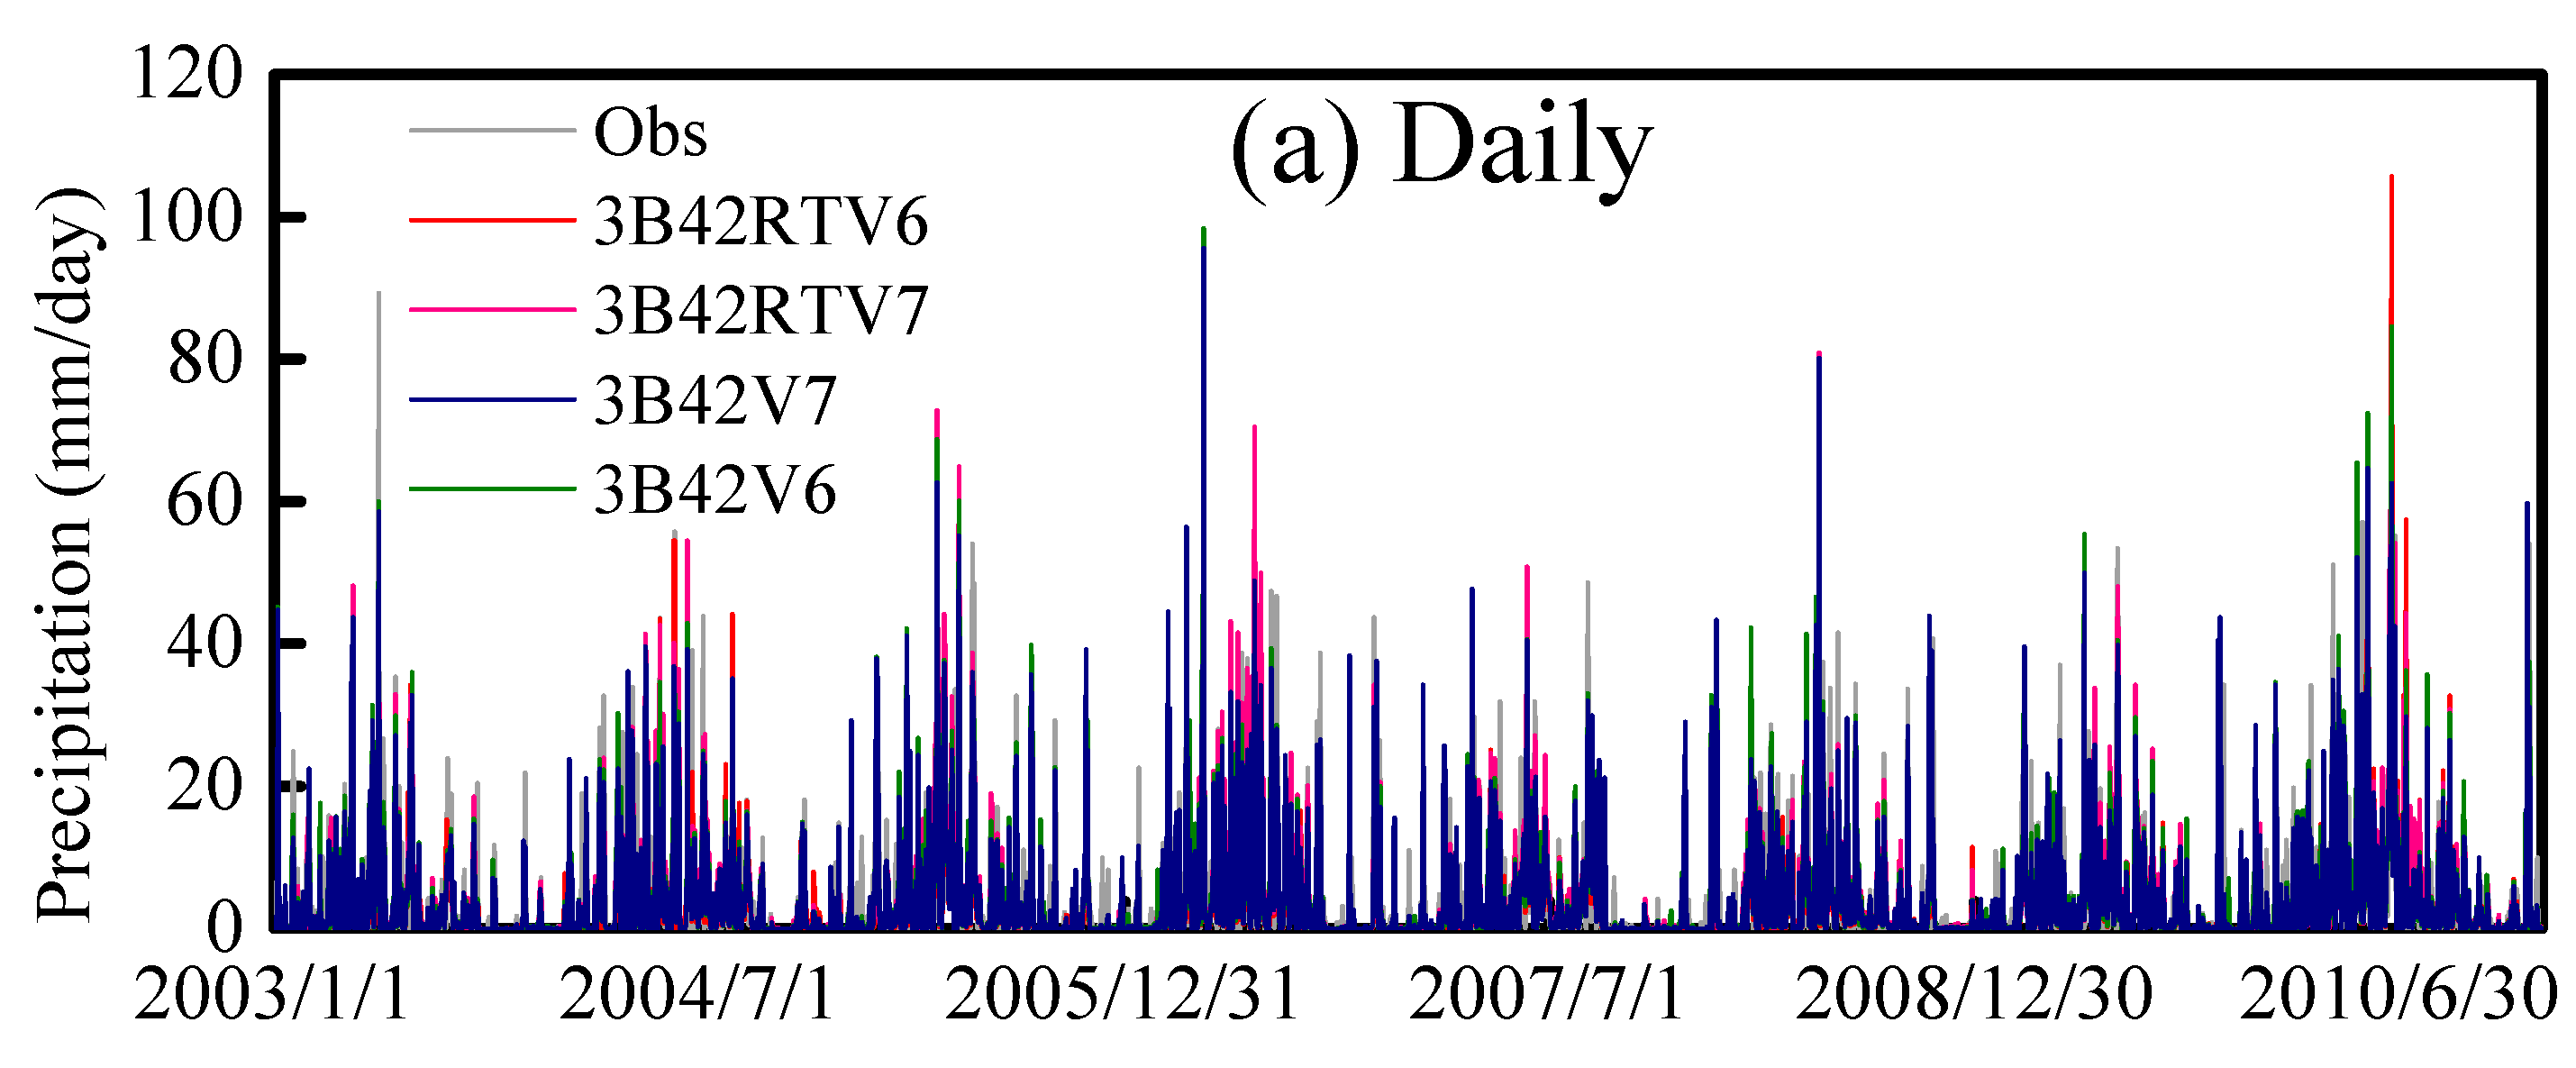
The 3B42RTV7 (RB = 2.97%, RMSE = 5.69 mm, and CC= 0.79) had better performance than that of 3B42RTV6 (RB = −24.15%, RMSE = 5.98 mm, and CC = 0.72). And the 3B42V7 (RB = 2.95%, RMSE = 5.24 mm, and CC = 0.82) perform better than that of 3B42V6 (RB = 3.60%, RMSE = 5.56 mm, and CC = 0.80) with higher CC and lower RMSE value at daily time scale. For the monthly statistics of satellite rainfall products, the 3B42V6 was observed to achieve all the best indexes of RB (0.01%) and CC (0.95) except RMSE (1.04 mm), and the 3B42V7 was found to attain all the best indexes of RMSE (1.00 mm) and CC (0.95) except RB (1.06%). Overall, the 3B42V6 and 3B42V7 perform better than the 3B42RTV6 and 3B42RTV7.
(2)
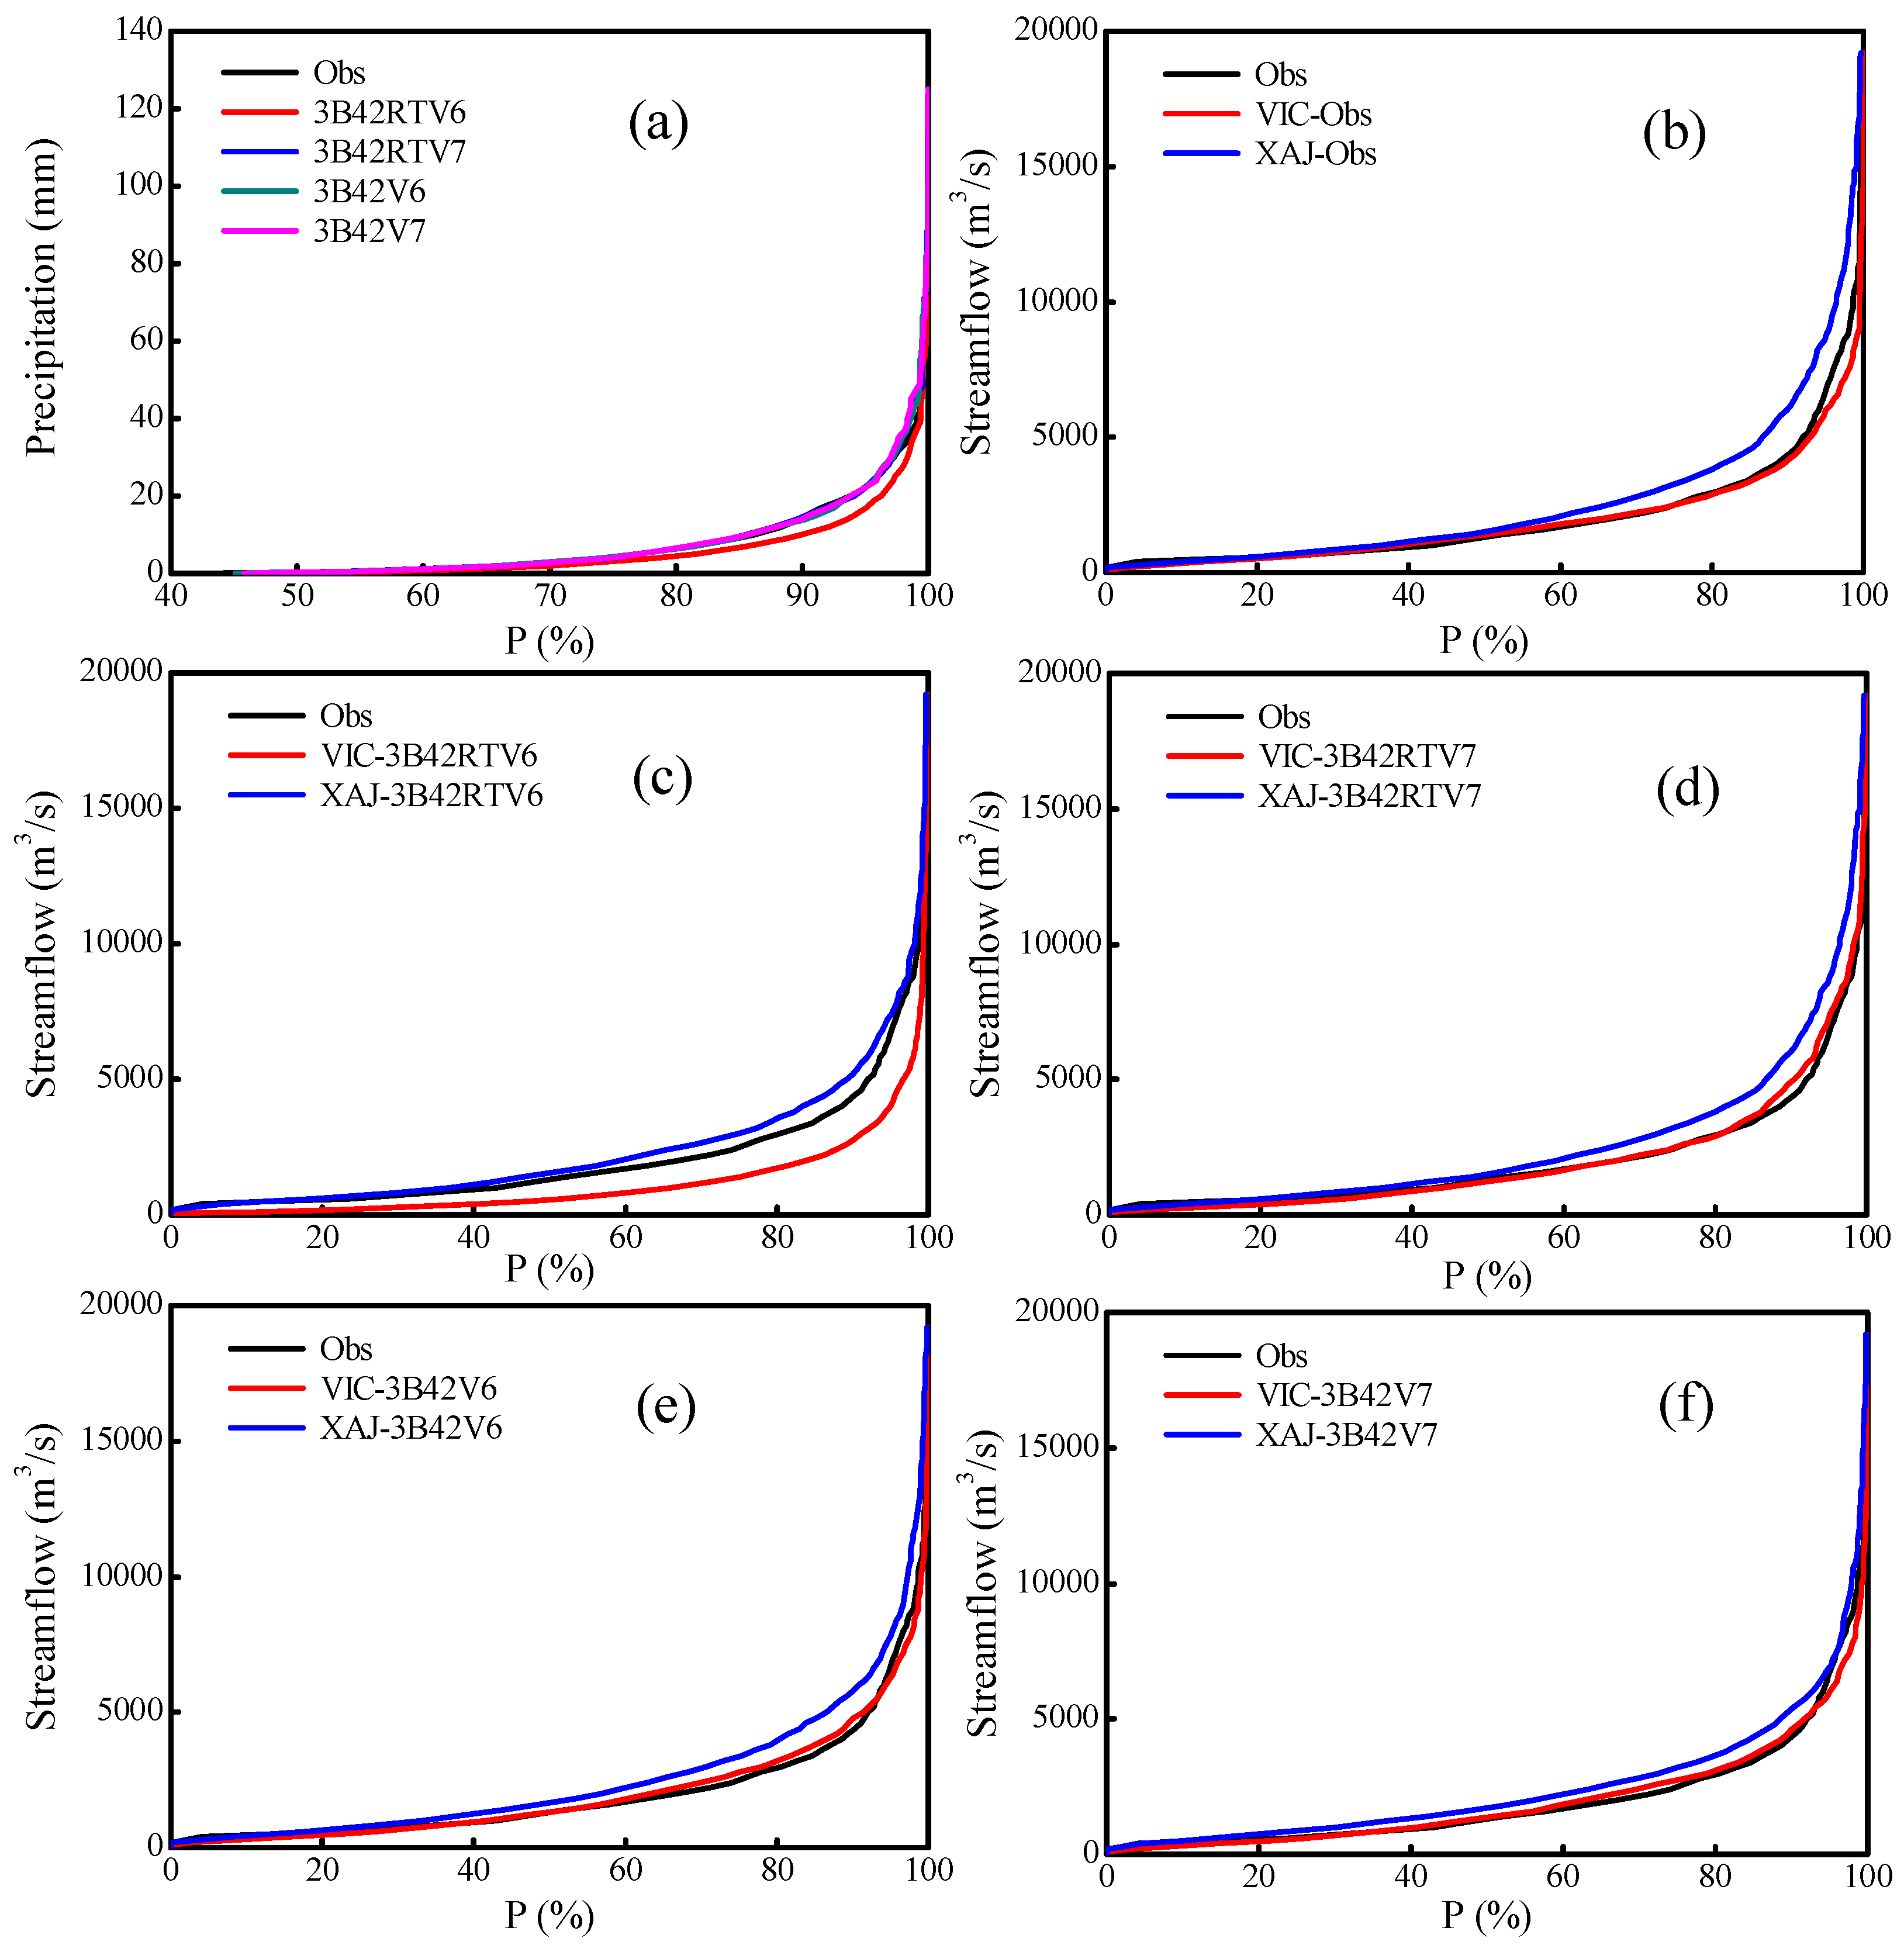
The 3B42RTV6 and 3B42V7 have good hydrological performance in the streamflow simulation by the VIC and XAJ hydrological models with higher NSCE and CC values. The 3B42RTV6 and 3B42RTV7 demonstrated lower NSCE score (0.50 vs. 0.70). In general, 3B42RTV6 and 3B42RTV7 showed higher CC (>0.8) in simulating stream flow by the VIC and XAJ hydrological model.
(3)
The streamflow simulated by the VIC hydrological model driven by the 3B42V7 underestimated by 0.99%, however, it overestimated the stream flow by 23.16% simulated by the XAJ hydrological model. The 3B42V7 generally outperformed 3B42V6 in terms of hydrologic performance, and the VIC hydrological model generally outperformed the XAJ hydrological model with lower RB, higher NSCE, and higher CC values. Of course, the conceptual hydrological model was enough for the hydrologic evaluation of TRMM and GPM IMERG satellite-based precipitation in a humid basin of China. This study provides a reference for the comparison of multiple models on watershed scale.

Author Contributions

Z.Z. provided the datasets including the required supporting software needed for the analyses; Z.Z., S.C. and Z.D. cooperated in designing and improving the concept of the research project and related processes; J.T. and Y.H. conducted the data processing and analysis. All the authors participated actively in preparing and reviewing the manuscript.

Acknowledgments

This paper is financially supported by National Natural Science Foundation of China (Grant No. 91747203 and 41171020) and Distinguished Young Scholars Fund of Nanjing Forestry University (NLJQ2015-01) and the project supported by the Six Talent Peaks project in Jiangsu Province (Grant no. 2015-JY-017). We would like to thank the National Climate Centre in Beijing for providing valuable climate datasets.

Conflicts of Interest

The authors declare no conflict of interest.

References

  1. Gourley, J.J.; Vieux, B.E. A Method for Evaluating the Accuracy of Quantitative Precipitation Estimates from a Hydrologic Modeling Perspective. J. Hydrol. 2005, 6, 115–133. [Google Scholar] [CrossRef]
  2. Gourley, J.J.; Vieux, B.E. A method for identifying sources of model uncertainty in rainfall-runoff simulations. J. Hydrol. 2006, 327, 68–80. [Google Scholar] [CrossRef]
  3. Huffman, G.J.; Adler, R.F.; Morrissey, M.M.; Bolvin, D.T.; Curtis, S.; Joyce, R.; Mcgavock, B.; Susskind, J. Global Precipitation at One-Degree Daily Resolution from Multisatellite Observations. J. Hydrol. 2001, 2, 36–50. [Google Scholar] [CrossRef]
  4. McLaughlin, D. An integrated approach to hydrologic data assimilation: Interpolation, smoothing, and filtering. Adv. Water. Resour 2002, 25, 1275–1286. [Google Scholar] [CrossRef]
  5. Jiang, S.; Ren, L.; Hong, Y.; Yong, B.; Yang, X.; Yuan, F.; Ma, M. Comprehensive evaluation of multi-satellite precipitation products with a dense rain gauge network and optimally merging their simulated hydrological flows using the Bayesian model averaging method. J. Hydrol. 2012, 452, 213–225. [Google Scholar] [CrossRef]
  6. Chen, S.; Hong, Y.; Cao, Q.; Gourley, J.J.; Kirstetter, P.; Yong, B.; Tian, Y.; Zhang, Z.; Shen, Y.; Hu, J.; et al. Similarity and difference of the two successive V6 and V7 TRMM multisatellite precipitation analysis performance over China. JGR Atmos. 2013, 118, 13060–13074. [Google Scholar] [CrossRef]
  7. Huffman, G.J.; Bolvin, D.T.; Nelkin, E.J.; Wolff, D.B.; Adler, R.F.; Gu, G.; Hong, Y.; Bowman, K.P.; Stocker, E.F. The TRMM Multisatellite Precipitation Analysis (TMPA): Quasi-Global, Multiyear, Combined-Sensor Precipitation Estimates at Fine Scales. J. Hydrol. 2007, 8, 38–55. [Google Scholar] [CrossRef]
  8. Liu, Z. Comparison of versions 6 and 7 3-hourly TRMM multi-satellite precipitation analysis (TMPA) research products. Atmos. Res. 2015, 163, 91–101. [Google Scholar] [CrossRef]
  9. Prakash, S.; Mitra, A.K.; Momin, I.M.; Pai, D.S.; Rajagopal, E.N.; Basu, S. Comparison of TMPA-3B42 Versions 6 and 7 Precipitation Products with Gauge-Based Data over India for the Southwest Monsoon Period. J. Hydrol. 2015, 16, 346–362. [Google Scholar] [CrossRef]
  10. Yong, B.; Chen, B.; Gourley, J.J.; Ren, L.; Hong, Y.; Chen, X.; Wang, W.; Chen, S.; Gong, L. Intercomparison of the Version-6 and Version-7 TMPA precipitation products over high and low latitudes basins with independent gauge networks: Is the newer version better in both real-time and post-real-time analysis for water resources and hydrologic extremes? J. Hydrol. 2014, 508, 77–87. [Google Scholar]
  11. Jiang, S.; Zhang, Z.; Huang, Y.; Chen, X.; Chen, S. Evaluating the TRMM Multisatellite Precipitation Analysis for Extreme Precipitation and Streamflow in Ganjiang River Basin, China. Adv. Meteorol. 2017, 2017, 2902493. [Google Scholar] [CrossRef]
  12. Fei, M.; Zhang, Z.; Yuan, L. Accuracy Assessmant for TRMM in the Poyang Lake Basin. Resour. Environ. Yangtze Basin 2015, 24, 1323–1330, (In Chines with English abstract). [Google Scholar]
  13. Islam, T.; Rico-Ramirez, M.A.; Han, D.; Srivastava, P.K.; Ishak, A.M. Performance evaluation of the TRMM precipitation estimation using ground-based radars from the GPM validation network. J. Atmos. Sol.-Terr. Phys. 2012, 77, 194–208. [Google Scholar] [CrossRef]
  14. Tang, G.; Ma, Y.; Long, D.; Zhong, L.; Hong, Y. Evaluation of GPM Day-1 IMERG and TMPA Version-7 legacy products over Mainland China at multiple spatiotemporal scales. J. Hydrol. 2016, 533, 152–167. [Google Scholar] [CrossRef]
  15. Chen, C.; Chen, Q.; Duan, Z.; Mo, K.; Li, Z.; Tang, G. Multiscale comparative evaluation of the GPM IMERG v5 and TRMM 3B42 v7 precipitation products from 2015 to 2017 over a climate transition area of China. Remote Sens. 2018, 10, 944. [Google Scholar] [CrossRef]
  16. Omranian, E.; Sharif, H.O. Evaluation of the Global Percipitation Measurement (GPM) Satellite Rainfall Products over the Lower Colorad River Basin,TEXAS1. J. Am. Water Resour. 2018, 54, 882–898. [Google Scholar] [CrossRef]
  17. Omranian, E.; Sharif, H.; Tavakoly, A. How Well Can Global Precipitation Measurement (GPM) Capture Hurricanes? Case Study: Hurricane Harvey. Remote Sens. 2018, 10, 1150. [Google Scholar] [CrossRef]
  18. Adler, R.F.; Huffman, G.J.; Chang, A.; Ferraro, R.; Xie, P.; Janowiak, J.; Rudolf, B.; Schneider, U.; Curtis, S.; Bolvin, D.; et al. The Version-2 Global Precipitation Climatology Project (GPCP) Monthly Precipitation Analysis (1979–Present). J. Hydrol. 2003, 4, 1147–1167. [Google Scholar] [CrossRef]
  19. Tobin, K.J.; Bennett, M.E. Using Swat to Model Streamlow in Two River Basins with Ground and Satellite Precipitaion Data1. J. Am. Water Resour. 2009, 45, 253–271. [Google Scholar] [CrossRef]
  20. Xue, X.; Hong, Y.; Limaye, A.S.; Gourley, J.J.; Huffman, G.J.; Khan, S.I.; Dorji, C.; Chen, S. Statistical and hydrological evaluation of TRMM-based Multi-satellite Precipitation Analysis over the Wangchu Basin of Bhutan: Are the latest satellite precipitation products 3B42V7 ready for use in ungauged basins? J. Hydrol. 2013, 499, 91–99. [Google Scholar] [CrossRef]
  21. Behrangi, A.; Khakbaz, B.; Jaw, T.C.; AghaKouchak, A.; Hsu, K.; Sorooshian, S. Hydrologic evaluation of satellite precipitation products over a mid-size basin. J. Hydrol. 2011, 397, 225–237. [Google Scholar] [CrossRef]
  22. Hong, X.; Guo, S.; Xiong, L.; Liu, Z. Spatial and temporal analysis of drought using entropy-based standardized precipitation index: A case study in Poyang Lake basin, China. Appl. Clim. 2015, 122, 543–556. [Google Scholar] [CrossRef]
  23. Zhang, Y.; You, Q.; Chen, C.; Li, X. Flash droughts in a typical humid and subtropical basin: A case study in the Gan River Basin, China. J. Hydrol. 2017, 551, 162–176. [Google Scholar] [CrossRef]
  24. Shankman, D.; Keim, B.D.; Song, J. Flood frequency in China’s Poyang Lake region: Trends and teleconnections. Int. J. Clim. 2006, 26, 1255–1266. [Google Scholar] [CrossRef]
  25. Chen, S.; Hu, J.; Zhang, Z.; Behrangi, A.; Hong, Y.; Gebregiorgis, A.S.; Cao, J.; Hu, B.; Xue, X.; Zhang, X. Hydrologic Evaluation of the TRMM Multisatellite Precipitation Analysis Over Ganjiang Basin in Humid Southeastern China. IEEE. J. 2015, 8, 4568–4580. [Google Scholar] [CrossRef]
  26. Tang, G.; Zeng, Z.; Long, D.; Guo, X.; Yong, B.; Zhang, W.; Hong, Y. Statistical and Hydrological Comparisons between TRMM and GPM Level-3 Products over a Midlatitude Basin: Is Day-1 IMERG a Good Successor for TMPA 3B42V7? J. Hydrol. 2016, 17, 121–137. [Google Scholar] [CrossRef]
  27. Guoqiang, T.; Wei, W.; Ziyue, Z.; Xiaoin, G.; Na, L.; Di, L.; Yang, H. An Overview of the Global Precipitation Measurement (GPM) Mission and It’s Latest Development. Remote Sens. Technol. Appl. 2015, 30, 607–615, (In Chinese with English abstract). [Google Scholar]
  28. Rozante, J.; Vila, D.; Barboza Chiquetto, J.; Fernandes, A.; Souza Alvim, D. Evaluation of TRMM/GPM Blended Daily Products over Brazil. Remote Sens. 2018, 10, 882. [Google Scholar] [CrossRef]
  29. Renjun, Z. The Xinanjiang model applied in China. J. Hydrol. 1992, 135, 371–381. [Google Scholar] [CrossRef]
  30. Liang, X. Two-layer variable infiltration capacity land surface representation for general circulation models. Ph.D. Thesis, Washington University, Washington, DC, USA.
  31. Wilks, D. International Geophysics; Elsevier: Kidlington, UK, 1995; pp. 2–676. [Google Scholar]
  32. Ebert, E.E.; Janowiak, J.E.; Kidd, C. Comparison of Near-Real-Time Precipitation Estimates from Satellite Observations and Numerical Models. Bull. Am. Meteorol. Soc. 2007, 88, 47–64. [Google Scholar] [CrossRef]
  33. El Kenawy, A.M.; Lopez-Moreno, J.I.; McCabe, M.F.; Vicente-Serrano, S.M. Evaluation of the TMPA-3B42 precipitation product using a high-density rain gauge network over complex terrain in northeastern Iberia. Glob. Planet Chang. 2015, 133, 188–200. [Google Scholar] [CrossRef]
  34. Jiabin, X.; Qinglian, Z.; Qifeng, S.; Xiaoping, L.; Mingli, D. Remote Raman spectral peak searching algorithm based on Kolmogorov-Smirnov test. Chin. J. Sci. Instrum. 2018, 39, 141–147, (In Chines with English abstract). [Google Scholar]
  35. Makarov, A.A.; Simonova, G.I. Some Properties of Two-Sample Kolmogorov—Smirnov Test in the Case of Contamination of One of the Samples. J. Math. Sci. 2017, 220, 718–723. [Google Scholar] [CrossRef]
  36. Yapo, P.O.; Gupta, H.V.; Sorooshian, S. Multi-objective global optimization for hydrologic models. J. Hydrol. 1998, 204, 83–97. [Google Scholar] [CrossRef]
  37. Chen, S.; Hong, Y.; Gourley, J.J.; Huffman, G.J.; Tian, Y.; Cao, Q.; Yong, B.; Kirstetter, P.; Hu, J.; Hardy, J.; et al. Evaluation of the successive V6 and V7 TRMM multisatellite precipitation analysis over the Continental United States. Water Resour. Res. 2013, 49, 8174–8186. [Google Scholar] [CrossRef]
  38. Huang, Y.; Zhang, Z.; Fei, M.; Jin, Q. Hydrological Evaluation of the TMPA Multi-satellite Precipitation Esitimates over the Ganjiang Basin. Resour. Environ. Yangtze Basin 2016, 25, 1618–1625, (In Chines with English abstract). [Google Scholar]
  39. Zhu, H.; Li, Y.; Huang, Y.; Li, Y.; Hou, C.; Shi, X. Evaluation and hydrological application of satellite-based precipitation datasets in driving hydrological models over the Huifa river basin in Northeast China. Atmos. Res. 2018, 207, 28–41. [Google Scholar] [CrossRef]
  40. Nair, S.; Srinivasan, G.; Nemani, R. Evaluation of Multi-Satellite TRMM Derived Rainfall Estimates over a Western State of India. J. Meteorol. Soc. Jpn. 2009, 87, 927–939. [Google Scholar] [CrossRef]
  41. Yong, B.; Ren, L.; Hong, Y.; Wang, J.; Gourley, J.J.; Jiang, S.; Chen, X.; Wang, W. Hydrologic evaluation of Multisatellite Precipitation Analysis standard precipitation products in basins beyond its inclined latitude band: A case study in Laohahe basin, China. Water Resour. Res. 2010, 46, W07519. [Google Scholar] [CrossRef]
  42. Tian, Y.; Peters-Lidard, C.D.; Adler, R.F.; Kubota, T.; Ushio, T. Evaluation of GSMaP Precipitation Estimates over the Contiguous United States. J. Hydrol. 2010, 11, 566–574. [Google Scholar] [CrossRef]
  43. Mei, Y.; Anagnostou, E.N.; Nikolopoulos, E.I.; Borga, M. Error Analysis of Satellite Precipitation Products in Mountainous Basins. J. Hydrol. 2014, 15, 1778–1793. [Google Scholar] [CrossRef]
  44. Prakash, S.; Mitra, A.K.; Pai, D.S.; AghaKouchak, A. From TRMM to GPM: How well can heavy rainfall be detected from space? Adv. Water Resour. 2016, 88, 1–7. [Google Scholar] [CrossRef]
  45. Wang, Z.; Zhong, R.; Lai, C.; Chen, J. Evaluation of the GPM IMERG satellite-based precipitation products and the hydrological utility. Atmos. Res. 2017, 196, 151–163. [Google Scholar] [CrossRef]
  46. Zhang, Y.; Sun, A.; Sun, H.; Gui, D.; Xue, J.; Liao, W.; Yan, D.; Zhao, N.; Zeng, X. Error adjustment of TMPA satellite precipitation estimates and assessment of their hydrological utility in the middle and upper Yangtze River Basin, China. Atmos. Res. 2019, 216, 52–64. [Google Scholar] [CrossRef]
Figure 1. Locations of the study area and the related hydro-meteorological stations.
Remotesensing 11 00431 g001
Figure 2. Spatial distribution of annual mean precipitation in the Ganjiang River Basin for TMPA and observed data from 2003 to 2010 (a) Observed data; (b) 3B42V6; (c) 3B42V7; (d) 3B42RTV6; (e) 3B42RTV7).
Remotesensing 11 00431 g002
Figure 3. Spatial distribution of annual mean precipitation in the Ganjiang River Basin from GPM, 3B42V7 and Observed data from 2014 to 2015 (a) Observed data; (b) 3B42V7; (c) GPM).
Remotesensing 11 00431 g003
Figure 4. The precipitation time series for TMPA and observed precipitation in the Ganjiang River basin from 2003 to 2010 ((a), Daily; (b), Monthly; (c), Annual).
Remotesensing 11 00431 g004aRemotesensing 11 00431 g004b
Figure 5. The precipitation time series from GPM and rain gauges in the Ganjiang River basin from May 2014 to October 2015 ((a), Daily; (b), Monthly).
Remotesensing 11 00431 g005
Figure 6. Statistical indices for different rainfall thresholds at daily time scale ((a,d) POD; (b,e) CSI and (c,f) FAR).
Remotesensing 11 00431 g006
Figure 7. Comparison of observed and simulated streamflow using gauge data as input and corresponding daily precipitation for the calibration period and simulation period ((a) VIX; (b) XAJ).
Remotesensing 11 00431 g007
Figure 8. Scatter plots of the observed and simulated streamflow by using VIC and XAJ hydrological models in the Ganjiang River basin ((ad) VIC; (fi) XAJ).
Remotesensing 11 00431 g008aRemotesensing 11 00431 g008b
Figure 9. Comparison of the observed and simulated streamflow based on the 3B42V7 and GPM precipitation data by using VIC hydrological model in the Ganjiang River basin.
Remotesensing 11 00431 g009
Figure 10. Cumulative probabilities of the observed streamflow and simulated streamflow using the XAJ and VIC hydrological models in the Ganjiang River basin (the difference in the observed and simulated probability distributions was statistically significant at the 0.05 significance level with Kolmogorov-Smirnov statistic).
Remotesensing 11 00431 g010
Figure 11. Daily statistical indices for different streamflow thresholds of VIC and XAJ model ((a,d,g) POD; (b,e,h) CSI and (c,f,i) FAR).
Remotesensing 11 00431 g011
Table 1. Introduction of the five kinds of satellite precipitation products.
ProductsPeriodSpatial Resolution (°)
3B42RTV62003/01–2010/120.25
3B42V62003/01–2010/120.25
3B42RTV72003/01–2010/120.25
3B42V72003/01–2015/100.25
GPM2014/05–2015/100.1
Table 2. Statistical Performance Measures Used for Evaluation of Satellite Products.
IndicesFormula
Category 1
Relative bias
(Bias)
n = 1 N ( Sat n Gag n ) n = 1 N Gag n
Correlation coefficient
(CC)
1 N n = 1 N ( Sat n Sat ¯ ) ( Gag n Gag ¯ ) ( SD Sat ) ( SD Gag )
Root mean square error
(RMSE)
1 N n = 1 N ( Sat n Gag n ) 2
Nash-Sutcliffe Coefficient of Efficiency
(NSCE)
1 n = 1 N ( Sat n Gag n ) 2 n = 1 N ( Sat n Sat ¯ ) 2
Category 2
Probability of detection
(POD)
C sg C sg + C g M S
False alarm ratio
(FAR)
C s M g C sg + C s M g
Critical success index
(CSI)
C sg C sg + C s M g + C g M S
Notes: n, number of samples; Satn, satellite rainfall estimate; Gagn, gauge-observed rainfall; Sat, averaged satellite rainfall; Gag, averaged gauge rainfall; SDSat, standard deviations of satellite rainfall; SDGag, standard deviations of gauge rainfall; Csg, events captured by satellite and gauge; CsMg, events captured by satellite and missed by gauge; CgMs, events captured by gauge and missed by satellite [16].
Table 3. The difference between the estimated precipitation of four satellite products and the observed precipitation in the Ganjiang River basin.
Precipitation ProductDailyMonthly
RB (%)RMSE (mm)CCRB (%)RMSE (mm)CC
3B42RTV6−24.155.980.72−26.251.960.86
3B42RTV72.975.690.79−0.301.630.90
3B42V63.605.560.80−0.011.040.95
3B42V72.955.240.82−1.061.000.95
Table 4. The XAJ model Calibrated Paraments and Calibrated Values in Ganjiang River Basin.
ModuleParameterDescriptionValue
EvapotranspirationKcRatio of potential evapotranspiration to pan evaporation0.599
WumTension water capacity of upper layer (mm)20
WlmTension water capacity of lower layer (mm)60
CEvapotranspiration coefficient of deeper layer0.143
Runoff generationWmTension water capacity (mm)131.6
BExponent of distribution of tension water capacity0.899
ImRatio of impervious area to the total area of the basin0.01
Runoff separationSm*Free water capacity (mm)64.654
ExExponent of distribution of free water capacity0.580
Kg*Outflow coefficient of free water storage to groundwater0.223
KiaOutflow coefficient of free water storage to interflow0.215
RoutingCg*Recession constant of groundwater storage0.839
Ci*Recession constant of interflow storage0.988
Cs*,bRecession constant in the lag-and-route method0.85
Lag*,bLag time (h)2
KecMuskingum time constant for each sub-reach (h)1
Xe*Muskingum weighting factor for each sub-reach0.31
Table 5. The VIC model Calibrated Parameters and Calibrated Values in Ganjiang River Basin.
ParametersDefinitionValue RangeCalibrated Value
BVariable infiltration curve parameter (binfilt)0.001–1.00.236
WsFraction of maximum soil moisture where non-linear baseflow occurs≥0.50.533
DsFraction of Dsmax where non-linear baseflow begins0.001–1.00.481
DsmaxMaximum velocity of baseflow (mm/day)0–5013.748
d0Thickness of each soil moisture layer (m)0.1–3.00.300
d12.430
d20.533

