A Pairwise SSD Fingerprinting Method of Smartphone Indoor Localization for Enhanced Usability

 ,
,
Abstract
:1. Introduction
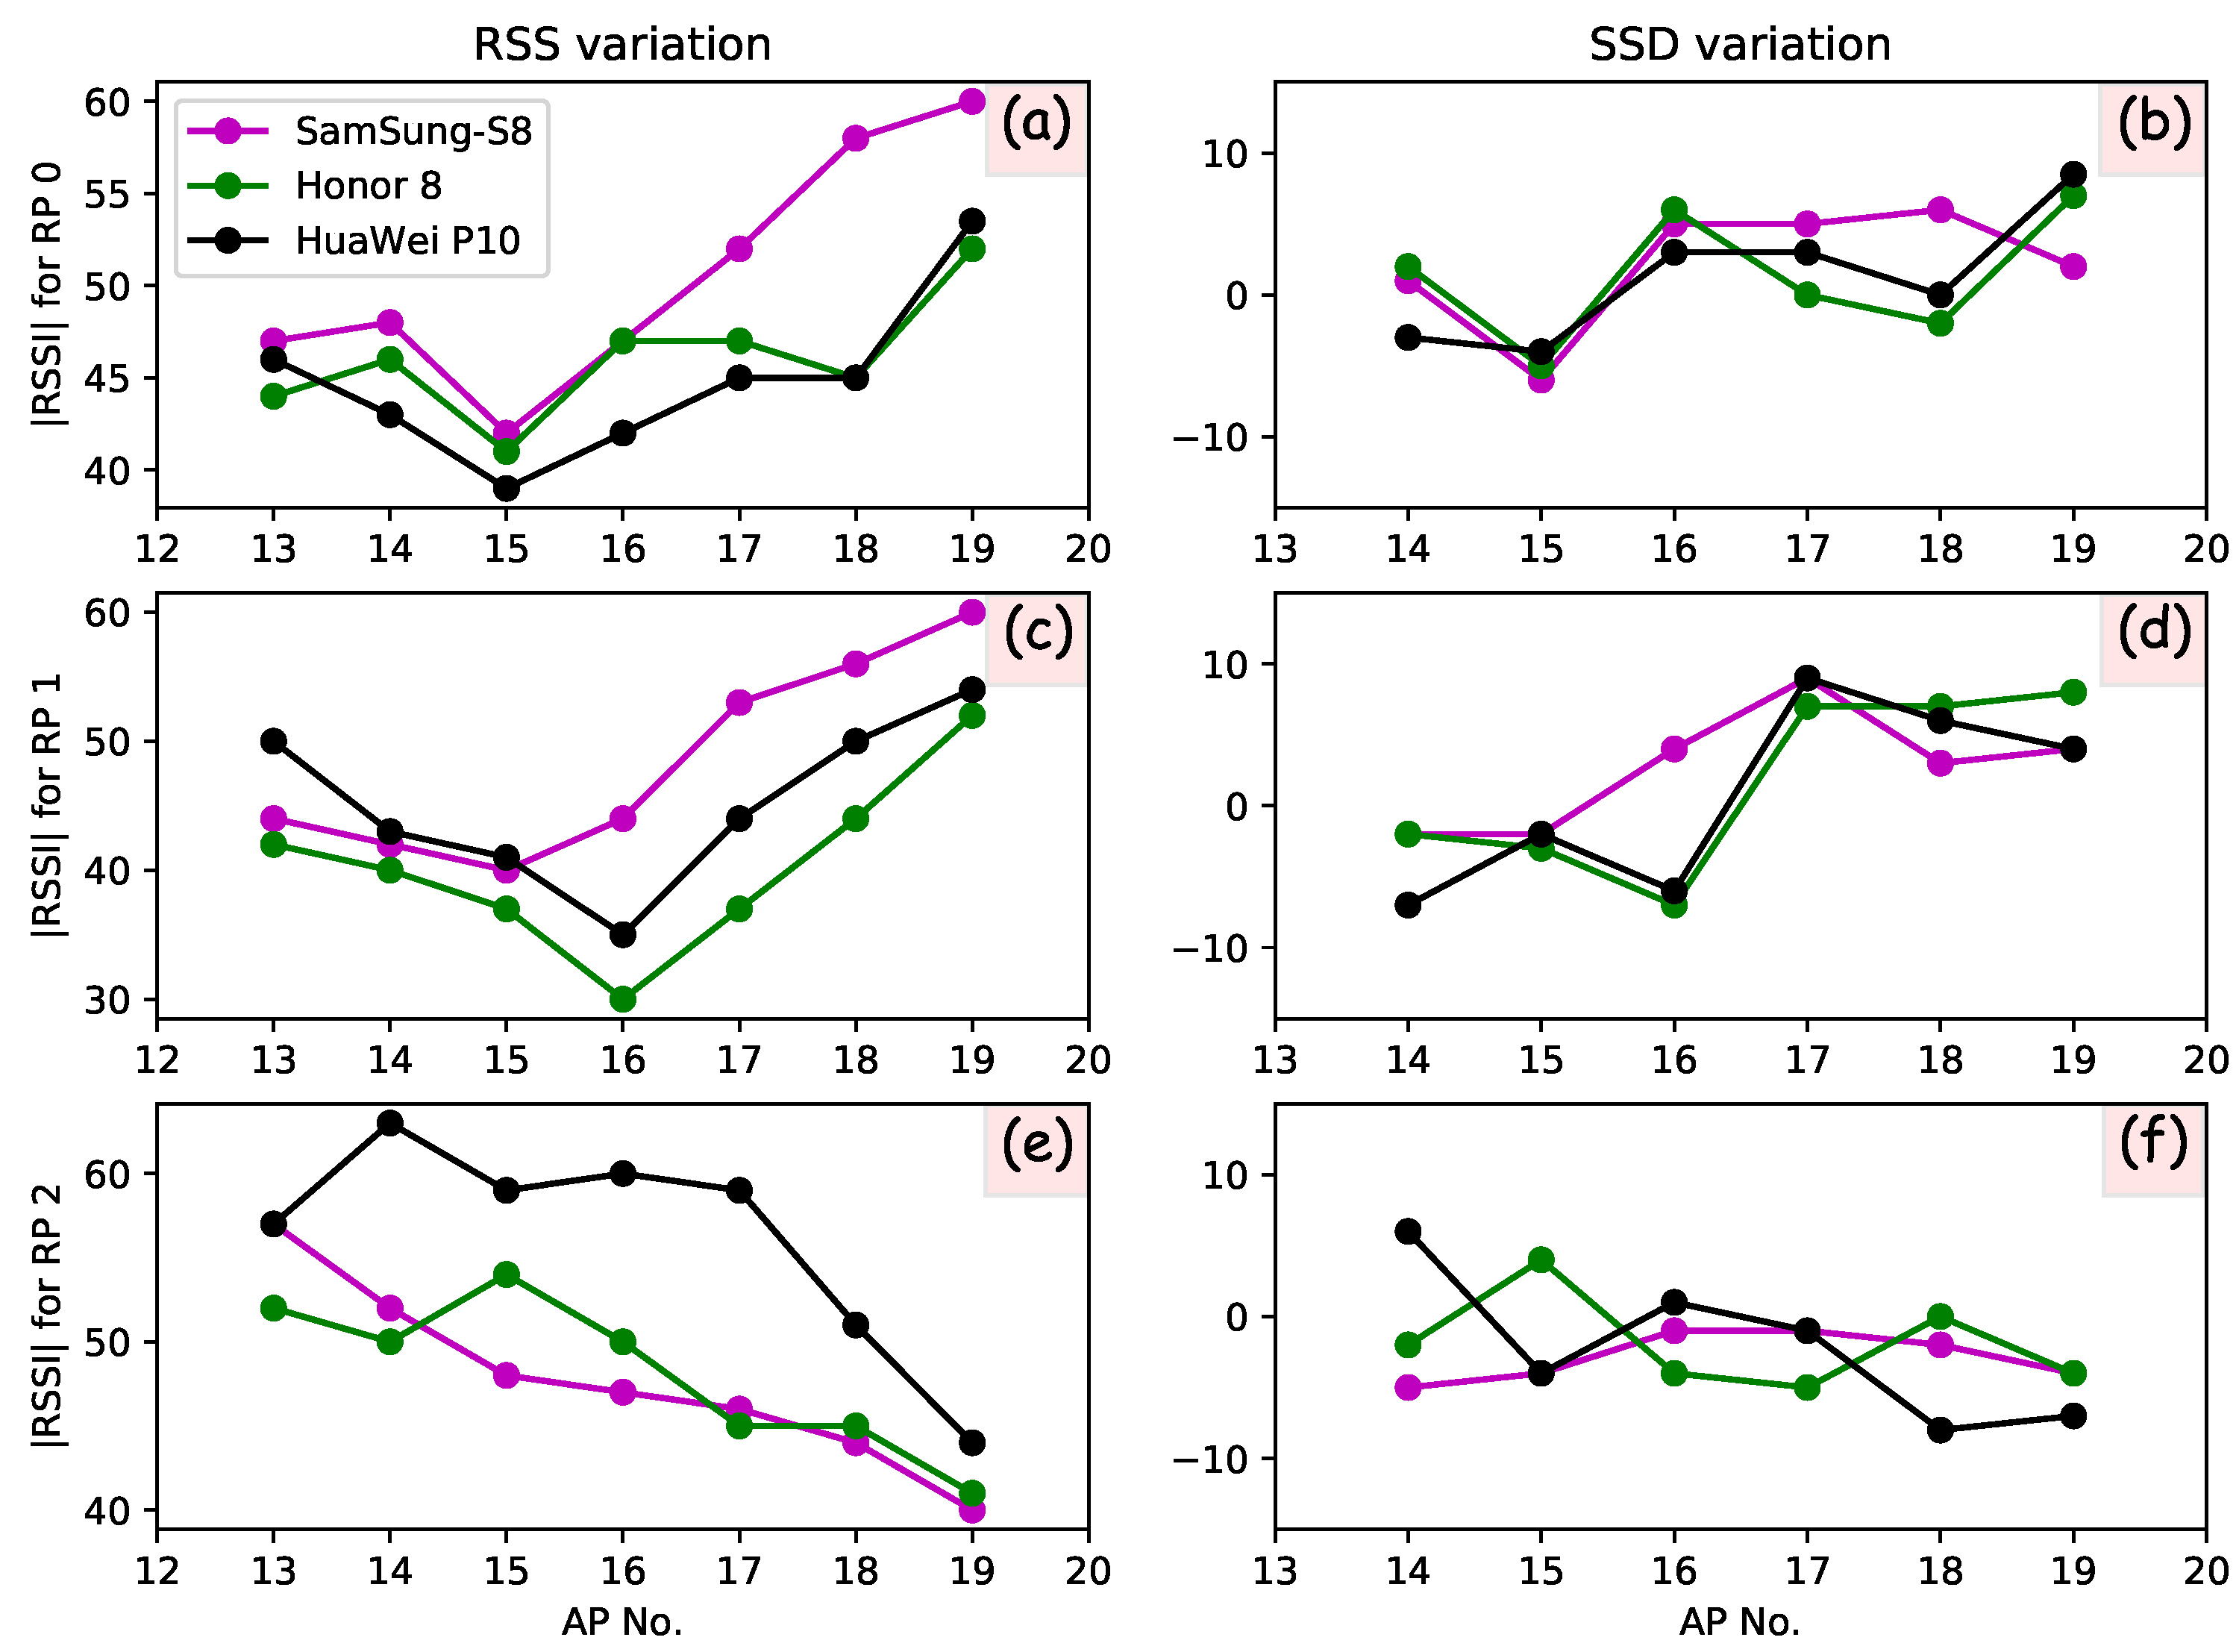
- The heterogeneity of devices. For most of the cases, the assumption of the RSS fingerprinting method is that the devices collecting RSSI for both the offline training phase and the online phase are identical or homogeneous; otherwise, the localization accuracy is significantly degraded. This is because the RSS is influenced by a particular transmitter-receiver pair’s hardware-specific parameters, such as antenna gains [13]. To overcome this, Haeberlen [14] and Kjærgaard [15] proposed a precalibration method to translate the RSS of heterogeneous devices into the benchmark device by a set of conversion formulae. However, the formulae must be found and validated in the lab in advance, which is impractical and time-consuming with the increasing number of new mobile devices. Therefore, developing a free-calibration method to reduce effects caused by heterogeneous mobile devices is a challenge towards the goal of ∼5 m location precision.
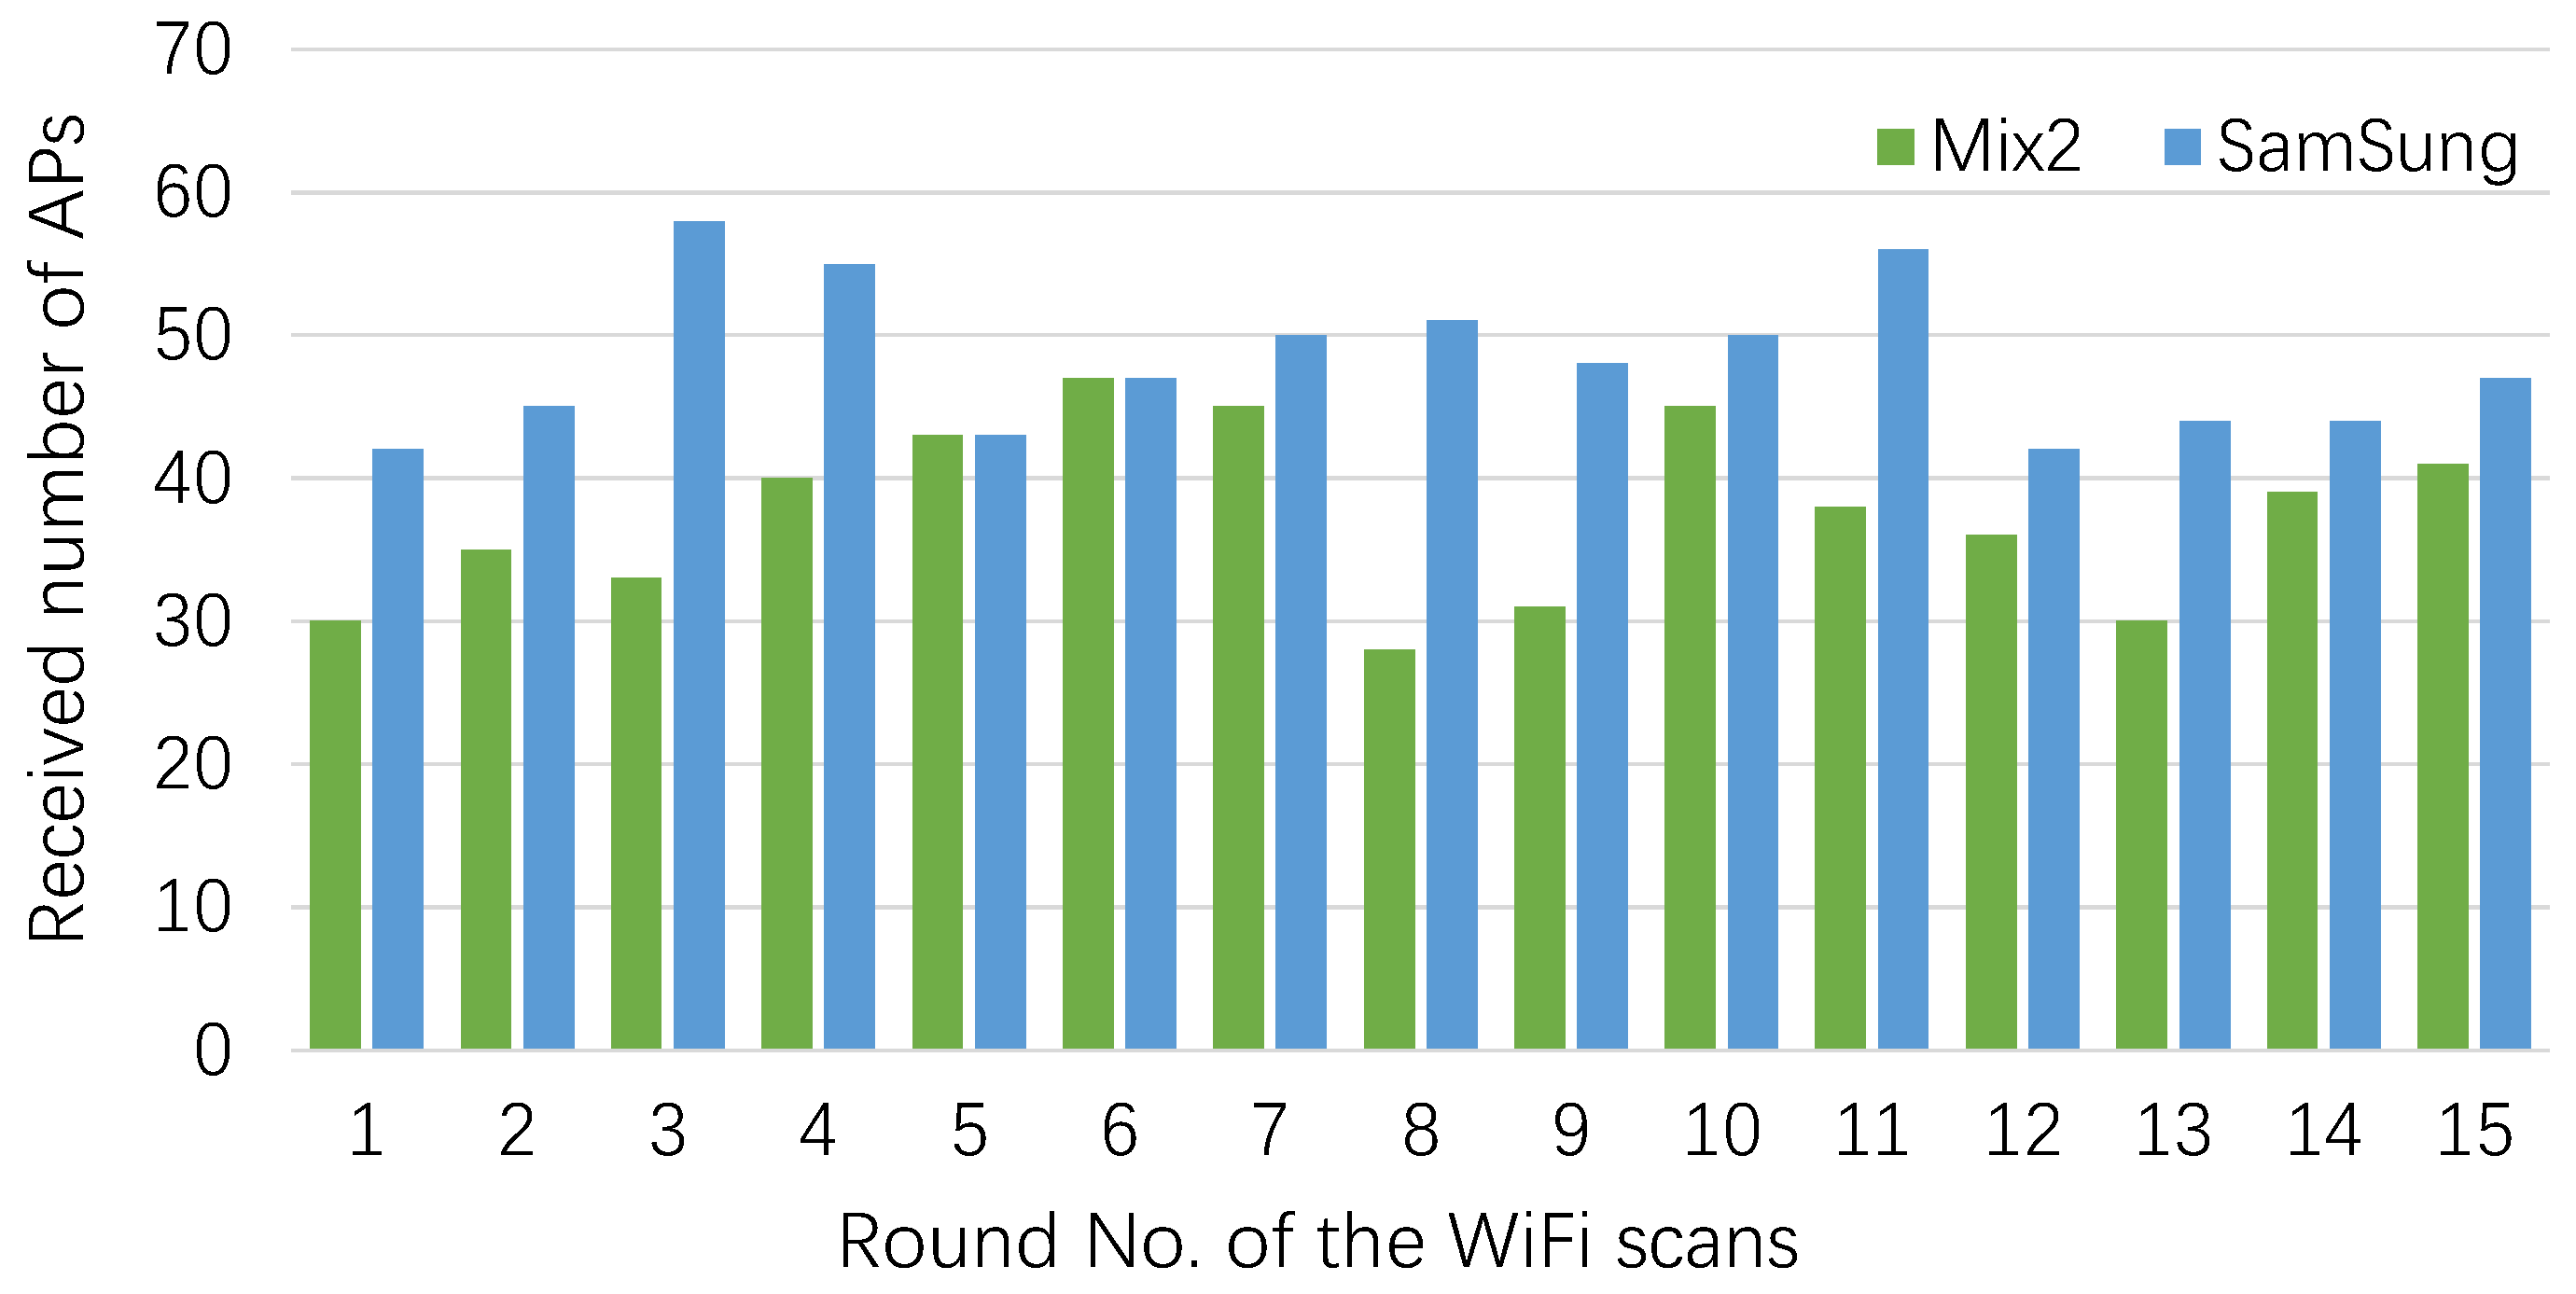
- The reliability of positioning. This great challenge is the result of the large errors in RSS fingerprinting localization due to the signal fluctuations caused by many factors, i.e., the time-varying environments or body blockages [16]. The large errors usually manifest as a large gap between current Wi-Fi prediction and the previous prediction, which is apparently unreasonable because a pedestrian’s historic walk track should be continuous. Some of the past works attempted to reduce the signal fluctuations regarding one or two aspects [17], but currently, there is no single universal solution for all cases. In addition, another direction is to leverage the relatively stable external sources in a fusion frame, typically, the PDR (pedestrian dead reckoning) derived information including the pedestrian’s heading and walking distance [18,19]. With a deliberately designed filter, the fusion can smooth the sequence of Wi-Fi positioning and minimize the large errors. However, frequent erroneous Wi-Fi positioning will undermine the filtering. Hence, it is still necessary to enhance the reliability of Wi-Fi positioning. How to design a pure Wi-Fi positioning system by increasing the diversity of fingerprints to further reduce large errors is a considerable challenge.
2. Related Work
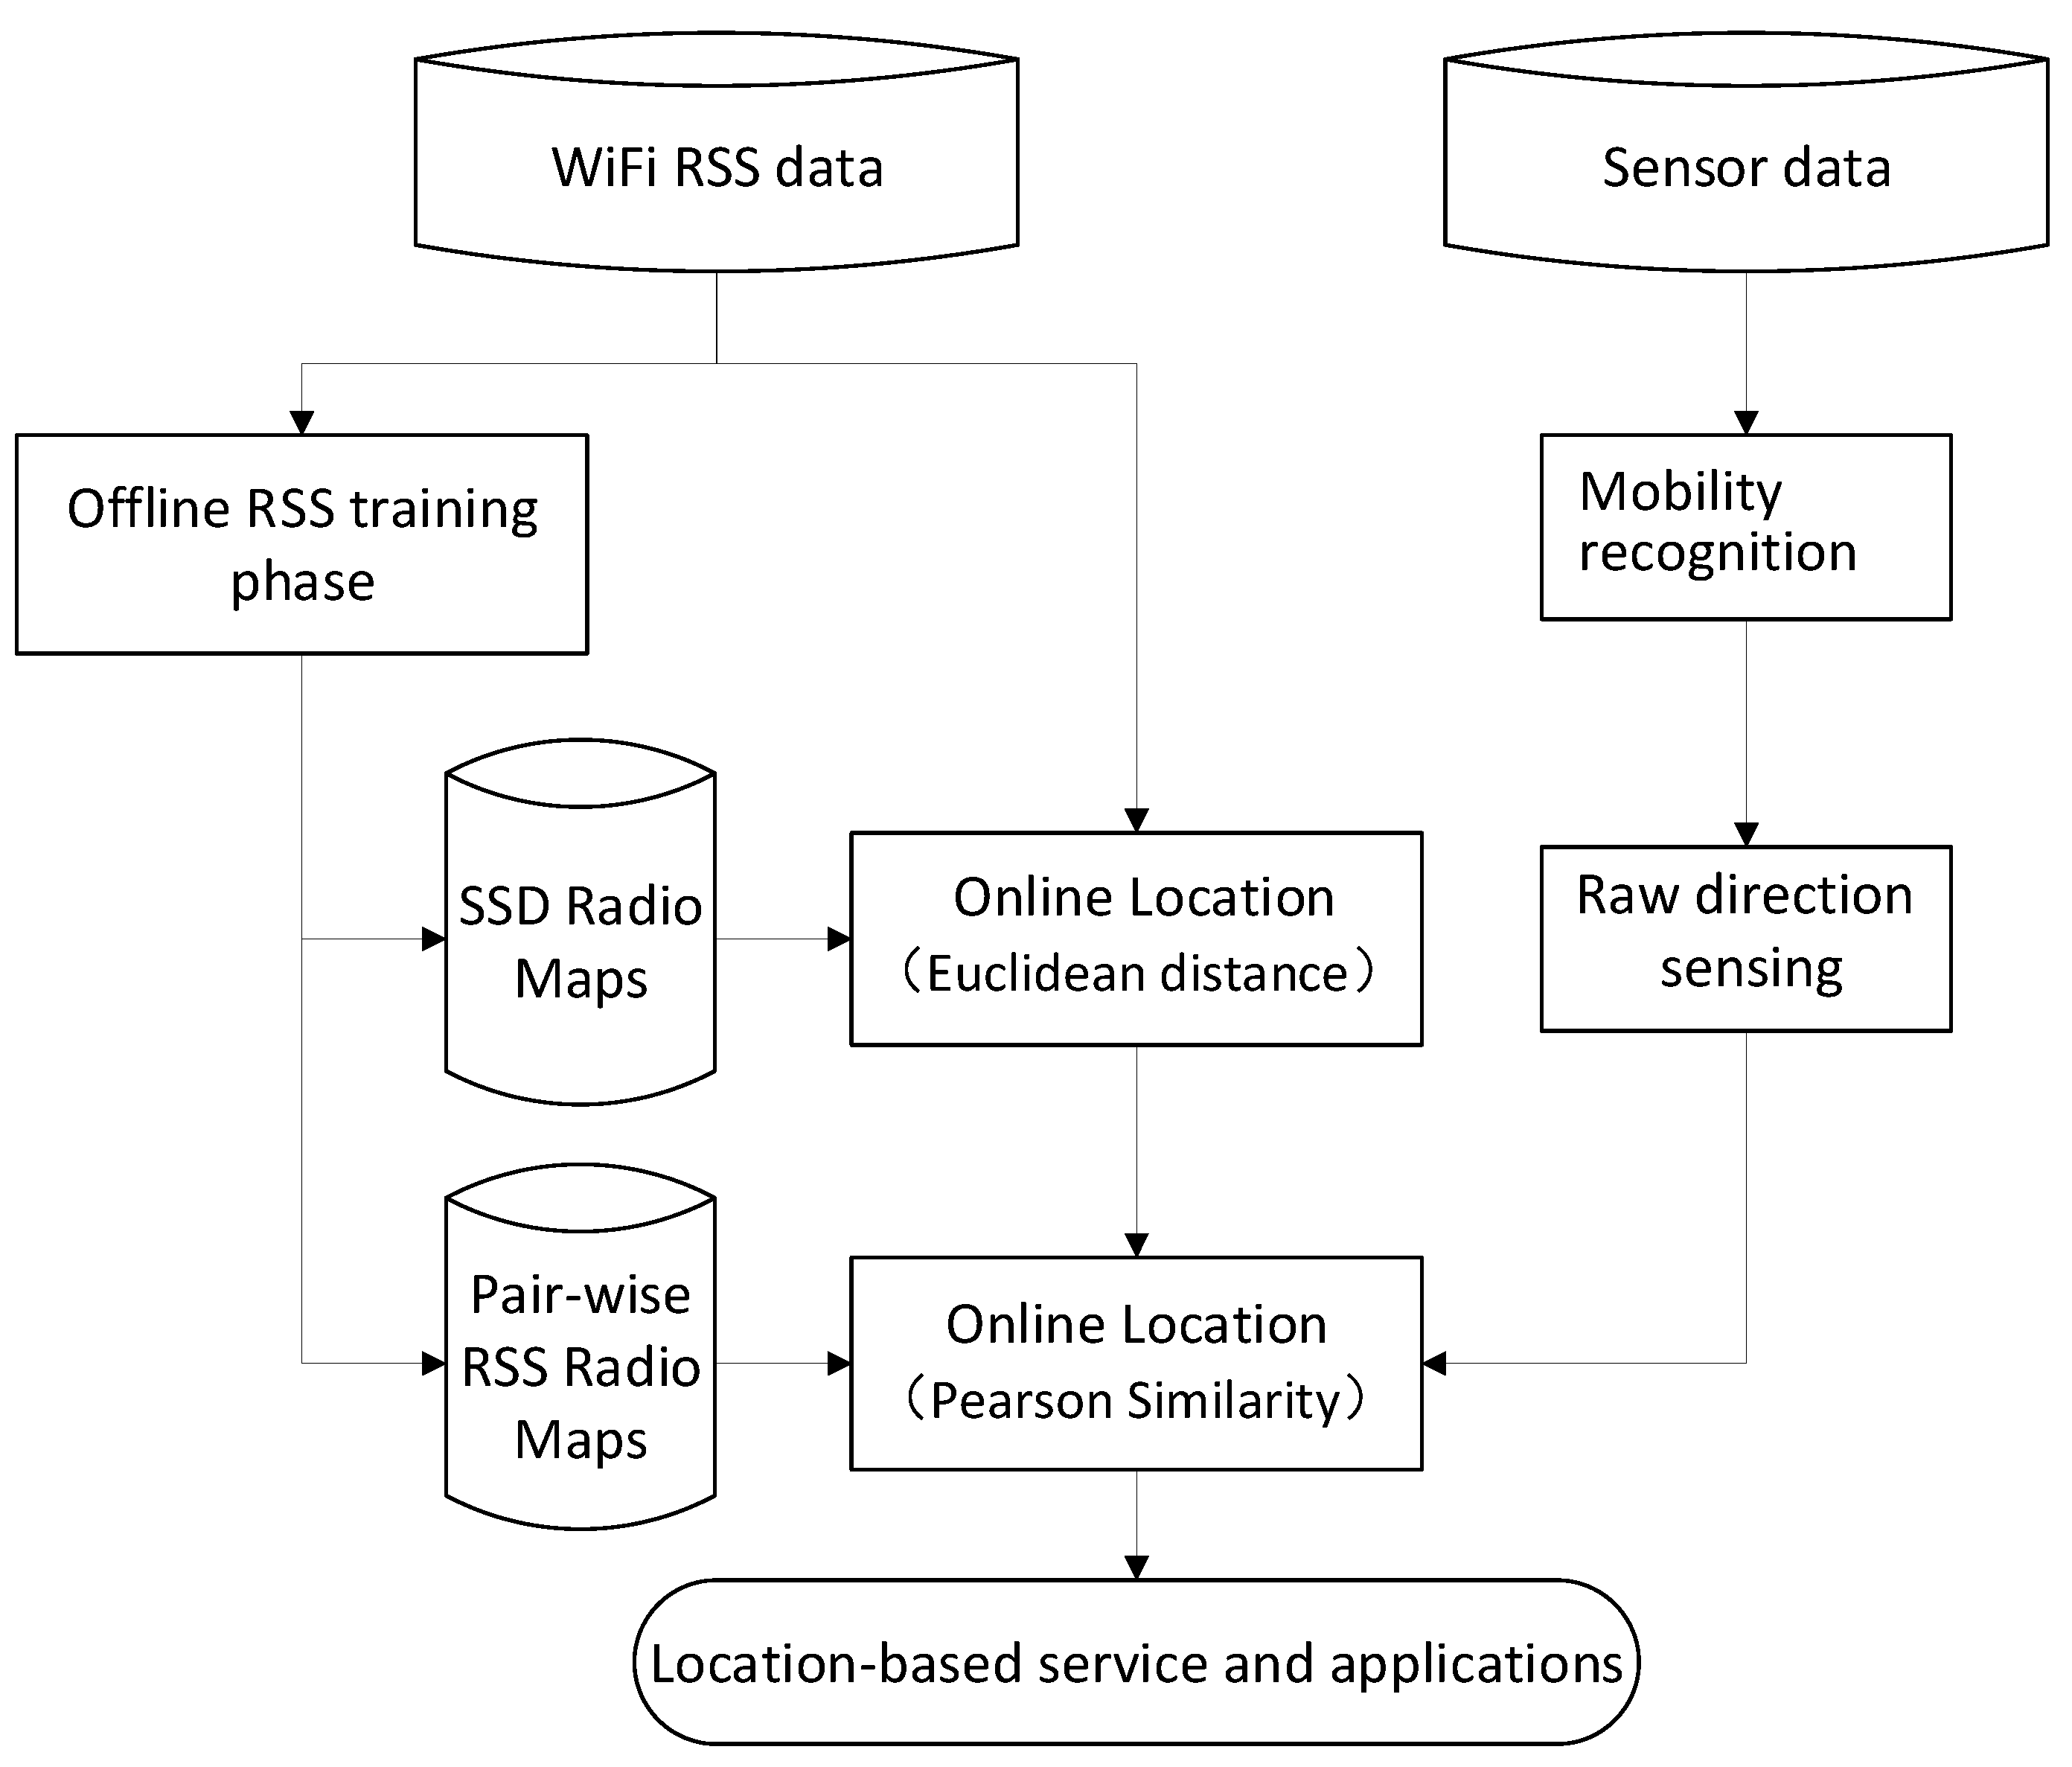
3. Method
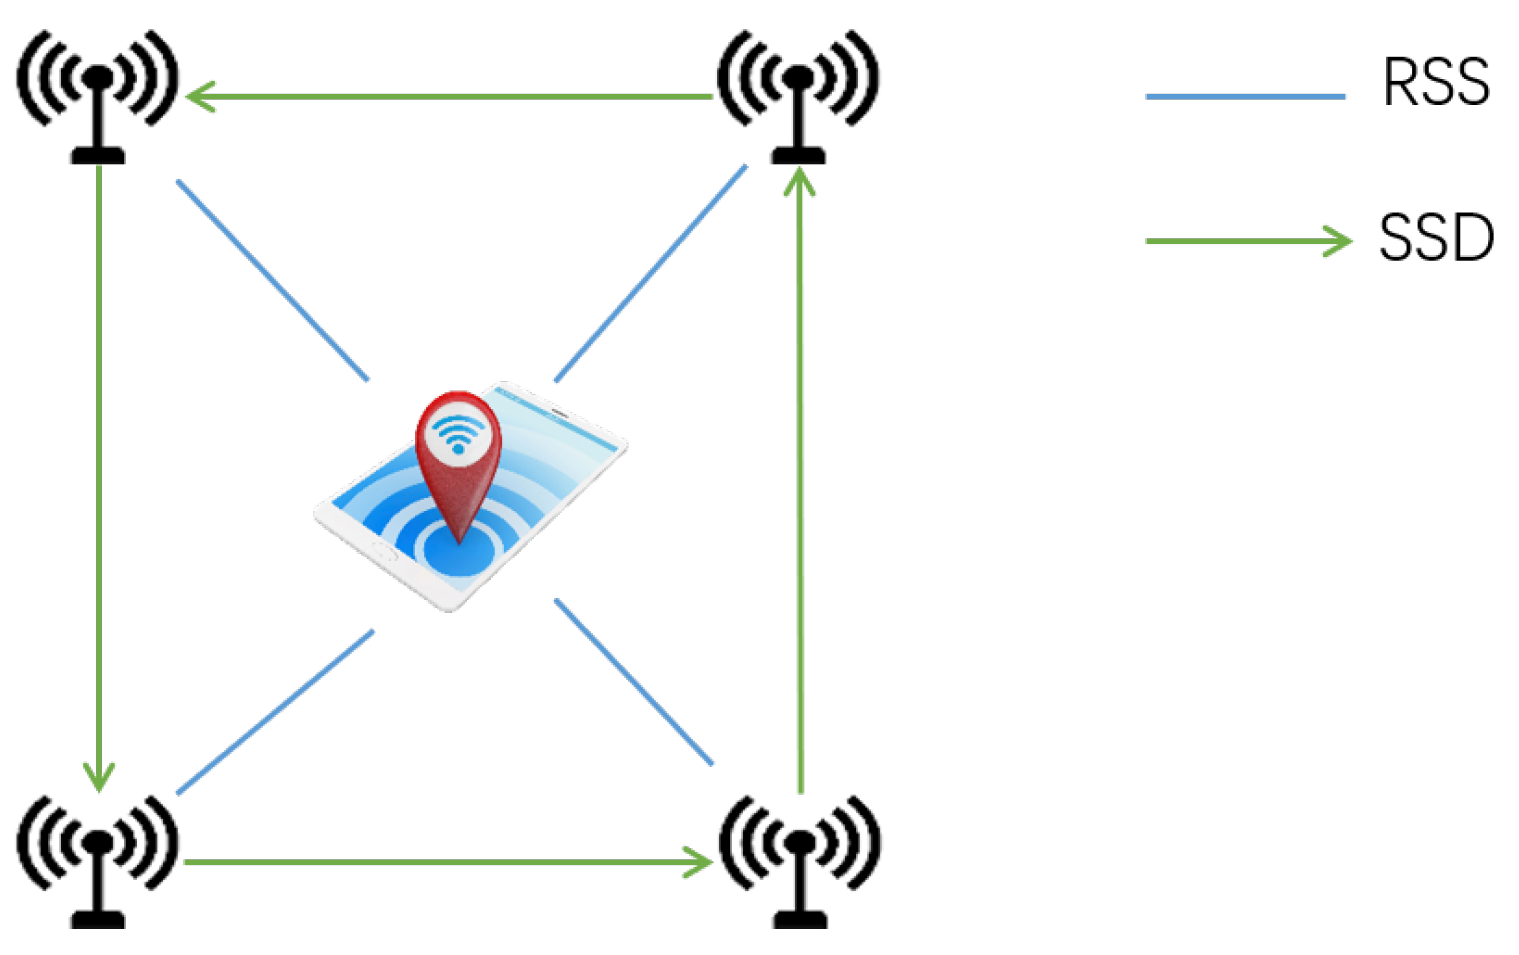
3.1. SSD Radio Map Construction and Online Inference
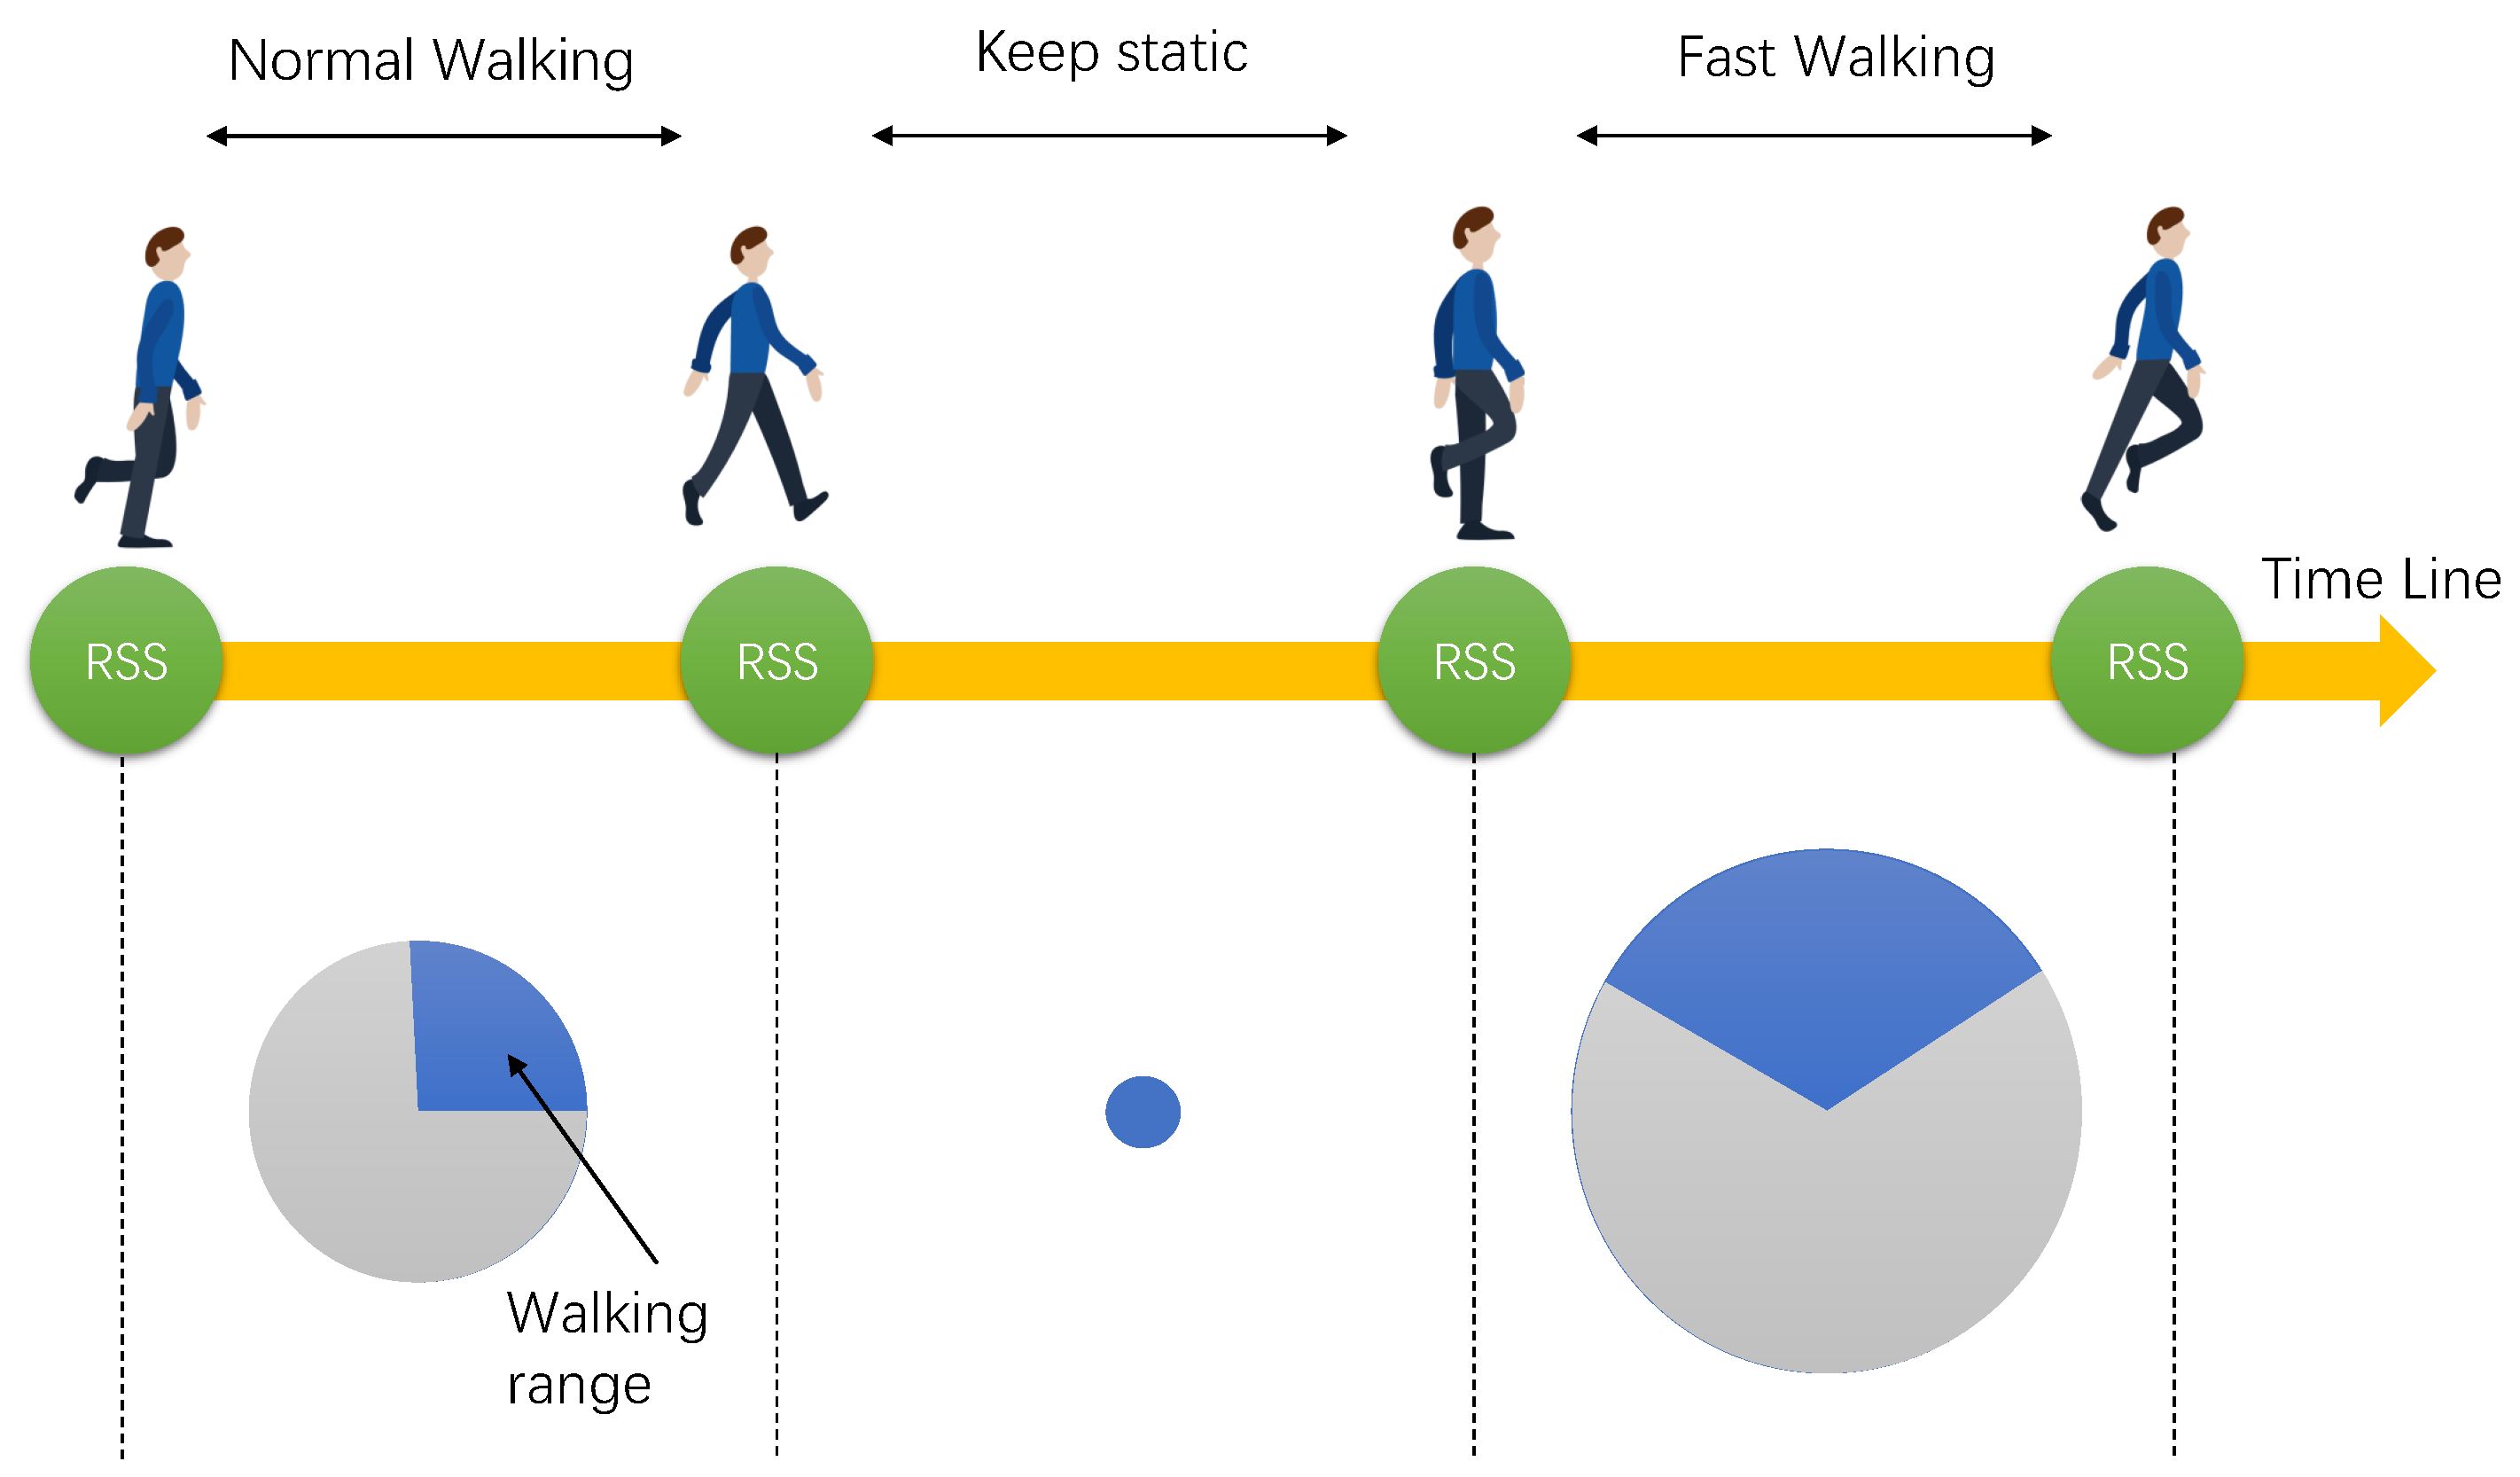
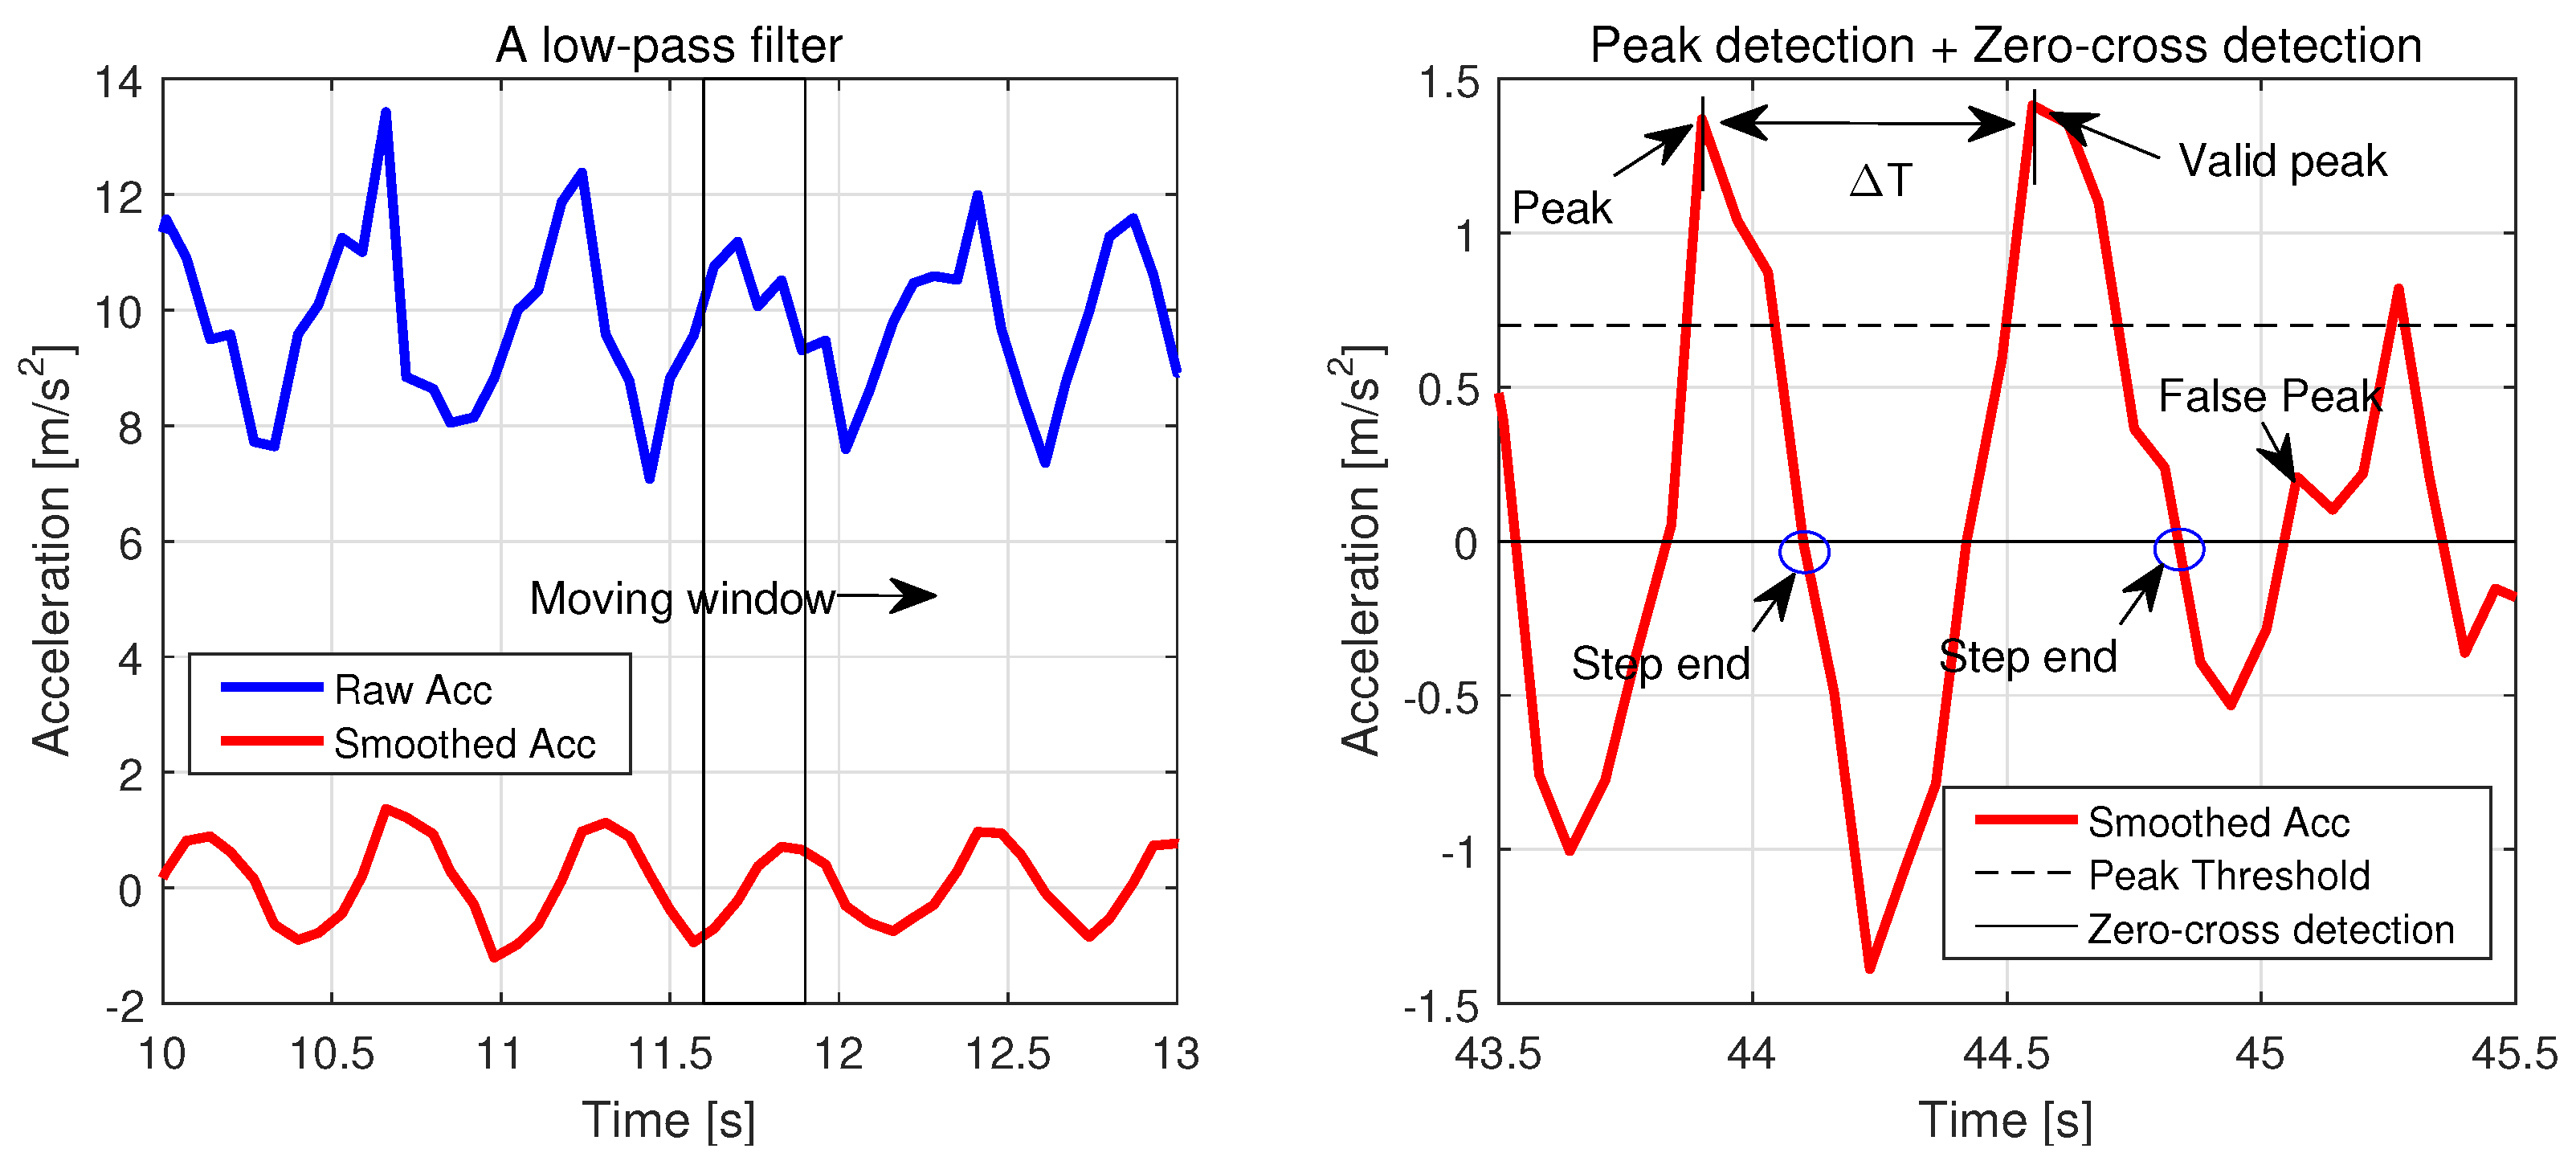
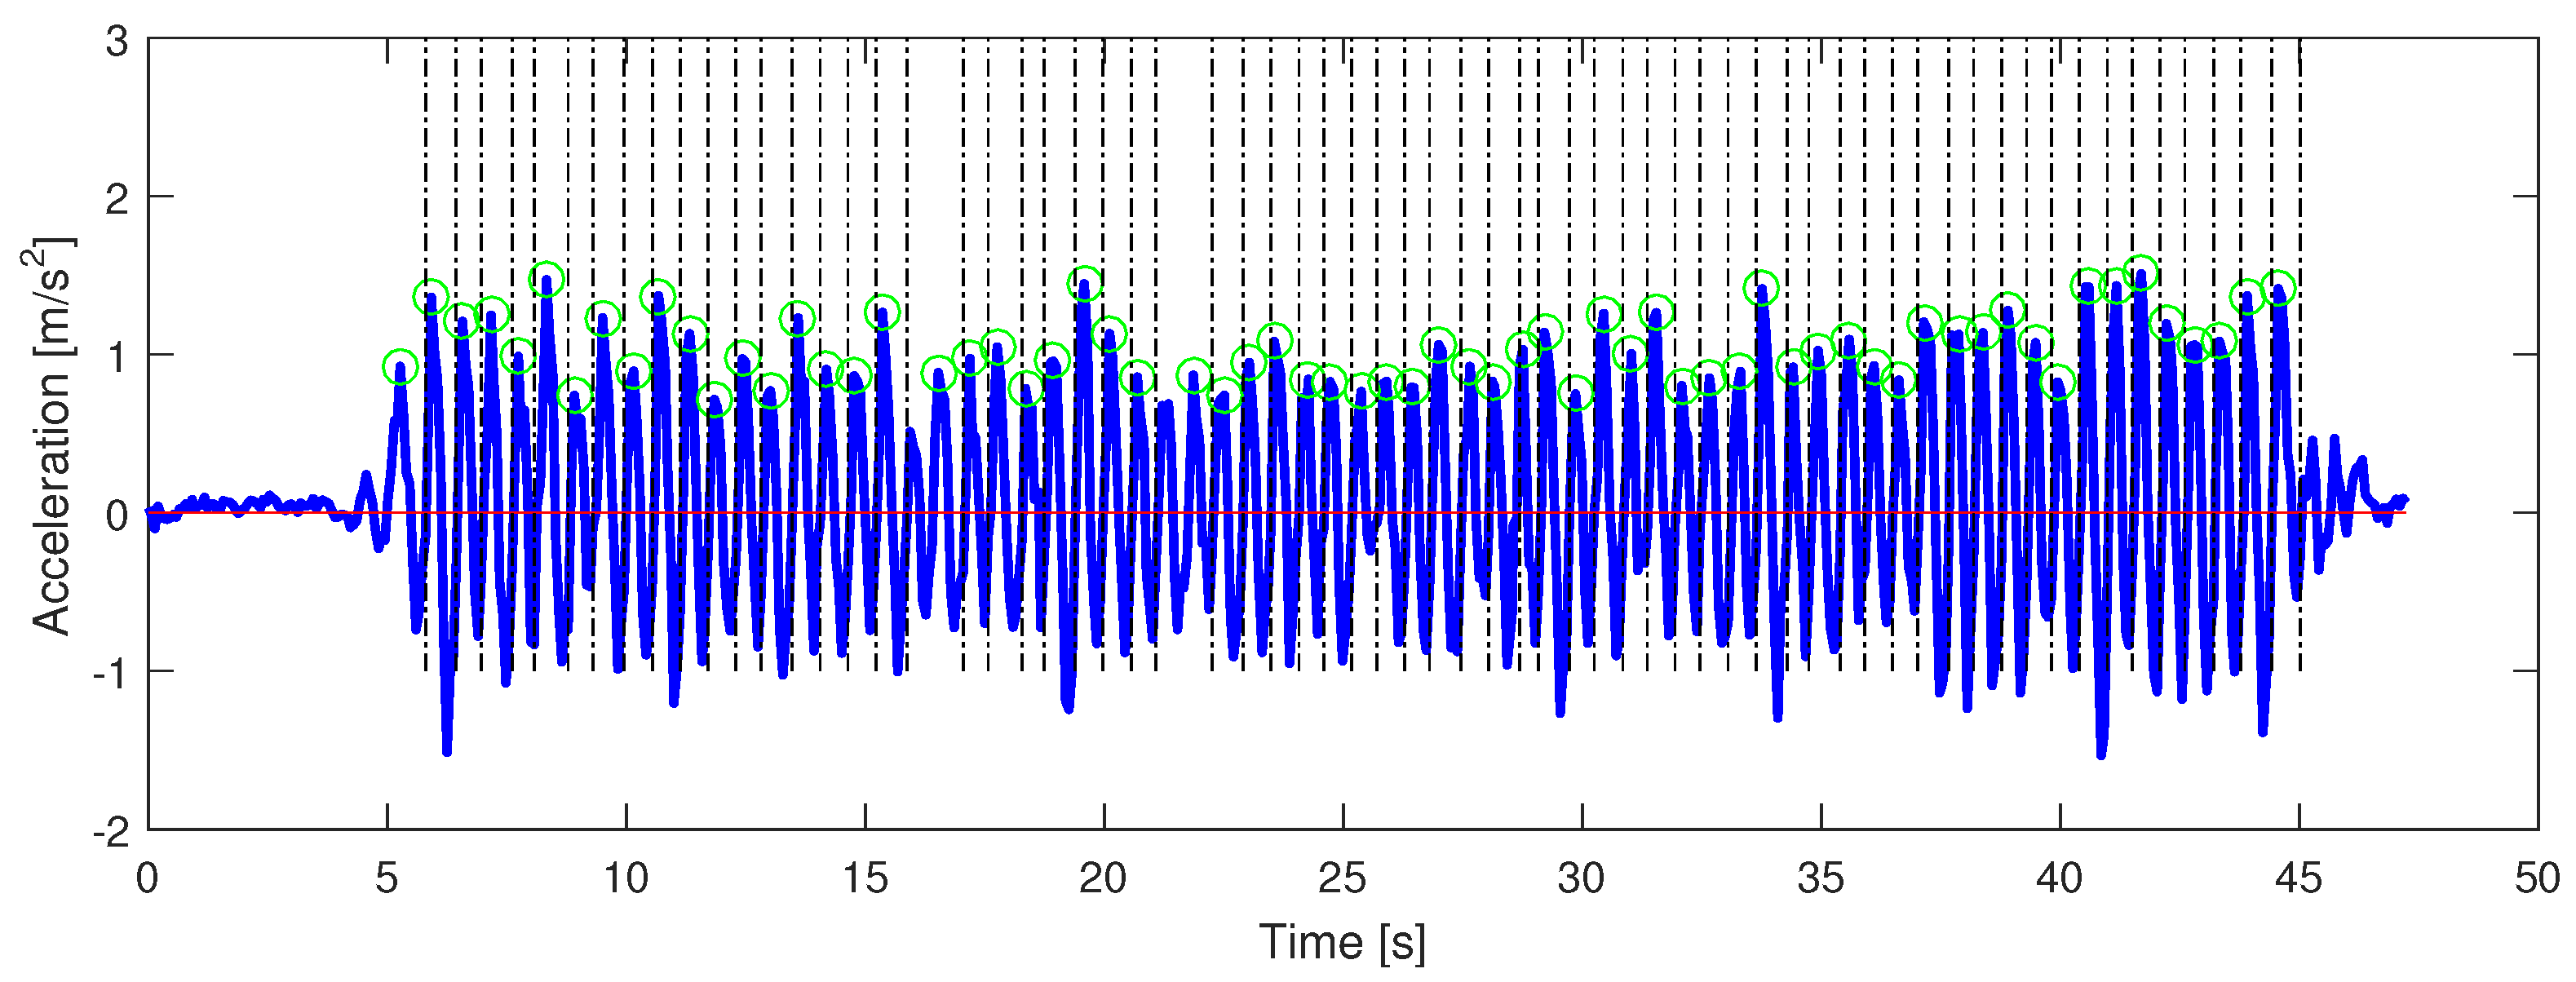
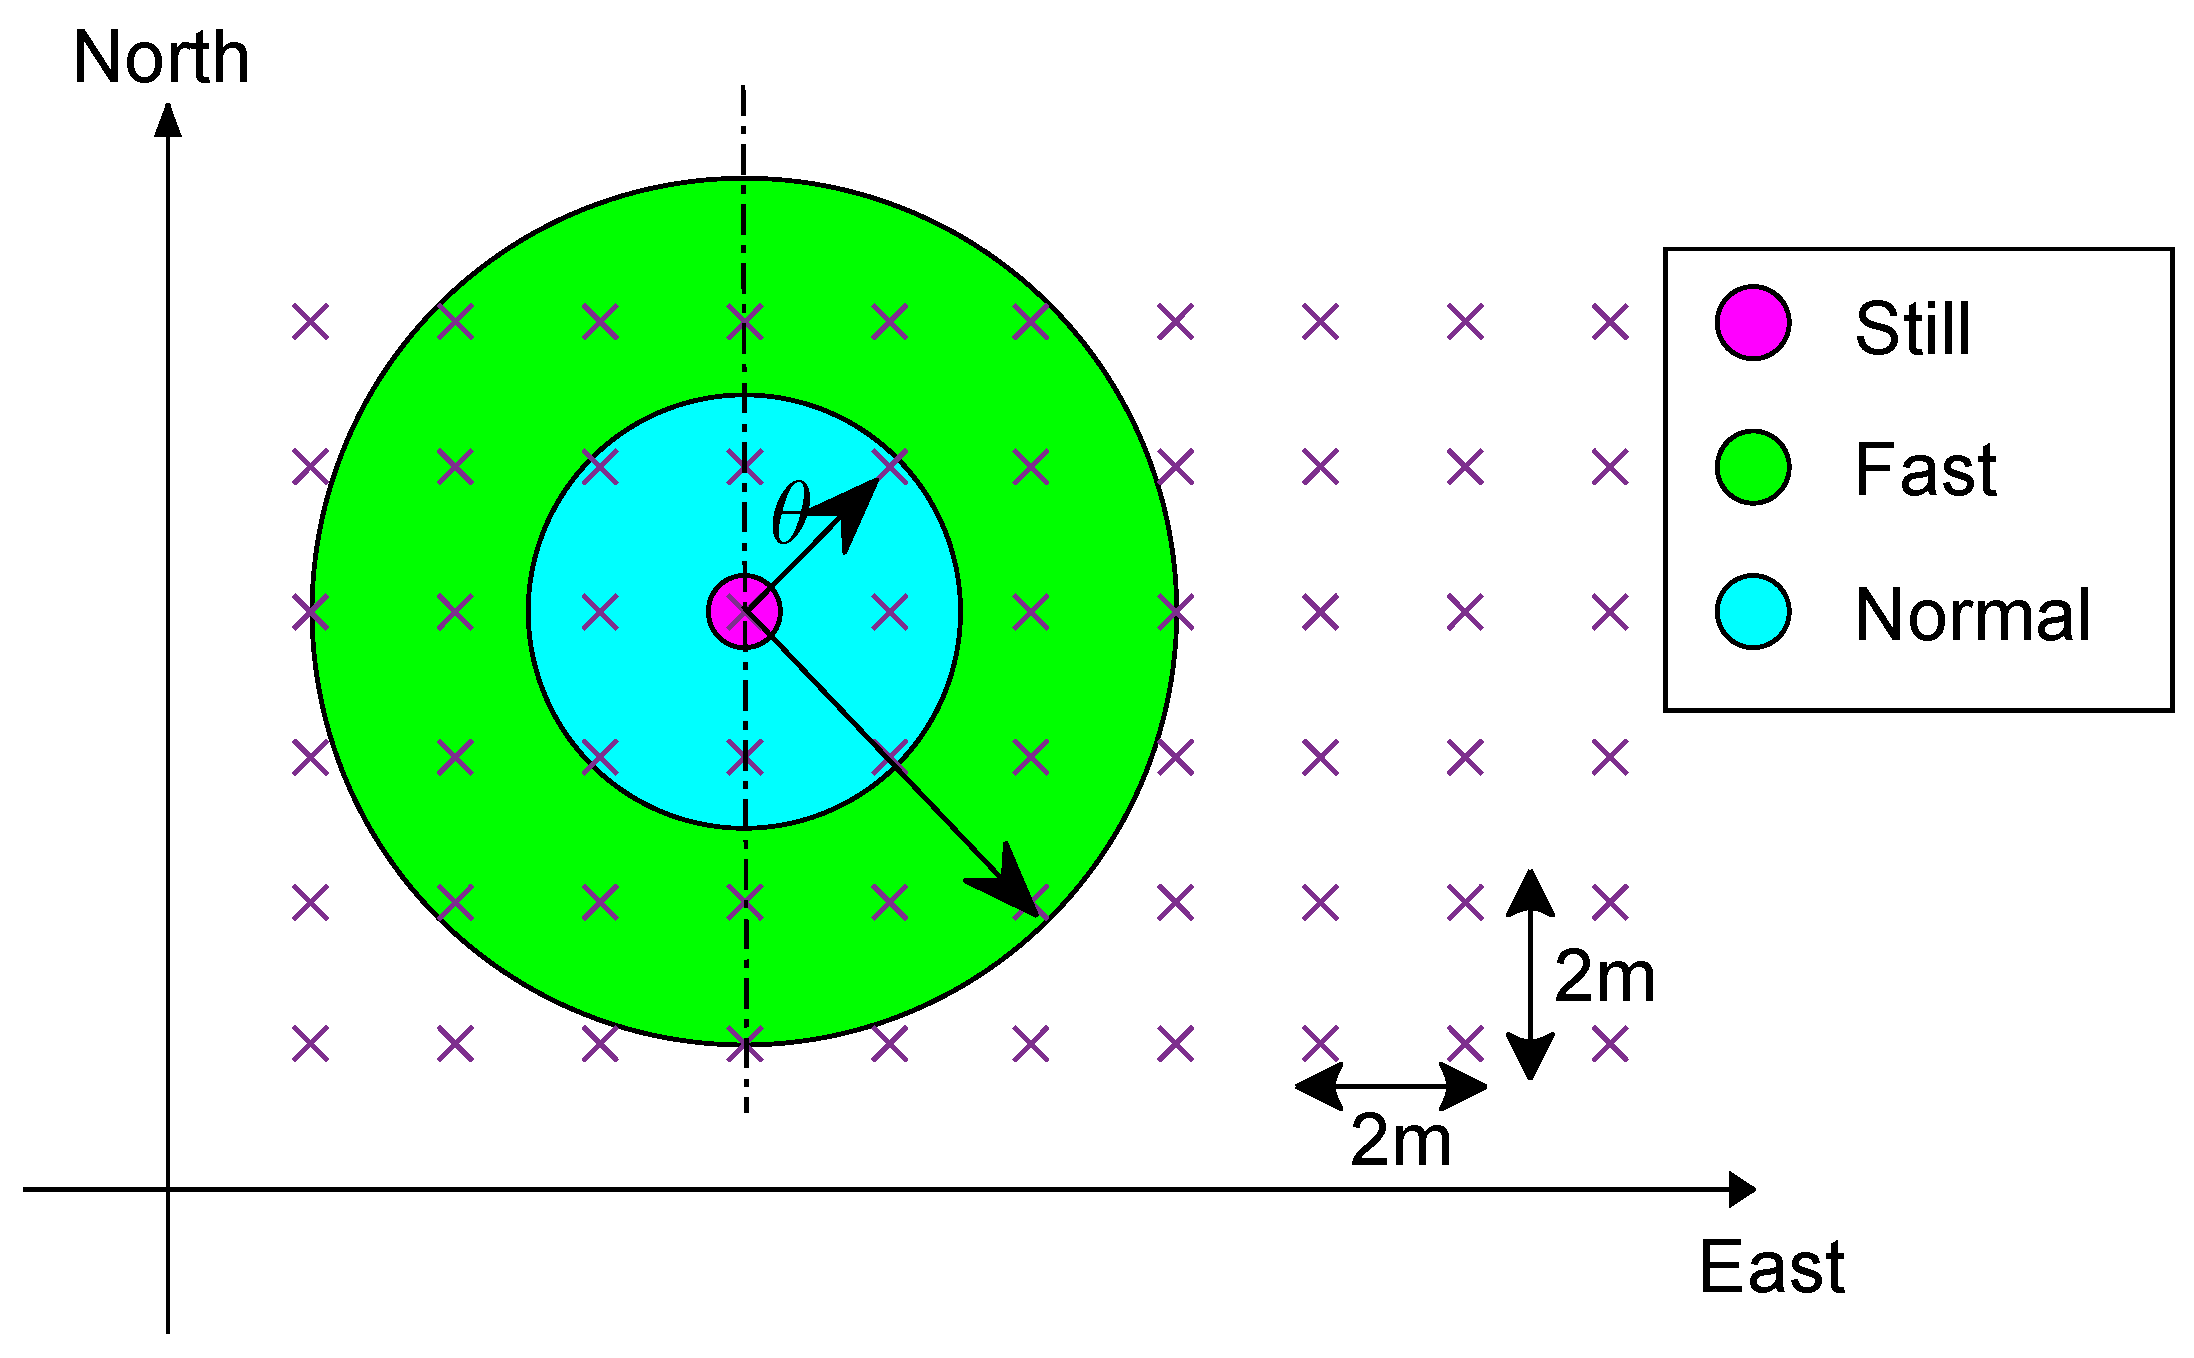
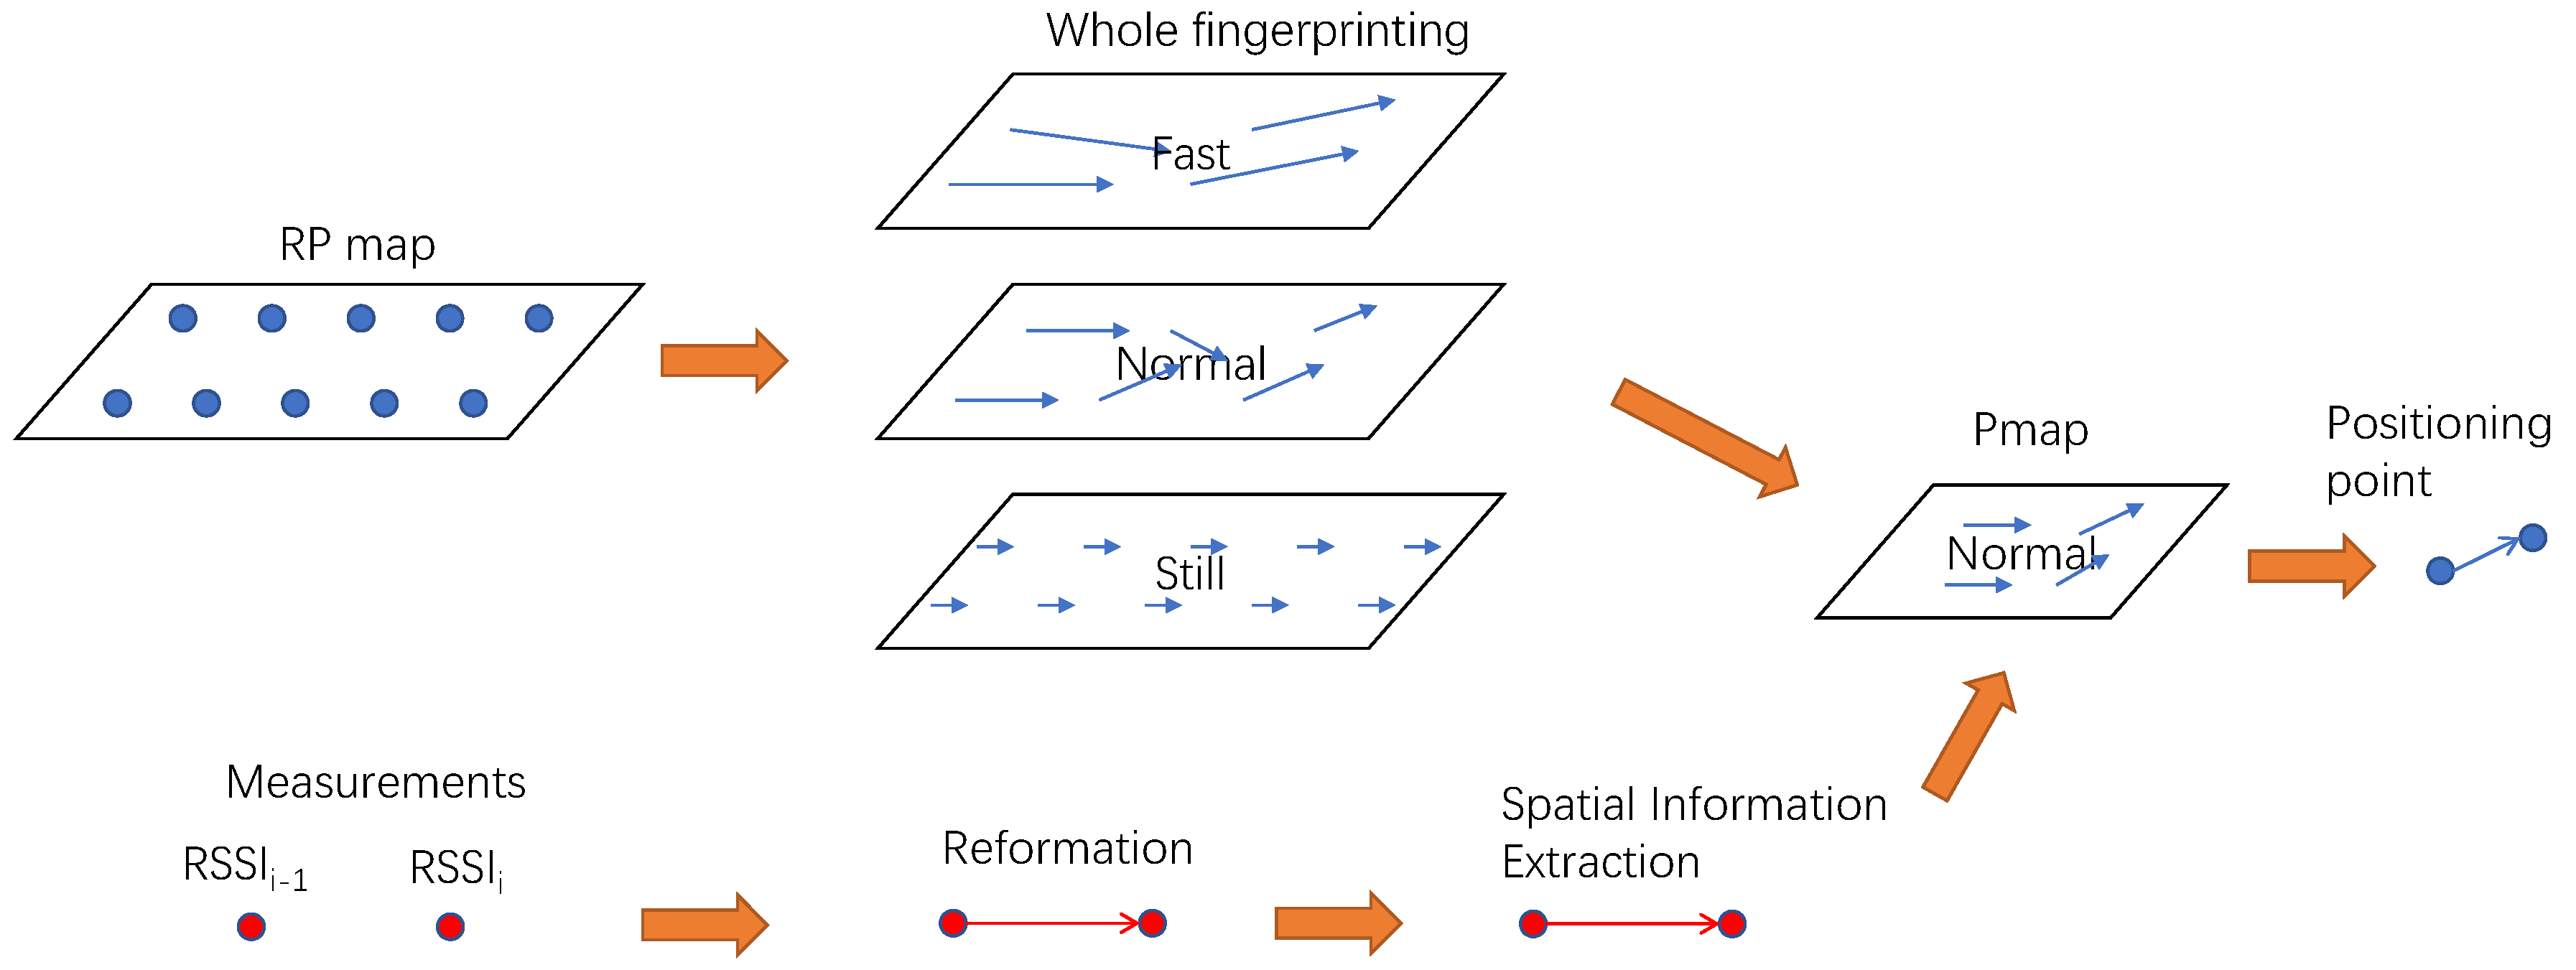
3.2. Spatial Mobility Information Extraction
3.3. Pairwise RSS Radio Map Construction and Online Inference
4. Experiments and Results
4.1. Static Test for SSD Method
4.2. Testbed Setup for PSSD Method
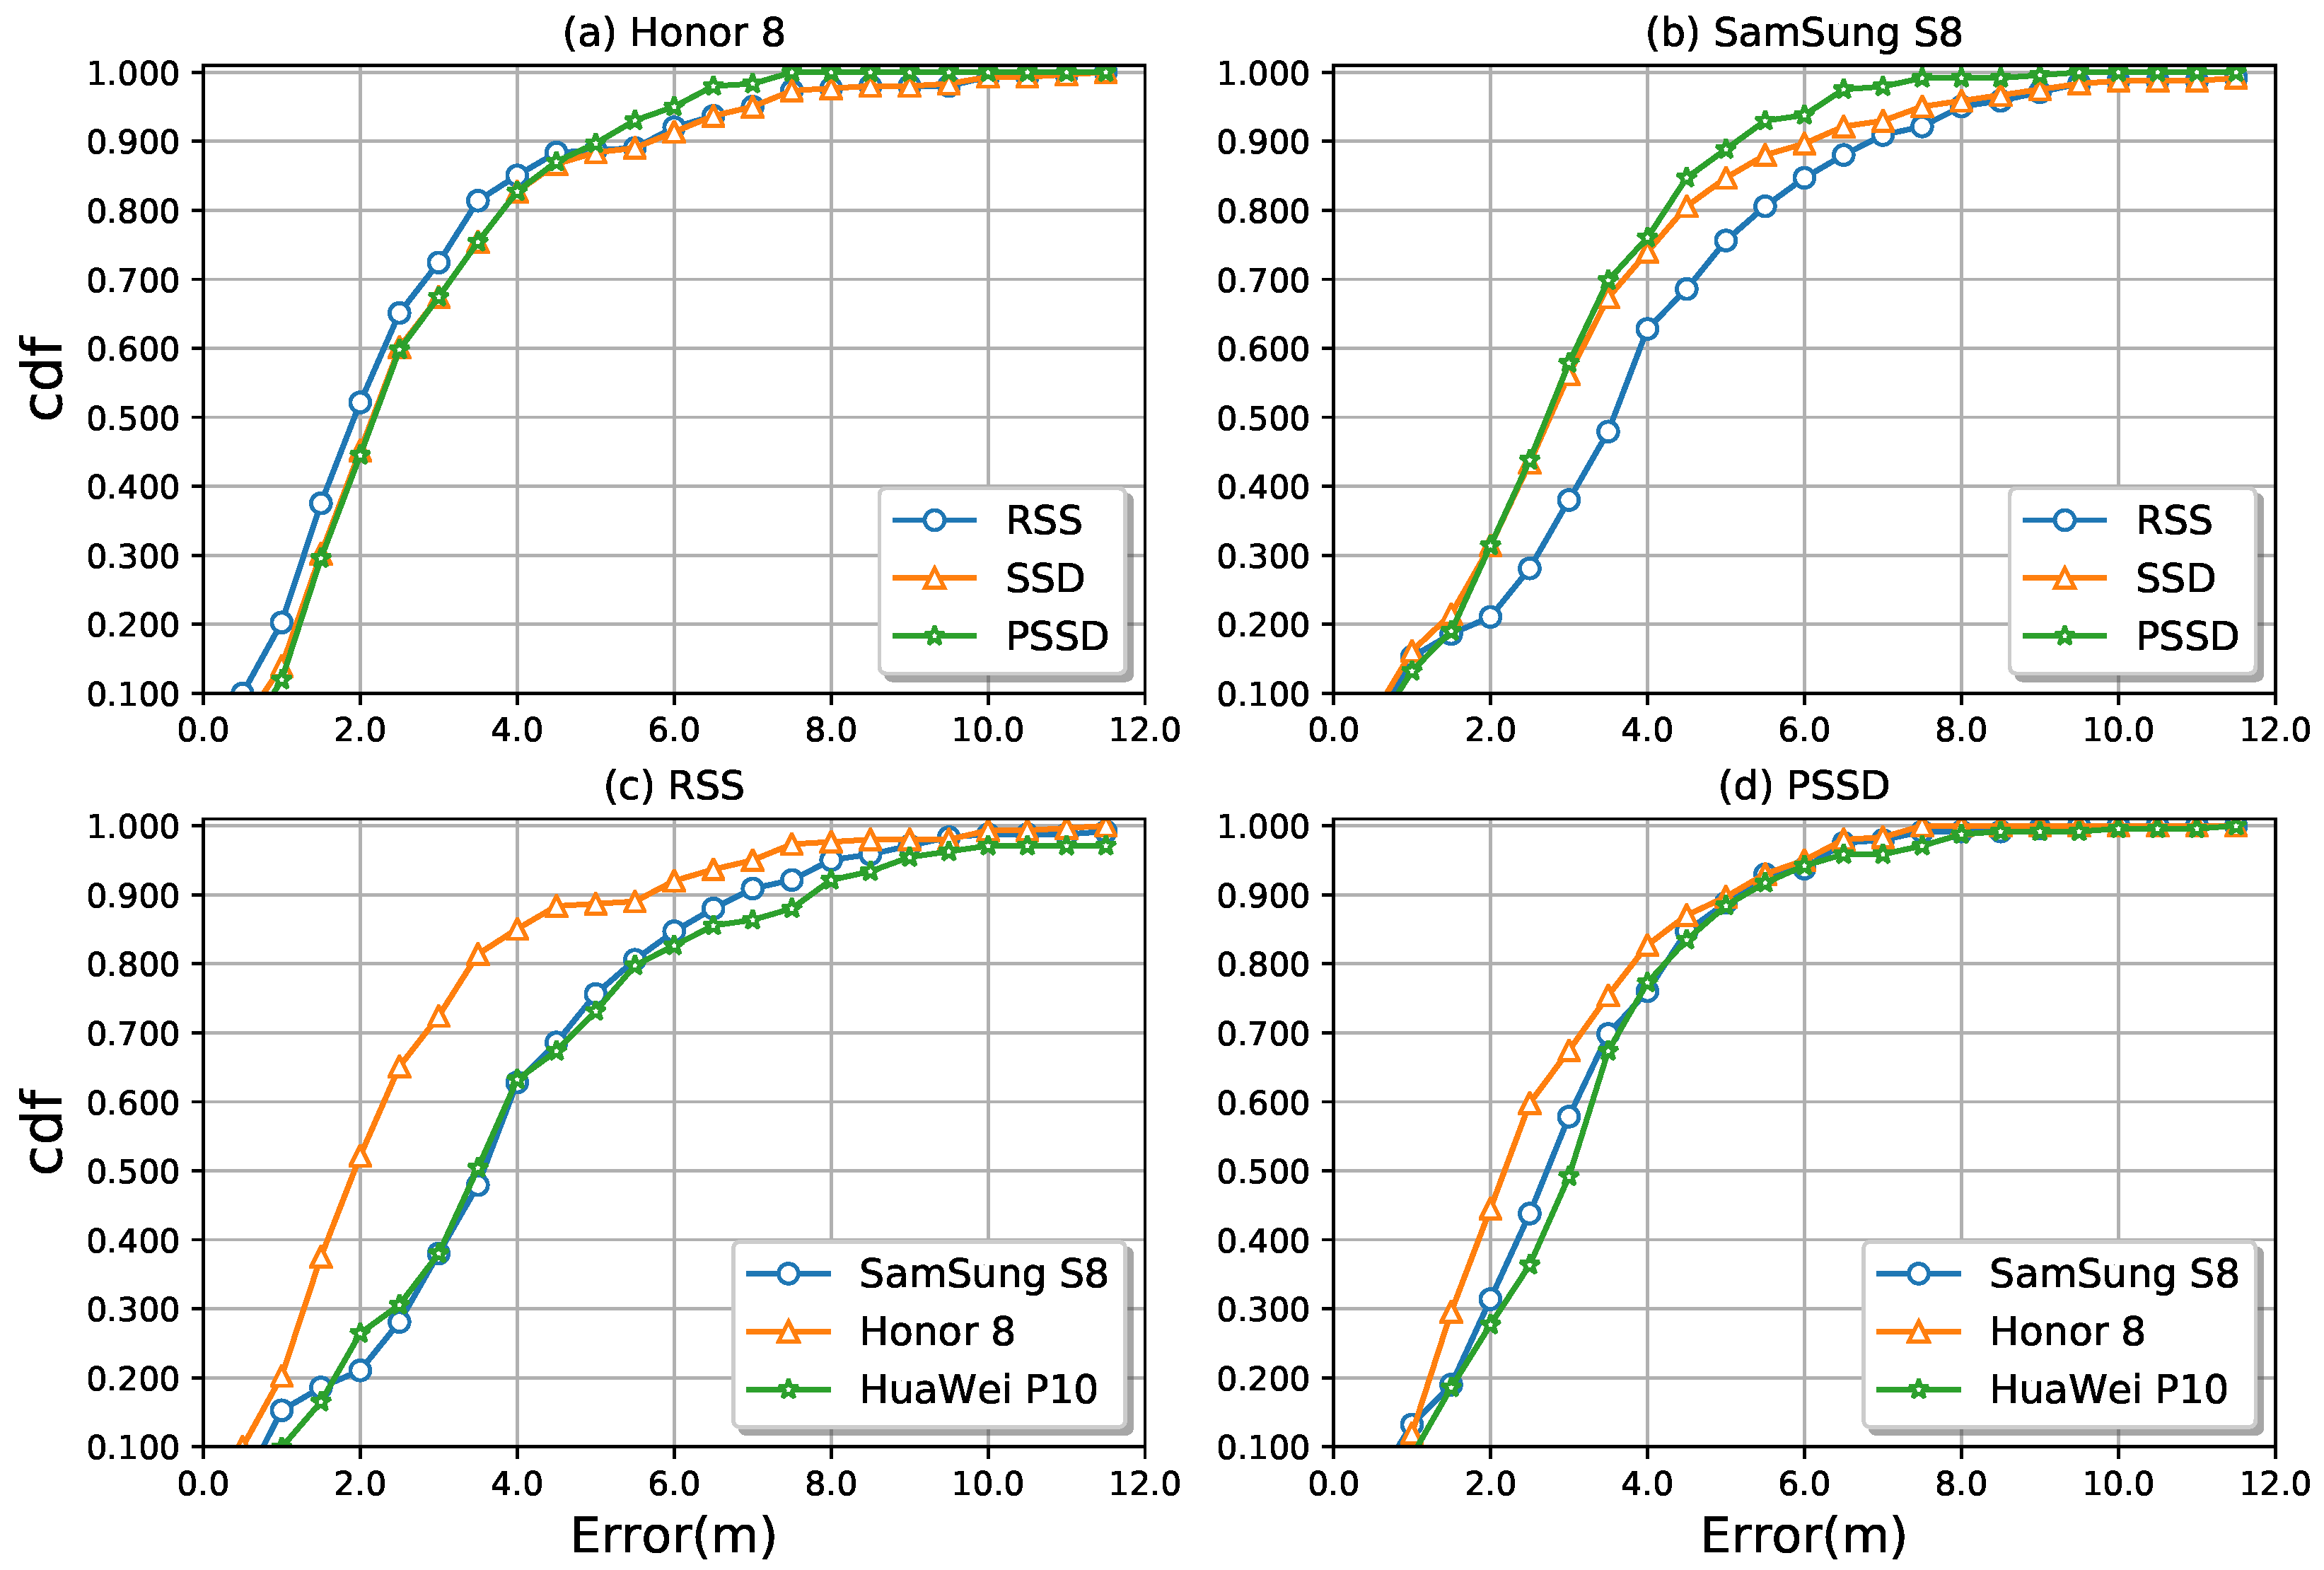
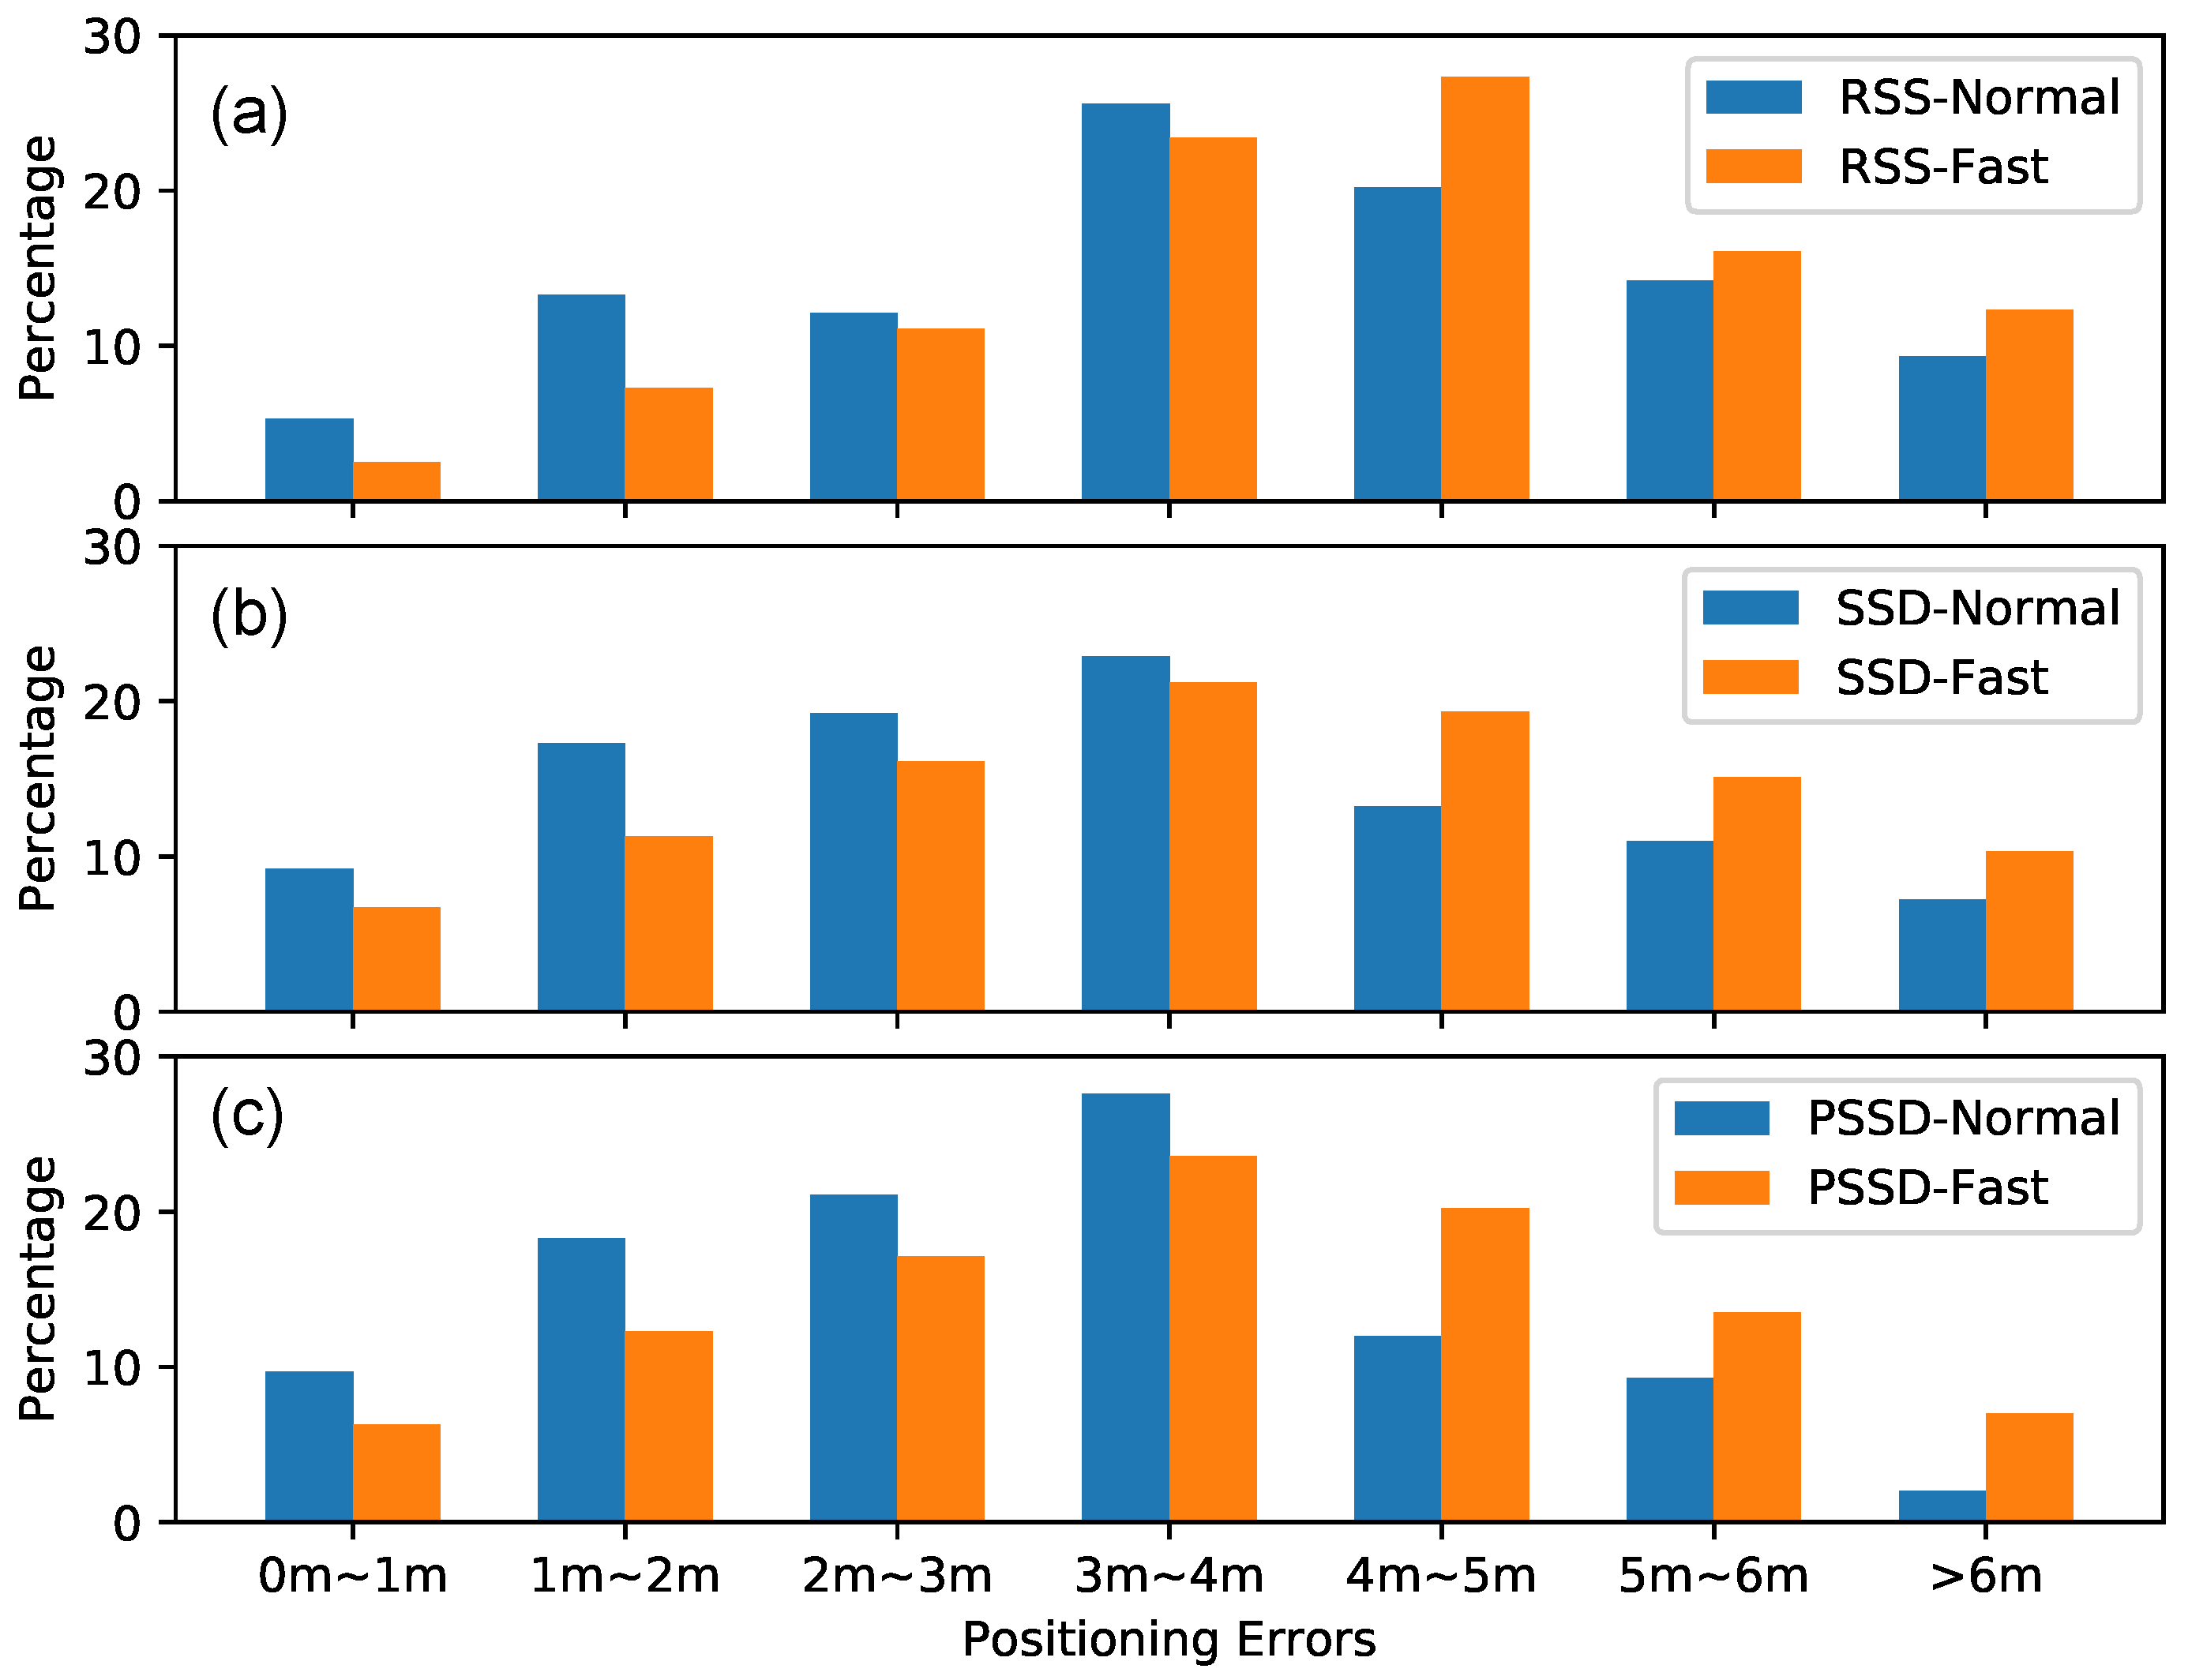
4.3. Overall Performance Evaluation
5. Conclusions
Author Contributions
Funding
Acknowledgments
Conflicts of Interest
References
- Global Indoor Location Market Analysis (2017–2023). Available online: https://www.reportlinker.com/p05207399/Global-Indoor-Location-Market-Analysis.html (accessed on 23 November 2017).
- He, S.; Chan, S.H.G. Wi-Fi Fingerprint-Based Indoor Positioning: Recent Advances and Comparisons. IEEE Commun. Surv. Tutor. 2016, 18, 466–490. [Google Scholar] [CrossRef]
- Basri, C.; Khadimi, A.E. Survey on indoor localization system and recent advances of WIFI fingerprinting technique. In Proceedings of the International Conference on Multimedia Computing and Systems, Marrakech, Morocco, 29 September–1 October 2016; pp. 253–259. [Google Scholar]
- Correa, A.; Barcelo, M.; Morell, A.; Vicario, J.L. A Review of Pedestrian Indoor Positioning Systems for Mass Market Applications. Sensors 2017, 17, 1927. [Google Scholar] [CrossRef] [PubMed]
- Zafari, F.; Gkelias, A.; Leung, K. A Survey of Indoor Localization Systems and Technologies. arXiv, 2017; arXiv:1709.01015. [Google Scholar]
- Karaagac, A.; Haxhibeqiri, J.; Ridolfi, M.; Joseph, W.; Moerman, I.; Hoebeke, J. Evaluation of accurate indoor localization systems in industrial environments. In Proceedings of the IEEE International Conference on Emerging Technologies and Factory Automation, Limassol, Cyprus, 12–15 September 2017. [Google Scholar]
- Martin, E.; Vinyals, O.; Friedland, G.; Bajcsy, R. Precise indoor localization using smart phones. In Proceedings of the International Conference on Multimedea 2010, Firenze, Italy, 25–29 October 2010; pp. 787–790. [Google Scholar]
- Shu, Y.; Huang, Y.; Zhang, J.; Coué, P.; Cheng, P.; Chen, J.; Kang, G.S. Gradient-Based Fingerprinting for Indoor Localization and Tracking. IEEE Trans. Ind. Electron. 2016, 63, 2424–2433. [Google Scholar] [CrossRef]
- Dortz, N.L.; Gain, F.; Zetterberg, P. WiFi fingerprint indoor positioning system using probability distribution comparison. In Proceedings of the IEEE International Conference on Acoustics, Speech and Signal Processing, Kyoto, Japan, 25–30 March 2012; pp. 2301–2304. [Google Scholar]
- Ge, X.; Qu, Z. Optimization WIFI indoor positioning KNN algorithm location-based fingerprint. In Proceedings of the IEEE International Conference on Software Engineering and Service Science, Beijing, China, 26–28 August 2016; pp. 135–137. [Google Scholar]
- Li, Z.; Liu, J.; Yang, F.; Niu, X.; Li, L.; Wang, Z.; Chen, R. A Bayesian Density Model Based Radio Signal Fingerprinting Positioning Method for Enhanced Usability. Sensors 2018, 18, 4063. [Google Scholar] [CrossRef] [PubMed]
- Turner, D.; Savage, S.; Snoeren, A.C. On the empirical performance of self-calibrating WiFi location systems. In Proceedings of the Local Computer Networks, Bonn, Germany, 4–7 October 2011; pp. 76–84. [Google Scholar]
- Hossain, A.K.M.M.; Jin, Y.; Soh, W.S.; Van, H.N. SSD: A Robust RF Location Fingerprint Addressing Mobile Devices’ Heterogeneity. IEEE Trans. Mob. Comput. 2013, 12, 65–77. [Google Scholar] [CrossRef]
- Haeberlen, A. Practical robust localization over large-scale 802.11 wireless networks. In Proceedings of the International Conference on Mobile Computing and Networking, Philadelphia, PA, USA, 26 September–1 October 2004; pp. 70–84. [Google Scholar]
- Kjærgaard, M.B. Automatic mitigation of sensor variations for signal strength based location systems. In Proceedings of the International Conference on Location- and Context-Awareness, Dublin, Ireland, 10–11 May 2006; pp. 30–47. [Google Scholar]
- Wu, C.; Yang, Z.; Zhou, Z.; Liu, Y.; Liu, M. Mitigating Large Errors in WiFi-based Indoor Localization for Smartphones. IEEE Trans. Veh. Technol. 2017, 66, 6246–6257. [Google Scholar] [CrossRef]
- Kim, Y.; Shin, H.; Cha, H. Smartphone-based Wi-Fi pedestrian-tracking system tolerating the RSS variance problem. In Proceedings of the IEEE International Conference on Pervasive Computing and Communications, Lugano, Switzerland, 19–23 March 2012; pp. 11–19. [Google Scholar]
- Chen, Z.; Zou, H.; Jiang, H.; Zhu, Q.; Soh, Y.C.; Xie, L. Fusion of WiFi, smartphone sensors and landmarks using the Kalman filter for indoor localization. Sensors 2015, 15, 715–732. [Google Scholar] [CrossRef] [PubMed]
- Liu, J.; Chen, R.; Ling, P.; Guinness, R.; Kuusniemi, H. A Hybrid Smartphone Indoor Positioning Solution for Mobile LBS. Sensors 2012, 12, 17208–17233. [Google Scholar] [CrossRef] [PubMed] [Green Version]
- Tsui, A.W.; Chuang, Y.H.; Chu, H.H. Unsupervised Learning for Solving RSS Hardware Variance Problem in WiFi Localization. Mob. Netw. Appl. 2009, 14, 677–691. [Google Scholar] [CrossRef]
- Han, S.; Zhao, C.; Meng, W.; Li, C. Cosine similarity based fingerprinting algorithm in WLAN indoor positioning against device diversity. In Proceedings of the IEEE International Conference on Communications, London, UK, 8–12 June 2015; pp. 2710–2714. [Google Scholar]
- Xie, Y.; Wang, Y.; Nallanathan, A.; Wang, L. An Improved K-Nearest-Neighbor Indoor Localization Method Based on Spearman Distance. IEEE Signal Process. Lett. 2016, 23, 351–355. [Google Scholar] [CrossRef] [Green Version]
- Wang, L.; Wu, X.; Zheng, B.; Cui, J.; Zhou, H. A cosine similarity-based compensation strategy for RSS detection variance in indoor localization. In Proceedings of the Telecommunication Networks and Applications Conference, Dunedin, New Zealand, 7–9 December 2017; pp. 47–52. [Google Scholar]
- Dong, F.; Chen, Y.; Liu, J.; Ning, Q.; Piao, S. A Calibration-Free Localization Solution for Handling Signal Strength Variance. In Proceedings of the International Conference on Mobile Entity Localization and Tracking in GPS-Less Environments, Orlando, FL, USA, 30 September 2009. [Google Scholar]
- Laoudias, C.; Piché, R.; Panayiotou, C.G. Device self-calibration in location systems using signal strength histograms. J. Locat. Based Serv. 2013, 7, 165–181. [Google Scholar] [CrossRef]
- Liu, B.C.; Lin, K.H.; Wu, J.C. Analysis of hyperbolic and circular positioning algorithms using stationary signal-strength-difference measurements in wireless communications. IEEE Trans. Veh. Technol. 2006, 55, 499–509. [Google Scholar] [CrossRef]
- Kjrgaard, M.B.; Munk, C.V. Hyperbolic Location Fingerprinting: A Calibration-Free Solution for Handling Differences in Signal Strength (concise contribution). In Proceedings of the IEEE International Conference on Pervasive Computing and Communications, Hong Kong, China, 17–21 March 2008; pp. 110–116. [Google Scholar]
- Zheng, Z.; Chen, Y.; He, T.; Li, F.; Chen, D. Weight-RSS: A calibration-free and robust method for WLAN-Based indoor positioning. Int. J. Distrib. Sens. Netw. 2015, 11, 573582. [Google Scholar] [CrossRef]
- Fang, S.H.; Wang, C.H.; Chiou, S.M.; Lin, P. Calibration-Free Approaches for Robust Wi-Fi Positioning against Device Diversity: A Performance Comparison. In Proceedings of the Vehicular Technology Conference, Yokohama, Japan, 6–9 May 2012; pp. 1–5. [Google Scholar]
- Fet, N.; Handte, M.; Marrón, P.J. A model for WLAN signal attenuation of the human body. In Proceedings of the ACM International Joint Conference on Pervasive and Ubiquitous Computing, Zurich, Switzerland, 8–12 September 2013; pp. 499–508. [Google Scholar]
- Li, X.; Wang, J.; Liu, C.; Zhang, L.; Li, Z. Integrated WiFi/PDR/Smartphone Using an Adaptive System Noise Extended Kalman Filter Algorithm for Indoor Localization. ISPRS Int. J. Geo-Inf. 2016, 5, 8. [Google Scholar] [CrossRef]
- Chen, G.; Meng, X.; Wang, Y.; Zhang, Y.; Tian, P.; Yang, H. Integrated WiFi/PDR/Smartphone Using an Unscented Kalman Filter Algorithm for 3D Indoor Localization. Sensors 2015, 15, 24595–24614. [Google Scholar] [CrossRef] [PubMed] [Green Version]
- Cho, H.; Kwon, Y. RSS-based indoor localization with PDR location tracking for wireless sensor networks. AEUE Int. J. Electron. Commun. 2016, 70, 250–256. [Google Scholar] [CrossRef]
- Zhang, M.; Shen, W.; Yao, Z.; Zhu, J. Multiple information fusion indoor location algorithm based on WIFI and improved PDR. In Proceedings of the Chinese Control Conference, Chengdu, China, 27–29 July 2016; pp. 5086–5092. [Google Scholar]
- Koo, B.; Lee, S.; Lee, M.; Lee, D.; Lee, S.; Kim, S. PDR/fingerprinting fusion indoor location tracking using RSS recovery and clustering. In Proceedings of the International Conference on Indoor Positioning and Indoor Navigation, Busan, South Korea, 27–30 October 2014; pp. 699–704. [Google Scholar]
- Hassan, M. A performance model of pedestrian dead reckoning with activity-based location updates. In Proceedings of the IEEE International Conference on Networks, Singapore, 12–14 December 2012; pp. 64–69. [Google Scholar]
- Radu, V.; Marina, M.K. HiMLoc: Indoor smartphone localization via activity aware Pedestrian Dead Reckoning with selective crowdsourced WiFi fingerprinting. In Proceedings of the International Conference on Indoor Positioning and Indoor Navigation, FMontbeliard-Belfort, France, 28–31 October 2013; pp. 1–10. [Google Scholar]
- Bahl, P.; Padmanabhan, V.N. RADAR: An In-Building RF-based User Location and Tracking System. In Proceedings of the INFOCOM 2000, Nineteenth Joint Conference of the IEEE Computer and Communications Societies, Tel Aviv, Israel, 26–30 March 2000; Volume 2, pp. 775–784. [Google Scholar]
- Rappaport, T.S. Wireless Communications: Principles and Practice; Prentice-Hall, Inc.: Upper Saddle River, NJ, USA, 1995. [Google Scholar]
- Saunders, S.R.; Simon, S.R. Antennas and Propagation for Wireless Communication Systems; J. Wiley and Sons, Inc.: New York, NY, USA, 1999; pp. 1–4. [Google Scholar]
- Aitaterini, P.; Ji, T. Frequency and velocity of people walking. Struct. Eng. 2005, 84, 36–40. [Google Scholar]
- Slater, J.A.; Malys, S. WGS 84—Past, Present and Future. In Advances in Positioning and Reference Frames; International Association of Geodesy, Symposia, Brunner, F.K., Eds.; Springer: Berlin/Heidelberg, Germany, 1998; Volume 118. [Google Scholar]


| Smartphone | Test Approach | Matching Rate | Mean Error | RMSE |
|---|---|---|---|---|
| Samsung S8 | RSS | 83.4% | 0.48 | 1.65 |
| Samsung S8 | SSD | 82.0% | 0.85 | 1.96 |
| Samsung S8 | MSSD | 82.0% | 0.85 | 1.96 |
| XiaoMi | RSS | 6.7% | 3.79 | 4.60 |
| XiaoMi | SSD | 18.7% | 2.86 | 3.53 |
| XiaoMi | MSSD | 22.1% | 2.64 | 3.28 |
| Number of Tests | Walk Speed | Calculated Steps | Steps Error | Error Rate |
|---|---|---|---|---|
| 1 | Normal | 98 | 2 | 2% |
| 2 | Normal | 97 | 3 | 3% |
| 3 | Normal | 97 | 3 | 3% |
| 4 | Fast | 99 | 1 | 1% |
| 5 | Fast | 100 | 0 | 0% |
| 6 | Fast | 99 | 1 | 1% |
| Smartphone | Test Approach | Mean Error | RMSE | Maximal Error | 90 Percentile |
|---|---|---|---|---|---|
| Honor 8 | RSS | 2.5 | 3.2 | 11.3 | 5.7 |
| Honor 8 | SSD | 2.7 | 3.4 | 11.3 | 5.8 |
| Honor 8 | PSSD | 2.6 | 3.0 | 7.1 | 5.1 |
| Samsung S8 | RSS | 3.8 | 4.6 | 19.1 | 6.7 |
| Samsung S8 | SSD | 3.2 | 4.0 | 19.1 | 6.0 |
| Samsung S8 | PSSD | 2.9 | 3.3 | 9.1 | 5.2 |
| Huawei P10 | RSS | 4.0 | 4.9 | 18.0 | 7.7 |
| Huawei P10 | SSD | 3.2 | 4.2 | 19.2 | 7.0 |
| Huawei P10 | PSSD | 3.1 | 3.6 | 11.1 | 5.3 |
© 2019 by the authors. Licensee MDPI, Basel, Switzerland. This article is an open access article distributed under the terms and conditions of the Creative Commons Attribution (CC BY) license (http://creativecommons.org/licenses/by/4.0/).
Share and Cite
Yang, F.; Xiong, J.; Liu, J.; Wang, C.; Li, Z.; Tong, P.; Chen, R. A Pairwise SSD Fingerprinting Method of Smartphone Indoor Localization for Enhanced Usability. Remote Sens. 2019, 11, 566. https://0-doi-org.brum.beds.ac.uk/10.3390/rs11050566
Yang F, Xiong J, Liu J, Wang C, Li Z, Tong P, Chen R. A Pairwise SSD Fingerprinting Method of Smartphone Indoor Localization for Enhanced Usability. Remote Sensing. 2019; 11(5):566. https://0-doi-org.brum.beds.ac.uk/10.3390/rs11050566
Chicago/Turabian StyleYang, Fan, Jian Xiong, Jingbin Liu, Changqing Wang, Zheng Li, Pengfei Tong, and Ruizhi Chen. 2019. "A Pairwise SSD Fingerprinting Method of Smartphone Indoor Localization for Enhanced Usability" Remote Sensing 11, no. 5: 566. https://0-doi-org.brum.beds.ac.uk/10.3390/rs11050566