Article

Development and Validation of a Photo-Based Measurement System to Calculate the Debarking Percentages of Processed Logs

1
University of Applied Science Weihenstephan-Triesdorf, Hans-Carl-von-Carlowitz-Platz 3, D-85354 Freising, Germany
2
Assistant Professorship of Forest Operations, Department of Ecology and Ecosystem Management, Technical University of Munich, Hans-Carl-von-Carlowitz-Platz 2, D-85354 Freising, Germany
3
Scientes Mondium UG, Ruppertskirchen 5, D-85250 Altomünster, Germany
4
Department of Forest and Wood Science, Stellenbosch University, Private Bag X1, 7602 Matieland, South Africa
*
Authors to whom correspondence should be addressed.
Submission received: 29 March 2019 / Revised: 29 April 2019 / Accepted: 10 May 2019 / Published: 12 May 2019
(This article belongs to the Special Issue Advances in Active Remote Sensing of Forests)

Abstract

:
Within a research project investigating the applicability and performance of modified harvesting heads used during the debarking of coniferous tree species, the actual debarking percentage of processed logs needed to be evaluated. Therefore, a computer-based photo-optical measurement system (Stemsurf) designed to assess the debarking percentage recorded in the field was developed, tested under laboratory conditions, and applied in live field operations. In total, 1720 processed logs of coniferous species from modified harvesting heads were recorded and analyzed within Stemsurf. With a single log image as the input, the overall debarking percentage was calculated by further estimating the un-displayed part of the log surface by defining polygons representing the differently debarked areas of the log surface. To assess the precision and bias of the developed measurement system, 480 images were captured under laboratory conditions on an artificial log with defined surface polygons. Within the laboratory test, the standard deviation of average debarking percentages remained within a 4% variation. A positive bias of 6.7% was caused by distortion and perspective effects. This resulted in an average underestimation of 1.1% for the summer debarking percentages gathered from field operations. The software generally performed as anticipated through field and lab testing and offered a suitable alternative of assessing stem debarking percentage, a task that should increase in importance as more operations are targeting debarked products.

1. Introduction

Remote sensing technologies play an important role as nondestructive tools used to evaluate numerous scientific questions and approaches. Within a forestry context, much development has occurred in the last two decades where airborne or even spaceborne data are utilized to evaluate canopy structures [1], crown characteristics [2,3,4], and above-ground biomass itself [5,6]. However, due to the nondestructive nature, terrestrial optical remote sensing technologies are also increasingly used to measure forest characteristics such as sub-canopy architecture [7], leaf area index [8,9,10], tree height, diameter at breast height [11,12,13,14,15,16,17,18] or even above-ground stump geometry [19].
In addition to tree morphology and stand structure, optical measurement systems are increasingly used for detailed investigations of the resulting forest products. Such radioscopic and nondestructive measurement systems (flat X-ray, CT scanners, laser, or photo-optical systems) are normally positioned at the in-feed of debarking facilities or the first manufacturing line within an industrial plant to search for beneficial or undesirable log characteristics such as resin pockets, branches, cracks, impurities, and foreign bodies [20,21,22]. For example, the images can be used to increase the yield and marginable profit by pre-calculating the cutting sequence within sawmills [21,23,24]. Concerning bark measurements, the systems are able to provide additional bark information, such as the debarking percentage and absolute and relative bark volumes in comparison to the total stem volume [25,26]. The systems mentioned above have all been tested and generally perform very well. However, because of their location at an industrial plant, they do not allow for measurements to be recorded directly in the forest. This precondition was a requirement for our project, since the aim was to assess the debarking efficiency of modified harvesting heads during live forest operations. Such harvesting heads are used in mechanized forest operations to fell, delimb, and process trees into assortments of varying lengths.
More specifically, technologies developed for harvesting operations in Eucalyptus sp. plantations in South Africa, South America, Australia, and so forth were transferred and tested under central European conditions. Therefore, conventionally used harvesting heads were modified with parts originally designed for Eucalyptus operations. Conventional debarking measurement procedures for in-field use, such as the trans-line intersect measurement procedure [27,28], were considered but were determined to be too inaccurate to assess a high volume of wood. The net measurement method, where nets with defined square areas are used and then knots are counted that lie on bark or wooden areas of a log to calculate the debarking percentage, was also tested in a pilot study. However, the method proved to be too time consuming and was therefore not further pursued. For a higher accuracy and precision, the utilization of complex but precise facility-based measurement systems (CT, X-ray, laser) was also under review. However, a research approach relying on industry-based radioscopic systems was not feasible, as the measurements had to be embedded into the ongoing harvesting operations with a minimum of interference. Furthermore, the diverse wood assortments in Germany are usually sold to different industrial customers and are therefore sorted directly after harvesting and could not be measured at a single processing facility with radioscopic systems. It was of primary interest to evaluate the whole tree and all resulting assortments after mechanized processing to evaluate the influence of log diameter and tree structure on the debarking efficiency.
Based on the specific test requirements—(i) high accuracy over a medium to high sample size, (ii) easy and fast execution of in-field measurements, (iii) operability within ongoing harvesting operations between the harvesting and the stacking of the logs—no suitable measurement system was available on the market. Therefore, the objective of this study was to develop a photo-optical measurement system designed to quantify the debarking percentage of processed logs and to assess its performance under laboratory and field conditions.

2. Materials and Methods

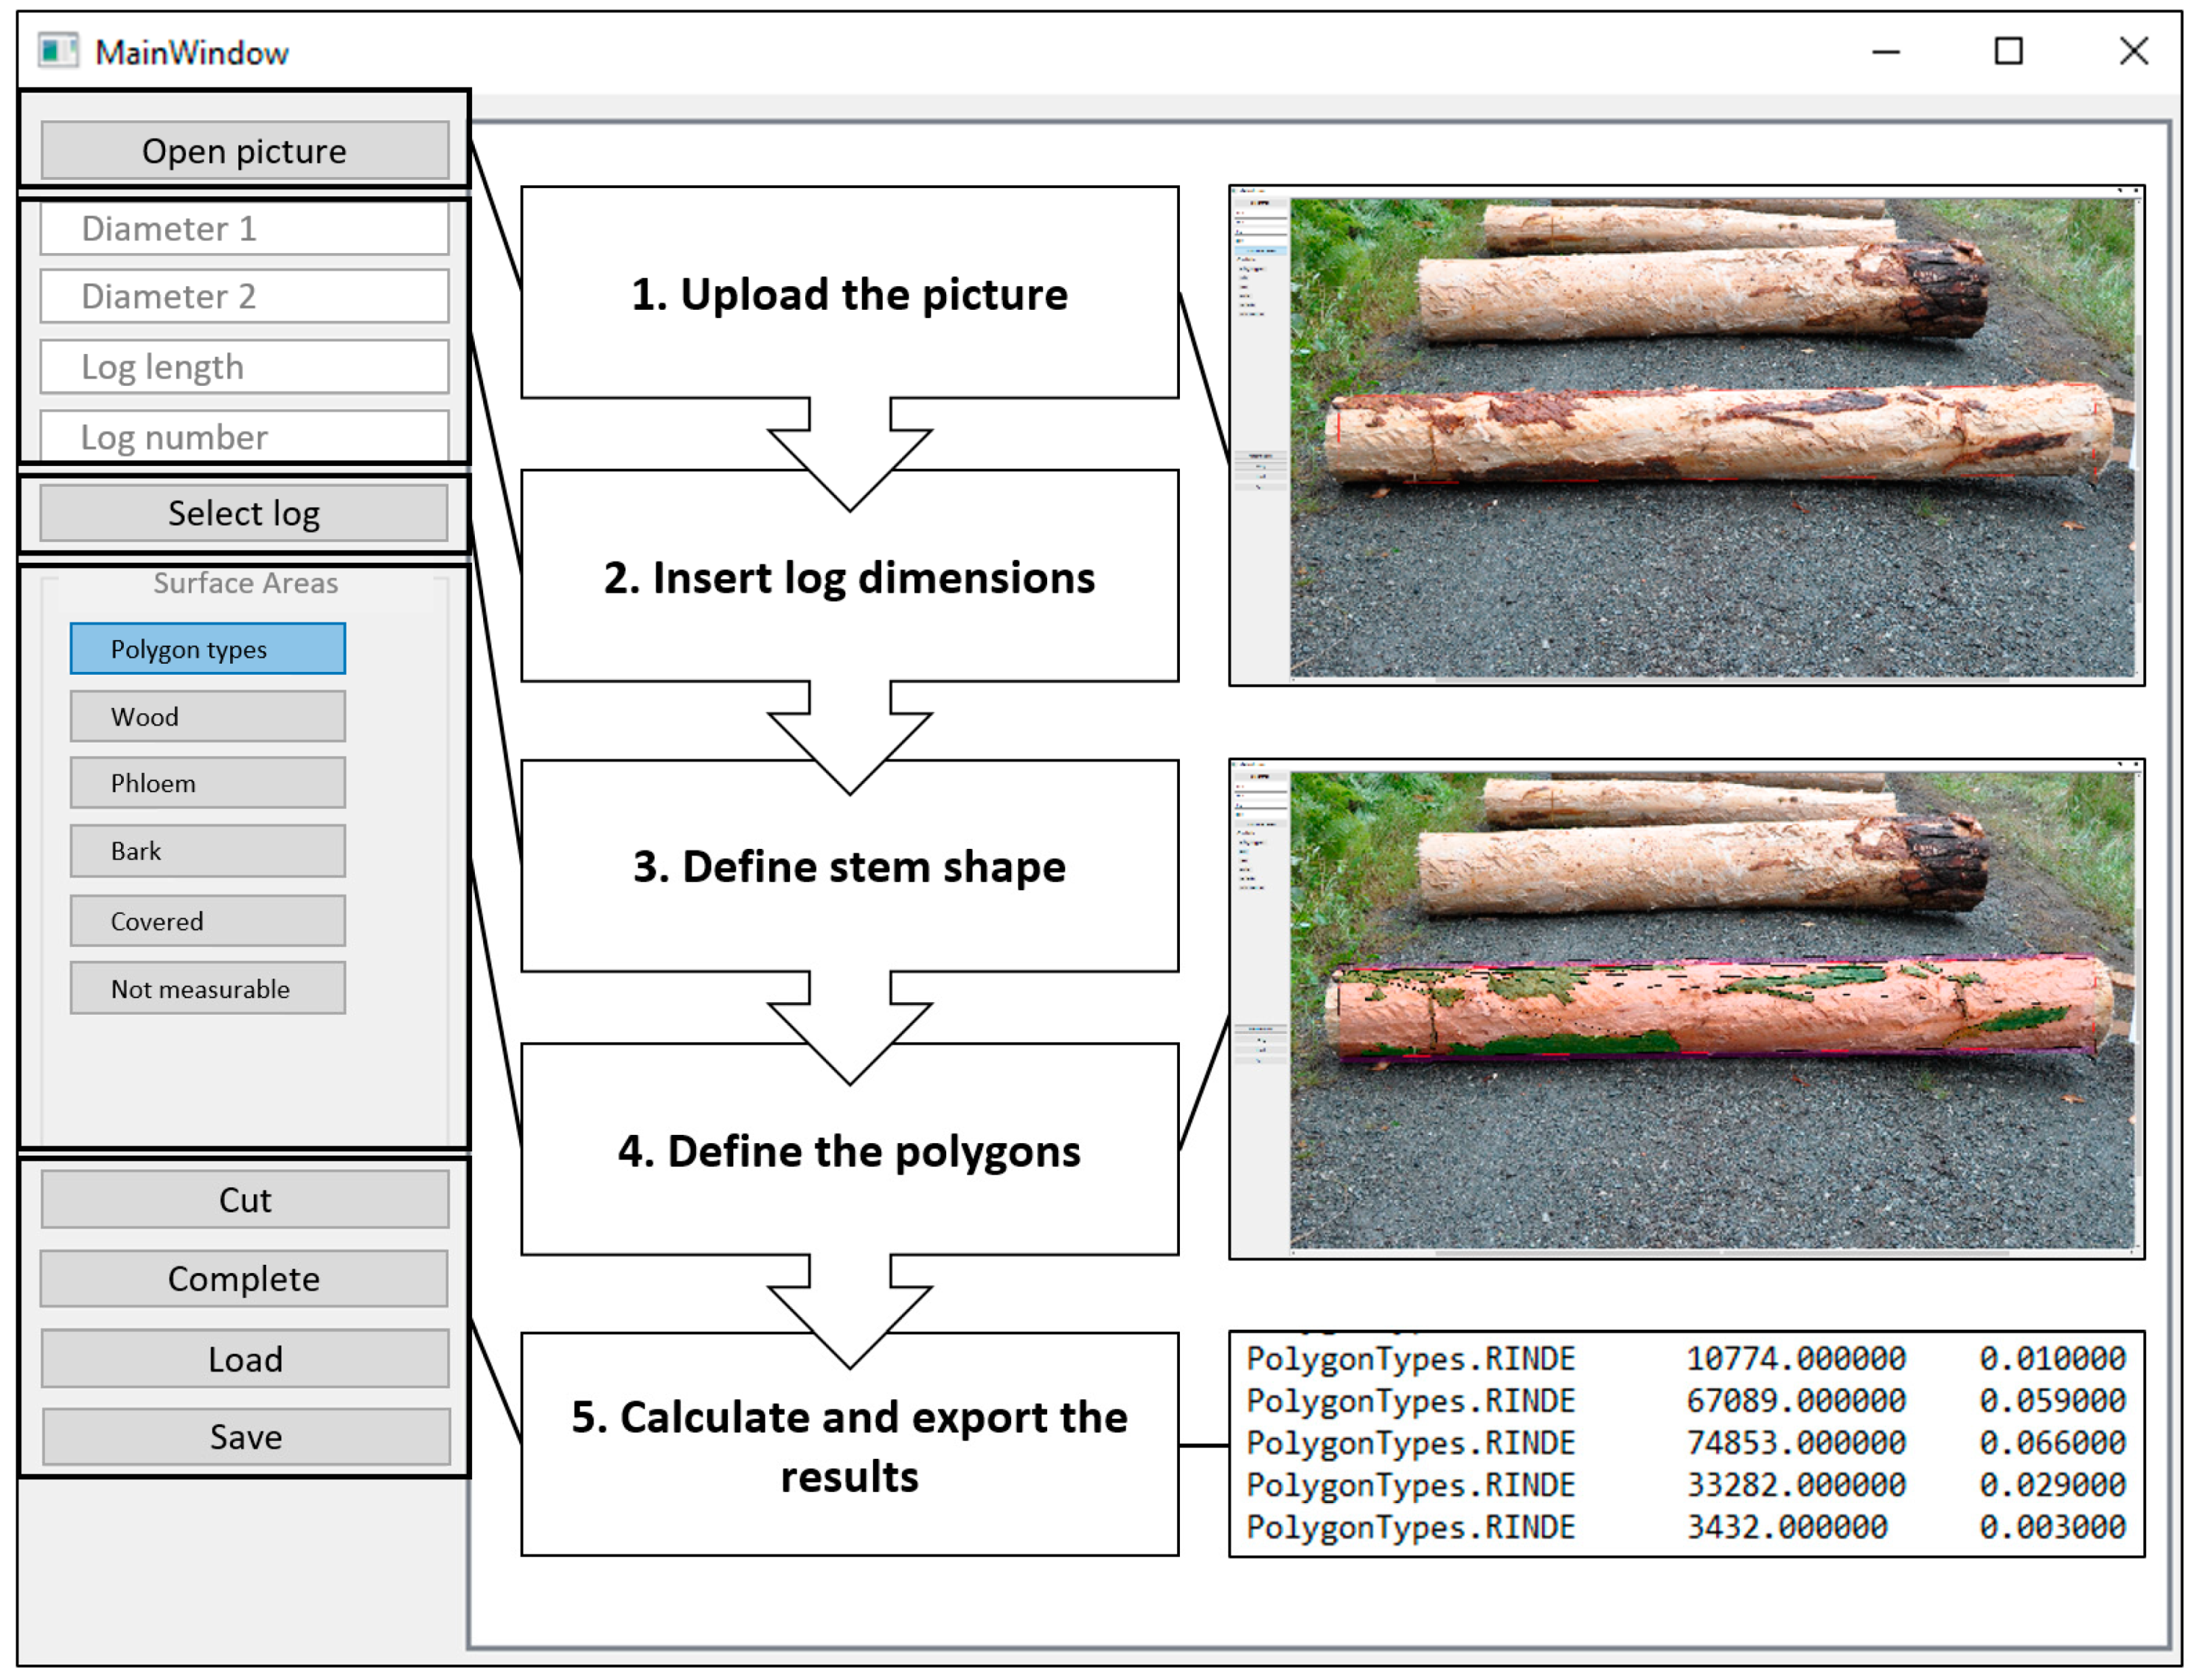
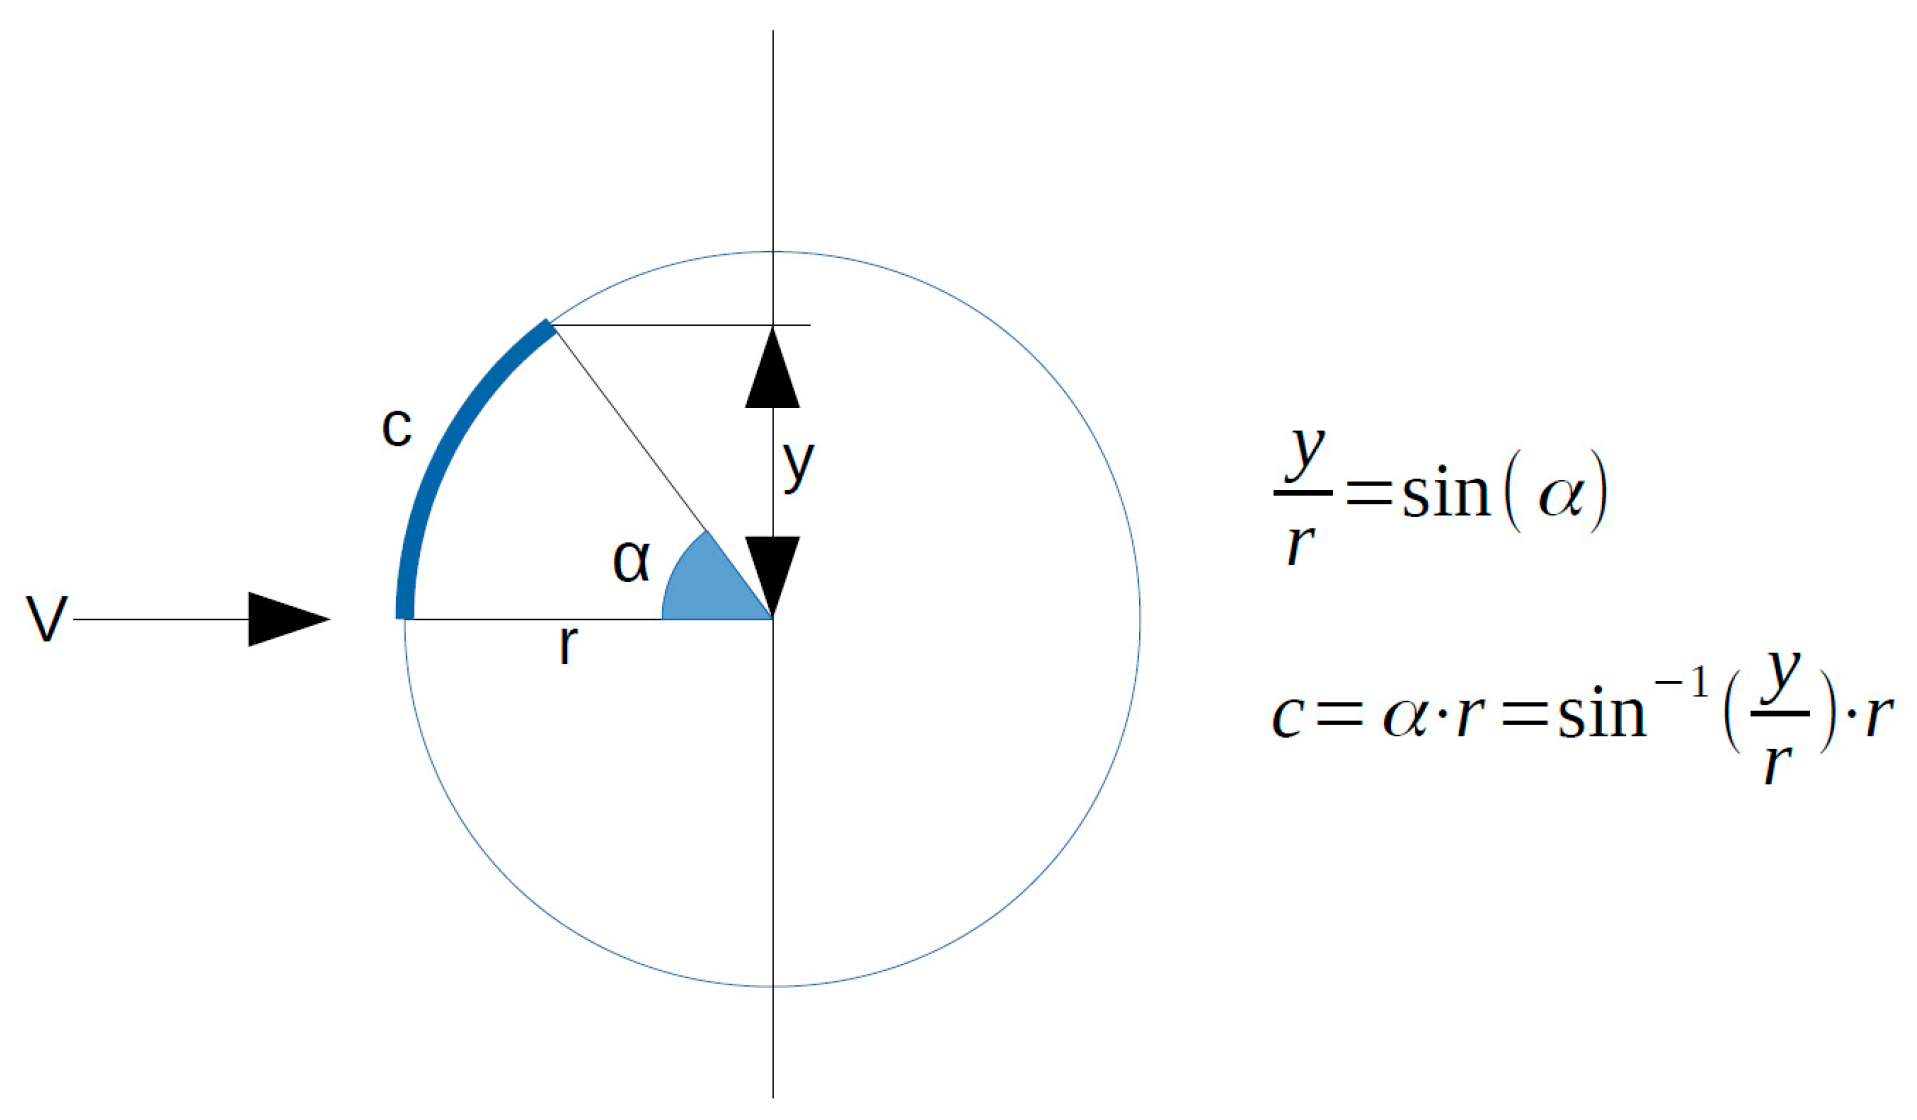
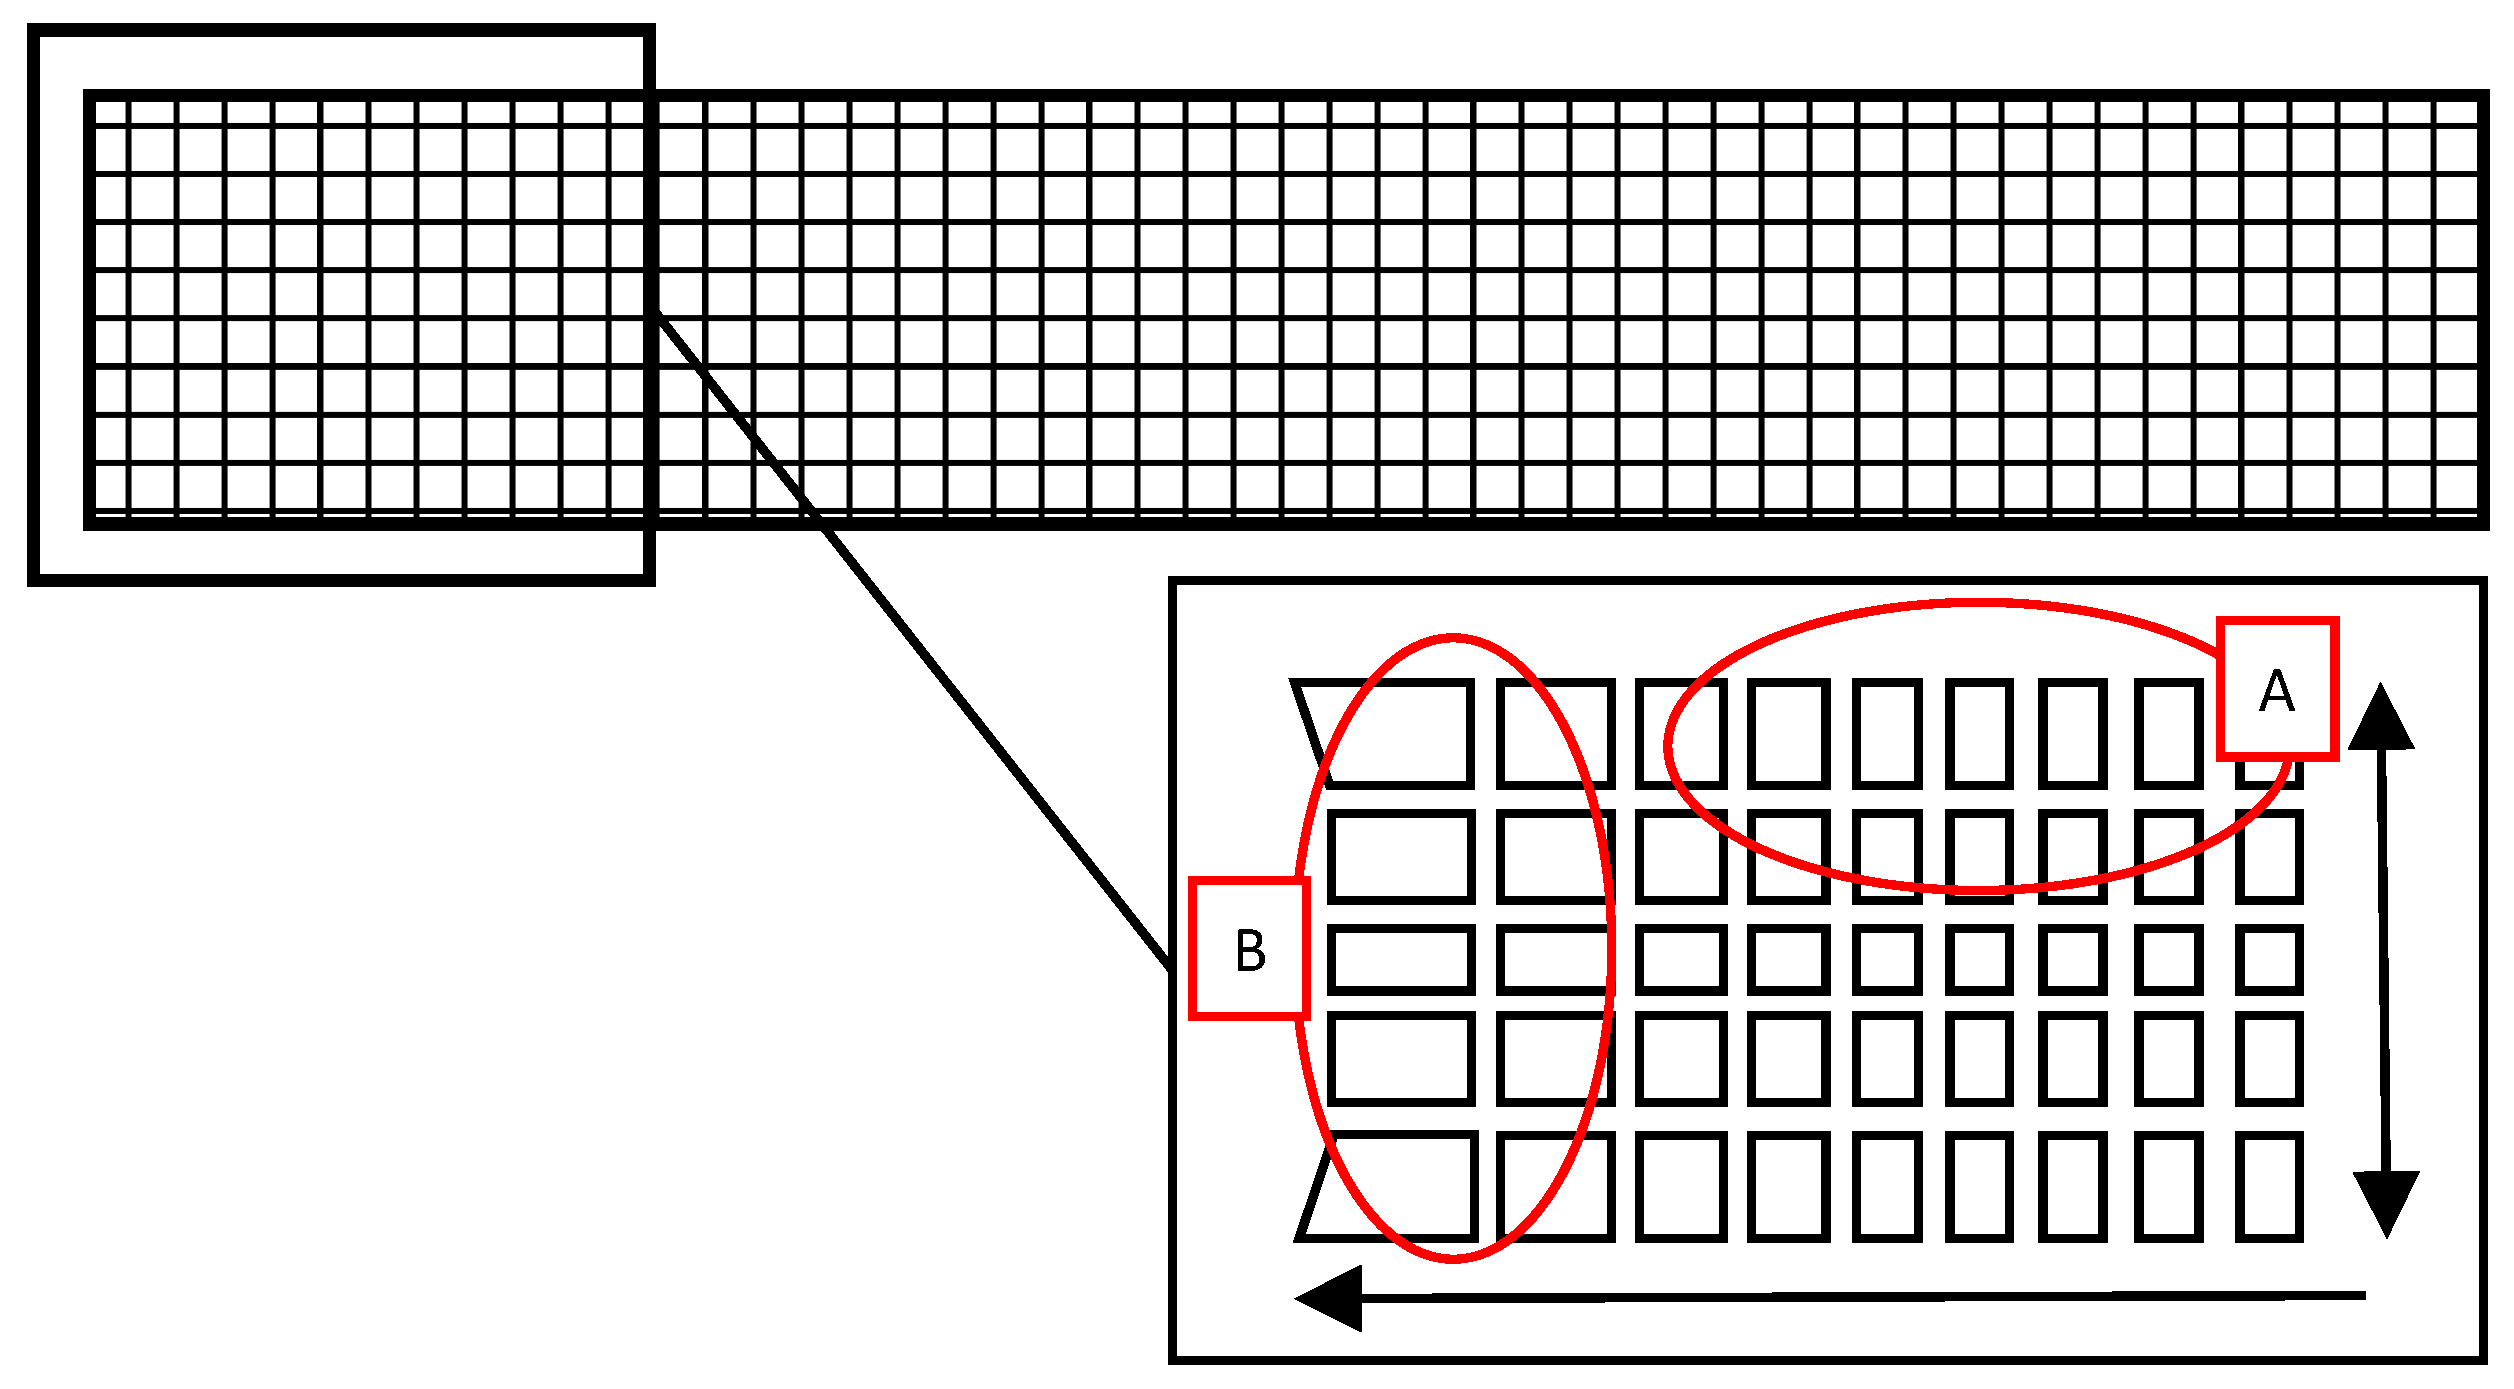
2.1. Development and Programming of the Measurement System Stemsurf

Measuring the remaining bark on the stems is tedious in the field. Thus, the photogrammetric software solution "Stemsurf" was developed by the company Scientes Mondium UG, to facilitate an efficient and objective measurement of residual bark (phellem) and phloem. Stemsurf allows to mark and measure the remaining bark in an image. For this, images were taken of the stems with a standard digital single-lens reflex (DSLR) camera. Additionally, log diameters at the small and large ends as well as the length were measured to provide a reasonable base for the ensuing image transformation. This process is a re-projection of manually drawn polygons on a series of frustums, which represent the log. It is done under the assumption that a log has a circular cross-section and that the camera distance compared to the log diameter is far away, so a nearly parallel projection of the log can be assumed. The process makes use of the human ability of pattern recognition.
The first task of the user is to mark the stem in the image by defining the stem ends and providing the diameter variation in the stem from the empirically determined stem end diameters (Figure 1). It is possible to subdivide the stem further in a set of stem axis-aligned cone frustums to describe the stem form in a more detailed way. With this procedure, the position and form of the log are located in the image. Afterwards, the user draws polygons manually around all remaining bark and phloem patches in the original image. Areas, which are occluded or otherwise not clearly visible in the image can be highlighted and then excluded in the following process. Through this method, the entire stem image is divided into different categories. The areas of the visible part of the total log and the areas of the bark or phloem patches are then calculated by the Stemsurf software. Possible overlaps of the polygons are removed automatically. In addition, a small area consisting of two adjacent pixels located around the perimeter of the stem is automatically marked as “not measurable” to prevent high projection errors due to the tangential view.
All polygon vertices were projected to a flat plane applying an approximate cone unwrapping algorithm that maps the log surface to a flat plane (Figure 2). This unwrapping procedure makes use of the user-defined stem shape. First, the stem section (cone frustrum) in which the vertex of interest is located is determined. Second, the stem radius (r) in pixels is calculated based on the rule of proportions. Third, the perpendicular pixel distance from the stem axis in the image (y) at this point is calculated using a point-line distance formula [29]. In a fourth step the vertex coordinates are unwrapped from the image space to a flat plane. In this step, the length of the circular arc c has to be determined by the equation c = arcsin ( y r ) r , where r denotes the radius at the y-stem axis cross- section in meters and y denotes the perpendicular distance from the stem axis in the image. The position along the stem axis as x coordinate together with c as the y coordinate results in the new coordinate in a flat plane.
The pixel coordinates are then rescaled to meters based on the stem lengths and diameters measured in the field and marked in the image. The wrapped polygon area is converted to square meters accordingly. The proportions of the individual bark category to the entire visible stem area are then calculated. The proportions determined for the visible stem part are assumed to represent the entire stem accordingly.

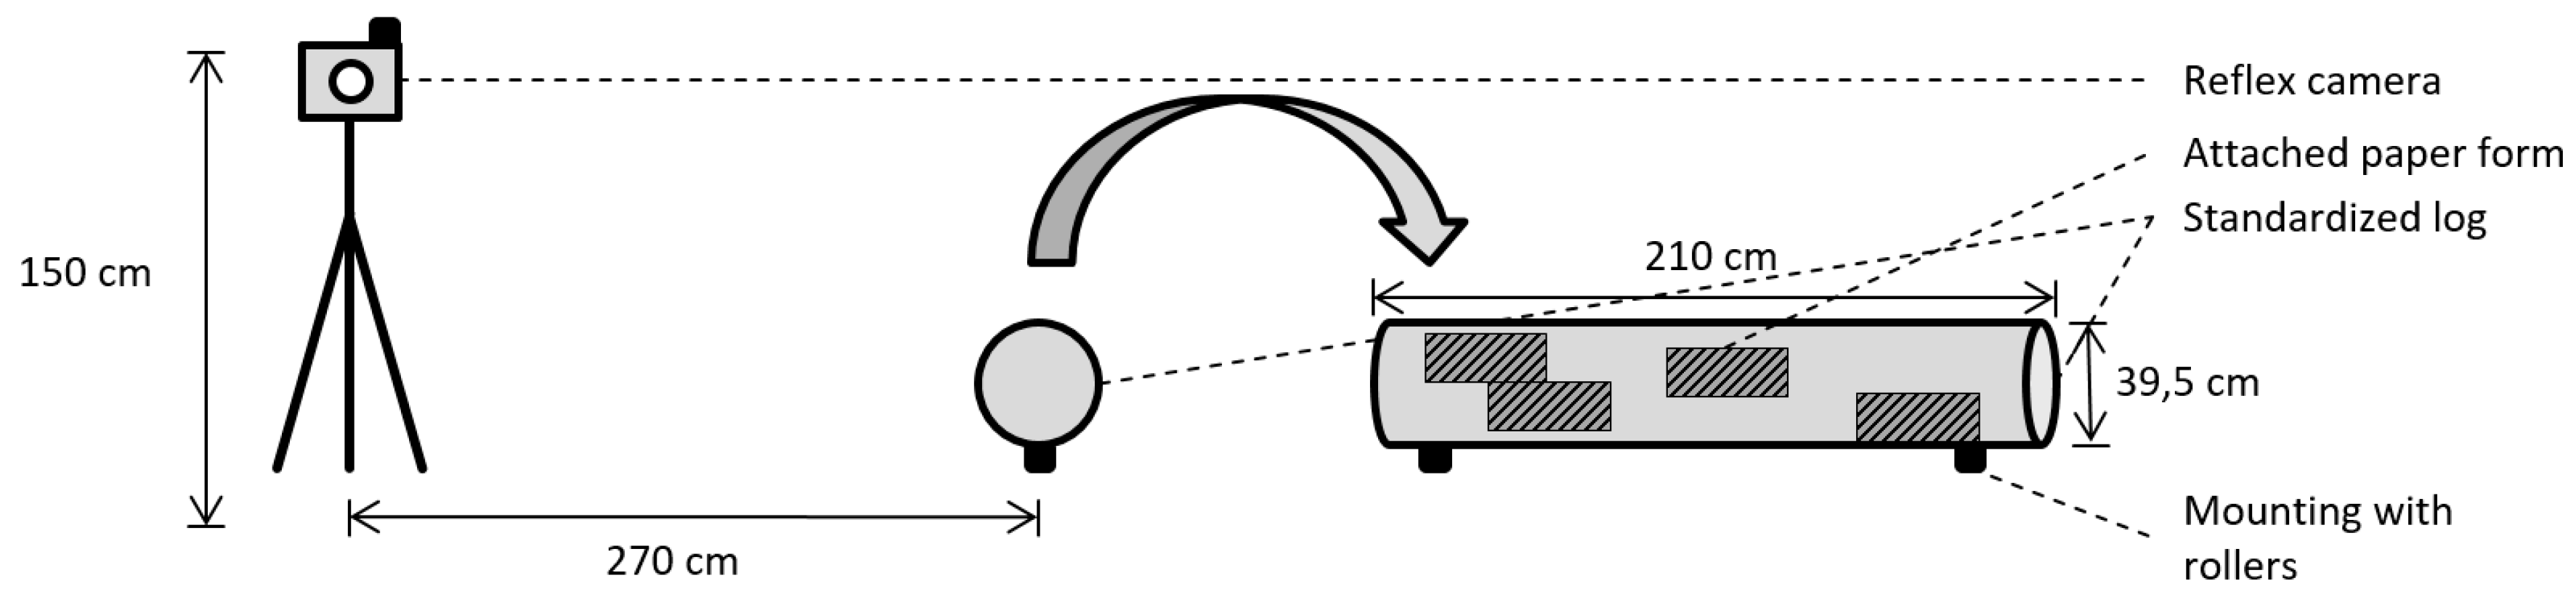
2.2. Precision Validation through Lab Experience

To validate the precision of the measurements taken with the developed software, tests were performed under laboratory conditions. Within those tests, defined paper geometries simulating areas with bark residues were positioned on an artificial log. The test log was a standardized wood-log (debranching simulator for chainsaw-based debranching) without any taper or deviation on the log surface, measuring 210 cm in length with a diameter of 39.5 cm (surface area of 26,060 cm2). The covered (simulated bark) area accounted for exactly 25% (6515 cm2) of the total stem surface (Figure 3). The laboratory experiment was divided into two test series to assess the influence of the geometry of bark remnants on the curvature and rounding effects within the software and the accuracy on the debarking measurements. The first test series employed rectangular paper geometries and the second test series used perfectly round paper geometries. The gathered datasets of rectangular and round geometries were treated separately to monitor differences between both geometry types. In addition, the time required by Stemsurf to delineate the polygons with the two types of geometry was recorded to determine if the geometry type influenced the processing time.
To identify the exact positions to place the paper forms, a grid (7 × 12) was applied to the log, thus subdividing it into defined segments of equal area. The position of the paper forms on the stem was then chosen with a randomizing algorithm and the paper forms were attached with pins at the correct locations on the log surface. To record the photo shots, a DSLR camera (lens: 18–105 mm focal length; f/3.5–5.6 maximum aperture; 76°–15°20’ angle of view; 0.45 m minimum focus distance) was installed 270 cm away from the log and mounted on a tripod at a height of 1.5 m above the ground. The horizontal distance between the camera and the log was chosen to ensure the ends of the log were not too close to the image border when considering the distortion, but close enough to have a high resolution of the log on the image. For improved imaging, the auto focus function was activated, and the highest possible resolution was used (4288 × 2848; 12.2 Mpixel).
The log was turned 30° clockwise after every image to gain 12 repetitions per setup. To define the 30° angle, the end-surface of the standardized log was marked similar to a watch dial defining the positions 1 to 12. To ease the turning process and to fix the log on the exact same position (depending on the angle chosen), the standardized log was mounted on four rollers (Figure 3). For each test series, 12 consecutive images were captured, while rotating the log 30° after each image. After completing a full 360° rotation, the paper forms were detached and rearranged according to the new positioning provided by the randomizer. This test design resulted in 240 images taken with the rectangular geometry and 240 images with round geometry, thus totaling 480 single images.
The 480 images were imported and evaluated within the Stemsurf software and compared to the defined 75% wood and 25% bark areas. Within Stemsurf, the debarking percentage was calculated by evaluating the single image and estimating the backside of the log proportionally. The calculations and determinations of standard deviations were performed using SPSS version 24. Multiple average debarking percentages were calculated based on varying sample sizes (n = 240; 96; 48; 24; 12). The average with the lowest samples was calculated from 12 single images, corresponding to a full rotation of a log in a single test run.

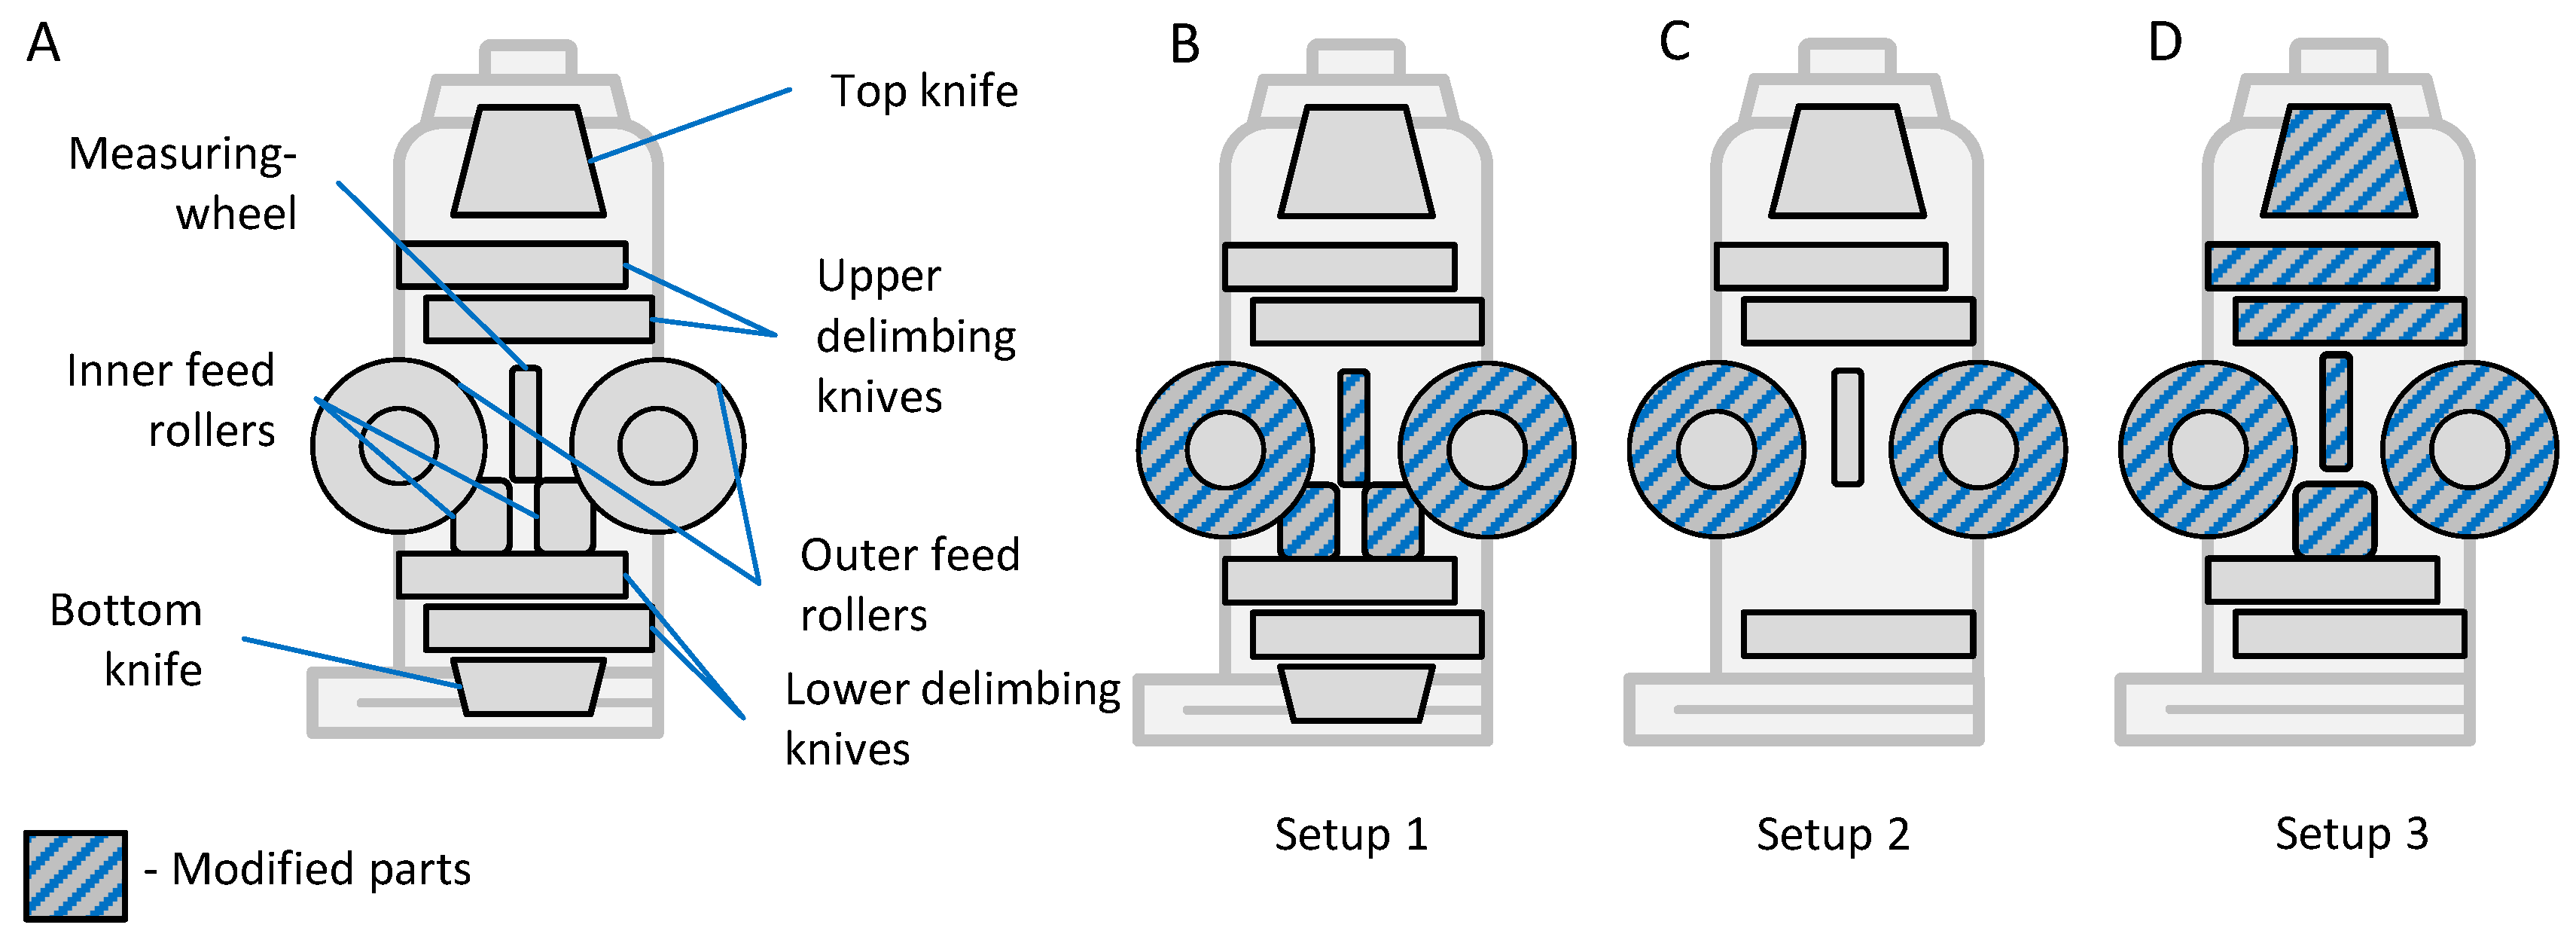
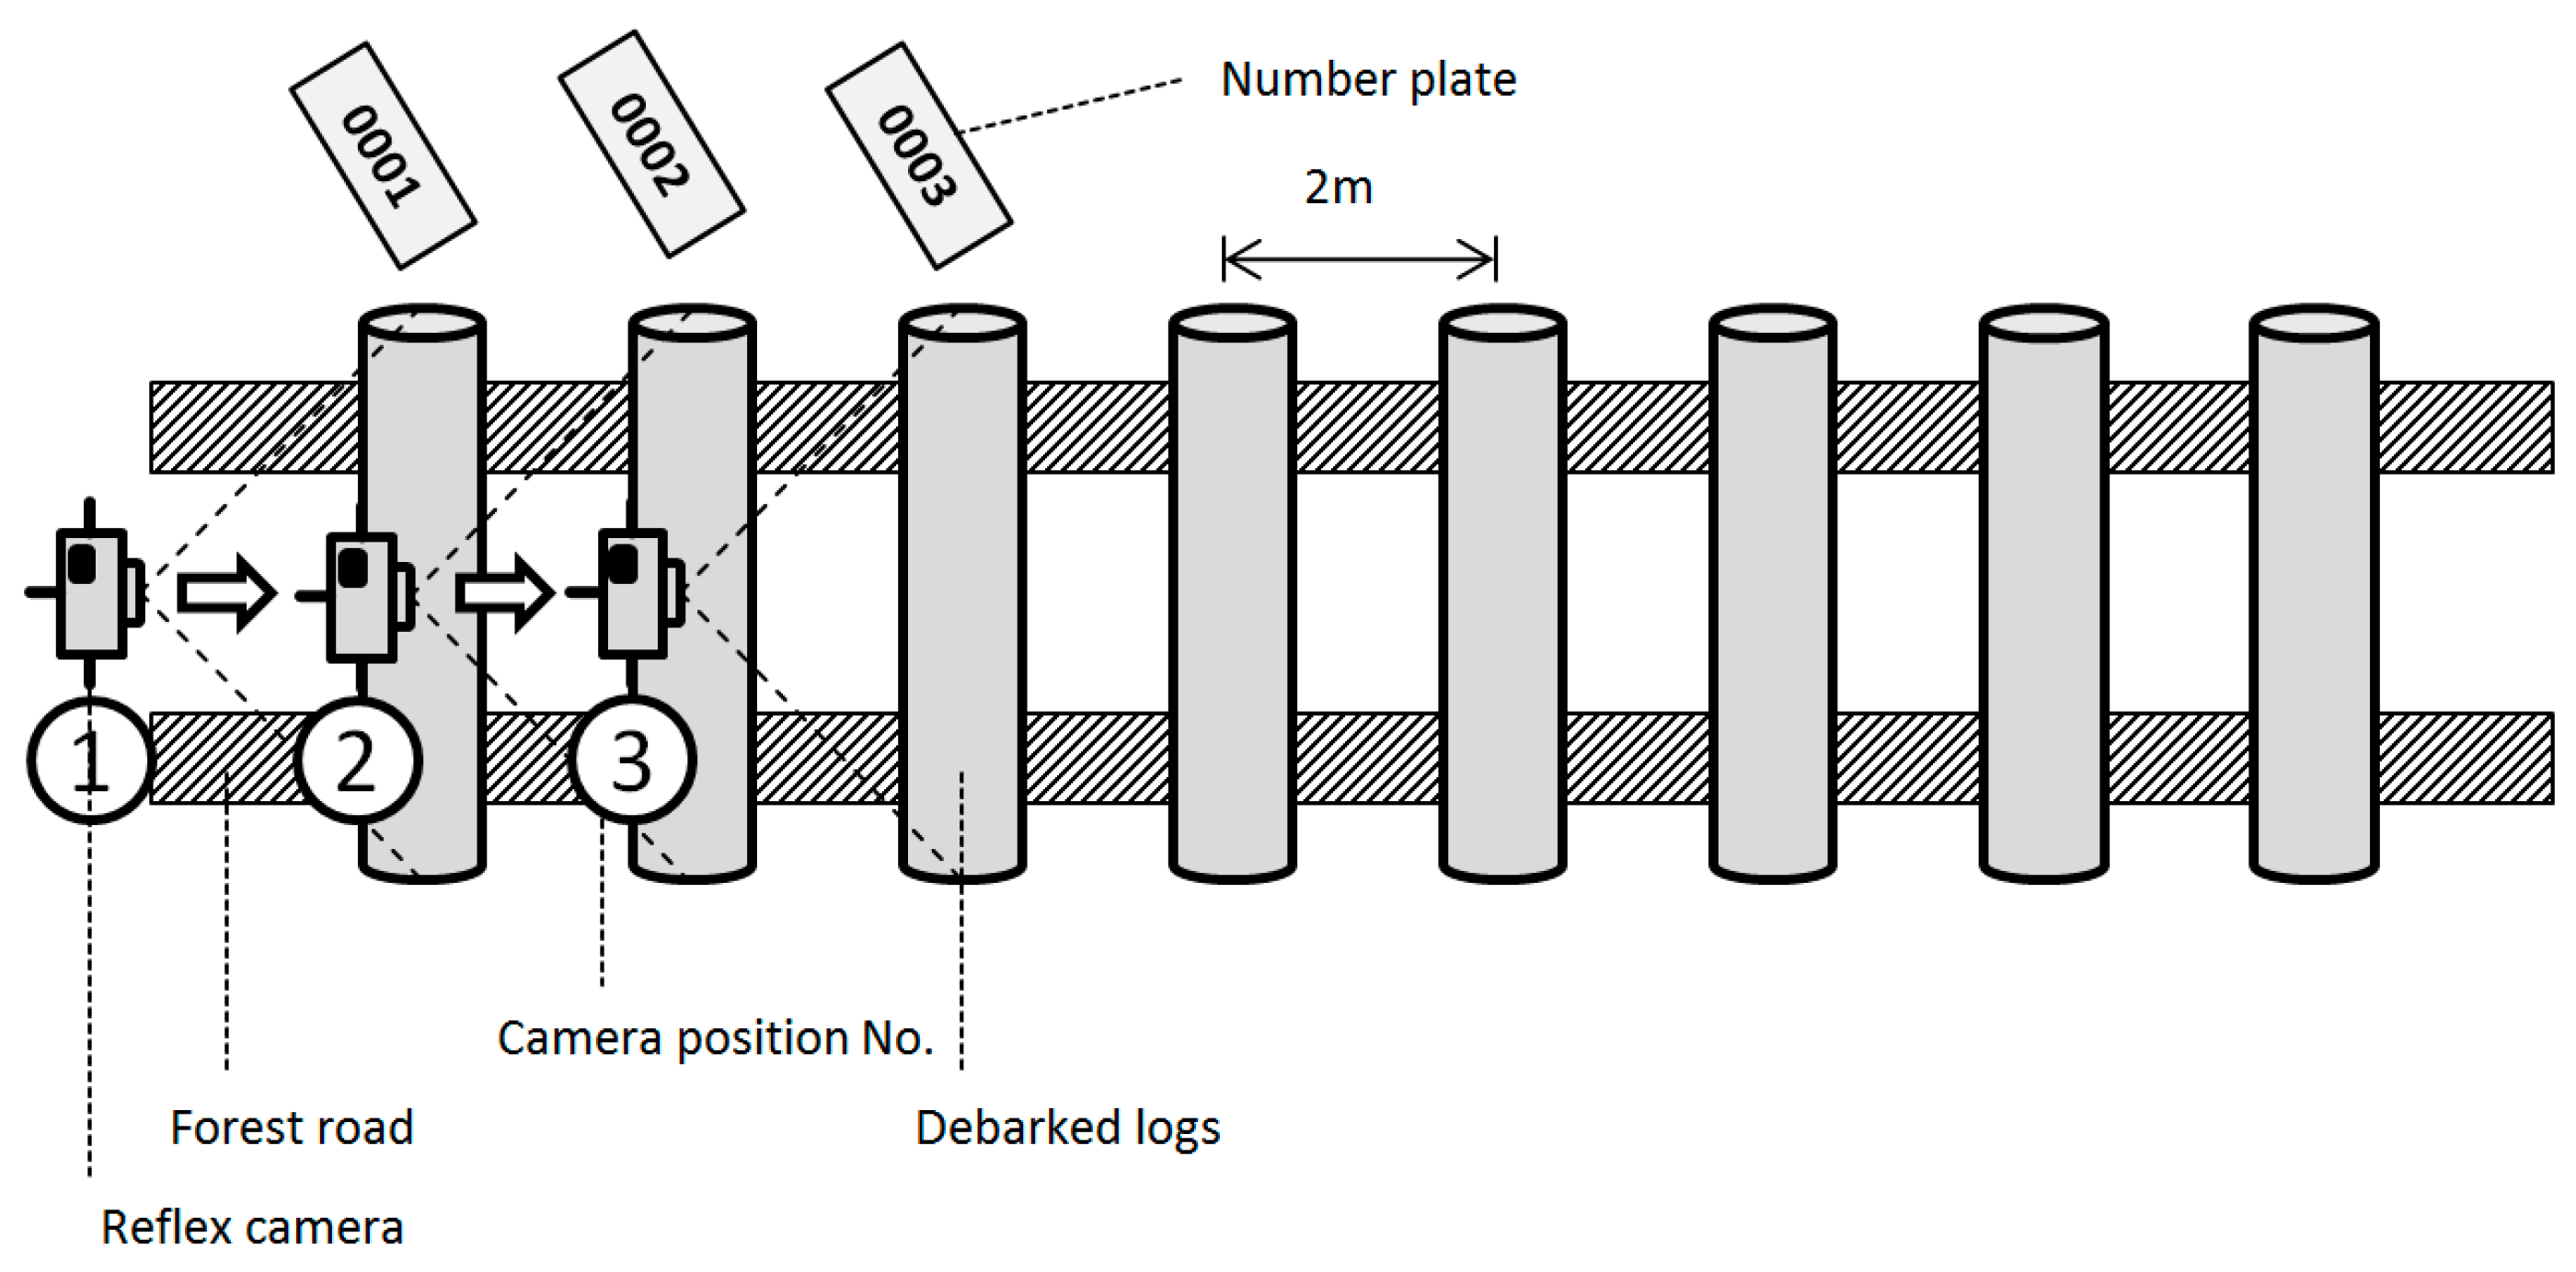
2.3. Field Application

The study was imbedded within a research project that assessed the debarking efficiency of modified harvesting heads under Central European conditions. Therefore, the following three different machine setups listed in Table 1 were modified and tested:
Since the goal of this article is not to assess the performance of each setup but rather to verify how the software performed with logs of varying dimensions, only a concise description of the individual setups will be provided. For succinctness, the combination of harvester and harvesting head will be referred to as Setup 1 (S1), Setup 2 (S2), and Setup 3 (S3).
The focus of the research project was directed at modifying conventional harvesting heads on harvesters currently used by German forest entrepreneurs. The three harvesting heads (Table 1) tested were technically modified in order to achieve a debarking effect within the harvesting process. Modifications were performed with the support of the machine manufacturers and were limited to the use of pre-existing parts. In this regard, attempts were made to minimize the complexity of modifications in order to limit the conversion costs and were therefore mostly focused on the replacement of feed rollers. The replacement of conventional feed rollers (Figure 4) with debarking rollers (Eucalyptus rollers) forces the felled tree to rotate along its longitudinal axis within the harvesting head during the processing phase, thus allowing the delimbing knives to remove bark from the entire stem surface.
In the field application, a total of 1720 Norway spruce (Picea abies [L.] Karst) and Scots pine (Pinus sylvestris L.) logs, with lengths varying between 2.4 m and 5.4 m and mid-diameters ranging from 8.0 cm to 54.7 cm were measured, from stands in northern and southern Germany. To assess the influence of the associated cambial activity on debarking efficiency, 976 logs were harvested and evaluated within the vegetation season (summer) and 744 logs outside of the vegetation season (winter) according to the German Meteorological Service (DWD) (winter: from Dec 1 to Feb 28/29; summer: from June 1 to August 31).
After the trees were harvested and processed with one of the debarking head prototypes, each single log was registered and tagged with a unique number plate that was inserted into the wood at one extremity of the log. The logs were then transported to a nearby forest road or yard with a forwarder where they were then unloaded and placed in a parallel fashion perpendicular to the forest road (Figure 5). To avoid overlaps of the logs within the image, the spacing between logs was set to approximately two meters. In line with the laboratory tests, a single image was taken for each log with the same reflex camera described earlier, which was again mounted on a tripod at a height of 1.5 m. The auto focus function and the highest possible resolution were again used. To prevent shadows or blurring effects, a remote control was used to trigger the image acquisition. The images were taken only from one side (broadside) of the log, not capturing the side ends of the log. The assigned log number was recorded together with the picture number. This information was compiled and assigned in a code for every log within the database, including image number, log number, tree number, tree species, season, and harvesting head prototype. As a last working step, the small and large end diameters (0.5 cm accuracy) and the length (cm accuracy) of each log were measured manually with a caliper and measuring tape, respectively.

2.4. Time Effort

To determine how the shape of bark remnants influenced the time required to evaluate a single log with the Stemsurf software, the average time effort was recorded for both test series. The average processing time for test logs with simple rectangular geometry was 75 seconds and thereby 143 seconds faster than for logs with a more complex round geometry (218 seconds). However, the manual evaluation of the logs in the Stemsurf software was the most time-consuming element, compared to the preparation and recording of the logs. In total, 76% of the time was allocated to evaluating the logs within the software.

3. Results

3.1. Performance in Laboratory Settings

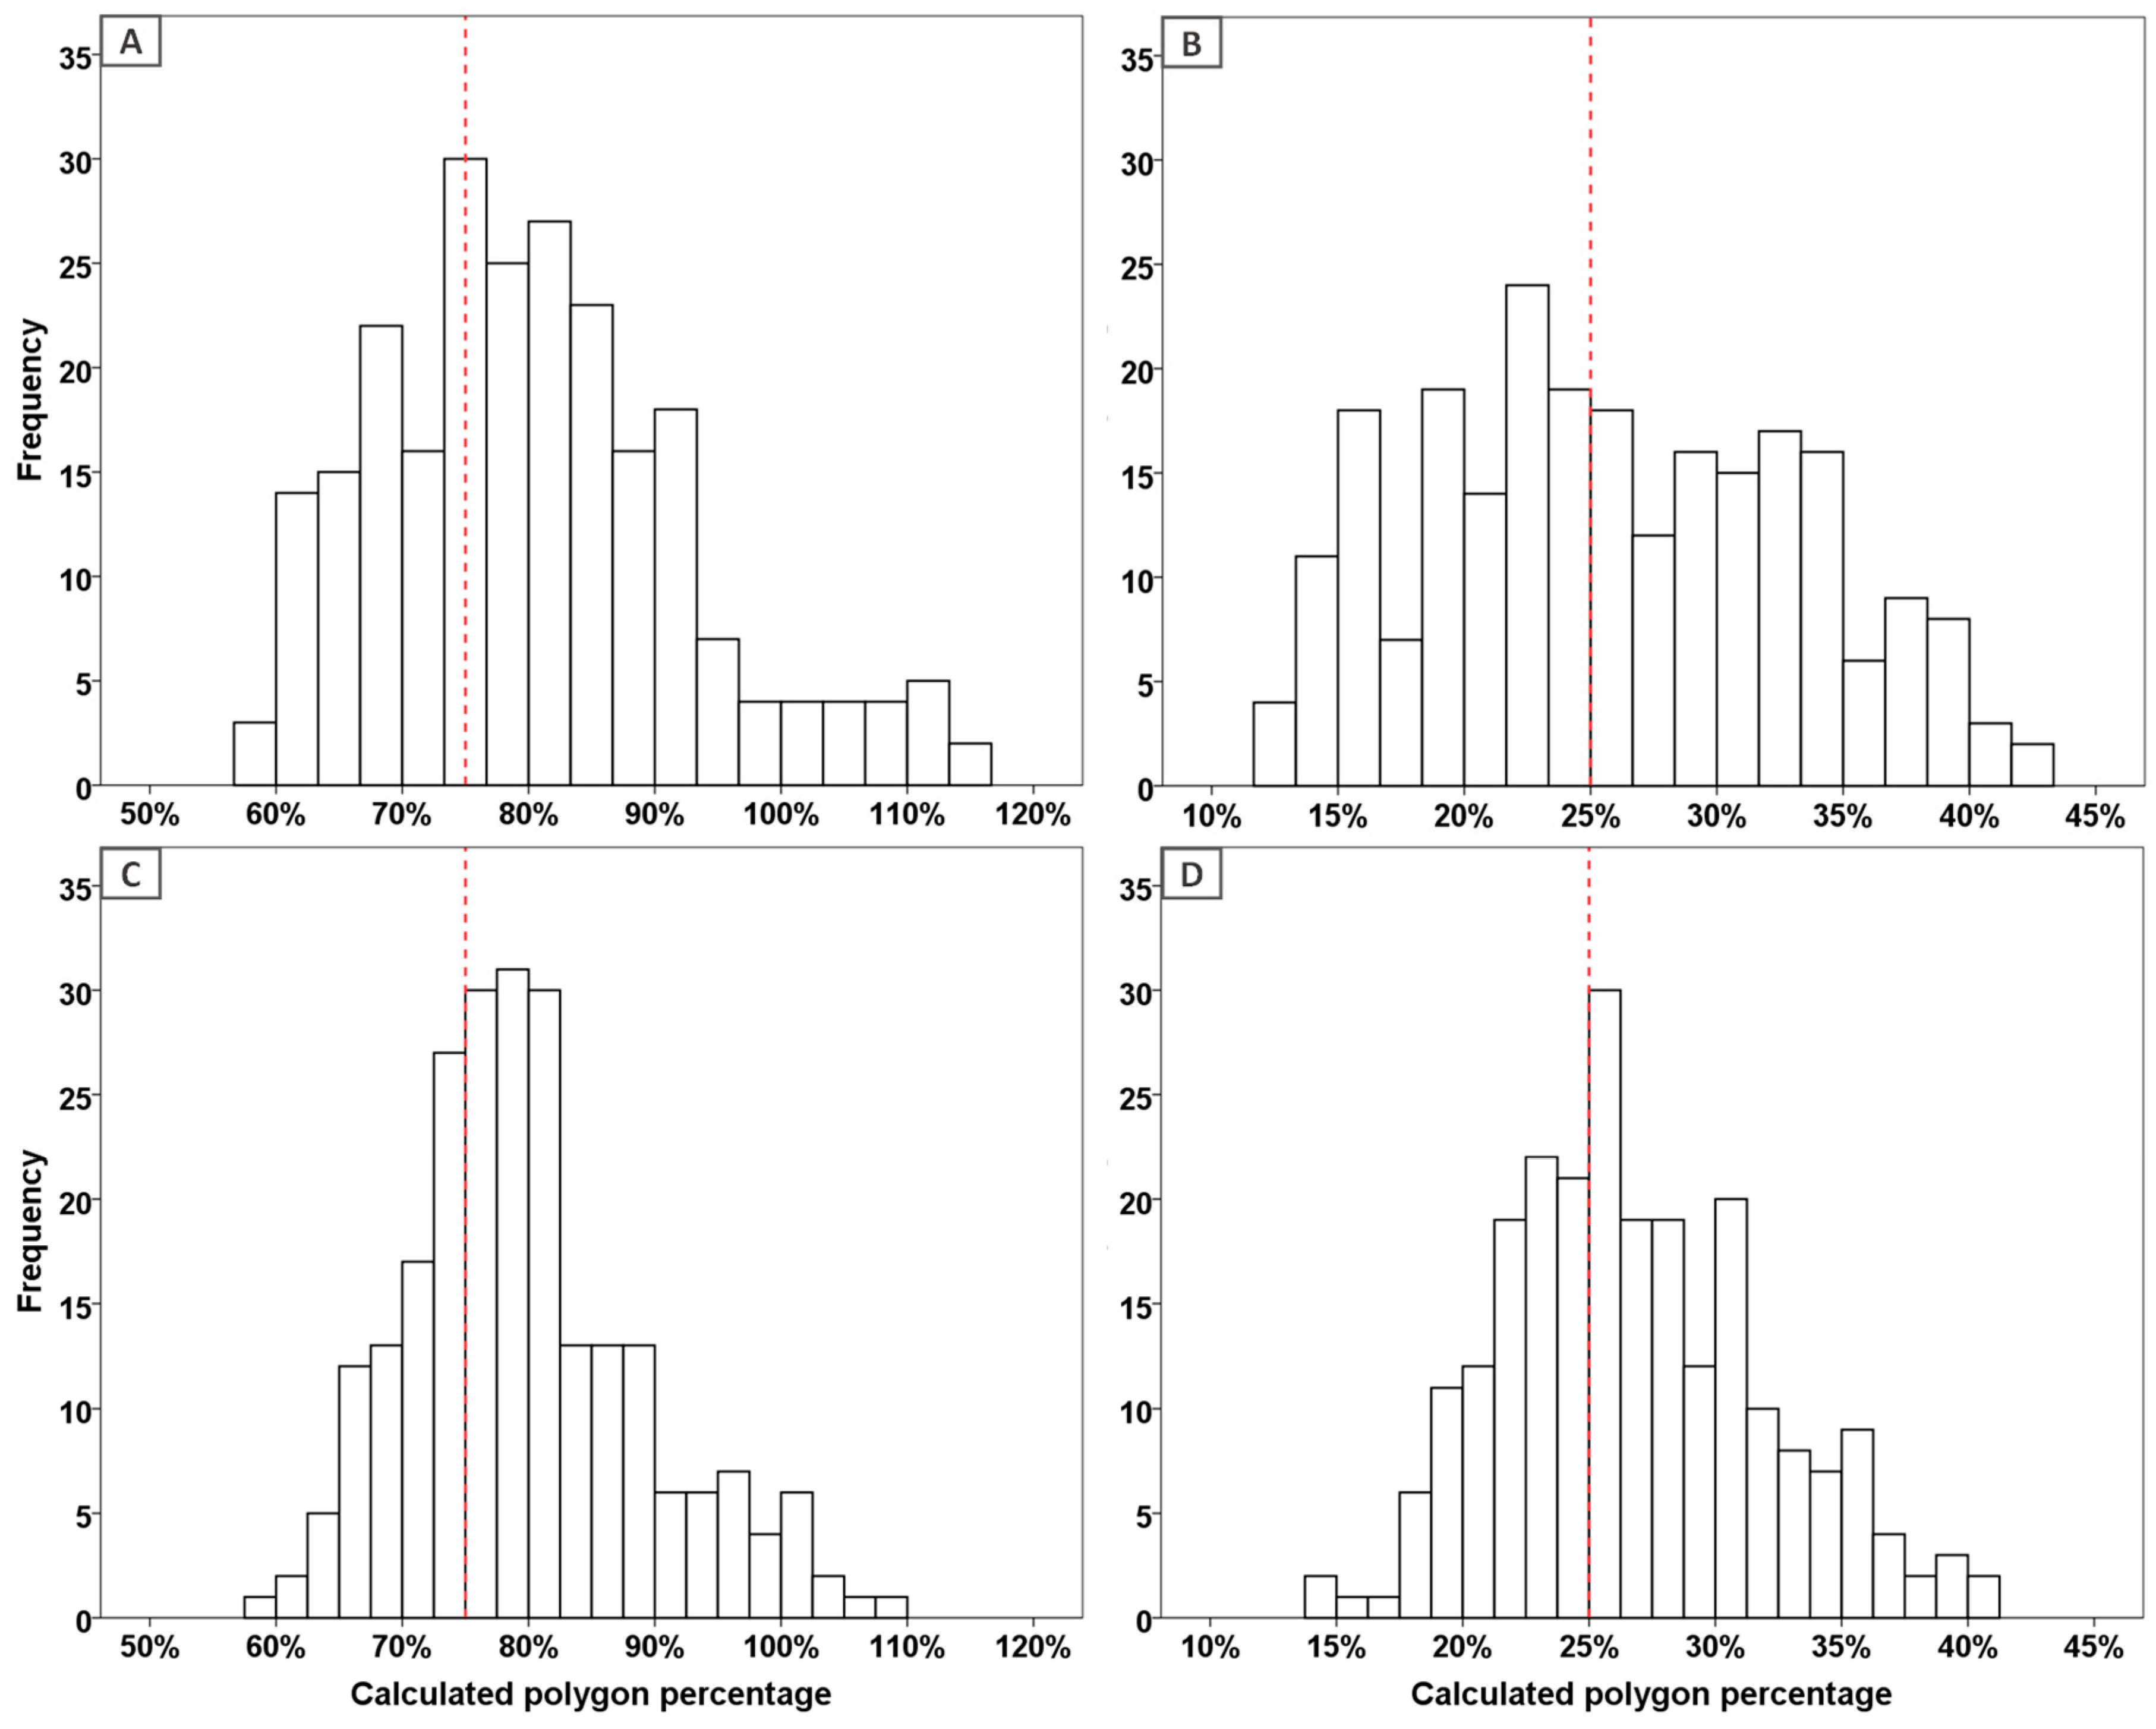
3.1.1. Laboratory Precision Validation—Single Values

The 480 laboratory recordings of the simulated debarked logs revealed a broad range with the single calculated debarking percentages differing widely from the fixed 75% wood and 25% bark shares (Figure 6; Table 2). Debarking percentages did not follow a normal distribution as tested with the Kolmogorov-Smirnov and Shapiro Wilk tests. In the test series performed with rectangular geometry, a higher frequency of over- and under-calculated debarking percentages were detected compared to test series with round geometry (Figure 6). In some instances, the calculated wood surface even exceeded the total surface of the standardized log. This occurred with higher frequency for test series of rectangular geometry, causing the highest variation between the smallest and largest calculated wood surface, which was equal to a 66% difference (Figure 6A). Calculating the mean wood and bark surfaces divided into rectangular and round geometries (n = 240), the deviation from the simulated surface exceeded the prescribed 5% for the wood surface with a 5.5% deviation for shapes with a rectangular geometry (Table 2). With a 4.8% deviation for the calculated wood surface, the test series with round geometry remained within the prescribed precision of a maximum of 5% deviation. In comparison, the calculation of the average bark surface was rather precise with deviations of 0.8% and 1.7% from the simulated 25% bark surface, for rectangular and round geometry simulations, respectively (Table 2).

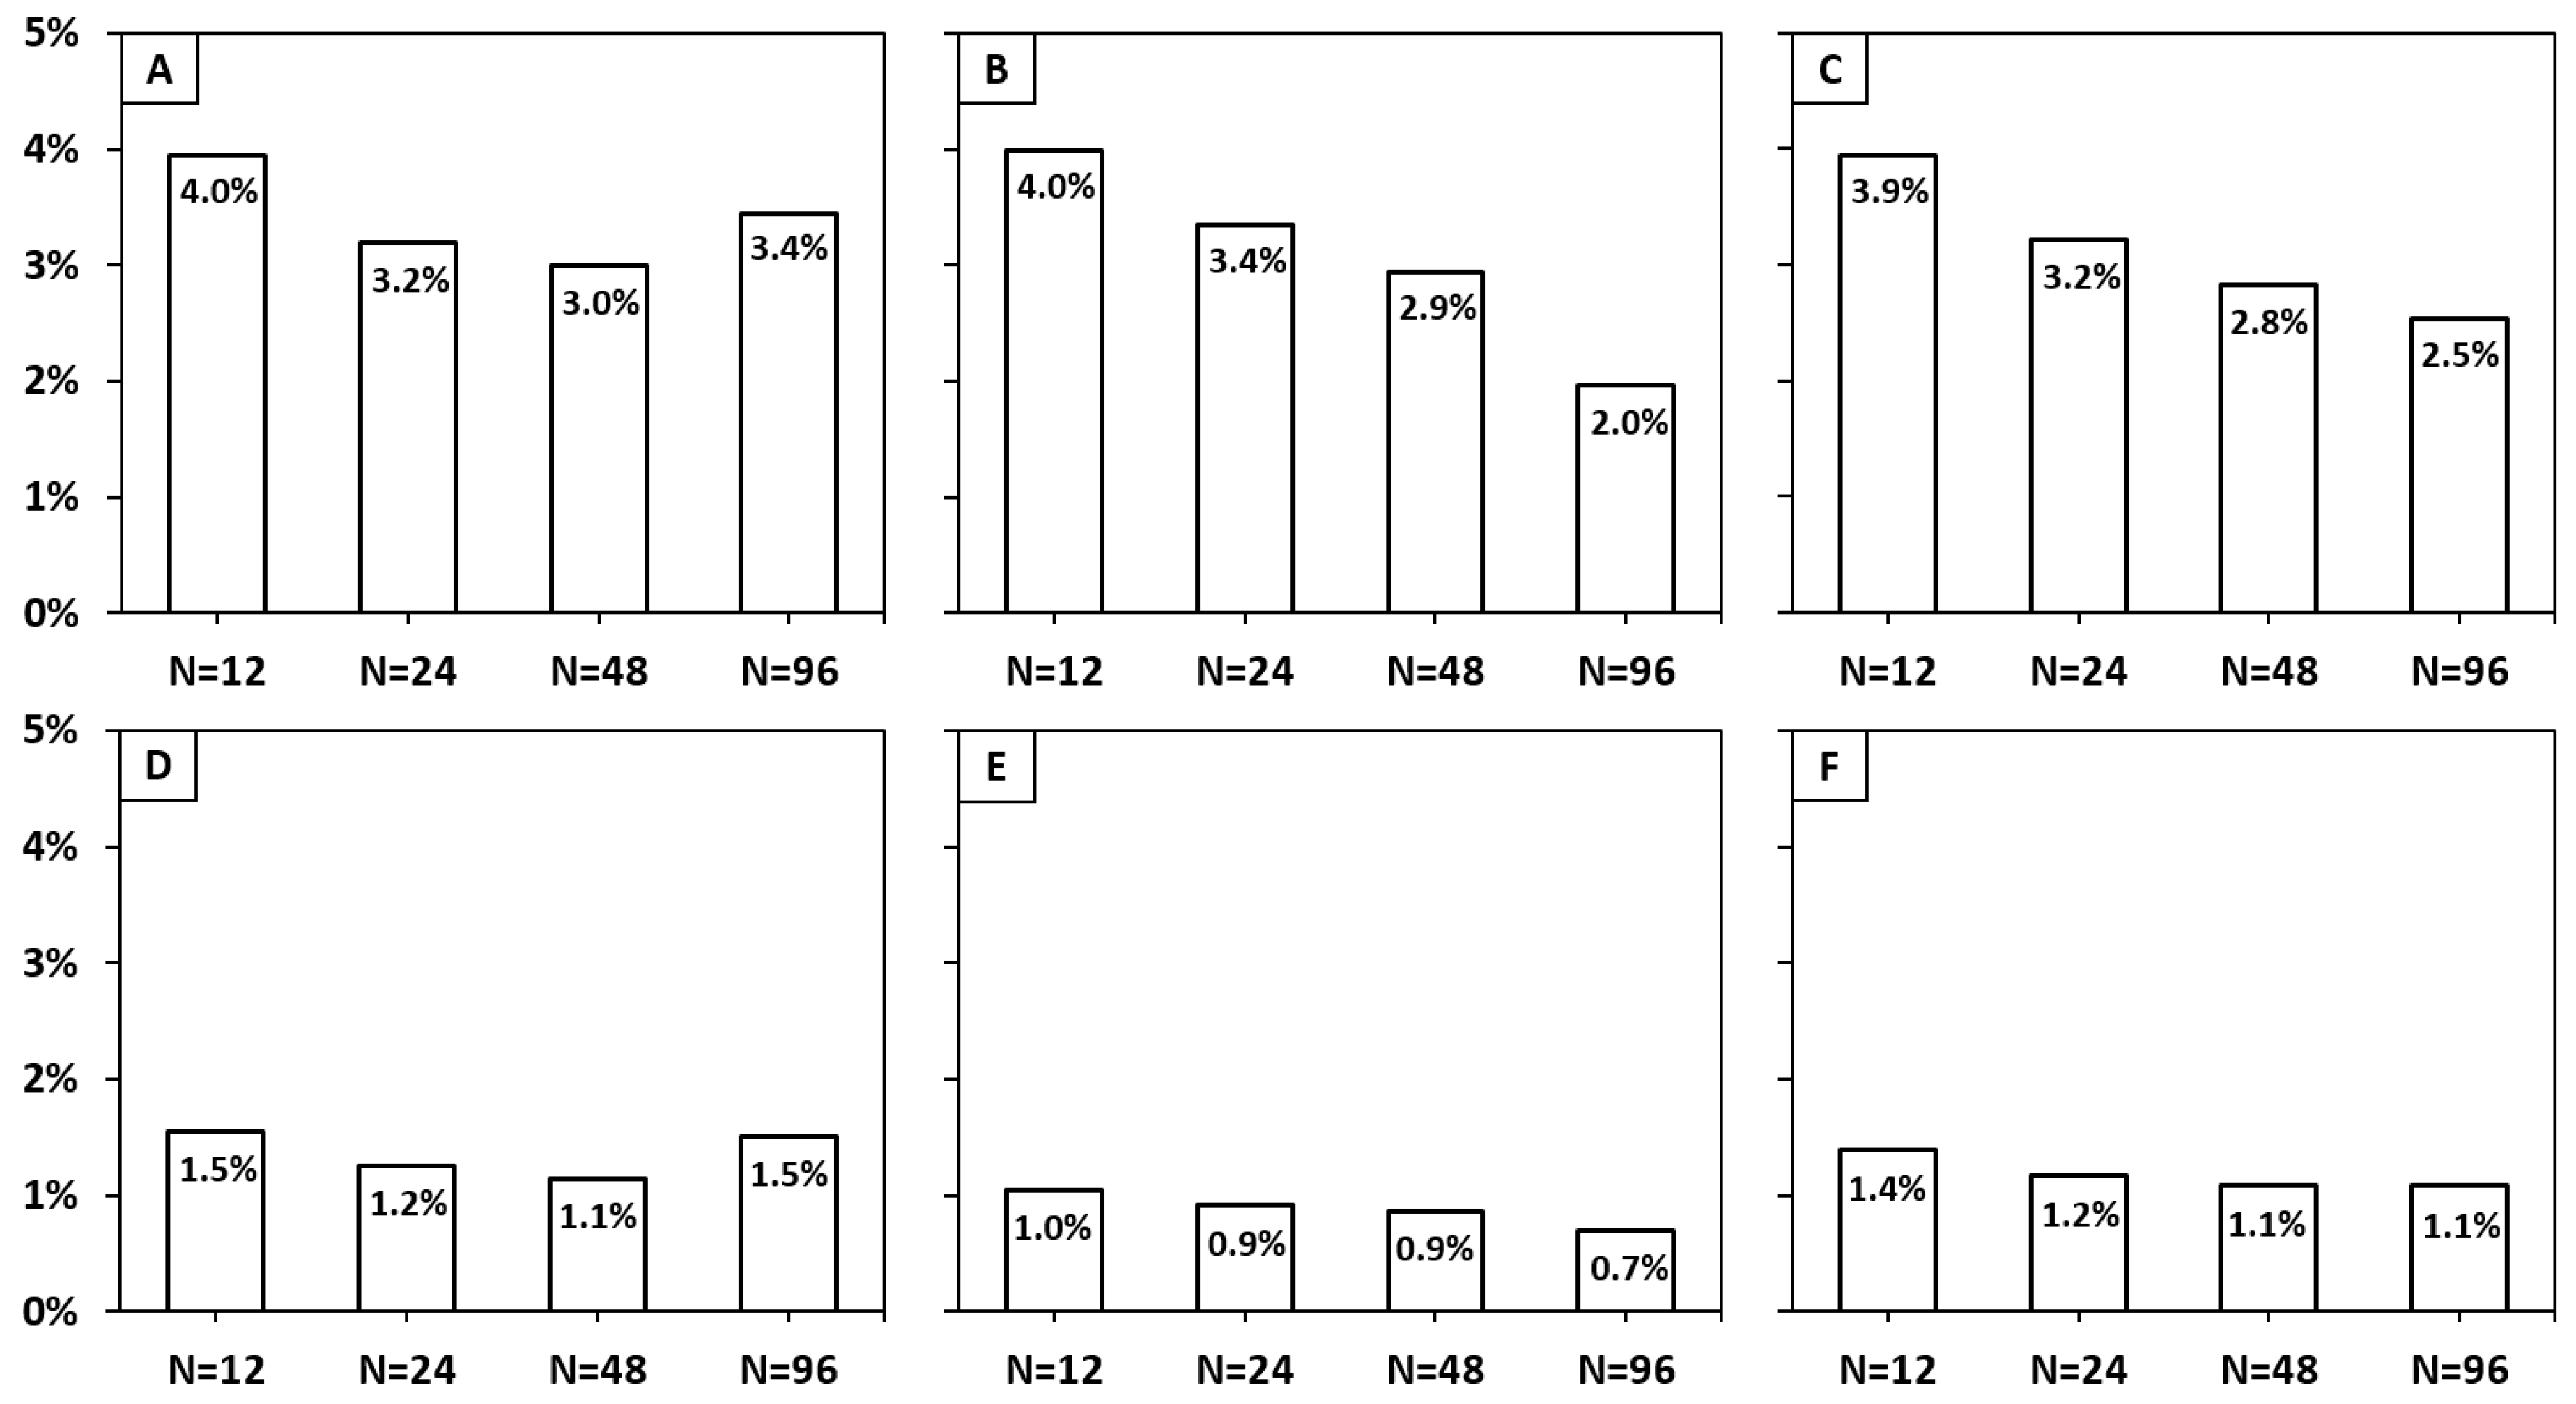
3.1.2. Laboratory Precision Validation—Average Values

In a second analysis, the single polygon measurements were clustered and average wood and bark surface values were calculated to determine the deviation of average values consisting of increasing sample sizes (N = 12, 24, 48, 96) to the actual debarking condition of 75% wood surface and 25% bark remnants. While the single measurements presented a rather wide range of minima and maxima (26.5%–66.8%; Table 2), the calculated averages only varied between 1.2% and 17.4% (Table 3). Furthermore, when combining both rectangular and round geometries, the standard deviation was accordingly lower and varied between 4.0% and 12.0% for calculated wood surfaces and 1.5% and 0.7% for calculated bark surfaces, respectively. As expected, the results showed a clear trend towards lower standard deviations of averages as the reported sample size increased. Surprisingly, the standard deviation calculated for the rectangular geometry test series was again higher for the larger sample size of n = 96 as compared to the round geometry test series. In most cases, the standard deviation of the more complex round geometry test series was lower compared to the simple rectangular shape test series.
However, throughout all average values of different sample sizes measured under laboratory test conditions, the standard deviation remained within the desired 5%, favoring the bark measurements with an even higher precision (Figure 7).

3.1.3. Laboratory Accuracy Validation—Bias

If a measurement system delivers unbiased results, the estimates of parameters E(Θ) equals the true parameter θ. Therefore, the difference is E(Θ) − θ = 0. However, if the results are biased, E(Θ) is either greater or smaller than θ. The parameter is then systematically overestimated if E(Θ) > θ (positive bias) or systematically underestimated if E(Θ) < θ (negative bias).
As presented in Table 4, the bias appeared to be positive for the tested estimates of parameters of n = 240, thus favoring the bark polygon measurements with a lower difference (0.8% for rectangular geometries, 1.7% for round geometries) in comparison to the difference of wood polygon measurements (5.5% for rectangular geometries, 4.6% for round geometries). Therefore, the positive bias resulted in a systematic overestimation of the measured polygon shares. However, it has to be taken into consideration that the measurements of wood polygons were based on an area that is three times larger than the bark polygon measurements. This implies also a three times higher systematic error potential for wood polygon measurements. Therefore, a relative area correction calculation was used to display the bias in a better comparability. The corrected difference between estimates of parameters (CorrE(Θ)) and the true parameter (θ) accounted for 7.3% and 6.1% for wood polygons and 3.2% and 6.8% for bark polygons for square and round geometries, respectively (Table 4). When considering the 3.2% (round bark geometries) as an outlier, the average positive bias equaled 6.7% (5.9% complete dataset). Considering the applied formula for the debarking percentage where D denotes the debarking percentage, Bark% denotes the percentage of bark residues and Phloem% denotes the percentage of phloem residues:
D % = 100 %   ( B a r k % + ( P h l o e m % 0.5 ) )
the overestimation of bark proportions lead to a systematically lower debarking percentage and the results of the summer tests should therefore be considered as rather conservative.

3.2. Performance in Field Settings

Finally, based on the encouraging results of the laboratory validation tests, the method was applied in the field on 1720 logs originating from live debarking harvesting operations. As presented in Figure 7, the highest average debarking percentage (90%) was recorded during the S1 Summer II (n = 291) test, whereas the lowest average debarking percentage (73%) of summer field trials was recorded during the S2 Summer (n = 242) tests. Both further summer tests, S1 Summer I (n = 210) and S3 Summer (n = 233), performed similarly with an average debarking percentage of 84%. Considering the winter trials, the average debarking percentage varied between 35% for S2 Winter (n = 251) and 54% for S1 Winter (n = 348), thus equaling a 56% increase in debarking efficiency in favor of S1 Winter. S3 Winter (n = 144) has to be considered as an intermediate test, as the sap flow was already established and performed on par with the S1 Summer II and S3 Summer tests, with a recorded average debarking percentage of 83%. Both summer and winter calculations were based on the measured bark polygon shares (Equation (1)). According to the laboratory test results of precision and bias, the debarking percentage from summer tests seemed to be systematically underestimated. Based on the debarking percentage calculations (Equation (1)) and the bias evaluation, a corrected debarking percentage was calculated based on the equation:
C o r r D % = 100 %     [ ( B a r k % +   ( P h l o e m % 0.05 ) )     ( B a r k % +   ( P h l o e m % 0.5 ) ) 0.067 ]
where CorrD% denotes the corrected debarking percentage, Bark% indicates the percentage of bark residues and Phloem% indicates the percentage of phloem residues.
The corrected debarking percentages are further presented in Table 5. The influence of the systematic error was considerably higher for the S1 Winter (3.1 percentage points) and S2 Winter (4.4 percentage points) test compared to the summer test series with an average difference of 1.1 percentage points. This difference is likely attributed to a greater influence of the systematic error with increasing shares of the polygon type used for the debarking percentage calculation.

4. Discussion

In this project, a solution was presented that replaced tedious manual field measurements with a photogrammetric software that enabled the user to perform most of the work in the office based on a mathematical model of the stem and manual delineation of the different areas on the stem surface.

4.1. Field and Laboratory Test Performance

The most prominent advantage of the developed measurement system lies within its simplicity. It facilitates fast and reliable measurements of debarking percentages within the forest. The measurement process can be easily fitted into the ongoing forest operations as the logs do not have to be transported to a facility to be tested by conventional measurement systems (sawmills, pulp and paper mills, etc.). Furthermore, the software allows users to record large amounts of data within a rather short time period, which can then be evaluated in a subsequent step. This reduces the time needed in the field and lowers the risk of weather influences on the test run. The use of a high-resolution reflex camera with the option for remote control is highly recommended to eliminate user errors within Stemsurf caused by a lack of contrast and sharpness of the recorded images.

4.2. Precision and Bias

The laboratory measurements presented a high variance of single debarking percentages as shown in Figure 6, mainly as a consequence of the fact that only one perspective of the log was displayed in the image and the backside of the log was estimated proportionally. However, within the debarking procedure of the harvester, the stems were rotated in a spiral direction multiple times while being fed through the harvester head. Through this rotation, the debarking was usually comparable on the entire surface of the log and caused a rather random distribution of bark residues, if the debarking percentage was not 100%. This field observation supports accurate estimations of the backside of the log on many occasions. Furthermore, taking into account that the system relied on averages over many logs rather than single log values, extreme deviations within single value measurements were less relevant. The calculated average debarking percentages proved to be precise with both small and larger sample sizes staying within the anticipated deviation range of 5%.
Nevertheless, the occasional overestimations of summed wood surface proportions exceeded the theoretical 100% (within a margin of about 2%) and indicated areas for further improvement. Those extremes were mainly caused by rounding errors between the defined boundaries of the stem and user shortcomings within the marking of the polygons. Therefore, it is recommended that the measurements in Stemsurf are consecutively performed by the same person, to limit the variation of the user-related errors.
Another source of error was linked to polygons that extended far to the longitudinal edges and outside areas of the log, where the camera vision happened to be on a steep (tangential) angle. In such instances, the influence of different log diameters and lengths on the outside effects caused by the curvature of the log and the perspective of the camera appeared to be a potential distortion factor. Every single image was comprised of a fixed number of pixels and therefore identical pixel size. Considering the 3D reality pictured within the 2D projection of the image, a single pixel located on the stem did not represent the exact same log surface area compared to other pixels (Figure 8). Pixels located closer to the periphery of the defined log represented a larger log surface area than the pixels located in the middle (Figure 8A). This effect was caused by the curvature of the log. The effect further increased for pixels near both side-ends of the log (Figure 8B). With a distance of the camera to the log that equaled almost the length of the logs being studied in combination with the lens used (opening angle approximately 53 degrees) in the tests, a per pixel resolution of 0.0124 degrees was used. A single pixel in the middle of the log was therefore 0.6 mm wide and on the extremity 0.65 mm. This resulted in a surface deviation of 0.65 × 0.60 0.60 2 = 8.3%. This effect can be reduced for future applications by applying a telephoto lens (90 mm), which simulates the doubling of the distance between the camera and the recorded log, thus resulting in a surface deviation at the extremities of 0.64 × 0.62 0.62 2 = 3.2%. The deviation effects on the extremities of the log should decrease even further by locating more information to the center of the image.
To limit the effect of edge distortions on the measured debarking percentage, it is also recommended to calculate the debarking percentage by relying on the smallest measured surface polygon type, since a smaller area has a potentially lower frequency of measurement failures. For measurements of logs with a high debarking percentage, a calculation based on the detected bark residues is recommended (Equation (1)). Conversely, calculations of debarked logs with a low debarking percentage should be based on wood surface polygons. The log diameter and length were equal for all test series performed in the laboratory to ensure a high comparability within the accuracy measurements and thus a potential varying influence on distortion effects was avoided by the test setup itself. The correction calculations of the gathered field data could therefore only consider the systematic error of optical effects. Hence, the corrected debarking percentages presented in Table 5 were closer to the true parameter than prior to corrections but not exact, as some influencing factors on the bias were still unknown. These factors could not have been evaluated using the gathered field data, as the true debarking percentages were not known and therefore a true parameter θ was not present.
Directly comparing debarking percentages measured with Stemsurf to those obtained from x-ray or laser-based technology installed at wood processing facilities was not feasible since our logs were measured in the field soon after forwarding operations had been completed. Loading the logs onto a truck and transporting them over dozens of kilometers to the closest wood processing facility, equipped with laser scanning technology, would have caused variations in debarking percentages, thus rendering the comparison irrelevant. The most relevant study we could find was performed by Baumgartner et al. [30], who manually debarked areas of rectangular geometry on logs of Norway spruce. Afterwards, the logs were scanned with an industrial scanner (Microtec Tomolog®) equipped with two x-ray sensors to determine the difference in accuracy in bark thickness between manual and scanner measurements. Baumgartner et al. [30] determined that with the x-ray scanner on average, less than half a millimeter of difference in thickness was measured from the manual reference value.
Unlike Stemsurf, light detection and ranging (LiDAR) solutions rely on contour-based detection. This causes a limitation to the identification of defects characterized by significant surface changes in height, often the case between areas of bark and wood. Defects such as knobs and depressions can therefore limit an accurate measurement of the debarking percentage [31]. Comparable limitations are not present with Stemsurf, as the detection of residues is based on a visual evaluation.

4.3. Limitations and Areas of Improvements

For benchmark measurements, the precision and associated standard deviation seemed to be sufficient. However, for further investigations and if the debarking percentage needs to be improved to maximum debarking ability for live operations, the precision might need to be enhanced to monitor small changes within the debarking result with a high reliability and accuracy. Another reason to increase the accuracy and resolution will be to further investigate the influencing factors of the debarking percentage. Those research questions were not included in the main scope of the research project but could arise in the future as more operations are being performed with the debarking setups.
The simplicity of the system can also result in certain inherent limitations. By capturing and evaluating a single image per log, a maximum share of 50% of the existing surface can be recorded and measured. The remaining 50% of the surface is assumed to have the same proportions of bark areas as the measured stem part. Therefore, the individual debarking percentages should not be used to answer further questions about physical influencing factors on the debarking percentages of individual logs. Three possible solutions are conceivable to circumvent this disadvantage.
First: a larger database. If sufficient data is available, average debarking percentages of equally influenced logs can be calculated and investigated. However, the more specific an influencing factor becomes, the larger the database would need to be to provide a sufficient sample size of debarking percentages per factor for robust average debarking percentages of that particular factor. The limitation of this solution might be the presence of multiple influencing factors present on a single log. Therefore, logs can only be categorized in sample groups if one outstanding influencing factor is present.
Second: recording an additional image from the blind-side of the log. By collecting two opposing images of a single log, the recorded surface can be substantially increased. Thereby, inaccuracies within the calculation of the debarking percentages can be lowered and single debarking percentages might become comparable to targeted influencing factors. However, a certain area still has to be estimated and potential overlapping of the two images might have a negative influence on the precision of the debarking percentage evaluation.
Third: recording up to 100% of the log surface. Within the research project, an attempt to record a higher share of the actual surface has already been tested. The recording method was changed from a photo-optical based recording system towards a terrestrial LiDAR based system. Hereby, multiple scans can be merged, and a higher share of the log surface can be recorded without moving the log. By placing optical markers on the log, and turning the log, a complete measurement of the log surface can also be achieved. The laser-based recording system would also solve the above-mentioned issues of log curvature and perspective of 2D measurements. The 3D projection of the log enables the possibility of unrolling the stem surface from a cylindrical into a flat projection. In turn, this would provide a future improvement potential of Stemsurf, where the currently applied projection is replaced by a triangulation based on the LiDAR data.
As applying the polygons to the different surface geometries in Stemsurf requires three quarters of the processing time, this could also become a major area of improvement. To shorten the processing time per image, an automated recognition function, based on the shape and color (RGB) information gathered in the study seems feasible. This could help to expand the limitation of processed data per test run in the future and make the measurement system more productive, especially when combined with LiDAR recording. However, according to findings from Weidenhiller and Denzler [26], automated pattern recognition on the base of RBG color data might be impacted by certain limitations. Within the described study, the algorithm based on color never exceeded an accuracy of 60% since a high share of surface areas was labelled as “unknown” due to occurring color similarities within bark and wood patterns. Weidenhiller and Denzler [26] also stated that an algorithm which is based solely on color values of single pixels will always perform unsatisfactorily, due to atypical bark colors or impurities such as dirt present on a log [26].
To clarify the influences of log characteristics (sweeps, taper, forks) on the accuracy of the photo-optical system, it is recommended to perform additional laboratory tests presenting different log diameters and lengths with defined and known reference debarking percentages and compare those to the results obtained in Stemsurf. A checkerboard test presenting defined square areas could further help understanding the distortion effects within Stemsurf. Furthermore, by presenting identical images with known surface polygon shares to a group of test users, the user-related error could also be determined.

5. Conclusions

The focus of this study was to design a computer software “Stemsurf” to quantify the debarking percentage of processed logs and evaluate its performance under laboratory and field conditions. In the laboratory, results revealed that the standard deviation of the single debarking percentages varied greatly, which was mostly caused by only measuring 50% of the log surface through a single image and estimating the remaining surface proportionally. However, when grouping single debarking percentages together through calculation of average debarking percentages, Stemsurf provided precise and robust results. Throughout all tested sample sizes (n = 12 to n = 96) the standard deviation remained within the anticipated 5% range. Distortion, perspective, and user-related errors resulted in a positive bias of 6.7%.
In general, the designed measurement system proved to be a promising tool to evaluate field-based debarking percentages as it was capable of recording and processing large amounts of data within an acceptable period while producing robust and reliable results of debarking percentages. Potential areas of improvement are an automatic detection of the polygons to reduce the image processing time and the image recording system to cover a higher share of the log surface to make the single debarking percentages more accurate and comparable to single influencing factors of the debarking percentage.

Author Contributions

Conceptualization, all authors; methodology, all authors; software, T.S. and S.S.; writing-original draft preparation, J.B.H. and E.R.L.; writing-review and editing, all authors; supervision, E.R.L.; funding acquisition, S.W.

Funding

This research was funded by the German Federal Ministry of Food and Agriculture (FKZ 22013213, 22012214).

Acknowledgments

We would like to thank Grünberger, Rosnau, Mayer, and Vater for their support and assistance within the field data gathering and Peters for the assistance throughout the laboratory tests. For their support on Stemsurf measurements, we would like to thank Rosnau, Mayer, Müller, and Huber. We also acknowledge the Bavarian and Lower Saxonian State forests for providing forest stands and the entrepreneurs Harrer & Mayer and Raker for their contribution. Finally, we thank our project partner the Kuratorium für Waldarbeit und Forsttechnik e.V. for their support and great cooperation.

Conflicts of Interest

The authors declare no conflict of interest.

References

  1. Simard, M.; Pinto, N.; Fisher, J.B.; Baccini, A. Mapping forest canopy height globally with spaceborne lidar. J. Geophys. Res. 2011, 116, G04021. [Google Scholar] [CrossRef]
  2. Lim, K.; Treitz, P.; Wulder, M.; St-Onge, B.; Flood, M. LiDAR remote sensing of forest structure. Prog. Phys. Geogr. 2003, 27, 88–106. [Google Scholar] [CrossRef]
  3. Müller, J.; Brandl, R.; Buchner, J.; Pretzsch, H.; Seifert, S.; Strätz, C.; Veith, M.; Fenton, B. From ground to above canopy—Bat activity in mature forests is driven by vegetation density and height. For. Ecol. Manag. 2013, 306, 179–184. [Google Scholar]
  4. Bayer, D.; Seifert, S.; Pretzsch, H. Structural crown properties of Norway spruce (Picea abies [L.] Karst.) and European beech (Fagus sylvatica [L.]) in mixed versus pure stands revealed by terrestrial laser scanning. Trees 2013, 27, 1035–1047. [Google Scholar] [CrossRef]
  5. Boudreau, J.; Nelson, R.F.; Margolis, H.A.; Beaudoin, A.; Guindon, L.; Kimes, D.S. Regional aboveground forest biomass using airborne and spaceborne LiDAR in Québec. Remote Sens. Environ. 2008, 112, 3876–3890. [Google Scholar] [CrossRef]
  6. Kunneke, A.; van Aardt, J.; Roberts, W.; Seifert, T. Localisation of Biomass Potentials. In Bioenergy from Wood: Sustainable Production in the Tropics; Seifert, T., Ed.; Springer: Dordrecht, the Netherlands, 2014; pp. 11–41. [Google Scholar]
  7. Hilker, T.; van Leeuwen, M.; Coops, N.C.; Wulder, M.A.; Newnham, G.J.; Jupp, D.L.B.; Culvenor, D.S. Comparing canopy metrics derived from terrestrial and airborne laser scanning in a Douglas-fir dominated forest stand. Trees 2010, 24, 819–832. [Google Scholar] [CrossRef]
  8. Moorthy, I.; Miller, J.R.; Hu, B.; Chen, J.; Li, Q. Retrieving crown leaf area index from an individual tree using ground based lidar data. Can. J. For. Res. 2008, 34, 320–332. [Google Scholar]
  9. Strahler, A.H.; Jupp, D.L.B.; Woodcock, C.E.; Schaaf, C.B. Retrieval of forest structural parameters using a ground based lidar instrument. Can. J. For. Res. 2008, 34, 426–440. [Google Scholar] [CrossRef]
  10. Bao, Y.; Ni, W.; Wang, D.; Yue, C.; He, H.; Verbeeck, H. Effects of tree trunks on estimation of clumping index and LAI from HemiView and Terrestrial LiDAR. Forests 2018, 9, 144. [Google Scholar] [CrossRef]
  11. Hopkinson, C.; Chasmer, L.; Young-Pow, C.; Treitz, P. Assessing forest metrics with a ground-based scanning lidar. Can. J. For. Res. 2004, 34, 573–583. [Google Scholar] [CrossRef]
  12. Henning, J.; Radtke, P. Detailed stem measurements of standing trees from ground-based scanning Lidar. For. Sci. 2006, 52, 67–80. [Google Scholar]
  13. Watt, P.J.; Donoghue, D.N.M. Measuring forest structure with terrestrial laser scanning. Int. J. Remote Sens. 2005, 26, 1437–1446. [Google Scholar] [CrossRef]
  14. Maas, H.G.; Bienert, A.; Scheller, S.; Keane, E. Automatic forest inventory parameter determination from terrestrial laser scanner data. Int. J. Remote Sens. 2008, 29, 1579–1593. [Google Scholar] [CrossRef]
  15. Yu, X.; Liang, X.; Hyyppä, J.; Kankare, V.; Vastaranta, M.; Holopainen, M. Stem biomass estimation based on stem reconstruction from terrestrial laser scanning point clouds. Remote Sens. Lett. 2013, 4, 344–353. [Google Scholar] [CrossRef]
  16. Spriggs, R.; Coomes, D.; Jones, T.; Caspersen, J.; Vanderwel, M. (2017): An Alternative Approach to Using LiDAR Remote Sensing Data to Predict Stem Diameter Distributions across a Temperate Forest Landscape. Remote Sens. 2017, 9, 944. [Google Scholar] [CrossRef]
  17. Fang, R.; Strimbu, B.M. Stem Measurements and Taper Modeling Using Photogrammetric Point Clouds. Remote Sens. 2017, 9, 716. [Google Scholar] [CrossRef]
  18. Yan, Y.; Xia, M.; Fan, S.; Zhan, M.; Guan, F. Detecting the competition between Moso bamboos and broad-leaved trees in mixed forests using a terrestrial laser scanner. Forests 2018, 9, 520. [Google Scholar] [CrossRef]
  19. Labelle, E.R.; Heppelmann, J.B.; Borchert, H. Application of Terrestrial Laser Scanner to Evaluate the Influence of Root Collar Geometry on Stump Height after Mechanized Forest Operations. Forests 2018, 9, 709. [Google Scholar] [CrossRef]
  20. Schad, K.C.; Schmoldt, D.L.; Ross, R.J. Nondestructive Methods for Detecting Defects in Softwood Logs; USDA Forest Service Research Paper FPL-RP-546; USDA: Washington, DC, USA, 1996; 13p.
  21. Fonseca, M.A. The Measurement of Roundwood: Methodologies and Conversion Rations; CABI Publishing: Wallingford, Oxfordshire, UK, 2005; 269p. [Google Scholar]
  22. Colin, F.; Laborie, M.P.; Fortin, M. Wood properties: Future needs, measurement and modelling. Ann. For. Sci. 2015, 72, 665–670. [Google Scholar] [CrossRef]
  23. Hodges, D.G.; Anderson, W.C.; McMillin, C.W. The economic potential of CT scanners for hardwood sawmills. For. Prod. J. 1990, 40, 65–69. [Google Scholar]
  24. Rais, A.; Ursella, E.; Vicario, E.; Giudiceandrea, F. The use of the first industrial X-ray CT scanner increases the lumber recovery value: Case study on visually strength-graded Douglas-fir timber. Ann. For. Sci. 2017, 74, 9. [Google Scholar]
  25. Gjerdrum, P. Sawlog scaling accuracy before and after barking, and the importance for sawn timber recovery – A case study. Wood Mater. Sci. Eng. 2012, 7, 120–125. [Google Scholar] [CrossRef]
  26. Weidenhiller, A.; Denzler, J.K. On the suitability of colour and texture analysis for detecting the presence of bark on a log. Comput. Electr. Agric. 2014, 106, 42–48. [Google Scholar] [CrossRef]
  27. Roth, A.; Kennel, E.; Knoke, T.; Matthes, U. Line intercept sampling: An efficient method for sampling of coarse woody debris? Eur. J. For. Res. 2003, 122, 318–336. [Google Scholar]
  28. Murphy, G.E.; Pilkerton, S.J. Seasonal Impacts of Bark Loss on Simulated Payloads, Bark Delivery, and Transport Costs for Freshly Harvested Logs. For. Prod. J. 2011, 61, 71–76. [Google Scholar] [CrossRef]
  29. Weisstein, E.W. Point-Line Distance--2-Dimensional. Available online: http://mathworld.wolfram.com/Point-LineDistance2-Dimensional.html (accessed on 29 April 2019).
  30. Baumgartner, R.; Brüchert, F.; Staudenmaier, J.; Sauter, U.-H. Bark measurements with x-ray technology. In Proceedings of the COST E 53 Conference – Quality Control for Wood and Wood Products, Warsaw, Poland, 15–17 October 2007. [Google Scholar]
  31. Thomas, L.; Shaffer, C.A.; Mili, L.; Thomas, E. Automated detection of severe surface defects on barked hardwood logs. For. Prod. J. 2007, 57, 50–56. [Google Scholar]
Figure 1. Schematic chart of the operating principle and working steps for the Stemsurf software.
Remotesensing 11 01133 g001
Figure 2. Cross-sectional view of the stem for the calculation of the bark surface area units with V being the camera view direction, r the radius at the y-stem axis cross section, c the length of the stem surface, α the angle in radiant, and y the perpendicular distance from the stem axis in the image.
Remotesensing 11 01133 g002
Figure 3. Schematic illustration showing the laboratory setup for a test series performed on square geometry. The standardized log is turned 90 degrees to show an example of square geometry.
Remotesensing 11 01133 g003
Figure 4. Modifications performed on three different harvesting head prototypes. (A) General overview of modifiable parts of conventional harvesting heads. (B) Tested S1 modifications (inner and outer feed rollers, measuring wheel). (C) Tested S2 modifications (feed rollers). (D) Tested S3 modifications (inner and outer feed rollers, measuring wheel, upper delimbing knives, top knife).
Remotesensing 11 01133 g004
Figure 5. Schematic illustration showing the parallel positioning of processed logs placed on a forest road ready for image acquisition.
Remotesensing 11 01133 g005
Figure 6. Histograms of measured polygon shares of (A) wood surface of the rectangular geometry test series, (B) bark surface of the rectangular geometry test series, (C) wood surface of the round geometry test series, and (D) bark surface of the round geometry test series. The red line identifies the actual share of 75% wood and 25% bark surface.
Remotesensing 11 01133 g006
Figure 7. Calculated standard deviations for different sample sizes: (A) wood surface of rectangular geometry test series, (B) wood surface of round geometry test series, (C) wood surface total, (D) bark surface of rectangular geometry test series, (E) bark surface of round geometry test series, (F) bark surface total.
Remotesensing 11 01133 g007
Figure 8. Schematic of a 2D projection of a log via equal pixels and the expected described log surface with (A) longer areas towards the outside and (B) wider areas towards the extremities of the pictured log. The arrows indicate the direction of exceeding surface areas defined by a single pixel.
Remotesensing 11 01133 g008
Table 1. Harvesters and harvesting heads studied.
Setup 1Setup 2Setup 3
HarvesterJohn Deere 1270 ETimberpro 620EPonsse ScorpionKing
Harvesting headJohn Deere H480CLogMax 7000cPonsse H7
Table 2. Descriptive statistics of the main results comparing the single debarking percentage measurement values.
PolygonTest SeriesSample SizeMean
(%)
Standard Deviation
(%)
Range
(%)
Minimum
(%)
Maximum
(%)
WoodRectangular24080.512.866.856.8123.6
Round24079.69.447.859.9107.7
BarkRectangular24025.87.634.88.443.2
Round24026.75.226.514.340.8
Table 3. Descriptive statistics presenting the main results comparing the calculated average debarking percentages.
PolygonTest SeriesSample Size (%)Standard Deviation (%)Range (%)Minimum (%)Maximum (%)Deviation Range * (%)
WoodRectangular123.9517.474.792.1−0.3–17.1
Round123.9814.575.389.90.3–14.9
Rectangular243.199.976.286.01.2–11.0
Round243.3510.075.885.80.8–10.8
Rectangular483.008.076.384.21.3–9.2
Round482.946.177.383.42.3–8.4
Rectangular963.446.276.382.41.3–7.4
Round961.973.977.481.32.4–6.1
BarkRectangular121.545.523.729.2−1.3–4.2
Round121.053.525.829.20.8–4.2
Rectangular241.253.824.328.1−0.7–3.1
Round240.913.225.829.00.8–4.0
Rectangular481.142.825.027.80–2.8
Round480.872.126.128.31.1–3.3
Rectangular961.502.625.227.80.2–2.8
Round960.691.226.127.31.1–2.3
* Deviation of average debarking percentages from 75% for wood and 25% for bark polygon measurements under controlled conditions.
Table 4. Descriptive statistics of the calculated average debarking percentages compared to the true simulated debarking percentages of the laboratory surveys (sample size = 240).
PolygonTest SeriesE (Θ)
(%)
θ
(%)
E(Θ) – θ
(%)
CorrE(Θ) − θ
(%)
WoodRectangular80.5755.57.3
Round79.6754.66.1
BarkRectangular25.8250.83.2
Round26.7251.76.8
E(Θ) - Estimates of parameters; θ - True parameter; CorrE(Θ) - Area-corrected estimates of parameters.
Table 5. Measured average debarking percentages of the field application of the system corrected based on findings of the laboratory accuracy validation.
Field TestsS1
Summer I
(%)
S1
Winter
(%)
S1
Summer II
(%)
S2
Winter
(%)
S3
Winter
(%)
S2
Summer
(%)
S3
Summer
(%)
Debarking percentage84.153.889.934.883.473.183.8
Corrected debarking percentage *85.156.990.639.284.574.984.9
* Recorded average debarking percentages of summer and winter field applications, corrected considering a bias factor.

