Article

Measuring Change Using Quantitative Differencing of Repeat Structure-From-Motion Photogrammetry: The Effect of Storms on Coastal Boulder Deposits

by
Timothy Nagle-McNaughton
1,2,* and
Rónadh Cox
1
1
Department of Geosciences, Williams College, Williamstown, MA 01267, USA
2
Department of Earth and Planetary Science, The University of New Mexico, Albuquerque, NM 87131, USA
*
Author to whom correspondence should be addressed.
Submission received: 21 November 2019 / Revised: 11 December 2019 / Accepted: 15 December 2019 / Published: 20 December 2019

Abstract

:
Repeat photogrammetry is increasingly the go-too tool for long-term geomorphic monitoring, but quantifying the differences between structure-from-motion (SfM) models is a developing field. Volumetric differencing software (such as the open-source package CloudCompare) provides an efficient mechanism for quantifying change in landscapes. In this case study, we apply this methodology to coastal boulder deposits on Inishmore, Ireland. Storm waves are known to move these rocks, but boulder transportation and evolution of the deposits are not well documented. We used two disparate SfM data sets for this analysis. The first model was built from imagery captured in 2015 using a GoPro Hero 3+ camera (fisheye lens) and the second used 2017 imagery from a DJI FC300X camera (standard digital single-lens reflex (DSLR) camera); and we used CloudCompare to measure the differences between them. This study produced two noteworthy findings: First, volumetric differencing reveals that short-term changes in boulder deposits can be larger than expected, and that frequent monitoring can reveal not only the scale but the complexities of boulder transport in this setting. This is a valuable addition to our growing understanding of coastal boulder deposits. Second, SfM models generated by different imaging hardware can be successfully compared at sub-decimeter resolution, even when one of the camera systems has substantial lens distortion. This means that older image sets, which might not otherwise be considered of appropriate quality for co-analysis with more recent data, should not be ignored as data sources in long-term monitoring studies.

Graphical Abstract

1. Introduction

Photogrammetric surveys flown using unmanned aerial vehicles (UAVs) are now routinely used for longitudinal monitoring studies in areas with rapid erosive and/or depositional processes, such as coastal [1,2] or fluvial environments [1,3,4,5]. UAVs and structure-from-motion (SfM) photogrammetric software have become go-to tools for monitoring hazardous locations such as landslides [6,7,8,9,10,11,12] and subsidence/sinkholes [13,14,15]. These technologies have also been widely adopted in coastal erosion [16,17,18], marine science [19,20,21], both marine and terrestrial ecology [22,23,24,25,26,27], archaeology [28,29,30,31,32,33,34,35], and civil engineering [36,37,38,39,40].
The swiftness with which researchers have embraced and applied this relatively new technology speaks to its inherent potential—UAV mapping is ideal for repeat low-cost, high-resolution data collection [41]—but also reflects rapid advances in the efficiency and stability of UAVs, the usability and reliability of controller software, and the sophistication of automated photogrammetric image processing [42,43,44,45].
Despite these improvements in protocols for data collection and analysis, quantifying change via repeat photogrammetry remains a challenge, generally requiring manipulation of digital terrain models (DTMs) using Geographic Information Systems (GIS) [45,46]. But recent innovations in 3D differencing software, as implemented in the open-source package CloudCompare (www.danielgm.net/cc/) enable rapid, objective, and replicable quantitative differencing [47]. CloudCompare is a cross-platform 3D point cloud and mesh processing package, which provides a suite of features for direct comparison of dense point clouds (>10 million points) and meshes on standard consumer computer hardware [48,49]. Accessibility and ease of use make CloudCompare an attractive tool, and it is applied increasingly in a variety of fields, including mapping [50,51], archaeology [52,53], and geomorphology [54,55,56,57].
Another issue relevant to long term monitoring studies is how to deal with repeat imagery captured using different kinds of hardware, with different resolutions and/or distortion levels. The ultra-wide-angle (fisheye) lenses mounted on the popular consumer camera brand GoPro capture a ~120° field of view, but have barrel distortion due to their short focal length. Despite their limitations, GoPro cameras are popular tools for acquiring UAV imagery [24,31,58,59,60], they are relatively inexpensive, are light enough to be carried by off-the-shelf consumer drones, offer good resolution for their size, and can image large areas at relatively low altitudes (where lower wind speeds make UAV operation easier) [58,61,62,63,64]. However, ultra-wide-angle lenses require substantial calibration and correction to correct the inherent barrel distortion [33,59]. In this study, we demonstrate that heavily distorted imagery captured with GoPro cameras can be effectively corrected with consumer software, and used to build high-resolution SfM models with little residual distortion. Furthermore, these GoPro-derived models can be precisely aligned with models that are constructed using non-distorted imagery, to perform quantitative differencing on a sub-decimeter scale.
Here we apply CloudCompare to longitudinal monitoring of coastal boulder deposits (CBD) on Inishmore, Ireland (Figure 1). Combining repeat photogrammetry (first data collected by a GoPro Hero 3+, and later using a DJI FC300X) and quantitative differencing, we demonstrate re-organization of the deposit by storm waves over a two-year period. This work is part of a long-term monitoring project that will contribute to understanding CBD dynamics, and thereby unlock the record of high-energy wave events preserved in these deposits.

2. Coastal Boulder Deposits
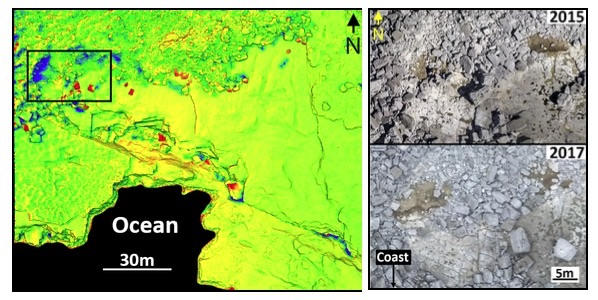
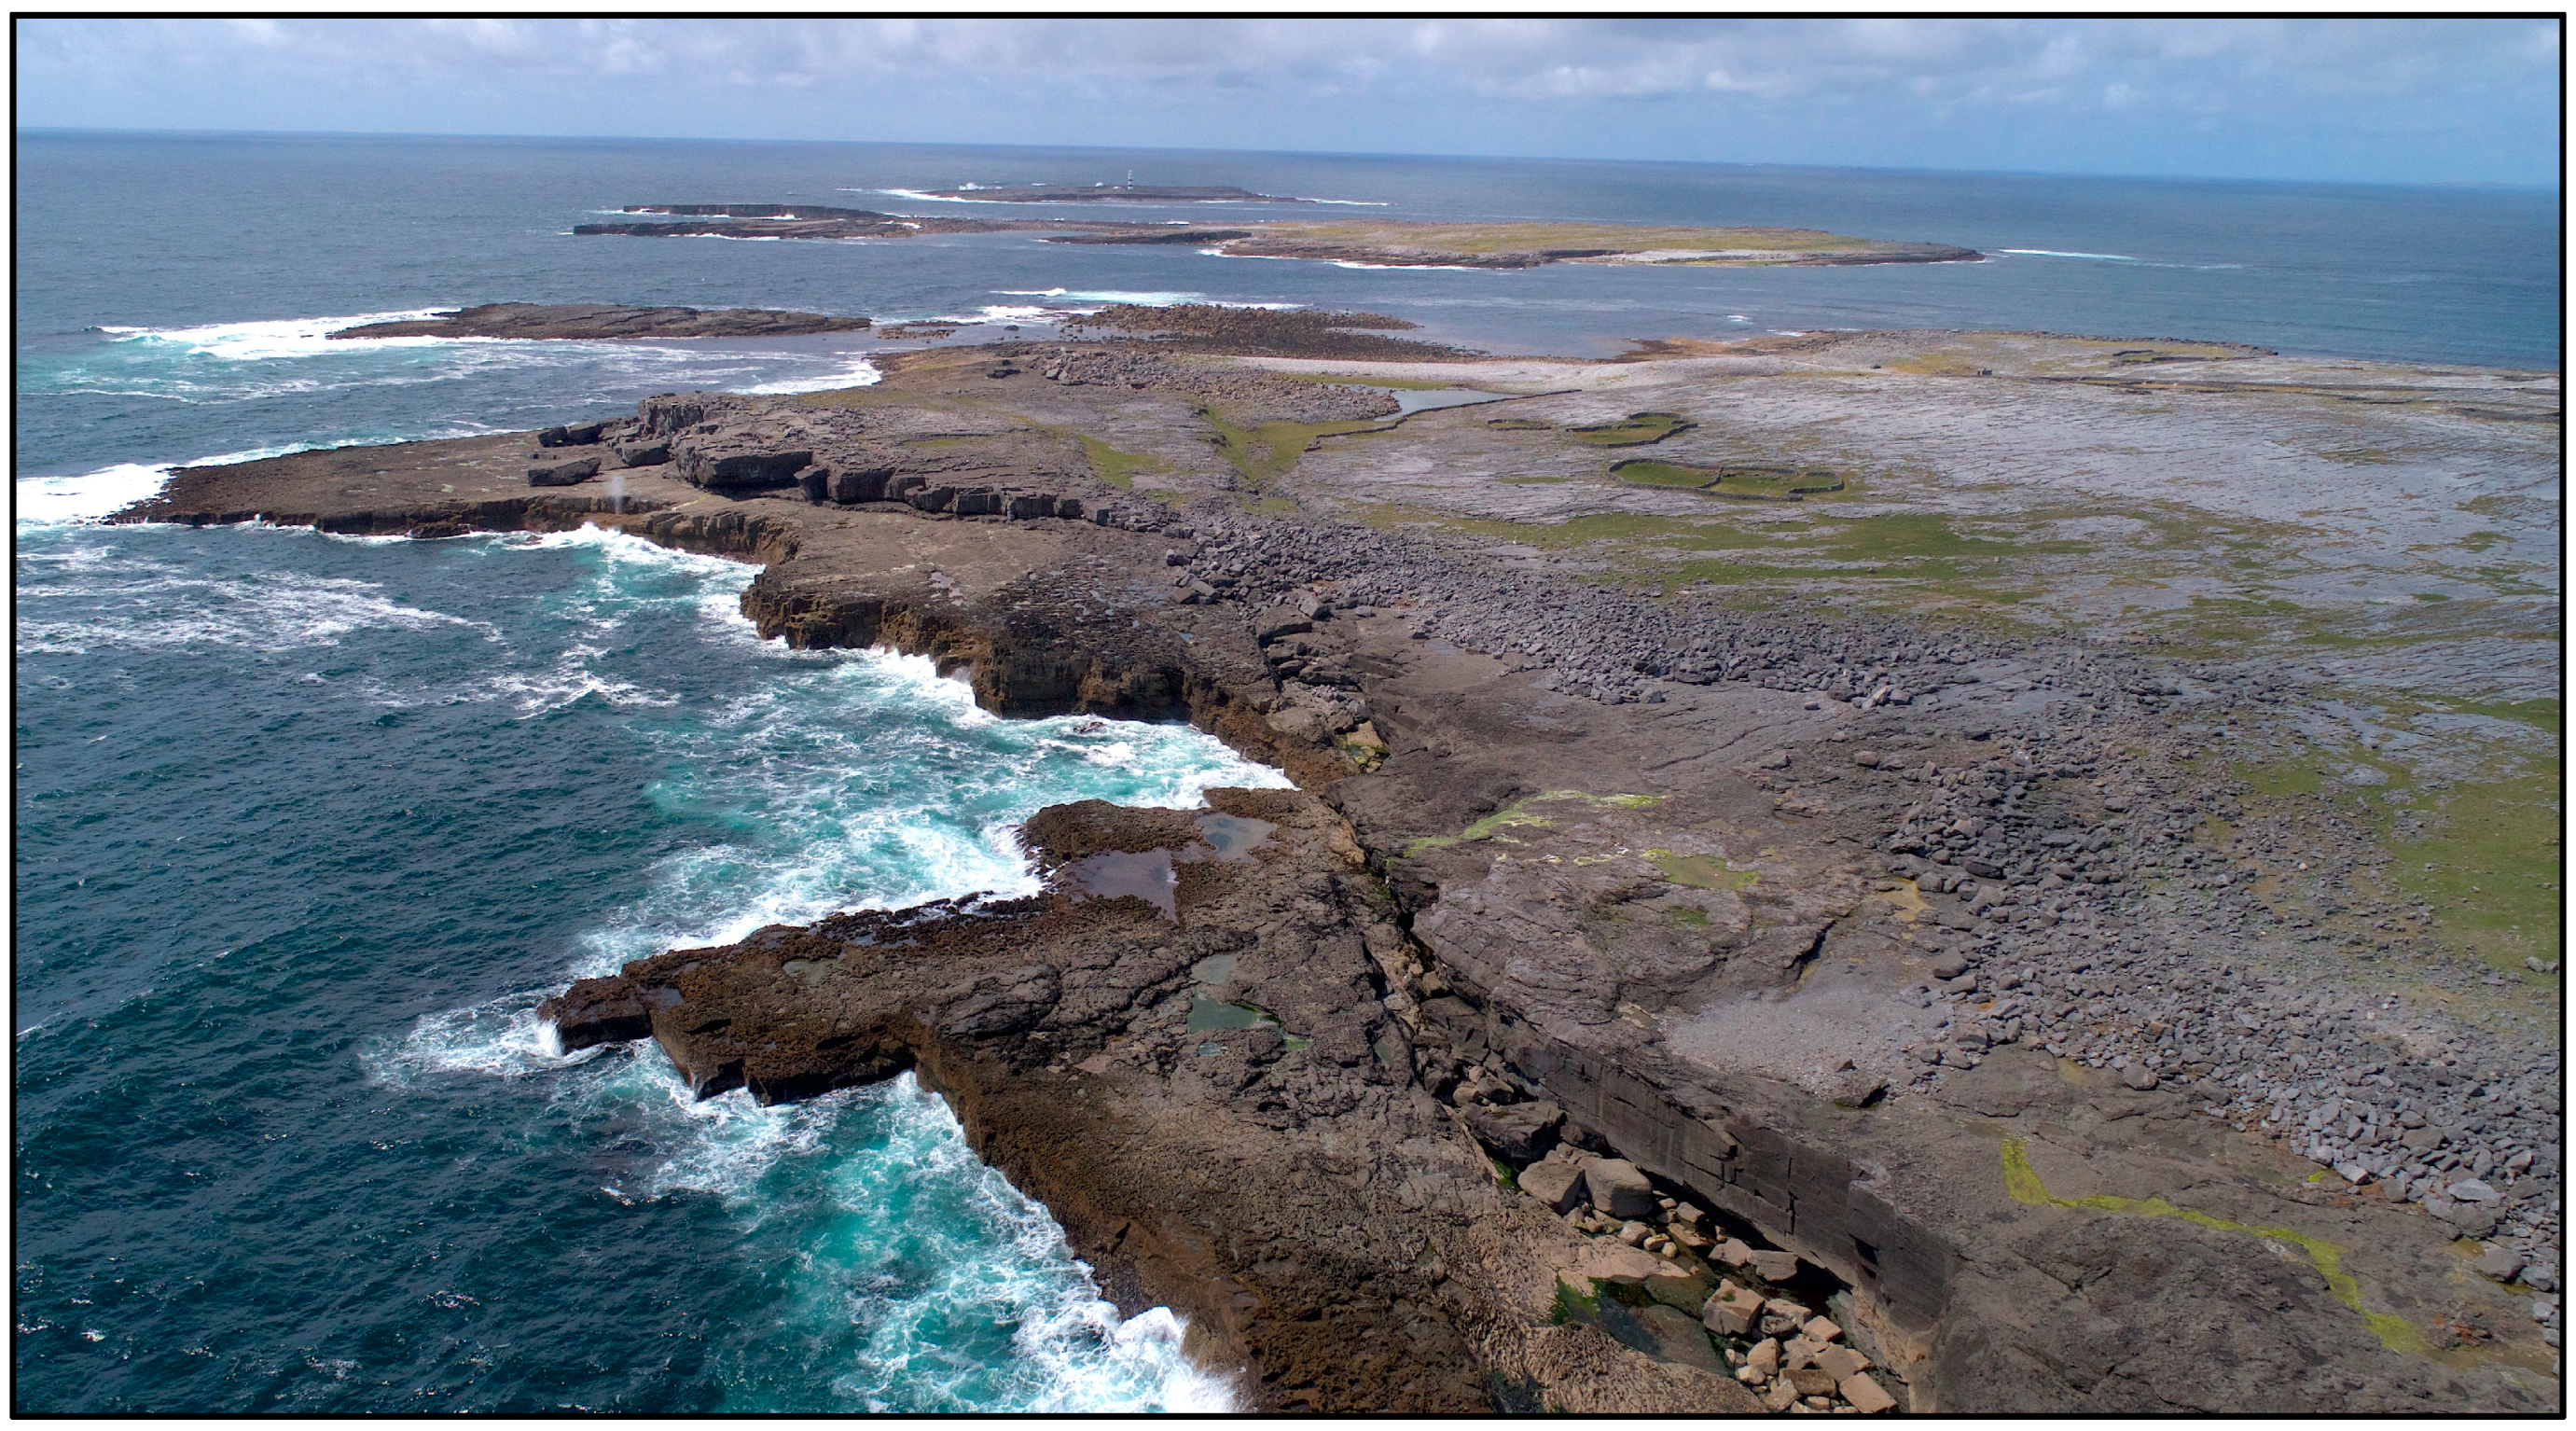
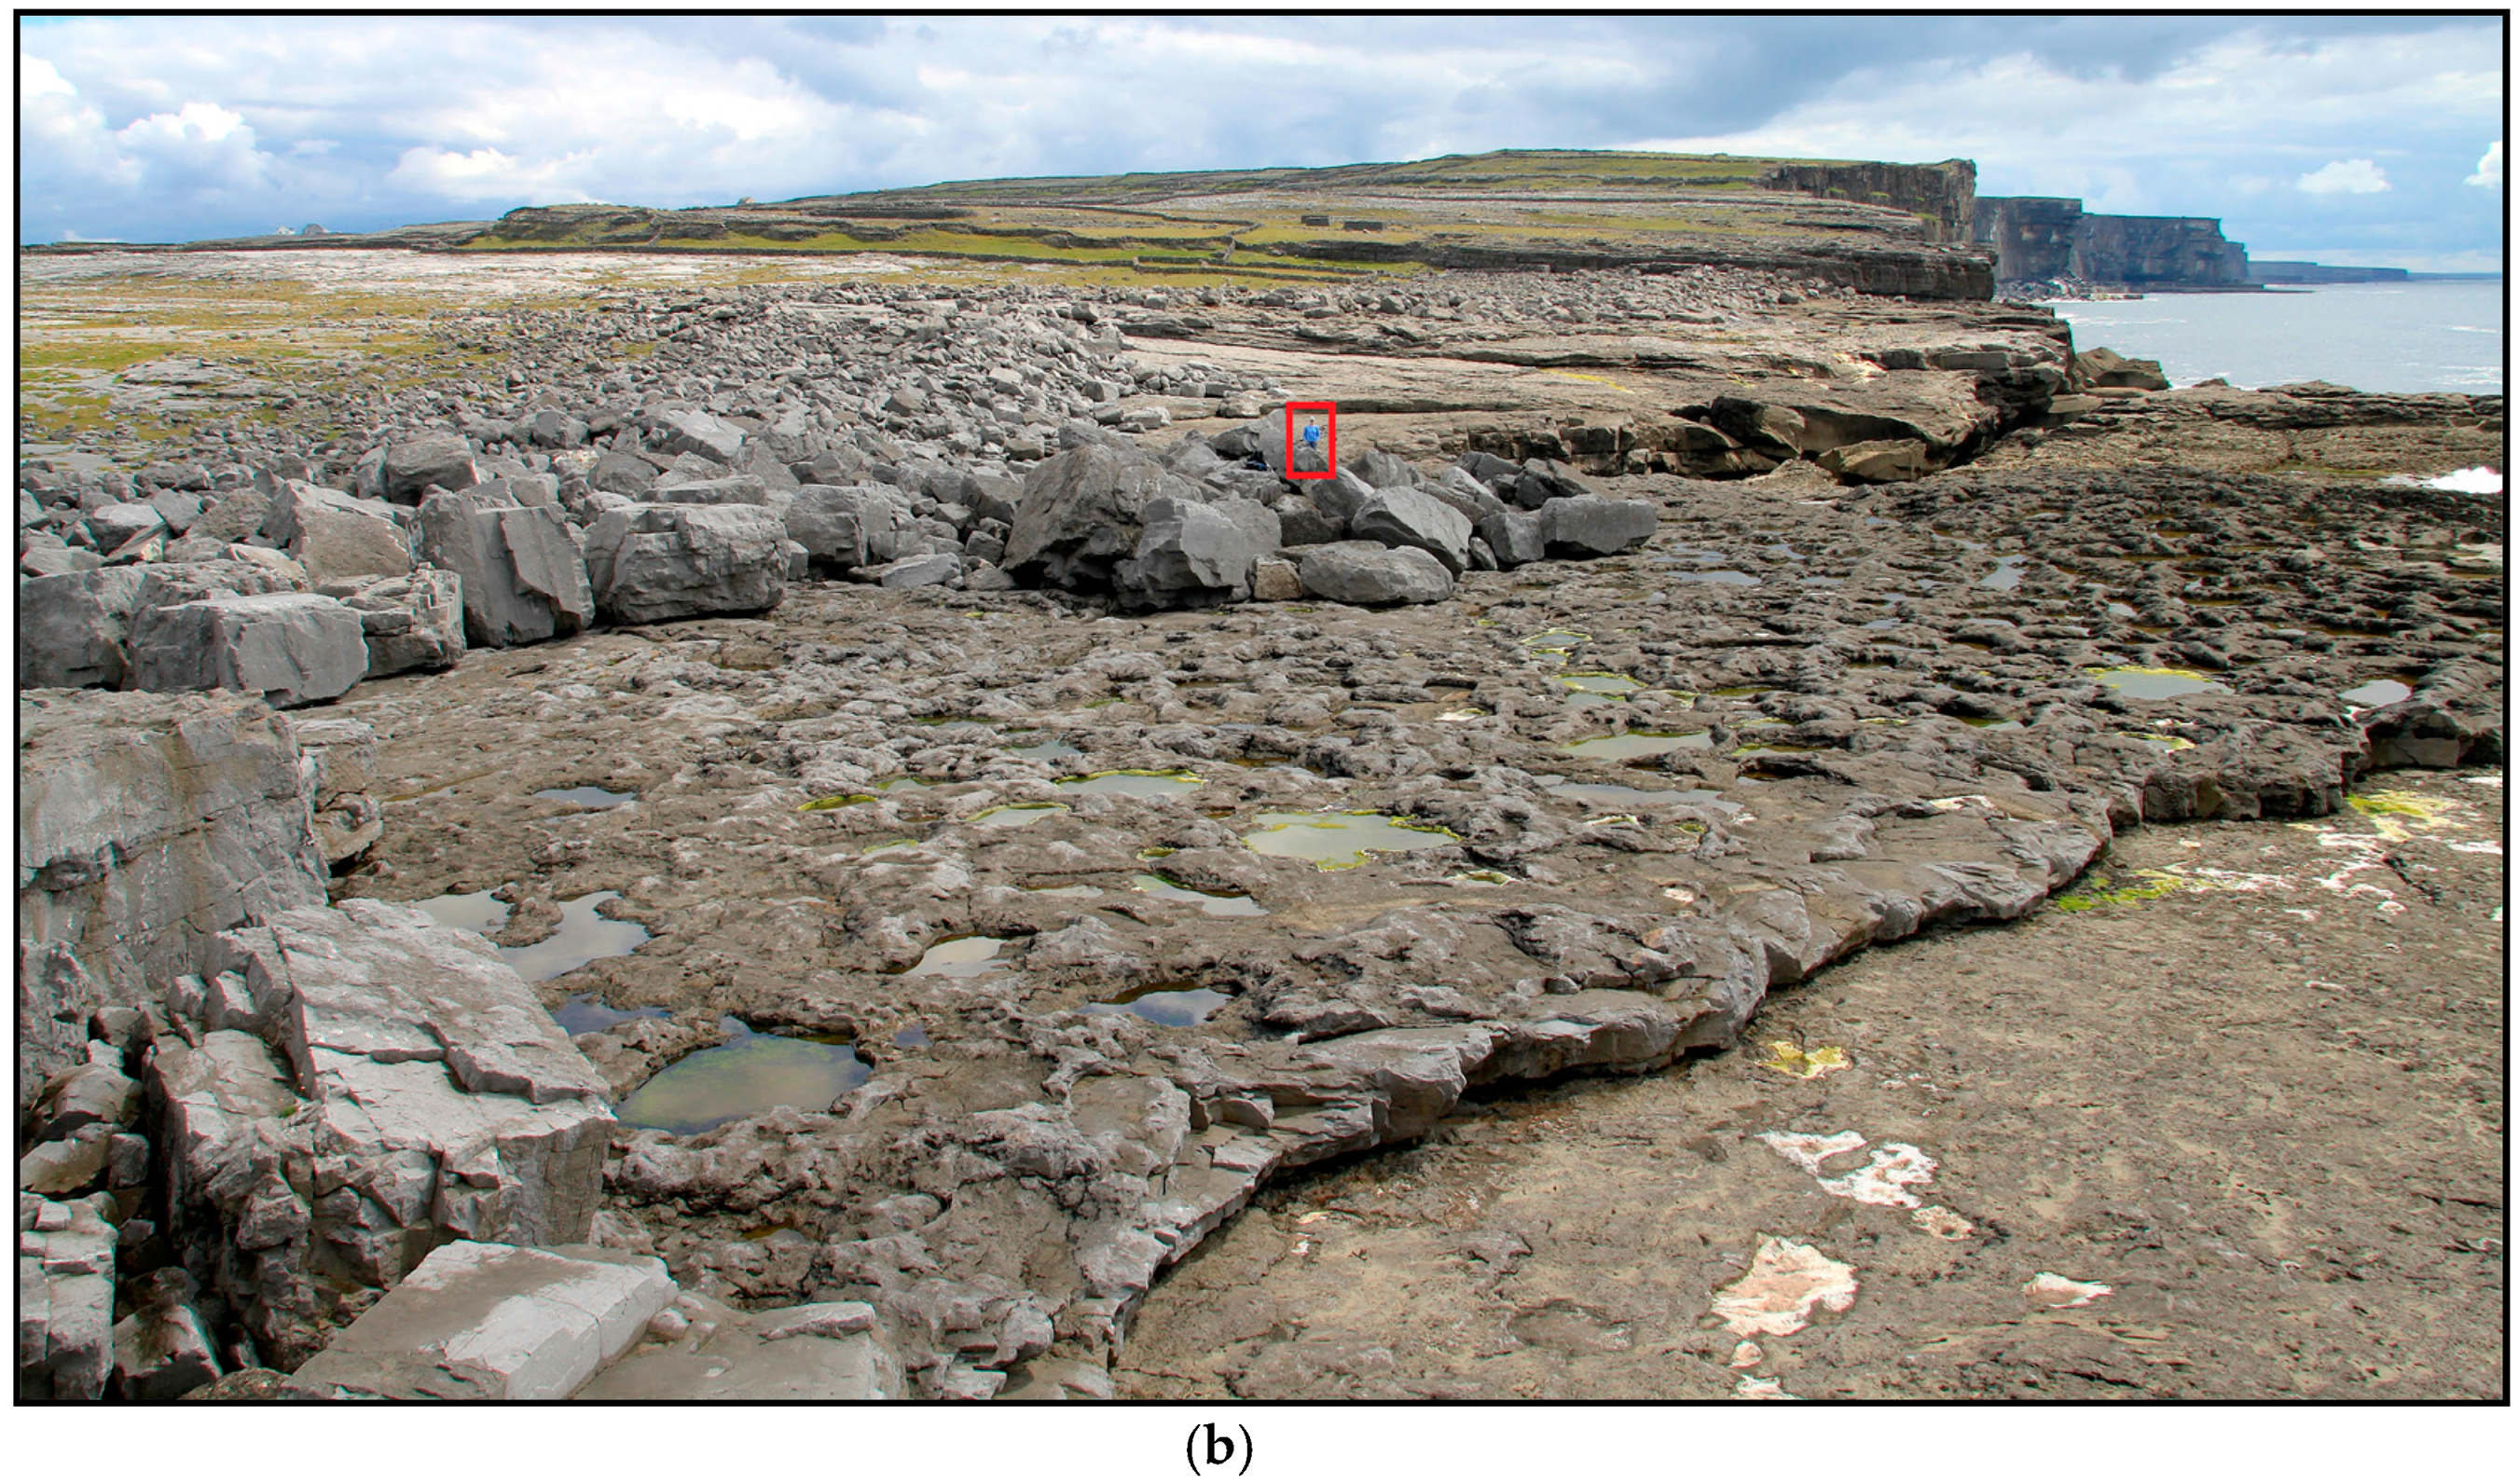
Coastal boulder deposits (CBD) accumulate above the high-tide line on exposed rocky coasts, and include clasts that can weigh hundreds of tons in some cases [65,66,67,68]. They often form imbricated boulder ridges that can be several meters high, tens of meters wide, and hundreds of meters long [65,69,70,71] (Figure 2), CBD occur world-wide along high-energy coastlines. They have been documented around the Mediterranean [72,73,74,75], as well as in the Atlantic on the Aran Islands, Ireland [70,76], the Shetland and Orkney Islands, Scotland [69], Banneg Island, France [77], and Iceland [78]. CBD are also located in both western and northeast Australia [66,79], Iran [80], Oman [81], the Philippines [67,68,82], the Caribbean [71,83,84,85,86], South Africa [87], and elsewhere. Until recently, however they received little attention: about 90% of published studies are from the last 18 years [88].
CBD are ideal candidates for photogrammetric monitoring and CloudCompare analysis, because the processes by which they form and evolve are poorly understood. Some studies have inferred tsunami emplacement, possibly with subsequent modification by storm waves [72,89,90,91,92]. Others argue that characteristic features of CBD, including boulder imbrication, are primary indicators of tsunami transport, and exclude storm waves [93]. Further, the precise mechanics of boulder generation and transport remain contentious, and the dynamics of boulder ridge evolution over time (including inland migration rates) are not understood. Before and after positions of individual boulders and of ridge fronts have been documented [65,67,68] but the details remain elusive. Boulders may remain in place for decades, perhaps even centuries; but may then be transported meters or tens of meters during a single event [65,67,79,81,94].
The Aran Islands are of particular interest in this context because waves generated by intense storms have recently been shown to deposit and rearrange CBD along the Atlantic-facing coasts of all three islands [65,88]. Recognition that these deposits are currenty active has made them a focus for studying the energetics and effects of high energy storms [95,96]. Repeat observations of boulder ridges and quantitative change analyses over short time scales are critical for understanding CBD dynamics.
Quantifying the timescale and magnitude of change from year to year sets a baseline, and even in years without extreme storms may reveal lower-energy dynamics in the CBD system. Documenting these changes is a necessary precursor to unravelling the long-term evolution of CBD systems, and better understanding the mechanisms of their movement. UAV-based photogrammetry is an ideal methodology for this work. Observations are easily repeatable even in relatively inaccessible areas, so that SfM models can be created on an annual basis or better. Point-cloud differencing using CloudCompare can rapidly quantify changes at all scales. Thus, SfM can record CBD changes, including responses to storm events.

3. Study Area

This case study focuses on part of an extensive CBD system on the Aran Islands (Figure 2). Inishmore, the largest of the three islands, has about 7 linear km of CBD along its Atlantic coasts [70,76]; and our test site is at the far northwestern end (Figure 3), where wave energies tend to be greatest (Cox et al., In review).
The Aran Islands are composed of Carboniferous limestone that dips 2–4° to the southwest [97]. A combination of near-flat bedding and orthogonal sets of vertical veins and joints creates stair-step cliffs and broad platforms on the exposed Atlantic sides of the islands. Erosion along these planes of weakness yields tabular boulders (Figure 3), which pile up at the back of the bedrock platforms. The Aran Islands CBD have been the site of several studies [65,70,76,98]. The largest boulders, which weigh hundreds of tonnes, tend to be close to sea level, while smaller boulders (still weighing tonnes or tens of tonnes) can be up to 220 m inland, or on cliffs that reach as high as 50 m above sea level [65,70,76].
The test site exhibits well-developed boulder ridges that sit 8–15 m above high water, ~30–70 m inland (Figure 1), and contain boulders with characteristic masses of tonnes to several tonnes, with intermediate axes of order 1 m [99] (sites S31–S33 in Table A2 of Ronadh Cox et al., 2012). Individual blocks in the ridges (often concentrated at the seaward edge: Figure 3) tend to be larger, and commonly weigh tens of tonnes, up to ≈100 t in some cases (intermediate axes of order 2–5 m, density 2.66 t m−3 [65,76]. Comparison with 1930s film footage revealed transport of boulders up to about 60 t [100], and during large storms in winter 2013–2014 movement of boulders weighing as much as 50 t was documented [65]. Conventional wisdom suggests there is little or no activity in these deposits on a year-to-year basis, with change happening only during particularly extreme storm events [76,95,98]. The data presented in this study challenge that assumption by showing considerable deposit rearrangement during the winters of 2015–2016 and 2016–2017.

4. Materials and Methods

Our methodology had four phases: (1) on-site image acquisition using a DJI Phantom drone; (2) image correction and optimization in Adobe Lightroom; (3) 3-D point-cloud and mesh generation using the SfM software package Agisoft PhotoScan (referred to here as “Agisoft”: www.agisoft.com); and (4) quantitative differencing and analysis using CloudCompare (www.danielgm.net/cc/). Fieldwork was carried out with a two-person field team, and the survey time (from unpacking the drone to leaving the area) was 30 minutes without ground control points (GCPs,) and 75 minutes with GCP deployment and collection.
We point out that Agisoft Photoscan has recently been renamed Agisoft Metashape, but despite the name change, Metashape is essentially an upgrade with added functionality. The integrated changelog is at www.agisoft.com/pdf/metashape_changelog.pdf).

4.1. Image Acquisition

Data were collected in 2015 and 2017 using a DJI Phantom 3 (FC300X) drone controlled by DJI Groundstation Pro (Table 1). Phantom drones are relatively inexpensive, costing between $400 and $1500, and have been used for similar SfM studies [57,82,101]. Images were collected at nadir along precisely calibrated flightpaths parallel to the coast (Figure 4), at altitude 90 m in 2015 and 50 m in 2017 (Table 1). To ensure sufficient target points in adjacent images, flight paths were set up to provide 80% overlap between successive images and 60% sidelap between adjacent paths. The benefits of high-overlap image sets are well-documented [25,64,102,103,104], so the practice has become standard operating procedure.
Different cameras were used in the two different missions: a GoPro Hero 3+ in 2015, and a DJI single-lens reflex camera in 2017. Both cameras had 12-megapixel sensors, but the GoPro camera had a much wider field of view (Table 1). In both surveys, the in-camera GPS automatically tagged each image’s metadata with the capture location co-ordinates. These positional data have limited accuracy, however, as they are captured while the camera is in motion, using a relatively low-precision GPS unit. To improve georeferencing, GCPs—i.e., discrete objects that would be recognizable in the photographs (Figure 5)—were distributed throughout the study area during the 2017 survey. Their positions were recorded on the ground using hand-held mapping-grade GPS, which was sufficiently precise for the scale of changes measured in this study. While not utilized in this project, Agisoft provides a tool to generate unique coded GCPs via the Print Markers tool that the software can then automatically recognize and label later via the Detect Markers tool [105] (see pages 71–72). These can be useful in surveys flown at low altitude, but require very high image resolution for reliability. Further, while the coded GCPs are natively implemented by Agisoft, manual GCPs are widely used in the literature [47,106].

4.2. Image Optimisation and Distortion Correction

Drone imagery was imported into Adobe Lightroom for organization and processing. Lightroom is professional-grade software for photographic catalog management and bulk processing, which in addition to having powerful processing algorithms, is relatively inexpensive and user-friendly. Thus, it is often used in scientific photogrammetry for both image correction [35] and lens distortion correction [33,107]. The image corrections employed in this study were simple and uniform across the images: the contrast was increased to +30, and clarity (a mid-tone contrast enhancement) was increased to +25. This process improves performance of the SfM software in common-point identification, minimizing errors. It is especially important when target features are relatively homogenous, as is the case with the monochrome limestone bedrock of the test site (e.g., Figure 5).
Lens distortion was addressed via Lightroom’s lens correction profile. This tool fixes image distortion and chromatic aberration (either automatically or manually) by reading lens information from the metadata and applying lens-specific image adjustment profiles [108,109,110,111,112,113,114]. The 2017 images required very little adjustment, but the corrections were essential for the 2015 GoPro images, which had strong barrel (or “fisheye” distortion). More complex and sophisticated lens correction techniques exist [41,54,115,116,117,118] but Adobe’s lens profiles have been tested and recommended in the photogrammetric literature [64,119,120,121,122]. The quality of Lightroom’s corrections are evident in before-and-after images (Figure 6), and in the quality of the final model.

4.3. Model Generation Using Agisoft Photogrammetry Software

Agisoft’s ease of use, relatively low cost, and high-quality output [123,124,125] have led to broad uptake in scientific communities including forestry [101], geology [126], geomorphology [41,56,82,127,128], and archeology [32,129,130]. The software has an intuitive workflow that guides users step-by-step through the process of generating a 3D model [105]. For this project, we used the 2017 version 1.3.4. The product has been updated and renamed since this study was completed (see www.agisoft.com/pdf/metashape_changelog.pdf) but the workflow described here is the same in the current version of the software.
Image alignment is the first workflow step. Agisoft’s algorithms [105] are generally very good at aligning photos, but the software has a few percent failure rate even with systematically acquired, GPS-tagged, uniformly oriented photos, and a couple of passes may be necessary. The precise error rate varies depending on variables such as image resolution and format, image overlap, sensor type and size, lens focal length and aperture, lens geometry, camera calibration accuracy, camera GPS accuracy, target contrast, target geometry, and flight altitude, path, and speed [131,132,133]. In this study, 21 of 355 images (6%) in the 2015 survey and 4 of 211 (2%) in the 2017 survey failed to align on first pass. Selecting each of the failed images, resetting its alignment (via the Reset Camera Alignment command), and then using the Align Selected Cameras command fixed every failed alignment in this study, i.e., a 100% alignment success rate.
The sparse point cloud (i.e., a very low-resolution 3D visualization of tie points common to multiple images, which is generated during the image alignment process) permits the user to evaluate accuracy and identify problematic tie points prior to the more computationally intensive generation of dense point clouds. Each point has associated uncertainty information. Points with high uncertainty are likely to be inaccurate, so it is standard practice to improve model quality by systematic elimination of points that fail to meet defined thresholds [134]. Uncertain points were identified via two passes of Agisoft’s Gradual Selection tool, with threshold set to reconstruction uncertainty = 10 [135] (as recommended by Mayer et al., 2018), and then deleted. This process may not identify all problematic reconstructions, so it is recommended that the user manually rotate the model about all axes to visually identify inaccurate tie points. For example, Agisoft sometimes mis-correlates points located in the sky and the ocean, or incorrectly reconstructs bedrock relationships such that some points ‘float’ above or below the model surface. These points can be manually selected and deleted. Previous work has shown that expert manual filtering is the most efficient and accurate way of removing outlier points, and an indispensable step in the model-creation process [1]. The optimized tie points are then used to construct the dense cloud.
Dense point clouds can be built at a range of resolution settings: lowest, low, medium, high, and ultra. Each increase in resolution produces an exponentially larger number of points in the final model. To achieve the highest resolution possible, all models in this study were built at ultra quality.
During dense-cloud creation, additional mis-correlated points are generated. Agisoft has a built-in function called Depth Filtering to help mitigate the number of these points. This tool has four settings (off, mild, moderate, and aggressive). Testing the various filtering levels revealed that aggressive filtering produced better dense clouds in less time, so that setting was used in this project.
Although GCPs are not required for model generation, their inclusion improves positional accuracy [47,116]. GCPs acquired during the 2017 survey were brought into the model via Agisoft’s import function. Agisoft places a marker giving an estimate of the GCP location in each image, but for precision, the user should visually check the placement, and refine if necessary. Images can be filtered by GCP presence, so that the user can efficiently work through just those images containing GCPs. For example, sometimes the digital GCP marker may not be centered on the physical GCP marker in the photograph. In such cases, the user can manually move the digital marker to the correct place.
Once all GCP markers have been accurately positioned in the model, the digital marker coordinates are updated to match the coordinates measured by GPS in the field. Whether by use of pre-coded targets or by manual input of GCP locations, the GCPs thus provide accurate anchor points for georeferencing the model. Once all GCPs have been located and anchored, the user simply updates the model projection via the Update tool. Agisoft then measures the difference between GCP anchor point coordinates and the estimated coordinates for other points in the model, and refines the projection accordingly. The precise georeferencing of the 2017 model via the GCPs was transmitted to the 2015 model when the two models were aligned in Cloud Compare.
Polygon surfaces meshes were built from the georeferenced dense clouds via the Build Mesh command in the Workflow menu. Mesh surfaces have much smaller output files and therefore are much faster to process in CloudCompare. Meshes can be one of two types: arbitrary or height field. Arbitrary surfaces can be applied to any kind of object. No assumptions are made about the object being modeled, although this comes at a cost of higher memory consumption [136]. To achieve the maximum possible mesh resolution, the meshes for this project were of arbitrary type.
Building high-resolution models is computationally intensive. Using a desktop Mac Pro (with 1TB PCLe storage, 32GB of 1866MHz RAM, a 3.0GHz 8-core 16-thread Intel Xeon CPU, and two AMD FirePro D700 GPUs with 6GB of total memory) it took ~25–30 hours to generate the dense clouds and 5–10 hours to build the meshes (the shorter times were for the lower resolution starting image sets). Those times would be less with more recently developed multi-core processers. It is important to note that not all applications require the highest precisions, and processing time should be taken into account when determining the optimal precision for addressing a specific research question.

4.4. Quantitative Differencing Using CloudCompare

CloudCompare is free open-source software that offers a comprehensive suite of tools for comparing a variety of model formats, largely via the Multiscale Model to Model Cloud Comparison (M3C2) algorithm [137] See www.cloudcompare.org/doc/wiki/index.php?title=FILE_I/O for a full list of formats. Supported file types are imported into CloudCompare via a simple Open menu. The software provides quantitative differencing and statistical manipulation functions, in addition to a variety of display enhancement features (custom color ramps, shaders, handling of calibrated pictures, etc.). CloudCompare can analyze any combination of meshes and dense point clouds: point-to-point, mesh-to-point, and mesh-to-mesh [136].
For this project, we used mesh-to-mesh analysis. Although dense clouds generally have better resolution than corresponding meshes, the point cloud file sizes can be several orders of magnitude larger and are therefore computationally cumbersome to work with. Our dense cloud files were ~20 GB, while the meshes were only ~300 MB. The smaller file sizes and simpler geometries made mesh-to-mesh comparisons much faster than point cloud comparisons of the same area. The triangulated/triangular irregular network (TIN) .ply mesh file format (also known as the Stanford Triangle Format) was optimal because of its broad compatibility and ease of integration with other 3D software [50,138].
Achieving high-quality alignment is the critical step in model differencing, and CloudCompare’s registration methods have been tested and used in the literature [26,139,140,141]. The process is iterative, with the alignment becoming better with each iteration. Three initial input values are required: theoretical overlap, iteration stop condition, and alignment scaling.A theoretical overlap of less than 100% allows CloudCompare to align partially-overlapping models (as is generally the case for drone flights collected at different times) without having to scale or move one of the models to completely overlap the other [136]. Even when data are collected in controlled environments and/or with very high-precision instruments, the overlap is rarely 100% [142,143].
The iteration stop condition can be set to a maximum number of iterations (e.g., stop after 30 iterations), or at a target root mean square (RMS) difference between iterations (e.g., stop when the improvement between iterations is less than 1 cm), whichever comes first [136]. For example, the distance between the models may decrease by several meters between the first and second iteration, but this improvement will get gradually smaller as the alignment improves. Thus, by the twentieth and twenty-first iterations, the improvement may be a centimeter or less. For this study, an improvement threshold value of 1 × 10⁻⁵ m was used, and the minimum iterations were set to 1,000 to ensure that the improvement threshold was met first. The default settings are 20 iterations or an improvement threshold of 1 × 10⁻⁵ units, and have been used elsewhere in the literature (e.g., Vasilakos et al., 2018). The extremely small threshold improvement value ensures that the algorithm is asymptotically approaching an optimized alignment, and has reached a plateau of diminishing returns, as each iteration is producing a tiny marginal improvement regardless of how much computation time is invested.
The last input is whether or not to enable model scaling for cases where the models are of slightly different sizes [136]. CloudCompare uses a scaling factor only when it improves alignment between models, so its use is highly recommended, especially given that scaling has been useful with models generated with wide-angle imagery even in highly controlled laboratory settings [58]. Alignment scaling was therefore enabled in this study.
Model alignment should maximise accuracy. Thus the model with the best georeferencing and/or resolution should provide the template to which other models will be aligned. In this case, 2017 model, which was georeferenced with GCPs, was the more accurate. Thus, the 2015 mesh was aligned to the 2017 mesh.
Vertical distances between sampled points on the two aligned mesh surfaces are calculated via the mesh-to-mesh option within CloudCompare’s cloud-to-mesh (C2M) tool [141,144,145,146]. Note that differences between point clouds are given as absolute values (i.e., the tools do not distinguish between surface raising and lowering, but simply compute the raw distance between sampled points on the two input models). A first-party plugin called M3C2 returns signed values (negative for surface lowering, positive for surface raising) [136], but this is not required for mesh-to-mesh comparisons, which automatically differentiate between added and lost volume.

5. Results

5.1 Agisoft Models

The Agisoft models for 2015 and 2017 had resolutions of 3.7 and 2.4 cm/pixel respectively. For the larger boulders, with y-axis lengths in the range of meters to several meters, this represents tens to hundreds of pixels in area. Specific boulders are readily discernable, as are details of the bedrock (Figure 7). It was clear from initial comparison of the models that the majority of the area had not changed between 2015 and 2017, and that there had been no erosion of the bedrock platform, but that many individual boulders had changed locations.
Detailed visual comparisons revealed complex rearrangement dynamics in the clasts comprising the boulder ridge (Figure 7). Some boulders visible in 2015 could not be found in the 2017 model or imagery, and in addition there were new boulders in the 2017 data that could not be identified in the 2015 model or imagery. For example in Figure 7, there are 24 boulders with trackable movement, and 52 boulders that could not be matched to the 2015 data.
We were able to calculate volumes for individual boulders in Agisoft via the built-in Measure Area and Volume tool. Multiplying volume by the measured density of 2.66 t m−3 [65,76] provided approximate boulder masses (Table 2).

5.2. Aligning Disparate Datasets with CloudCompare

The 2015 and 2017 models aligned well in the CloudCompare output. Significant changes in surface elevation due to boulder motions are clearly evident as red and blue features in Figure 8, and provide the basis for a robust quantitative analysis, as will be discussed below.
We assessed the alignment quality in this study by examining areas where we know there was zero change over the time interval. Zero difference between models is represented in the output by green. We know that most of the area underwent no change, and that is borne out by the green color that dominates Figure 8. This gives us confidence in the quality of the quantitative differencing. Minor residual distortion from the fisheye 2015 images clearly impacted model alignment and hence the differencing. This is shown by areas in Figure 8 that display as pale yellow, indicating a slight (≤30 cm) offset between the models. As there was no erosion or deposition on the bedrock platform or in the fields to the north, this yellow tint reveals that lens corrections removed most but not all of the distortion. The residual effect is minor, however, and does not obscure the actual changes that occurred; as this study (in common with most geomorphic analyses) is interested in macroscopic change, the scale of the distortion does not affect the interpretations.

5.3. Quantitative Differencing via CloudCompare

The high resolution of the Agisoft models made boulder movement easily detectable in the CloudCompare output. Boulders that moved to new positions between 2015 and 2017 stand out in bright red (positive change in model surface elevation), while their previous locations are displayed as blue footprints (negative change).
Some boulders moved considerable distances along the platform; others simply rotated in place. Boulder movement was unequally distributed. Across most of the boulder ridge there were few or no changes. Differences between the 2015 and 2017 configurations are concentrated in two zones. First, on the west side, a patchy area ~10 m above high water, and >50 m inland lost substantial mass (blue in Figure 8) as many small (mostly 0.5–1 t) boulders were moved. Because sizable groups of contiguous boulders were removed, they display in the CloudCompare output as a more-or-less uniform surface lowering. Their new depositional locations are represented by a diffuse array of mass additions (warmer colors) elsewhere on the boulder ridge. Erosion in this area also revealed a paleosol formerly buried beneath the boulder ridge (Figure 9). Second, along the seaward edge of the boulder ridge, a large number of individually identifiable larger clasts were dislocated (red in Figure 10).
We tracked more than 100 individual boulders, of which the largest 18 are listed in Table 2. Sixteen of the largest boulders were located more than 8 m above high water. Of the 12 for which we know both the before and after positions, 9 were transported more than 5 m. The dominant transportation mode was simple translation, but a few boulders were rotated or overturned (Figure 11, Table 2). The largest single boulder (3 m × 3 m × 1 m, ~28 t) was flipped upright ~90°. The second largest (19 t) slid 7 m. The longest transport distance was 23 m by a 3-tonne boulder. Especially notable boulders include numbers 16, 17 and, 18 (Table 2), which were initially located 12 m above high water and ~60 m inland, and which by 2017 had moved 7–11 m further inland and gained 1–3 m in elevation (Figure 11).

6. Discussion

6.1 Effective, Efficient Methodology for Quantitative Repeat Photogrammetric Analysis

Digital cameras are rapidly evolving. Increasing resolutions and the ‘pixel-limit’ have been the subject of intense study recently, as sensors are being made smaller for use in smartphones [147,148,149,150]. The action cameras used in this study, at 12 megapixels, were high-resolution for drone-mounted cameras at the time we collected these data. But now, four years and five camera generations later, GoPro’s current model has 50% greater resolution at 18 megapixels (https://gopro.com/en/us/compare). Higher-end full-frame DSLR resolutions have similarly increased and at 40-60 megapixels or better, are currently more than double those of the action cameras. The point is that although image quality continues to increase, these technological changes do not affect scientists’ ability to conduct longitudinal studies that may have to integrate across multiple formats and levels of resolution. In the same way that legacy technologies such as black-and-white aerial photography were integrated into Geographic Information Systems studies [151,152], photogrammetry software is sufficiently versatile to normalize digital image sets with a wide range of resolutions.
The lens corrections applied to the fisheye GoPro images, although seeming somewhat drastic (Figure 6), were effective, resulting in an Agisoft model relatively free of distortion (Figure 8). Our results show that distorted source imagery can be addressed by simple tools that are not labor-intensive (e.g., Hastedt et al., 2016; Wierzbicki, 2018). The Agisoft model built from the corrected imagery was of sufficient quality to permit quantitative comparison with a model generated by a different camera. This finding demonstrates that hardware consistency between surveys is not critical for high-resolution quantitative differencing. Examination of the output (Figure 8), specifically the pale yellow colour of some areas where we know no change occurred (thus they should be green), shows that the quantitative effects of residual distortion are at scales ≤30 cm. Thus even with non-complete removal of lens effects, the quantitative comparison clearly reveals the substantive changes between models.
This approach could be useful to a variety of scientists. For example, those who may have changed imaging platforms in the past and did not consider linking their datasets across platforms, those who are hoping to change imaging platforms in the future (e.g., to take advantage of technological improvements) and are worried about preserving the consistency of their data, or to scientists and citizens who wish to collaborate through the compilation and comparison of datasets collected at different times or for different purposes on disparate platforms. Some have advised that GoPro fisheye imagery should be avoided in SfM studies (e.g., Mosbrucker et al., 2017), but this analysis shows that distorted imagery, appropriately corrected, can be used successfully for quantitative geomorphology.
The workflow implemented in this study is ideal for efficient repeat observations. This potential for producing four-dimensional data has already been realized in a range of studies [19,20,41,46,153,154]. Much of the procedure in Agisoft can be automated via custom scripts or the Batch Process option [105]. Thus, once an effective workflow has been prototyped and tested, repeating those operations with additional datasets is very time-efficient. CloudCompare has fewer automation options [136], but setting the software up to process models requires very little time once effective alignment parameters are established through testing.

6.2. Boulder Movement

Comparison of high-resolution SfM models demonstrates that between 2015 and 2017, at least some waves in the study area were capable of transporting boulders that weigh up to 26 t, situated at considerable elevations above high water and tens of meters inland. It is impossible to hind-cast exact characteristics of the waves that drove boulder movement, because interactions between wave size, wave approach angle, coastline shape, cliff height, bathymetry, and cliff-top boulders are complex [155]. The large number of boulders transported along the seaward edge of the boulder ridge, and the variable directions of boulder movement (See Figure 7 and Figure 10) suggest multiple rearrangement events.
The large numbers of ‘missing’ and ‘new’ boulders (Figure 7) exemplify the complex nature of boulder transport and the challenge of tracking the movement of specific boulders. ‘Missing’ boulders are those that were present in the 2015 model but could not be identified in the 2017 model, and ‘new’ boulders are those that were not identifiable in 2015 images but were observed in 2017. Missing boulders have three possible explanations: they could have been transported out of the study site (into the ocean, or out of the model’s field of view), they might have been buried under other clasts during rearrangement, or they might have been overturned, rendering them unrecognizable in the later photographs. There is no evidence that new boulders were quarried from the bedrock in this area, so ‘new‘ boulders in the 2017 images are probably boulders that were uncovered, overturned, or transported into the field of view.
The results highlight the need to observe CBD on a regular basis in order to document year-to-year changes. The data illustrate that boulders weighing tens of tonnes are moved on short timescales and also provide insights into the ways in which CBD are reshaped. These changes are relatively small, but over time could lead to significant reorganization of the deposits. Furthermore, the distributed nature of the changes—with small areas experiencing significant erosion while adjacent boulders of the same size distribution are unaffected—illustrates the stochastic nature of change in this environment.
The two models only capture the start and end points of boulder movement, so the measured transport distances (Table 2) are minima. Boulders may in fact have travelled greater distances along non-linear paths, possibly in more than one transportation event. For example, in Figure 12 (which incorporates additional data in the form of low-resolution aerial imagery from Bing), the net movement of the three boulders between 2012 and 2017 was only ~5 m to the east. However, the 2015 data reveal that between 2012 and 2015 the boulders moved ~10 m south, then moved ~10 m north-northeast between 2015 and 2017. The 2015 observation quadruples the interpolated distance travelled from 5 m to 20 m, and shows the highly dynamic nature of these deposits. Frequent observations would help better interpret such unpredictable and non-linear changes.

6.3. Advantages and Disadvantages of CloudCompare

CloudCompare is a robust and flexible open-source tool but does have some limitations. Most notable is its inability to save intermediate analysis steps. The comparison output file can be saved as a custom “.bin” file, but currently there is no way to preserve a save-state after importing a file, or after registration. For example, there is no option for saving progress after loading models into CloudCompare (a process that can take several minutes to over an hour depending on the file’s size and the storage medium’s read/write speed), but before registration. Nor is there an option to save the two clouds’ alignment once they have been registered. This requires that the entire comparison be run from start to finish without closing the CloudCompare application, and that a crash necessitates starting from scratch. Lastly, once the final comparison .bin file has been generated and saved, there is no way to go back and manually examine the two aligned clouds from which it was derived (i.e., in case an unusual artifact appears in the output).
CloudCompare was effective at identifying differences between models, enabling accurate calculations of volume change and volume redistribution. Tracking movement of individual objects, however, still requires non-trivial time investment by the user. In this study, we attempted to pair each blue ‘before’ boulder footprint with a red ‘after’ boulder in the comparison output so that boulder travel paths could be identified. However, this process was complicated by ’orphan‘ features, i.e., boulders that for which the corresponding origin footprint could not be identified, and likewise those origin footprints for which a corresponding boulder could not be found in the study area. Identifying the ‘before’ and ‘after’ boulder pairs required manually surveying the point clouds, meshes, and orthomosaics to try to match boulders by shape, texture, color, tone, and/or distinctive markings—a process that was laborious and time-consuming. It’s important to note, however, that trying to make those same measurements on images or models without the benefit of the CloudCompare analysis would have been far more time consuming.

7. Conclusions

The analysis of drone-derived SfM model time-series via CloudCompare is a promising technique for quantifying volumetric change over time. SfM data can be collected essentially on-demand with a small field team, and the resulting models can be very high resolution (1–10 cm/pixel) and can cover kilometer-scale areas. Comparing these models via CloudCompare allows rapid and repeatable analysis of change.
This study establishes that neither consistent imaging hardware nor deployment of GCPs are required to take advantage of CloudCompare’s quantitative differencing capabilities. The application of basic lens corrections in Adobe Lightroom and judicious choice of alignment parameters within CloudCompare enabled a model derived from GoPro fisheye imagery and built without GCPs to be successfully aligned with a fully georeferenced model derived from undistorted images. We hope that this finding encourages researchers to incorporate older or alternative photographic datasets in their own work, e.g., those produced with different hardware or incorporating different imaging parameters, permitting longer timelines for geomorphic comparison.
In this study, CloudCompare detected boulder movement down to sub-decimeter scale over a two-year period despite some minor residual distortion in the 2015 model. Boulders up to 28 t were rearranged, and scores of smaller boulders were moved and reorganized. These changes are much larger than conventional wisdom would suggest and indicate that the Aran Islands coastal boulder deposits are active on a yearly basis.
This study illustrates how CloudCompare provides a straightforward toolkit for quantifying change, both at the scale of individual boulders and for deposits as a whole. This potential for producing four-dimensional data using SfM has already been realized in a wide variety of fields (e.g., Bryson et al., 2012, 2013; Eltner et al., 2015, 2017; Gillan et al., 2017; Rossini et al., 2018), and the methodology described here could be widely adopted in disciplines other than geomorphology (e.g., ecology, land-use surveying). The ease of use and minimal training required mean that this methodology can be adopted by both expert and non-expert users, opening the door to rapid data acquisition, effective use of datasets collected with different hardware, and short-term monitoring of changing sites by researchers, citizen scientists, and other stakeholders. This is important as more frequent and detailed records are critical to developing a better understanding of CBD dynamics wave-event to event and the mechanisms behind boulder movement. With more data, specific wave events and their characteristics could be related to detailed CBD changes, and these connections could ultimately help build an empirical model of CBD evolution.

Author Contributions

Conceptualization, R.C.; methodology, R.C., & T.N.-M.; Investigation, R.C.; formal analysis, R.C. & T.N.-M.; resources, R.C.; data curation, T.N.-M.; writing—original draft preparation, T.N.-M.; writing—review and editing, R.C. & T.N.-M.; visualization, R.C. & T.N.-M.; supervision, R.C.; project administration, R.C.; funding acquisition, R.C. All authors have read and agreed to the published version of the manuscript.

Funding

This research was funded by the National Science Foundation, Grant #1529756.

Acknowledgments

Peter Cox (Williams College and petercox.ie) operated the drone and provided technical expertise in data collection. The authors thank Jacob Cytrynbaum for both his help in the field and his input on a preliminary version of this manuscript.

Conflicts of Interest

The authors declare no conflict of interest.

References

  1. Brunier, G.; Fleury, J.; Anthony, E.J.; Gardel, A.; Dussouillez, P. Close-range airborne Structure-from-Motion Photogrammetry for high-resolution beach morphometric surveys: Examples from an embayed rotating beach. Geomorphology 2016, 261, 76–88. [Google Scholar] [CrossRef]
  2. Casella, E.; Rovere, A.; Pedroncini, A.; Stark, C.P.; Casella, M.; Ferrari, M.; Firpo, M. Drones as tools for monitoring beach topography changes in the Ligurian Sea (NW Mediterranean). Geo-Mar. Lett. 2016, 36, 151–163. [Google Scholar] [CrossRef]
  3. Marteau, B.; Vericat, D.; Gibbins, C.; Batalla, R.J.; Green, D.R. Application of Structure-from-Motion photogrammetry to river restoration. Earth Surf. Process. Landf. 2017, 42, 503–515. [Google Scholar] [CrossRef] [Green Version]
  4. Woodget, A.S.; Austrums, R.; Maddock, I.P.; Habit, E. Drones and digital photogrammetry: From classifications to continuums for monitoring river habitat and hydromorphology. Wiley Interdiscip. Rev. Water 2017, 4, e1222. [Google Scholar] [CrossRef] [Green Version]
  5. Tamminga, A.D.; Eaton, B.C.; Hugenholtz, C.H. UAS-based remote sensing of fluvial change following an extreme flood event. Earth Surf. Process. Landf. 2015, 40, 1464–1476. [Google Scholar] [CrossRef]
  6. Marek, L.; Miřijovský, J.; Tuček, P. Monitoring of the Shallow Landslide Using UAV Photogrammetry and Geodetic Measurements BT. Engineering Geology for Society and Territory—Volume 2; Lollino, G., Giordan, D., Crosta, G.B., Corominas, J., Azzam, R., Wasowski, J., Sciarra, N., Eds.; Springer International Publishing: Cham, The Switzerland, 2015; pp. 113–116. [Google Scholar]
  7. Stumpf, A.; Malet, J.-P.; Kerle, N.; Niethammer, U.; Rothmund, S. Image-based mapping of surface fissures for the investigation of landslide dynamics. Geomorphology 2013, 186, 12–27. [Google Scholar] [CrossRef] [Green Version]
  8. Gomez, C.; Purdie, H. UAV-based photogrammetry and geocomputing for hazards and disaster risk monitoring–A review. Geo-Environ. Disasters 2016, 3, 23. [Google Scholar] [CrossRef] [Green Version]
  9. Bitelli, G.; Dubbini, M.; Zanutta, A. Terrestrial laser scanning and digital photogrammetry techniques to monitor landslide bodies. Int. Arch. Photogramm. Remote Sens. Spat. Inf. Sci. 2004, 35, 246–251. [Google Scholar]
  10. Lucieer, A.; Jong, S.M.; Turner, D. Mapping landslide displacements using Structure from Motion (SfM) and image correlation of multi-temporal UAV photography. Prog. Phys. Geogr. 2014, 38, 97–116. [Google Scholar] [CrossRef]
  11. Rossi, G.; Tanteri, L.; Tofani, V.; Vannocci, P.; Moretti, S.; Casagli, N. Multitemporal UAV surveys for landslide mapping and characterization. Landslides 2018, 15, 1045–1052. [Google Scholar] [CrossRef] [Green Version]
  12. Rossi, G.; Tanteri, L.; Salvatici, T.; Casagli, N. The use of multi-copter drones for landslide investigations. In Proceedings of the 3rd North American Symposium on Landslides, Roanoke, VA, USA, 4–8 June 2017; pp. 978–984. [Google Scholar]
  13. Suh, J.; Choi, Y. Mapping hazardous mining-induced sinkhole subsidence using unmanned aerial vehicle (drone) photogrammetry. Environ. Earth Sci. 2017, 76, 144. [Google Scholar] [CrossRef]
  14. Al-Halbouni, D.; Holohan, E.P.; Saberi, L.; Alrshdan, H.; Sawarieh, A.; Closson, D.; Walter, T.R.; Dahm, T. Sinkholes, subsidence and subrosion on the eastern shore of the Dead Sea as revealed by a close-range photogrammetric survey. Geomorphology 2017, 285, 305–324. [Google Scholar] [CrossRef] [Green Version]
  15. Gasperini, D.; Allemand, P.; Delacourt, C.; Grandjean, P. Potential and limitation of UAV for monitoring subsidence in municipal landfills. Int. J. Environ. Technol. Manag. 2014, 17, 1. [Google Scholar] [CrossRef]
  16. Gonçalves, J.A.; Henriques, R. UAV photogrammetry for topographic monitoring of coastal areas. ISPRS J. Photogramm. Remote Sens. 2015, 104, 101–111. [Google Scholar] [CrossRef]
  17. Barlow, J.; Gilham, J.; Ibarra Cofrã, I. Kinematic analysis of sea cliff stability using UAV photogrammetry. Int. J. Remote Sens. 2017, 38, 2464–2479. [Google Scholar] [CrossRef]
  18. Swirad, Z.M.; Rosser, N.J.; Brain, M.J. Identifying mechanisms of shore platform erosion using Structure-from-Motion (SfM) photogrammetry. Earth Surf. Process. Landf. 2019, 44, 1542–1588. [Google Scholar] [CrossRef] [Green Version]
  19. Bryson, M.; Johnson-Roberson, M.; Pizarro, O.; Williams, S. Automated registration for multi-year robotic surveys of marine benthic habitats. In Proceedings of the 2013 IEEE/RSJ International Conference on Intelligent Robots and Systems, Tokyo, Japan, 3–7 November 2013; pp. 3344–3349. [Google Scholar]
  20. Bryson, M.; Johnson-Roberson, M.; Pizarro, O.; Williams, S. Repeatable robotic surveying of marine benthic habitats for monitoring long-term change. In Proceedings of the Robotics Science and Systems, Sydney, Australia, 9–13 July 2012; pp. 3–7. [Google Scholar]
  21. Joyce, K.E.; Duce, S.; Leahy, S.M.; Leon, J.; Maier, S.W. Principles and practice of acquiring drone-based image data in marine environments. Mar. Freshw. Res. 2019, 70, 952–963. [Google Scholar] [CrossRef]
  22. Leon, J.X.; Roelfsema, C.M.; Saunders, M.I.; Phinn, S.R. Measuring coral reef terrain roughness using ‘Structure-from-Motion’close-range photogrammetry. Geomorphology 2015, 242, 21–28. [Google Scholar] [CrossRef]
  23. Burns, J.H.R.; Delparte, D.; Gates, R.D.; Takabayashi, M. Integrating structure-from-motion photogrammetry with geospatial software as a novel technique for quantifying 3D ecological characteristics of coral reefs. Life Environ. 2015, 3, e1077. [Google Scholar] [CrossRef]
  24. Casella, E.; Collin, A.; Harris, D.; Ferse, S.; Bejarano, S.; Parravicini, V.; Hench, J.L.; Rovere, A. Mapping coral reefs using consumer-grade drones and structure from motion photogrammetry techniques. Coral Reefs 2017, 36, 269–275. [Google Scholar] [CrossRef]
  25. Grenzdörffer, G.J.; Engel, A.; Teichert, B. The photogrammetric potential of low-cost UAVs in forestry and agriculture. Int. Arch. Photogramm. Remote Sens. Spat. Inf. Sci. 2008, 31, 1207–1214. [Google Scholar]
  26. Lisein, J.; Pierrot-Deseilligny, M.; Bonnet, S.; Lejeune, P. A photogrammetric workflow for the creation of a forest canopy height model from small unmanned aerial system imagery. Forests 2013, 4, 922–944. [Google Scholar] [CrossRef] [Green Version]
  27. Paneque-Gálvez, J.; McCall, M.K.; Napoletano, B.M.; Wich, S.A.; Koh, L.P. Small drones for community-based forest monitoring: An assessment of their feasibility and potential in tropical areas. Forests 2014, 5, 1481–1507. [Google Scholar] [CrossRef] [Green Version]
  28. Hixon, S.W.; Lipo, C.P.; Hunt, T.L.; Lee, C. Using Structure from Motion mapping to record and analyze details of the Colossal Hats (Pukao) of monumental statues on Rapa Nui (Easter Island). Adv. Archaeol. Pract. 2018, 6, 42–57. [Google Scholar] [CrossRef] [Green Version]
  29. Sapirstein, P. Accurate measurement with photogrammetry at large sites. J. Archaeol. Sci. 2016, 66, 137–145. [Google Scholar] [CrossRef]
  30. Meyer, D.E.; Lo, E.; Afshari, S.; Vaughan, A.; Rissolo, D.; Kuester, F. Utility of low-cost drones to generate 3D models of archaeological sites from multisensor data. SAA Archaeol. Rec. Mag. Soc. Am. Archaeol. 2016, 16, 22–24. [Google Scholar]
  31. Balletti, C.; Guerra, F.; Scocca, V.; Gottardi, C. 3D integrated methodologies for the documentation and the virtual reconstruction of an archaeological site. Int. Arch. Photogramm. Remote Sens. Spat. Inf. Sci. 2015, 40, 215–222. [Google Scholar] [CrossRef] [Green Version]
  32. Verhoeven, G. Taking computer vision aloft–archaeological three-dimensional reconstructions from aerial photographs with photoscan. Archaeol. Prospect. 2011, 18, 67–73. [Google Scholar] [CrossRef]
  33. Nikolakopoulos, K.G.; Soura, K.; Koukouvelas, I.K.; Argyropoulos, N.G. UAV vs classical aerial photogrammetry for archaeological studies. J. Archaeol. Sci. Rep. 2017, 14, 758–773. [Google Scholar] [CrossRef]
  34. Smith, N.G.; Passone, L.; al-Said, S.; al-Farhan, M.; Levy, T.E. Drones in Archaeology: Integrated Data Capture, Processing, and Dissemination in the al-Ula Valley, Saudi Arabia. Near East. Archaeol. 2014, 77, 176–181. [Google Scholar] [CrossRef]
  35. Semaan, L.; Salama, M.S. Underwater Photogrammetric Recording at the Site of Anfeh, Lebanon BT. In 3D Recording and Interpretation for Maritime Archaeology; McCarthy, J.K., Benjamin, J., Winton, T., Van Duivenvoorde, W., Eds.; Springer International Publishing: Cham, The Switzerland, 2019; pp. 67–87. ISBN 978-3-030-03635-5. [Google Scholar]
  36. Yamazaki, F.; Matsuda, T.; Denda, S.; Liu, W. Construction of 3D models of buildings damaged by earthquakes using UAV aerial images. In Proceedings of the Tenth Pacific Conference Earthquake Engineering Building an Earthquake-Resilient Pacific, McKinnon, Australia, 6–8 November 2015; pp. 6–8. [Google Scholar]
  37. Ridolfi, E.; Buffi, G.; Venturi, S.; Manciola, P. Accuracy analysis of a dam model from drone surveys. Sensors 2017, 17, 1777. [Google Scholar] [CrossRef] [PubMed] [Green Version]
  38. Pacifici, F.; Chini, M.; Emery, W.J. A neural network approach using multi-scale textural metrics from very high-resolution panchromatic imagery for urban land-use classification. Remote Sens. Environ. 2009, 113, 1276–1292. [Google Scholar] [CrossRef]
  39. Yeum, C.M.; Choi, J.; Dyke, S.J. Autonomous image localization for visual inspection of civil infrastructure. Smart Mater. Struct. 2017, 26, 35051. [Google Scholar] [CrossRef]
  40. Francesco, G.; Emanuele, B. Inspection of Components with the Support of the Drones. Int. Res. J. Eng. Technol. 2018, 5, 1784–1789. [Google Scholar]
  41. Eltner, A.; Kaiser, A.; Abellan, A.; Schindewolf, M. Time lapse structure-from-motion photogrammetry for continuous geomorphic monitoring. Earth Surf. Process. Landf. 2017, 42, 2240–2253. [Google Scholar] [CrossRef]
  42. Pádua, L.; Vanko, J.; Hruška, J.; Adão, T.; Sousa, J.J.; Peres, E.; Morais, R. UAS, sensors, and data processing in agroforestry: A review towards practical applications. Int. J. Remote Sens. 2017, 38, 2349–2391. [Google Scholar] [CrossRef]
  43. Colomina, I.; Molina, P. Unmanned aerial systems for photogrammetry and remote sensing: A review. ISPRS J. Photogramm. Remote Sens. 2014, 92, 79–97. [Google Scholar] [CrossRef] [Green Version]
  44. Suomalainen, J.; Anders, N.; Iqbal, S.; Roerink, G.; Franke, J.; Wenting, P.; Hünniger, D.; Bartholomeus, H.; Becker, R.; Kooistra, L. A Lightweight Hyperspectral Mapping System and Photogrammetric Processing Chain for Unmanned Aerial Vehicles. Remote Sens. 2014, 6, 11013–11030. [Google Scholar] [CrossRef] [Green Version]
  45. Nolan, M.; Larsen, C.F.; Sturm, M. Mapping snow-depth from manned-aircraft on landscape scales at centimeter resolution using Structure-from-Motion photogrammetry. Cryosph. Discuss. TCD 2015, 9, 333–381. [Google Scholar] [CrossRef]
  46. Gillan, K.J.; Karl, W.J.; Elaksher, A.; Duniway, C.M. Fine-Resolution Repeat Topographic Surveying of Dryland Landscapes Using UAS-Based Structure-from-Motion Photogrammetry: Assessing Accuracy and Precision against Traditional Ground-Based Erosion Measurements. Remote Sens. 2017, 9, 437. [Google Scholar] [CrossRef] [Green Version]
  47. Micheletti, N.; Chandler, J.H.; Lane, S.N. Structure from motion (SFM) photogrammetry. In Geomorphological Techniques, Online Edition; Clarke, L.E., Nield, J.M., Eds.; Society for Geomorphology: London, UK, 2015; Chapter 2, Section 2.2; ISSN 2047-0371. [Google Scholar]
  48. Girardeau-Montaut, D.C. 3D Point Cloud and Mesh Processing Software. Telecom ParisTechs 2017. Available online: https://pastel.archives-ouvertes.fr/pastel-00001745/ (accessed on 1 November 2019).
  49. Girardeau-Montaut, D. Cloud compare—3d point cloud and mesh processing software. Open Source Project. 2019. Available online: https://www.danielgm.net/cc/ (accessed on 1 November 2019).
  50. Cosso, T.; Ferrando, I.; Orlando, A. Surveying and mapping a cave using 3D Laser scanner: The open challenge with free and open source software. Int. Arch. Photogramm. Remote Sens. Spat. Inf. Sci. 2014, 40, 181–186. [Google Scholar] [CrossRef] [Green Version]
  51. Będkowski, J.; Pełka, M.; Majek, K.; Fitri, T.; Naruniec, J. Open source robotic 3D mapping framework with ROS—Robot Operating System, PCL—Point Cloud Library and Cloud Compare. In Proceedings of the 2015 International Conference on Electrical Engineering and Informatics (ICEEI), Denpasar, Indonesia, 10–11 August 2015; pp. 644–649. [Google Scholar]
  52. Lieberwirth, U.; Metz, M.; Neteler, M.; Kühnle, K. Applying low budget equipment and open source software for high resolution documentation of archaeological stratigraphy and features. In Papers from the 41st Conference on Computer Applications and Quantitative Methods in Archaeology; Amsterdam University Press: Amsterdam, The Netherlands, 2013; pp. 55–64. [Google Scholar]
  53. Abed, F.M.; Mohammed, M.U.; Mohammed, M.U.; Kadhim, S.J. Architectural and Cultural Heritage conservation using low-cost cameras. Appl. Res. J. 2017, 3, 376–384. [Google Scholar]
  54. Stumpf, A.; Malet, J.-P.; Allemand, P.; Pierrot-Deseilligny, M.; Skupinski, G. Ground-based multi-view photogrammetry for the monitoring of landslide deformation and erosion. Geomorphology 2015, 231, 130–145. [Google Scholar] [CrossRef]
  55. Esposito, G.; Mastrorocco, G.; Salvini, R.; Oliveti, M.; Starita, P. Application of UAV photogrammetry for the multi-temporal estimation of surface extent and volumetric excavation in the Sa Pigada Bianca open-pit mine, Sardinia, Italy. Environ. Earth Sci. 2017, 76, 103. [Google Scholar] [CrossRef]
  56. Duffy, P.J.; Shutler, D.J.; Witt, J.M.; DeBell, L.; Anderson, K. Tracking Fine-Scale Structural Changes in Coastal Dune Morphology Using Kite Aerial Photography and Uncertainty-Assessed Structure-from-Motion Photogrammetry. Remote Sens. 2018, 10, 1494. [Google Scholar] [CrossRef] [Green Version]
  57. Tung, W.Y.; Nagendran, S.K.; Mohamad Ismail, M.A. 3D rock slope data acquisition by photogrammetry approach and extraction of geological planes using FACET plugin in CloudCompare. IOP Conf. Ser. Earth Environ. Sci. 2018, 169, 012051. [Google Scholar] [CrossRef]
  58. Hastedt, H.; Ekkela, T.; Luhmann, T. Evaluation of the quality of action cameras with wide-Angle lenses in uav photogrammetry. Int. Arch. Photogramm. Remote Sens. Spat. Inf. Sci. 2016, 2016, 851–859. [Google Scholar] [CrossRef]
  59. Wierzbicki, D. Multi-camera imaging system for UAV photogrammetry. Sensors 2018, 18, 2433. [Google Scholar] [CrossRef] [Green Version]
  60. Di Franco, C.; Buttazzo, G. Coverage Path Planning for UAVs Photogrammetry with Energy and Resolution Constraints. J. Intell. Robot. Syst. Theory Appl. 2016, 83, 445–462. [Google Scholar] [CrossRef]
  61. Mustard, J.F.; Adler, M.; Allwood, A.; Bass, D.S.; Beaty, D.W.; Bell, J.F.; Brinckerhoff, W.B.; Carr, M.; Des Marais, D.J.; Drake, B.; et al. Report of the Mars 2020 Science Definition Team. Mars Explor. Progr. Anal. Gr. 2013, 150, 155–205. [Google Scholar]
  62. Zhang, H.; Aldana-Jague, E.; Clapuyt, F.; Wilken, F.; Vanacker, V.; Van Oost, K. Evaluating the potential of post-processing kinematic (PPK) georeferencing for UAV-based structure-from-motion (SfM) photogrammetry and surface change detection. Earth Surf. Dyn. 2019, 7, 827. [Google Scholar] [CrossRef] [Green Version]
  63. Wierzbicki, D.; Nienaltowski, M. Accuracy Analysis of a 3D Model of Excavation, Created from Images Acquired with an Action Camera from Low Altitudes. ISPRS Int. J. Geo-Inf. 2019, 8, 83. [Google Scholar] [CrossRef] [Green Version]
  64. Mosbrucker, A.R.; Major, J.J.; Spicer, K.R.; Pitlick, J. Camera system considerations for geomorphic applications of SfM photogrammetry. Earth Surf. Process. Landf. 2017, 42, 969–986. [Google Scholar] [CrossRef] [Green Version]
  65. Cox, R.; Jahn, K.L.; Watkins, O.G.; Cox, P. Extraordinary boulder transport by storm waves (west of Ireland, winter 2013–2014), and criteria for analysing coastal boulder deposits. Earth-Sci. Rev. 2018, 177, 623–636. [Google Scholar] [CrossRef]
  66. Nott, J. Extremely high-energy wave deposits inside the Great Barrier Reef, Australia: Determining the cause—tsunami or tropical cyclone. Mar. Geol. 1997, 141, 193–207. [Google Scholar] [CrossRef]
  67. Kennedy, A.B.; Mori, N.; Zhang, Y.; Yasuda, T.; Chen, S.-E.; Tajima, Y.; Pecor, W.; Toride, K. Observations and modeling of coastal boulder transport and loading during Super Typhoon Haiyan. Coast. Eng. J. 2016, 58, 1640004. [Google Scholar] [CrossRef]
  68. Kennedy, A.B.; Mori, N.; Yasuda, T.; Shimozono, T.; Tomiczek, T.; Donahue, A.; Shimura, T.; Imai, Y. Extreme block and boulder transport along a cliffed coastline (Calicoan Island, Philippines) during Super Typhoon Haiyan. Mar. Geol. 2017, 383, 65–77. [Google Scholar] [CrossRef] [Green Version]
  69. Hall, A.M.; Hansom, J.D.; Williams, D.M.; Jarvis, J. Distribution, geomorphology and lithofacies of cliff-top storm deposits: Examples from the high-energy coasts of Scotland and Ireland. Mar. Geol. 2006, 232, 131–155. [Google Scholar] [CrossRef]
  70. Williams, D.M.; Hall, A.M. Cliff-top megaclast deposits of Ireland, a record of extreme waves in the North Atlantic—storms or tsunamis? Mar. Geol. 2004, 206, 101–117. [Google Scholar] [CrossRef]
  71. Miller, S.; Rowe, D.-A.; Brown, L.; Mandal, A. Wave-emplaced boulders: Implications for development of prime real estate seafront, North Coast Jamaica. Bull. Eng. Geol. Environ. 2014, 73, 109–122. [Google Scholar] [CrossRef]
  72. Barbano, M.S.; Pirrotta, C.; Gerardi, F. Large boulders along the south-eastern Ionian coast of Sicily: Storm or tsunami deposits? Mar. Geol. 2010, 275, 140–154. [Google Scholar] [CrossRef]
  73. Biolchi, S.; Furlani, S.; Antonioli, F.; Baldassini, N.; Deguara, J.C.; Devoto, S.; Stefano, A.D.; Evans, J.; Gambin, T.; Gauci, R. Boulder accumulations related to extreme wave events on the eastern coast of Malta. Nat. Hazards Earth Syst. 2016. [Google Scholar] [CrossRef] [Green Version]
  74. Mastronuzzi, G.; Sansò, P. Boulders transport by catastrophic waves along the Ionian coast of Apulia (southern Italy). Mar. Geol. 2000, 170, 93–103. [Google Scholar] [CrossRef]
  75. Mastronuzzi, G.; Pignatelli, C.; Sansò, P.; Selleri, G. Boulder accumulations produced by the 20th of February, 1743 tsunami along the coast of southeastern Salento (Apulia region, Italy). Mar. Geol. 2007, 242, 191–205. [Google Scholar] [CrossRef]
  76. Cox, R.; Zentner, D.B.; Kirchner, B.J.; Cook, M.S. Boulder ridges on the Aran Islands (Ireland): Recent movements caused by storm waves, not tsunamis. J. Geol. 2012, 120, 249–272. [Google Scholar] [CrossRef] [Green Version]
  77. Autret, R.; Dodet, G.; Fichaut, B.; Suanez, S.; David, L.; Leckler, F.; Ardhuin, F.; Ammann, J.; Grandjean, P.; Allemand, P. A comprehensive hydro-geomorphic study of cliff-top storm deposits on Banneg Island during winter 2013–2014. Mar. Geol. 2016, 382, 37–55. [Google Scholar] [CrossRef] [Green Version]
  78. Etienne, S.; Paris, R. Boulder accumulations related to storms on the south coast of the Reykjanes Peninsula (Iceland). Geomorphology 2010, 114, 55–70. [Google Scholar] [CrossRef]
  79. Nott, J. The tsunami hypothesis—Comparisons of the field evidence against the effects, on the Western Australian coast, of some of the most powerful storms on Earth. Mar. Geol. 2004, 208, 1–12. [Google Scholar] [CrossRef]
  80. Shah-hosseini, M.; Morhange, C.; Beni, A.N.; Marriner, N.; Lahijani, H.; Hamzeh, M.; Sabatier, F. Coastal boulders as evidence for high-energy waves on the Iranian coast of Makran. Mar. Geol. 2011, 290, 17–28. [Google Scholar] [CrossRef]
  81. Hoffmann, G.; Reicherter, K.; Wiatr, T.; Grützner, C.; Rausch, T. Block and boulder accumulations along the coastline between Fins and Sur (Sultanate of Oman): Tsunamigenic remains? Nat. Hazards 2013, 65, 851–873. [Google Scholar] [CrossRef]
  82. Boesl, F.; Engel, M.; Eco, R.C.; Galang, J.N.B.; Gonzalo, L.A.; Llanes, F.; Quix, E.; Brückner, H. Digital mapping of coastal boulders—high-resolution data acquisition to infer past and recent transport dynamics. Sedimentology 2019. [Google Scholar] [CrossRef]
  83. Khan, S.; Robinson, E.; Rowe, D.-A.; Coutou, R. Size and mass of shoreline boulders moved and emplaced by recent hurricanes, Jamaica. Z. Geomorphol. Suppl. Issues 2010, 54, 281–299. [Google Scholar] [CrossRef]
  84. Glumac, B.; Curran, A. Documenting the Generation and Transport of Large Rock Boulders by Storm Waves Along the High-energy Southern Coast of San Salvador Island, Bahamas (EP23C-2296). In Proceedings of the 2018 AGU Fall Meeting, Washington, DC, USA, 10–14 December 2018. [Google Scholar]
  85. Wilson, K.; Hassenruck-Gudipati, H.J.; Mason, J.; Schroeder, C.L.; Smith, B.; Mohrig, D.C. Coastal impacts from far field storms-Evidence from Eleuthera, The Bahamas (EP13A-06). Presented at the 2018 AGU Fall Meeting, Washington, DC, USA, 10–14 December 2018. [Google Scholar]
  86. Cox, R.; Hearty, P.J.; Russell, D.; Edwards, K.R. Comparison of coastal boulder deposits (Holocene Age) on Eleuthera, Bahamas, with storm-transported boulders on Aran Islands, Ireland. Available online: https://gsa.confex.com/gsa/2016AM/webprogram/Paper281076.html (accessed on 30 September 2016).
  87. Salzmann, L.; Green, A. Boulder emplacement on a tectonically stable, wave-dominated coastline, Mission Rocks, northern KwaZulu-Natal, South Africa. Mar. Geol. 2012, 323, 95–106. [Google Scholar] [CrossRef]
  88. Cox, R.; O’Boyle, L.; Cytrynbaum, J. Imbricated Coastal Boulder Deposits are Formed by Storm Waves, and Can Preserve a Long-Term Storminess Record. Sci. Rep. 2019, 9, 10784. [Google Scholar] [CrossRef]
  89. Fichaut, B.; Suanez, S. Quarrying, transport and deposition of cliff-top storm deposits during extreme events: Banneg Island, Brittany. Mar. Geol. 2011, 283, 36–55. [Google Scholar] [CrossRef]
  90. Lorang, M.S. A wave-competence approach to distinguish between boulder and megaclast deposits due to storm waves versus tsunamis. Mar. Geol. 2011, 283, 90–97. [Google Scholar] [CrossRef]
  91. Medina, F.; Mhammdi, N.; Chiguer, A.; Akil, M.; Jaaidi, E.B. The Rabat and Larache boulder fields; new examples of high-energy deposits related to storms and tsunami waves in north-western Morocco. Nat. Hazards 2011, 59, 725. [Google Scholar] [CrossRef]
  92. Switzer, A.D.; Burston, J.M. Competing mechanisms for boulder deposition on the southeast Australian coast. Geomorphology 2010, 114, 42–54. [Google Scholar] [CrossRef]
  93. Scheffers, A.M.; Kinis, S. Stable imbrication and delicate/unstable settings in coastal boulder deposits: Indicators for tsunami dislocation? Quat. Int. 2014, 332, 73–84. [Google Scholar] [CrossRef]
  94. Paris, R.; Naylor, L.A.; Stephenson, W.J. Boulders as a Signature of Storms on Rock Coasts. Mar. Geogl. 2011, 283, 1–11. [Google Scholar] [CrossRef]
  95. Erdmann, W.; Kelletat, D.; Scheffers, A. Boulder transport by storms—Extreme-waves in the coastal zone of the Irish west coast. Mar. Geol. 2018, 399, 1–13. [Google Scholar] [CrossRef]
  96. Schmitt, P.; Cox, R.; Dias, F.; O’Boyle, L.; Whittaker, T. Field measurements of extreme waves in the intertidal zone (EGU2019-15785). In Proceedings of the Geophys Research Abstracts, Aran Islands, Ireland, 7–12 April 2019. [Google Scholar]
  97. Langridge, D. Limestone pavement patterns on the Island of Inishmore Co. Galway. Irish Geogr. 1971, 6, 282–293. [Google Scholar] [CrossRef]
  98. Scheffers, A.; Kelletat, D.; Haslett, S.; Scheffers, S.; Browne, T. Coastal boulder deposits in Galway Bay and the Aran Islands, western Ireland. Z. Geomorphol. Suppl. Issues 2010, 54, 247–279. [Google Scholar] [CrossRef]
  99. Cox, R.; Ardhuin, F.; Dias, F.; Autret, R.; Beisiegel, N.; Earlie, C.S.; Herterich, J.G.; Kennedy, A.; Paris, R.; Raby, A.; et al. Boulders deposited by storm waves can be misinterpreted as tsunami-related because commonly used hydrodynamic equations are flawed. Front. Mar. Sci. Rev. 2012, 63, 5–30. [Google Scholar]
  100. Cox, R. Movie Man of Aran as a documentary source for studying boulder transport by storm waves. In Proceedings of the 2013 GSA Annual Meeting in Denver, Denver, CO, USA, 27–30 October 2013. [Google Scholar]
  101. Mohan, M.; Silva, C.A.; Klauberg, C.; Jat, P.; Catts, G.; Cardil, A.; Hudak, A.T.; Dia, M. Individual tree detection from unmanned aerial vehicle (UAV) derived canopy height model in an open canopy mixed conifer forest. Forests 2017, 8, 340. [Google Scholar] [CrossRef] [Green Version]
  102. Henry, J.; Malet, J.; Maquaire, O.; Grussenmeyer, P. The use of small-format and low-altitude aerial photos for the realization of high-resolution DEMs in mountainous areas: Application to the Super-Sauze earthflow (Alpes-de-Haute-Provence, France). Earth Surf. Process. Landf. J. Br. Geomorphol. Res. Gr. 2002, 27, 1339–1350. [Google Scholar] [CrossRef] [Green Version]
  103. Torres-Sánchez, J.; López-Granados, F.; Borra-Serrano, I.; Peña, J.M. Assessing UAV-collected image overlap influence on computation time and digital surface model accuracy in olive orchards. Precis. Agric. 2018, 19, 115–133. [Google Scholar] [CrossRef]
  104. Mesas-Carrascosa, F.-J.; Notario García, M.; Meroño de Larriva, J.; García-Ferrer, A. An analysis of the influence of flight parameters in the generation of unmanned aerial vehicle (UAV) orthomosaicks to survey archaeological areas. Sensors 2016, 16, 1838. [Google Scholar] [CrossRef] [Green Version]
  105. Agisoft LLC Agisoft Metashape User Manual Professional Edition, Version 1.5. Available online: https://www. agisoft.com/pdf/metashape-pro_1_5_en. pdf (accessed on 2 June 2018).
  106. Barazzetti, L.; Scaioni, M.; Remondino, F. Orientation and 3D modelling from markerless terrestrial images: Combining accuracy with automation. Photogramm. Rec. 2010, 25, 356–381. [Google Scholar] [CrossRef]
  107. Nikolakopoulos, K.; Kavoura, K.; Depountis, N.; Kyriou, A.; Argyropoulos, N.; Koukouvelas, I.; Sabatakakis, N. Preliminary results from active landslide monitoring using multidisciplinary surveys. Eur. J. Remote Sens. 2017, 50, 280–299. [Google Scholar] [CrossRef] [Green Version]
  108. Jin, H. Metadata Based Alignment of Distorted Images. U.S. Patent US8830347B2, 9 September 2014. [Google Scholar]
  109. Jin, H. Metadata-Driven Method and Apparatus for Automatically Aligning Distorted Images. U.S. Patent US8368773B1, 5 February 2013. [Google Scholar]
  110. Chen, S.; Jin, H.; Chien, J.-C.; Goldman, D.R. Methods and Apparatus for Camera Calibration Based on Multiview Image Geometry. U.S. Patent US8368762B1, 5 February 2013. [Google Scholar]
  111. Jin, H. Method and Apparatus for Aligning and Unwarping Distorted Images. U.S. Patent US8391640B1, 12 December 2013. [Google Scholar]
  112. Paris, S.; Kee, E.R.; Chen, S.; Wang, J. Lens Modeling. U.S. Patent US9235063B2, 12 January 2016. [Google Scholar]
  113. Chen, S.; Chien, J.-C.; Jin, H. Method and Apparatus for Matching Image Metadata to a Profile Database to Determine Image Processing Parameters. U.S. Patent US8194993B1, 5 June 2012. [Google Scholar]
  114. Chen, S.; Chan, E.; Jin, H.; Chien, J.-C. Methods and Apparatus for Retargeting and Prioritized Interpolation of Lens Profiles. U.S. Patent US20130124159A1, 4 July 2013. [Google Scholar]
  115. Harwin, S.; Lucieer, A.; Osborn, J. The impact of the calibration method on the accuracy of point clouds derived using unmanned aerial vehicle multi-view stereopsis. Remote Sens. 2015, 7, 11933–11953. [Google Scholar] [CrossRef] [Green Version]
  116. Sanz-Ablanedo, E.; Chandler, J.H.; Rodríguez-Pérez, J.R.; Ordóñez, C. Accuracy of Unmanned Aerial Vehicle (UAV) and SfM photogrammetry survey as a function of the number and location of ground control points used. Remote Sens. 2018, 10, 1606. [Google Scholar] [CrossRef] [Green Version]
  117. Bakker, M.; Lane, S.N. Archival photogrammetric analysis of river–floodplain systems using Structure from Motion (SfM) methods. Earth Surf. Process. Landf. 2017, 42, 1274–1286. [Google Scholar] [CrossRef] [Green Version]
  118. James, M.R.; Robson, S.; d’Oleire-Oltmanns, S.; Niethammer, U. Optimising UAV topographic surveys processed with structure-from-motion: Ground control quality, quantity and bundle adjustment. Geomorphology 2017, 280, 51–66. [Google Scholar] [CrossRef] [Green Version]
  119. Terpstra, T.; Dickinson, J.; Hashemian, A. Using Multiple Photographs and USGS LiDAR to Improve Photogrammetric Accuracy. SAE Int. J. Trans. Saf. 2018, 6, 193–216. [Google Scholar] [CrossRef]
  120. Jeong, H.; Ahn, H.; Park, J.; Kim, H.; Kim, S.; Lee, Y.; Choi, C. Feasibility of Using an Automatic Lens Distortion Correction (ALDC) Camera in a Photogrammetric UAV System. J. Korean Soc. Surv. Geod. Photogramm. Cartogr. 2015, 33, 475–483. [Google Scholar] [CrossRef] [Green Version]
  121. Verma, A.K.; Bourke, M.C. A method based on structure-from-motion photogrammetry to generate sub-millimetre-resolution digital elevation models for investigating rock breakdown features. Earth Surf. Dyn. 2019, 7, 45–66. [Google Scholar] [CrossRef] [Green Version]
  122. Neale, W.T.; Hessel, D.; Terpstra, T. Photogrammetric measurement error associated with lens distortion. SAE Tech. Pap. 2011. [Google Scholar] [CrossRef] [Green Version]
  123. Barbasiewicz, A.; Widerski, T.; Daliga, K. The analysis of the accuracy of spatial models using photogrammetric software: Agisoft Photoscan and Pix4D. In Proceedings of the E3S Web of Conferences, Gdansk, Poland, 22–25 June 2017; p. 12. [Google Scholar]
  124. Jaud, M.; Passot, S.; Le Bivic, R.; Delacourt, C.; Grandjean, P.; Le Dantec, N. Assessing the accuracy of high resolution digital surface models computed by PhotoScan® and MicMac® in sub-optimal survey conditions. Remote Sens. 2016, 8, 465. [Google Scholar] [CrossRef] [Green Version]
  125. Li, X.Q.; Chen, Z.A.; Zhang, L.T.; Jia, D. Construction and Accuracy Test of a 3D Model of Non-Metric Camera Images Using Agisoft PhotoScan. Procedia Environ. Sci. 2016, 36, 184–190. [Google Scholar] [CrossRef] [Green Version]
  126. Tavani, S.; Granado, P.; Corradetti, A.; Girundo, M.; Iannace, A.; Arbués, P.; Muñoz, J.A.; Mazzoli, S. Building a virtual outcrop, extracting geological information from it, and sharing the results in Google Earth via OpenPlot and Photoscan: An example from the Khaviz Anticline (Iran). Comput. Geosci. 2014, 63, 44–53. [Google Scholar] [CrossRef]
  127. Esposito, G.; Salvini, R.; Matano, F.; Sacchi, M.; Danzi, M.; Somma, R.; Troise, C. Multitemporal monitoring of a coastal landslide through SfM-derived point cloud comparison. Photogramm. Rec. 2017, 32, 459–479. [Google Scholar] [CrossRef] [Green Version]
  128. Smith, M.W.; Vericat, D. From experimental plots to experimental landscapes: Topography, erosion and deposition in sub-humid badlands from structure-from-motion photogrammetry. Earth Surf. Process. Landf. 2015, 40, 1656–1671. [Google Scholar] [CrossRef] [Green Version]
  129. Miles, J.; Pitts, M. Photogrammetry and RTI Survey of Hoa Hakananai’a Easter Island Statue. In Papers from the 41st Conference on Computer Applications and Quantitative Methods in Archaeology; Amsterdam University Press: Amsterdam, The Netherlands, 2013; pp. 144–156. [Google Scholar]
  130. Yamafune, K. Using Computer Vision Photogrammetry (Agisoft Photoscan) to Record and Analyze Underwater Shipwreck Sites. Available online: https://oaktrust.library.tamu.edu/handle/1969.1/156847 (accessed on 2 June 2016).
  131. Fraser, B.T.; Congalton, R.G. Issues in Unmanned Aerial Systems (UAS) data collection of complex forest environments. Remote Sens. 2018, 10, 908. [Google Scholar] [CrossRef] [Green Version]
  132. Rush, G.P.; Clarke, L.E.; Stone, M.; Wood, M.J. Can drones count gulls? Minimal disturbance and semiautomated image processing with an unmanned aerial vehicle for colony-nesting seabirds. Ecol. Evol. 2018, 8, 12322–12334. [Google Scholar] [CrossRef] [PubMed]
  133. Casana, J.; Wiewel, A.; Cool, A.; Hill, A.C.; Fisher, K.D.; Laugier, E.J. Archaeological aerial thermography in theory and practice. Adv. Archaeol. Pract. 2017, 5, 310–327. [Google Scholar] [CrossRef] [Green Version]
  134. Gillan, J.K.; McClaran, M.P.; Swetnam, T.L.; Heilman, P. Estimating forage utilization with drone-based photogrammetric point clouds. Rangel. Ecol. Manag. 2019, 72, 575–585. [Google Scholar] [CrossRef]
  135. Mayer, C.; Pereira, L.M.G.; Kersten, T.P. A Comprehensive Workflow to Process UAV Images for the Efficient Production of Accurate Geo-information. In Proceedings of the IX National Conference on Cartography and Geodesy, Amadora, Portugal, 25–26 October 2018. [Google Scholar]
  136. Girardeau-Montaut, D. CloudCompare Version 2.6. 1 User Manual. Available online: http://www.danielgm.net/cc/doc/qCC/CloudCompare v2 (accessed on 1 November 2019).
  137. Lague, D.; Brodu, N.; Leroux, J. Accurate 3D comparison of complex topography with terrestrial laser scanner: Application to the Rangitikei canyon (NZ). ISPRS J. Photogramm. Remote Sens. 2013, 82, 10–26. [Google Scholar] [CrossRef] [Green Version]
  138. Alouache, A.; Yao, X.; Wu, Q. Creating Textured 3D Models from Image Collections using Open Source Software. Int. J. Comput. Appl. 2017, 163, 14–19. [Google Scholar] [CrossRef]
  139. Rajendra, Y.D.; Mehrotra, S.C.; Kale, K.V.; Manza, R.R.; Dhumal, R.K.; Nagne, A.D.; Vibhute, A.D. Evaluation of Partially Overlapping 3D Point Cloud’s Registration by using ICP variant and CloudCompare. Int. Arch. Photogramm. Remote Sens. Spat. Inf. Sci. 2014, 40, 891. [Google Scholar] [CrossRef] [Green Version]
  140. Wu, M.L.; Chien, J.C.; Wu, C.T.; Lee, J. Der An augmented reality system using improved-iterative closest point algorithm for on-patient medical image visualization. Sensors 2018, 18, 2505. [Google Scholar] [CrossRef] [PubMed] [Green Version]
  141. Holst, C.; Klingbeil, L.; Esser, F.; Kuhlmann, H. Using point cloud comparisons for revealing deformations of natural and artificial objects. In Proceedings of the 7th International Conference on Engineering Surveying (INGEO 2017), Lisbon, Portugal, 18–20 October 2017; pp. 265–274. [Google Scholar]
  142. Chen, H.; Zhao, X.; Luo, J.; Yang, Z.; Zhao, Z.; Wan, H.; Ye, X.; Weng, G.; He, Z.; Dong, T. Towards Generation and Evaluation of Comprehensive Mapping Robot Datasets. arXiv 2019, arXiv:1905.09483. [Google Scholar]
  143. Vasilakos, C.; Chatzistamatis, S.; Roussou, O.; Soulakellis, N. Terrestrial photogrammetry vs Laser Scanning for rapid earthquake damage assessment. Int. Arch. Photogramm. Remote Sens. Spat. Inf. Sci. 2018, 42, 527–533. [Google Scholar] [CrossRef] [Green Version]
  144. Monserrat, O.; Crosetto, M. Deformation measurement using terrestrial laser scanning data and least squares 3D surface matching. ISPRS J. Photogramm. Remote Sens. 2008, 63, 142–154. [Google Scholar] [CrossRef]
  145. Benito-Calvo, A.; Arroyo, A.; Sánchez-Romero, L.; Pante, M.; De La Torre, I. Quantifying 3D Micro-Surface Changes on Experimental Stones Used to Break Bones and Their Implications for the Analysis of Early Stone Age Pounding Tools. Archaeometry 2018, 60, 419–436. [Google Scholar] [CrossRef]
  146. Martínez-Espejo Zaragoza, I.; Caroti, G.; Piemonte, A.; Riedel, B.; Tengen, D.; Niemeier, W. Structure from motion (SfM) processing of UAV images and combination with terrestrial laser scanning, applied for a 3D-documentation in a hazardous situation. Geomat. Nat. Hazards Risk 2017, 8, 1492–1504. [Google Scholar] [CrossRef]
  147. Chen, T.; Catrysse, P.B.; Gamal, A.E.; Wandell, B.A. How small should pixel size be? In Proceedings of the SPIE, San Jose, CA, USA, 15 May 2000; Volume 3965. [Google Scholar] [CrossRef]
  148. Farrell, J.; Xiao, F.; Kavusi, S. Resolution and light sensitivity tradeoff with pixel size. In Proceeding of the SPIE, San Jose, CA, USA, 10 February 2006; Volume 6069. [Google Scholar] [CrossRef]
  149. Eid, E. Study of limitations on pixel size of very high resolution image sensors. In Proceedings of the Eighteenth National Radio Science Conference, NRSC2001 (IEEE Cat. No.01EX462), Mansoura, Egypt, 27–29 March 2001; Volume 1, pp. 15–28. [Google Scholar] [CrossRef]
  150. Jiang, C.; Song, J. An Ultrahigh-Resolution Digital Image Sensor with Pixel Size of 50 nm by Vertical Nanorod Arrays. Adv. Mater. 2015, 27, 4454–4460. [Google Scholar] [CrossRef]
  151. Gomez, C.; Hayakawa, Y.; Obanawa, H. A study of Japanese landscapes using structure from motion derived DSMs and DEMs based on historical aerial photographs: New opportunities for vegetation monitoring and diachronic geomorphology. Geomorphology 2015, 242, 11–20. [Google Scholar] [CrossRef] [Green Version]
  152. Rapinel, S.; Clément, B.; Dufour, S.; Hubert-Moy, L. Fine-Scale Monitoring of Long-term Wetland Loss Using LiDAR Data and Historical Aerial Photographs: The Example of the Couesnon Floodplain, France. Wetlands 2018, 38, 423–435. [Google Scholar] [CrossRef]
  153. Eltner, A.; Baumgart, P.; Maas, H.G.; Faust, D. Multi-temporal UAV data for automatic measurement of rill and interrill erosion on loess soil. Earth Surf. Process. Landf. 2015, 40, 741–755. [Google Scholar] [CrossRef]
  154. Rossini, M.; Di Mauro, B.; Garzonio, R.; Baccolo, G.; Cavallini, G.; Mattavelli, M.; De Amicis, M.; Colombo, R. Rapid melting dynamics of an alpine glacier with repeated UAV photogrammetry. Geomorphology 2018, 304, 159–172. [Google Scholar] [CrossRef]
  155. Herterich, J.G.; Dias, F. Wave breaking and runup of long waves approaching a cliff over a variable bathymetry. Procedia IUTAM 2017, 25, 18–27. [Google Scholar] [CrossRef]
Figure 1. Study area location. Note that the southern coast of Inishmore is exposed to the open Atlantic.
Remotesensing 12 00042 g001
Figure 2. View northwest across the study site on Inishmore (Figure 1). The boulder ridge forms a sinuous line, positioned at the back of the shallowly dipping bedrock platform. The ridge front is ~15 m above high water, and 30-60 m inland from the high-tide line. The photo was taken about one hour before high tide. he dark brown colouration close to the water marks the intertidal extent.
Remotesensing 12 00042 g002
Figure 3. Ground-based views of the study site. Note the human figures for scale within the red boxes. (a) The view west along Inishmore in 2014 with the edge of the study site visible (b) The view east along the study site in 2017. The figure in (b) marks the approximate location from which (a) was taken.
Remotesensing 12 00042 g003aRemotesensing 12 00042 g003b
Figure 4. The 2015 flight path over the study area site as seen in screen capture from DJI Groundstation Pro.
Remotesensing 12 00042 g004
Figure 5. Ground control points (GCPs) used in this study. (a) A photograph of GCP #7. The plastic folder protects the paper from ocean spray and rain, and the fluorescent border makes it easier to find in the photos (b) A GCP (white within the red box) visible on the point cloud.
Remotesensing 12 00042 g005
Figure 6. Left—An uncorrected oblique 2015 GoPro image of the study area demonstrating the effects of the fisheye distortion, Right—The same image with corrections. Note the exaggerated curvature of the horizon, and lower contrast in the uncorrected image. Model generation used nadir images only, but this oblique example (which includes the horizon) shows the effectiveness of the fisheye correction.
Remotesensing 12 00042 g006
Figure 7. A comparison of orthomosiacs derived from the Agisoft models (a) 2015 and (b) 2017, reveals movement vectors for boulders that could be identified in both models (arrows) and also ‘new’ boulders, (stars) for which the origin points could not be determined.
Remotesensing 12 00042 g007aRemotesensing 12 00042 g007b
Figure 8. CloudCompare output showing quantitative difference between the 2015 and 2017 Agisoft models. The red box marks the area shown in Figure 9 and Figure 10). Black arrows indicate places where residual distortion in the GoPro images led to slightly imperfect surface alignment, leading to false detection of slight vertical changes by CloudCompare’s C2M algorithm. Note that the majority of the output area is green (no change), indicating a successful alignment.
Remotesensing 12 00042 g008
Figure 9. Erosion and deposition in the study area. (a) CloudCompare output showing areas with dramatic negative surface differences. Green indicates no change; red shows volume added; blue shows volume lost. (b) A comparison of the orthomosaics of the boxed area in (a) showing the erosion between 2015 and 2017.
Remotesensing 12 00042 g009
Figure 10. Dislocation of eighteen boulders in the study area. The red patches represent the 2017 locations of the boulders (positive elevation difference between the two models). The associated numbers are the approximate masses (in t), measured from the Agisoft mesh. Arrows connect the 2015 boulder locations (blue patches representing negative elevation difference) with the 2017 locations; the correspondences were determined based on identifying and matching the boulders in the original drone photos.
Remotesensing 12 00042 g010
Figure 11. Examples of boulder movement. (a) Boulder group A was translated inland; boulder group B translated seawards. Green indicates no change; red shows volume added, and blue shows volume lost. (b) Boulder number 14 (Table 2) rotated 180°, as indicated by the change in orientation of the green and blue dots. White arrows show direction to the ocean. The blurriness in the 2017 image is due to a poor autofocus lock.
Remotesensing 12 00042 g011
Figure 12. Time-series comparison of aerial photographs of the area near the study area showing boulder movement over short time scales. Between 2012 and 2015 boulders #16, 17, and 18 (~ 4 t and 6 t respectively) moved seawards ~5–10 m. Between 2015 and 2017 the same boulders moved back towards the boulder ridge. The 2012 imagery is useful for this illustrative purpose where the boulders are relatively large, isolated, and obvious, but does not have the necessary resolution for quantifying boulder movement in the more complex deposits. (2012 image from Bing Maps, 2015 and 2017 images from orthomosaics generated for this study).
Remotesensing 12 00042 g012
Table 1. Flight parameters.
Survey Year20152017
Camera ModelGoPro Hero3+ DJI FC300X
35 mm sensor focal length equivalent17 mm20 mm
Field of view149°94°
Resolution (Megapixels)1212
Flight altitude (m)9050
Number of orthogonal photos359211
GCP deploymentNoYes
Table 2. The eighteen largest dislocated boulders in the study area. 2015 distances and elevations are given where the boulder could be identified in the 2015 model and/or images. Most boulders simply slid across the platform, but one was rotated (#14), one was flipped (#2), and one appeared in the study area from an unknown origin (#1). Boulder masses are approximate.
ID #Estimated Mass (tonnes)Distance Moved (m)2015 Elevation (m)2017 Elevation (m)Elevation Change (m)
119 ----11--
228 ----12.5--
319 7910+1
415 1010100
53 23910+1
67 15911+2
712 1234+1
88 6911+2
93 ----11--
103 ----11--
113 ----11--
126 4220
138 511110
1413 ----13--
1511 41214+2
163 71214+2
177 111215+3
186 101215+3

