Retrieval of Particulate Backscattering Using Field and Satellite Radiometry: Assessment of the QAA Algorithm

 , ,
, ,  , and
, and
Abstract
:
1. Introduction
2. Data and Methods
2.1. Assessment of the Quasi-Analytical Algorithm (QAA)
2.2. In Situ Data
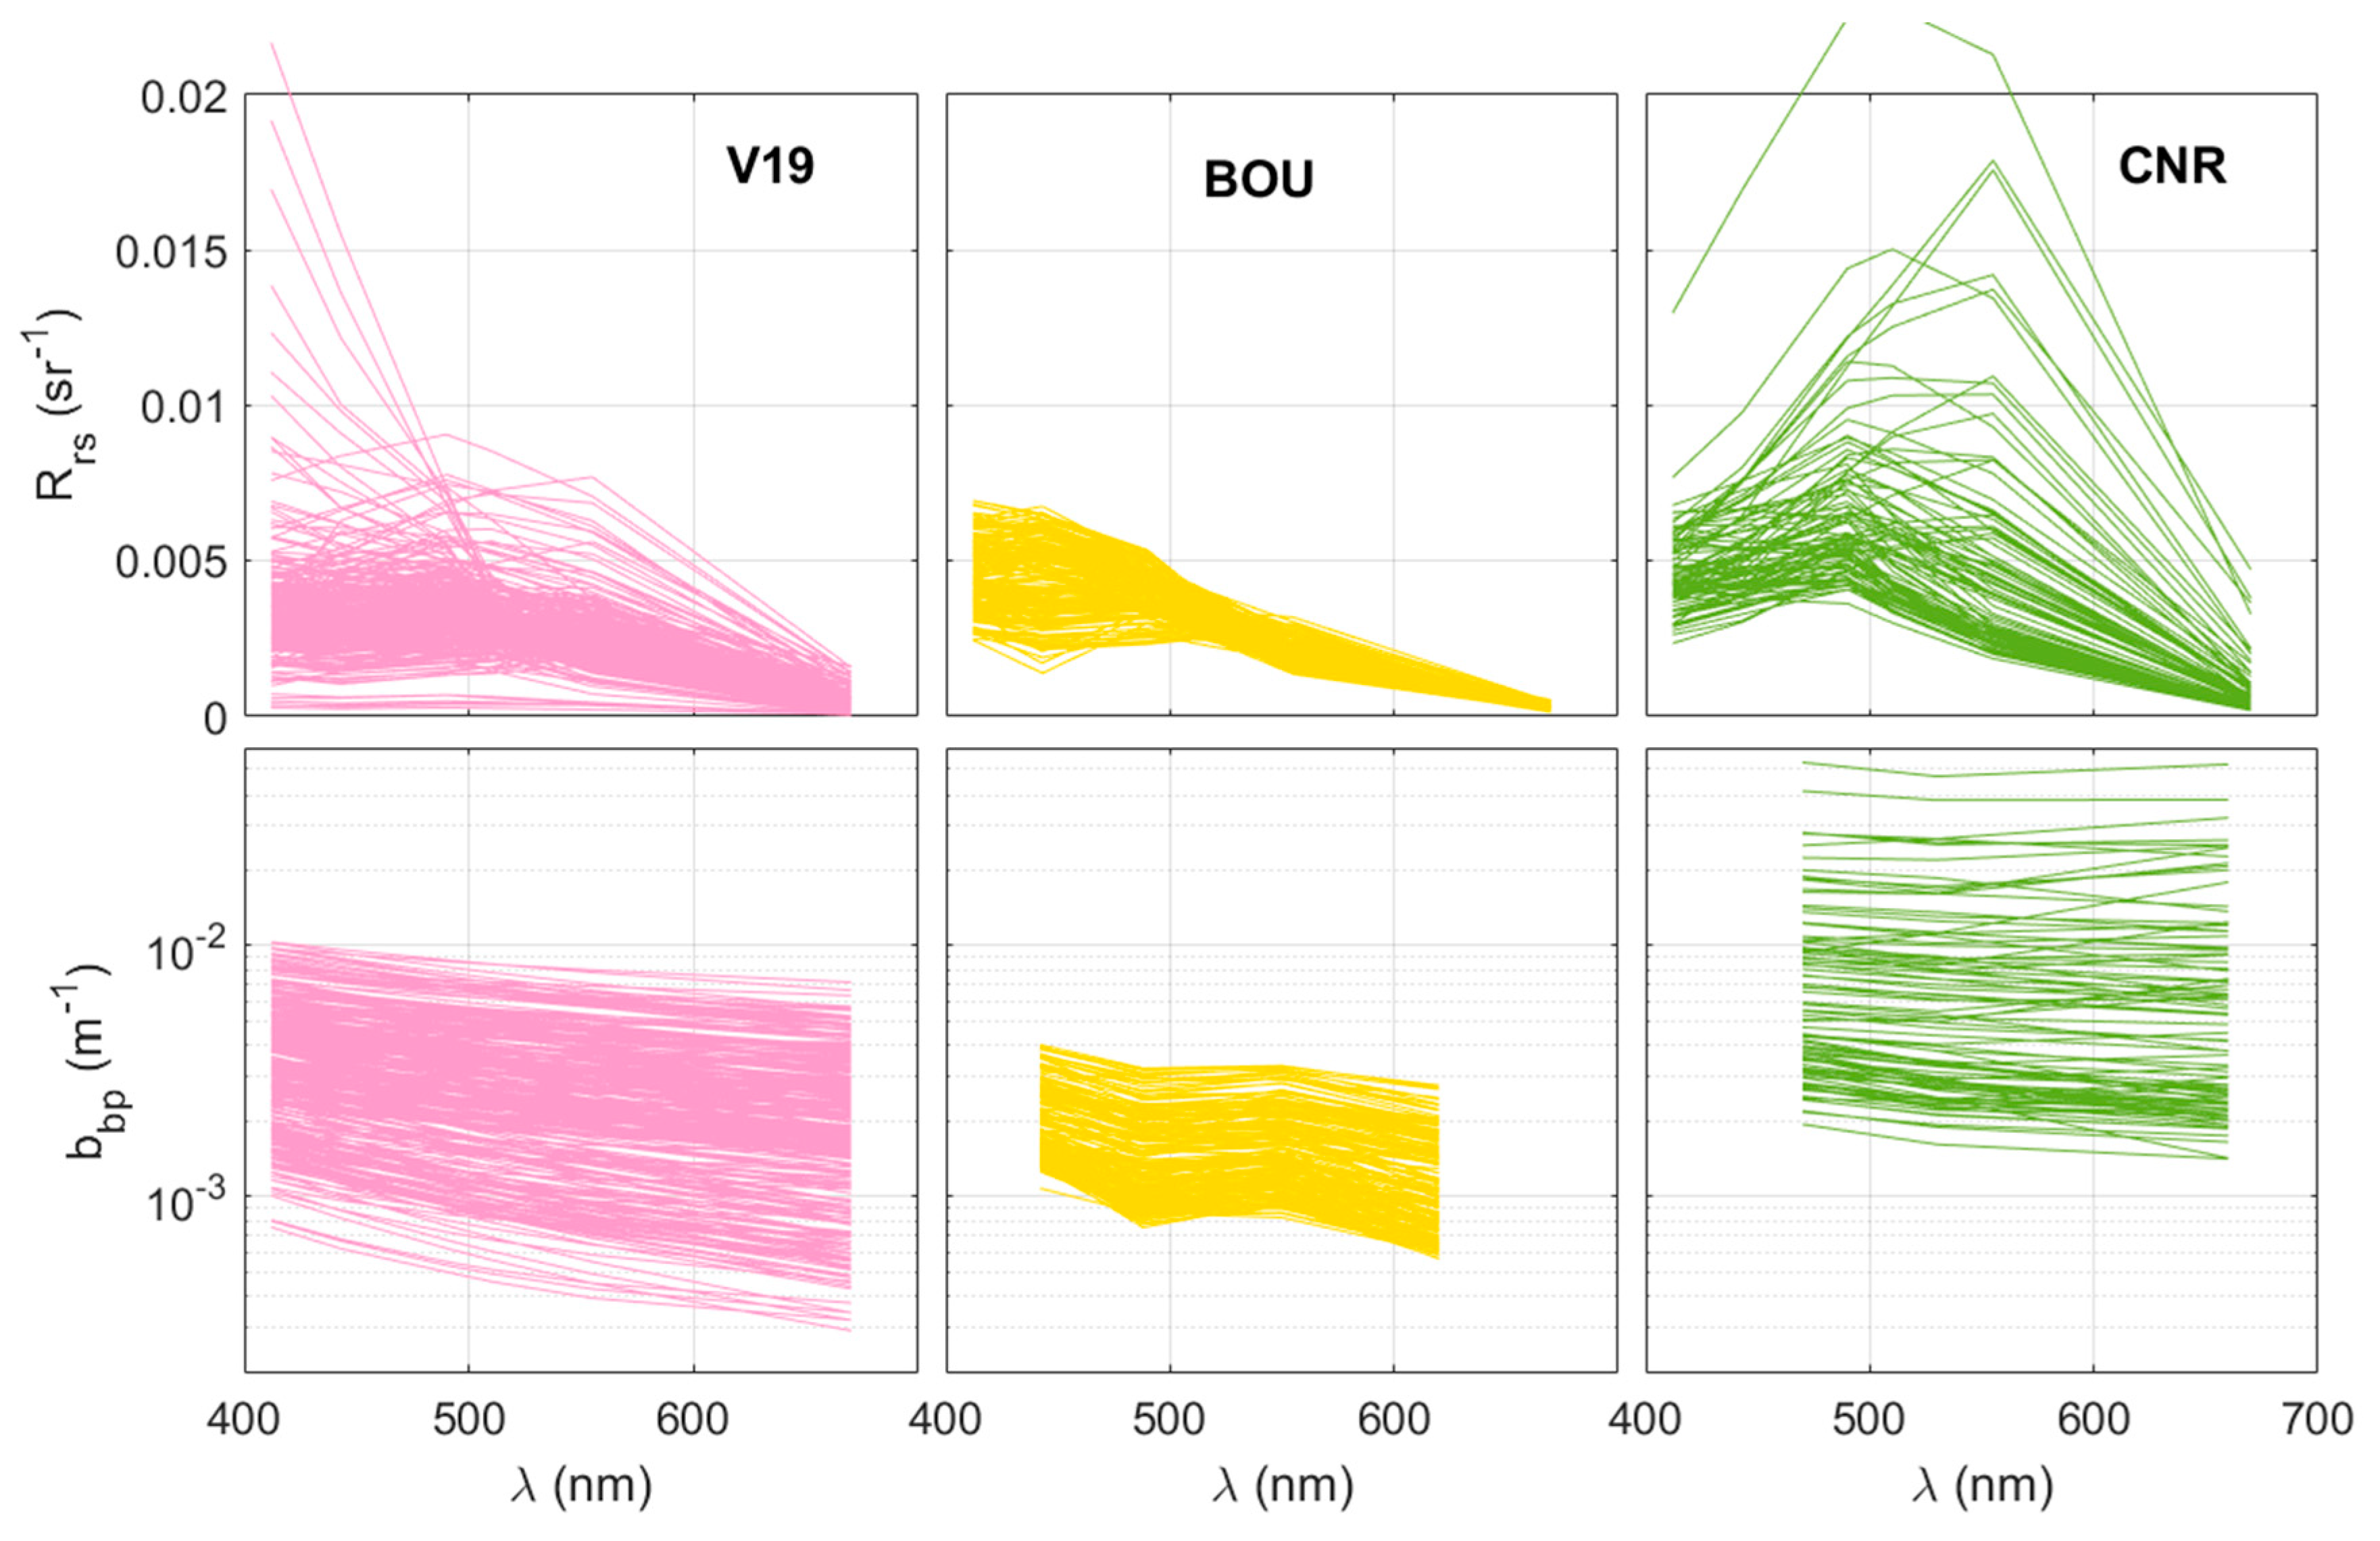
2.2.1. V19 Dataset
2.2.2. BOU Dataset
2.2.3. CNR Dataset
2.3. Satellite ESA OC-CCI Rrs Data
3. Results and Discussion
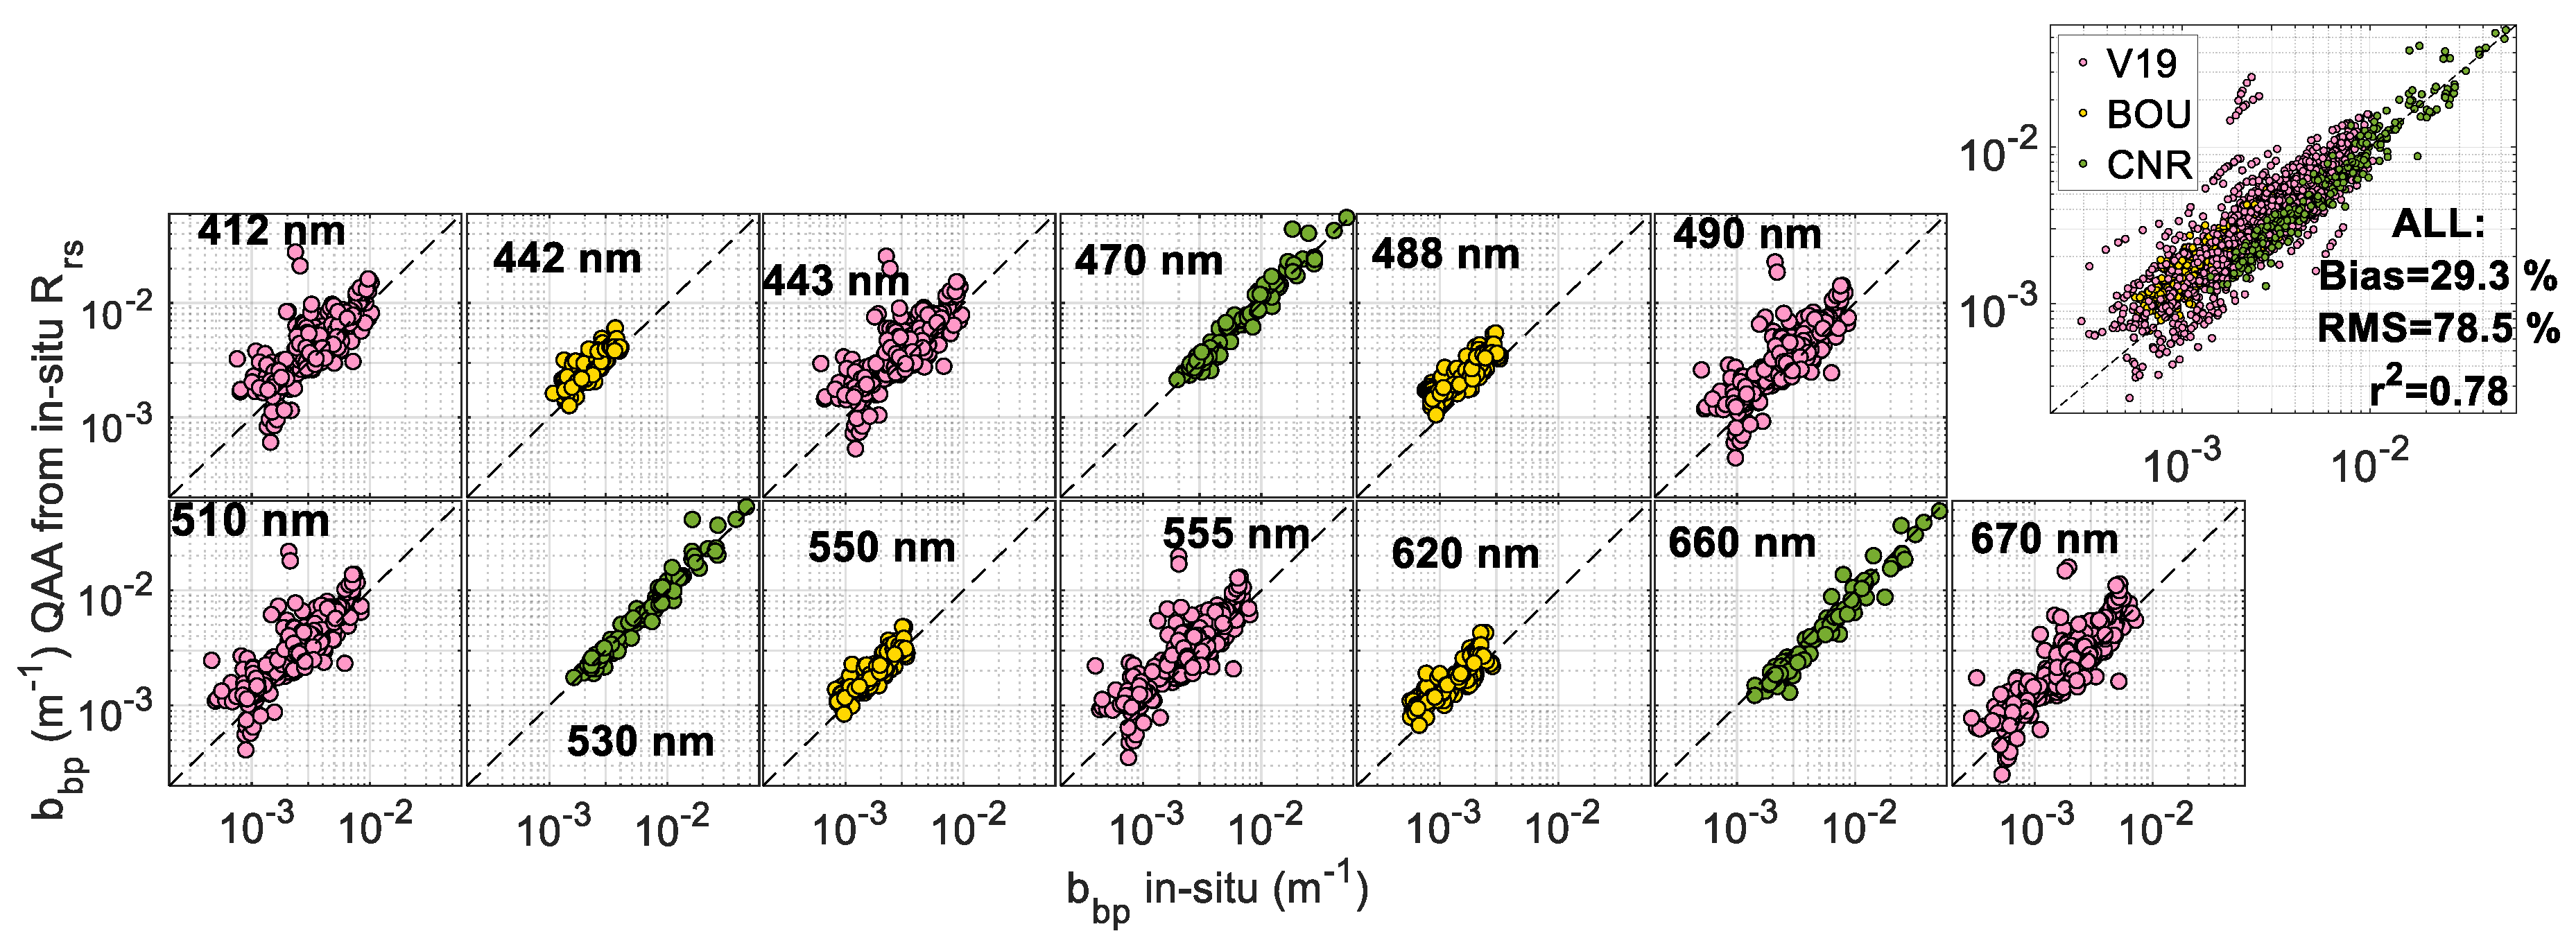
3.1. QAA Performance for bbp Retrievals from In Situ Data
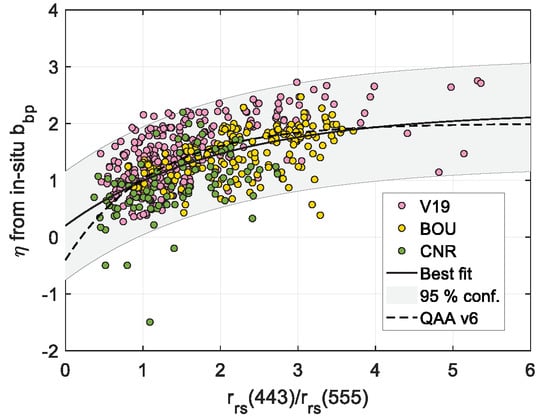
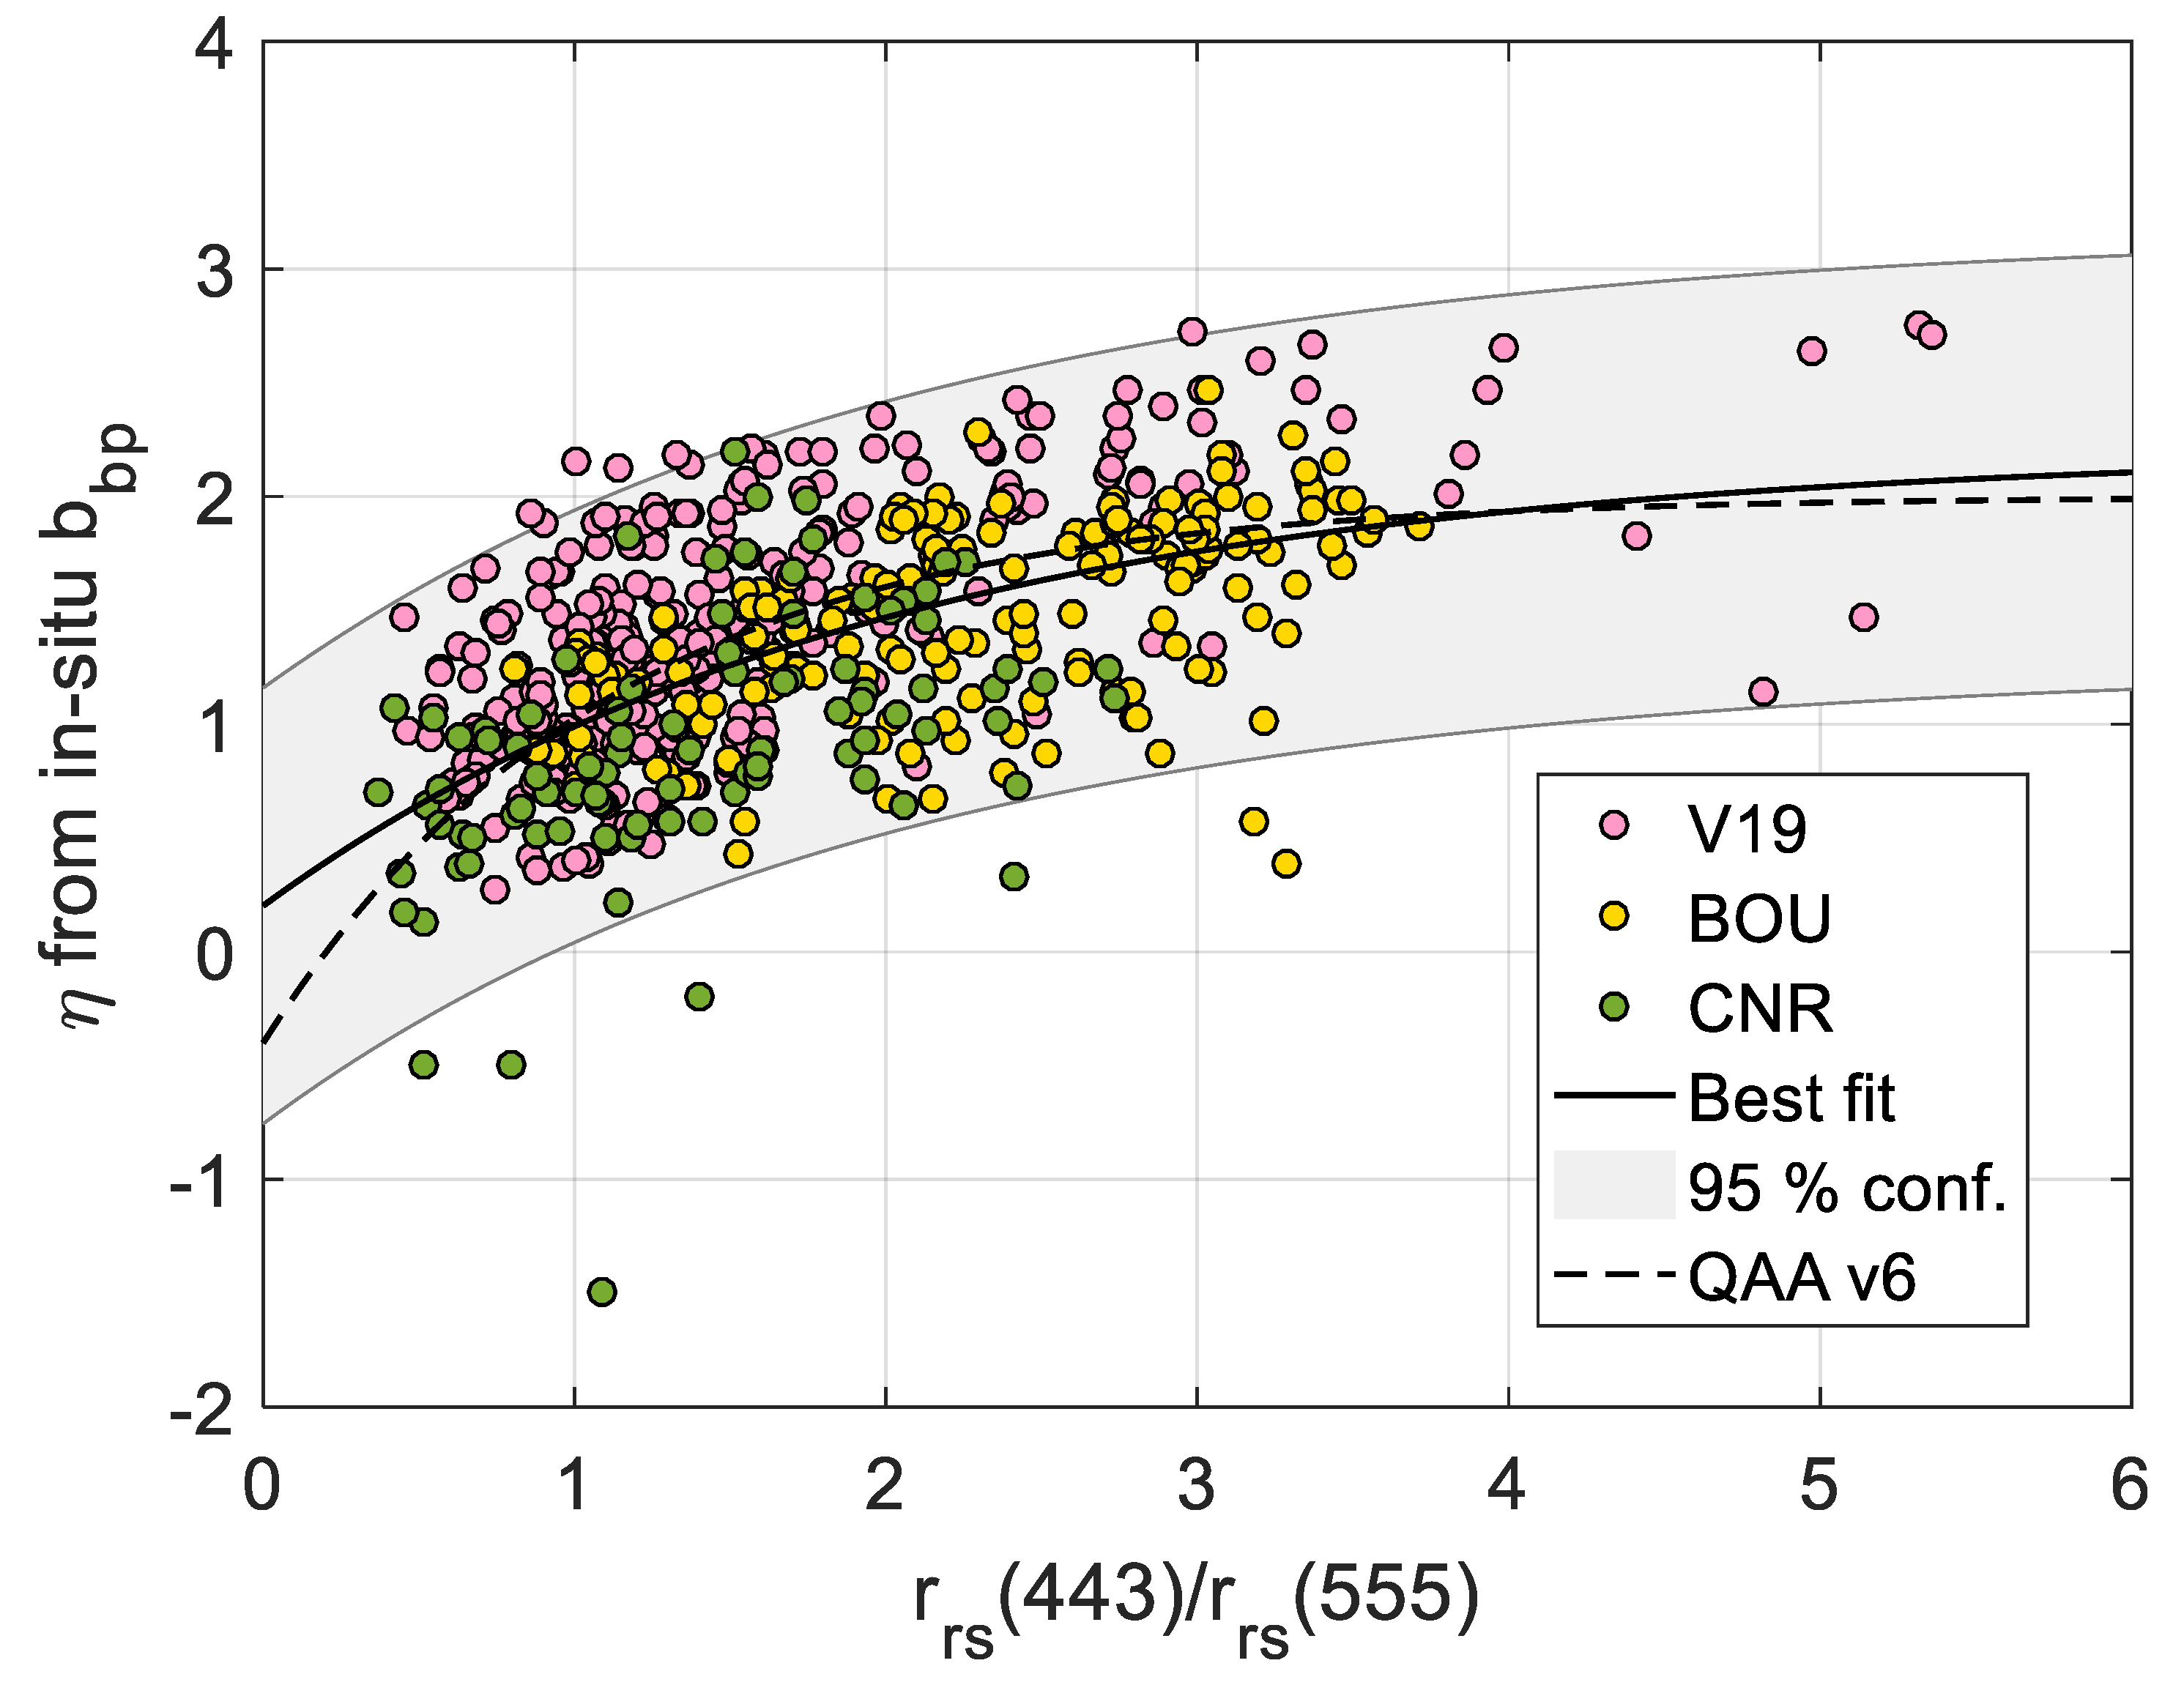
3.2. Estimation of the bbp Spectral Slope from Rrs Data
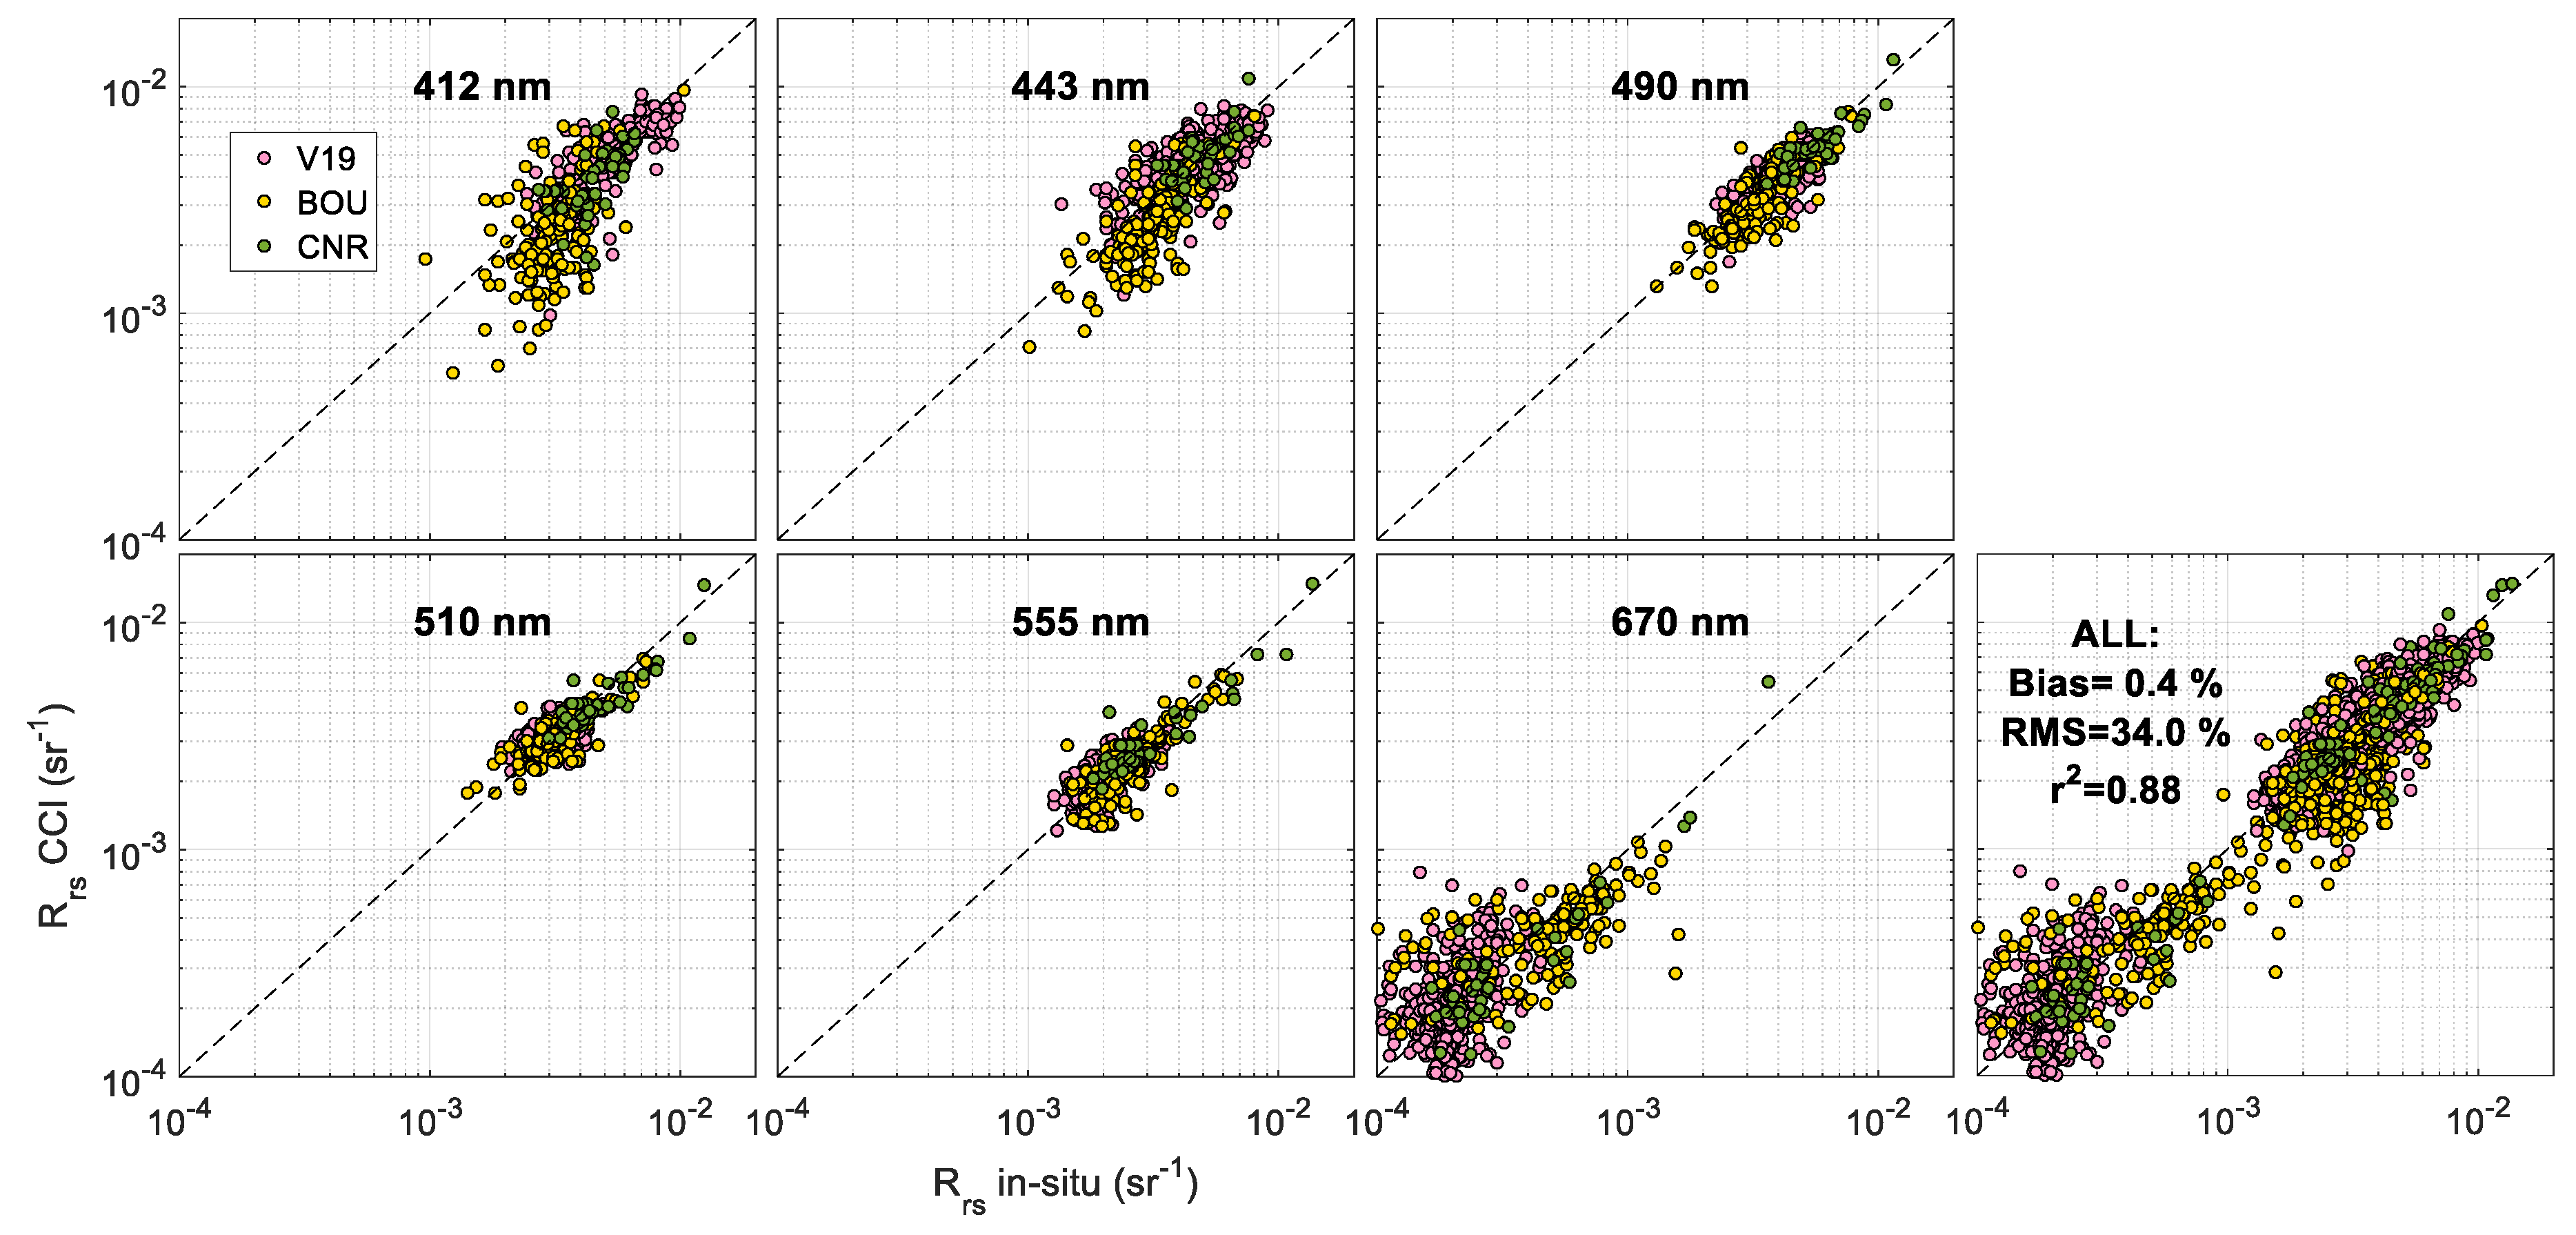
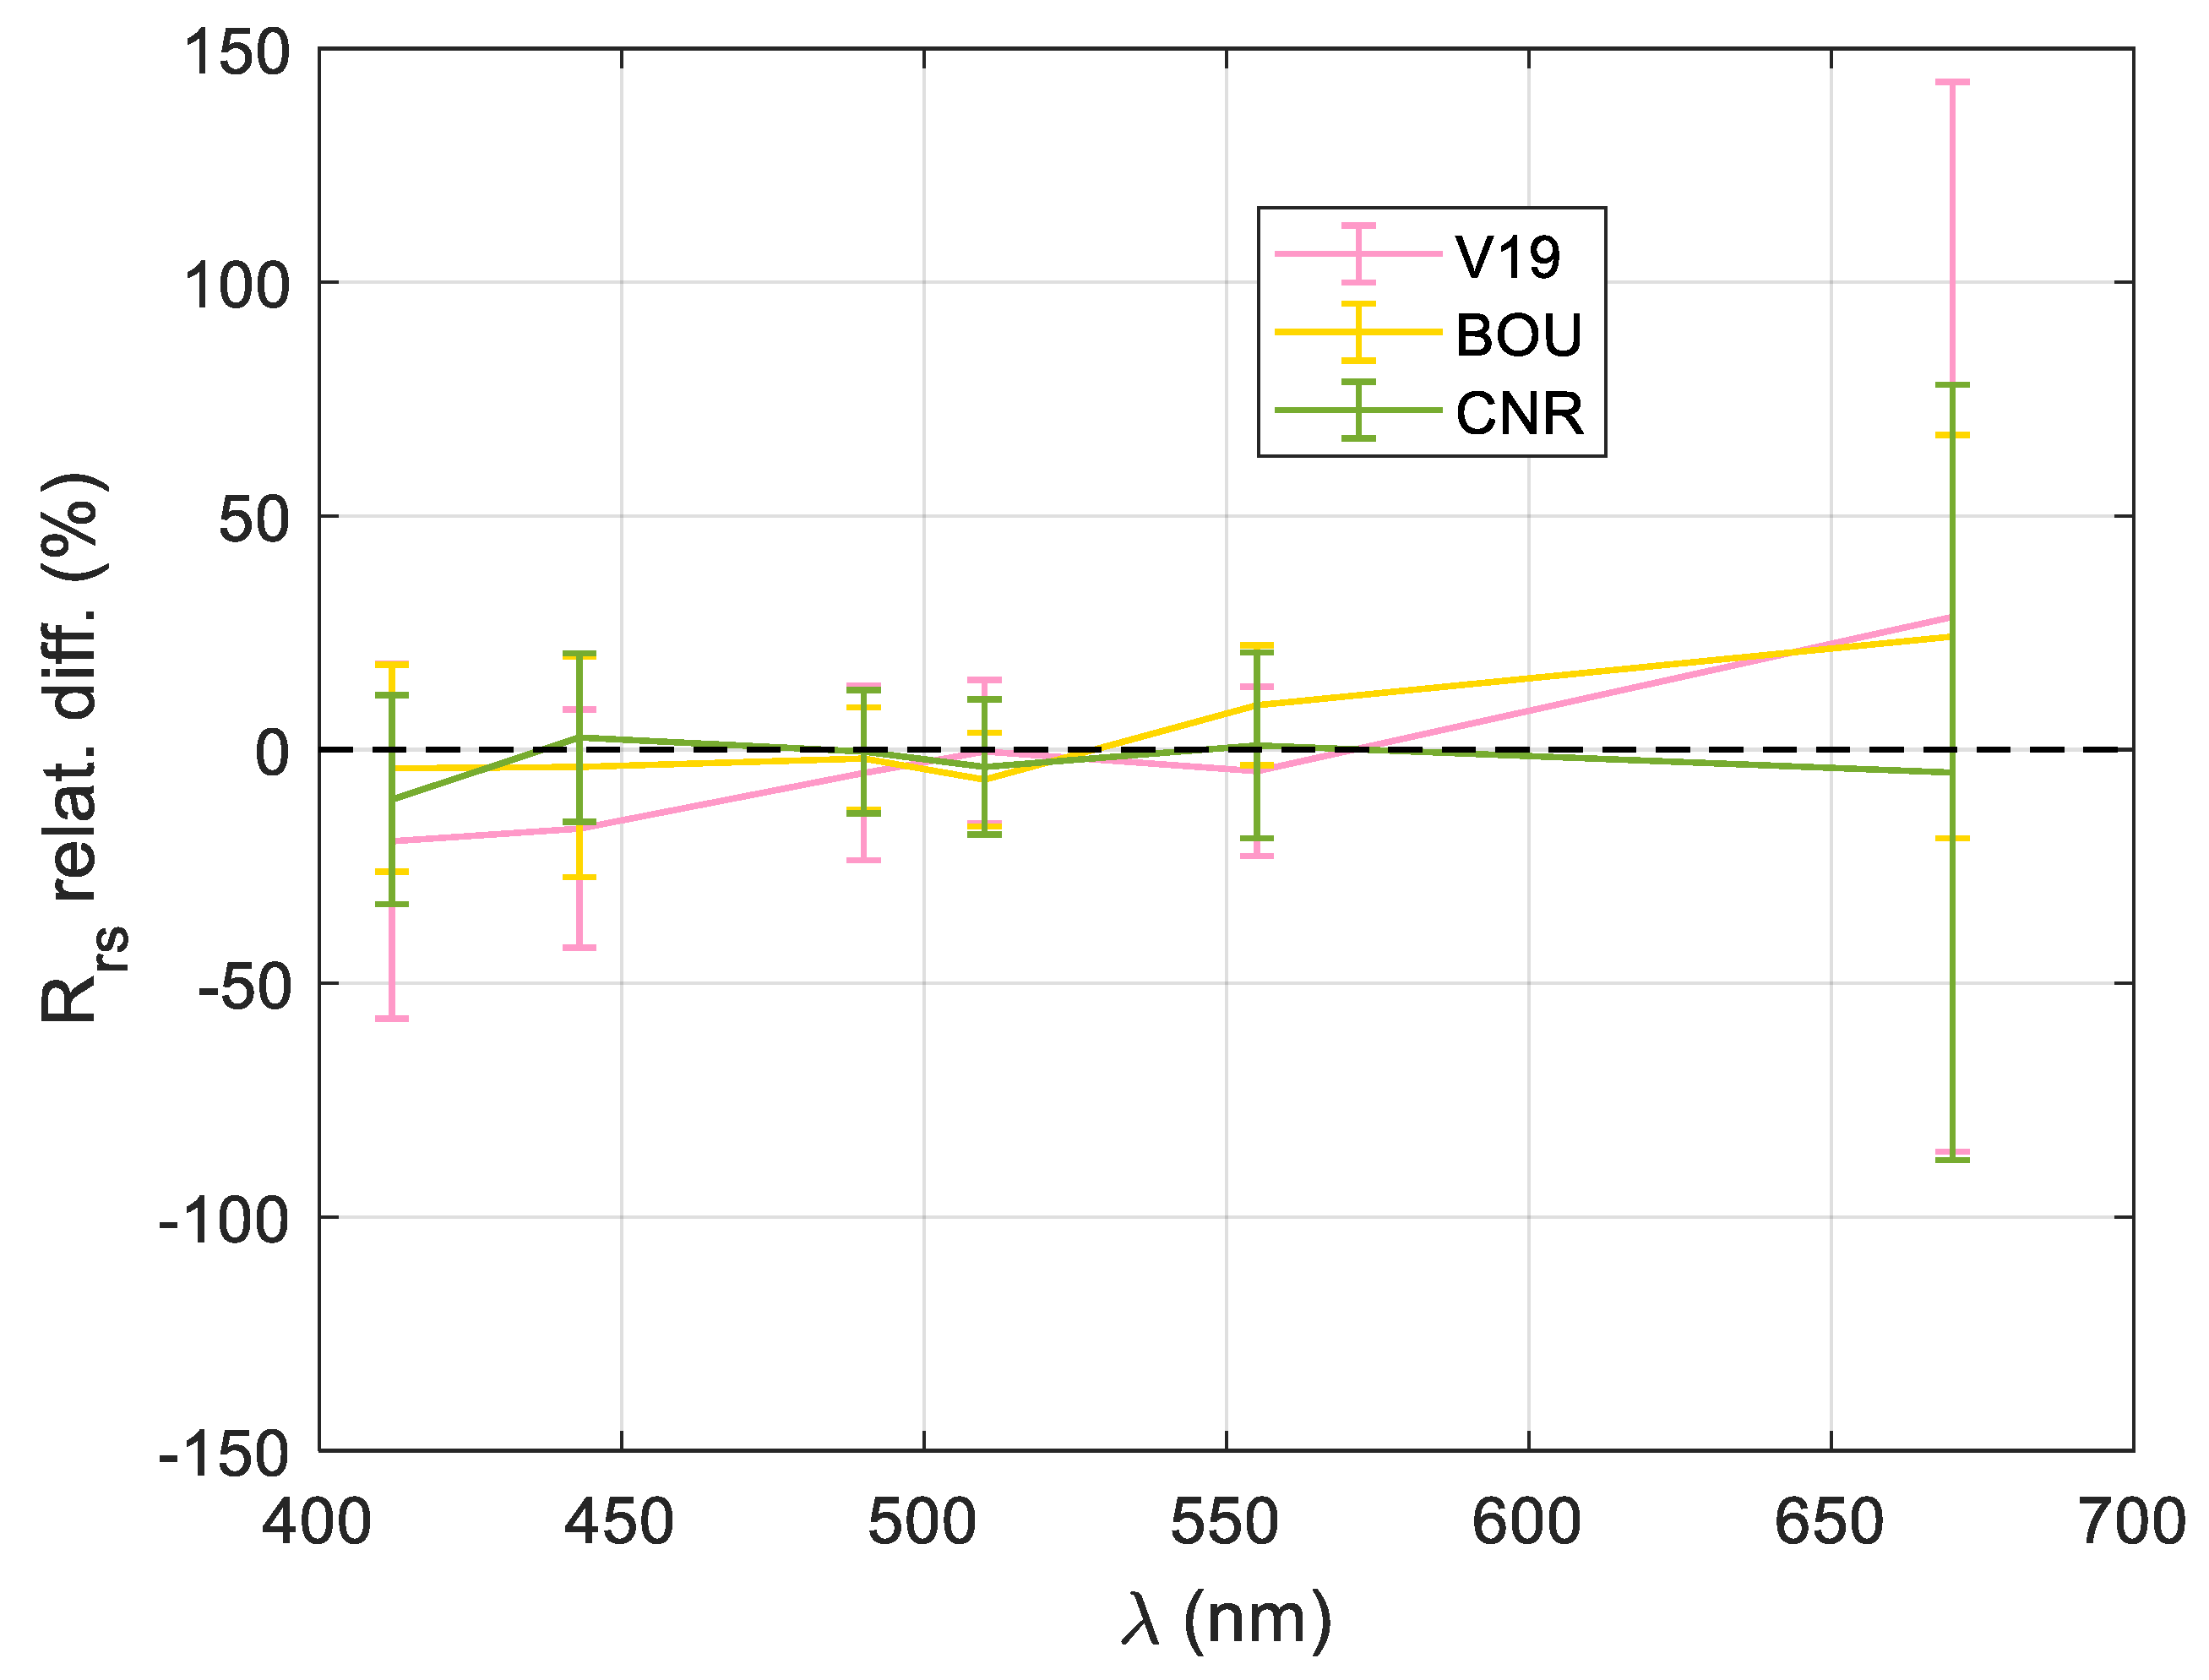
3.3. Validation of CCI Rrs
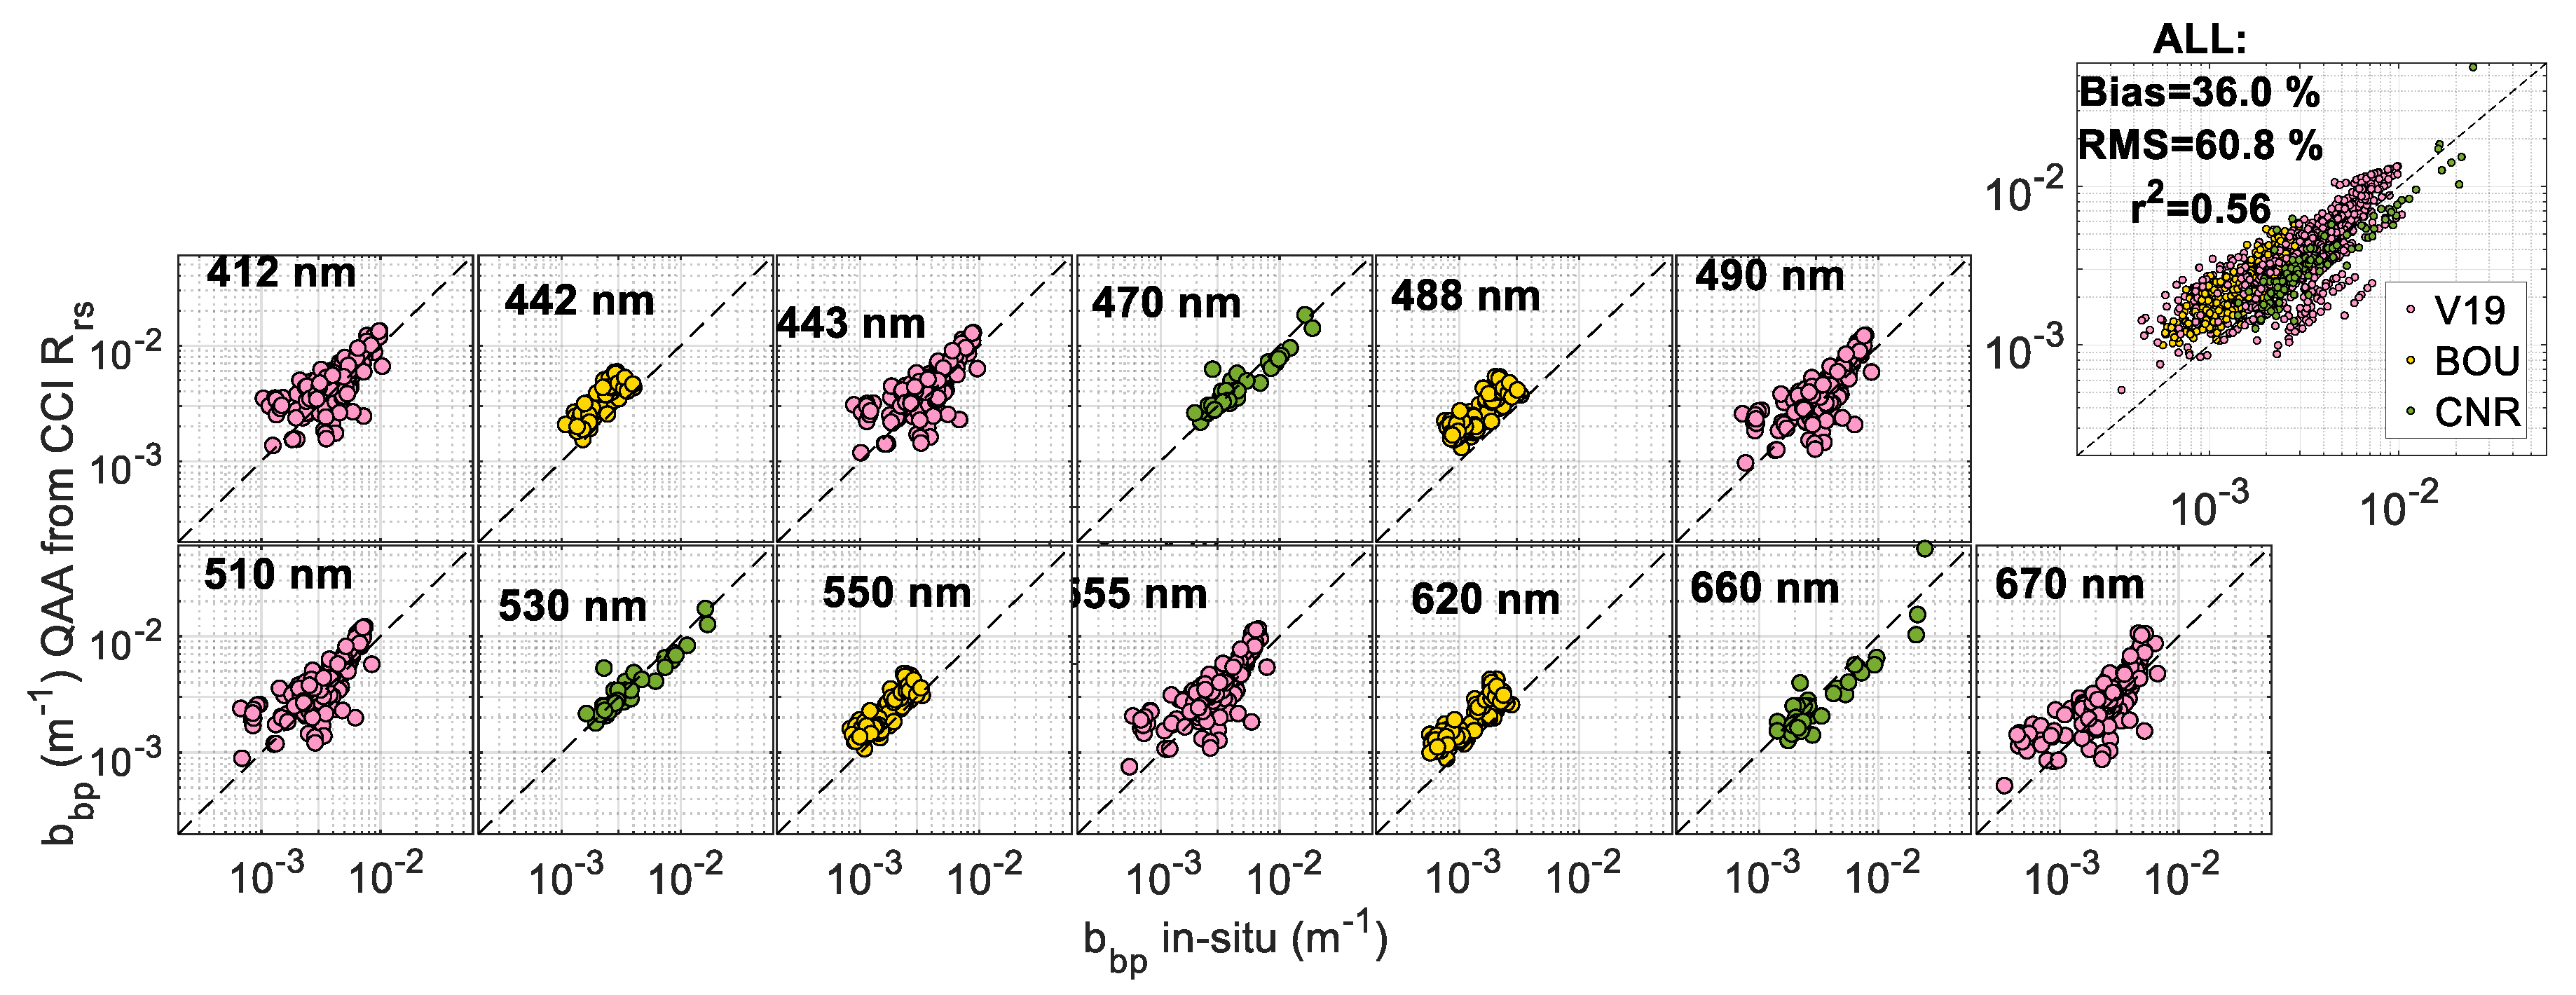
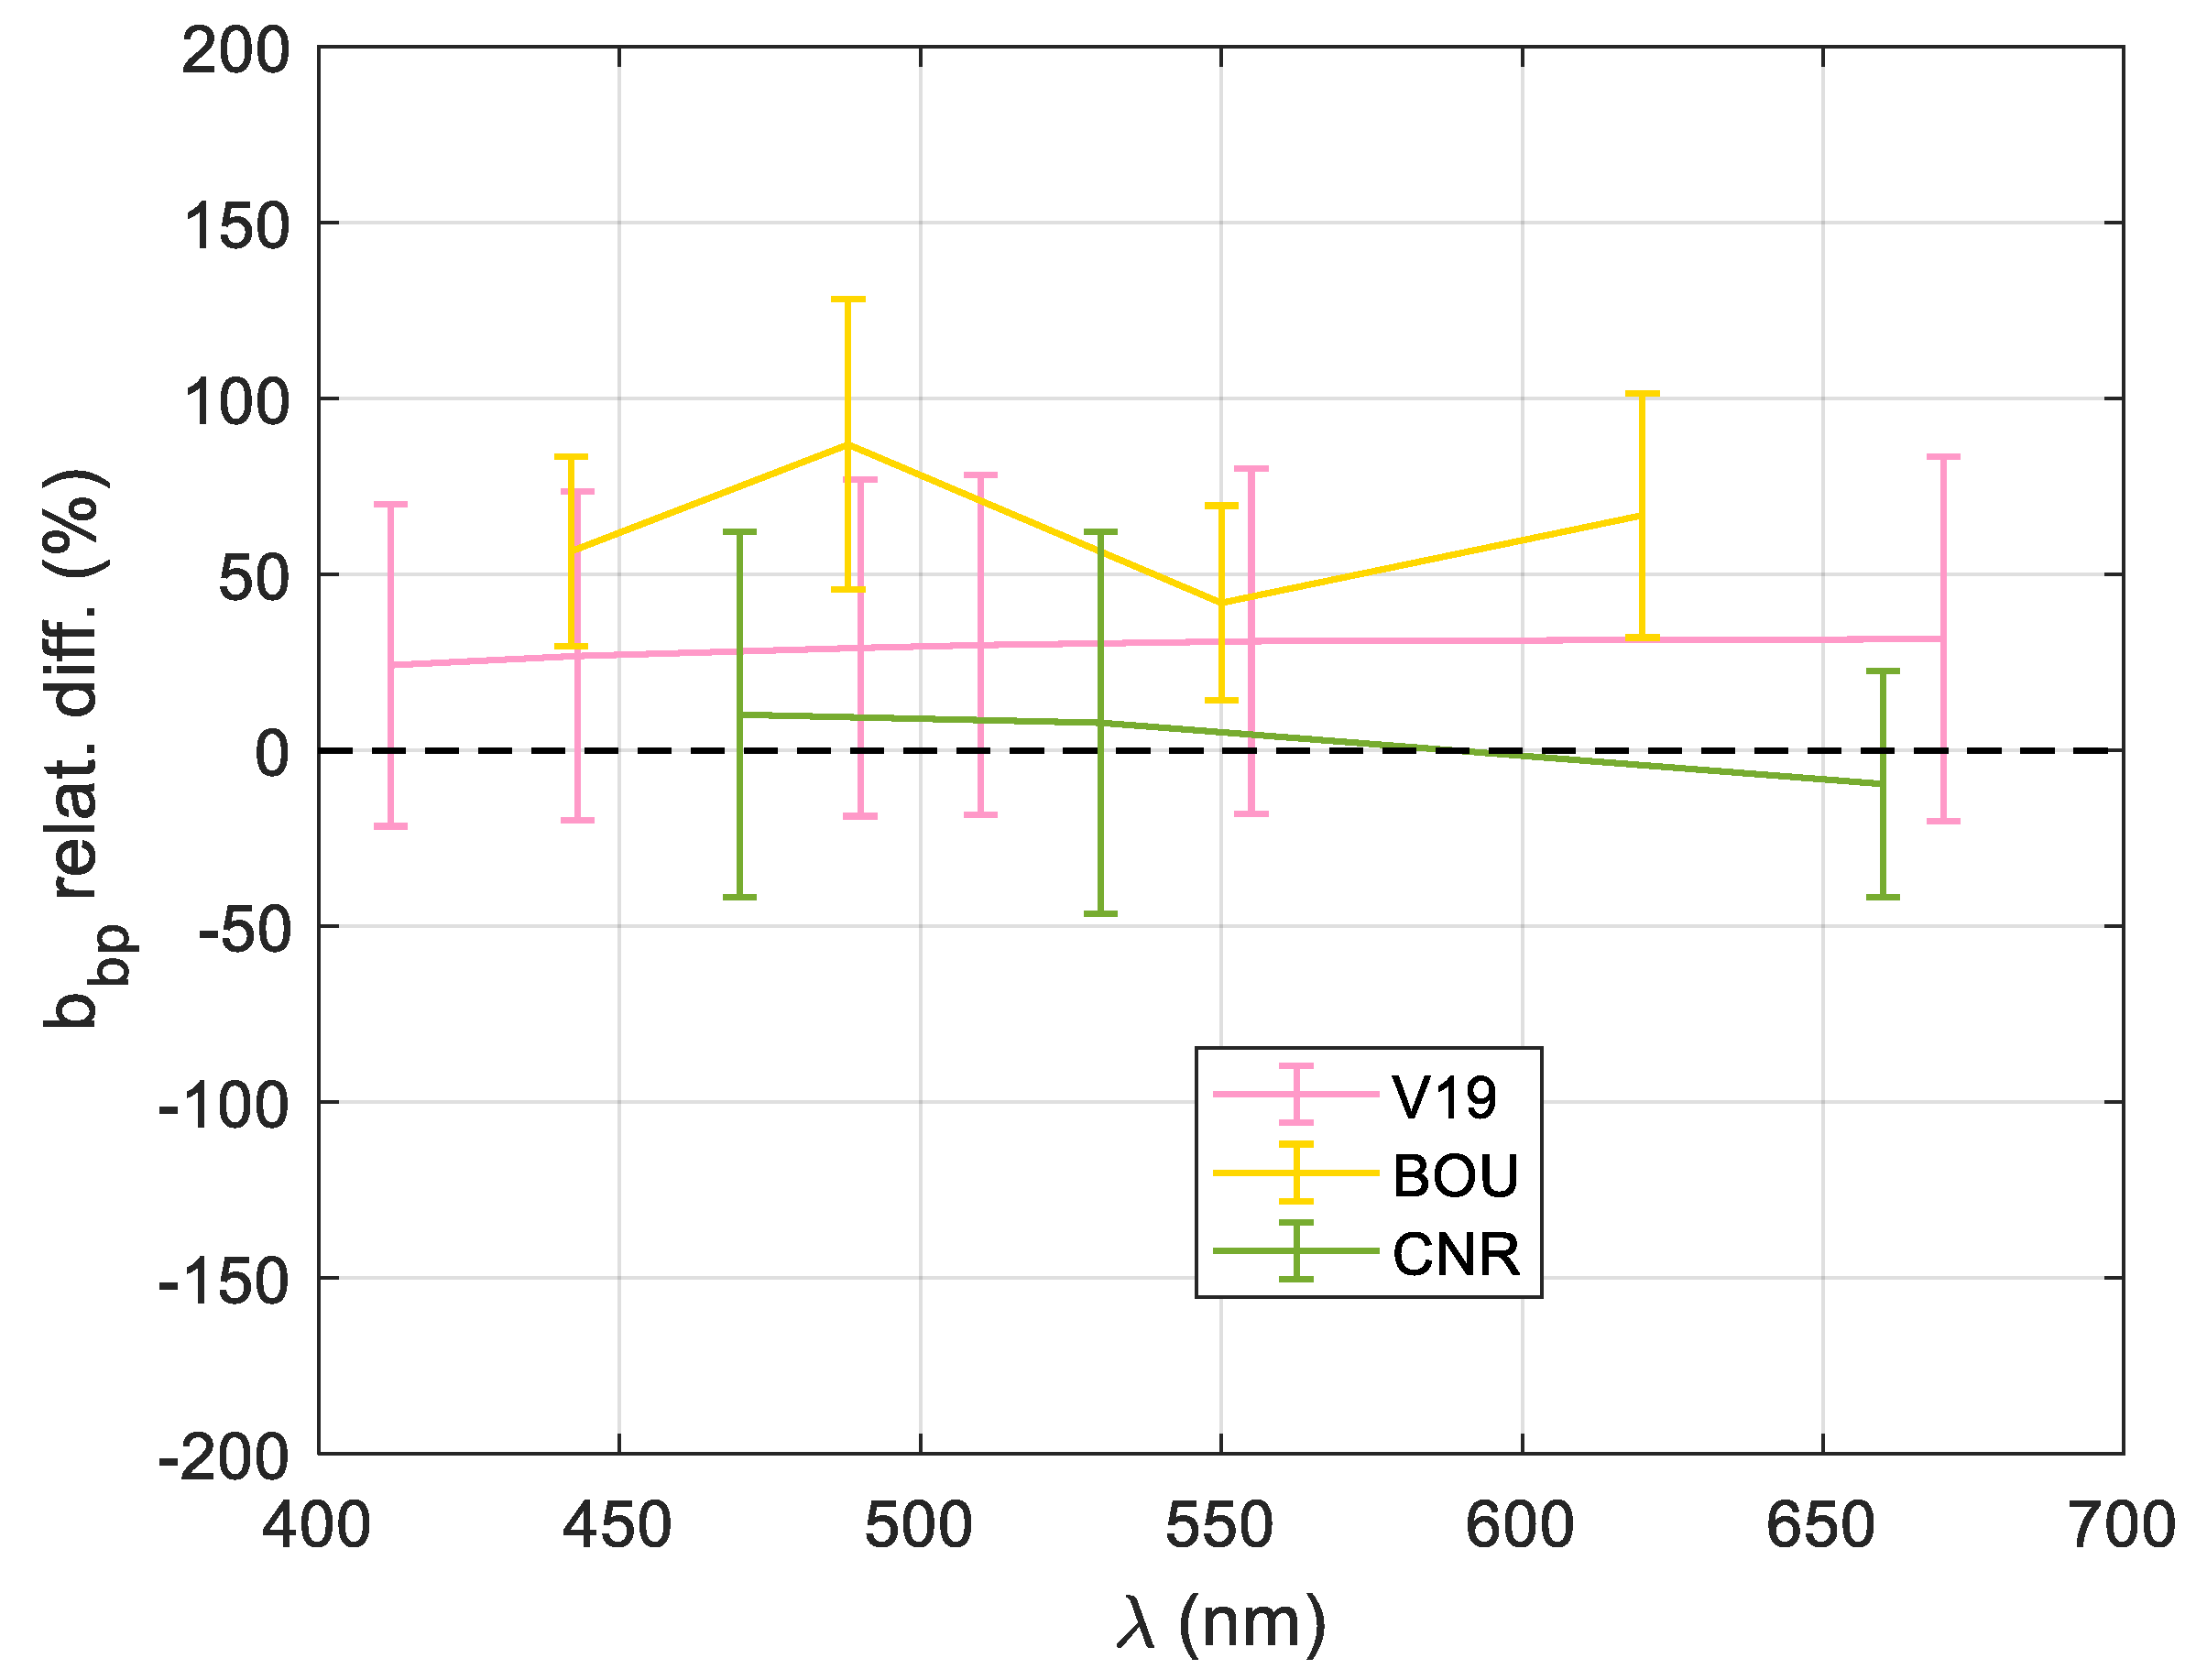
3.4. QAA Performance for bbp Retrievals from CCI Data
4. Conclusions
- (1)
- Raman scattering compensation of Rrs prior to the application of the QAA significantly reduces errors in the retrieval of bbp with respect to in situ bbp. Inclusion of this processing step in operational schemes is recommended.
- (2)
- The QAA-derived bbp from in situ radiometry has negligible biases with respect to in situ bbp.
- (3)
- CCI Rrs shows low biases but higher RMS differences with respect to in situ data, that could be excessive for the monitoring of natural change over short periods. Here, the standardization of in situ radiometry protocols is highly encouraged [52], in order to reduce the errors when in situ datasets formed by multiple contributors are merged and used for Rrs matchup analysis.
- (4)
- In part as a consequence of the findings above, QAA-derived bbp from CCI Rrs displays negligible biases respect to in situ bbp, with moderately low RMS errors.
- (5)
- The in situ radiometry-derived spectral backscattering slope (η) has low predictive value as compared to η derived from bbp matchups. In this context, the impact of using the best fitted curve instead of the widely used expression [22] is negligible, thus validating the application of the latter without its retuning.
Author Contributions
Funding
Acknowledgments
Conflicts of Interest
Appendix A


References
- Behrenfeld, M.J.; Boss, E.; Siegel, D.A.; Shea, D.M. Carbon-based ocean productivity and phytoplankton physiology from space. Glob. Biogeochem. Cycles 2005, 19. [Google Scholar] [CrossRef]
- Bellacicco, M.; Volpe, G.; Colella, S.; Pitarch, J.; Santoleri, R. Influence of photoacclimation on the phytoplankton seasonal cycle in the Mediterranean Sea as seen by satellite. Remote Sens. Environ. 2016, 184, 595–604. [Google Scholar] [CrossRef]
- Lee, Z.; Carder, K.L.; Arnone, R.A. Deriving inherent optical properties from water color: A multiband quasi-analytical algorithm for optically deep waters. Appl. Opt. 2002, 41, 5755–5772. [Google Scholar] [CrossRef] [PubMed]
- Loisel, H.; Stramski, D.; Dessailly, D.; Jamet, C.; Li, L.; Reynolds, R.A. An Inverse Model for Estimating the Optical Absorption and Backscattering Coefficients of Seawater from Remote-Sensing Reflectance Over a Broad Range of Oceanic and Coastal Marine Environments. J. Geophys. Res. Oceans 2018, 123, 2141–2171. [Google Scholar] [CrossRef]
- Brewin, R.J.W.; Sathyendranath, S.; Müller, D.; Brockmann, C.; Deschamps, P.-Y.; Devred, E.; Doerffer, R.; Fomferra, N.; Franz, B.; Grant, M.; et al. The Ocean Colour Climate Change Initiative: III. A round-robin comparison on in-water bio-optical algorithms. Remote Sens. Environ. 2015, 162, 271–294. [Google Scholar] [CrossRef] [Green Version]
- Twardowski, M.S.; Boss, E.; Macdonald, J.B.; Pegau, W.S.; Barnard, A.H.; Zaneveld, J.R.V. A model for estimating bulk refractive index from the optical backscattering ratio and the implications for understanding particle composition in case I and case II waters. J. Geophys. Res. Oceans 2001, 106, 14129–14142. [Google Scholar] [CrossRef] [Green Version]
- Slade, W.H.; Boss, E. Spectral attenuation and backscattering as indicators of average particle size. Appl. Opt. 2015, 54, 7264–7277. [Google Scholar] [CrossRef]
- Organelli, E.; Dall’Olmo, G.; Brewin, R.J.W.; Tarran, G.A.; Boss, E.; Bricaud, A. The open-ocean missing backscattering is in the structural complexity of particles. Nat. Commun. 2018, 9, 5439. [Google Scholar] [CrossRef]
- Stramski, D.; Kiefer, D.A. Light scattering by microorganisms in the open ocean. Prog. Oceanogr. 1991, 28, 343–383. [Google Scholar] [CrossRef]
- Morel, A.; Ahn, Y.-H. Optics of heterotrophic nanoflagellates and ciliates: A tentative assessment of their scattering role in oceanic waters compared to those of bacterial and algal cells. J. Mar. Res. 1991, 49, 177–202. [Google Scholar] [CrossRef]
- Stramski, D.; Boss, E.; Bogucki, D.; Voss, K.J. The role of seawater constituents in light backscattering in the ocean. Prog. Oceanogr. 2004, 61, 27–56. [Google Scholar] [CrossRef]
- Thomalla, S.J.; Ogunkoya, A.G.; Vichi, M.; Swart, S. Using Optical Sensors on Gliders to Estimate Phytoplankton Carbon Concentrations and Chlorophyll-to-Carbon Ratios in the Southern Ocean. Front. Mar. Sci. 2017, 4. [Google Scholar] [CrossRef] [Green Version]
- Loisel, H.; Bosc, E.; Stramski, D.; Oubelkheir, K.; Deschamps, P.-Y. Seasonal variability of the backscattering coefficient in the Mediterranean Sea based on satellite SeaWiFS imagery. Geophys. Res. Lett. 2001, 28, 4203–4206. [Google Scholar] [CrossRef]
- Kostadinov, T.S.; Siegel, D.A.; Maritorena, S. Retrieval of the particle size distribution from satellite ocean color observations. J. Geophys. Res. Oceans 2009, 114. [Google Scholar] [CrossRef]
- Kostadinov, T.S.; Milutinović, S.; Marinov, I.; Cabré, A. Carbon-based phytoplankton size classes retrieved via ocean color estimates of the particle size distribution. Ocean Sci. 2016, 12, 561–575. [Google Scholar] [CrossRef] [Green Version]
- Behrenfeld, M.J.; O’Malley, R.T.; Boss, E.S.; Westberry, T.K.; Graff, J.R.; Halsey, K.H.; Milligan, A.J.; Siegel, D.A.; Brown, M.B. Revaluating ocean warming impacts on global phytoplankton. Nat. Clim. Chang. 2015, 6, 323–330. [Google Scholar] [CrossRef]
- Bellacicco, M.; Volpe, G.; Briggs, N.; Brando, V.; Pitarch, J.; Landolfi, A.; Colella, S.; Marullo, S.; Santoleri, R. Global Distribution of Non-algal Particles From Ocean Color Data and Implications for Phytoplankton Biomass Detection. Geophys. Res. Lett. 2018, 45, 7672–7682. [Google Scholar] [CrossRef] [Green Version]
- Martínez-Vicente, V.; Evers-King, H.; Roy, S.; Kostadinov, T.S.; Tarran, G.A.; Graff, J.R.; Brewin, R.J.W.; Dall’Olmo, G.; Jackson, T.; Hickman, A.E.; et al. Intercomparison of Ocean Color Algorithms for Picophytoplankton Carbon in the Ocean. Front. Mar. Sci. 2017, 4. [Google Scholar] [CrossRef] [Green Version]
- Siegel, D.A.; Behrenfeld, M.J.; Maritorena, S.; McClain, C.R.; Antoine, D.; Bailey, S.W.; Bontempi, P.S.; Boss, E.S.; Dierssen, H.M.; Doney, S.C.; et al. Regional to global assessments of phytoplankton dynamics from the SeaWiFS mission. Remote Sens. Environ. 2013, 135, 77–91. [Google Scholar] [CrossRef] [Green Version]
- Halsey, K.H.; Jones, B.M. Phytoplankton Strategies for Photosynthetic Energy Allocation. Annu. Rev. Mar. Sci. 2015, 7, 265–297. [Google Scholar] [CrossRef]
- Mobley, C.D. Light and Water: Radiative Transfer in Natural Waters; Academic Press: Cambridge, MA, USA, 1994. [Google Scholar]
- Lee, Z. Update of the Quasi-Analytical Algorithm (QAA_v6). Available online: http://www.ioccg.org/groups/Software_OCA/QAA_v6_2014209.pdf (accessed on 22 December 2019).
- Huot, Y.; Morel, A.; Twardowski, M.S.; Stramski, D.; Reynolds, R.A. Particle optical backscattering along a chlorophyll gradient in the upper layer of the eastern South Pacific Ocean. Biogeosciences 2008, 5, 495–507. [Google Scholar] [CrossRef] [Green Version]
- Brewin, R.J.W.; Dall’Olmo, G.; Sathyendranath, S.; Hardman-Mountford, N.J. Particle backscattering as a function of chlorophyll and phytoplankton size structure in the open-ocean. Opt. Express 2012, 20, 17632–17652. [Google Scholar] [CrossRef] [PubMed]
- Mélin, F. Comparison of SeaWiFS and MODIS time series of inherent optical properties for the Adriatic Sea. Ocean Sci. 2011, 7, 351–361. [Google Scholar] [CrossRef]
- Werdell, P.J.; Bailey, S.W. An improved in situ bio-optical data set for ocean color algorithm development and satellite data product validation. Remote Sens. Environ. 2005, 98, 122–140. [Google Scholar] [CrossRef]
- Werdell, P.J.; Franz, B.A.; Lefler, J.T.; Robinson, W.D.; Boss, E. Retrieving marine inherent optical properties from satellites using temperature and salinity-dependent backscattering by seawater. Opt. Express 2013, 21, 32611–32622. [Google Scholar] [CrossRef] [PubMed]
- Zheng, G.; Stramski, D.; Reynolds, R.A. Evaluation of the Quasi-Analytical Algorithm for estimating the inherent optical properties of seawater from ocean color: Comparison of Arctic and lower-latitude waters. Remote Sens. Environ. 2014, 155, 194–209. [Google Scholar] [CrossRef]
- Pitarch, J.; Bellacicco, M.; Volpe, G.; Colella, S.; Santoleri, R. Use of the quasi-analytical algorithm to retrieve backscattering from in situ data in the Mediterranean Sea. Remote Sens. Lett. 2016, 7, 591–600. [Google Scholar] [CrossRef]
- Bisson, K.M.; Boss, E.; Westberry, T.K.; Behrenfeld, M.J. Evaluating satellite estimates of particulate backscatter in the global open ocean using autonomous profiling floats. Opt. Express 2019, 27, 30191–30203. [Google Scholar] [CrossRef]
- Sathyendranath, S.; Brewin, R.J.W.; Brockmann, C.; Brotas, V.; Calton, B.; Chuprin, A.; Cipollini, P.; Couto, A.B.; Dingle, J.; Doerffer, R.; et al. An Ocean-Colour Time Series for Use in Climate Studies: The Experience of the Ocean-Colour Climate Change Initiative (OC-CCI). Sensors 2019, 19, 4285. [Google Scholar] [CrossRef] [Green Version]
- Bellacicco, M.; Cornec, M.; Organelli, E.; Brewin, R.J.W.; Neukermans, G.; Volpe, G.; Barbieux, M.; Poteau, A.; Schmechtig, C.; D’Ortenzio, F.; et al. Global Variability of Optical Backscattering by Non-algal particles from a Biogeochemical-Argo Data Set. Geophys. Res. Lett. 2019, 46, 9767–9776. [Google Scholar] [CrossRef]
- Valente, A.; Sathyendranath, S.; Brotas, V.; Groom, S.; Grant, M.; Taberner, M.; Antoine, D.; Arnone, R.; Balch, W.M.; Barker, K.; et al. A compilation of global bio-optical in situ data for ocean-colour satellite applications—version two. Earth Syst. Sci. Data 2019, 11, 1037–1068. [Google Scholar] [CrossRef] [Green Version]
- Antoine, D.; Chami, M.; Claustre, H.; d’Ortenzio, F.; Morel, A.; Bécu, G.; Gentili, B.; Louis, F.; Ras, J.; Roussier, E. BOUSSOLE: A Joint CNRS-INSU, ESA, CNES, and NASA Ocean Color Calibration and Validation Activity; NASA: Washington, DC, USA, 2006.
- Bracaglia, M.; Volpe, G.; Colella, S.; Santoleri, R.; Braga, F.; Brando, V.E. Using overlapping VIIRS scenes to observe short term variations in particulate matter in the coastal environment. Remote Sens. Environ. 2019, 233, 111367. [Google Scholar] [CrossRef]
- Zhang, X.; Hu, L.; He, M.-X. Scattering by pure seawater: Effect of salinity. Opt. Express 2009, 17, 5698–5710. [Google Scholar] [CrossRef] [PubMed] [Green Version]
- Huber, P.J.; Ronchetti, E.M. Robust Statistics; John Wiley & Sons: New York, NY, USA, 1981. [Google Scholar]
- Moré, J.J.; Sorensen, D.C. Computing a Trust Region Step. SIAM J. Sci. Stat. Comput. 1983, 4, 553–572. [Google Scholar] [CrossRef] [Green Version]
- Westberry, T.K.; Boss, E.; Lee, Z. Influence of Raman scattering on ocean color inversion models. Appl. Opt. 2013, 52, 5552–5561. [Google Scholar] [CrossRef]
- Lee, Z.; Hu, C.; Shang, S.; Du, K.; Lewis, M.; Arnone, R.; Brewin, R. Penetration of UV-visible solar radiation in the global oceans: Insights from ocean color remote sensing. J. Geophys. Res. Oceans 2013, 118, 4241–4255. [Google Scholar] [CrossRef] [Green Version]
- Antoine, D.; Guevel, P.; Desté, J.-F.; Bécu, G.; Louis, F.; Scott, A.J.; Bardey, P. The “BOUSSOLE” Buoy—A New Transparent-to-Swell Taut Mooring Dedicated to Marine Optics: Design, Tests, and Performance at Sea. J. Atmos. Ocean. Technol. 2008, 25, 968–989. [Google Scholar] [CrossRef]
- Antoine, D.; d’Ortenzio, F.; Hooker, S.B.; Bécu, G.; Gentili, B.; Tailliez, D.; Scott, A.J. Assessment of uncertainty in the ocean reflectance determined by three satellite ocean color sensors (MERIS, SeaWiFS and MODIS-A) at an offshore site in the Mediterranean Sea (BOUSSOLE project). J. Geophys. Res. Oceans 2008, 113. [Google Scholar] [CrossRef]
- Mélin, F.; Sclep, G. Band shifting for ocean color multi-spectral reflectance data. Opt. Express 2015, 23, 2262–2279. [Google Scholar] [CrossRef]
- Valente, A.; Sathyendranath, S.; Brotas, V.; Groom, S.; Grant, M.; Taberner, M.; Antoine, D.; Arnone, R.; Balch, W.M.; Barker, K.; et al. Inherent optical properties and diffuse attenuation coefficient aggregated within +/−6 nm of SeaWiFS, MODIS-AQUA, VIIRS, OLCI and MERIS bands, corrected Version 2019-06-12. In A Compilation of Global Bio-Optical in Situ Data for Ocean-Colour Satellite Applications—Version Two; Valente, A., Ed.; Pangaea: Bremen, Germany, 2019. [Google Scholar] [CrossRef]
- Antoine, D.; Siegel, D.A.; Kostadinov, T.; Maritorena, S.; Nelson, N.B.; Gentili, B.; Vellucci, V.; Guillocheau, N. Variability in optical particle backscattering in contrasting bio-optical oceanic regimes. Limnol. Oceanogr. 2011, 56, 955–973. [Google Scholar] [CrossRef]
- Organelli, E.; Bricaud, A.; Gentili, B.; Antoine, D.; Vellucci, V. Retrieval of Colored Detrital Matter (CDM) light absorption coefficients in the Mediterranean Sea using field and satellite ocean color radiometry: Evaluation of bio-optical inversion models. Remote Sens. Environ. 2016, 186, 297–310. [Google Scholar] [CrossRef]
- Volpe, G.; Colella, S.; Brando, V.E.; Forneris, V.; La Padula, F.; Di Cicco, A.; Sammartino, M.; Bracaglia, M.; Artuso, F.; Santoleri, R. Mediterranean ocean colour Level 3 operational multi-sensor processing. Ocean Sci. 2019, 15, 127–146. [Google Scholar] [CrossRef] [Green Version]
- Jackson, T.; Chuprin, A.; Sathyendranath, S.; Grant, M.; Zühlke, M.; Dingle, J.; Storm, T.; Boettcher, M.; Fomferra, N. Ocean Colour Climate Change Initiative (OC_CCI)—Interim Phase. Product User Guide, D3.4 PUG. 2019. Available online: https://esa-oceancolour-cci.org/sites/esa-oceancolour-cci.org/alfresco.php?file=a68aa514-3668-4935-9235-fca10f7e8bee&name=OC-CCI-PUG-v4.1-v1.pdf (accessed on 22 December 2019).
- Mélin, F.; Chuprin, A.; Grant, M.; Jackson, T.; Sathyendranath, S. Ocean Colour Climate Change Initiative (OC_CCI)—Phase Two; Ocean Colour Data Bias Correction and Merging D2.6; Plymouth Marine Laboratory: Plymouth, UK, 2016; Volume 35. [Google Scholar]
- Lee, Z.; Huot, Y. On the non-closure of particle backscattering coefficient in oligotrophic oceans. Opt. Express 2014, 22, 29223–29233. [Google Scholar] [CrossRef] [Green Version]
- Mélin, F.; Zibordi, G.; Berthon, J.-F. Assessment of satellite ocean color products at a coastal site. Remote Sens. Environ. 2007, 110, 192–215. [Google Scholar] [CrossRef]
- Zibordi, G.; Voss, K.J.; Johnson, B.C.; Mueller, J.L. (Eds.) Protocols for Satellite Ocean Colour Data Validation: In Situ Optical Radiometry (Volume 3.0). In IOCCG Ocean Optics and Biogeochemistry Protocols for Satellite Ocean Colour Sensor Validation; IOCCG Protocol Series; IOCCG: Dartmouth, NS, Canada, 2019; Volume 3. [Google Scholar] [CrossRef]
- Haltrin, V.I.; Kattawar, G.W.; Weidemann, A.D. Modeling of elastic and inelastic scattering effects in oceanic optics. In Proceedings of the Ocean Optics XIII (1997), Halifax, NS, Canada, 6 February 1997. [Google Scholar]
- Dall’Olmo, G.; Westberry, T.K.; Behrenfeld, M.J.; Boss, E.; Slade, W.H. Significant contribution of large particles to optical backscattering in the open ocean. Biogeosciences 2009, 6, 947–967. [Google Scholar] [CrossRef] [Green Version]


| Band (nm) | Bias (%) | RMS (%) | r2 | N | |
|---|---|---|---|---|---|
| V19 | 412 | 40.3 | 128.4 | 0.35 | 319 |
| 443 | 42.7 | 129.4 | 0.37 | 319 | |
| 490 | 44.5 | 127.8 | 0.41 | 319 | |
| 510 | 45.0 | 127.1 | 0.42 | 319 | |
| 555 | 45.2 | 124.2 | 0.44 | 319 | |
| 670 | 43.1 | 114.2 | 0.47 | 319 | |
| All | 43.4 | 125.3 | 0.43 | 1914 | |
| BOU | 442 | 44.5 | 50.7 | 0.73 | 172 |
| 488 | 71.3 | 79.2 | 0.73 | 172 | |
| 550 | 29.0 | 36.5 | 0.78 | 172 | |
| 620 | 52.0 | 60.2 | 0.73 | 172 | |
| All | 49.2 | 58.7 | 0.75 | 688 | |
| CNR | 470 | 11.8 | 25.1 | 0.88 | 93 |
| 530 | 7.7 | 22.8 | 0.89 | 93 | |
| 660 | −9.6 | 20.7 | 0.93 | 93 | |
| All | 3.3 | 22.9 | 0.88 | 279 |
| Band (nm) | Bias (%) | RMS (%) | r2 | N | |
|---|---|---|---|---|---|
| V19 | 412 | 28.5 | 94.6 | 0.45 | 319 |
| 443 | 30.7 | 95.0 | 0.47 | 319 | |
| 490 | 32.2 | 93.4 | 0.50 | 319 | |
| 510 | 32.6 | 92.8 | 0.51 | 319 | |
| 555 | 32.7 | 90.4 | 0.52 | 319 | |
| 670 | 30.7 | 83.1 | 0.54 | 319 | |
| All | 31.2 | 91.6 | 0.52 | 1914 | |
| BOU | 442 | 33.0 | 40.1 | 0.73 | 172 |
| 488 | 57.2 | 64.8 | 0.73 | 172 | |
| 550 | 18.2 | 27.1 | 0.78 | 172 | |
| 620 | 39.0 | 47.8 | 0.73 | 172 | |
| All | 37.0 | 47.0 | 0.75 | 688 | |
| CNR | 470 | 6.5 | 22.6 | 0.88 | 93 |
| 530 | 2.5 | 21.3 | 0.89 | 93 | |
| 660 | −14.2 | 23.0 | 0.93 | 93 | |
| All | −1.73 | 22.3 | 0.89 | 279 |
| Band (nm) | Bias (%) | RMS (%) | r2 | N | |
|---|---|---|---|---|---|
| V19 | 412 | −19.6 | 42.7 | 0.37 | 147 |
| 443 | −16.9 | 30.6 | 0.53 | 147 | |
| 490 | −5.0 | 19.3 | 0.66 | 147 | |
| 510 | −0.4 | 15.3 | 0.73 | 147 | |
| 555 | −4.6 | 18.7 | 0.78 | 147 | |
| 670 | 28.4 | 117.9 | 0.47 | 147 | |
| All | −3.0 | 54.2 | 0.73 | 882 | |
| BOU | 412 | −4.0 | 22.5 | 0.50 | 96 |
| 443 | −3.7 | 23.9 | 0.63 | 97 | |
| 490 | −1.9 | 11.1 | 0.66 | 97 | |
| 510 | −6.4 | 11.9 | 0.47 | 97 | |
| 555 | 9.5 | 16.0 | 0.64 | 97 | |
| 670 | 24.2 | 49.5 | 0.31 | 97 | |
| All | 3.0 | 26.0 | 0.89 | 581 | |
| CNR | 412 | −10.7 | 24.8 | 0.42 | 42 |
| 443 | 2.6 | 18.2 | 0.53 | 42 | |
| 490 | −0.4 | 13.2 | 0.75 | 42 | |
| 510 | −3.7 | 14.9 | 0.81 | 42 | |
| 555 | 0.9 | 19.9 | 0.88 | 42 | |
| 670 | −4.9 | 83.1 | 0.90 | 42 | |
| All | −2.7 | 21.9 | 0.87 | 252 |
| Band (nm) | Bias (%) | RMS (%) | r2 | N | |
|---|---|---|---|---|---|
| V19 | 412 | 24.2 | 51.8 | 0.66 | 147 |
| 443 | 26.8 | 53.9 | 0.67 | 147 | |
| 490 | 29.1 | 56.0 | 0.68 | 147 | |
| 510 | 29.9 | 56.8 | 0.67 | 147 | |
| 555 | 31.0 | 58.1 | 0.67 | 147 | |
| 670 | 31.6 | 60.7 | 0.62 | 147 | |
| All | 28.8 | 56.3 | 0.68 | 882 | |
| BOU | 442 | 56.6 | 62.7 | 0.67 | 97 |
| 488 | 86.9 | 96.2 | 0.64 | 97 | |
| 550 | 41.9 | 50.2 | 0.70 | 97 | |
| 620 | 66.8 | 75.3 | 0.69 | 97 | |
| All | 63.1 | 73.1 | 0.69 | 388 | |
| CNR | 470 | 10.1 | 52.9 | 0.48 | 42 |
| 530 | 7.8 | 54.9 | 0.46 | 42 | |
| 660 | −9.6 | 33.5 | 0.63 | 42 | |
| All | 2.7 | 48.1 | 0.50 | 126 |
© 2019 by the authors. Licensee MDPI, Basel, Switzerland. This article is an open access article distributed under the terms and conditions of the Creative Commons Attribution (CC BY) license (http://creativecommons.org/licenses/by/4.0/).
Share and Cite
Pitarch, J.; Bellacicco, M.; Organelli, E.; Volpe, G.; Colella, S.; Vellucci, V.; Marullo, S. Retrieval of Particulate Backscattering Using Field and Satellite Radiometry: Assessment of the QAA Algorithm. Remote Sens. 2020, 12, 77. https://0-doi-org.brum.beds.ac.uk/10.3390/rs12010077
Pitarch J, Bellacicco M, Organelli E, Volpe G, Colella S, Vellucci V, Marullo S. Retrieval of Particulate Backscattering Using Field and Satellite Radiometry: Assessment of the QAA Algorithm. Remote Sensing. 2020; 12(1):77. https://0-doi-org.brum.beds.ac.uk/10.3390/rs12010077
Chicago/Turabian StylePitarch, Jaime, Marco Bellacicco, Emanuele Organelli, Gianluca Volpe, Simone Colella, Vincenzo Vellucci, and Salvatore Marullo. 2020. "Retrieval of Particulate Backscattering Using Field and Satellite Radiometry: Assessment of the QAA Algorithm" Remote Sensing 12, no. 1: 77. https://0-doi-org.brum.beds.ac.uk/10.3390/rs12010077