Article

Assessing the Operation Parameters of a Low-altitude UAV for the Collection of NDVI Values Over a Paddy Rice Field

1
College of Engineering, South China Agricultural University/Guangdong Engineering Research Center for Agricultural Aviation Application (ERCAAA), Guangzhou 510642, China
2
Centre for Earth Observation Sciences (CEOS), Department of Earth and Atmospheric Sciences, University of Alberta, Edmonton, AB T6G 2E3, Canada
3
National Center for International Collaboration Research on Precision Agricultural Aviation Pesticides Spraying Technology (NPAAC), Guangzhou 510642, China
4
Key Laboratory of Key Technology on Agricultural Machine and Equipment (South China Agricultural University), Ministry of Education, Guangzhou 510642, China
5
College of Electronic Engineering, South China Agricultural University, Guangzhou 510642, China
6
School of Computer Science and Technology, Guangdong University of Technology, Guangzhou 510006, China
*
Author to whom correspondence should be addressed.
Remote Sens. 2020, 12(11), 1850; https://0-doi-org.brum.beds.ac.uk/10.3390/rs12111850
Submission received: 5 May 2020 / Revised: 29 May 2020 / Accepted: 4 June 2020 / Published: 8 June 2020
(This article belongs to the Special Issue UAVs for Vegetation Monitoring)

Abstract

:
Unmanned aerial vehicle (UAV) remote sensing platforms allow for normalized difference vegetation index (NDVI) values to be mapped with a relatively high resolution, therefore enabling an unforeseeable ability to evaluate the influence of the operation parameters on the quality of the thus acquired data. In order to better understand the effects of these parameters, we made a comprehensive evaluation on the effects of the solar zenith angle (SZA), the time of day (TOD), the flight altitude (FA) and the growth level of paddy rice at a pixel-scale on UAV-acquired NDVI values. Our results show that: (1) there was an inverse relationship between the FA (≤100 m) and the mean NDVI values, (2) TOD and SZA had a greater impact on UAV–NDVIs than the FA and the growth level; (3) Better growth levels of rice—measured using the NDVI—could reduce the effects of the FA, TOD and SZA. We expect that our results could be used to better plan flight campaigns that aim to collect NDVI values over paddy rice fields.

1. Introduction

Paddy rice is a staple crop for more than half the world’s population, especially in Asia [1]. China is the largest paddy rice-producing country, but still faces challenges from a rapid increase in global food demand and food security [2]. Hence, it is of utmost importance to increase food productivity in a sustainable manner. Successful and timely estimations of paddy-rice growth are useful means of cultivation management, agricultural decision-making and tillage improvement [3]. Cultivating paddy rice scientifically can contribute to disease prevention, optimal nutrient use, yield increments and the reduction of environmental pollution arising due to excessive nitrogen use [4,5,6]. One essential aspect of effective field management practices is to monitor crop growth with higher efficiency.
For decades, optical satellite systems have been an effective means of monitoring crop growth and estimating yields [7,8]. To this end, Landsat, MODIS, AVHRR, SPOT and other satellites have been commonly used [9]. Data from these satellites can be effectively used to monitor crop growth over a vast region, but most freely available satellite data are still untimely, and the spatial resolution is insufficient for precision agriculture [10]. For example, Landsat 8 has a temporal resolution of 16 days and a spatial resolution of 30 m [11]. As timeliness and high resolution are crucial for agricultural production and management, such data have limited applicability for agricultural production monitoring and management. Additionally, satellite-derived data are often affected by atmospheric effects induced by the absorption and scattering of aerosols and molecules. Conducting the required atmospheric and spatial corrections before satellite data can be effectively analyzed adds to the time required for data analysis.
Moreover, there are many commercial field sensors that can be used to infer information on the structural and biochemical properties of vegetation in a nondestructive manner. Examples on these sensors include, but are not limited to, the GreenSeeker handheld crop sensor (Trimble, Inc., Sunnyvale, CA, USA), Crop CircleTM (Holland Scientific, Inc., Lincoln, NE, USA), N-Sensor ALS (Precision Decisions, Ltd., Shipton, UK), Crop Spec (Topcon Positioning Systems, Inc., Livermore, CA, USA) and FieldSpec 2500© (Malvern Panalytical, Malvern, UK) [12]. However, these sensors also have disadvantages, such as short sensory distance and thus, a small spatial coverage [13]. One must usually distribute a large number of sensors in the field for data collection, but even then, handheld sensor are inefficient to cover large areas [14].
Recently, UAV-based remote sensing has emerged as a promising solution for monitoring crop growth in a flexible and widely applicable manner and with a high throughput. UAVs typically have an excellent maneuverability, low cost and high safety, which gives them an advantage over some other platforms [15]. Compared to field sensors, optical imaging sensors mounted on UAVs can be used to efficiently acquire data due to their broader spatial coverage [16,17,18]. Furthermore, unlike satellite data, UAVs offer means for real-time image analysis based on high spatial resolution data. Due to the multitude of advantages of UAVs, many researchers have applied such data to study agricultural production and practices. For instance, UAV-based optical sensing has been successfully used to infer information on soybeans [19], wheat breeding, yield estimation [20], paddy-rice diseases [21] and yield evaluation [22,23].
Due to the many benefits of UAVs, they have been identified [24] as an established tool for precision agriculture [25]. In many studies, normalized difference vegetation index (NDVI), the most commonly used index in vegetation studies [26], has been successfully applied to UAV-based data [23]. Flight parameters such as the flight altitude (FA) need to be considered because they determine the quality of the remote sensing data. For instance, the ground sampling distance (GSD=size of pixel×flight altitude/focal length) [27] and the spatial coverage of the survey [28,29] determine to which extent patterns and objects can be detected. On the other hand, collecting high-quality remote-sensing data can become challenging if the bidirectional reflectance distribution function (BRDF), resulting from a large solar zenith angle (SZA), affects the results [30]. The time of day (TOD), also related to the SZA, is also an important factor that can influence optical remote sensing data and hence needs to be taken into account. In addition, in the context of rice crops, the different growth levels can influence the spectral discrimination between rice and other image components (soil and water). However, there are few studies to have comprehensively evaluated these factors. Because of these reasons, it is essential to make a comprehensive assessment of the above discussed parameters (TOD, SZA, FA and growth level) on UAV data acquired for precision agriculture.
Here, we present comparison trials of UAV-borne NDVI values, called UAV–NDVIs from herein, acquired using different flight parameters and crop growth levels. We conducted our study in a paddy rice field that was treated with different fertilizers to induce variability in crop growth levels. The specific goals of this study were to assess (1) the effects of the TOD, SZA and FA on the UAV–NDVIs; and (2) the susceptibility of the UAV–NDVIs to the variability in the growth levels of crops.

2. Materials and Methods
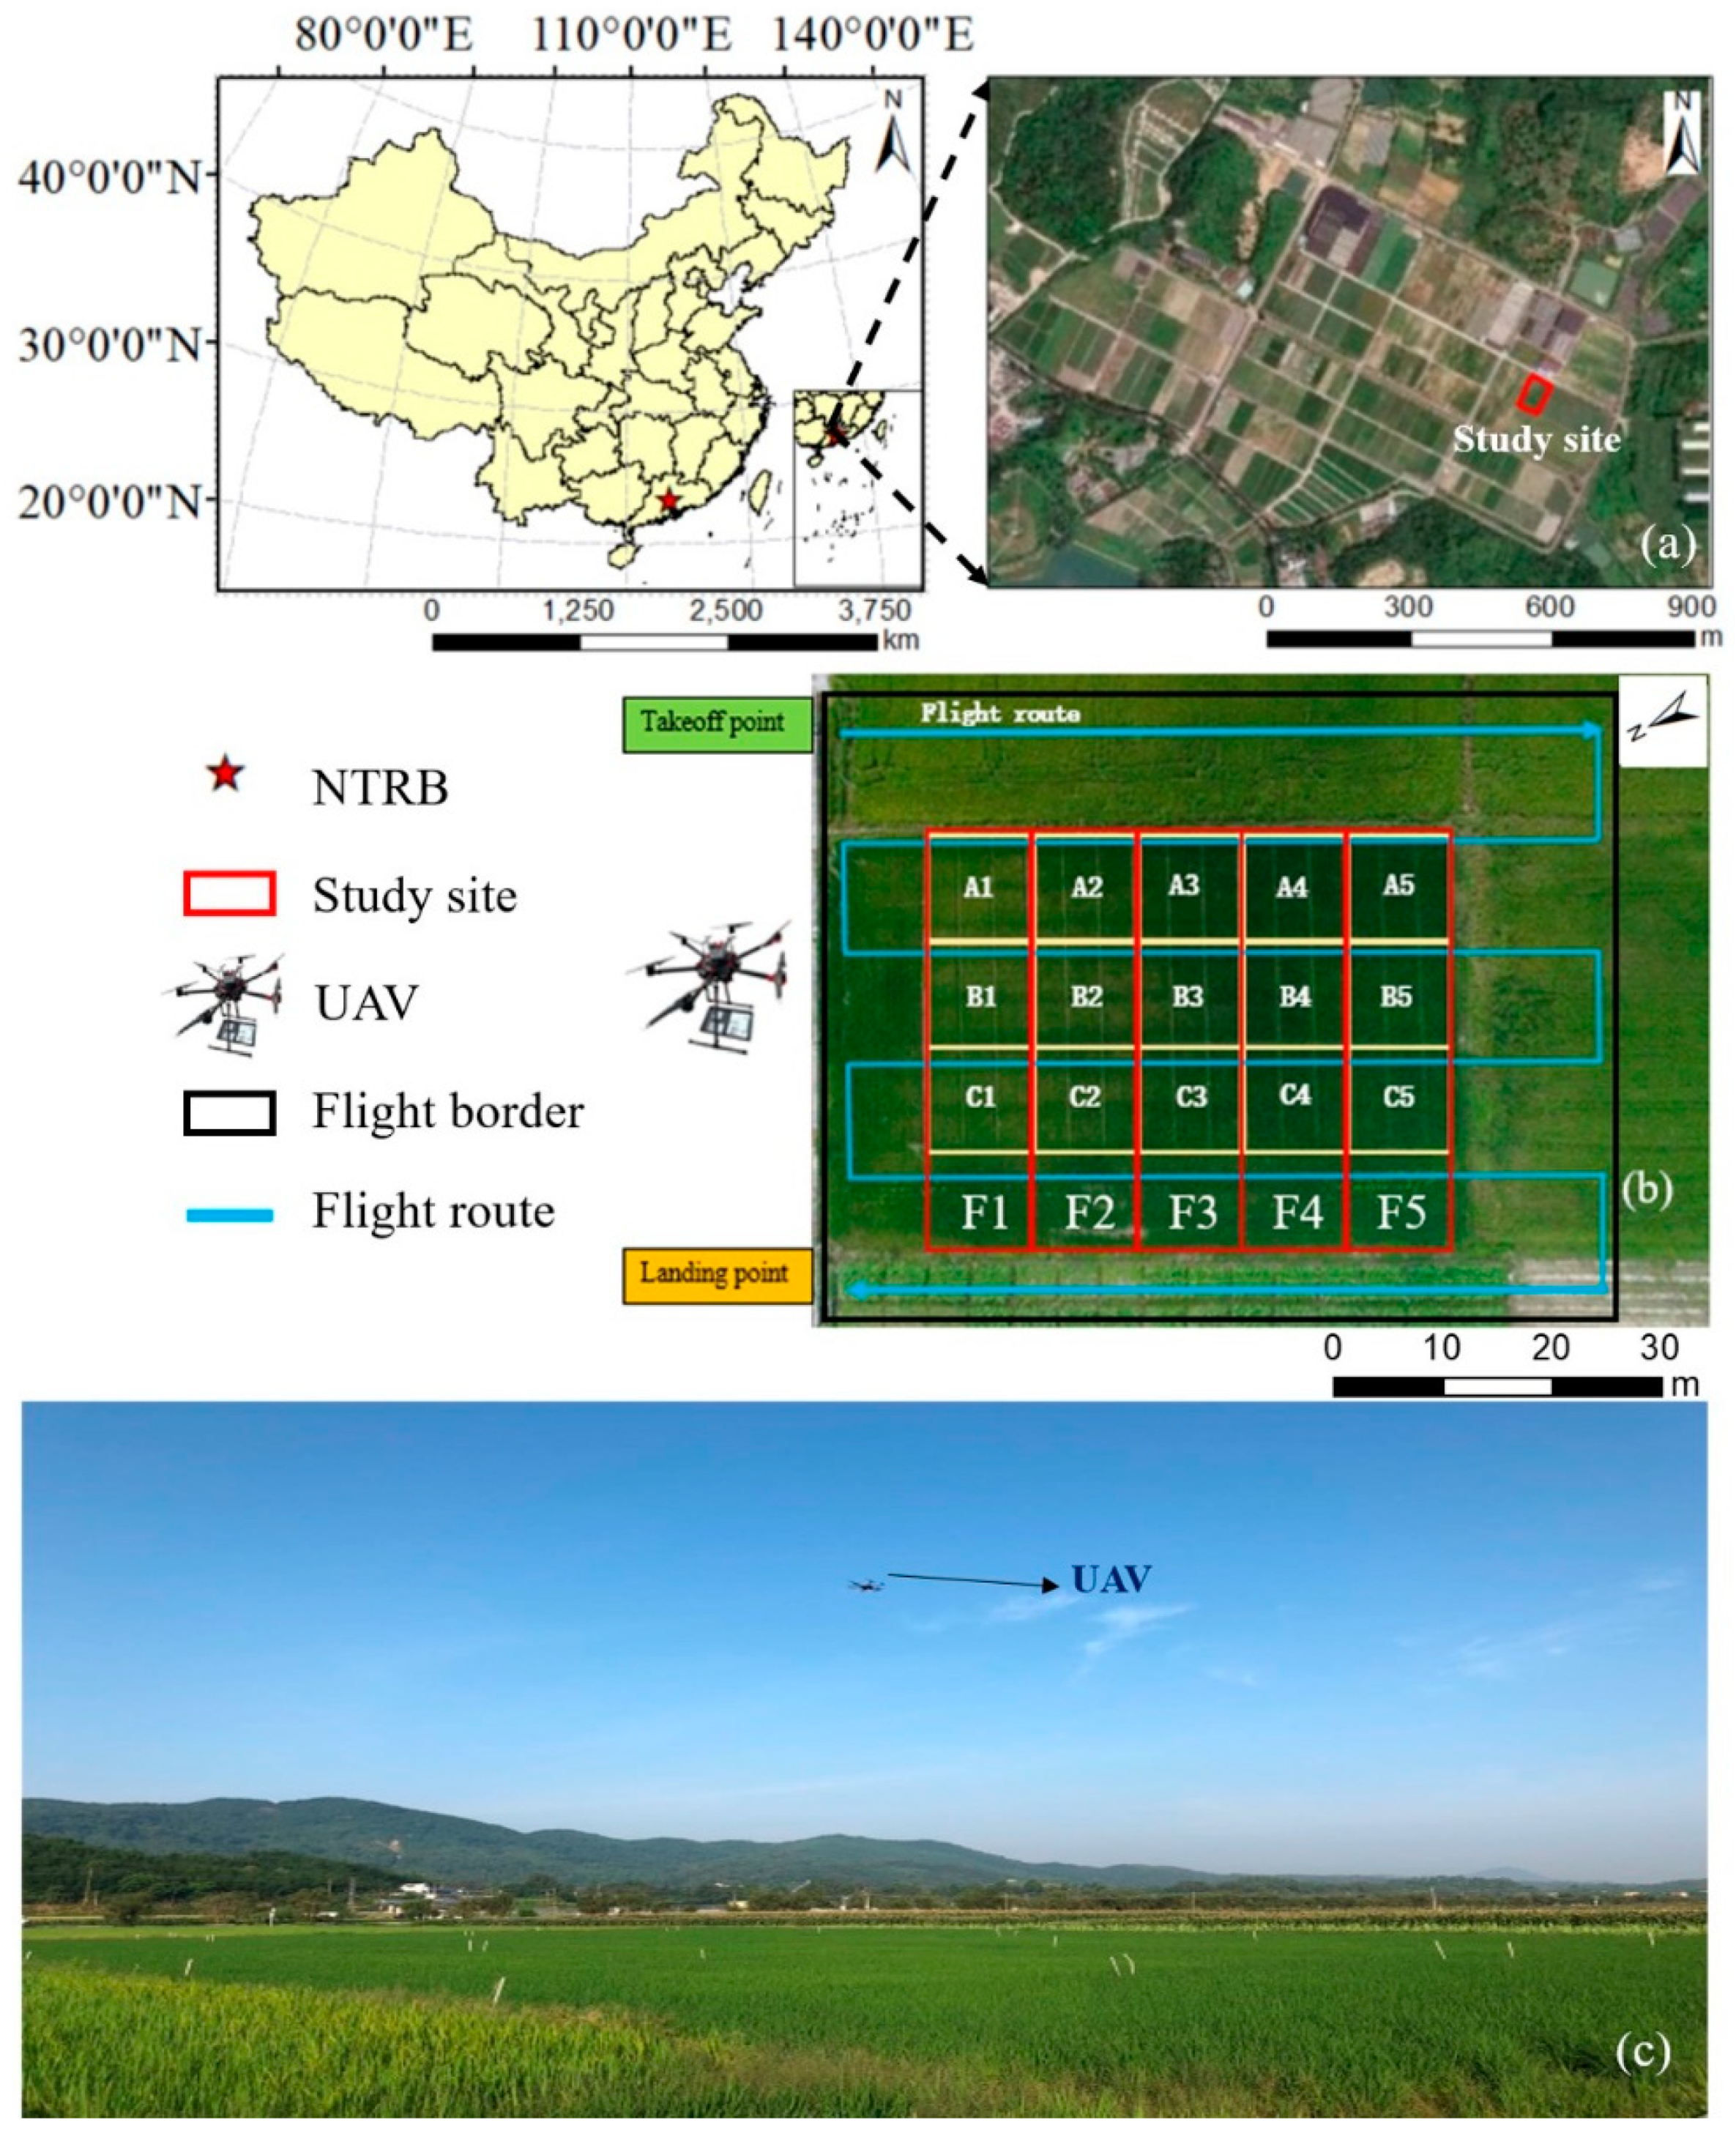
2.1. Study Site

A 1500 m2 (30 m × 50 m) paddy rice field (Figure 1a) (variety: ‘Meixiang zhan’) in the Ningxi Teaching and Research Bases (NTRB) at the South China Agricultural University, Guangzhou, China (23°14’22” N, 113°38’31” E), was selected for the survey. Plant spacing and row spacing in the field were both 0.2 m. The rice field was divided into five comparison zones: F1, F2, F3, F4 and F5. Each zone consisted of three fields, F1: A1, B1 and C1; F2: A2, B2 and C2; F3: A3, B3 and C3; F4: A4, B4 and C4; F5: A5, B5 and C5 (Figure 1b). The size of each field was 10 m×10 m. Additionally, five zones were fertilized with different nitrogen application rates (Figure 2). It should be noted that the fields of each comparison zone were treated with the same fertilization strategy. This strategy involved applying different amounts of base fertilizer, tillering fertilizer and panicle fertilizer to create differences in crop growth.

2.2. UAV Data Collection

A Micasense RedEdge-M camera (MicaSense, Inc., Seattle, WA, USA) was attached to the Matrice-600 Pro UAV (DJI, Inc., Shenzhen, China), a six-rotor UAV, for the aerial imagery collection. This camera has five independent imagers, each with a custom narrowband filter that enables the imager to receive a precise spectrum. The RedEdge-M camera also includes a downwelling light sensor (DLS) and a GPS module. The DLS is a light sensor with five bands, which need to connect directly to the host for radiation calibration. The specifications of the RedEdge-M camera are given in Table 1.
The flight plans were designed using the Atlas Flight application (Micasense, Inc., Fremont, CA, USA). The flight altitudes were set to 40 m, 60 m, 80 m and 100 m and the flight speed was set to 5 m/s. In addition. the side overlap, and forward overlap of the camera were set to 80% to ensure effective orthorectification and mosaicking of the resulting images. Following the instructions of the Micasense manual (https://support.micasense.com), a calibrated Teflon panel was imaged by the RedEdge-M camera for radiometric calibration before and after each flight. Using these settings, the image acquisition was conducted above the study area from 6 am to 6 pm on June 11, 2018. A total of 48 flights were thus conducted and 31,980 images were collected by performing each flight mission at an interval of 15 minutes. Detailed flight parameters are given in Table 2.

2.3. Ground Data Collection

The ground NDVI data were obtained using the GreenSeeker handheld crop sensor (Trimble, Inc., Sunnyvale, CA, USA), which has two independent LEDs that can emit 774 nm near-infrared (NIR) light and 656 nm red light. Due to its own light source, the sensor is relatively unaffected by solar conditions. In this study, the GreenSeeker sensor was used to acquire NDVI ground data (called GS–NDVIs from here forward), to determine the different growth levels of the five zones (F1–F5) described above. The GreenSeeker sensor calculates the NDVI values using the following formula:
G S N D V I ( 656   nm , 774   nm ) = R 774 R 656 R 774 + R 656
where R 774 is the reflectance of near-infrared light (774 nm) and R 656 is the reflectance of red light (656 nm).
In practice, the GS–NDVI values were acquired by positioning the sensor at a 0.8-m height above the canopy. These data were acquired simultaneously with the UAV data to minimize potential discrepancies caused by asynchronous data acquisition. A total of 60 randomly distributed GS–NDVI values were collected from each zone, resulting in a total of 300 measurements across the study area.

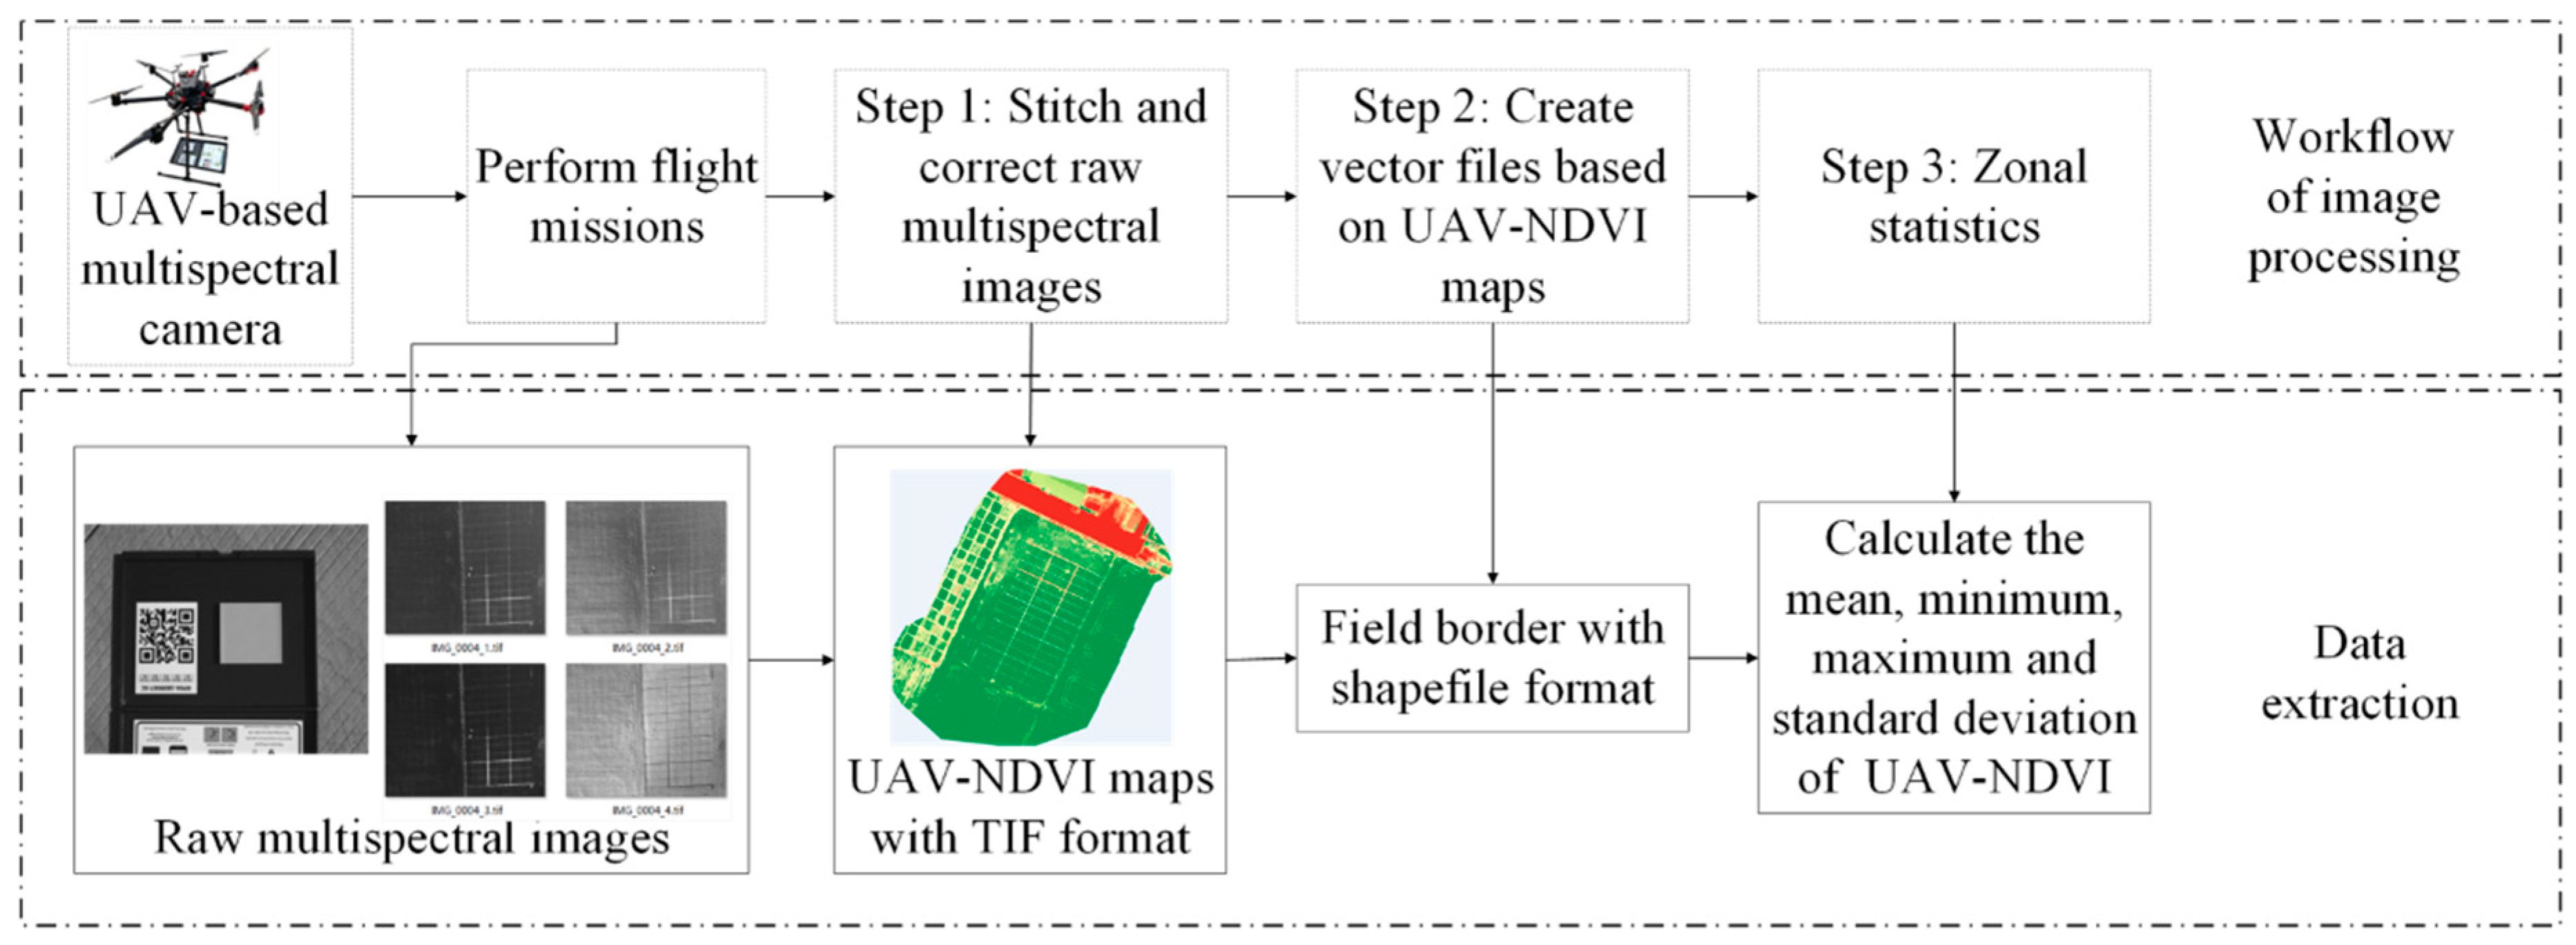
2.4. Data Processing and Analysis

The 60 GS–NDVI measurements acquired from each of the five zones were first averaged to create a single representative value for each zone. A map was then compiled of these five GS–NDVI values using the ArcMap software (ESRI, Redlands, CA, USA).
The UAV images were processed in three steps as shown in Figure 3. First, the original images were stitched and geometrically and radiometrically corrected using the Pix4D mapper software (Pix 4D, Inc., Lausanne, Switzerland). Using these images, the UAV–NDVI values were computed using the red and NIR bands of the RedEdge-M camera:
U A V N D V I ( 668   nm , 860   nm ) = R 840 R 668 R 840 + R 668
where R 840 is the reflectance of near-infrared light (840 nm) and R 668 is the reflectance of red light (668 nm).
Second, five shapefiles were created to represent each zone using ArcMap. Finally, the Zonal Statistics tool of ArcMap was used to calculate the mean, minimum, maximum and standard deviation (STDEV) of the pixel-scale UAV–NDVI data. These statistics were calculated separately for the five zones, represented by the five shapefiles created in step two. Of the collected values, the mean UAV–NDVI reflects the mean productivity and biomass, and the standard deviation indicates the spatial variability in productivity. The minimum and maximum UAV–NDVIs can provide information on pixel mixing. The count of pixels (COP) of a certain NDVI can give indicators of the NDVI distribution and is determined by the ground sampling distance (GSD), which in turn is influenced by the FA. Therefore, the COPs of each NDVI value were computed to analyze the effect of the FA on the UAV–NDVIs.
In addition to the aforementioned, a total of 48 SZAs were calculated using the NOAA Solar Calculator tool (https://www.esrl.noaa.gov) that was given the location of the study site and the TOD of each flight mission. From herein, identifiers M6–M17 are used to represent each TOD. For example, M6 stands for TOD from 6 am to 7 am, and M13 represents the TOD from 1 pm to 2 pm, and so on. It should be noted that this experiment was only conducted for the UAV data because the GreenSeeker instrument has its internal light source and hence, the effects of the TOD are negligent in the ground data. The significance of the effects of the FA, TOD, SZA and growth level on the UAV–NDVIs was determined using the Standardized Regression Coefficients [31] analysis which reflects the relative importance of different variables. This analysis was conducted using the SPSS® software package (IBM, NY, USA) to evaluate the order of influence.

3. Results

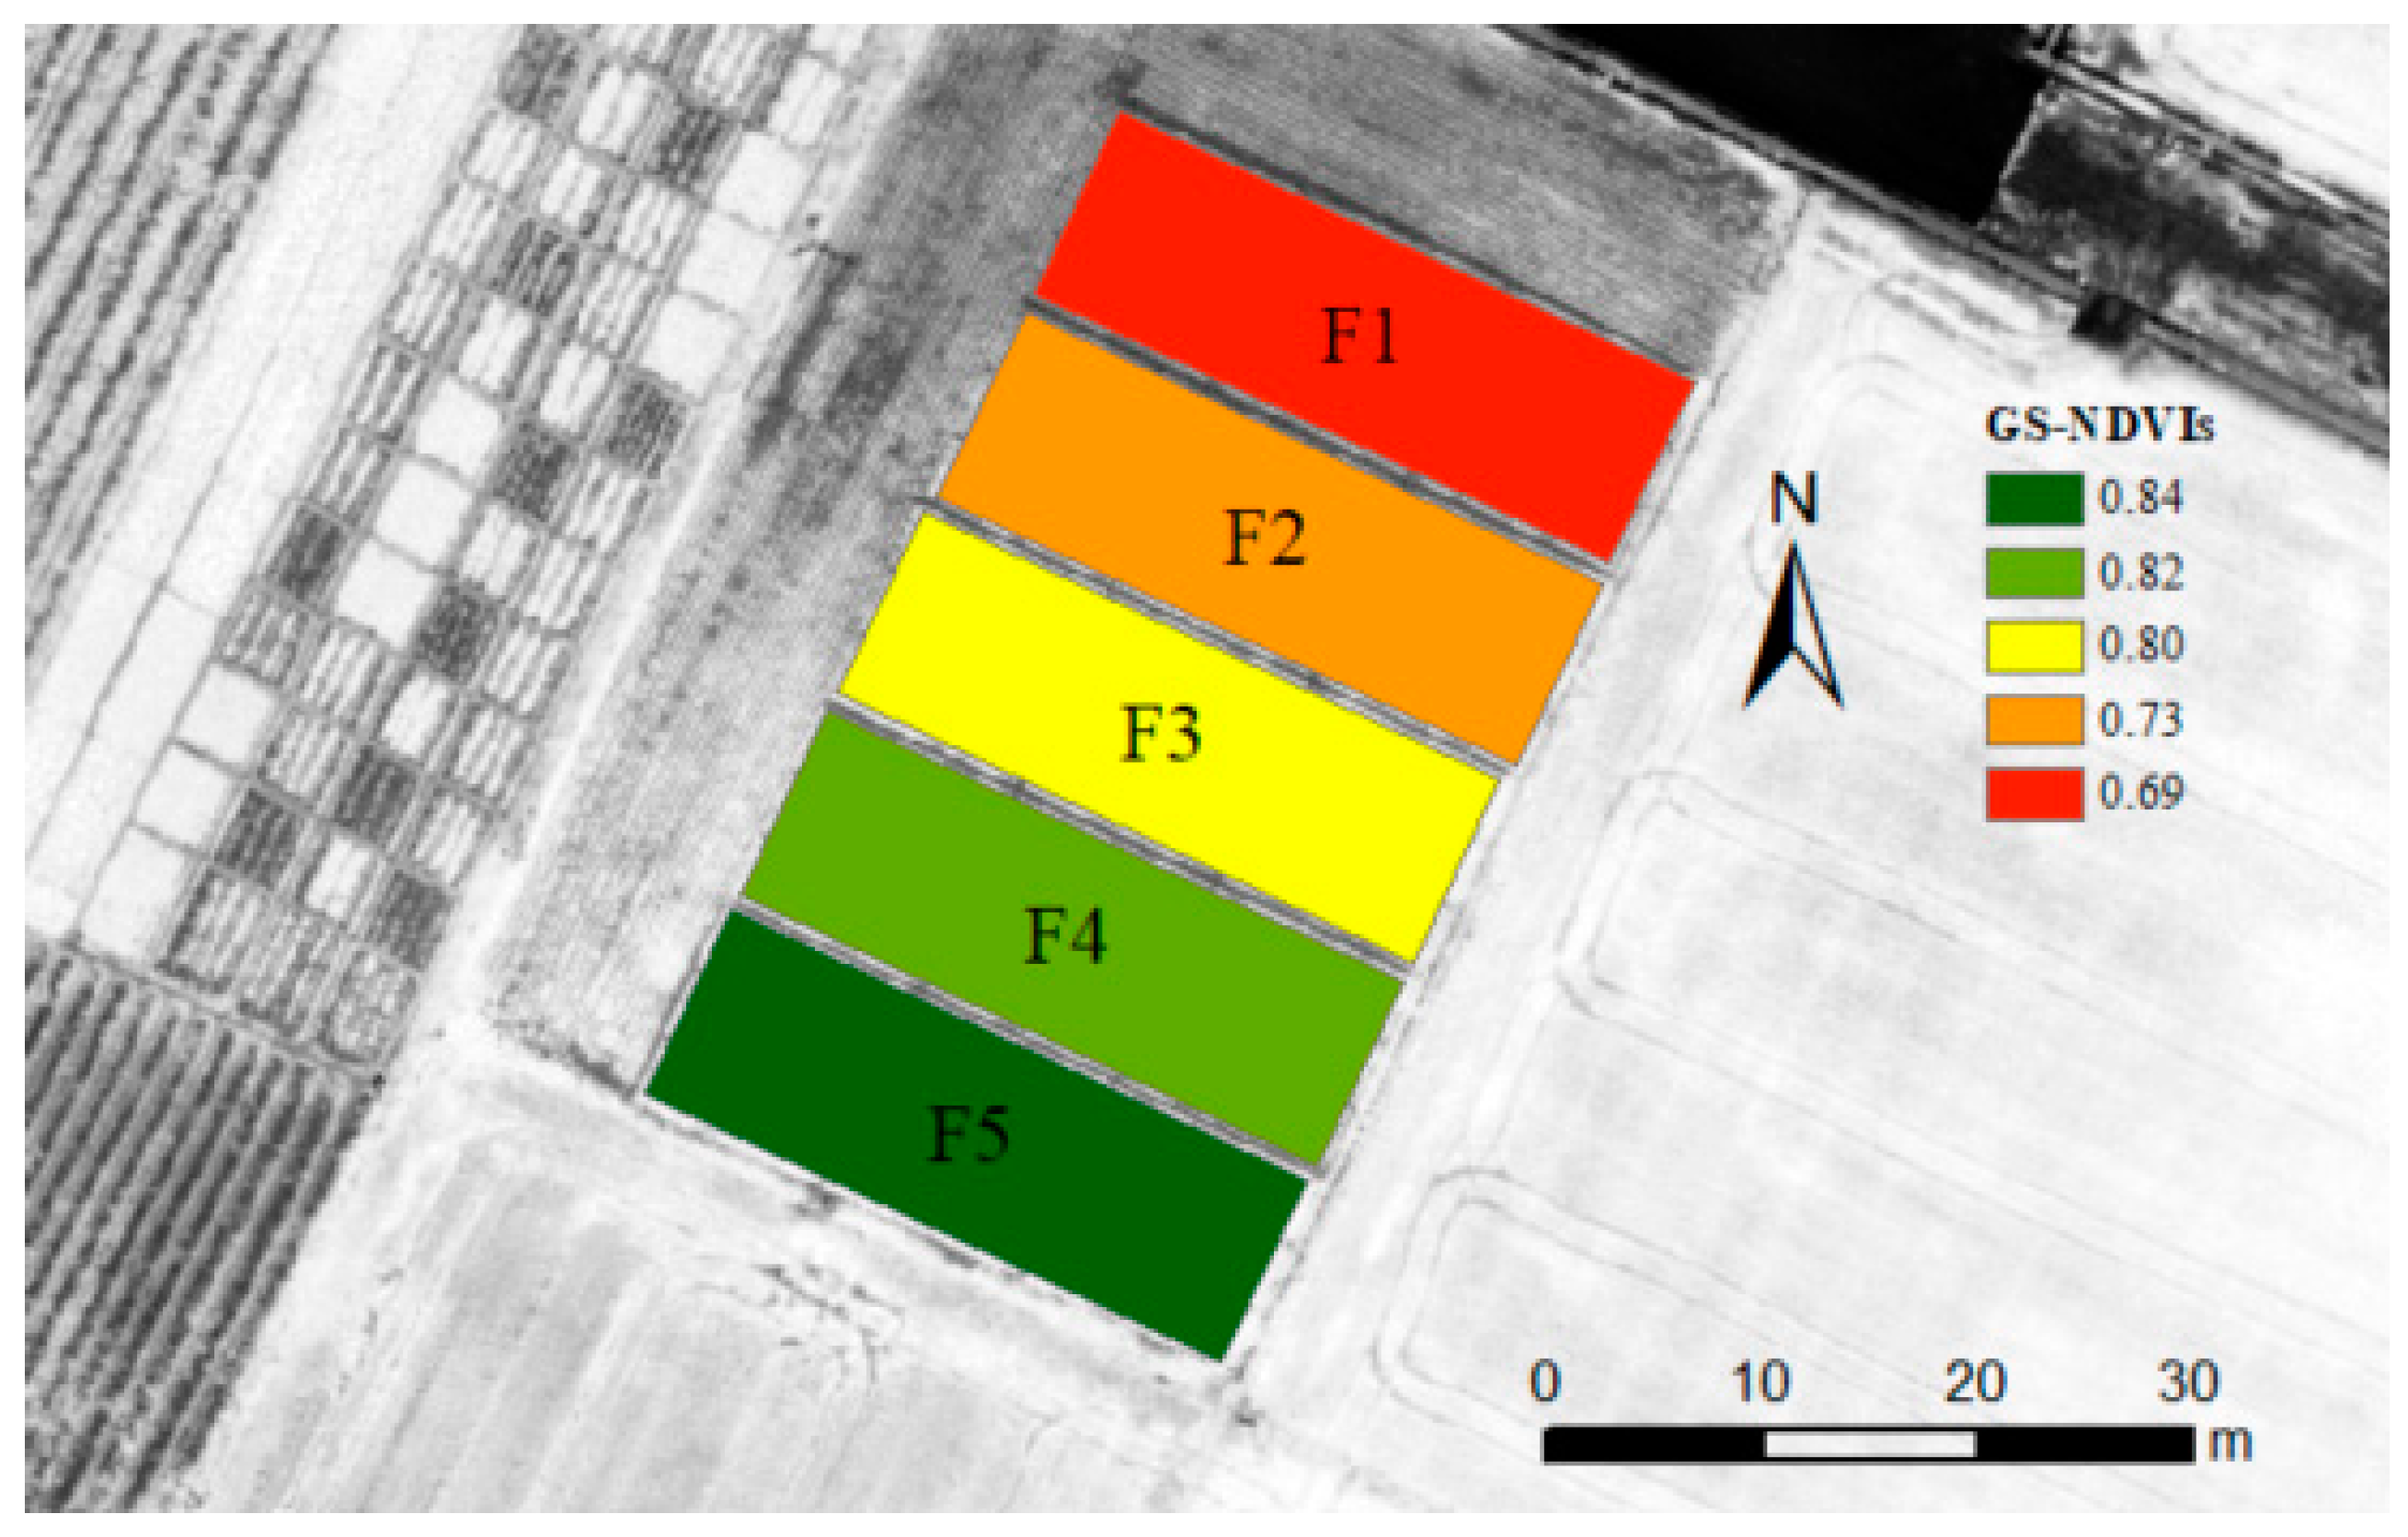
3.1. The Rice Growth Levels Determined by the GS–NDVIs

In Figure 4, the mean GS–NDVI values, obtained through ground measurements, are shown. As can be seen in figure, there is a trend from the highest NDVI values in zone F5 toward the lowest NDVI values in zone F1. This trend is consistent with fertilizer use, shown in Figure 2, that increases from zone F1 toward zone F5. Therefore, it is obvious that the differences in the NDVI values are due to the fertilizer strategy and the zones thus represent different growth levels of paddy rice.

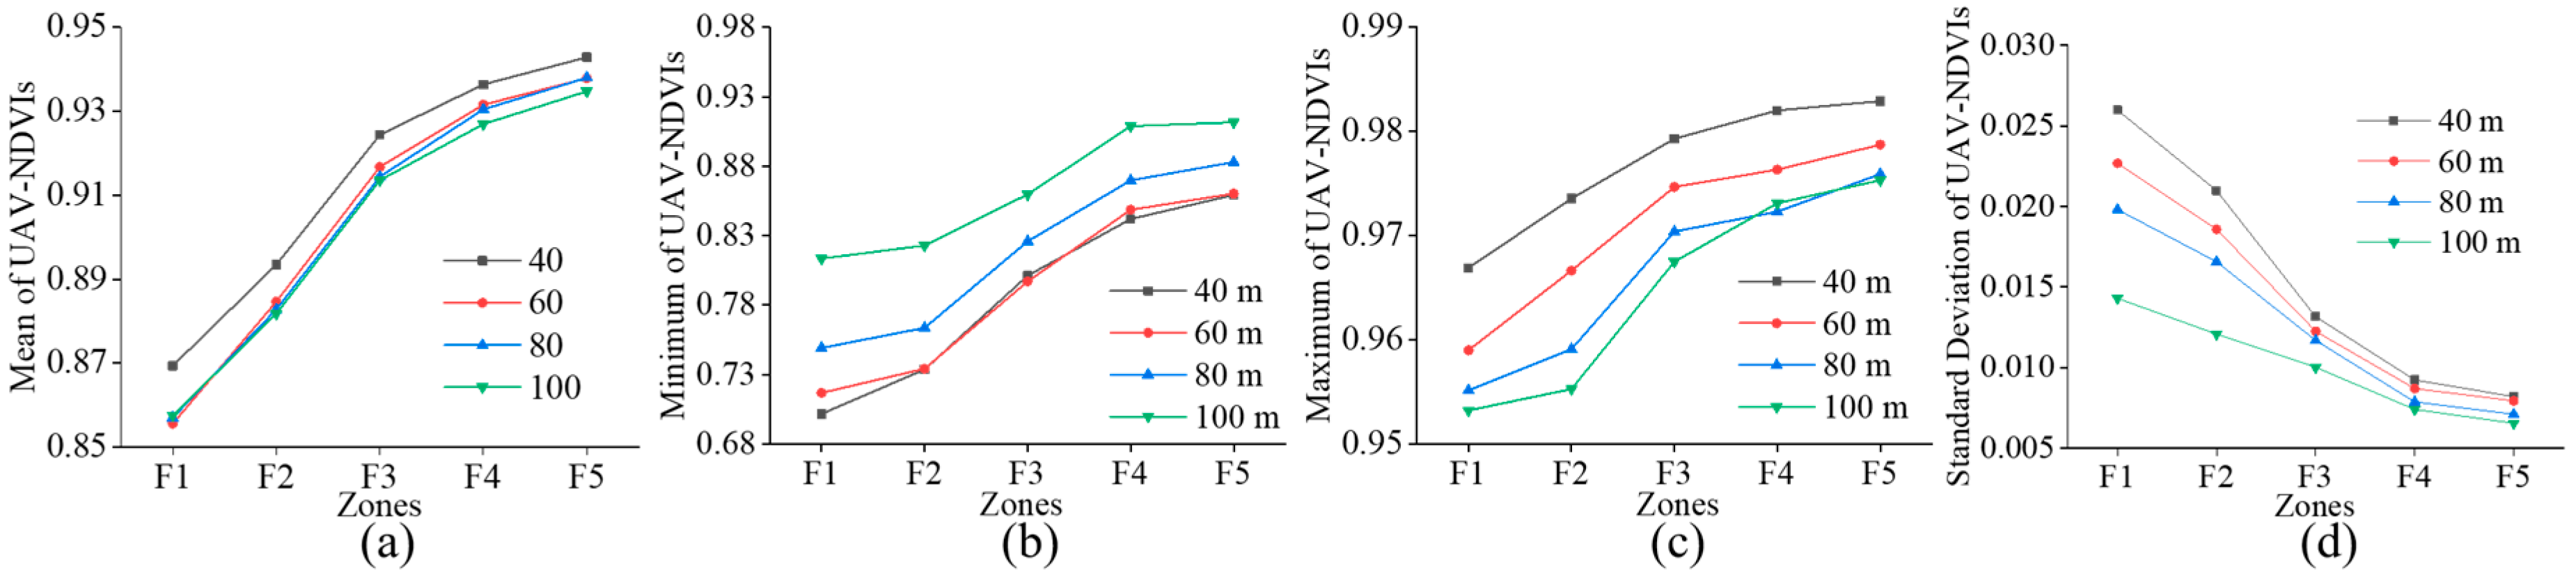
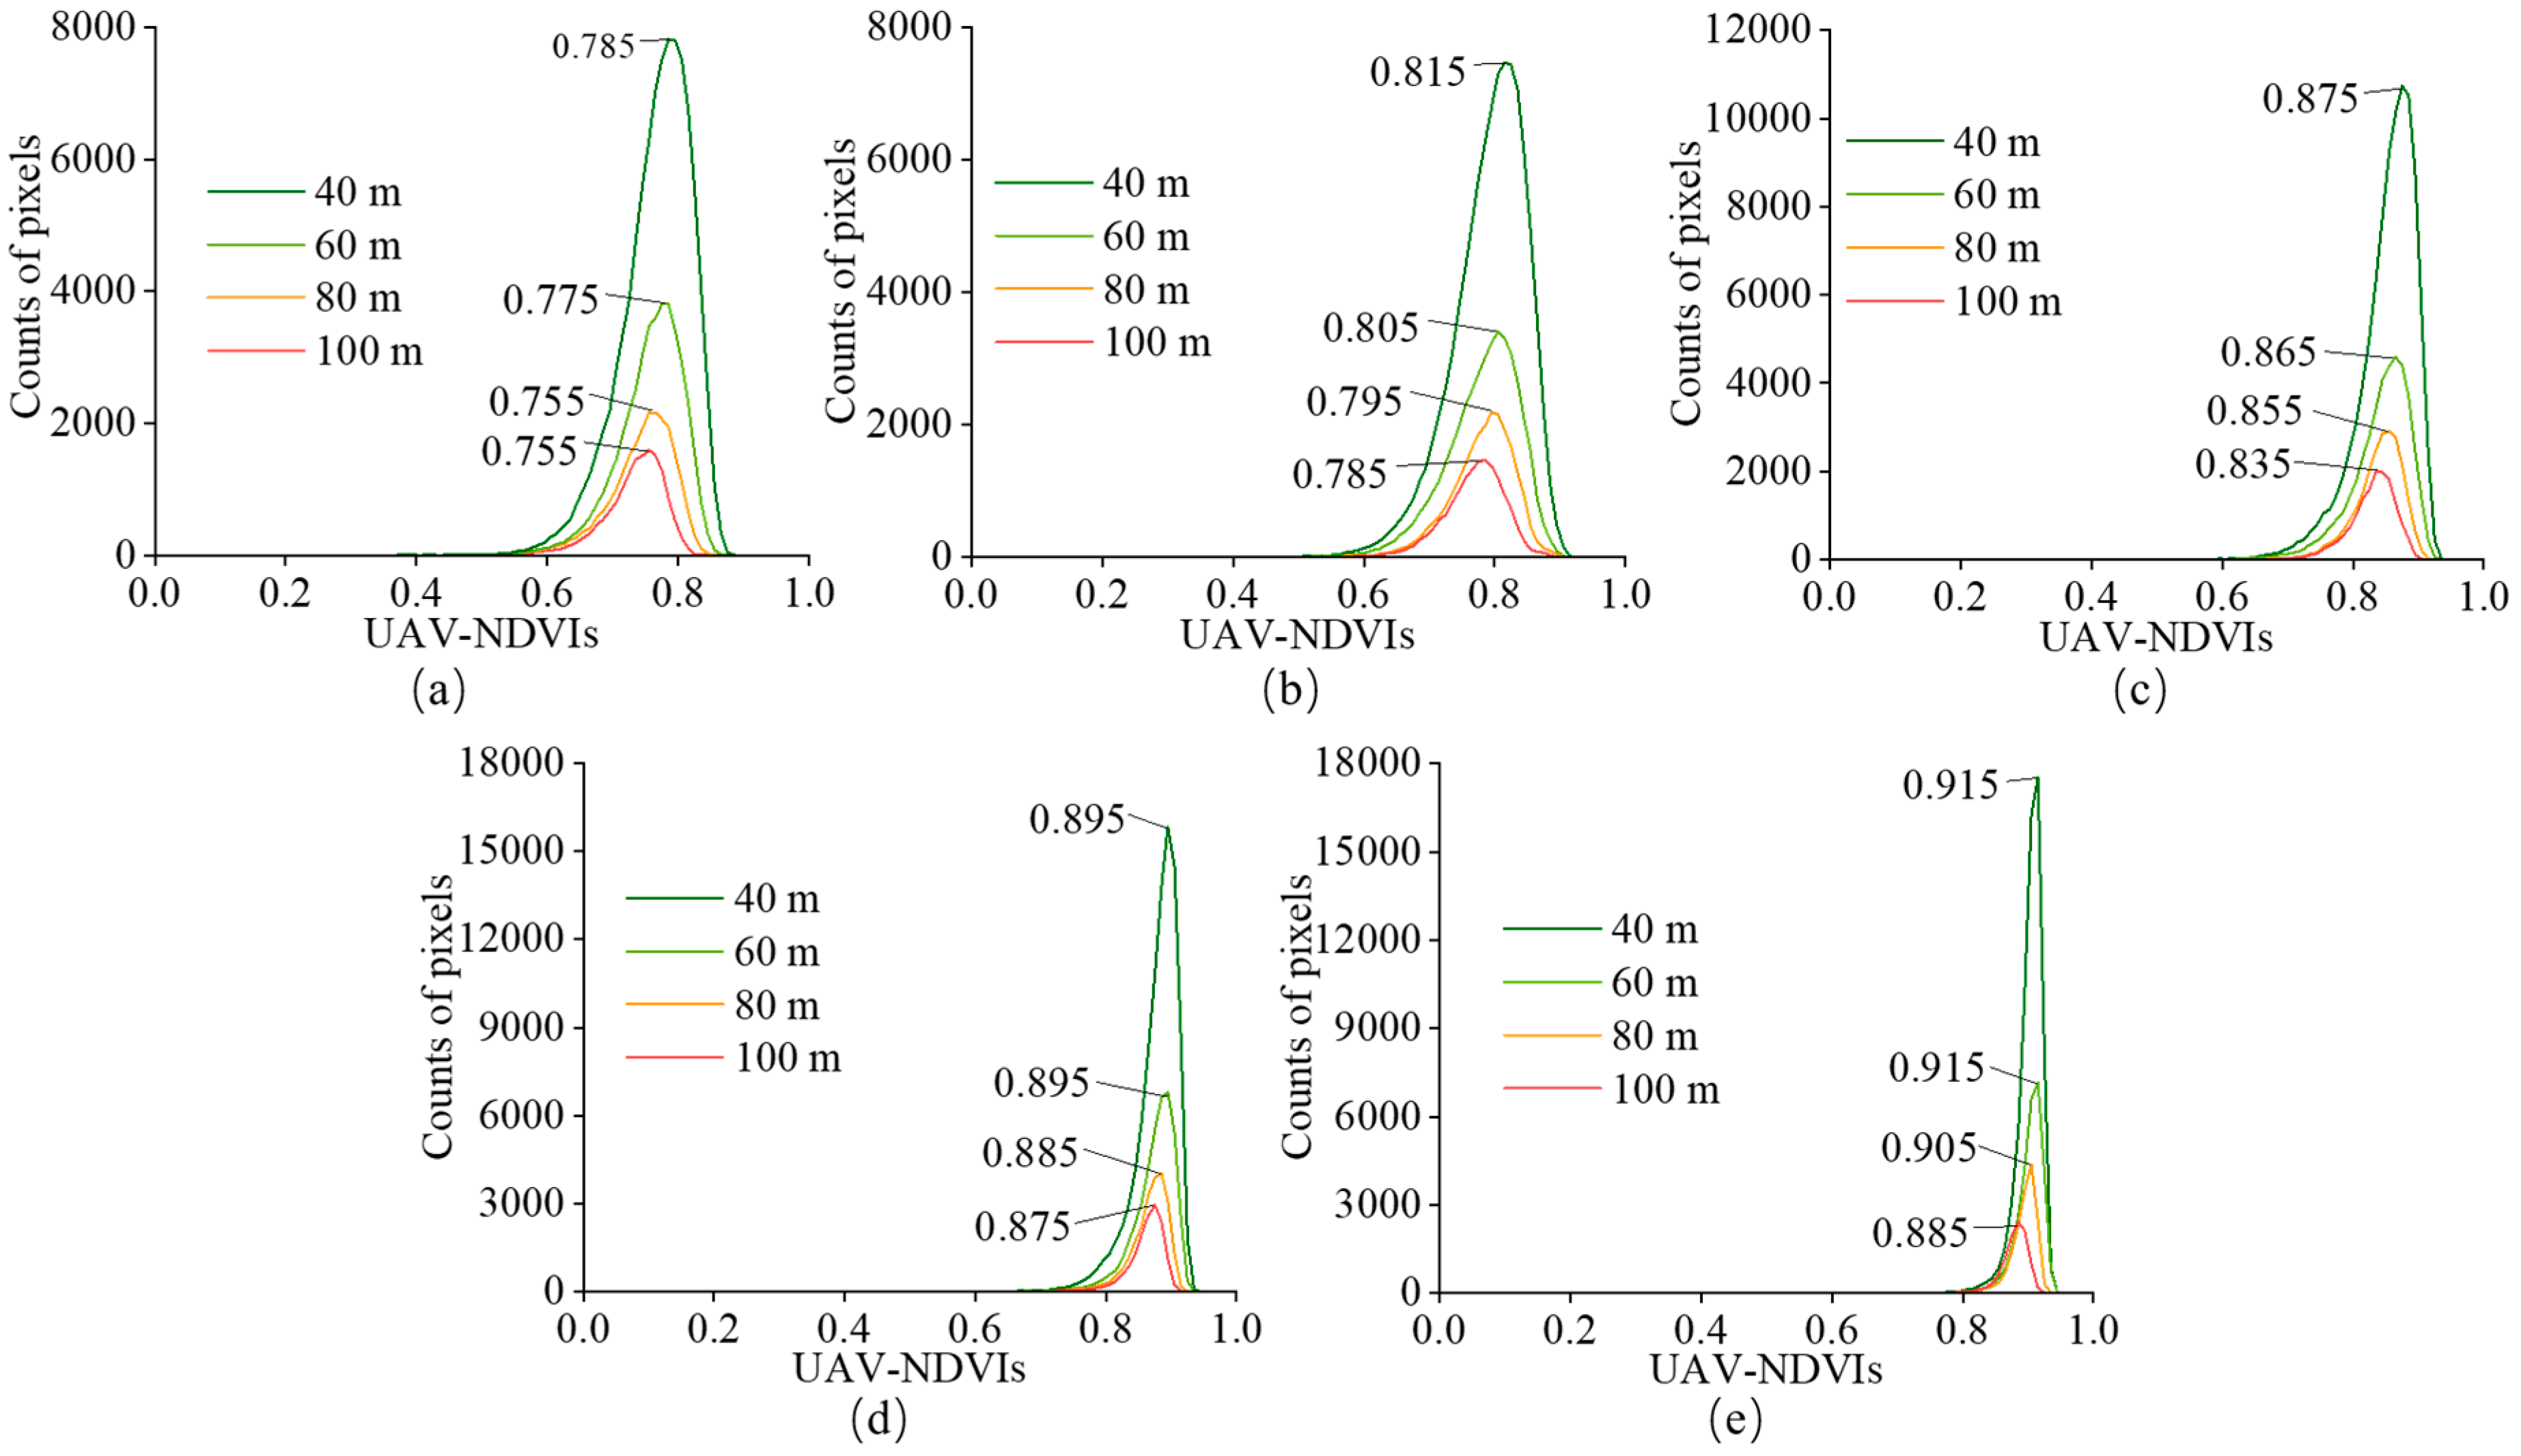
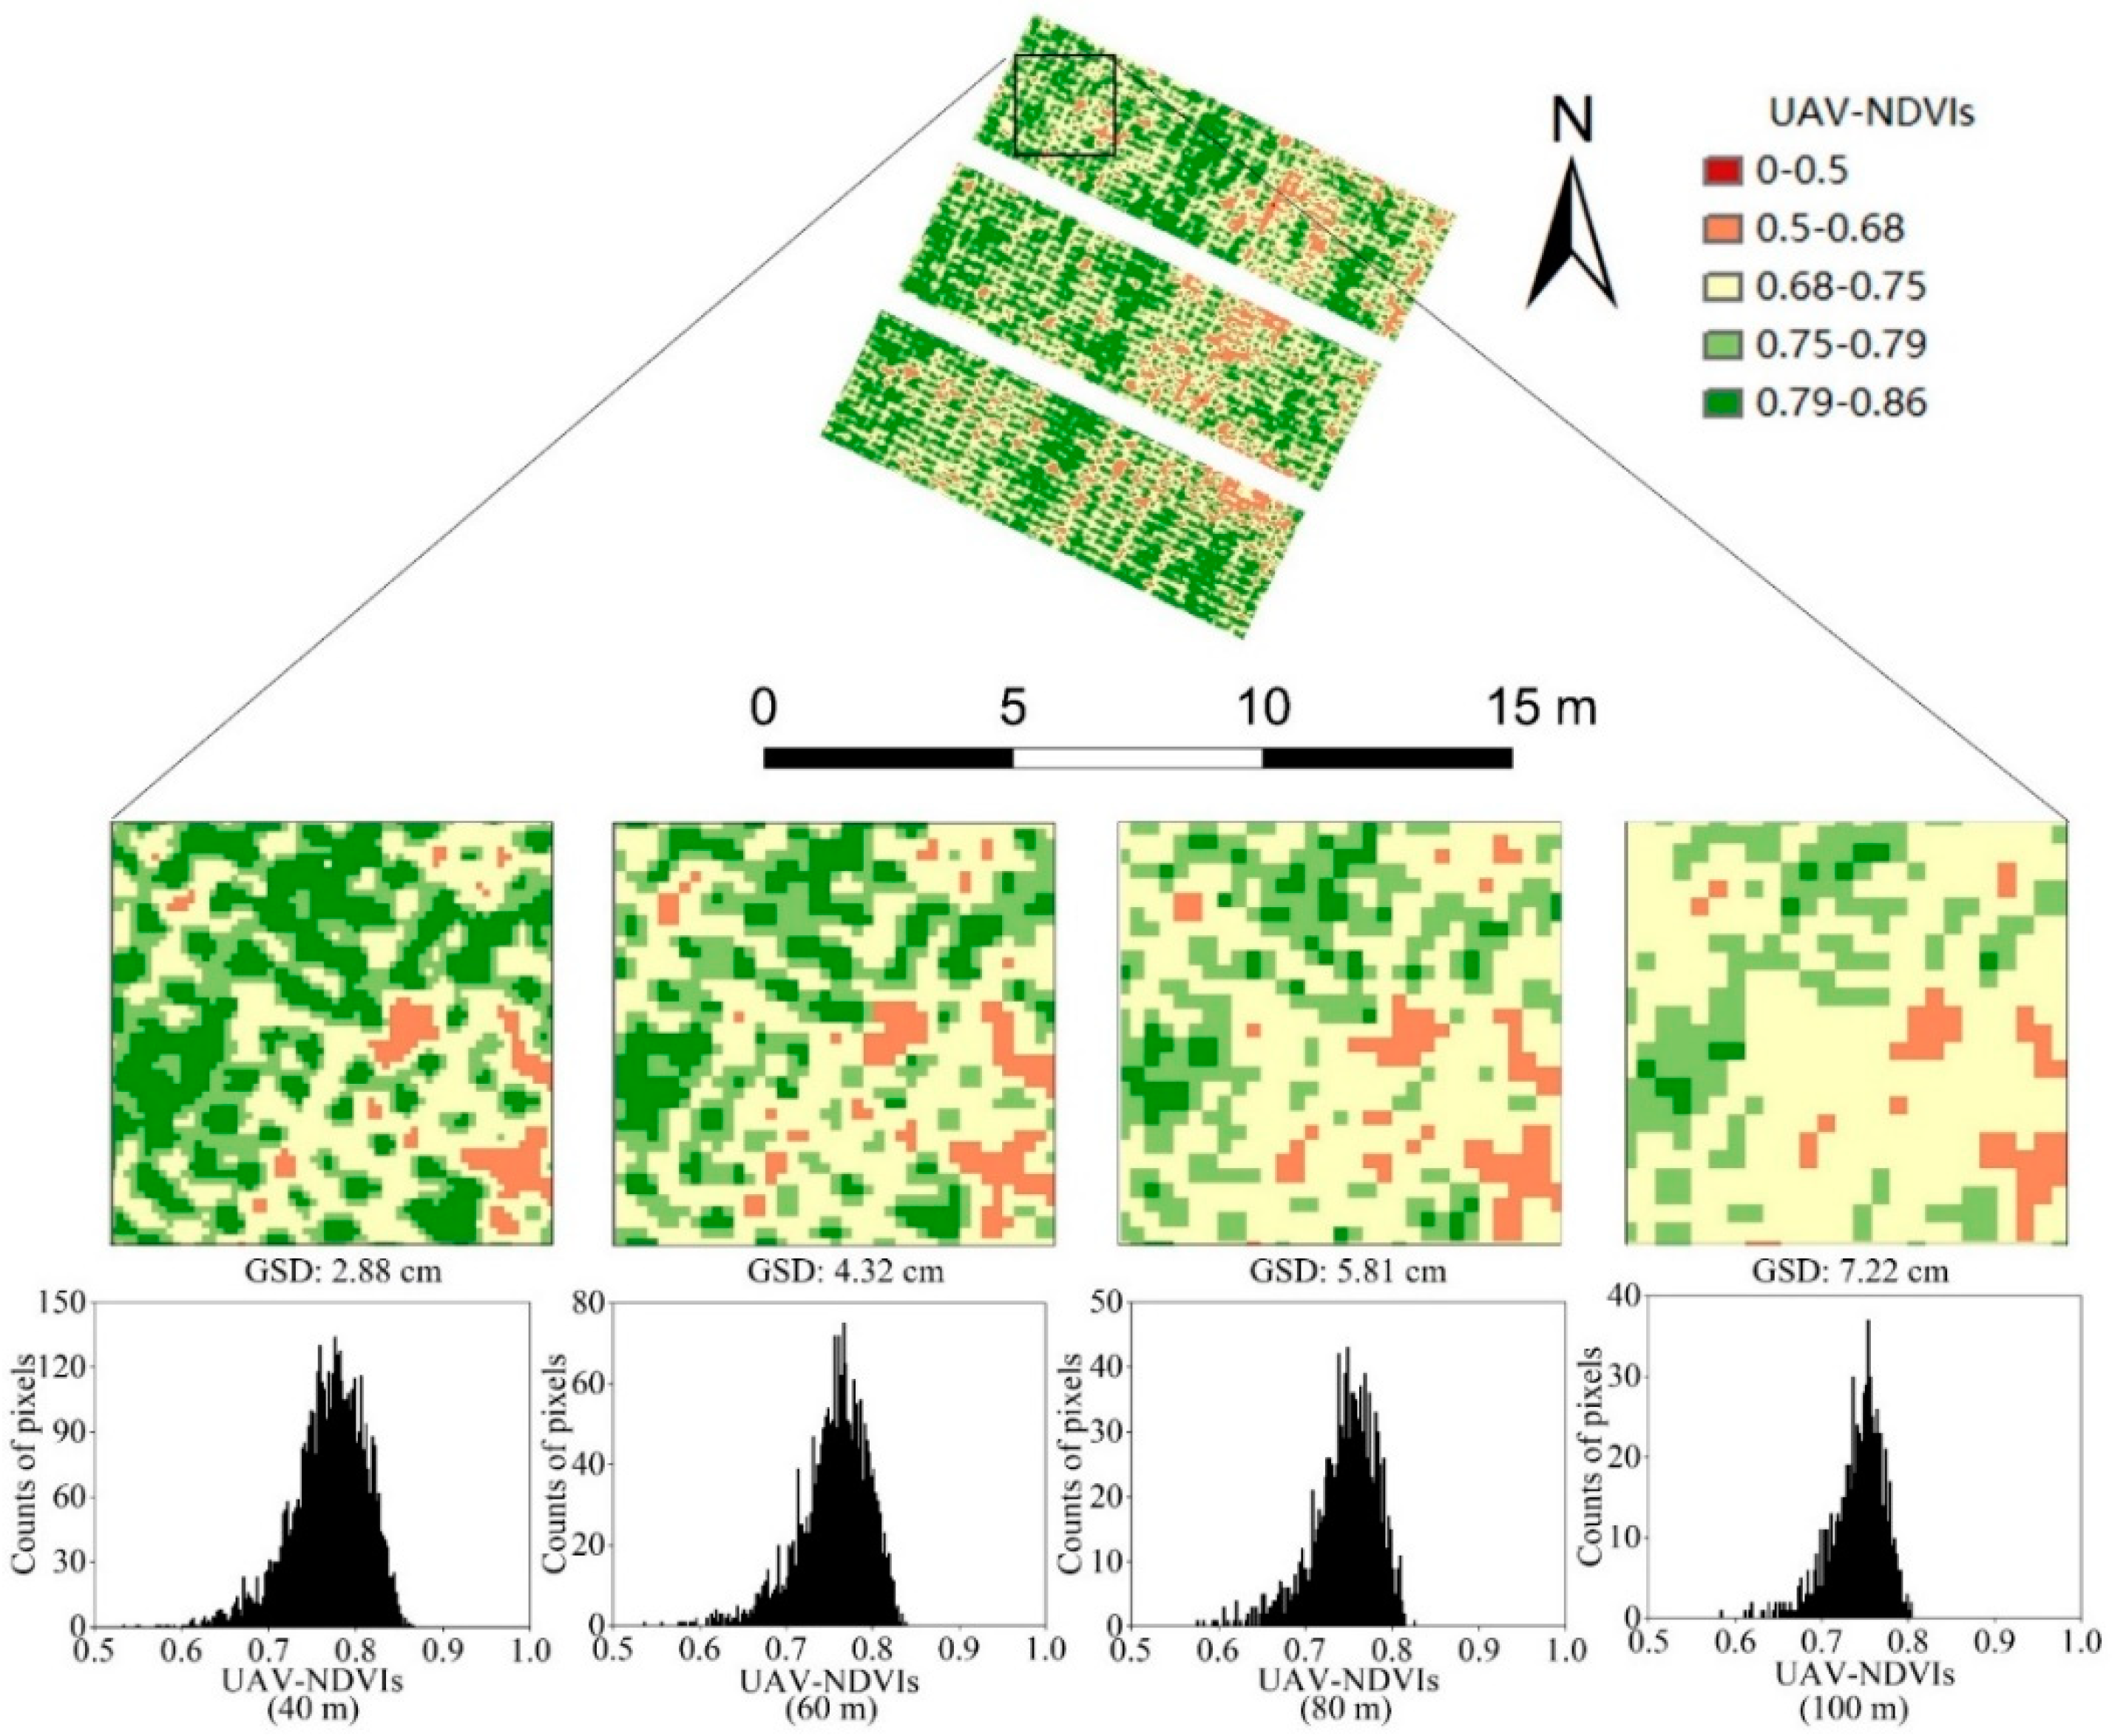
3.2. Effects of the Flight Altitude (FA) on the NDVI Values

In this experiment, we analyzed the influence of the FA on the UAV–NDVIs. The resulted, shown in Figure 5, suggest five trends: (i) the mean and maximum UAV–NDVIs increase with decreasing FA (Figure 5a,c); (ii) the minimum UAV–NDVIs increase with increasing FA (Figure 5b); (iii) the standard deviation values decrease with increasing FA (Figure 5d); (iv) the mean, minimum and maximum UAV–NDVIs increase from zone F1 to zone F5 and (v) the standard deviation values decrease from zone F1 to zone F5. These trends were based on the obtained UAV–NDVI values throughout the day.
In order to further analyze the COP differences of the UAV–NDVIs in the field-scale, the COP distribution curves of the UAV–NDVIs were analyzed under different FAs for fields B1–B5 (Figure 6). It could be seen that, on the whole, the higher the FA, the lower the COP, the smaller the NDVI value of the peak COP and the smaller the NDVI value overall. For instance, in B1 (Figure 6a), the peak COP NDVI values were 0.785, 0.775, 0.755 and 0.755 for 40 m, 60 m, 80 m, 100 m, respectively, and the COPs of these peak NDVI values were 7820, 3808, 2162 and 1596, respectively. The mean UAV–NDVIs of the FAs from 40 m to 100 m were 0.766, 0.756, 0.742 and 0.733. The same tendency could be observed in the other fields.

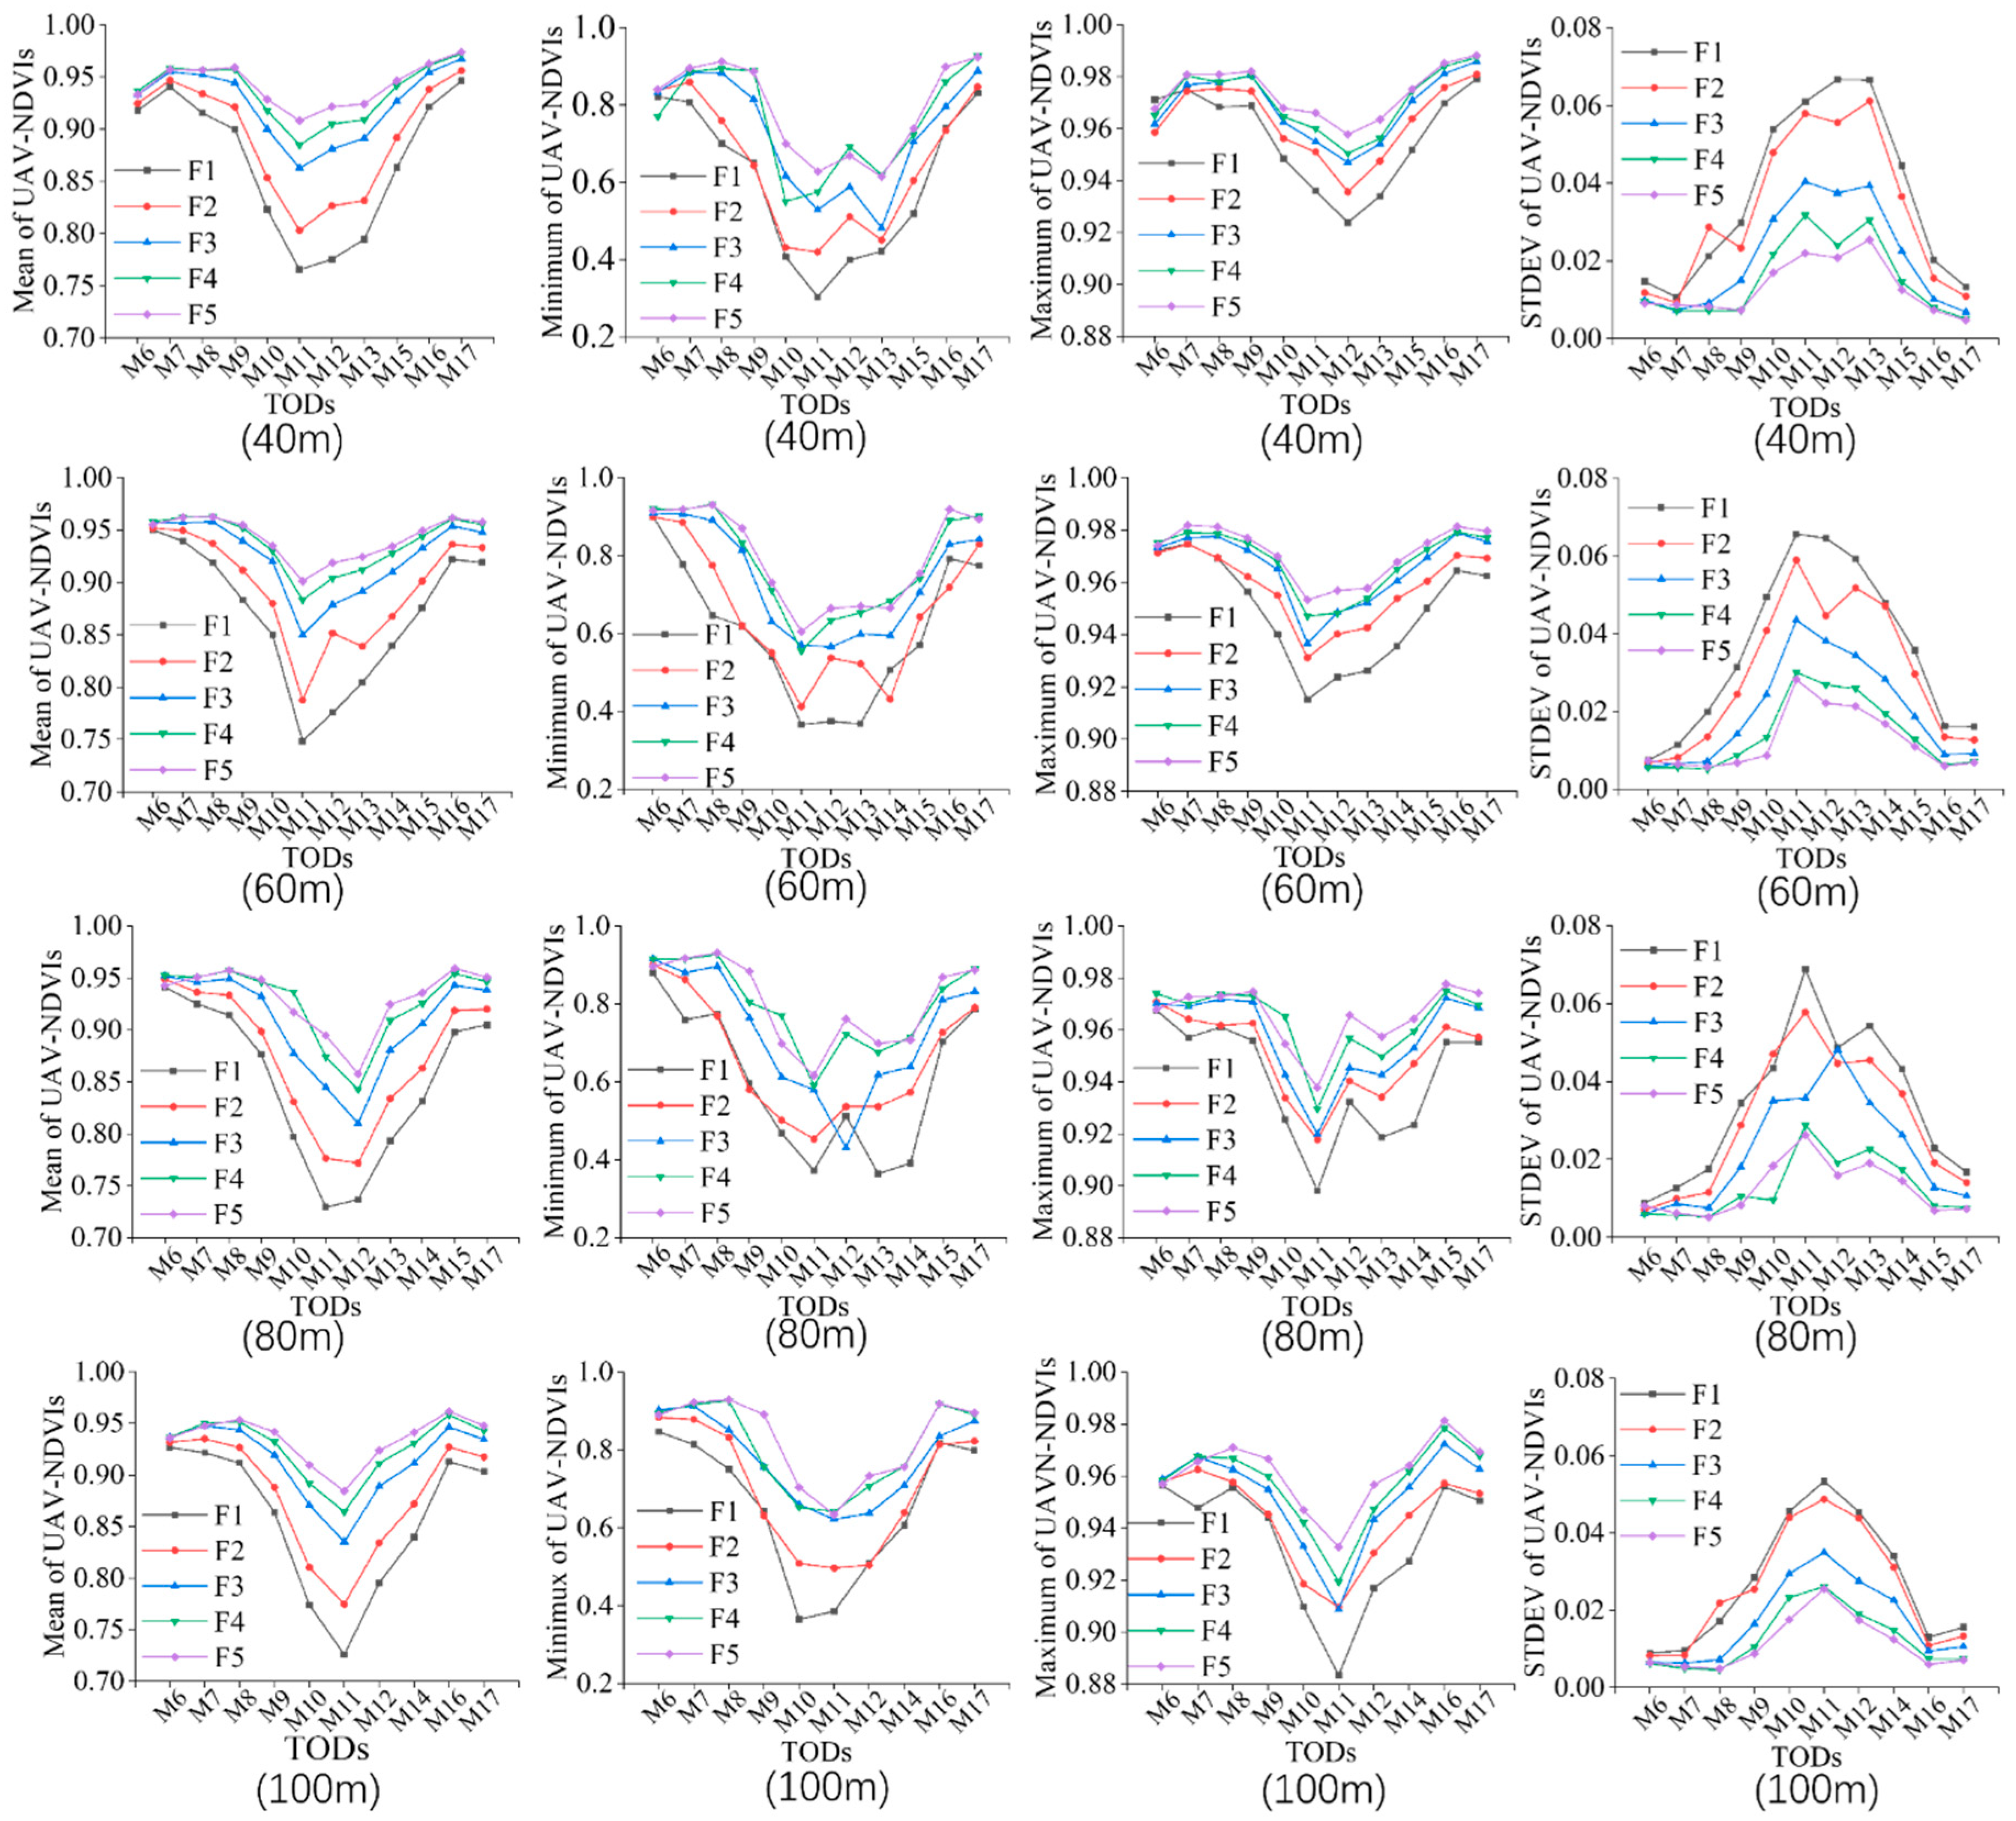
3.3. Effects of the Time of Day (TOD) on the NDVI Values

Figure 7 showed the trends of the UAV–NDVIs of the five zones (F1–F5) as a function of the TOD and FA. As can be seen in figure, the general trend of the mean UAV–NDVIs was nearly uniform across all zones and FAs. This suggests that the mean, minimum and maximum UAV–NDVIs were highest during the morning (TODs: M6–M9) and late afternoon (TODs: M13–M17) and lowest around the midday (TODs: M10 to M12). In contrast, the standard deviation values were higher around midday than at other times.

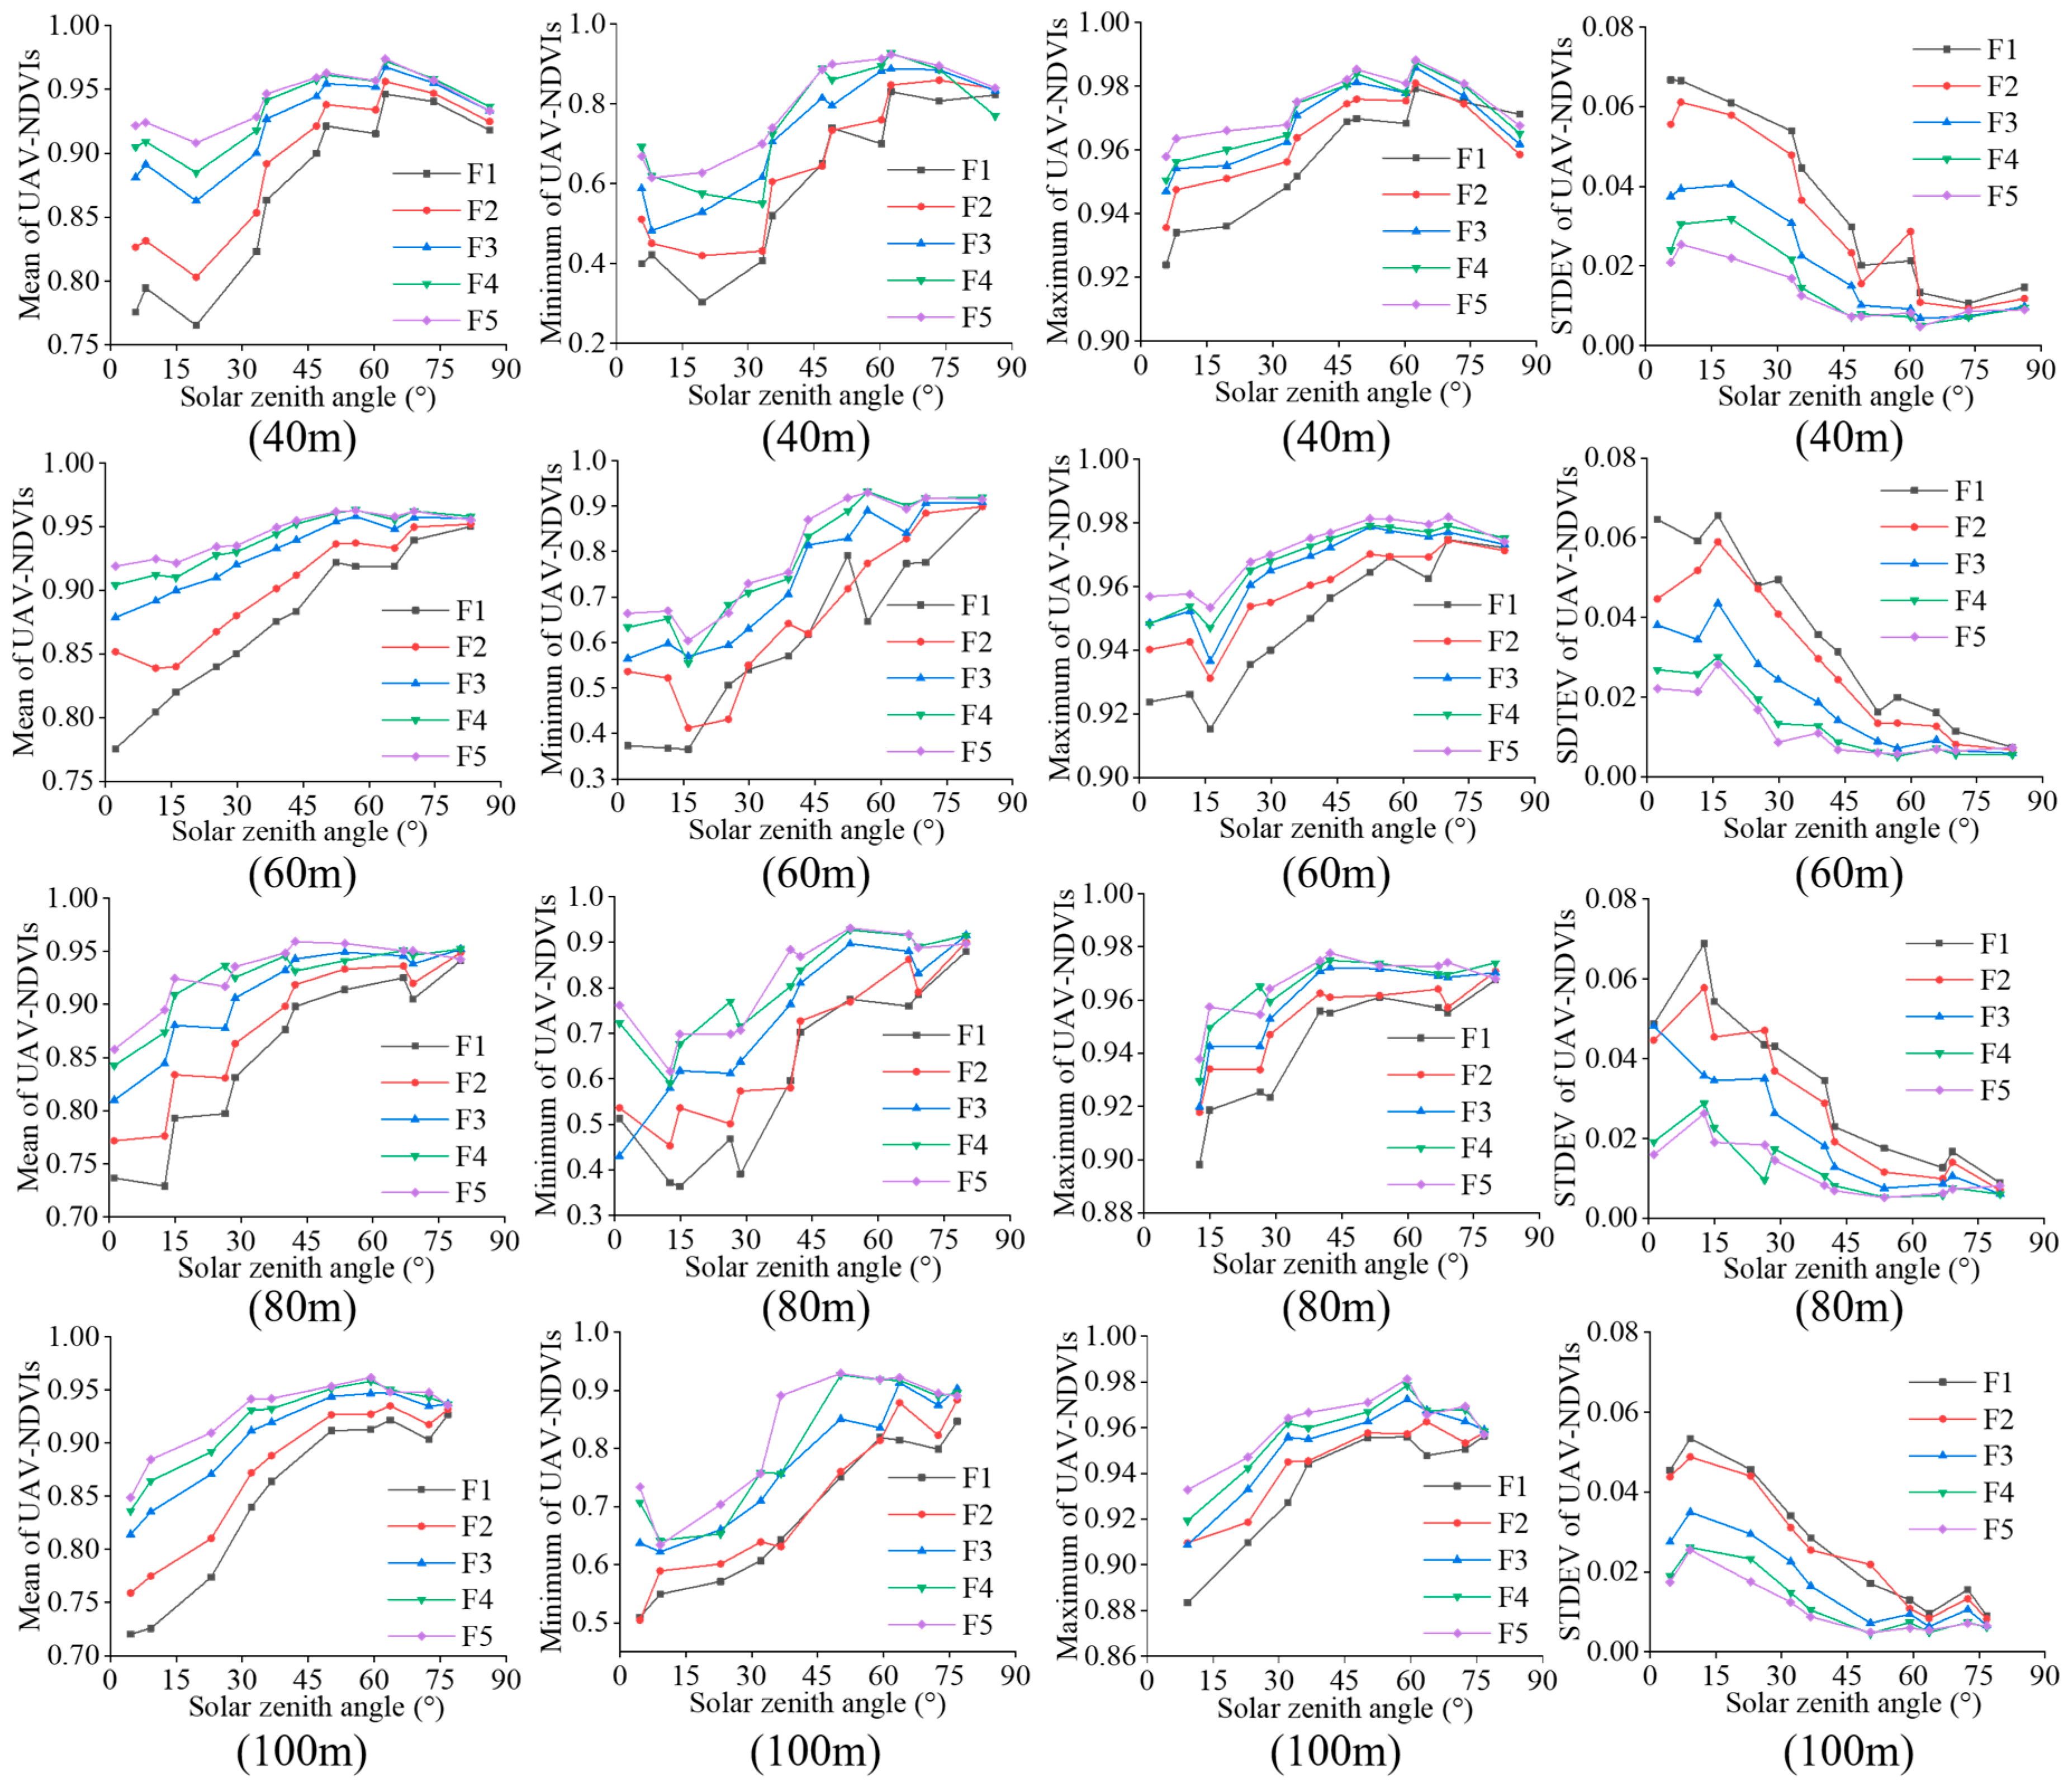
3.4. Dependence of the UAV–NDVIs on the Solar Zenith Angle (SZA)

As can be seen in Figure 8, two general trends can be observed in the SZA values of the study: i) the mean, minimum and maximum UAV–NDVI values generally increased as a function of increasing SZA and ii) the standard deviation values decreased as a function of increasing SZA. The trends were similar across all zones (F1–F5) and FAs. As the lowest SZAs occur around the solar noon this means that the UAV–NDVI values were lower around noon than in the morning or in the afternoon. The reverse was true for the standard deviation values. These results are consistent with those discussed in Section 3.3, which is logical, since the SZAs depend on the TOD.

3.5. Effects of the Growth Levels of Rice on the UAV–NDVIs

The differences between the mean UAV–NDVI values of the five zones followed those acquired using the ground data (F1: lowest, F5: highest, see Figure 4). In contrast, the standard deviation values had a downward trend from zone F1 to zone F5. With some slight variation, these differences could be detected irrespective of the FA, TOD and SZA (see Figure 5, Figure 7 and Figure 8). Thus, better growth levels induced higher NDVI values and lower standard deviation values. Furthermore, as could be seen in Figure 6, the curves of each field (B1–B5) consistently show a right shift (toward higher UAV–NDVI values) and a compressed value distribution with increasing growth level (B1: lowest, B5: highest). Hence, the better the growth level, the denser the UAV–NDVI distribution at the pixel scale.
To further study the trends associated with the growth levels, the averaged range of the mean UAV–NDVIs are shown individually for the FAs, TODs and SZAs in Table 3. As can be seen, the maximum averaged range of the FAs was 0.031 and that of TODs and SZAs was 0.200 in zone F1. In zone 5, the range was from 0.019 to 0.085. Based on the resulted, shown on Table 3, indicating that the better growth level could reduce the effect of FAs, TODs and SZAs.

3.6. Relative Importance of Different Impactors: FAs, SZAs/TODs, Growth Levels

In order to further analyze the contribution of the above factors, the standardized regression coefficients (SRC) of the linear model are shown in Table 4. According to the positive relationship between the contribution and absolute values of the SRC, the descending contribution rank regarding the mean and STDEV UAV–NDVIs can be listed as: SZAs/TODs, growth levels and FAs. It can be found that the FAs affect the values less than the other parameters and the SZAs/TODs had a significant effect on the mean UAV–NDVIs and STDEV UAV–NDVIs.

4. Discussion

Remote sensing has been widely used to assess crop growth in different environments. UAV-based imaging technology has the potential to provide high spatial resolution (up to centimeter-scale) maps for this end, providing instant feedback needed for crop management and decision making. In this context, increasing the understanding of how the flight parameters affect the NDVI values acquired using UAV-systems can help improve the image quality of the thus acquired data. In this study, we used a lightweight UAV equipped with a multispectral camera to collect NDVI values over a paddy rice under different flight parameters as well as different crop growth levels. The results suggest that the flight parameters and growth levels have a significant effect on the UAV-based data, thus highlighting the importance of careful flight planning. Nevertheless, it is essential to mention that the parameters and environmental factors (FA, TOD, SZA and growth level) discussed in this study do not fully account for the quality of the UAV-acquired data: Factors such as the flight speed can have a significant impact on the quality of the remote sensing data.

4.1. Sensitivity of UAV–NDVIs to the Flight Altitude (FA)

Our resulted, discussed in Section 3.2, suggest that the mean, minimum, maximum and standard deviation values of the UAV–NDVIs were highly related to the FA. This was particularly true for the COP of the peak UAV–NDVI values, shown in Figure 6. Additionally, as can be seen in the Appendix Table A1 and Figure A1, under the same growth level, the higher the FA, the smaller the individual UAV–NDVIs and the narrower the range of the UAV–NDVIs. Regarding the effects of the FA on the NDVI values, previous studies have reported different results. Stow et al. [32] evaluated the effects of the FA on the NDVI values through field experiments, finding that the relationship between them was inconclusive. In studies by Rasmussen et al. [33] and Yu et al. [34], no significant associations were found between the FA and the NDVI values. Easterday et al. [35] concluded that of the NDVI values acquired under different FAs (30 m, 60 m, 100 m and 120 m), the lowest FAs were better for detecting water deficit in plants. Similar to our study, a report by Mesas-Carrascosa et al. [36] concluded that even though the mean and maximum UAV–NDVIs were negatively related to the FA, the reverse was true for the minimum and STDEV UAV–NDVIs.
Notwithstanding the relationship between the NDVIs and the FA, the selection of the FAs has important implications from the point of view of the spatial resolution of the remote sensing imagery. In the field of imaging technology, a higher GSD means that each pixel represents a larger area. However, with the resulting lower spatial resolution of the image, the spectral information included in each pixel becomes more mixed and hence, detecting objects and phenomena can become more difficult. At high FAs associated with low spatial resolutions, some pixels could be mixed, and the average NDVIs may become diluted [37].
Looking at the relationship between the FA and the number of pixels of this study, Figure A1 shows four subsets of the UAV–NDVI maps of the B2 field at different FAs at TOD M11. In this analysis, four subsets were selected to represent the FAs of 40, 60, 80 and 100 m. These FAs resulted in GSDs values of 2.88, 4.32, 5.81 and 7.22 cm×pixel−1 that had NDVI values between 0.5 and 0.86. As can be seen in Figure A1, increasing the GSD resulted in fewer pixels in the same sampled area and narrower COP distributions. Under normal circumstances, the higher the FA of the UAV platform, the larger the area represented by a single pixel, and thus, the lesser the ability of the UAV system to detect small features. In the case of a paddy rice field, despite their commonly high canopy densities, there are still many canopy gaps. These gaps have other elements such as soil and water, which, depending on the FA, can lead to different degrees of spectral mixing. This, in turn, can lead to overall smaller mean NDVI and standard deviation values as suggested by Figure 5a,b, respectively. Therefore, as far as the NDVI monitoring of rice is concerned, the average NDVI was inversely proportional to the FAs. This further supports the conclusion that the FA was an important factor affecting the image quality for the crops. In general, it can be concluded that FAs do impact the mean UAV–NDVIs, but it is not conclusive that the mean UAV–NDVIs will keep decreasing with increasing FA. A possible extreme flight altitude needs further exploration.
Another noticeable factor regarding the effect of FA on vegetation indexes was atmospheric effects. Yu et al. suggested normalized excess green index (ExG) and the normalized green–red difference index (NGRDI) were relatively susceptible to FAs than the NDVI values (FAs: 10 m, 30 m, 50 m and 100 m) considering of the atmospheric effects [34]. The atmospheric attenuation was small in the low-altitude atmospheres and the effect of path radiance in their model was negligible for red and infrared wavelengths. Thus, we did not make an analysis of the atmospheric effects upon NDVIs when the FAs were under 100 m. In fact, the atmospheric effects were more significant at higher FAs (manned aircrafts and satellites) [38].

4.2. Influence of the time of Day (TOD) and Solar Zenith Angle (SZA) on the UAV–NDVIs

Although the SZA values vary as a function of the time of day, date and location [39], in this study, SZAs and TODs were discussed independently, because there is the spatiotemporal difference. To the knowledge of the authors, our study is one of the first ones to report and discuss the effects of the TODs and SZAs on UAV-based NDVI values continuously from sunrise to sunset. Based on our results, the mean, minimum, maximum and standard deviation of the UAV–NDVIs are all highly related to the TODs and SZAs (see Section 3.3 and Section 3.4). In previous studies, Ishihara et al. [28] suggests that the response of vegetation indices to the SZA was evident under a clear sky. Rahman [29] reported NDVIs from ground-based observations that decreased with decreasing SZA at a pasture site, but did not provide explanations to this finding. Their conclusions were directly based on the average assessment of ground-NDVIs, and hence, not remote sensing data. Although the results in this study show a similar phenomenon, we have further analyzed the UAV–NDVI distribution on a pixel-scale (including mean, minimum, maximum, standard deviation and COP of the UAV–NDVIs), an experimental setup that can reveal the relationships between the UAV–NDVIs and the flight parameters (SZAs/TODs) more clearly. Ishihara et al. suggested that surveys involving NDVI measurements be performed at a SZA of 60° to be effective for the accurate assessment of the canopy structure and function. However, our results, shown in Figure 8, suggest no obvious differences between the mean UAV–NDVIs and standard deviation values of the UAV–NDVIs with different growth levels at a SZA of 60°. Therefore, we do not follow the recommendation by Ishihara et al. to acquire UAV–NDVI values at a SZA of 60°. In practice, the TODs and SZAs were the direct reasons for changing the angle between the view direction and incident light. An important phenomenon in this context is the widely discussed hot spot effect, also called the hot spot directional signature in the backscattering direction [40]. In recent studies, this phenomenon was also called the bidirectional reflectance distribution function (BRDF) effects. Generally, the radiance of the reflecting medium will decrease with an increasing angle between the view direction and incident light because of the decreased probability of seeing illuminated particles [41]. Therefore, because of the vertical downward view of the RedEdge camera, the strongest radiance and relatively complete reflectivity from the rice canopy was collected when the SZAs were relatively small. By definition, crop reflectance is the ratio of the amount of light leaving the canopy to the amount of incoming light. We suggest the reflectivity was relatively accurate at a smaller SZAs, in turn, resulting in reliable NDVI values.

4.3. Effect of the Growth Level on the UAV–NDVIs

It can also be seen in the data that the application rate of fertilizers can have a significant impact on the NDVI values (Figure 4). In the early stages of rice growth or in the case of weak growth that results from inadequate fertilization, the canopy is distributed sparsely and there are more gaps with water between seedlings [42]. These potential gaps would influence the NDVI values. For instance, looking at the image acquired at M11 (11 am–12 pm) at 40 m (Figure A1), the image has a relatively high GSD of 2.88 cm at a FA of 40 m. Due to the resulting high spatial resolution, the image contains many details, including those related to non-foliar areas, and thus, small NDVI values that result from pixels with soil or water. Similarly, areas with lesser amounts of fertilizers and thus, less vigorous growth levels will have more gaps with smaller NDVI values and higher standard deviation values than result from spatial heterogeneity (vegetation, water and soil). The higher the flight altitude, the lower the spatial resolution and the lesser the amount of details in the image. Therefore, in the UAV image acquired at 100 m, the standard deviation is lower and the range of NDVI values is narrower than in the image that was acquired at 40 m (Figure 7 and Figure A1). On the other hand, the main limitation in our growth level analysis was the lack of observations to cover entire growth stages. Such an analysis would have provided a more comprehensive quantitative framework to interpret the interrelationships between the growth levels and the flight parameters. In fact, in the early stages of rice growth, due to the sparse rice canopy, aerial remote sensing will collect a large area of ground water surface (mirror reflectance), which is a growth period that is not suitable for UAV remote sensing monitoring. Hence, the available growth stages for reliable UAV remote sensing are limited.

5. Conclusions

In this study, a paddy rice field was used as a test area to assess the effects of FA, TOD, SZA and growth level on the UAV-acquired NDVI values. Based on the SRC values of the linear regression resulted, all of the former parameters had a significant effect on the UAV–NDVIs. More specifically, our results suggest that (1) the SZA/TOD had the largest impact on the mean, minimum, maximum and STDEV of UAV–NDVI values, followed by the growth level and the FA; (2) the mean, maximum and STDEV of UAV–NDVIs were inversely proportional to the FA (≤100 m) and the minimum of UAV–NDVIs decreased with increasing FA; (3) the mean, minimum and maximum of UAV–NDVIs were proportional to the SZA, but it was contrary with the STDEV of UAV–NDVIs; (4) the effect of TOD on UAV–NDVIs could refer to the SZA;(5) Furthermore, according to our results, the UAV–NDVIs close to the smaller SZAs show the highest signal-to-noise ratios which we infer to reflect the most realistic growth status values. We expect that our resulted and the recommendations could provide a reference to the operating parameters of UAVs in the context of precision agriculture.

Author Contributions

R.J. was responsible for the framework design of the entire system in this research and arranged tests, conducted several verification tests and wrote the article. P.W. and Y.X. assisted in collected all the test data and checked the study carefully. Z.Z. proposed the main plans, ideas and guidance for the work and reviewed the study, as well as acquired the funding. X.L., Y.L., G.Z., A.S.-A. and K.L. provided guidance and advice. All authors have read and agreed to the published version of the manuscript.

Funding

This work was supported by the National Natural Science Foundation of China (31871520), the National Key R&D Program of China (2018YFD0200301), Science and Technology Plan of Guangzhou of China (201807010111), Science and Technology Plan of Guangdong Province of China (2017B090903007) and Innovative Research Team of Agricultural and Rural Big Data in Guangdong Province of China (2019KJ138).

Acknowledgments

We would like to thank the flying permission of the administration of Ningxi Teaching and Research Bases, at the South China Agricultural University, Guangzhou, China. Furthermore, the authors would like to thank the reviewer for their helpful comments.

Conflicts of Interest

The authors declare no conflicts of interest.

Appendix A

Figure A1. Subset of the B2 NDVI map at 40, 60, 80, 100 m with TOD of M11 (11 am–12 pm).
Remotesensing 12 01850 g0a1
Table A1. Minimum, maximum and range of UAV–NDVIs of the B1–B5 fields.
FieldsFlight Altitude/mMinimum of UAV–NDVIsMaximum of UAV–NDVIsRange
B1400.380.880.50
600.480.880.40
800.490.860.37
1000.520.840.32
B2400.430.920.49
600.440.910.47
800.460.910.45
1000.500.900.40
B3400.530.940.41
600.570.930.36
800.610.920.31
1000.650.900.25
B4400.590.940.35
600.620.930.31
800.680.920.24
1000.710.910.20
B5400.740.940.20
600.770.940.17
800.770.930.16
1000.780.920.14

References

  1. Aruva, S.; Sayantani, D.; Vijayalakshmi, S.; Moses, J.A.; Anandharamakrishnan, C. Ageing of rice: A review. J. Cereal Sci. 2018, 81, 161–170. [Google Scholar]
  2. Zhang, X.; Liu, Y.; Liu, Y.; Cui, Q.; Yang, L.; Hu, X.; Guo, J.; Zhang, J.; Yang, S.; Abou-Amer, I. Impacts of climate change on self-sufficiency of rice in China: A CGE-model-based evidence with alternative regional feedback mechanisms. J. Clean. Prod. 2019, 230, 150–161. [Google Scholar] [CrossRef]
  3. Sharma, S.; Rout, K.K.; Khanda, C.M.; Tripathi, R.; Shahid, M.; Nayak, A.; Satpathy, S.; Banik, N.C.; Iftikar, W.; Parida, N.; et al. Field-specific nutrient management using Rice Crop Manager’ decision support tool in Odisha, India. Field Crop. Res. 2019, 241, 107578. [Google Scholar] [CrossRef] [PubMed]
  4. Deng, L.; Mao, Z.; Li, X.; Hu, Z.; Duan, F.; Yan, Y. UAV-based multispectral remote sensing for precision agriculture: A comparison between different cameras. ISPRS J. Photogramm. 2018, 146, 124–136. [Google Scholar] [CrossRef]
  5. Agueera Vega, F.; Carvajal Ramirez, F.; Perez Saiz, M.; Orgaz Rosua, F. Multi-temporal imaging using an unmanned aerial vehicle for monitoring a sunflower crop. Biosyst. Eng. 2015, 132, 19–27. [Google Scholar] [CrossRef]
  6. Khanal, S.; Fulton, J.; Shearer, S. An overview of current and potential applications of thermal remote sensing in precision agriculture. Comput. Electron. Agr. 2017, 139, 22–32. [Google Scholar] [CrossRef]
  7. Brinkhoff, J.; Dunn, B.W.; Robson, A.J.; Dunn, T.S.; Dehaan, R.L. Modeling mid-season rice nitrogen uptake using multispectral satellite data. Remote Sens. 2019, 11, 1837. [Google Scholar] [CrossRef] [Green Version]
  8. Nutini, F.; Confalonieri, R.; Crema, A.; Movedi, E.; Paleari, L.; Stavrakoudis, D.; Boschetti, M. An operational workflow to assess rice nutritional status based on satellite imagery and smartphone apps. Comput. Electron. Agr. 2018, 154, 80–92. [Google Scholar] [CrossRef]
  9. Fan, X.; Liu, Y. A global study of NDVI difference among moderate-resolution satellite sensors. ISPRS J. Photogramm. 2016, 121, 177–191. [Google Scholar] [CrossRef]
  10. Matese, A.; Toscano, P.; Di Gennaro, S.F.; Genesio, L.; Vaccari, F.P.; Primicerio, J.; Belli, C.; Zaldei, A.; Bianconi, R.; Gioli, B. Intercomparison of UAV, Aircraft and satellite remote sensing platforms for precision viticulture. Remote Sens. 2015, 7, 2971–2990. [Google Scholar] [CrossRef] [Green Version]
  11. Wu, M.; Huang, W.; Niu, Z.; Wang, C.; Li, W.; Yu, B. Validation of synthetic daily Landsat NDVI time series data generated by the improved spatial and temporal data fusion approach. Inform. Fusion. 2018, 40, 34–44. [Google Scholar] [CrossRef]
  12. Ali, A.M.; Abou-Amer, I.; Ibrahim, S.M. Using GreenSeeker active optical sensor for optimizing maize nitrogen fertilization in calcareous soils of Egypt. Arch. Agron. Soil Sci. 2018, 64, 1083–1093. [Google Scholar] [CrossRef]
  13. Barker, D.W.; Sawyer, J.E. Using active canopy sensors to quantify corn nitrogen stress and nitrogen application rate. Agron. J. 2010, 102, 964–971. [Google Scholar] [CrossRef]
  14. Zheng, H.; Cheng, T.; Yao, X.; Deng, X.; Tian, Y.; Cao, W.; Zhu, Y. Detection of rice phenology through time series analysis of ground-based spectral index data. Field Crop. Res. 2016, 198, 131–139. [Google Scholar] [CrossRef]
  15. Ostos-Garrido, F.J.; de Castro, A.I.; Torres-Sanchez, J.; Piston, F.; Pena, J.M. High-throughput phenotyping of bioethanol potential in cereals using UAV-based multi-spectral imagery. Front. Plant Sci. 2019, 10, 948. [Google Scholar] [CrossRef] [PubMed] [Green Version]
  16. Sankaran, S.; Khot, L.R.; Espinoza, C.Z.; Jarolmasjed, S.; Sathuvalli, V.R.; Vandemark, G.J.; Miklas, P.N.; Carter, A.H.; Pumphrey, M.O.; Knowles, N.R.; et al. Low-altitude, high-resolution aerial imaging systems for row and field crop phenotyping: A review. Eur. J. Agron. 2015, 70, 112–123. [Google Scholar] [CrossRef]
  17. Candiago, S.; Remondino, F.; De Giglio, M.; Dubbini, M.; Gattelli, M. Evaluating multispectral images and vegetation indices for precision farming applications from UAV images. Remoe Sensing. 2015, 7, 4026–4047. [Google Scholar] [CrossRef] [Green Version]
  18. Xiang, H.; Tian, L. Development of a low-cost agricultural remote sensing system based on an autonomous unmanned aerial vehicle (UAV). Biosyst. Eng. 2011, 108, 174–190. [Google Scholar] [CrossRef]
  19. Yu, N.; Li, L.; Schmitz, N.; Tian, L.F.; Greenberg, J.A.; Diers, B.W. Development of methods to improve soybean yield estimation and predict plant maturity with an unmanned aerial vehicle based platform. Remote Sens. Environ. 2016, 187, 91–101. [Google Scholar] [CrossRef]
  20. Duan, T.; Chapman, S.C.; Guo, Y.; Zheng, B. Dynamic monitoring of NDVI in wheat agronomy and breeding trials using an unmanned aerial vehicle. Field Crop. Res. 2017, 210, 71–80. [Google Scholar] [CrossRef]
  21. Liu, T.; Li, R.; Zhong, X.; Jiang, M.; Jin, X.; Zhou, P.; Liu, S.; Sun, C.; Guo, W. Estimates of rice lodging using indices derived from UAV visible and thermal infrared images. Agr. Forest Meteorol. 2018, 252, 144–154. [Google Scholar] [CrossRef]
  22. Reza, M.N.; Na, I.S.; Baek, S.W.; Lee, K. Rice yield estimation based on K-means clustering with graph-cut segmentation using low-altitude UAV images. Biosyst. Eng. 2019, 177, 109–121. [Google Scholar] [CrossRef]
  23. Zhou, X.; Zheng, H.B.; Xu, X.Q.; He, J.Y.; Ge, X.K.; Yao, X.; Cheng, T.; Zhu, Y.; Cao, W.X.; Tian, Y.C. Predicting grain yield in rice using multi-temporal vegetation indices from UAV-based multispectral and digital imagery. ISPRS J. Photogramm. 2017, 130, 246–255. [Google Scholar] [CrossRef]
  24. Guan, S.; Fukami, K.; Matsunaka, H.; Okami, M.; Tanaka, R.; Nakano, H.; Sakai, T.; Nakano, K.; Ohdan, H.; Takahashi, K. Assessing Correlation of High-Resolution NDVI with fertilizer application level and yield of rice and wheat crops using small UAVs. Remote Sens. 2019, 11, 112. [Google Scholar] [CrossRef] [Green Version]
  25. Maes, W.H.; Steppe, K. Perspectives for remote sensing with unmanned aerial vehicles in precision agriculture. Trends Plant Sci. 2019, 24, 152–164. [Google Scholar] [CrossRef]
  26. Al-Bakri, J.T.; Suleiman, A.S. NDVI response to rainfall in different ecological zones in Jordan. Int. J. Remote Sens. 2004, 25, 3897–3912. [Google Scholar] [CrossRef]
  27. Seifert, E.; Seifert, S.; Vogt, H.; Drew, D.; van Aardt, J.; Kunneke, A.; Seifert, T. Influence of drone altitude, image overlap, and optical sensor resolution on multi-view reconstruction of forest images. Remote Sens. 2019, 11, 1252. [Google Scholar] [CrossRef] [Green Version]
  28. Ishihara, M.; Inoue, Y.; Ono, K.; Shimizu, M.; Matsuura, S. The impact of sunlight conditions on the consistency of vegetation indices in croplands—Effective usage of vegetation indices from continuous ground-based spectral measurements. Remote Sens. 2015, 7, 14079–14098. [Google Scholar] [CrossRef] [Green Version]
  29. Rahman, M.M.; Lamb, D.W.; Samborski, S.M. Reducing the influence of solar illumination angle when using active optical sensor derived NDVIAOS to infer fAPAR for spring wheat (Triticum aestivum L.). Comput. Electron. Agr. 2019, 156, 1–9. [Google Scholar] [CrossRef]
  30. Wang, H.; Zhang, W.; Dong, A. Measurement and modeling of Bidirectional Reflectance Distribution Function (BRDF) on material surface. Measurement 2013, 46, 3654–3661. [Google Scholar] [CrossRef]
  31. Bring, J. How to Standardize Regression Coefficients. Am. Stat. 1994, 48, 209–213. [Google Scholar]
  32. Stow, D.; Nichol, J.C.; Wade, T.; Assmann, J.J.; Simpson, G.; Helfter, C. Illumination geometry and flying height influence surface reflectance and NDVI derived from multispectral UAS imagery. Drones 2019, 3, 55. [Google Scholar] [CrossRef] [Green Version]
  33. Rasmussen, J. Are vegetation indices derived from consumer-grade cameras mounted on UAVs sufficiently reliable for assessing experimental plots? Eur. J. Agron. 2016, 74, 75–92. [Google Scholar] [CrossRef]
  34. Yu, X.; Liu, Q.; Liu, X.; Liu, X.; Wang, Y. A physical-based atmospheric correction algorithm of unmanned aerial vehicles images and its utility analysis. Int. J. Remote Sens. 2017, 38, 3101–3112. [Google Scholar] [CrossRef]
  35. Easterday, K.; Kislik, C.; Dawson, T.E.; Hogan, S.; Kelly, M. Remotely sensed water limitation in vegetation: Insights from an experiment with Unmanned Aerial Vehicles (UAVs). Remote Sens. 2019, 11, 1853. [Google Scholar] [CrossRef] [Green Version]
  36. Mesas-Carrascosa, F.; Torres-Sanchez, J.; Clavero-Rumbao, I.; Garcia-Ferrer, A.; Pena, J.; Borra-Serrano, I.; Lopez-Granados, F. Assessing optimal flight parameters for generating accurate multispectral orthomosaicks by UAV to support site-specific crop management. Remote Sens. 2015, 7, 12793–12814. [Google Scholar] [CrossRef] [Green Version]
  37. Tu, Y.; Phinn, S.; Johansen, K.; Robson, A.; Wu, D. Optimising drone flight planning for measuring horticultural tree crop structure. ISPRS J. Photogramm. 2020, 160, 83–96. [Google Scholar] [CrossRef] [Green Version]
  38. Khaliq, A.; Comba, L.; Biglia, A.; Ricauda Aimonino, D.; Chiaberge, M.; Gay, P.; Abou-Amer, I.P. Comparison of Satellite and UAV-based multispectral imagery for vineyard variability assessment. Remote Sens. Environ. 2019, 11, 436. [Google Scholar] [CrossRef] [Green Version]
  39. Wei, S.; Fang, H. Estimation of canopy clumping index from MISR and MODIS sensors using the normalized difference hotspot and darkspot (NDHD) method: The influence of BRDF models and solar zenith angle. Remote Sens. Environ. 2016, 187, 476–491. [Google Scholar] [CrossRef]
  40. Bréon, F.; Maignan, F.; Leroy, M.; Grant, I. Analysis of hot spot directional signatures measured from space. J. Geophys. Res. Atmos. 2002, 107, 1–15. [Google Scholar] [CrossRef]
  41. Kuusk, A. The hot spot effect in plant canopy reflectance. In Photon-Vegetation Interactions: Applications in Optical Remote Sensing and Plant Ecology; Myneni, R.B., Ross, J., Eds.; Springer: Berlin/Heidelberg, Germany, 1991; pp. 139–159. [Google Scholar]
  42. Stanton, C.; Starek, M.; Elliott, N.; Brewer, M.; Maeda, M.; Chu, T. Unmanned aircraft system-derived crop height and normalized difference vegetation index metrics for sorghum yield and aphid stress assessment. J. Appl. Remote Sens. 2017, 11, 26035. [Google Scholar] [CrossRef] [Green Version]
Figure 1. Study site. (a) The study site was located at a paddy-rice field, marked by the pink rectangle in Ningxi Teaching and Research Bases (NTRB) at the South China Agricultural University, Guangzhou, China; (b) five field zones were present: F1, F2, F3, F4 and F5, marked by red rectangles; blue flight route is a schematic diagram that represents the 4 different routes at different flight altitudes: 40 m, 60 m, 80 m and 100 m; (c) unmanned aerial vehicle (UAV)-based multispectral camera acquiring raw multispectral images of the study site at a low flight altitude (40–100 m).
Remotesensing 12 01850 g001
Figure 2. Fertilization program of the test field.
Remotesensing 12 01850 g002
Figure 3. Image processing workflow.
Remotesensing 12 01850 g003
Figure 4. Map of the five zones (F1–F5) and their average normalized difference vegetation index (NDVI) values (GS–NDVIs) based on ground data.
Remotesensing 12 01850 g004
Figure 5. Mean (a), minimum (b), maximum (c) and standard deviation values (d) of the UAV–NDVIs of the five zones (F1–F5) at different flight altitudes.
Remotesensing 12 01850 g005
Figure 6. Count of pixels (COP) distribution curves of the UAV–NDVIs of the B1–B5 (ae) fields under different flight altitudes at the time of day (TOD) of 11 am–12 pm (M11).
Remotesensing 12 01850 g006
Figure 7. Mean, minimum, maximum and standard deviation of the UAV–NDVIs shown for different zones (F1–F5), times of day (TODs; M6–M17) and flight altitudes (FAs; 40, 60, 80 and 100 m).
Remotesensing 12 01850 g007
Figure 8. Mean, minimum, maximum and standard deviation of the UAV–NDVIs shown for different zones (F1–F5), solar zenith angles and flight altitudes (40, 60, 80 and 100 m).
Remotesensing 12 01850 g008
Table 1. The specifications of the RedEdge-M camera. Acronyms: DLS—downwelling light sensor; FOV—field of view; FWHM—full width at half maximum; NIR—near infrared.
SpecificationParameters
Weight170 g (including DLS)
Dimensions9.4 cm × 6.3 cm × 4.6 cm
Power4.2–15.8 V DC, 4 W nominal, 8 W peak
Spectral bandsBlue (475 nm, FWHM: 20 nm); green (560 nm, FWHM: 20 nm); red (668 nm, FWHM: 10 nm); red edge (717 nm, FWHM: 10 nm); NIR (840 nm, FWHM: 40 nm)
Maximum capture speed1 capture per second (all bands)
Storage format16 bits TIFF
Field of view (FOV)46°
Table 2. Flight parameters of the study.
Start Time of Each Hour (min)Flight Altitude (m)Image Overlap (%)Speed (m·s−1)Ground Sampling Distance (cm)
<15408052.88
15–30604.32
30–45805.81
>451007.22
Table 3. Average range of means UAV–NDVIs of F1, F2, F3, F4 and F5 fields.
ImpactorsF1F2F3F4F5
FAs0.0310.0310.0250.0220.019
TODs(h)/SZAs (°)0.2000.1680.1220.1000.085
Table 4. Standardized regression coefficients (SRC) of FAs, SZAs/TODs and growth levels.
ImpactorsMean UAV–NDVIsSTDEV UAV–NDVIs
FAs−0.148 **−0.089 **
TODs(h)/SZAs (°)0.698 **−0.728 **
Growth levels0.509 **−0.510 **
Note: ** represents the p ≤ 0.01.

